
Effect of Topographic Factors on Ecological Environment Quality in the Red Soil Region of Southern China: A Case from Changting County


Abstract
1. Introduction
2. Materials and Methods
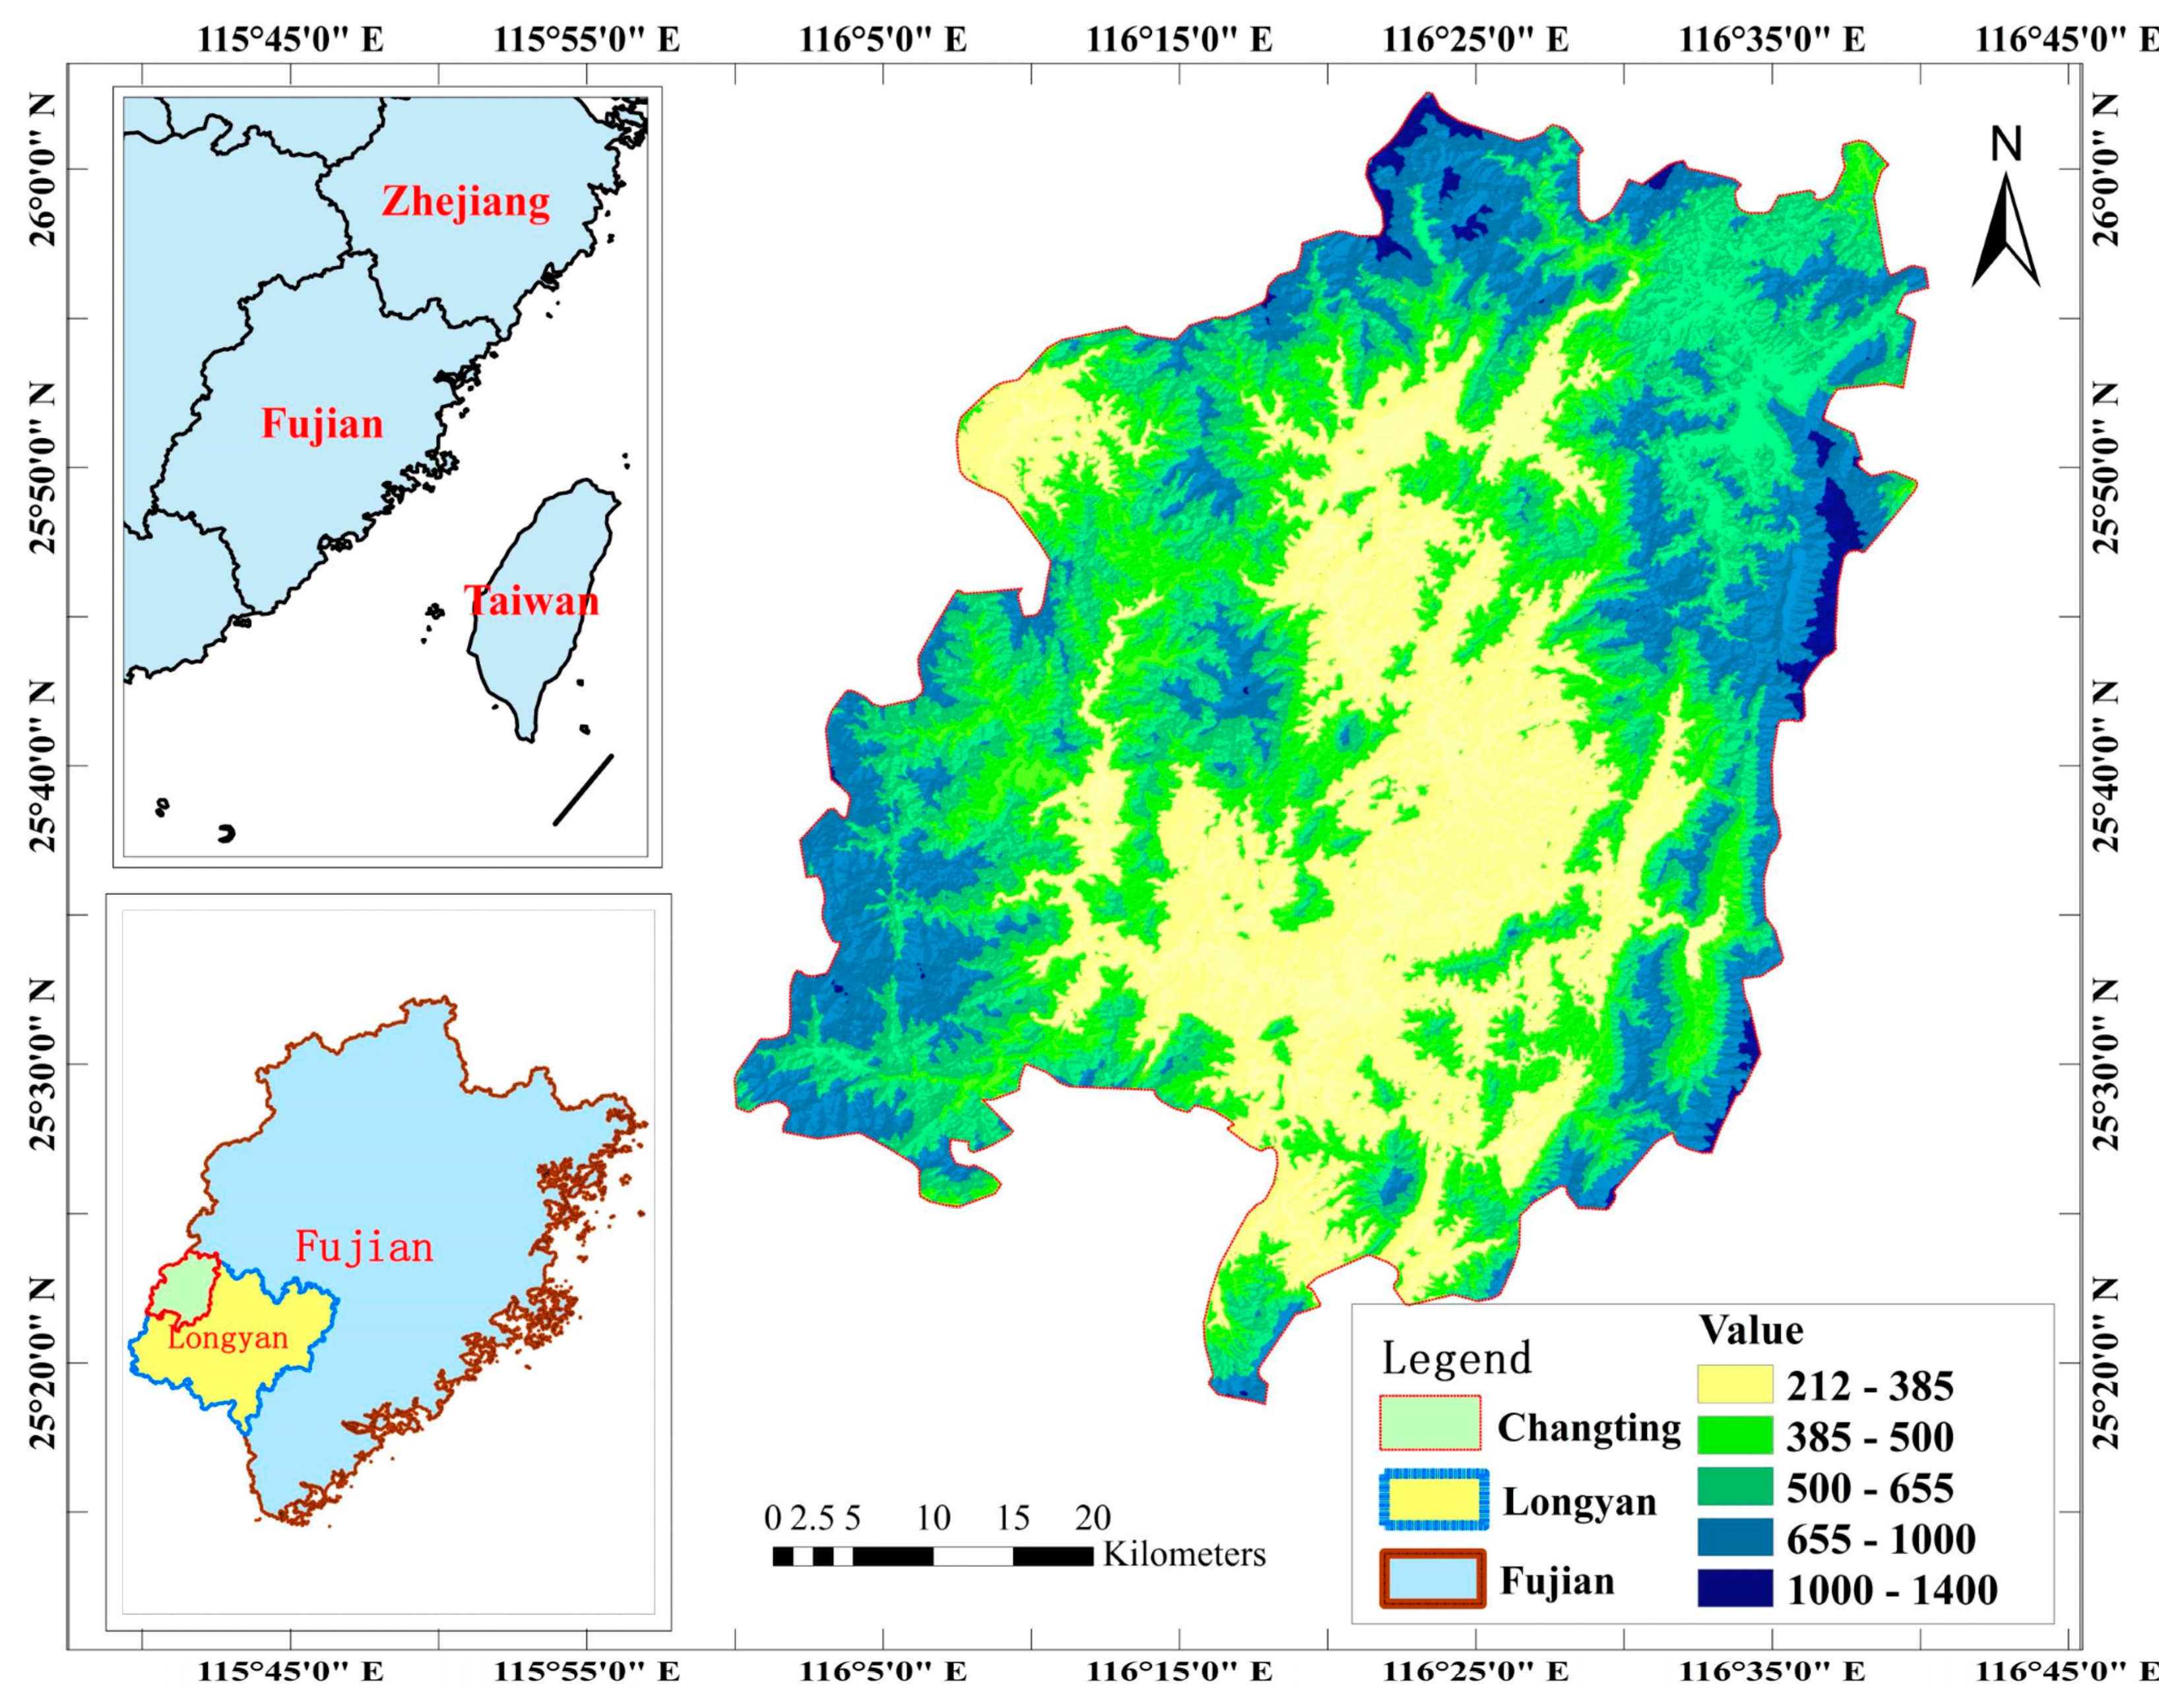
2.1. Introduction to Study Area
2.2. Methodology
2.2.1. Data Sources and Processing
- (1)
- The administrative boundary vector data for Changting County, situated within Longyan City of Fujian Province, was generously provided by the Fujian Provincial Natural Resources and Geographical Information Center located in Fuzhou City, Fujian Province, China, which was used for masking DEM.
- (2)
- The evaluation results of the EEQ for the study area from 2000 to 2019 were achieved using RSEI integrating with Landsat ETM+, TM, and OLI/TIR images, respectively, which was detailed in the previous research [39], and each grade EEQ was converted to points whose terrain characteristics were determined using the Extract Multi Values to Points tool in ArcGIS Pro 3.2, which was used for calculating the average value of each topographic factor for each grade EEQ to reveal the changing trends of topography across different EEQ grades.
- (3)
- A digital elevation model (DEM) with a 30 m grid resolution was downloaded from the Geospatial Data Cloud Website (http://www.gscloud.cn/). This DEM was employed for extracting topographic factors using ArcGIS Pro 3.2, including slope, aspect, relief amplitude (RA), and topographic position index (TPI).
- (4)
- The study area was divided into 0.33 × 0.33 km2 grids to generate a total of 28,420 grid points using the Fishnet tool in ArcGIS Pro 3.2, and the terrain characteristics of each grid point were still determined using the Extract Multi Values to Points tool in ArcGIS Pro 3.2, which was used for calculating the percentage of the grid points falling in each of the topographic factors categorization for each EEQ grade and the explanatory powers for the EEQ combining with Geodetector model to reveal the terrain distribution characteristics of the EEQ and the primary affecting factors for topography on the EEQ.
- (5)
- Figure 2 provides a detailed description of the data processing procedures and purposes.
2.2.2. Selection of Topographic Factors
2.2.3. Geodetector Model
3. Results
3.1. Changing Trend of Topographic Factors for the EEQ
3.2. Terrain Distribution Characteristics of Different Grades EEQ
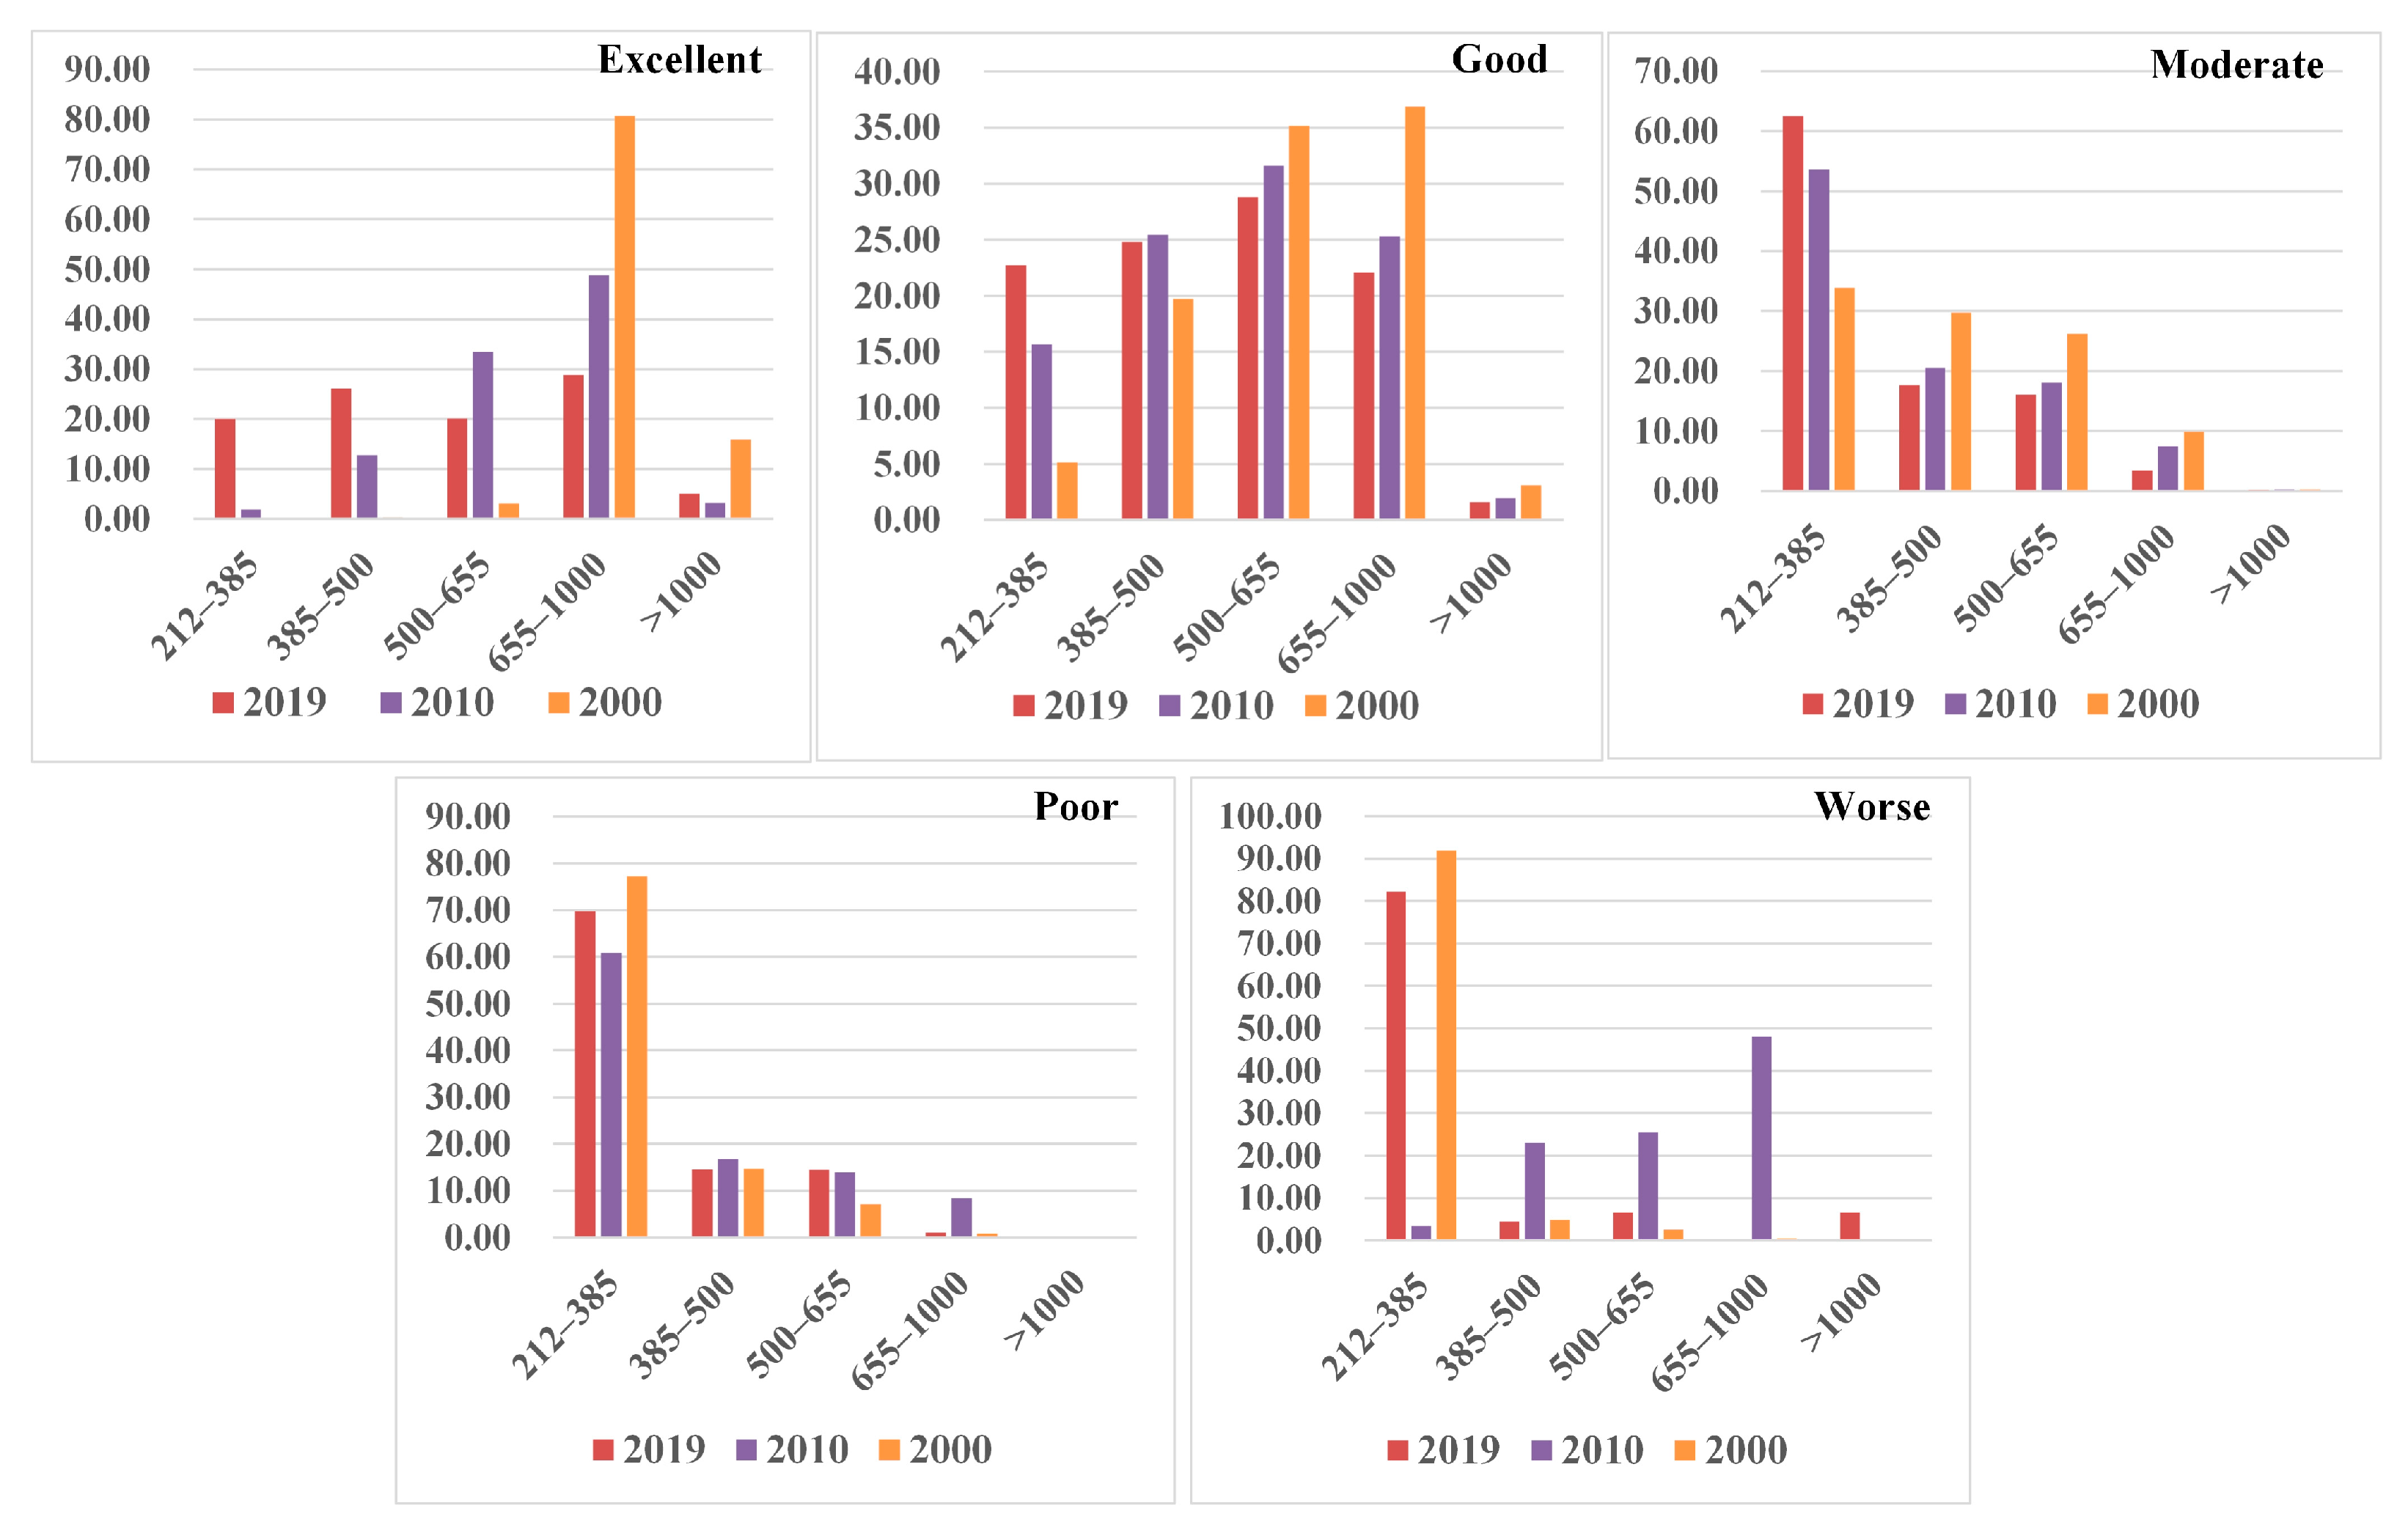
- (1)
- Distribution Characteristics of the EEQ at the Elevation Factor
- (2)
- Distribution Characteristics of the EEQ at the Slope Factor

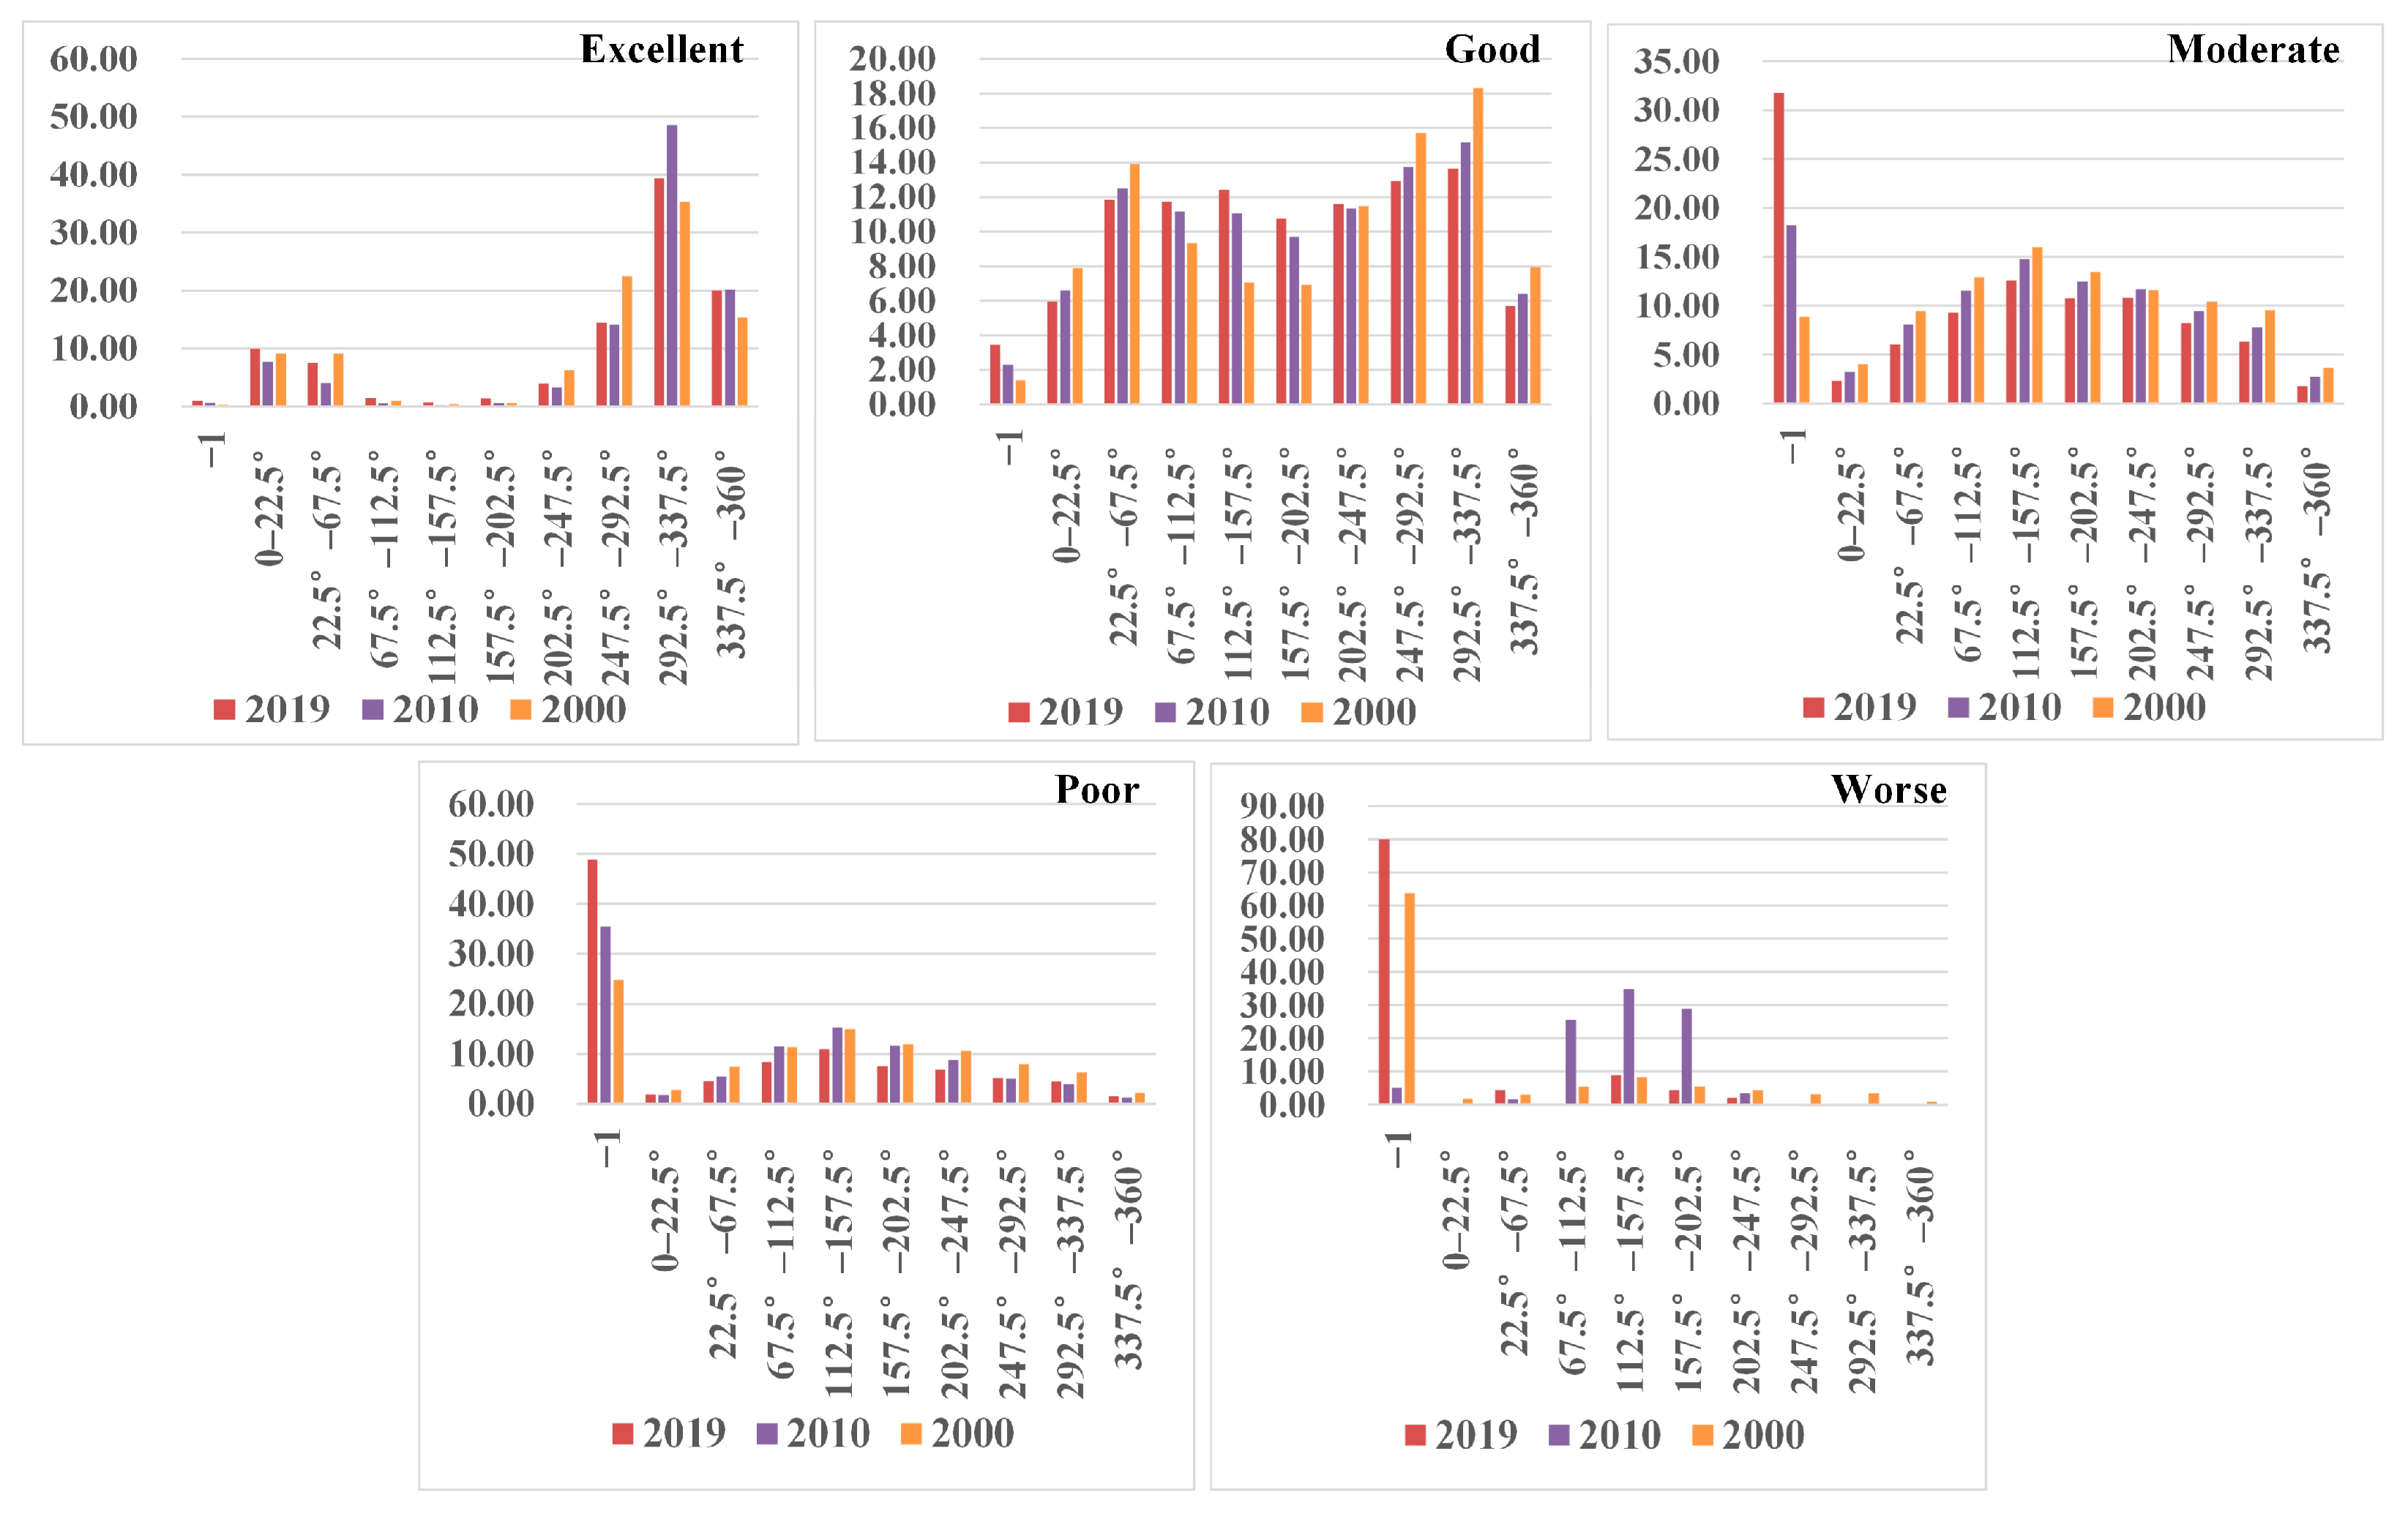
- (3)
- Distribution Characteristics of the EEQ at the Aspect Factor
- (4)
- Distribution Characteristics of the EEQ at the RA Factor

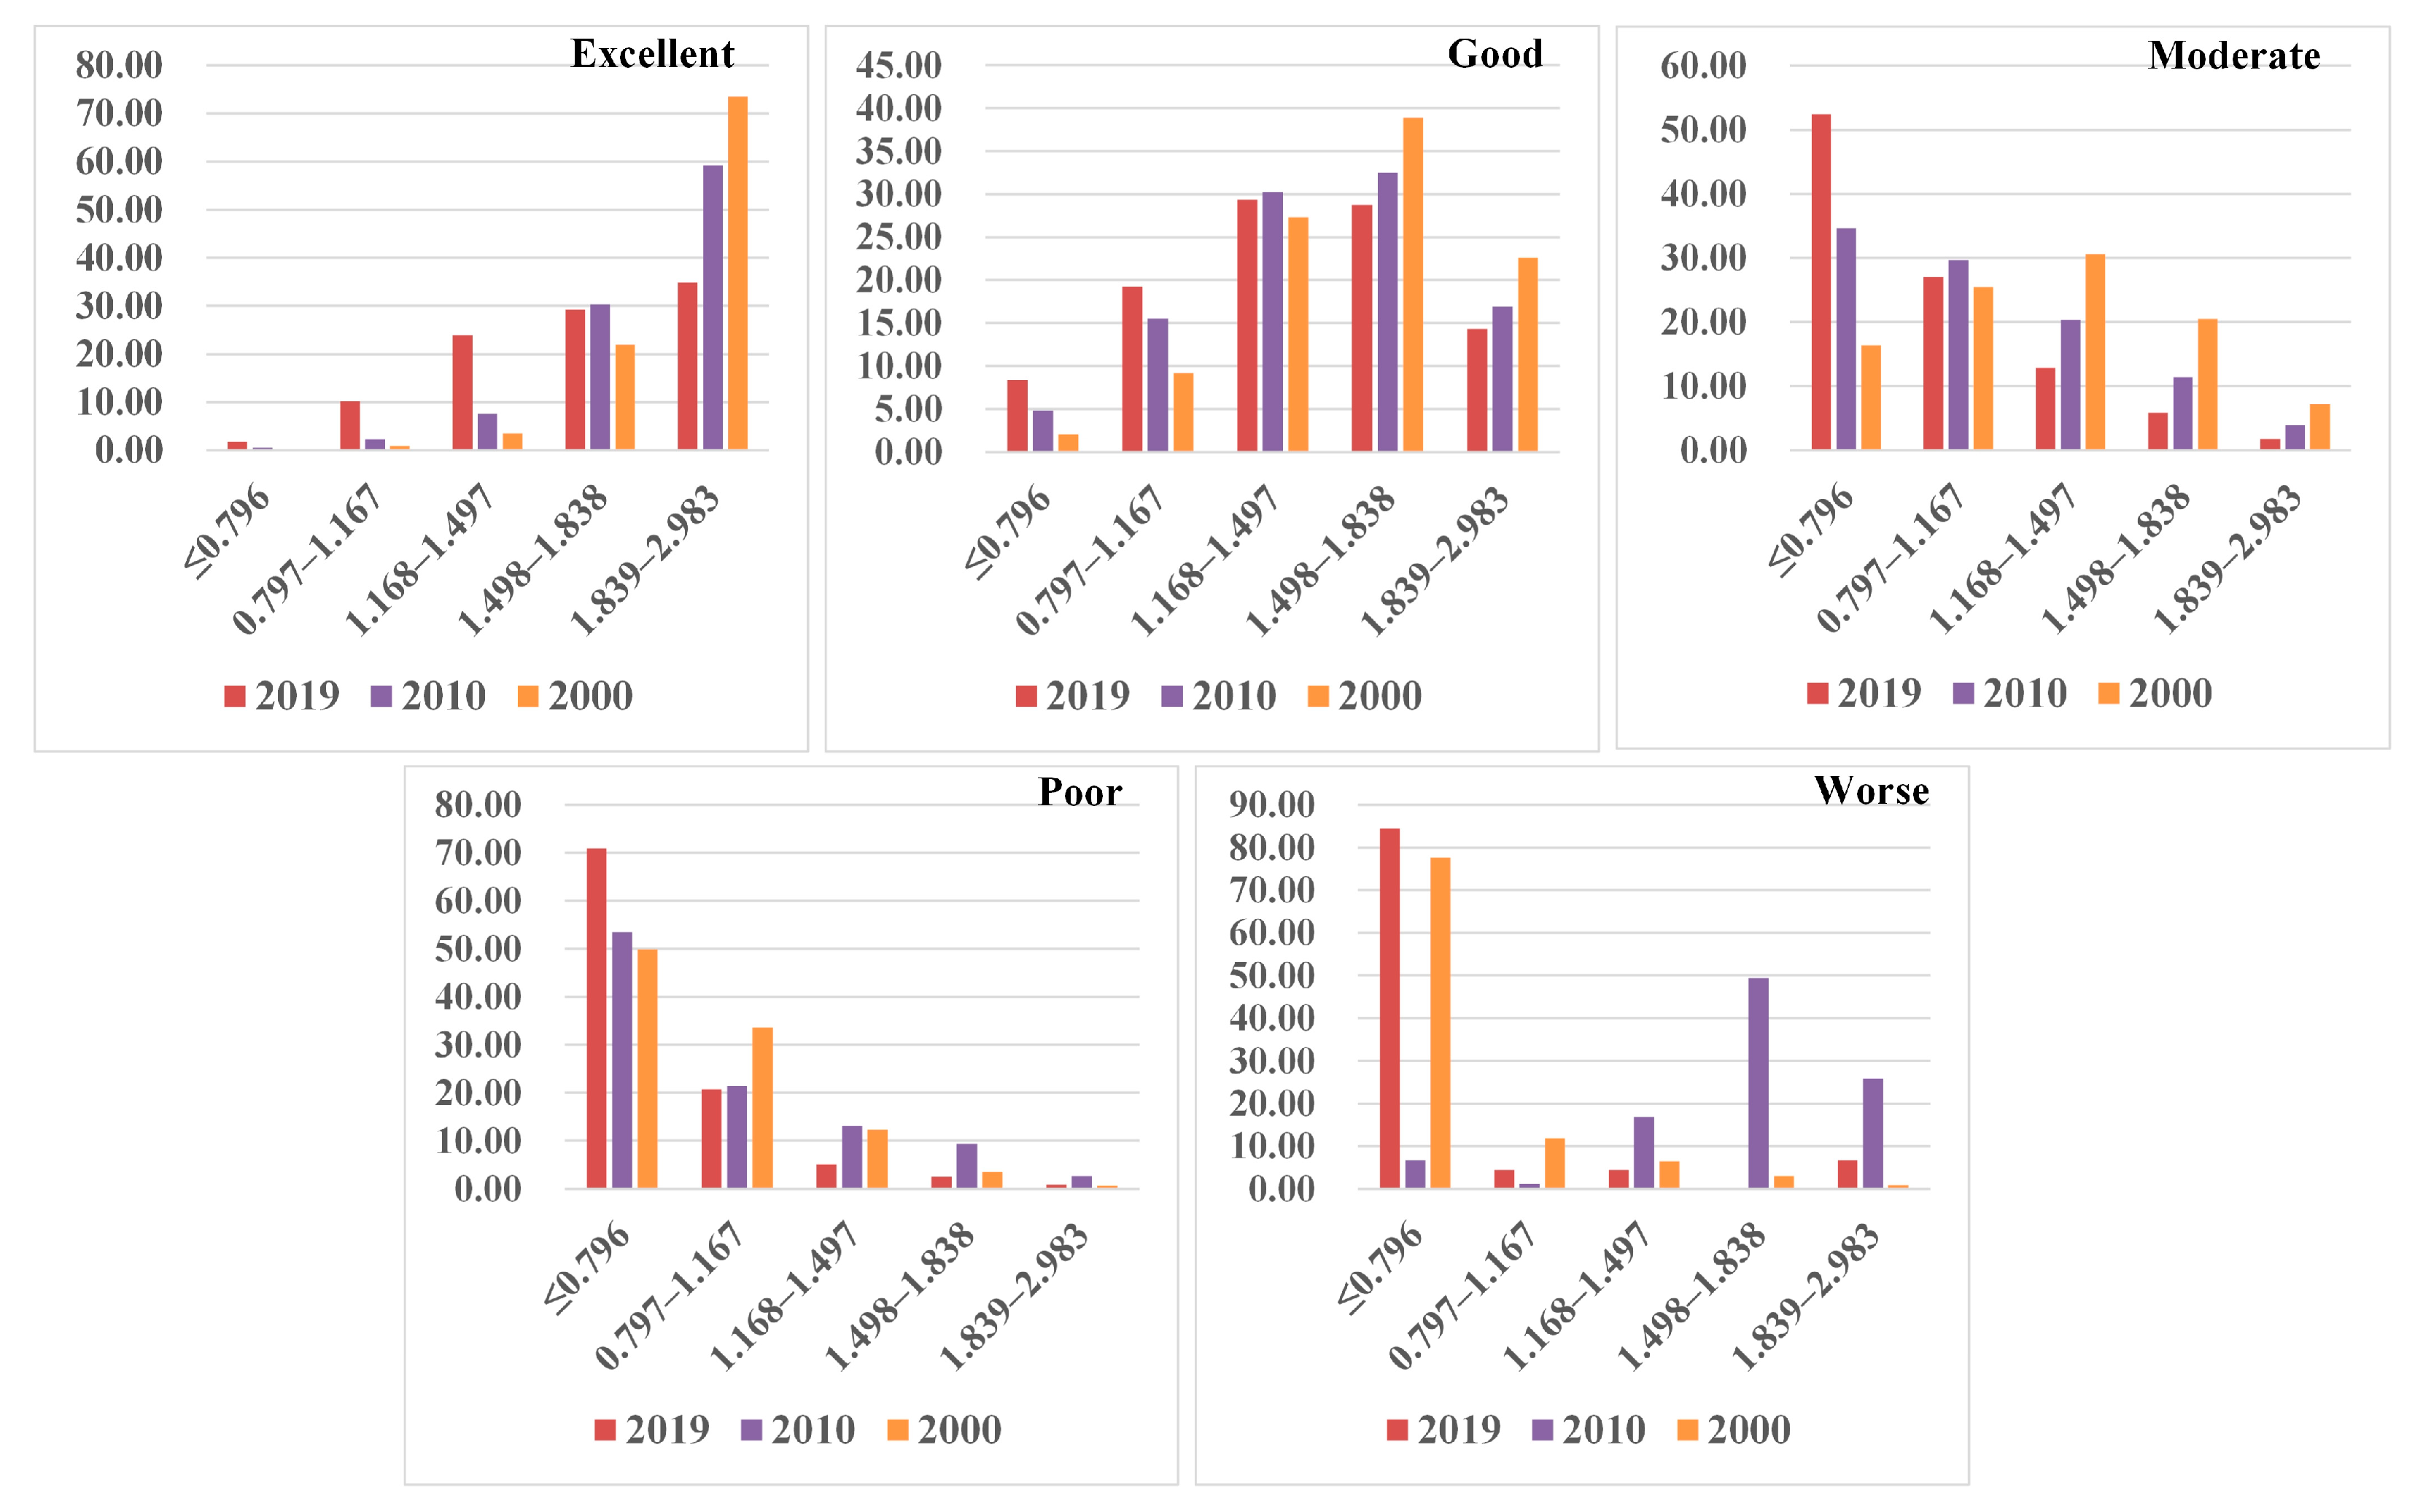
- (5)
- Distribution Characteristics of the EEQ at the TPI Factor
3.3. Primary Driving Factors of Topography for the EEQ
4. Discussion
4.1. Rationality of Topographic Factor Classifications
4.2. Limitations of Geodetector Model
4.3. Applicability of the Conclusions
5. Conclusions
- (1)
- In general, across all study periods, the trends in topographic factors exhibited a consistent pattern: the average values rose in tandem with the increase in the EEQ grades.
- (2)
- Areas in the excellent grade were mainly found at elevations ranging from 385 to 1000 m, on the slopes between 5° and 35°, and on the shady slopes. These areas corresponded to the RA of 4.438–14.698 m and the TPI of 1.168–2.983. The regions in the good grade encompassed nearly all the classifications of the topographic factors. Typically, for the moderate, poor, and worse grades, there was a trend of decreasing areas as topographic factor classification increased. However, in 2010, the worse grade EEQ was observed in the regions with relatively steep terrain compared with those in 2000 and 2019; this may be because there still are some patches scattered in the regions with poor soil and difficult access, which has been difficult to govern since 2010.
- (3)
- Elevation, TPI, and TPI factors had the greatest explanatory power for the EEQ in 2000, 2010, and 2019, respectively. Simultaneously, the coupling effect of any two topographic factors on the EEQ was greater than that of a single factor, and elevation and aspect, aspect and TPI, and aspect and TPI had the greatest coupling effect on the EEQ for the three periods (2000, 2010, and 2019), respectively, which also better reminds us that it is necessary to pay more attention to the comprehensive impact of topographic factors.
Author Contributions
Funding
Institutional Review Board Statement
Informed Consent Statement
Data Availability Statement
Conflicts of Interest
References
- Liu, P.; Ren, C.; Wang, Z.; Zhang, B.; Chen, L. Assessment of the eco-enviromental quality in the Nanweng River Nature Reserve, Northeast China by remote sensing. Chin. J. Appl. Ecol. 2018, 29, 3347–3356. [Google Scholar] [CrossRef]
- Ministry of Environmental Protection of the People’s Republic of China. Available online: https://www.mee.gov.cn/image20010518/6257.pdf (accessed on 25 December 2024).
- Ministry of Ecology and Environment of the People’s Republic of China. Available online: https://www.mee.gov.cn/ywgz/fgbz/bz/bzwb/stzl/201503/W020150326489785523925.pdf (accessed on 25 December 2024).
- Hu, X.; Xu, H. A New Remote Sensing Index for Assessing the Spatial Heterogeneity in Urban Ecological Quality: A Case from Fuzhou City, China. Ecol. Indic. 2018, 89, 11–21. [Google Scholar] [CrossRef]
- Ma, H.; Shi, L. Assessment of Eco-Environmental Quality of Western Taiwan Straits Economic Zone. Env. Monit Assess 2016, 188, 311. [Google Scholar] [CrossRef] [PubMed]
- Guo, Z.; Wei, W.; Zhang, X.; Li, Z.; Zhou, J.; Xie, B. Spatial distribution characteristics and influencing factors of eco-environmental quality based on RS and GIS in Shiyang River Basin, China. Chin. J. Appl. Ecol. 2019, 30, 3075–3086. [Google Scholar] [CrossRef]
- Liu, T.; Wang, H.; Wang, H.; Xu, H. The Spatiotemporal Evolution of Ecological Security in China Based on the Ecological Footprint Model with Localization of Parameters. Ecol. Indic. 2021, 126, 107636. [Google Scholar] [CrossRef]
- Miao, C.; Sun, L.; Yang, L. The Studies of Ecological Environmental Quality Assessment in Anhui Province Based on Ecological Footprint. Ecol. Indic. 2016, 60, 879–883. [Google Scholar] [CrossRef]
- Shi, Z.; Li, H. Application of Artificial Neural Network Approach and Remotely Sensed Imagery for Regional Eco-Environmental Quality Evaluation. Env. Monit Assess 2007, 128, 217–229. [Google Scholar] [CrossRef] [PubMed]
- Nourani, V.; Foroumandi, E.; Sharghi, E.; Dąbrowska, D. Ecological-Environmental Quality Estimation Using Remote Sensing and Combined Artificial Intelligence Techniques. J. Hydroinform. 2021, 23, 47–65. [Google Scholar] [CrossRef]
- Fung, T.; Siu, W. Environmental quality and its changes, an analysis using NDVI. Int. J. Remote Sens. 2000, 21, 1011–1024. [Google Scholar] [CrossRef]
- Baig, M.H.A.; Zhang, L.; Shuai, T.; Tong, Q. Derivation of a tasselled cap transformation based on Landsat 8 at-satellite reflectance. Remote Sens. Lett. 2014, 5, 423–431. [Google Scholar] [CrossRef]
- Crist, E.P. A TM Tasseled Cap equivalent transformation for reflectance factor data—NASA Technical Reports Server (NTRS). Remote Sens. Environ. 1985, 17, 301–306. [Google Scholar] [CrossRef]
- Tan, Z.; Xi, S. Analysis on the Evolution of Heat Island Effect and Its Influencing Factors in Ningbo Central City from 1990 to 2015. J. Hebei Univ. Eng. (Nat. Sci. Ed.) 2021, 38, 69–77. [Google Scholar] [CrossRef]
- Qin, Z.; Zhang, M.; Arnon, K.; Pedro, B. Mono-window Algorithm for Retrieving Land Surface Temperature from Landsat TM6 data. Acta Geogr. Sin. 2001, 56, 456–466. [Google Scholar]
- Xu, H. A remote sensing urban ecological index and its application. Acta Ecol. Sin. 2013, 33, 7853–7862. [Google Scholar]
- Liao, W.; Jiang, W. Evaluation of the Spatiotemporal Variations in the Eco-Environmental Quality in China Based on the Remote Sensing Ecological Index. Remote Sens. 2020, 12, 2462. [Google Scholar] [CrossRef]
- Gong, C.; Lyu, F.; Wang, Y. Spatiotemporal Change and Drivers of Ecosystem Quality in the Loess Plateau Based on RSEI: A Case Study of Shanxi, China. Ecol. Indic. 2023, 155, 111060. [Google Scholar] [CrossRef]
- Gan, X.; Du, X.; Duan, C.; Peng, L. Evaluation of Ecological Environment Quality and Analysis of Influencing Factors in Wuhan City Based on RSEI. Sustainability 2024, 16, 5809. [Google Scholar] [CrossRef]
- Ji, J.; Wang, S.; Zhou, Y.; Liu, W.; Wang, L. Studying the Eco-Environmental Quality Variations of Jing-Jin-Ji Urban Agglomeration and Its Driving Factors in Different Ecosystem Service Regions From 2001 to 2015. IEEE Access 2020, 8, 154940–154952. [Google Scholar] [CrossRef]
- Cheng, L.; Wang, Z.; Tian, S.; Liu, Y.; Sun, M.; Yang, Y. Evaluation of eco-environmental quality in Mentougou District of Beijing based on im proved remote sensing ecological index. Chin. J. Ecol. 2021, 40, 1177–1185. [Google Scholar] [CrossRef]
- Muhadaisi, A.; Zhang, F.; Liu, K.; Ayinuer, Y. Urban ecological environment evaluation based on Tiangong—2 and Landsat8 data. Remote Sens. Land Resour. 2020, 32, 209–218. [Google Scholar] [CrossRef]
- Zhang, J.; Gu, Y.; Shen, J.; Cong, M.; Sun, Y.; He, J.; Yang, L. Analysis of Spatiotemporal Changes and Driving Factors of Ecological Environment Quality in the Yellow River Basin. Environ. Sci. 2024, 46, 956–971. [Google Scholar] [CrossRef]
- Wang, S.; Wu, W. Spatiotemporal Variation of Ecological Environmental Quality and Its Response to Different Driving Factors in Jialing River Basin In Recent 31 Years. Res. Soil Water Conserv. 2024, 31, 427–439. [Google Scholar] [CrossRef]
- Jing, Y.; Zhang, F.; He, Y.; Kung, H.; Johnson, V.C.; Arikena, M. Assessment of Spatial and Temporal Variation of Ecological Environment Quality in Ebinur Lake Wetland National Nature Reserve, Xinjiang, China. Ecol. Indic. 2020, 110, 105874. [Google Scholar] [CrossRef]
- Yu, H.; Zhang, F.; Ma, H.; Lu, Y. Spatio-temporal Evolution and Driving Factors of Ecological Environment Quality in the Huaihe River Basin Based on RSEI. Environ. Sci. 2024, 45, 4112–4121. [Google Scholar] [CrossRef]
- Li, J.; Zhang, Y.; Yu, T.; Yan, R. Assessment of Spatial-Temporal Changes of Ecological Environment Quality and Its Driving Force Analysis in Aksu Region Based on Remote Sensing Ecological Index. J. Soil Water Conserv. 2023, 37, 333–340. [Google Scholar] [CrossRef]
- Wang, F.; Li, W.; Lin, Y.; Nan, X.; Hu, Z. Spatiotemporal Pattern and Driving Force Analysis of Ecological Environmental Quality in Typical Ecological Areas of the Yellow River Basin from 1990 to 2020. Environ. Sci. 2023, 44, 2518–2527. [Google Scholar] [CrossRef]
- Liu, Y.; Zhou, T.; Yu, W. Analysis of Changes in Ecological Environment Quality and Influencing Factors in Chongqing Based on a Remote-Sensing Ecological Index Mode. Land 2024, 13, 227. [Google Scholar] [CrossRef]
- Xiong, Q.; Hong, Q.; Chen, W. Temporal and Spatial Response of Ecological Environmental Quality to Land Use Transfer in Nanling Mountain Region, China Based on RSEI: A Case Study of Longnan City. Land 2024, 13, 675. [Google Scholar] [CrossRef]
- Xu, H.; Wang, M.; Shi, T.; Guan, H.; Fang, C.; Lin, Z. Prediction of Ecological Effects of Potential Population and Impervious Surface Increases Using a Remote Sensing Based Ecological Index (RSEI). Ecol. Indic. 2018, 93, 730–740. [Google Scholar] [CrossRef]
- Ullah, W.; Ahmad, K.; Ullah, S.; Tahir, A.A.; Javed, M.F.; Nazir, A.; Abbasi, A.M.; Aziz, M.; Mohamed, A. Analysis of the Relationship among Land Surface Temperature (LST), Land Use Land Cover (LULC), and Normalized Difference Vegetation Index (NDVI) with Topographic Elements in the Lower Himalayan Region. Heliyon 2023, 9, e13322. [Google Scholar] [CrossRef] [PubMed]
- Shi, S.; Wang, X.; Hu, Z.; Zhao, X.; Zhang, S.; Hou, M.; Zhang, N. Geographic Detector-Based Quantitative Assessment Enhances Attribution Analysis of Climate and Topography Factors to Vegetation Variation for Spatial Heterogeneity and Coupling. Glob. Ecol. Conserv. 2023, 42, e02398. [Google Scholar] [CrossRef]
- Cheng, M.; Cao, G.; Zhao, M.; Diao, E.; He, Q.; Gao, S.; Qiu, X.; Cheng, G. Temporal and spatial variation characteristics and influencial factors of soil moisture in the Xiangride-Qaidam River Basin. Arid Zone Res. 2022, 39, 615–624. [Google Scholar] [CrossRef]
- Karbalaee, A.R.; Hedjazizadeh, Z.; Masoodian, S.A. Dependency of LSA and LST to Topographic Factors in Iran, Based on Remote Sensing Data. Theor. Appl. Clim. 2023, 153, 709–726. [Google Scholar] [CrossRef]
- Xu, X.; Genovese, P.V.; Zhao, Y.; Liu, Y.; Woldesemayat, E.M.; Zoure, A.N. Geographical Distribution Characteristics of Ethnic-Minority Villages in Fujian and Their Relationship with Topographic Factors. Sustainability 2022, 14, 7727. [Google Scholar] [CrossRef]
- Xu, J.; Zheng, L.; Ma, R.; Tian, H. Correlation between Distribution of Rural Settlements and Topography in Plateau-Mountain Area: A Study of Yunnan Province, China. Sustainability 2023, 15, 3458. [Google Scholar] [CrossRef]
- Shi, S.; Peng, S.; Lin, Z.; Zhu, Z.; Ma, D.; Yin, Y.; Lu, X.; Li, T.; Gong, L. Analysis of Ecological Environment Quality Heterogeneity across Different Landform Types in Myanmar and Its Driving Forces. Ecol. Indic. 2024, 168, 112755. [Google Scholar] [CrossRef]
- Chen, J.; Lin, G.; Chen, Z. Evaluation of Spatial–Temporal Variations in Ecological Environment Quality in the Red Soil Region of Southern China: A Case Study of Changting County. Appl. Sci. 2024, 14, 8641. [Google Scholar] [CrossRef]
- Deng, C.; Chen, Z.; Chen, H.; Chen, Z. Hyperspectral Estimation Models of Chlorophyll Content for Dicranopteris Dichotoma Leaves at Different Ecological Restoration Stages in the Eroded Red Soil Areas of Southern China. J. Geo-Inf. Sci. 2019, 21, 948–957. [Google Scholar] [CrossRef]
- Jiang, T.; Xie, Y.; Chen, Z.; Chen, Z.; Chen, J. Reductions of Water Flow and Sediment Under Different Water Conservation Measures in Changting County of Fujian Province. Bull. Soil Water Conserv. 2018, 38, 35–41. [Google Scholar] [CrossRef]
- Zhou, J.; Zhang, B.; Luo, J. Terrain Gradient Differentiation of Ecosystem Service Value and Its Driving Factors in Anning River Basin. J. Hydroecology 2023, 1–9. [Google Scholar] [CrossRef]
- Chen, X.; Lin, X.; Mu, F.; Wang, Y.; Cheng, Z.; Jia, L. Temporal and Spatial Evolution of Ecosystem Service Value and Topographic Gradient Effect in Northeast Chongqing. J. Henan Polytech. Univ. (Nat. Sci.) 2023, 42, 92–102. [Google Scholar] [CrossRef]
- Cen, Y.; Zhang, B.; Luo, J.; Deng, Q.; Liu, H.; Wang, L. Influence of Topographic Factors on the Characteristics of Gully Systems in Mountainous Areas of Ningnan Dry-Hot Valley, SW China. Int. J. Environ. Res. Public Health 2022, 19, 8784. [Google Scholar] [CrossRef]
- Yu, H.; Zeng, H.; Jiang, Z. Study on Distribution Characteristics of Landscape Elements along the Terrain Gradient. Sci. Geogr. Sin. 2001, 21, 64–69. [Google Scholar] [CrossRef]
- Wang, J.; Li, X.; Christakos, G.; Liao, Y.; Zhang, T.; Gu, X.; Zheng, X. Geographical Detectors-Based Health Risk Assessment and its Application in the Neural Tube Defects Study of the Heshun Region, China. Int. J. Geogr. Inf. Sci. 2010, 24, 107–127. [Google Scholar] [CrossRef]
- 2010 Government Work Report of Changting County, Longyan City, Fujian Province. Available online: http://www.changting.gov.cn/xxgk/gzbg/201007/t20100714_822071.htm (accessed on 7 February 2025).
- Su, Y.; Zhang, P.; Zhang, X.; Zhao, Y.; Li, L. Ecological environment quality evaluation and driving factor analysis of Wu’an national forest park in Hebei province. J. Hebei Univ. (Nat. Sci. Ed.) 2023, 43, 197–206. [Google Scholar] [CrossRef]
- Wang, J.; Xu, C. Geodetector: Principle and Prospective. Acta Geogr. Sin. 2017, 72, 116–134. [Google Scholar] [CrossRef]
- Wu, P.; Chen, J.; Chen, S. Applications of Spatial Association Rules in the Study of Relationship between Landuse and Terrain Features. J. Subtrop. Resour. Environ. 2011, 6, 64–69. [Google Scholar]


| Topographic Factors | Classification | Unit | Method |
|---|---|---|---|
| Elevation | 1 (212–385); 2 (385–500); 3 (500–655); 4 (655–1000); 5 (1000–1400) | Meter | Natural Breaks (Jenks) + Manual |
| Slope | 1 (≤2°); 2 (2–5°); 3 (5–15°); 4 (15–25°); 5 (25–35°); 6 (35–55°); 7 (<70.72°) | Degree | Manual |
| Aspect | 1 (−1); 2 (0–22.5°, 337.5–360°); 3 (22.5–67.5°); 4 (67.5–112.5°); 5 (112.5–157.5°); 6 (157.5–202.5°); 7 (202.5–247.6°); 8 (247.5–292.5°); 9 (292.5–337.5°); | Degree | Equal Interval |
| Relief Amplitude (RA) | 1 (≤4.437); 2 (4.438–9.151); 3 (9.152–14.698); 4 (14.699–23.017); 5 (23.018–70.715) | Meter | Natural Breaks (Jenks) |
| Topographic Position Index (TPI) | 1 (≤0.796); 2 (0.797–1.167); 3 (1.168–1.497); 4 (1.498–1.838); 5 (1.839–2.983) | Natural Breaks (Jenks) |
| Year | Grades | Elevation | Slope | RA | TPI |
|---|---|---|---|---|---|
| 2000 | Poor | 291 | 3.3 | 3.36 | 0.62 |
| Worse | 352.2 | 5.7 | 5.1 | 0.84 | |
| Moderate | 468.6 | 12 | 8.2 | 1.24 | |
| Good | 626.9 | 16.6 | 9.2 | 1.58 | |
| Excellent | 864.1 | 23 | 9.3 | 2 | |
| 2010 | Poor | 655.2 | 16.9 | 7.2 | 1.62 |
| Worse | 404.2 | 5.8 | 4.6 | 0.88 | |
| Moderate | 423.3 | 8.3 | 6.5 | 1.03 | |
| Good | 562.7 | 15.4 | 9.1 | 1.48 | |
| Excellent | 674.2 | 24.6 | 10.3 | 1.87 | |
| 2019 | Poor | 410.1 | 2.1 | 1.62 | 0.67 |
| Worse | 372.1 | 3.3 | 3.3 | 0.73 | |
| Moderate | 392.7 | 5.5 | 5.3 | 0.86 | |
| Good | 536.4 | 14.3 | 8.7 | 1.4 | |
| Excellent | 586.3 | 20.6 | 10.2 | 1.66 |
| Year | TPI | RA | Aspect | Slope | Elevation |
|---|---|---|---|---|---|
| 2000 | 0.393 | 0.079 | 0.164 | 0.243 | 0.421 |
| 2010 | 0.293 | 0.084 | 0.196 | 0.238 | 0.193 |
| 2019 | 0.293 | 0.092 | 0.232 | 0.266 | 0.129 |
| Year | TPI and RA | Aspect and RA | Aspect and TPI | Slope and RA | Slope and TPI |
| 2000 | 0.409 | 0.199 | 0.462 | 0.273 | 0.414 |
| 2010 | 0.316 | 0.225 | 0.363 | 0.269 | 0.296 |
| 2019 | 0.325 | 0.255 | 0.348 | 0.302 | 0.303 |
| Year | Slope and Aspect | Elevation and RA | Elevation and TPI | Elevation and Aspect | Elevation and Slope |
| 2000 | 0.316 | 0.448 | 0.497 | 0.517 | 0.488 |
| 2010 | 0.309 | 0.240 | 0.314 | 0.328 | 0.311 |
| 2019 | 0.317 | 0.200 | 0.299 | 0.301 | 0.304 |
Disclaimer/Publisher’s Note: The statements, opinions and data contained in all publications are solely those of the individual author(s) and contributor(s) and not of MDPI and/or the editor(s). MDPI and/or the editor(s) disclaim responsibility for any injury to people or property resulting from any ideas, methods, instructions or products referred to in the content. |
© 2025 by the authors. Licensee MDPI, Basel, Switzerland. This article is an open access article distributed under the terms and conditions of the Creative Commons Attribution (CC BY) license (https://creativecommons.org/licenses/by/4.0/).
Share and Cite
Chen, J.; Lin, G.; Chen, Z. Effect of Topographic Factors on Ecological Environment Quality in the Red Soil Region of Southern China: A Case from Changting County. Sustainability 2025, 17, 1501. https://doi.org/10.3390/su17041501
Chen J, Lin G, Chen Z. Effect of Topographic Factors on Ecological Environment Quality in the Red Soil Region of Southern China: A Case from Changting County. Sustainability. 2025; 17(4):1501. https://doi.org/10.3390/su17041501
Chicago/Turabian StyleChen, Junming, Guangfa Lin, and Zhibiao Chen. 2025. "Effect of Topographic Factors on Ecological Environment Quality in the Red Soil Region of Southern China: A Case from Changting County" Sustainability 17, no. 4: 1501. https://doi.org/10.3390/su17041501
APA StyleChen, J., Lin, G., & Chen, Z. (2025). Effect of Topographic Factors on Ecological Environment Quality in the Red Soil Region of Southern China: A Case from Changting County. Sustainability, 17(4), 1501. https://doi.org/10.3390/su17041501