Article

Impact of Technological Advances on Workers’ Health: Taking Robotics as an Example

School of Business, Ningbo University, Ningbo 315000, China
*
Authors to whom correspondence should be addressed.
Sustainability 2025, 17(4), 1497; https://doi.org/10.3390/su17041497
Submission received: 9 January 2025 / Revised: 2 February 2025 / Accepted: 10 February 2025 / Published: 12 February 2025
(This article belongs to the Section Health, Well-Being and Sustainability)

Abstract

:
Workers’ health is one of the key factors for sustainable economic development. In the new era of industrialization marked by the rise of automation, the impact of widespread robot use on workers’ health is a growing concern. We organize the robotics data released by the International Federation of Robotics to the prefecture and city level and further match them with the 2010–2015 China Comprehensive Social Survey database in the city–year dimension. Subsequently, we used fixed-order regression analysis with maximum likelihood estimation to explore the impact of robotics development on workers’ health indicators. Our findings reveal that the use of industrial robots generally improves workers’ health and releases the “health dividend” of workers, with each unit increase in urban robot penetration increasing the probability of worker health in that area by 4%. A mechanism analysis shows that robots enhance workers’ health primarily by reducing labor intensity. Further heterogeneity analysis indicates that the health benefits of industrial robots are more pronounced for low-skilled workers, female workers, and agricultural laborers. Our research offers valuable insights into protecting workers’ rights and well-being in the age of automation.

1. Introduction

Due to the size of China’s population, previous studies have tended to focus on the “economic dividend of labor” [1,2,3]. With the aging population of Chinese society [4], studies have begun to focus on workers’ health [5,6]. In developing economies, the sustainability of the health of the workforce is important for productivity gains, thus contributing to overall economic growth [7,8]. Labor health issues have been widely discussed, especially after the global COVID-19 pandemic [9]. The classical economic school argues that the rational division of labor can effectively improve the efficiency of economic growth, and the neoclassical economic school focuses on the role of mutual knowledge spillovers and innovation in human capital. In addition to the differences in productivity and innovation ability, human capital should also include the health level of laborers. Based on the current stage of China’s economic development, maintaining economic growth while taking into account people’s livelihoods is the proper meaning of realizing high-quality economic development. However, the phenomena of “occupational disease”, “overwork”, and “overtime culture” are emerging in today’s society and seriously threatening workers’ health [10,11]. As the core concept of healthy and sustainable development is people-centered, these phenomena need to be urgently ameliorated.
The level of worker health as an expression of individual well-being is closely linked to economic growth [12]. The first strand of the literature relevant to our study is research related to health economics [13,14]. More economically developed areas often have better living conditions, nutritional intake, and public health, which in turn improves the health of the population [15,16]. At the macro-level, high economic growth allows governments more room to restructure public health expenditure and health care financing funds to act as a promoter of workers’ individual health [17]; at the micro-level, Tanaka (2020) argues that when rapid economic growth in developing economies gives domestic firms greater access to international markets, it can positively affect workers’ living environments by improving working conditions, such as fire safety and health care [18]. However, economic growth does not always have a positive impact on workers’ health, and the process of industrialization, with its high energy consumption and pollution, can damage ecosystems and impose heavy social health costs on the population [19]. Especially for developing economies, as “catching-up” societies, relying on the large markets of developed economies to carry out trade activities is an important channel to achieve economic growth, and relevant studies have also shown the existence of “sweatshops” in developing economies [20]. China’s early foreign direct investment has also turned China into the world’s sweatshop [21,22].
A second strand of the literature related to the text focuses on the economic growth effects of industrial robots [23,24]. Undoubtedly, China’s economic growth in recent years has entered a new channel, and the traditional model of crude economic growth that relies on processing trade no longer meets the requirements for high-quality development of the current economy. The previous literature represented by trade development can no longer explain the new changes that have occurred with respect to worker health. With the rapid advancement of artificial intelligence technology, countries are using industrial robots in the automotive, electronics, logistics, and transportation fields to find a new engine of economic growth [25,26,27]. Germany has embarked on “Industry 4.0”, the U.S. is moving toward an “Industrial Internet”, and the Chinese government has increased its investment in industrial robots in recent years [28,
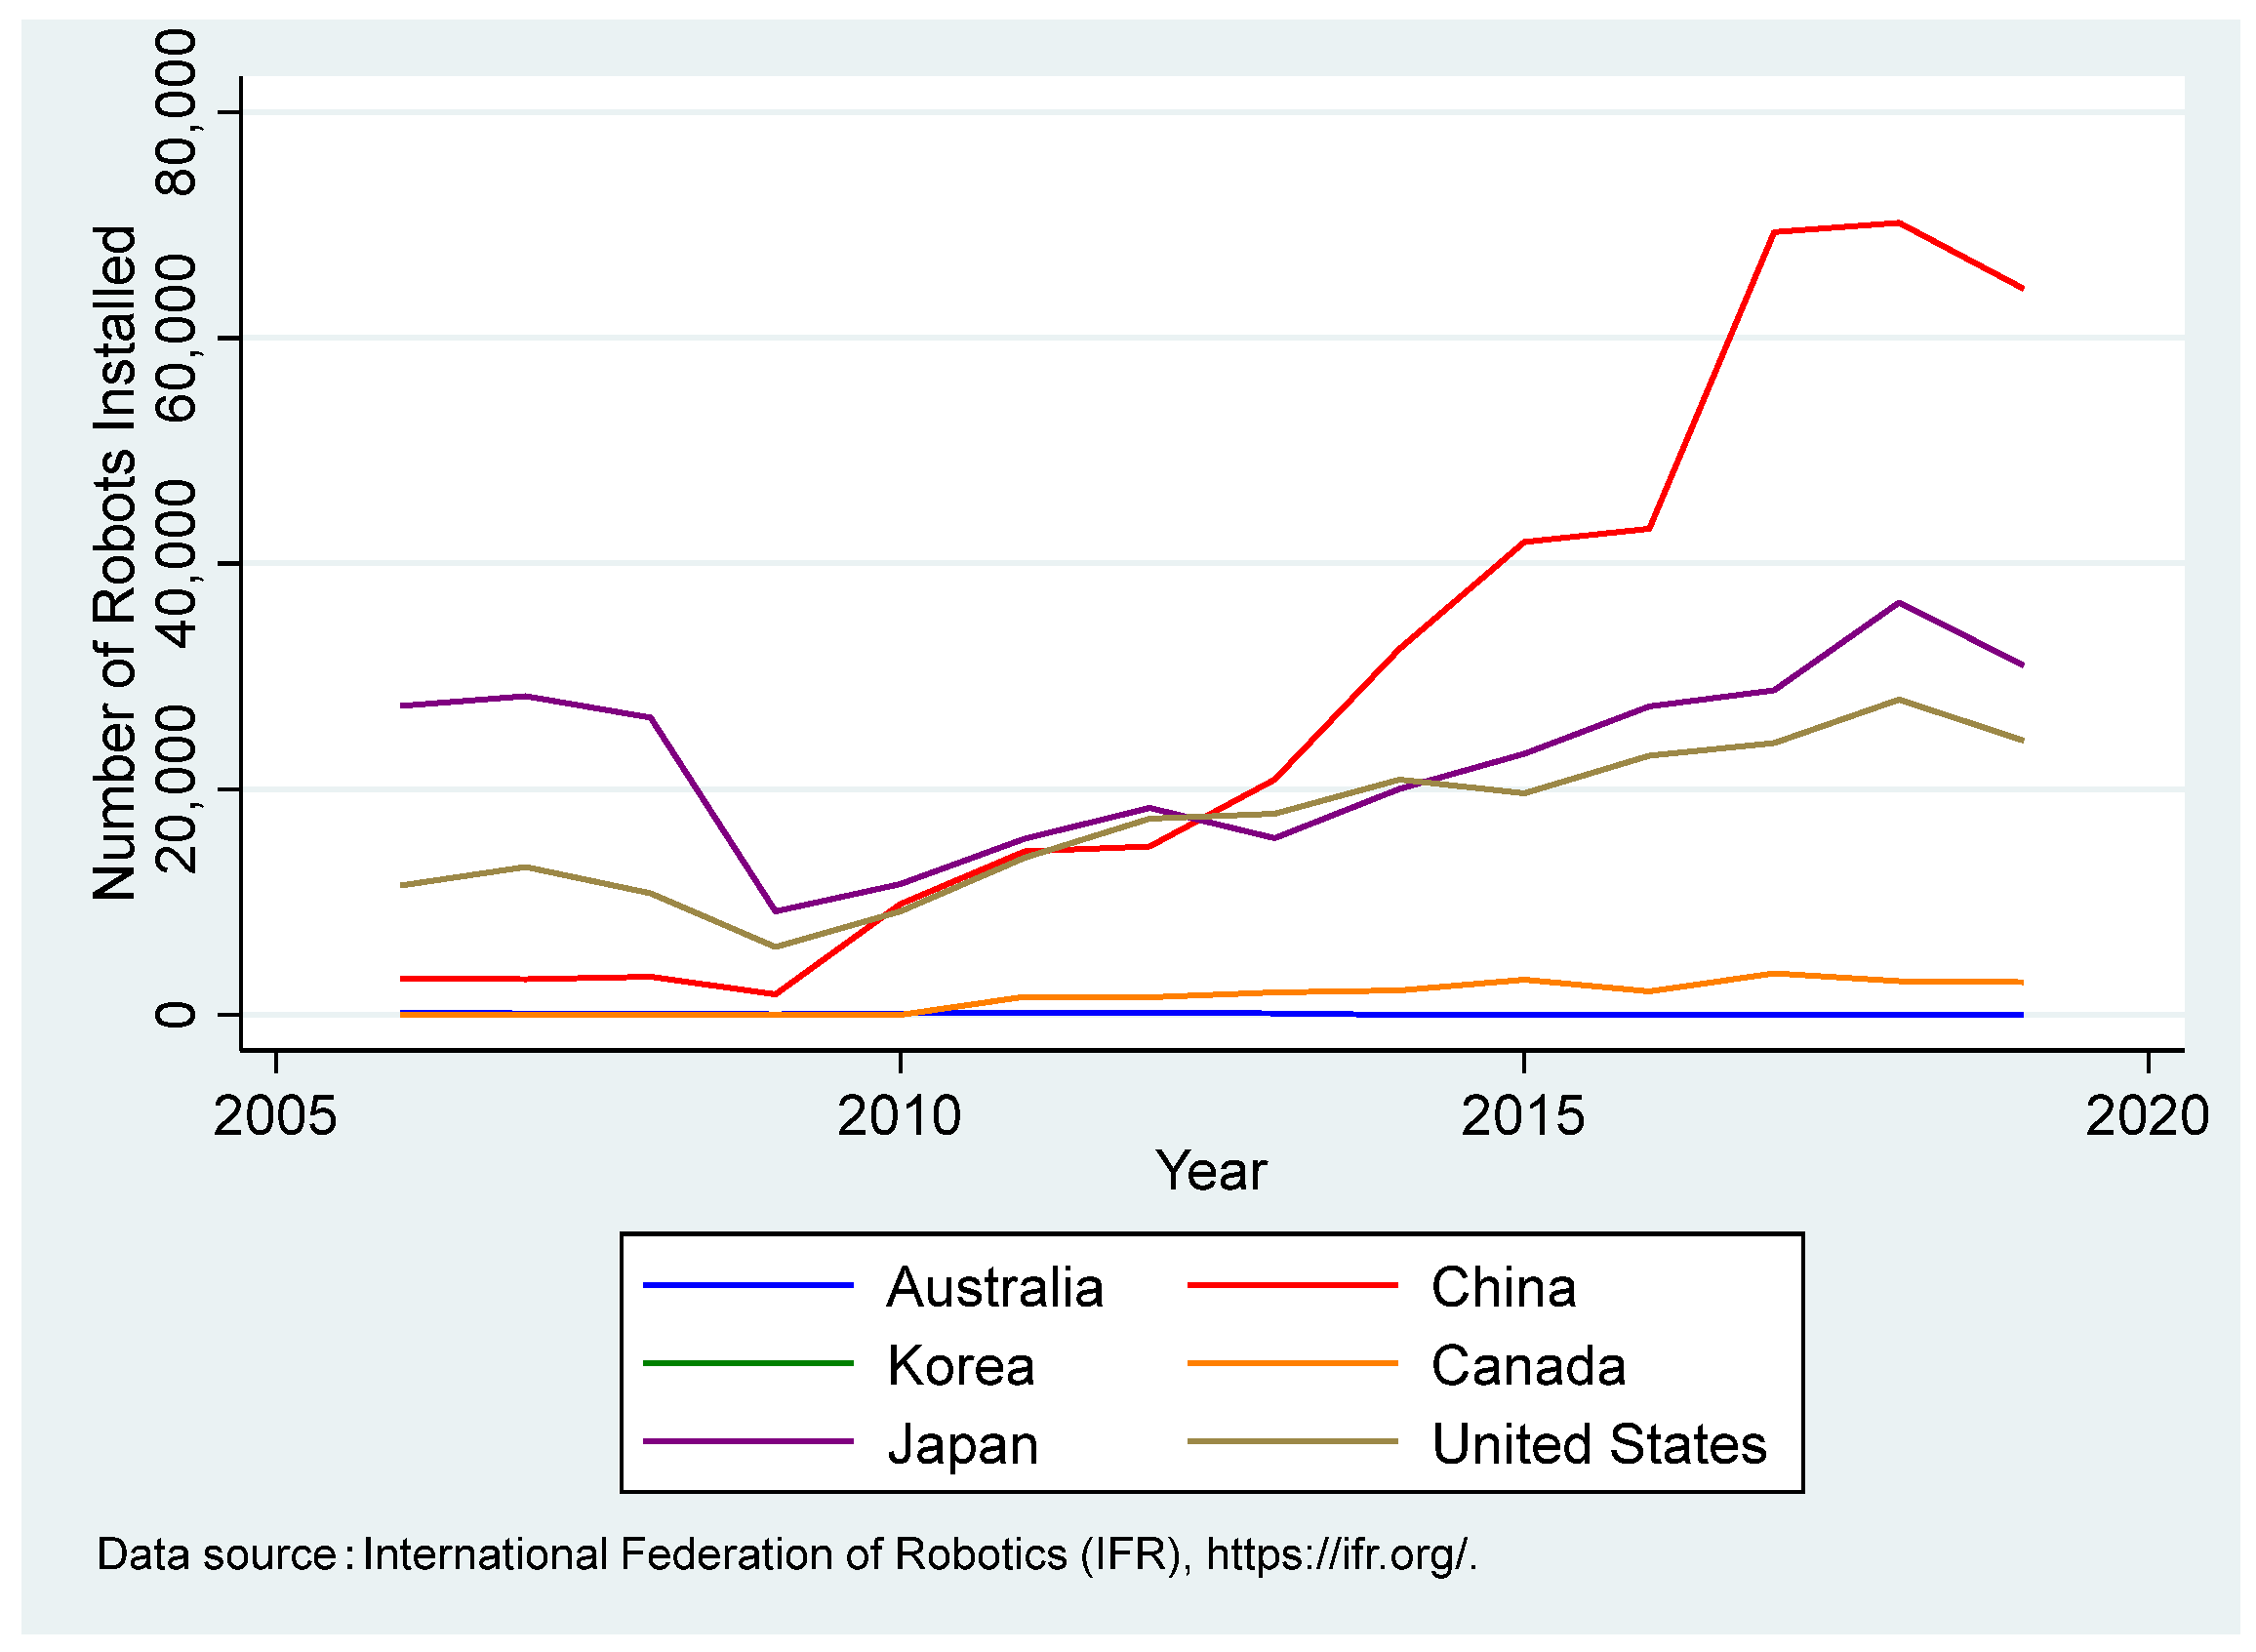
29]. According to the International Federation of Robotics (IFR), China’s installed base of industrial robots was predicted to grow at a rate of 44% in 2021, accounting for half of the global robot market share. It is worthwhile to pay attention to whether the large-scale use of industrial robots can change the economic phenomenon of “sweatshops”. Industrial robots, as a technology-intensive and capital-intensive product, have similar aspects to traditional intermediate goods and can be viewed as an aspect of technological advancement in production, by changing the production model in order to enhance the efficiency of economic growth [30]. However, unlike general intermediate goods, the use of industrial robots also has a skill complementarity effect that creates new tasks and new demand [31]. In addition to this, industrial robots also have substitution effects, with one study finding that the extensive adoption of industrial robots on the production side in the United States reduces production costs, thus reducing the need for imports from Mexico to protect its manufacturing sector [32]. Subsequent empirical studies have used the above framework to explore enterprise productivity [33], labor income [34], and interregional labor migration [35]. Our study provides more micro-empirical evidence on how industrial robot use can better utilize human capital for sustainable economic growth.
Although the existing literature is less concerned with the effects of the use of industrial robots on the health of laborers, the related literature focusing on how industrial robots affect the individual utility of laborers has inspired our research more than anything else. In particular, Acemoglu and Restrepo (2020) theoretically analyzed the micro-impacts of industrial robots on workers by nesting a model of the firm’s production tasks into the firm’s supply function [36]. Similarly to previous research, the theoretical analytical framework of our study still follows the same micro-mechanisms, but with the difference that it systematically analyzes the possible double crowding-out and crowding-in effects of different heterogeneous groups, based on the perspective of individual worker health. In addition, this research is also related to the literature focusing on the use of industrial robots and inequality, such as the skill income gap [37], the gender income gap [38], and the income gap between capital and labor owners [39]. Our study adds to the literature on labor economics by focusing further on health inequalities among workers.
The research focus of our study is as follows. Firstly, we emphasize the theoretical association between industrial robot use and workers’ health through mathematical modeling. Secondly, a key part of our research involves constructing an empirical model to verify our theoretical hypotheses using relevant data. Thirdly, we empirically test our theoretical mechanisms from macro-, meso-, and micro-perspectives. Fourthly, whether there is heterogeneity in the effects of industrial robots on workers’ health is also a central focus of this paper. Finally, we use the moderating effect to further analyze how to protect workers’ rights and interests in the context of “machine replacement.”
Firstly, existing research has confirmed that the use of industrial robots has had a profound impact on the labor market, including on wages and employment [40,41]. New technologies represented by industrial robots have increased labor productivity, optimized production processes, and enhanced workplace safety [42]. In particular, industrial robots have a substitution effect that frees workers from heavy physical labor. Our results find that industrial robots directly enhance workers’ health, which coincides with existing research findings, with the difference that our perspective is more direct and micro. Secondly, while our study finds that industrial robot use generally enhances the health effects of laborers, it may adversely affect urban, high-skilled, and male groups due to the simultaneous creation effects of industrial robots. This is in contrast to existing studies that focus only on the overall effect [43]. Finally, we find that narrowing the income gap between workers and strengthening the protection of workers’ rights and interests can effectively avoid the adverse effects of robot use, which suggests that our study has certain policy implications and can make targeted adjustments to the existing labor rights and interests protection policies.

2. Theoretical Framework

Health economics and labor economics suggest that hourly effects, income effects, and environmental effects are the main channels affecting workers’ health, and existing research also suggests that workers’ hours of work and wage income determine the economic effects of industrial robot use [
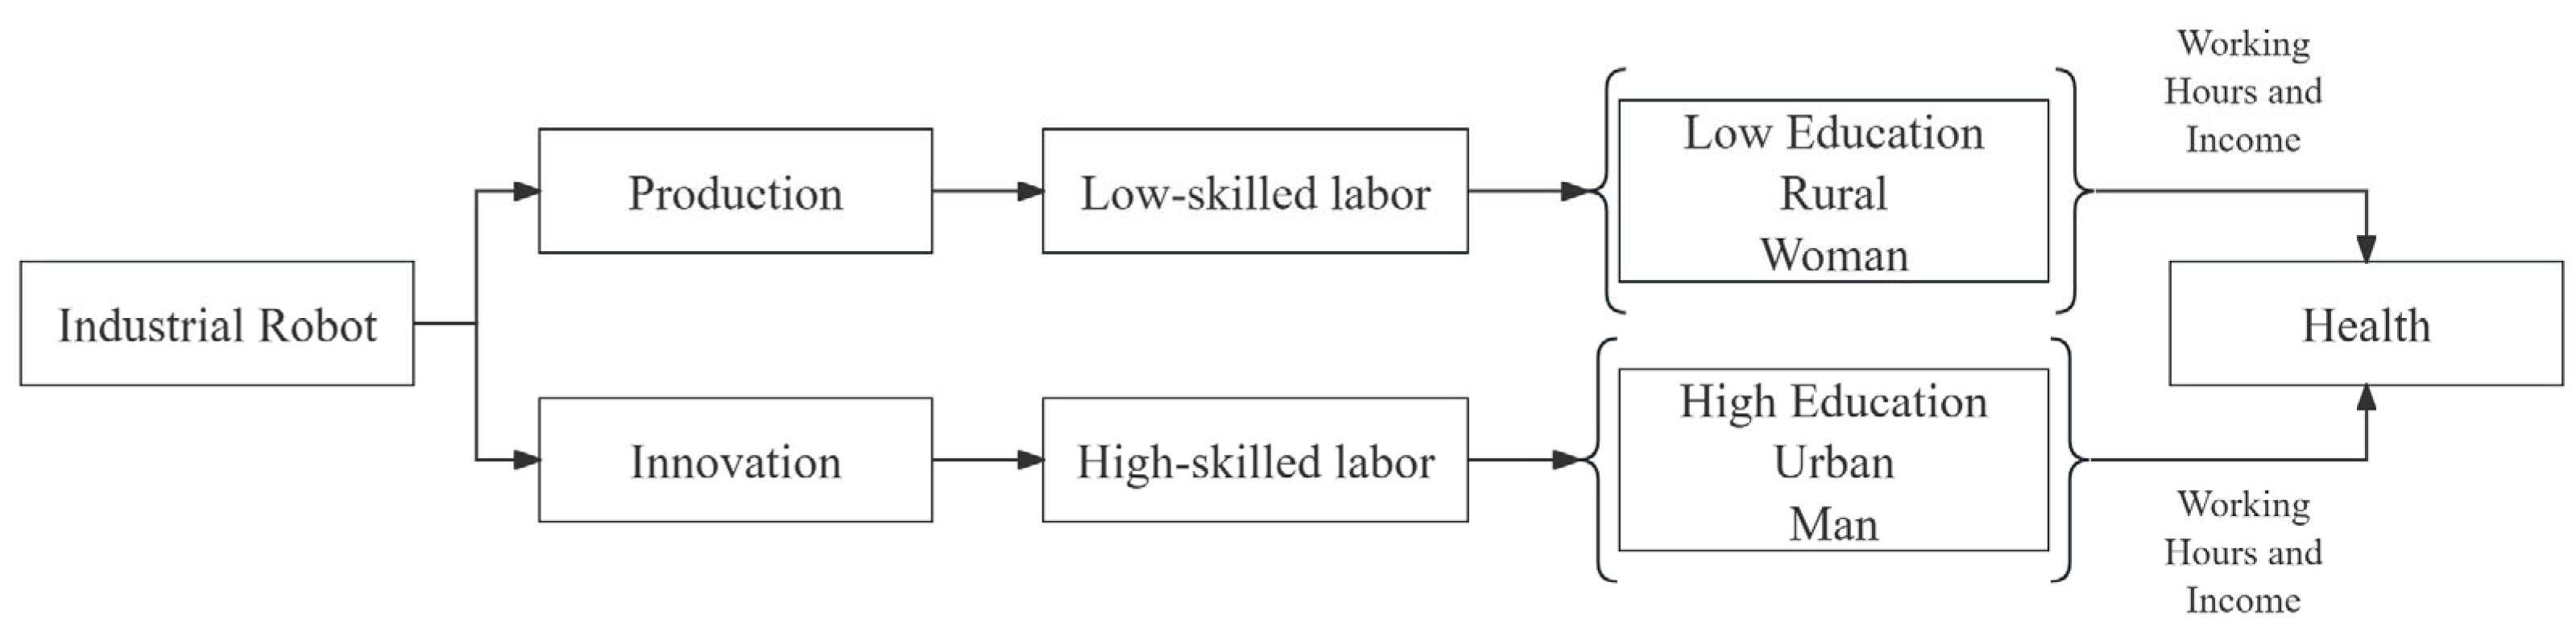
44]. The basic idea of the theoretical model construction in our study is to nest a robot production model with a sequence of jobs into a general equilibrium production function. The decision-making behavior of firms is affected by the cost of robot use (the cost required to purchase industrial robots) and the cost of labor (wages); at the same time, it is assumed that the cost of labor is heterogeneous across skill groups. Ultimately, the impact of robots on the labor force will be affected by individual skill heterogeneity of the labor force and affect the health of the workers. The theoretical framework is shown in Figure 1. The leftmost figure indicates that the use of industrial robots acts first and foremost in two different sectors, namely the production sector and the innovation sector. The intermediate flow parallel process diagram indicates that the production sector primarily affects low-skilled labor groups, including the female population, rural households, and low-educated workers, while the innovation sector primarily affects high-skilled groups, including males, urban households, and highly educated groups. Finally, it is passed on to health by affecting labor intensity and income.

2.1. Demand

The CES function is widely used in individual utility analysis and can accurately explain the composition of an individual’s welfare [45,46]. Therefore, we further incorporate the intensity of the laborer’s work on top of the CES and set the following utility function:
U = ω Ω q ( ω ) ρ d ω 1 ρ h ( θ ) 1 + γ ( θ ) 1 + γ ( θ )
q represents the quantity consumed, σ = 1 1 ρ > 1 represents the elasticity of substitution between goods, h represents the number of hours worked by the laborer, 0 < θ < 1 represents the sequence of jobs that the robot can perform, which reflects the elasticity of substitution between the laborer and the robot, γ represents the elasticity of substitution between labor and robots, and Equation (1) introduces the laborer’s hours of work into the traditional CES utility function, showing that the laborer’s utility is determined by both the consumption of the final goods and the hours of work determined by the robot’s efficiency.
Assuming a wage of w, which is similarly affected by the sequence of jobs performed by the robot, the individual income budget constraint is satisfied:
ω Ω p ( ω ) q ( ω ) d ω w ( θ ) h ( θ )
According to the first-order condition of profit maximization of the enterprise, the product demand function and the composite price index can be obtained to satisfy the budget constraints. E represents the total spending of all residents and can be treated as a constant.
q ( ω ) = p ( ω ) σ P 1 σ E
P = ω Ω p ( ω ) 1 σ d ω 1 1 σ
Combining Equations (1) with (2) creates a Lagrangian function and derives it for the individual’s working time h:
w ( θ ) P = h ( θ ) γ ( θ )
According to Equation (5), the consumer’s indirect utility function is given as follows:
U = χ w ( θ ) h ( θ ) P
The economic implication is that higher incomes and lower prices lead to higher levels of consumer welfare. χ is a constant term, and according to the relevant definition of health economics, the health level of workers is part of individual welfare, which is assumed to satisfy the following equation:
H e a l t h = χ w ( θ ) h ( θ ) r i s k ( h ( θ ) ) M P
r i s k ( h ( θ ) ) denotes the risk of illness or injury to the worker, which is a positive function of the number of hours worked by the worker, and M represents the cost of medicine borne by the worker.
Corollary 1: 
From Equations (5) and (7), it can be concluded that the income of individual laborers changes in the same direction as the number of hours worked, and that an increase in the use of industrial robots by firms will have an impact on laborers’ incomes and the number of hours worked in the same direction.

2.2. Supply

The production chain is usually set up using a CD function, which is usually able to include relevant inputs such as the quantity of labor and intermediate goods [47,48]. Since industrial robots play a role mainly on the production side and are also a type of input factor, our study introduces robots on top of this by setting the following equation:
y = ϕ m R m + ϕ p h ( θ ) L ( θ ) β β 1 α K 1 α
Rm stands for the number of industrial robots, L represents the number of laborers, which is also affected by the productivity of the robots, β denotes the elasticity of substitution between laborers, ϕ m and ϕ p represent the productivity of the industrial robots and laborers, respectively, K represents capital, and α represents the production shares of laborers and robots.
Based on the nature of the CD function, the marginal cost of the vendor’s supply is as follows:
p ( ω ) = θ V m + ( 1 θ ) V p α V k 1 α
V m ,   V p ,   V k denote the marginal cost of production of robots, labor, and capital, respectively. When production efficiency is θ = 1 , robots completely replace labor, and the marginal cost of vendor supply is p ( ω ) = V m α V k 1 α . When production efficiency is θ = 0 , robots are not as productive as human capital, and the marginal cost of vendor supply is p ( ω ) = V p α V k 1 α . There is a wage gap between skill groups V p h > V p l . We further assume that the cost of using robots in a firm is 0 1 L ( θ ) λ + 1 d θ ; this is because the more labor there is, the more robotic equipment you need to invest in.

2.3. Equilibrium

The profit of an enterprise is derived from operating income minus the cost of labor, the cost of purchasing robots, and the cost of fixed investments. We set the profit function of the firm as follows:
π ( ω ) = 0 1 p ϕ m R m + ϕ p h ( θ ) L ( θ ) β β 1 α K 1 α d θ 0 1 w ( θ ) h ( θ ) L ( θ ) d θ 0 1 L ( θ ) λ + 1 d θ F
At an equilibrium wage level in the labor market, the firm will choose the optimal number of workers and hours of work to maximize profitability, so the first-order condition of Equation (10) is satisfied.
w ( θ ) h ( θ ) L ( θ ) = ϕ p 1 1 σ y 1 1 σ P σ 1 σ E 1 σ
w ( θ ) h ( θ ) L ( θ ) + L ( θ ) λ + 1 = β β 1 ϕ p 1 1 σ y 1 1 σ P σ 1 σ E 1 σ
Combined with Equations (11) and (12), we obtain the following:
L ( θ ) λ = 1 β 1 h ( θ ) w ( θ )
From Equation (5), we can further conclude
L ( θ ) = 1 β 1 1 λ 1 P 1 λ γ w ( θ ) γ + 1 λ γ
Combining corollary 1 and Equations (8) and (14), we can observe that the direction of change of d h d θ and d y d θ is the same, indicating that only when the profit increases will the enterprise expand the scale of production and increase the input of labor; similarly, when the enterprise’s profit decreases, the enterprise will reduce the scale of production and reduce the input of labor. Therefore, the output maximization behavior of enterprises under the use of industrial robots determines the impact of the use of industrial robots on the working hours and income of workers, which in turn has an effect on the health of workers.
Using Equation (3) to obtain a partial derivative for θ yields the following equation:
d y d θ = d p ( θ ) σ P 1 σ E d θ = σ p ( θ ) σ 1 ( V m V p ) P σ 1 E
Assuming that the marginal cost of the skill threshold is V m , there is always a part of the high-skill group that is more productive than the robot, meaning V > V m ; similarly, there is a part of the low-skill group that is less productive than the robot, meaning V < V m .
When workers are in the high-skilled group, then d h d θ > 0 and d w d θ > 0 . Because the high-skilled group is more likely to be engaged in creative and unconventional work, the increase in output resulting from the use of industrial robots needs to be complemented by the high-skilled group, e.g., in the computer, information, and communication sector [
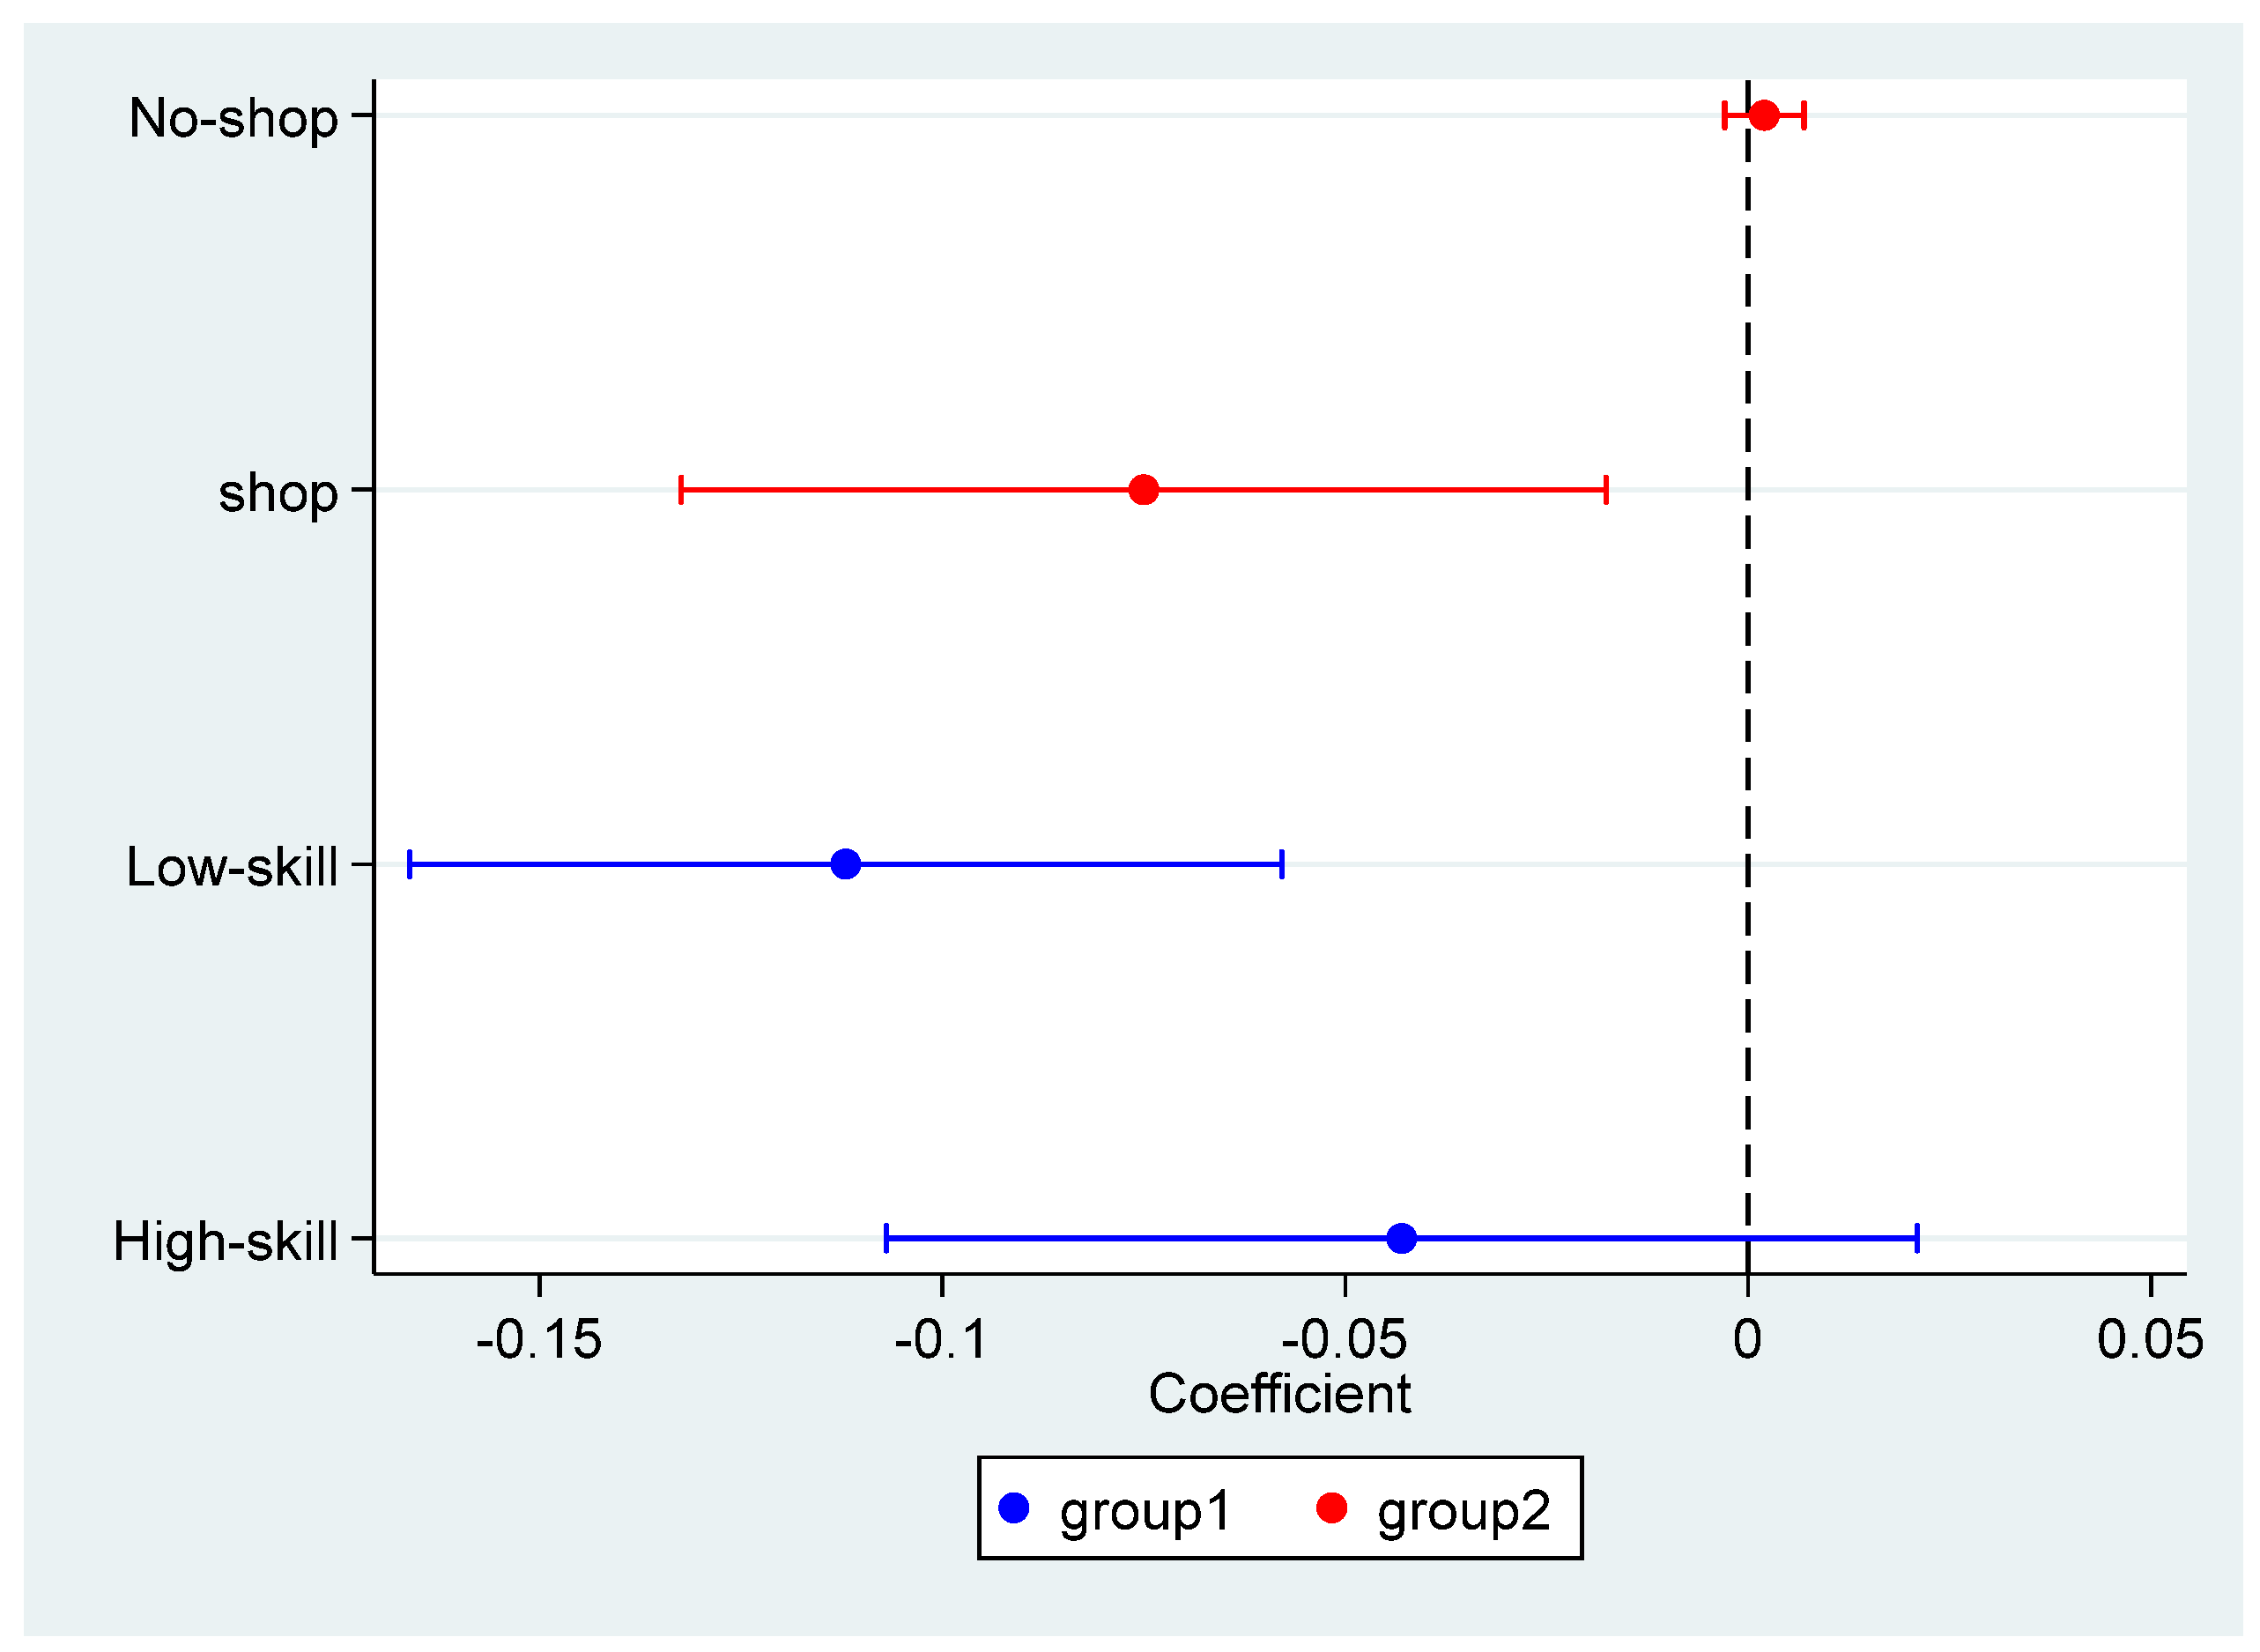
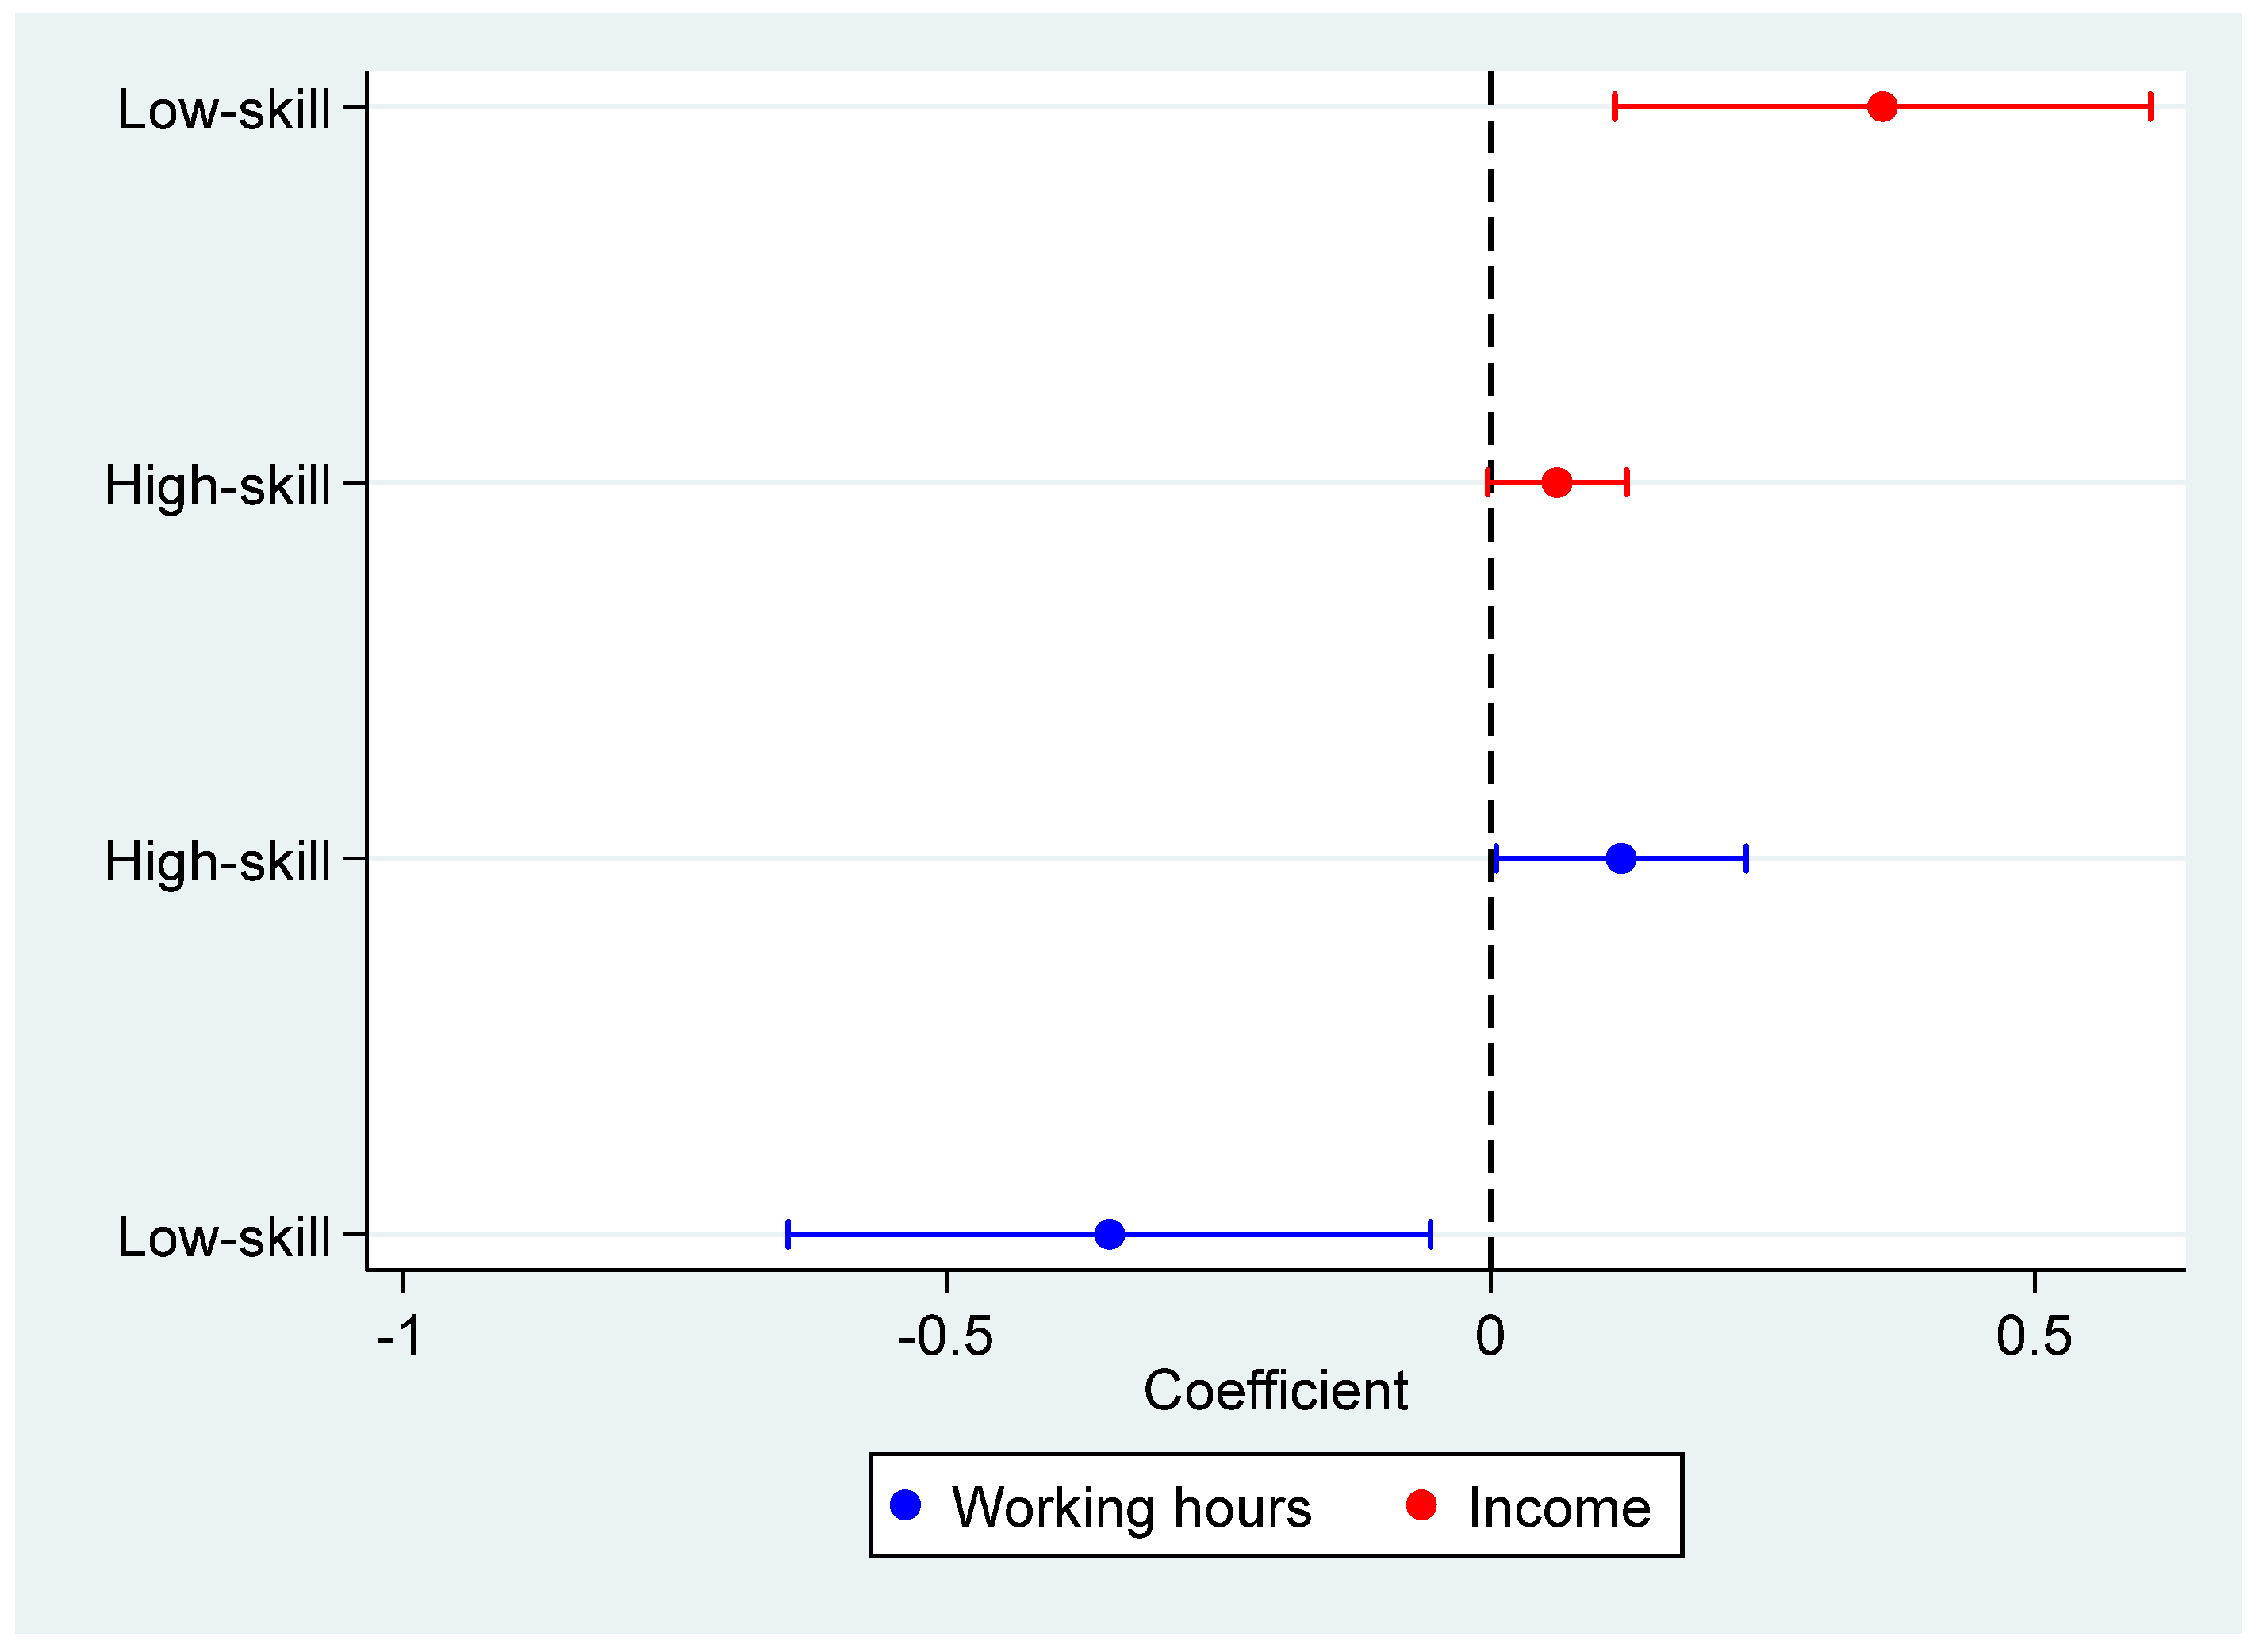
49]. When industrial robots enter sectors where high-skilled groups are located, on the one hand, the skill complementarity effect allows firms to create more jobs and task segments, which can increase the number of hours worked by employees, negatively affecting the level of health; on the other hand, for highly skilled workers, an increase in the number of hours worked leads to an increase in job earnings. When the labor force is a low-skilled group, d h d θ < 0 and d w d θ < 0 . This is because the low-skilled group is more likely to engage in simple labor outsourcing jobs, and the processes performed are in a substitution relationship with industrial robots, such as the blue-collar sector concentrated on the shop floor [44]. When industrial robots enter the sectors where low-skilled groups are located, the substitution relationship between the two leads to additional production costs faced by firms. When rational firms reduce the input of low-skilled labor, the reduction in working hours positively affects the health level of low-skilled groups, and the level of workers’ income decreases as well.
Proposition 1: 
Industrial robots affect laborer health by affecting work intensity and income levels.

3. Data and Method

3.1. Data

The robotics data selected for our study come from the International Federation of Robotics (IFR) and cover robot installations and stocks in 75 countries or regions since 1993. In our study, we use robot installations at the manufacturing level and statistics on robot use at 13 country–industry levels, including food processing, textiles, electronics and information, the automotive industry, the chemical industry, etc., which are further aggregated to the industrial robot use at the city level by using the weights of population employment at the city and industry levels. The data on workers’ health come from the China General Social Survey (CGSS), a program initiated by the Academy of Social Sciences in collaboration with 29 universities, encompassing 28 provinces in China, which began in 2003 and has conducted 11 rounds of sample surveys up to the end of 2018, covering a wide range of comprehensive information about an individual’s health, education, age, income, and other aspects. In terms of sample selection, our research only chooses the sample survey data for the five years of 2010, 2011, 2012, 2013, and 2015. On the one hand, the micro-survey data, taking into account the protection of individual privacy, only published the respondents’ provinces in most years, and the 2010–2015 data covered prefecture-level city information, which helps to refine the research dimensions of our study. On the other hand, considering China’s late start in industrial intelligence level, we counted the number of robots installed in major countries such as Australia, South Korea, China, the U.S., Japan, and Canada according to the IFR database, which contains the number of robots installed and stocked in each country, and Figure 2 shows that the annual installation of industrial robots in China only began to grow at a high rate in 2010.

3.2. Definition and Measurement of Variables

The dependent variable represents the level of health of individual laborers, expressed as self-rated health on a scale of 1–5; higher scores mean better health with data from the CGSS database for 2010–2015. The independent variable represents the robot penetration rate at the city level, with data from the IFR database, obtained by measuring through Equation (16).
R o b o t s   c t = i I L i , 2 , 2005 L c , 2005 R o b o t s   i , t E m p i , 2005
To avoid potential ex ante trends, we set the base year to 2005. L i , c , 2005 L c , 2005 denotes employment in industry i as a share of total employment in city c; Empi,2005 denotes the total number of persons employed in industry i at the national level. Control variables include age, education, registered residence, gender, and insurance at the individual level and the number of hospitals, environmental pollution, and industrial structure index at the city level. Individual-level control variables are from the CGSS database, and macro-level control variables are from each city’s yearbook. In addition to this, we also control for time and province fixed effects. Descriptive statistics for each variable are shown in Table 1; N represents the observed value, mean represents the average value, Std stands for the standard deviation, and Min and Max represent the minimum and maximum values, respectively. The average health score is 3.802, with a relatively narrow range (1 to 5), suggesting most respondents report moderate to good health. The mean value of robot penetration is 0.686, representing an average of 0.686 robots per 1000 labor-producing population per city, demonstrating the huge industrial production capacity of robots. The variance value of 0.952 for the robots suggests that there may be heterogeneity in the distribution of robots, which provides strong evidence that we are controlling for fixed effects in the benchmark regression. There are other control variables in the study, including age, gender, education, and domicile, with normative means and standard deviations at reasonable levels. In order to ensure the robustness of the results of the benchmark regression, we have performed the following treatments: (1) eliminating the missing cases of each indicator, (2) deleting the samples of retired staff over 60 years old for males and 55 years old for females, and (3) deleting those who lost their labor force and those who have not worked for three consecutive months or more.

3.3. Method

Considering that the dependent variable used in the data is derived from the self-assessed health ratings in the micro-survey database, which is not a continuous variable and does not satisfy the distributional requirements of the least squares estimation, we adopt a fixed-order model to construct a regression model using maximum likelihood estimation [50]. The model is shown in Equation (17):
P ( y = i |   x ) = 1 Φ α 0 α 1 R o b o t s c t α 2 X j t α 3 X c t δ c μ t ξ j c t
Φ represents the set of all explanatory variables. P represents the probability that an individual is in a different health class. The subscript j denotes individual, while c denotes city, and t denotes time. i denotes the health level rating of the individual labor force, R o b o t s c t denotes the core explanatory variable of our study, i.e., robot penetration at the city level, X j t and X c t denote the control variables at the individual and city levels, respectively, δ c and μ t denote the area fixed effect and time fixed effect, respectively, and ξ j c t denotes the residual term and clusters the standard errors to the level of the individual worker.

4. Results

4.1. Benchmark

The regression results are presented in Table 2. Column 1 presents the results without adding any control variables, where robots significantly promote labor force health, but this may be affected by time and region factors. Therefore, Column 2 controls for time and region fixed effects, and the results remain robust. Labor force health is still affected by individual factors such as age and education, and we further control for the relevant variables in Column 3 and find that industrial robots still significantly promote labor force health. In addition, we further include macro-level control variables such as regional industrial structure and medical level in Column 4 and find that industrial robots still promote laborers’ health. For every unit increase in the penetration of industrial robots in a city, the probability of worker health in that area increases by 4%. Overall, this may be due to the fact that China’s economy has grown to a certain level where work intensity is more sensitive to health than income level. Column 5 uses an OLS regression that still shows that the use of industrial robots contributes to the health of workers.

4.2. Robust Check

While we reduce the labor force population weights to control for potential ex ante trends, there are three areas of endogeneity that need to be explored further.

4.2.1. Consideration of Industry-Specific Disruptions

The health level of laborers is closely related to the industry in which they work, and at the same time, the use of industrial robots in China is also affected by industry characteristics, e.g., the demand for industrial robots in the automotive industry is significantly higher than that in other manufacturing industries, suggesting that industrial robots are characterized by a very distinct industry self-selection. This leads to the possibility that the results of the benchmark regression in our study may be disturbed by certain industry characteristics, i.e., there may be unobservable industry intrinsic factors that simultaneously affect the usage and health level of robots. Therefore, we remove the robot usage of each industry in turn and regress it according to Equation (1), and the results are shown in Figure 3 (dots represent the regression coefficients, and the solid lines represent the 90% confidence intervals); most of the regression coefficients are still significantly positive, which indicates that the results of the benchmark regression are still robust after removing the interference from the industry.

4.2.2. Consideration of Area-Specific Disturbances

Health economics suggests that regional environment and medical care are all important variables that affect workers’ health, and we also control for this in the baseline regressions with relevant proxy variables. However, the greater challenge of causal identification in our study comes from the interference of the development level of regional manufacturing industry on the regression results. Differences in the level of manufacturing development may be an important factor affecting the labor intensity of workers, and at the same time, the more developed the manufacturing industry, the stronger the demand for the use of industrial robots. Therefore, the development level of manufacturing in each region may be an important potential omitted variable. Although we control for industrial structure in the benchmark regression, the following attempts are made to further strip out the effect of the development level of manufacturing. As shown in Table 3, Columns 1–3 control for the amount of actual utilized foreign capital, total import and export trade, and the average distance of the location from the three major ports of Shanghai, Tianjin, and Guangzhou, respectively, and Column 4 indicates the deletion of the three most developed regions in China’s manufacturing industry, Guangdong, Zhejiang, and Jiangsu. Columns 1–4 of Table 3 all show that the core explanatory variables are still significantly positive, and the differences in coefficient changes are not large, indicating that after controlling for the potential impact of manufacturing, the use of industrial robots still has a certain promotional effect on labor health.

4.2.3. IV Estimates

Although the baseline regression results control for individual-level control variables, macro-level control variables, and region- and time-level fixed effects, they may still be confounded by numerous unobservable factors. More importantly, there is a reciprocal causal relationship between workers’ own health levels and robot use, so we construct Bartik instrumental variables for causal identification using two-stage least squares. The Bartik IV variable has become a significant tool for addressing endogeneity issues and has seen widespread application in recent years across labor economics, trade, development economics, and environmental studies. Its core concept involves using the initial share composition of individuals alongside the aggregate growth rate to simulate estimates across calendar years. These estimates are closely aligned with actual values but remain uncorrelated with the other residual terms [51]. In our study, the average of eight countries with a high level of robot development, including Singapore, Germany, the United States, Sweden, Denmark, Belgium, Italy, and the Netherlands, is selected as the instrumental variable for robot use in China. On the one hand, these eight countries have relatively high levels of industrial robot development; on the other hand, Asian countries with high levels of industrial robot development, such as Japan and South Korea, are deleted to exclude potential trade channels. This is carried out as shown in Equation (18), and the proportion of laborers still follows the micro-database of the 2005 National 1% Population Survey and the China Industrial Statistical Yearbook.
I V = 1 8 c W i I i I L i , c , 2005 L c , 2005 R o b o t s i , t E m p i , 2005
The instrumental variables need to fulfill two conditions. (1) Correlation: The number of industrial robots used in China is significantly affected by the average number of industrial robots used in other countries, i.e., cov ( R o b o t s , I V ) 0 Therefore, we have to select countries with a high level of industrial intelligence development as much as possible, and as shown in Figure 4, the number of industrial robots used in China has a significant positive correlation trend with each country. (2) Exogeneity: The instrumental variables can only affect the explained variables through the path of affecting the core explanatory variables, i.e., cov I V , ξ j c t = 0 . Theoretically, the use of foreign robots will only affect the use of the number of robots in China and thus have an impact on the health of laborers. Regarding the test of exogeneity of instrumental variables, there is no consistent method at home and abroad. In our study, only the core explanatory variables and instrumental variables are put into the regression; as shown in Column 1 of Table 4, the instrumental variables are not significant, while the core explanatory variables are significant, indicating that the instrumental variables can only affect the explanatory variables through the channel of the core explanatory variables, which verifies the exogeneity of the instrumental variables to some extent. In addition, we constructed a pre-2006 counterfactual control group by referring to the existing literature [52]. Considering the negligible level of industrial robot development in China before 2006, regressing the instrumental variables on health, as shown in Column 2 of Table 4, the regression results are not significant, which verifies that the instrumental variables in our study cannot affect the explanatory variables through other channels. The regression results of this instrumental variable are shown in Columns 3–4 of Table 4, and the results are all significantly positive, whether using parsimonious estimation or 2SLS regression.

5. Mechanism

5.1. Macro-Level Mechanism

The theoretical analysis in our study hypothesizes that the reduced work intensity of workers caused by industrial robots is an important channel that affects their health. If this conclusion is valid, laborers in areas with higher use of industrial robots face lower risk exposure. To verify this conjecture, we collate the number of safety accidents and fatalities at the prefecture-level city level from the State Administration of Work Safety (SAWS) as the dependent variables and control for both regional industrial structure (Index) and per capita economic development level (GDP). The regression results, as shown in Columns 1 and 2 of Table 5, suggest that industrial robots significantly suppress the number of major safety accidents and the number of fatalities they generate.

5.2. Firm-Level Mechanism

The theoretical analysis in our study suggests that industrial robots can generate both creation and substitution effects affecting workers’ health. Therefore, we utilize 2010–2015 listed-company-level data to verify whether this mechanism exists, by dividing the personnel composition of listed companies into low-skilled (specialties and below), high-skilled (bachelor’s degree and above), shop floor departments (production workers), and non-shop-floor departments (finance and sales) in regressions of industrial robots, respectively. The results, as shown in Figure 5, show that industrial robots have a significant dampening effect on the employment of labor in the low-skill and shop-floor sectors, while they do not have a significant effect on labor in the high-skill and non-shop-floor sectors, which to some extent explains the fact that there are substitution and creation effects of industrial robot use on the labor force. Due to the substitution effect on low-skilled labor groups, it will reduce the labor intensity and thus increase the health status of such groups. Conversely, there is a crowding-in effect of work in the high-skilled group, which may worsen their health status.

5.3. Individual-Level Mechanism

It has been shown that individual laborers’ income and working hours are important channels affecting health [53]. An important part of the mechanism of our study is to regress industrial robots on labor hours and wage income, with the results, as shown in Columns 1–2 of Table 6, demonstrating that industrial robot use reduces working hours and enhances laborer health. In addition to this, we also conduct other channel tests, as shown in Column 3 of Table 6, and the greater labor health promotion effect on the production sector again demonstrates that industrial robots affect labor intensity. This is due to the production sector, which primarily involves high-intensity physical labor. Column 4 indicates a non-significant effect on the low-income group, suggesting that robots also negatively affect health by lowering income. Finally, we also consider other potential influences that may arise from the use of industrial robots affecting the health of laborers, and we construct the following counterfactual group for mechanism testing. As shown in Columns 5–6 of Table 6, we use retired workers and non-participating workers to regress with industrial robots, respectively, and the results are not significant, which to some extent can prove that apart from working hours and income, industrial robots do not have other channels of action to affect the health level of workers.

5.4. Double Crowding-Out Effect

The theoretical analysis in the previous section suggests that industrial robots will affect health utility through the productivity effect and skill complementarity effect by simultaneously increasing the working hours and income level of high-skilled groups to form a double crowding-in effect, and through the substitution effect by simultaneously reducing the working hours and income level of low-skilled groups to form a double crowding-out effect. In order to verify the reasonableness of this channel, we divide workers into two groups of high and low skills and regress them on labor hours and labor income, respectively. The results, as shown by the blue line in Figure 6, show that industrial robots significantly reduce laborers’ hours of work, which is consistent with the baseline regression that promotes better overall health but increases the hours of work for the high-skill group. Similarly, looking at the red line in Figure 6, we still find that the use of industrial robots significantly increases the income level of the high-skill group compared to the low-skill group, validating the double crowding-in and crowding-out effect proposed in our theoretical analysis of the study.

6. Heterogeneous

In line with the theoretical assumptions of our study, the effects of industrial robot use on worker health may differ in utility between skill-heterogeneous groups. Educational level is the most representative variable reflecting the difference in skills; we divided workers into high and low groups according to educational level to conduct regression separately. The results, as shown by the blue line in Figure 7, show that the enhancement effect of industrial robots on the health of the low-skilled group is higher than that of the high-skilled group, which suggests that the positive effect of robots on health is concentrated in the low-skilled group, mainly due to the release of the labor intensity of low-skilled workers. We further group workers by gender; as shown by the red line in Figure 7, the health-enhancing effect of industrial robots on women is higher than that of men, which may be due to the fact that men have better technological thinking, which complements industrial robots and exacerbates the negative effect of working hours on health. In addition, we also grouped households by urban and rural domiciles, and as shown by the black line in Figure 7, industrial robots have a greater effect on the health of rural domiciles, which is due to the fact that the agricultural population is more likely to be engaged in heavy physical labor, and the substitution effect of industrial robots allows them to reduce the intensity of their work.

7. Further Analysis

7.1. Effect of Protection of Labor Rights and Interests

The main findings of the empirical study show that, on the whole, the use of industrial robots will release the health dividend of workers, especially the “health dividend” of the relatively disadvantaged groups, but there is a crowding-in effect on the working hours of high-skilled groups, which is not conducive to the improvement of the overall health level. Accordingly, we hypothesize that if the government intervenes at the macro-level to strengthen the protection of workers’ rights and interests, it will effectively inhibit the behavior of enterprises in extending working hours and also curb the substitution effect of industrial robots, which will jointly promote the enhancement of the overall health welfare of workers. In order to verify this conjecture, we use the number of current labor disputes closed/number of labor disputes received at the provincial level to reflect the level of protection for workers (Protects) and further add the interaction term of workers’ rights and interests protection to Equation (16) for regression. As shown in Column 1 of Table 7, the interaction term is significantly positive, which indicates that increasing the protection of workers’ rights and interests can have a positive effect on workers’ health. In addition, we speculate that compared to foreign-funded enterprises, state-owned enterprises and institutions have more complete employment systems and may also have stronger protection of labor hours, which is included as a moderator in the regression, and the results, as shown in Column 2 of Table 7, have a significant positive interaction term, which also indicates that strengthening the protection of workers’ rights and interests can amplify the positive effect of robots on health.

7.2. Reducing Income Disparity

The benchmark regressions in our study show that the marginal effect of income on health is smaller than the marginal effect of working hours on health, but the income effect is still important, especially in the context of the “machine shift”, and workers are still at risk of returning to poverty. A worrying phenomenon is that industrial robots not only benefit the higher-skilled groups in terms of higher incomes, but also the owners of capital due to the higher returns to production brought about by automation, ultimately leading to stagnant wage growth for the lower-skilled groups. If the wealth gap within a region itself is too wide, it means that its wealth distribution mechanism is less skewed in favor of low-skilled groups, and low-skilled labor has relatively lower income and security. The distortions in the wealth distribution mechanism will be deepened after the replacement of machines, which will put workers at “health risk” through reduced incomes, relative to regions with smaller gaps in wealth. Therefore, we calculate the Gini coefficient to measure the income disparity within the region [54], with data obtained from DMSP and VIIRS night light. The specific interaction term regression results are shown in Table 7; Columns 3 and 4 represent the Gini coefficient at prefecture-level cities and at the provincial level, respectively. The results all show that the interaction term is significantly negative, which indicates that the more unequal the income distribution of a region is, the more it will impede the health-improvement effect brought by the industrial robots, and the main reason for this phenomenon is that income disparity amplifies the income crowding-out effect produced by the industrial robots, and also at the same time, it further validates our study’s theoretical mechanism.

8. Discussion

In summary, the marginal contribution of our study is based on the following four aspects. Firstly, previous research has predominantly focused on the economic efficiency generated by robots and industrial upgrading. Each standard deviation increase in the number of industrial robots in use results in a 0.032 standard deviation increase in the number of patent applications [55,56]. Our study takes a more microscopic view of how industrial robots affect the personal health utility of workers, and the results show that the use of robots significantly improves workers’ health. For every unit increase in the penetration of industrial robots in a city, the probability of worker health in that area increases by 4%. Secondly, we inherit the theoretical analytical framework of existing industrial robotics research [55,56,57,58]; for example, industrial robots increase total employment but have an employment shock of −0.004 for low-skilled groups [57]. Our study is similar to it in terms of mechanism and finds similar crowding-out and crowding-in effects of industrial robots on health. Thirdly, high work intensity can result in negative health shocks of −0.164 and −0.201 for American and Chinese workers, respectively [58,59], and the ability of robots to improve the work environment has been widely demonstrated [60,61,62]. Our study further reveals that robots can reduce work intensity, thereby enhancing workers’ health. Finally, while much of the existing literature has focused on the inequality effects of industrial robots, such as employment inequality, income inequality, and resource inequality, especially the polarization that has occurred in Europe and the United States [63,64,
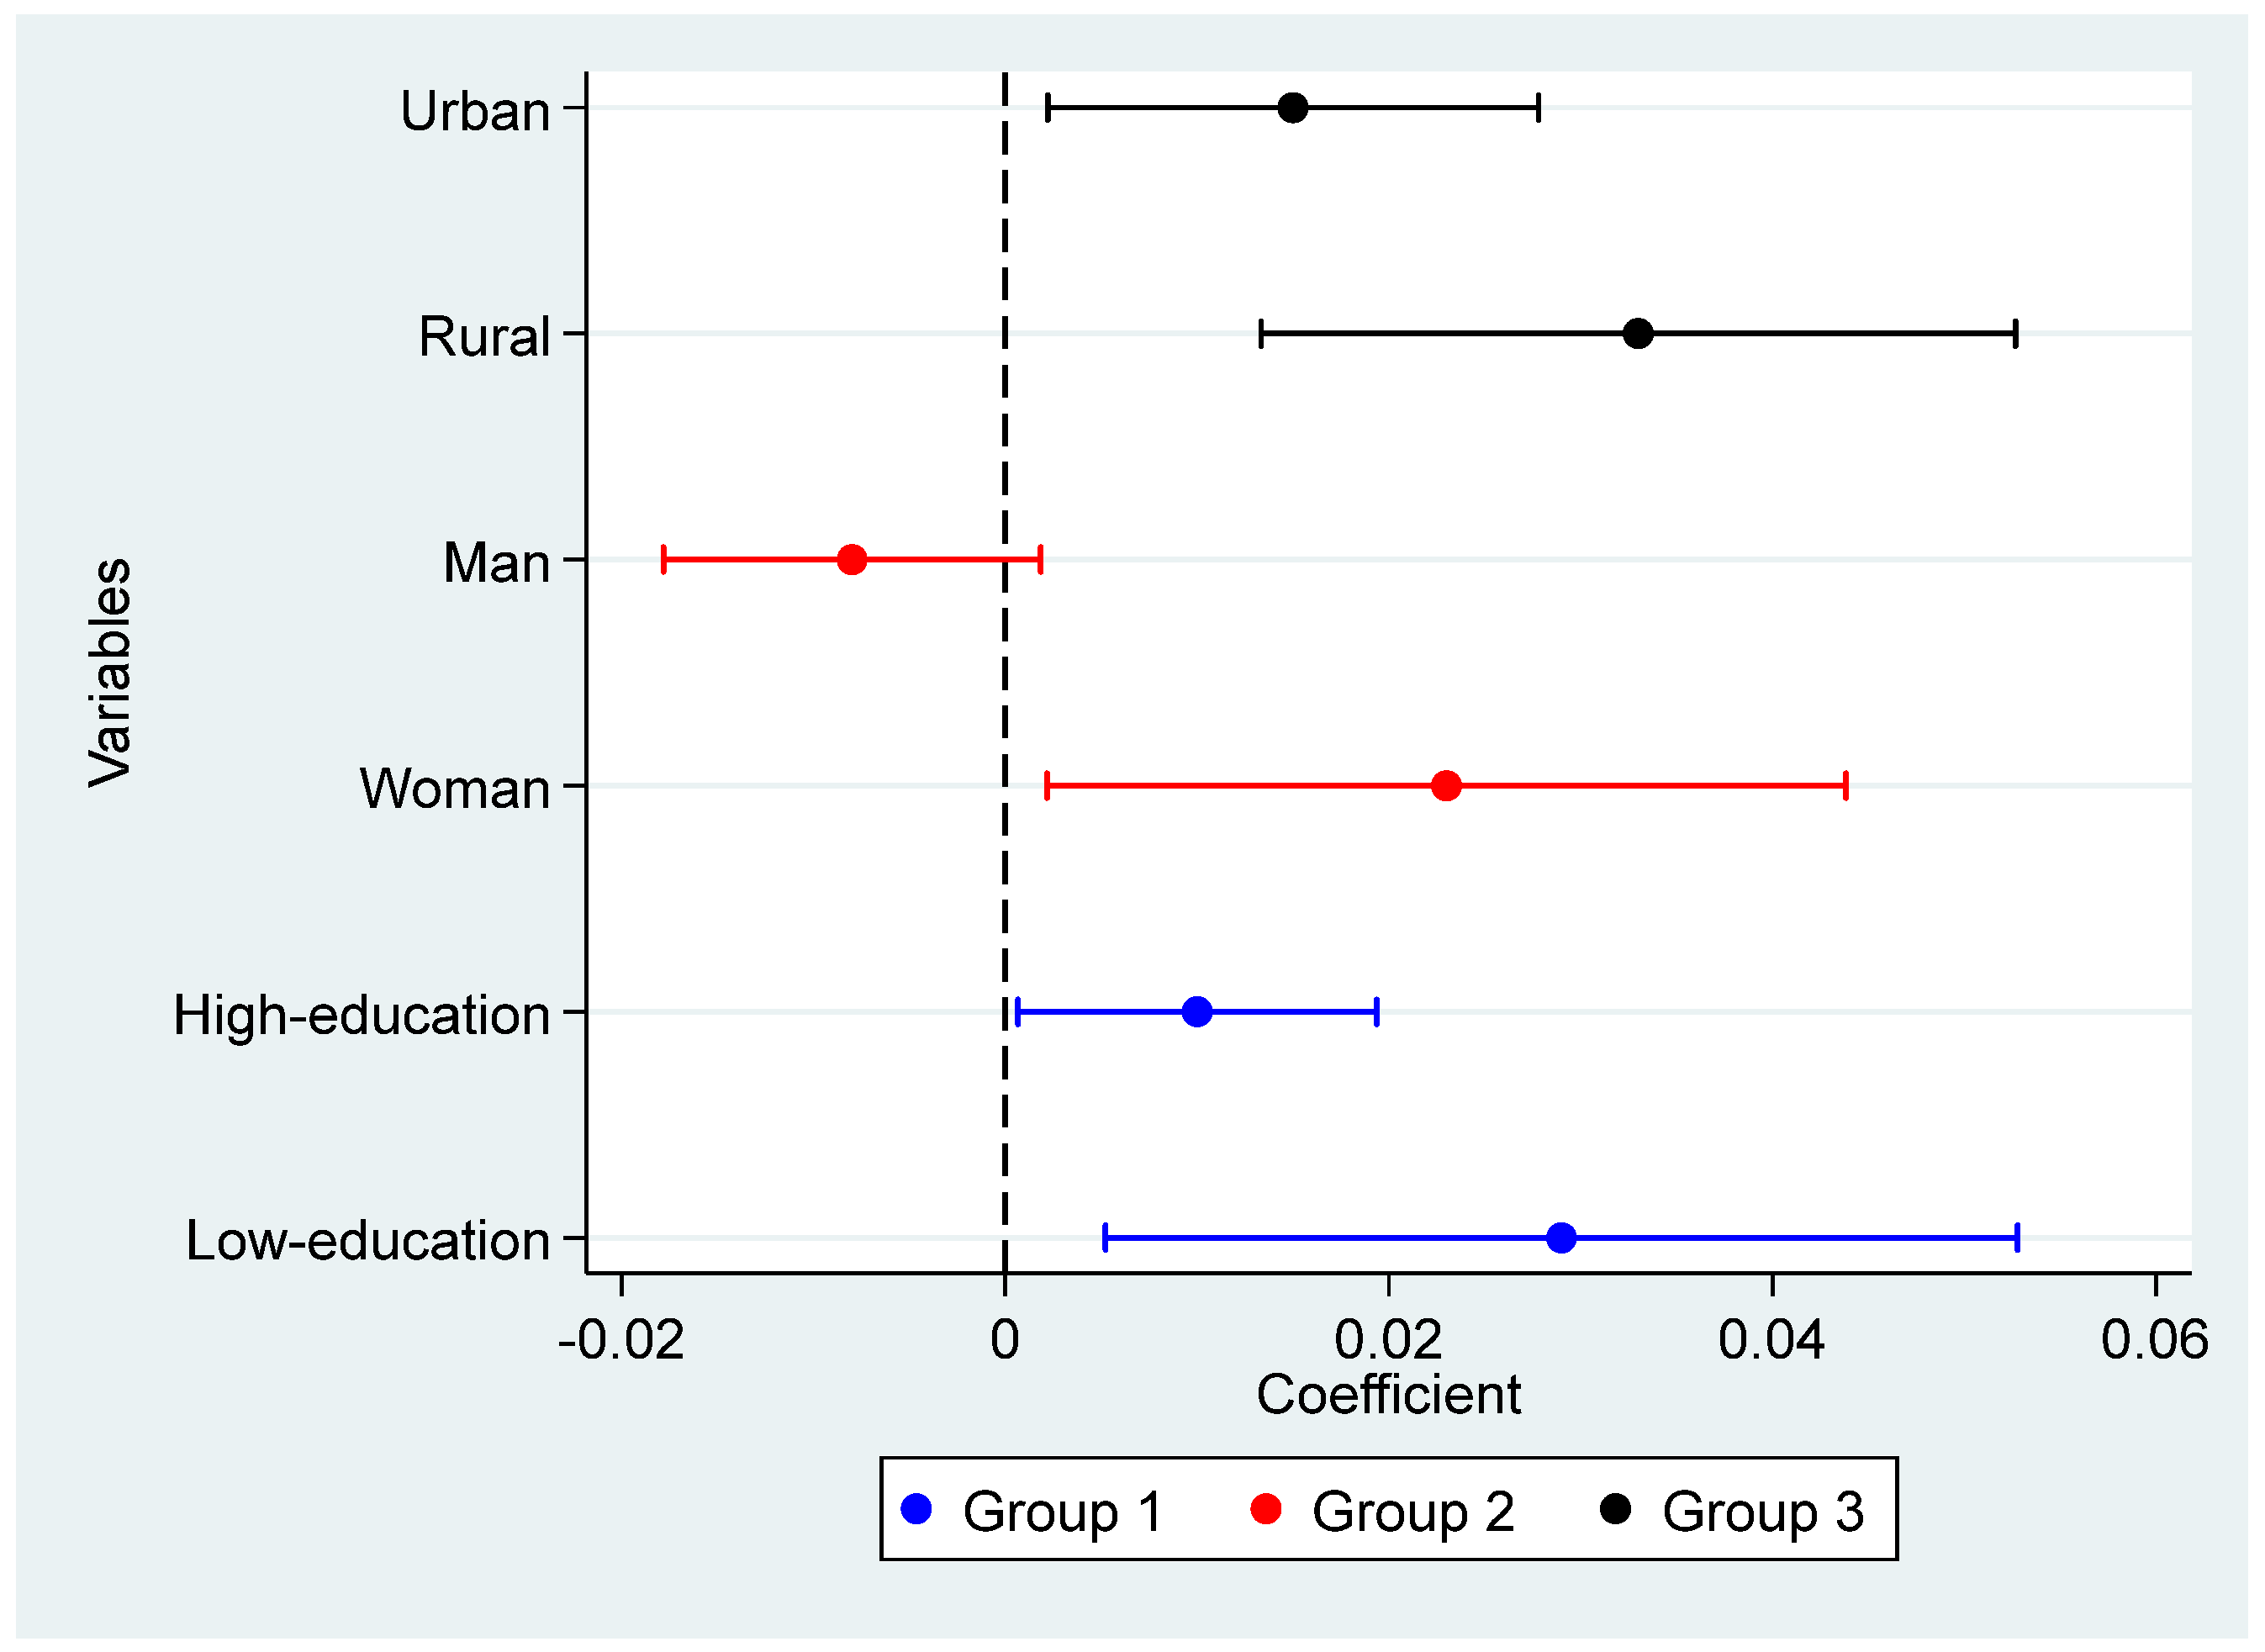
65], our findings suggest that industrial robots have more favorable health effects on low-skilled, female, and rural workers, helping to narrow the health gap among different groups of workers.
In addition to expanding the literature on industrial robots and workers’ personal utility, our research forms a theoretical expansion of labor economics, health economics, and industrial economics. It also provides policy recommendations for the sustainable development of China’s economy at a more micro-level, as follows. Firstly, the government should recognize the favorable aspects of “machines replacing humans”, maintain a positive outlook on the social issues caused by the use of industrial robots, and encourage enterprises to pursue “intelligent” transformations and industrial upgrades. This will enhance workers’ health through technological advances, promoting social stability and harmony. Secondly, while enterprises are upgrading intelligently and completing technological progress, the government should pay attention to the protection of workers’ rights and interests, expand labor dispute resolution channels, and urge enterprises to improve the vacation system and advocate flexible working hours to reduce the working hours of workers whose working hours have increased. Thirdly, the use of industrial robots may further exacerbate income inequality and reduce the effectiveness of workers’ health. Therefore, the government should further improve the income distribution system, narrow the income gap between occupations and industries, and realize the positive effects of industrial robots on workers’ health by strengthening the protection of low-income groups and providing vocational training.

9. Conclusions

Our study integrates the task model represented by industrial robots into the relevant theories of labor economics and health economics, extends the equilibrium analysis of workers’ individual utility by taking working hours and working income as the entry point, and matches the 2010–2015 CGSS database with the IFR database to verify the impacts and mechanisms of the use of industrial robots on workers’ health. The results show that, firstly, with each unit increase in the penetration of urban industrial robots, the probability of improved labor force health in the region rises by 4%. Secondly, mechanistic analysis reveals that the application of industrial robots significantly reduces the number of safety accidents at the macro-level and decreases laborers’ working hours at the micro-level, both of which positively impact labor force health. Thirdly, heterogeneity analysis indicates that, due to the substitution effect of industrial robots, low-skilled workers, female workers, and rural-household-registered workers benefit more in terms of health. Lastly, strengthening protections for workers’ rights at the macro-level and narrowing the income gap within regions can effectively mitigate health polarization among different skill groups, thereby maximizing the potential of industrial robots to enhance productivity while safeguarding workers’ rights.
The rapid growth of industrial robot applications in China provides a wealth of data to study their effects on health. Globally, this phenomenon is a reminder that countries cannot ignore the health of highly skilled workers when promoting industrial automation and intelligence. China’s rapid growth in industrial robotics adoption is part of a global wave of automation. Many countries, such as Germany, the United States, Japan, and South Korea, are also actively promoting industrial automation and intelligence. This global trend means that all countries are facing similar challenges of how to improve productivity while ensuring the physical and mental health of workers. China’s experience can provide lessons for other countries to help them better balance technological advancement with humanistic care. Technological progress should not come at the expense of workers’ well-being. Global policymakers can strengthen cooperation through international organizations (e.g., the International Labor Organization, the World Health Organization, etc.) to promote more humane workplace standards. For example, a global code of ethics for automation could be developed to ensure that technological advances evolve in tandem with worker well-being.

10. Limitations

Due to data limitations, our study was unable to understand exactly which industries’ laborers’ health conditions are affected by industrial robots, which needs to be further explored by future researchers. In addition to this, there are many sources of what constitutes health, including pneumoconiosis, industrial poisoning, external injuries, etc. Unfortunately, our study did not address these specific details. Finally, due to the lack of a unified global health database, our study has yet to be expanded to a more macro-level.

Author Contributions

W.Y.: Methodology and writing—original draft. C.Z.: Validation and funding acquisition. S.W.: Writing—reviewing and editing. J.F.: Visualization. All authors have read and agreed to the published version of the manuscript.

Funding

This research was funded by the National Social Science Foundation of China (No.22&ZD111).

Data Availability Statement

The data and code used in this study are available on request from the first author and corresponding author.

Conflicts of Interest

The authors declare no conflicts of interest.

References

  1. de Jesus Fernandes, A.R.; Queiroz, B.L. Aging, Education and Some Other Implications for the Silver Dividend in Developing Countries: Evidence from Brazil. J. Econ. Ageing 2024, 27, 100497. [Google Scholar] [CrossRef]
  2. Meng, X. The People’s Republic of China’s 40-Year Demographic Dividend and Labor Supply: The Quantity Myth. Asian Dev. Rev. 2023, 40, 111–144. [Google Scholar] [CrossRef]
  3. Zhou, J.; Deng, J.; Li, L.; Wang, S. The Demographic Dividend or the Education Dividend? Evidence from China’s Economic Growth. Sustainability 2023, 15, 7309. [Google Scholar] [CrossRef]
  4. Maestas, N.; Mullen, K.J.; Powell, D. The Effect of Population Aging on Economic Growth, the Labor Force, and Productivity. Am. Econ. J. Macroecon. 2023, 15, 306–332. [Google Scholar] [CrossRef]
  5. Cagney, K.A.; Browning, C.R.; Iveniuk, J.; English, N. The Onset of Depression During the Great Recession: Foreclosure and Older Adult Mental Health. Am. J. Public Health 2014, 104, 498–505. [Google Scholar] [CrossRef]
  6. Liu, G.G.; Dow, W.H.; Fu, A.Z.; Akin, J.; Lance, P. Income Productivity in China: On the Role of Health. J. Health Econ. 2008, 27, 27–44. [Google Scholar] [CrossRef]
  7. Ridhwan, M.M.; Nijkamp, P.; Ismail, A.; M. Irsyad, L. The Effect of Health on Economic Growth: A Meta-Regression Analysis. Empir. Econ. 2022, 63, 3211–3251. [Google Scholar] [CrossRef]
  8. Cai, L.; Kalb, G. Health Status and Labour Force Participation: Evidence from Australia. Health Econ. 2006, 15, 241–261. [Google Scholar] [CrossRef]
  9. Peters, S.E.; Dennerlein, J.T.; Wagner, G.R.; Sorensen, G. Work and Worker Health in the Post-Pandemic World: A Public Health Perspective. Lancet Public Health 2022, 7, e188–e194. [Google Scholar] [CrossRef]
  10. Liu, R.; Liu, H.-C.; Shi, H.; Gu, X. Occupational Health and Safety Risk Assessment: A Systematic Literature Review of Models, Methods, and Applications. Saf. Sci. 2023, 160, 106050. [Google Scholar] [CrossRef]
  11. Khoshakhlagh, A.H.; Chuang, K.-J.; Kumar, P. Health Risk Assessment of Exposure to Ambient Formaldehyde in Carpet Manufacturing Industries. Environ. Sci. Pollut. Res. 2022, 30, 16386–16397. [Google Scholar] [CrossRef] [PubMed]
  12. McDonald, S.; Roberts, J. AIDS and Economic Growth: A Human Capital Approach. J. Dev. Econ. 2006, 80, 228–250. [Google Scholar] [CrossRef]
  13. Robson, M.; O’Donnell, O.; Van Ourti, T. Aversion to Health Inequality—Pure, Income-Related and Income-Caused. J. Health Econ. 2024, 94, 102856. [Google Scholar] [CrossRef] [PubMed]
  14. Rodriguez Santana, I.; Mason, A.; Gutacker, N.; Kasteridis, P.; Santos, R.; Rice, N. Need, Demand, Supply in Health Care: Working Definitions, and Their Implications for Defining Access. Health Econ. Policy Law 2023, 18, 1–13. [Google Scholar] [CrossRef]
  15. Cutler, D.; Deaton, A.; Lleras-Muney, A. The Determinants of Mortality. J. Econ. Perspect. 2006, 20, 97–120. [Google Scholar] [CrossRef]
  16. Zivin, K.; Paczkowski, M.; Galea, S. Economic Downturns and Population Mental Health: Research Findings, Gaps, Challenges and Priorities. Psychol. Med. 2011, 41, 1343–1348. [Google Scholar] [CrossRef]
  17. Aísa, R.; Pueyo, F. Government Health Spending and Growth in a Model of Endogenous Longevity. Econ. Lett. 2006, 90, 249–253. [Google Scholar] [CrossRef]
  18. Tanaka, M. Exporting Sweatshops? Evidence from Myanmar. Rev. Econ. Stat. 2020, 102, 442–456. [Google Scholar] [CrossRef]
  19. Fitzgerald, E.F.; Schell, L.M.; Marshall, E.G.; Carpenter, D.O.; Suk, W.A.; Zejda, J.E. Environmental Pollution and Child Health in Central and Eastern Europe. Environ. Health Perspect. 1998, 106, 307–311. [Google Scholar] [CrossRef]
  20. Harrison, A.; Scorse, J. Multinationals and Anti-Sweatshop Activism. Am. Econ. Rev. 2010, 100, 247–273. [Google Scholar] [CrossRef]
  21. Sung, Y.-W. Made in China: From World Sweatshop to a Global Manufacturing Center? Asian Econ. Pap. 2007, 6, 43–72. [Google Scholar] [CrossRef]
  22. Nagel, K.; Herzer, D.; Nunnenkamp, P. How Does FDI Affect Health? Int. Econ. J. 2015, 29, 655–679. [Google Scholar] [CrossRef]
  23. Aghion, P.; Jones, B.F.; Jones, C.I. Artificial Intelligence and Economic Growth; National Bureau of Economic Research: Cambridge, MA, USA, 2017. [Google Scholar]
  24. Palčič, I.; Prester, J. Effect of Usage of Industrial Robots on Quality, Labor Productivity, Exports and Environment. Sustainability 2024, 16, 8098. [Google Scholar] [CrossRef]
  25. DeStefano, T.; Timmis, J. Robots and Export Quality. J. Dev. Econ. 2024, 168, 103248. [Google Scholar] [CrossRef]
  26. Borboni, A.; Reddy, K.V.V.; Elamvazuthi, I.; AL-Quraishi, M.S.; Natarajan, E.; Azhar Ali, S.S. The Expanding Role of Artificial Intelligence in Collaborative Robots for Industrial Applications: A Systematic Review of Recent Works. Machines 2023, 11, 111. [Google Scholar] [CrossRef]
  27. Cheng, H.; Jia, R.; Li, D.; Li, H. The Rise of Robots in China. J. Econ. Perspect. 2019, 33, 71–88. [Google Scholar] [CrossRef]
  28. Ghobakhloo, M. Industry 4.0, Digitization, and Opportunities for Sustainability. J. Clean. Prod. 2020, 252, 119869. [Google Scholar] [CrossRef]
  29. Malik, P.K.; Sharma, R.; Singh, R.; Gehlot, A.; Satapathy, S.C.; Alnumay, W.S.; Pelusi, D.; Ghosh, U.; Nayak, J. Industrial Internet of Things and Its Applications in Industry 4.0: State of The Art. Comput. Commun. 2021, 166, 125–139. [Google Scholar] [CrossRef]
  30. Graetz, G.; Michaels, G. Robots at Work. Rev. Econ. Stat. 2018, 100, 753–768. [Google Scholar] [CrossRef]
  31. Acemoglu, D.; Restrepo, P. The Race between Man and Machine: Implications of Technology for Growth, Factor Shares, and Employment. Am. Econ. Rev. 2018, 108, 1488–1542. [Google Scholar] [CrossRef]
  32. Faber, M. Robots and Reshoring: Evidence from Mexican Labor Markets. J. Int. Econ. 2020, 127, 103384. [Google Scholar] [CrossRef]
  33. Koch, M.; Manuylov, I.; Smolka, M. Robots and Firms. Econ. J. 2021, 131, 2553–2584. [Google Scholar] [CrossRef]
  34. Anelli, M.; Giuntella, O.; Stella, L. Robots, Marriageable Men, Family, and Fertility. J. Hum. Resour. 2021, 59, 443–469. [Google Scholar] [CrossRef]
  35. Bian, X.; Zhou, G. The Effects of Robots on Internal Migration: Evidence from China. J. Reg. Sci. 2024, 64, 840–865. [Google Scholar] [CrossRef]
  36. Acemoglu, D.; Restrepo, P. Robots and Jobs: Evidence from US Labor Markets. J. Polit. Econ. 2020, 128, 2188–2244. [Google Scholar] [CrossRef]
  37. Lankisch, C.; Prettner, K.; Prskawetz, A. How Can Robots Affect Wage Inequality? Econ. Model. 2019, 81, 161–169. [Google Scholar] [CrossRef]
  38. Black, S.E.; Spitz-Oener, A. Explaining Women’s Success: Technological Change and the Skill Content of Women’s Work. Rev. Econ. Stat. 2010, 92, 187–194. [Google Scholar] [CrossRef]
  39. Karabarbounis, L.; Neiman, B. The Global Decline of the Labor Share. Q. J. Econ. 2014, 129, 61–103. [Google Scholar] [CrossRef]
  40. Borland, J.; Coelli, M. Are Robots Taking Our Jobs? Aust. Econ. Rev. 2017, 50, 377–397. [Google Scholar] [CrossRef]
  41. Caselli, F.; Manning, A. Robot Arithmetic: New Technology and Wages. Am. Econ. Rev. Insights 2019, 1, 1–12. [Google Scholar] [CrossRef]
  42. Gualtieri, L.; Rauch, E.; Vidoni, R. Emerging Research Fields in Safety and Ergonomics in Industrial Collaborative Robotics: A Systematic Literature Review. Robot. Comput.-Integr. Manuf. 2021, 67, 101998. [Google Scholar] [CrossRef]
  43. Murashov, V.; Hearl, F.; Howard, J. Working Safely with Robot Workers: Recommendations for the New Workplace. J. Occup. Environ. Hyg. 2016, 13, D61–D71. [Google Scholar] [CrossRef] [PubMed]
  44. Acemoglu, D.; Restrepo, P. Tasks, Automation, and the Rise in U.S. Wage Inequality. Econometrica 2022, 90, 1973–2016. [Google Scholar] [CrossRef]
  45. Melitz, M.J. The Impact of Trade on Intra-Industry Reallocations and Aggregate Industry Productivity. Econometrica 2003, 71, 1695–1725. [Google Scholar] [CrossRef]
  46. Bonadio, B.; Huo, Z.; Levchenko, A.A.; Pandalai-Nayar, N. Global Supply Chains in the Pandemic. J. Int. Econ. 2021, 133, 103534. [Google Scholar] [CrossRef]
  47. Eaton, J.; Kortum, S. Technology, Geography, and Trade. Econometrica 2002, 70, 1741–1779. [Google Scholar] [CrossRef]
  48. Caliendo, L.; Parro, F. Estimates of the Trade and Welfare Effects of NAFTA. Rev. Econ. Stud. 2015, 82, 1–44. [Google Scholar] [CrossRef]
  49. Michaels, G.; Natraj, A.; Van Reenen, J. Has ICT Polarized Skill Demand? Evidence from Eleven Countries over Twenty-Five Years. Rev. Econ. Stat. 2014, 96, 60–77. [Google Scholar] [CrossRef]
  50. Li, H.; Zhou, L.-A. Political Turnover and Economic Performance: The Incentive Role of Personnel Control in China. J. Public Econ. 2005, 89, 1743–1762. [Google Scholar] [CrossRef]
  51. Goldsmith-Pinkham, P.; Sorkin, I.; Swift, H. Bartik Instruments: What, When, Why, and How. Am. Econ. Rev. 2020, 110, 2586–2624. [Google Scholar] [CrossRef]
  52. Nunn, N.; Wantchekon, L. The Slave Trade and the Origins of Mistrust in Africa. Am. Econ. Rev. 2011, 101, 3221–3252. [Google Scholar] [CrossRef]
  53. Hummels, D.; Munch, J.R.; Xiang, C. No Pain, No Gain: Work Demand, Work Effort, and Worker Health. Rev. Econ. Stat. 2023, 1–45. [Google Scholar] [CrossRef]
  54. Dagum, C. A New Approach to the Decomposition of the Gini Income Inequality Ratio. Empir. Econ. 1997, 22, 515–531. [Google Scholar] [CrossRef]
  55. Wang, L.; Zhou, Y.; Chiao, B. Robots and Firm Innovation: Evidence from Chinese Manufacturing. J. Bus. Res. 2023, 162, 113878. [Google Scholar] [CrossRef]
  56. Zhong, H.; Zhang, X.; Chan, K.C.; Yan, C. Industrial Robots and Firm Innovation: Big Data Evidence from China. J. Account. Lit. 2023. ahead-of-print. [Google Scholar] [CrossRef]
  57. Klenert, D.; Fernández-Macías, E.; Antón, J.-I. Do Robots Really Destroy Jobs? Evidence from Europe. Econ. Ind. Democr. 2023, 44, 280–316. [Google Scholar] [CrossRef]
  58. Fan, H.; Lin, F.; Lin, S. The Hidden Cost of Trade Liberalization: Input Tariff Shocks and Worker Health in China. J. Int. Econ. 2020, 126, 103349. [Google Scholar] [CrossRef]
  59. McManus, T.C.; Schaur, G. The Effects of Import Competition on Worker Health. J. Int. Econ. 2016, 102, 160–172. [Google Scholar] [CrossRef]
  60. Gihleb, R.; Giuntella, O.; Stella, L.; Wang, T. Industrial Robots, Workers’ Safety, and Health. Labour Econ. 2022, 78, 102205. [Google Scholar] [CrossRef]
  61. Okpala, I.; Nnaji, C.; Gambatese, J. Assessment Tool for Human–Robot Interaction Safety Risks during Construction Operations. J. Constr. Eng. Manag. 2023, 149, 04022145. [Google Scholar] [CrossRef]
  62. Shah, I.A.; Mishra, S. Artificial Intelligence in Advancing Occupational Health and Safety: An Encapsulation of Developments. J. Occup. Health 2024, 66, uiad017. [Google Scholar] [CrossRef] [PubMed]
  63. Brall, F.; Schmid, R. Automation, Robots and Wage Inequality in Germany: A Decomposition Analysis. LABOUR 2023, 37, 33–95. [Google Scholar] [CrossRef]
  64. Damelang, A.; Otto, M. Who Is Replaced by Robots? Robotization and the Risk of Unemployment for Different Types of Workers. Work Occup. 2024, 51, 181–206. [Google Scholar] [CrossRef]
  65. Zhao, C.; Li, Y.; Liu, Z.; Ma, X. Artificial Intelligence and Carbon Emissions Inequality: Evidence from Industrial Robot Application. J. Clean. Prod. 2024, 438, 140817. [Google Scholar] [CrossRef]
Figure 1. Theoretical framework.
Sustainability 17 01497 g001
Figure 2. Trends in industrial robot installation by country.
Sustainability 17 01497 g002
Figure 3. Industry characteristics. Note: The 13 manufacturing industries in this figure include food manufacturing, textiles, wood, paper, equipment manufacturing, metal manufacturing, chemical manufacturing, rubber, non-metal manufacturing, base metals, the automotive industry, the electronics and electrical industry, and other manufacturing.
Sustainability 17 01497 g003
Figure 4. Correlation test. Note: The vertical axis represents the number of robots installed, and the horizontal axis represents the tool variable.
Sustainability 17 01497 g004
Figure 5. Firm-level mechanism tests. Note: The dots represent the magnitude of the coefficients, and the solid lines represent the confidence intervals.
Sustainability 17 01497 g005
Figure 6. Double crowding-out effect tests. Note: The dots represent the magnitude of the coefficients, and the solid lines represent the confidence intervals.
Sustainability 17 01497 g006
Figure 7. Heterogeneous analysis. Note: The dots represent the magnitude of the coefficients, and the solid lines represent the confidence intervals.
Sustainability 17 01497 g007
Table 1. Descriptive statistics.
VariableNMeanStdMinMax
Health27,1783.8021.03315
Robots27,1780.6860.9520.0036.968
Age27,17840.38910.3211760
Education27,1780.5600.49601
Register27,1780.2280.41901
Gender27,1780.3870.28201
Insurance27,1780.9210.27001
Ln hospital25,5545.5410.6603.7847.358
Environment27,1780.8550.16800.998
Index27,1786.5800.4585.5177.589
Table 2. Benchmark regression.
VariableHealth
(1)(2)(3)(4)(5)
Robots0.113 ***0.050 ***0.038 **0.041 **0.018 *
(10.79)(2.78)(2.08)(2.07)(1.84)
Age −0.053 ***−0.052 ***−0.019 ***
(−6.46)(−6.14)(−4.71)
Age2 0.0000.000−0.000
(0.67)(0.51)(−1.14)
Education 0.101 ***0.106 ***0.067 ***
(3.47)(3.55)(4.67)
Register 0.071 *0.0610.034
(1.76)(1.48)(1.64)
Gender 0.344 ***0.343 ***0.170 ***
(14.72)(14.20)(14.06)
Insurance 0.089 **0.093 **0.041 *
(2.04)(2.08)(1.85)
Ln hospital −0.048−0.017
(−1.53)(−1.05)
Environment −0.049−0.042
(−0.39)(−0.65)
Index −0.040−0.008
(−0.69)(−0.26)
N27,17827,17827,17825,55425,554
R20.00130.03980.06600.06690.18
Year FENOYESYESYESYES
Province FENOYESYESYESYES
Note: *, **, and *** represent 10%, 5%, and 1% significance levels, respectively, and t-statistics are in parentheses.
Table 3. Regional characteristics.
VariableAdd ControlsDelete Province
(1)(2)(3)(4)
Robots0.041 *0.036 *0.040 **0.046 *
(1.95)(1.82)(2.03)(1.69)
Age−0.054 ***−0.052 ***−0.052 ***−0.060 ***
(−6.05)(−6.14)(−6.15)(−6.65)
Age20.0000.0000.0000.000
(0.79)(0.51)(0.51)(1.26)
Education0.072 **0.105 ***0.106 ***0.133 ***
(2.31)(3.52)(3.57)(4.06)
Register0.083 *0.0620.0620.194 ***
(1.91)(1.49)(1.49)(3.92)
Gender0.325 ***0.343 ***0.343 ***0.354 ***
(12.78)(14.20)(14.20)(13.72)
Insurance0.100 **0.093 **0.093 **0.118 **
(2.15)(2.06)(2.07)(2.42)
Ln hospital−0.093 **−0.063 *−0.0480.004
(−2.55)(−1.91)(−1.52)(0.13)
Environment−0.073−0.068−0.050−0.400 **
(−0.55)(−0.53)(−0.39)(−2.47)
Index−0.101−0.090−0.041−0.027
(−1.33)(−1.33)(−0.71)(−0.44)
FDI0.053 ***
(3.00)
Trade 0.018
(1.43)
Distance 0.157
(0.62)
N22,98825,55425,55422,385
R20.06690.06690.06690.0697
Year FEYESYESYESYES
Province FEYESYESYESYES
Note: *, **, and *** represent 10%, 5%, and 1% significance levels, respectively, and t-statistics are in parentheses.
Table 4. Results of IV.
Variable2010–20152003–2005SimplicityIV
(1)(2)(3)(4)
Robots0.138 *** 0.059 *
(6.65) (1.88)
IV−0.206−0.1840.361 *
(−1.37)(−0.69)(1.88)
Age −0.014 ***−0.052 ***−0.037 ***
(−3.72)(−6.13)(−4.30)
Age2 0.000 ***0.000−0.000
(4.32)(0.50)(−0.09)
Education 0.004 **0.106 ***0.145 ***
(2.04)(3.57)(4.89)
Register 0.0090.0620.041
(0.98)(1.49)(1.00)
Gender −0.0110.343 ***0.263 ***
(−1.06)(14.22)(10.90)
Insurance 0.0190.093 **0.004
(1.42)(2.08)(0.10)
Ln hospital 0.545 ***−0.048−0.054
(2.86)(−1.51)(−0.43)
Environment 0.465 **−0.048−0.029
(2.09)(−0.38)(−0.92)
Index −0.111−0.066−0.130 **
(−0.61)(−1.02)(−2.17)
N27,17811,42725,55425,554
R20.00140.020.06690.0669
Year FENOYESYESYES
Province FENOYESYESYES
Note: *, **, and *** represent 10%, 5%, and 1% significance levels, respectively, and t-statistics are in parentheses.
Table 5. Macro-level mechanism tests.
VariableDeathNumber
(1)(2)
Robots−0.824 *−0.172 **
(−1.80)(−2.18)
Index−2.586−0.657
(−0.56)(−0.81)
GDP1.308−0.165
(0.51)(−0.48)
N27942794
R20.00220.0041
Year FEYESYES
Province FEYESYES
Note: * and ** represent 10% and 5% significance levels, respectively, and t-statistics are in parentheses.
Table 6. Individual-level mechanism tests.
VariableHoursIncomeProduction SectorLow-IncomeRetiredNon-Work
(1)(2)(3)(4)(5)(6)
Robots−0.357 *0.3820.109 ***−0.002−0.0240.059
(−1.79)(1.24)(3.41)(−0.05)(−1.07)(1.39)
Age0.798 ***0.413 ***−0.077 ***−0.046 ***−0.029 ***−0.174 ***
(8.47)(9.66)(−4.83)(−3.29)(−13.21)(−9.96)
Age2−0.011 ***−0.005 ***0.000 **−0.0000.000 ***0.001 ***
(−9.59)(−10.14)(2.28)(−0.38)(12.68)(6.55)
Education−7.455 ***2.744 ***0.0200.107 *0.198 ***0.235 ***
(−27.23)(8.37)(0.39)(1.81)(3.64)(3.01)
Register−1.051 **0.1830.0120.1130.134 ***0.105
(−2.38)(0.60)(0.17)(1.60)(2.77)(1.31)
Gender3.821 ***1.581 ***0.168 ***0.353 ***0.358 ***−0.216 ***
(14.63)(10.10)(3.68)(8.81)(11.21)(−3.45)
Insurance−3.301 ***−0.6520.149 *−0.0360.133 *0.248 ***
(−6.20)(−1.04)(1.69)(−0.58)(1.78)(3.15)
Ln hospital−0.453−0.144−0.296 ***−0.020−0.016−0.081
(−1.31)(−0.85)(−3.86)(−0.40)(−0.40)(−1.28)
Environment−0.1951.383 **−0.2470.0830.1570.321
(−0.14)(2.02)(−0.97)(0.42)(0.87)(1.30)
Index0.6790.135−0.369 ***−0.0010.111−0.060
(1.05)(0.52)(−2.74)(−0.01)(1.44)(−0.50)
N22,50723,3757324917714,2135810
R20.07430.04180.06820.06620.03440.0879
Year FEYESYESYESYESYESYES
Province FEYESYESYESYESYESYES
Note: *, **, and *** represent 10%, 5%, and 1% significance levels, respectively, and t-statistics are in parentheses.
Table 7. Further analysis.
VariableHealth
(1)(2)(3)(4)
Robots × Protect1.271 **0.093 ***−0.181 **−0.237 ***
(2.00)(3.96)(−2.43)(−2.96)
Protect−0.008−0.255 ***−0.184−0.864
(−0.02)(−7.61)(−0.98)(−0.96)
Robots−1.222 *−0.0190.081 ***0.110 ***
(−1.93)(−0.79)(3.07)(3.50)
Age−0.052 ***−0.051 ***−0.053 ***−0.052 ***
(−6.14)(−6.03)(−6.20)(−6.14)
Age20.0000.0000.0000.000
(0.51)(0.58)(0.59)(0.51)
Education0.105 ***0.129 ***0.069 *0.058
(3.54)(4.29)(1.66)(1.38)
Register0.0600.0570.107 ***0.108 ***
(1.44)(1.37)(3.59)(3.62)
Gender0.343 ***0.338 ***0.099 **0.092 **
(14.21)(14.02)(2.20)(2.04)
Insurance0.095 **0.106 **0.342 ***0.343 ***
(2.11)(2.36)(14.13)(14.23)
Ln hospital−0.046−0.057 *−0.040−0.040
(−1.45)(−1.81)(−1.25)(−1.25)
Environment−0.018−0.071−0.041−0.012
(−0.14)(−0.56)(−0.32)(−0.10)
Index−0.052−0.061−0.0370.013
(−0.89)(−1.05)(−0.56)(0.22)
N25,55425,55425,38225,554
R20.06700.06770.06700.0670
Year FEYESYESYESYES
Province FEYESYESYESYES
Note: *, **, and *** represent 10%, 5%, and 1% significance levels, respectively, and t-statistics are in parentheses.
Disclaimer/Publisher’s Note: The statements, opinions and data contained in all publications are solely those of the individual author(s) and contributor(s) and not of MDPI and/or the editor(s). MDPI and/or the editor(s) disclaim responsibility for any injury to people or property resulting from any ideas, methods, instructions or products referred to in the content.

