1. Introduction
Tourism has experienced expansion and diversification in the past seven decades, and has become one of the largest and fastest growing sectors in the world economy [
1]. The prerequisites for the emergence and development of tourism are free time, free funds, and infrastructure development, but also the desire to travel. As the point of saturation in tourism is difficult to reach, since tourists who have material opportunities and acquire touristic habits will use increasingly complex and high-quality services, individuals’ free time, which is constantly increasing, will be used more and more to satisfy touristic needs, and to travel to new and increasingly distant countries [
2], which also leads to the creation of new tourist destinations. Therefore, in addition to traditional tourist favorites (Europe and North America), new destinations are emerging in Asia, Africa, and the Middle East, which has influenced the expansion of tourism. In recent years (the period before the COVID-19 pandemic), tourism has grown at higher rates in developing countries compared to developed countries, and according to UNWTO [
3] forecasts, it is expected that in 2030, over 50% of global tourism will be concentrated in developing countries. Nevertheless, although there has been a change in the regional order (Asia and the Pacific overtook the Americas region in the early 2000s; however, the order changed again after the pandemic), Europe still remains the global tourist leader, participating in over 50% of world tourism. When looking at international tourism, Europe is the region with the highest number of arrivals, although within this region, some subregions are achieving more significant growth rates, while others with a large number of mature destinations have lower growth rates, but the number of international tourist arrivals continues to grow [
4,
5].
Tourism is one of the areas of economic activity that is considered to be a stimulator of social and economic development [
6]. Although the development of tourism has numerous positive effects on national economies, since it contributes to the creation of GDP, generates employment, and contributes to raising the level of living standards of residents, the excessive development of tourism also creates certain negative social and ecological effects. Countries strive to improve the competitiveness of their tourist destinations on the international tourism market, which is reflected in an increase in the number of visitors, an increase in tourist consumption, and an ultimate contribution to the improvement of the well-being of the residents of the destination and the preservation of the destination’s natural resources for future generations [
7].
However, with the excessive development of tourism, the attitude of residents towards tourists is also changing. Ferrer-Roca et al. (2021) [
8] highlight overtourism as one of the challenges facing European tourism. Overtourism is a recent concept, even though its symptoms may have been apparent for a while. It results from an excessive number of visitors creating overcrowding and congestion at a destination, frequently leading to tension between tourists and the local population [
8]. Therefore, for destinations that have reached a stage in the life cycle of development where the number of tourists greatly exceeds the number of residents, a phase of antagonism occurs, where the local population sees tourists as the cause of all the problems in the destination [
9]. The negative side effects of tourism development, such as overcrowding, traffic jams, pressure on resources, littering, environmental pollution, and “architectural pollution” as a result of the construction of additional facilities for tourists, which, due to their appearance, do not fit into the old city core, disrupt the quality of life of residents. The orientation towards growth, development, and wealth creation of the tourism industry is subject to criticism, bearing in mind the industry’s responsibility for its obvious environmental consequences. It is therefore necessary to moderate its focus on purely economic aspects and strongly include those based on sustainability [
10].
The importance of tourism in broader economic and social development, the positive but also negative socio-economic and environmental effects it causes, and the importance of Europe as a dominant region in global tourism motivated this research. In the increasingly competitive tourism industry, it is necessary to assess whether tourist destinations are operating efficiently [
11]. Efficiency is crucial for development, and tourism is a significant component of a state’s economy, making it vital for both social and economic progress. The economic efficiency of any industry is a relative assessment of how effectively this industry processes inputs to obtain its outputs in comparison to the best practice, which is the most efficient industry in the sample [
12].
The subject of our research is to assess the relative tourism efficiency of European countries from a sustainability perspective. To assess the performance of tourism at the country level, from a broader sustainability perspective, the research uses a wide range of variables relating to the socio-economic and environmental impacts of tourism, as well as those representing the sustainability of demand in T&T (Travel and Tourism). To deal with multiple input and output variables, the study applies the DEA methodology. Data envelopment analysis can be successfully utilized to assess and compare the economic and environmental performances of tourism management units [
13]. The estimated tourism performance of countries, especially when a country is inefficient, provides insight into possible areas of improvement, and represents valuable information that policymakers can use when making long-term decisions regarding future tourism development.
The remainder of the paper is structured as follows. After the theoretical background presented in
Section 2, an overview of studies that apply DEA to assess tourism efficiency in European countries is provided, with an emphasis on variable selection in
Section 3.
Section 4 describes the research methodology, research sample, data, data processing method, and a detailed description of variable selection.
Section 5 presents the research results, and
Section 6 discusses the results and states the theoretical and practical implications of this research. Finally,
Section 7 concludes this article, states the limitations of this research, and provides a scope for further research.
2. Theoretical Background
Sustainable development is the main concept of development, and tourism has a significant economic, environmental, and social influence in today’s world; thus, the growth of this industry is interconnected with all three aspects of sustainability [
14]. Benchmarking tourism destinations and assessing the performance of tourism management are key and challenging tasks aimed at evaluating tourism sustainability and redefining tourism activities [
13]. Unmanaged tourism development can lead to destinations operating beyond their capacity, resulting in overcrowding, deterioration of natural and cultural resources, overloaded infrastructure, higher housing prices, and a diminished quality of life for local residents. If not properly managed, these problems can lead to resident resistance to tourism, decreased visitor satisfaction, and lower overall destination attractiveness, all of which negatively affect T&T development [
15]. Tourism management policies should prioritize sustainability, aiming to enhance the benefits of tourist arrivals while reducing negative impacts on the environment or the population of the destination [
16].
The sustainability of the tourism sector has become increasingly important for many destinations [
17]. Tourism services affect host areas in various ways, including having effects on the local environment, host communities, and the development of employment opportunities, making the tourism industry crucial for the sustainable development of tourism destinations [
14]. Unfortunately, because of its conceptual complexity, scholars do not have unified agreements on the definition and measurement of tourism sustainability [
18]. Sustainable tourism is defined by the UN Environment Program and UN World Tourism Organization as “tourism that takes full account of its current and future economic, social and environmental impacts, addressing the needs of visitors, the industry, the environment and host communities” [
19]. A destination can enhance its long-term competitiveness and development potential by effectively managing these factors [
20].
The tourism sector significantly contributes to the socio-economic process, directly and indirectly, through the generation of employment, export revenues, investments, and infrastructure development [
21]. T&T can be used to address global challenges, such as lack of economic opportunity, unemployment, and economic downturns, as it is expected to remain a significant driver of economic expansion and employment. In the next decade, the T&T industry’s contribution to global GDP is projected to rise from 9.1% in 2023 to 11.4% by 2034, aiding in the creation of more than 12% of jobs globally [
20]. Considering that the T&T industry will stay relatively labor-intensive, even with more automation, and noting the significant number of low-entry and part-time jobs in this sector, it presents excellent opportunities for addressing unemployment. It is also crucial for employing women, youth, migrants, and informal workers. Specifically, supported by the growth of emerging-market economies and the middle class, T&T will play a crucial role in driving economic expansion in developing nations and regions [
20].
While the economic benefits of increased tourism are appealing, decision makers must also consider the environmental impact [
17]. It has been argued that tourism is a resource-based industry, with natural environmental assets serving as the essential foundation for all tourism, often being the key factor in attracting tourists. This may partly explain why the sustainable tourism literature has largely concentrated on the preservation and conservation of natural resources [
22]. Undoubtedly, the issue of the impact of travel and tourism on the environment and resources remains significant, especially considering that the relationship is two-way. Without a healthy and preserved environment and resources, there is no tourism development. Although tourism development creates greater opportunities for the protection and conservation of necessary resources, on the other hand, it causes numerous negative impacts on the environment. Tourism contributes to environmental pollution and global climate change [
23].
Even though natural processes are probably some of the many reasons for environmental degradation and the steady increase in greenhouse gases, most of them are anthropogenic. Tourism is a significant contributor to carbon emissions, accounting for approximately 8% of overall global emissions, and is expected to rise by 25% by 2030 compared to 2016 levels [
24]. Travel and tourism transportation is a significant source of greenhouse gas (GHG) emissions [
25]. The primary environmental issue linked to tourism is the consumption of fossil fuels and the resulting greenhouse gas emissions. Transportation plays a significant role in the overall environmental impact of leisure tourism, accounting for between 60% and 95% of the impact at the journey level, which includes local transport, accommodation, and activities. Given these findings, it is essential to focus on reducing greenhouse gas emissions, especially in the transportation sector [
26]. Katircioglu et al. (2020) [
27] examined the impact of tourism on greenhouse gas emissions in Cyprus. Their findings indicate that tourism has a significant and lasting positive impact on carbon emissions, suggesting that expansion in the tourism sector leads to environmental degradation. The authors emphasize the importance of incorporating environmental indicators when analyzing sustainable development. In their research, Salahodjaev et al. (2022) [
28] investigated the connection between tourism, renewable energy, and CO
2 emissions in countries across Europe and Central Asia from 1990 to 2015. Using a two-step GMM estimator, they discovered that tourism contributes to an increase in CO
2 emissions, whereas renewable energy helps to lower carbon emissions. Metrics related to greenhouse gas emissions, the use of renewable energy, investments in green infrastructure, and exposure to weather-related events are key to assessing a country’s exposure, readiness, and willingness to tackle climate change—one of the most significant long-term threats to the travel and tourism industry [
15].
In response to the rapid rise in global tourism emissions, carbon mitigation efforts have focused on changing visitor behavior and encouraging technology adoption among tourism businesses. The first strategy aims to promote sustainable travel choices by encouraging tourists to reduce travel frequency, extend stays, select closer destinations, engage in non-motorized activities, and shift from air transport to land or public transport when possible. The second strategy targets the supply side, aiming to lower the carbon energy demands of tourism businesses, with incentives or penalties to drive technological improvements that enhance emission efficiency per service unit [
29].
A key issue contributing to the rising carbon emissions in tourism is the constant focus on maximizing tourism, where the growth of tourist numbers and spending is driven by economic goals, often with little regard for the social and environmental consequences [
30]. The tourism sector is more environmentally harmful for developed countries due to the large volume of tourist arrivals [
31].
It is necessary to develop the concept of sustainable tourism, because the arrival of foreign tourists negatively affects environmental efficiency. This could be a result of tourism transport, as foreign tourists rely more on air transport and other highly polluting modes of transport [
25]. Travel distance and mode of transport are the most important factors influencing eco-efficiency [
26]. Therefore, short travel distances are a prerequisite for sustainability. Eco-efficiency can be positively affected by an extended length of stay and higher expenditures per day [
26]. Steering the average length of stay in the desired direction is the goal of developing efficient marketing strategies [
32].
Since substantially reducing tourism volume is less politically and socially feasible, the literature proposes an alternative approach focused on optimizing tourism systems. The core idea is that certain visitor groups can provide greater benefits and/or cause less harm per trip to a destination than others. By increasing the share of higher-performing markets, the overall economic, social, or environmental efficiency of tourism can be improved. Therefore, through adjustments in market segmentation, greater benefits and/or reduced negative impacts can be achieved without needing to alter the total number of visitors [
29].
Destination attractiveness influences tourists’ timing, demand, willingness to pay, and length of stay, ultimately impacting the economic contribution of tourism. While many destinations focus on increasing visitor numbers, particularly through boosting international arrivals, less attention is given to optimizing existing tourism systems to create more profitable, stable, resilient, and sustainable outcomes [
33]. Sustainable tourism requires both the sustainable growth of tourism’s contribution to the economy and society, as well as the sustainable use of resources and the environment. Achieving either requires a solid understanding and effective management of tourism demand [
22]. “Management of demand” may contribute to more sustainable tourism development [
34].
The need for a broader approach to the drivers of tourism development has been recognized by the World Economic Forum (WEF), which, with the support of its diverse community of stakeholders, added a fifth subindex related to the sustainability of T&T to the Travel and Tourism Development Index (TTDI) structure. The Travel and Tourism Development Index (TTDI) 2021 is an evolution of the Travel and Tourism Competitiveness Index (TTCI). The shift from the TTCI to the TTDI represents an expanded focus on T&T development, incorporating factors like sustainability and resilience, and aims to emphasize the sector’s contribution to broader economic and social progress. Key differences in the framework and methodology between the two indices include the introduction of new pillars and the addition of a fifth subindex related to Travel and Tourism Sustainability [
15]. The TTDI’s T&T Sustainability dimension pillars measure the general environmental conditions and the sector’s energy sustainability (Environmental Sustainability), the economic and social impact of T&T (T&T Socio-economic Impact), and demand trends that may pressure destinations’ carrying capacity and negatively affect local communities (T&T Demand Sustainability) [
20] (p. 28). Europe’s leading destinations have faced challenges like short lengths of stay, high seasonality, and overcrowding [
20]. As the tourism sector recovers, sustainable management of tourism demand, which maximizes benefits for local communities while addressing negative impacts like overcrowding, will be crucial for T&T development [
15].
It is crucial to develop tools that assess the performance of tourism activities not just economically, but also from an environmental standpoint. Specifically, using performance indicators will be essential in order to offer guidelines for policymakers, correct inefficient management strategies, and encourage positive competition between destinations [
13]. Choosing the appropriate indicators for assessing a country’s tourism efficiency, which reflects various aspects of sustainability, can be a complex task. The next section will review studies that analyze the tourism efficiency of European countries using the DEA method, focusing on the variables employed in these studies.
3. DEA in Tourism—Literature Review
Efficiency in tourism is a crucial indicator for assessing the level and quality of tourism development [
35]. The rising interest in research on measuring efficiency in the tourism industry is unsurprising, considering tourism’s growing economic importance as a source of international revenue and domestic employment, as well as the intensifying competition in global tourism markets [
12]. Most studies in tourism analyze efficiency from a microeconomic perspective, among which the most numerous are those that evaluate the efficiency of hotels and restaurants. Although studies on efficiency in tourism from a macroeconomic perspective have gained importance in recent years, they are few and insufficiently researched compared to studies conducted at the level of various tourism companies. Some studies have analyzed the efficiency of tourist regions or destinations within individual countries [
36,
37,
38], while studies such as those by Hadad et al. (2012) [
12], Assaf and Josiassen (2012) [
39], and Martin et al. (2017) [
40] analyze a large number of countries worldwide. When it comes to Europe, some studies analyze countries belonging to individual European subregions, such as the Mediterranean [
41], Eastern Europe [
42], or the Balkans [
43,
44], and some studies focus on countries that are members of the European Union [
25,
45,
46], while other studies analyze countries from the entire European region [
21].
One advantage of the DEA method is that it allows the inclusion of multiple variables that act as inputs and outputs [
47]. As for the input and output variables used in comparable studies conducted in European countries, they are numerous and various.
One of the first DEA-based studies conducted to evaluate countries as tourist destinations in Europe was by Lozano and Gutiérrez (2011) [
45]. Lozano and Gutiérrez (2011) [
45] assessed the efficiency of the tourism sectors of different EU-25 member states. To assess the relative efficiency of countries, the authors used the following input variables: number of bed-places and number of full-time-equivalent persons employed, as well as two additional uncontrollable inputs, namely the inverse of the number of heating degree days (HDDs) and the number of properties inscribed on the World Heritage List (WHL) of UNESCO. The output variables used in the study were as follows: number of tourists, total (domestic and inbound tourism) overnight stays in all types of accommodation establishments, and international tourism receipts.
Kosmaczewska (2014) [
48] estimated the relative tourism efficiency of EU member states. The variable of arrivals in tourist accommodation establishments was regarded as input, while the variables of collective tourist accommodation establishments and GDP per inhabitant were regarded as outputs. Soysal-Kurt (2017) [
21] also measured the relative efficiency of European countries. The sample consisted of 29 countries, and three input and three output variables were used to assess the relative performances of the countries. The input variables were tourism expenses, number of employees (in the tourism sector), and number of beds, while the output variables were tourism receipts, tourist arrivals, and number of nights spent. Tomić and Marcikić Horvat (2018) [
49] used government expenditure and prioritization of tourism as input variables to evaluate the efficiency of six countries in Southeastern Europe, while international tourist arrivals, international tourism inbound receipts, and tourism industry GDP represented output variables in the research. Ilić and Petrevska (2018) [
43] determined tourism efficiency in 15 European countries. In assessing the tourism efficiency of countries, the authors used the following input variables: tourism expenses and the number of beds, while the number of arrivals, the number of nights spent, and tourism revenue were used as output variables.
Marcikić Horvat and Radovanov (2020) [
50] evaluated the relative efficiency of tourism development in 33 European countries, divided into Western Balkan Countries, New Member States, and EU15. The authors used one input variable: government expenditure for travel and tourism (T&T), and four output variables: average receipts per arrival, number of international tourist arrivals, T&T share of GDP, and T&T share of employment. Barišić and Cvetkoska (2020) [
46] analyzed the efficiency of travel and tourism in the European Union. To evaluate the efficiency of all 28 member states of the European Union, the authors used internal travel and tourism consumption and capital investment as inputs, while travel and tourism’s total contribution to GDP and employment were the outputs. To evaluate the efficiency of the tourism industry in a sample of countries in the Balkans, Cvetkoska and Barišić (2017) [
44] used visitor exports and domestic travel and tourism spending as inputs, while the outputs were the same as in Barišić and Cvetkoska (2020) [
46]. Radovanov et al. (2020) [
11] evaluated the efficiency of tourism development in European countries, which they observed within the following groups: Western Balkan, EU 15, and new member states. In evaluating the efficiency of tourism development, the authors used T&T government expenditure as the only input variable, while the output variables in the study were average receipts per arrival, T&T industry employment, and sustainability of travel and tourism industry development.
Doğanalp and Arslan (2021) [
41] used tourism revenues and tourist numbers as output variables in their analysis of the efficiency of the tourism industry in the Southern Mediterranean region. The input variables used in this research were far more numerous, and the authors divided them into four groups—Natural Assets (Blue Flag beaches, Blue Flag marinas, national parks, caves, and ski resorts); Cultural Assets (UNESCO world cultural and natural heritage, UNESCO intangible cultural heritage, and museums); Events (international fair organizations and international congress organizations); Infrastructure (the number of hotels and the other accommodation establishments and the number of employees in the tourism industry). Pavković et al. (2021) [
51] analyzed the efficiency of the tourism sector in certain European countries, which they divided into five groups: countries in transition, Scandinavian countries, Eastern European countries, Mediterranean countries, and Central and Western European countries. The input variables used in the study included the following: the number of hotels and similar accommodation capacities, the number of rooms, and the number of bed-places, whereas the output variables were the following: the number of inbound tourists, the number of bed-nights, and the tourism expenditure of tourists during their stay abroad. Lacko, Hajduová, and Markovič (2023) [
25], to evaluate environmental efficiency in EU countries, used the number of employed persons, gross fixed capital formation, and arable land as input variables, while greenhouse gas emissions and gross domestic product were used as output variables. Ivanova and Genchev (2024) [
52] measured the efficiency of tourist destinations in 19 countries in Southern and Southeastern Europe. The study used three input variables: employment, hotel rooms, and arrivals, while the only output variable was revenue. Karma, Devassia, and Muco (2024) [
42] used capital investment, number of employees, and number of beds places as input variables, and tourist receipts and tourist arrivals as output variables, to evaluate the tourism efficiency in Eastern European countries.
Based on the presented studies on tourism efficiency from a macroeconomic perspective in Europe, it is noticeable that studies that include variables related to the sustainability of this sector in efficiency assessments are few, and mostly refer only to certain aspects of sustainability. This study will be among the first studies to apply a broader sustainability approach to assessing the tourism efficiency of European countries, by including variables representing different dimensions of tourism sustainability. This research will also attempt to respond to suggestions from other authors regarding recommendations for future research, such as increasing the research sample and adding input and output variables, and suggestions that it is particularly desirable to include dimensions that reflect the impact of tourism activities on the environment, since ignoring this issue tends to calculate an excessive increase in production that may not always be sustainable [
45]. Some studies have included variables representing environmental sustainability in their efficiency evaluation, such as Lacko, Hajduová, and Markovič (2023) [
25], who used greenhouse gas emissions as one of the research variables in their study. Also, Radovanov et al. (2020) [
11] include the variable sustainability of travel and tourism industry development in their efficiency evaluation, which shows how effective a government’s efforts are to ensure that the T&T sector is being developed in a sustainable way.
To assess the relative efficiency of tourism in European countries from a sustainability perspective, this study, in addition to variables that typically represent tourism activity in studies, uses variables that represent the socio-economic impact of tourism and environmental sustainability. Unlike some previous studies [
11] that used pillar scores, we prefer to use elementary indicators, which will represent the dimension of environmental sustainability. Also, following the example of the TTDI, which indicates that the challenges of sustainability of demand in T&T have historically been challenging issues for leading European destinations, and that these demand trends can affect the carrying capacity of the destination and negatively affect local communities, an indicator representing demand sustainability dimension will be integrated into the assessment of tourism efficiency [
20]. The selection of variables for the assessment of tourism efficiency of countries that represent different dimensions of sustainability, without losing the discriminatory power of the model due to too many variables, is a challenging issue. A detailed description of the selected variables for the evaluation of tourism efficiency is presented in
Section 4.
4. Methodology and Data
Data envelopment analysis (DEA) is a robust method for evaluating performance and providing information on the efficiency of entities in different fields. Depending on the type of entities (decision making units—DMU), this analysis can be used both on microeconomic level, for assessing the efficiency of various organizations, and on the macroeconomic level, for comparison of countries or regions. It is a non-parametric technique that is highly versatile and can be used in a wide range of situations, because it does not require a predefined functional form of the relationship between inputs and outputs. There are different types of DEA models, depending on the specific problem, available data, selected sample, variables, and time period. A DMU is considered efficient if it produces the maximum possible output for a given set of inputs, or uses the minimum input to achieve a given level of output. The efficiency score is calculated for each DMU and ranges from 0 to 1, where 1 indicates that the DMU is operating efficiently, and values less than 1 indicate inefficiency. Inefficient DMUs are compared to a set of top-performing entities, which form the reference set. These entities are considered efficient, while inefficiencies are measured by the extent to which a unit must enhance its performance to reach the level of the top performers.
In this paper, the output-oriented BCC model is applied to the assessment of the relative technical efficiency of tourism in European countries. Three input variables (beds available, international tourist arrivals, and GHG intensity) and five output variables (T&T industry employment, inbound length of stay, nights international guests, international tourism receipts, T&T industry GDP) are used in the analysis. The DEA is carried out by solving the following model [
53] (p. 1080) of linear programming:
where
n is the number of entities and DMUo represents the country under evaluation. The number of output variables is
s, while
m is the number of input variables. The observed output and input values are
yr and
xi, respectively; thus,
yro is the amount of output
r used by DMUo, while
xio is the amount of input
i used by DMUo.
λ is the entity’s weight, and the efficiency score is labeled with
ϕ.
Data were retrieved from the World Economic Forum database (Travel and Tourism Development Index 2024 Edition) [
54], UNWTO Tourism Highlights [
5], UN Tourism [
55,
56], and Eurostat [
57]. The research sample consists of countries from the Europe region, and countries for which data for any of the variables were not available in the previously listed data sources were excluded from the initial sample. The final sample consists of 31 European countries, and the list of countries is presented in
Table A1. The data refer to 2022.
This study will be among the first to include, in addition to variables that typically represent tourism activity in research, variables that provide a broader approach to sustainability in assessing tourism efficiency. Following the example of the World Economic Forum’s Travel and Tourism Development Index, the efficiency assessment will include variables that measure T&T sustainability, which can be divided into the following components: environmental sustainability, socio-economic impact, and T&T demand sustainability [
54]. Considering previous studies and the aim of this one, the following research variables were selected.
The first input variable is the number of beds. This is one of the inputs that reflect the supply of tourist accommodation, and has been used in numerous studies [
21,
43,
45]. Accommodation capacity (beds, rooms, …) variables are among the most used inputs in tourism modeling with DEA techniques [
58]. The second input variable is international tourist arrivals. Although this variable is an output in most studies [
21,
39,
42,
43,
45,
50,
51], given the aim of this study, and following the example of Barros et al. (2011) [
36], Benito et al. (2014) [
47], Ben Aissa and Goaied (2017) [
59], and Ivanova and Genchev (2024) [
52], this research uses tourist arrivals as an input variable. Although arrivals and bed-nights appear to be similar, Barros et al. (2011) [
36] and Ben Aissa and Goaied (2017) [
59] argue that it is important to distinguish between them, because arrivals produce bed-nights, and the number of bed-nights better characterizes the economic returns of tourism. The authors also point out that it is possible to have a large number of arrivals for a relatively small number of nights in a situation that is symptomatic of an inefficient destination [
36,
59]. The third input variable in the study is T&T GHG intensity (GHG emissions in CO
2e kg per USD of travel and tourism GDP) [
54], and this variable represents environmental sustainability. This variable is one of the most commonly used in assessing environmental efficiency [
25], and is also one of the variables within the Environmental Sustainability pillar of the Travel and Tourism Development Index [
54]. This variable could also be treated as an output, but as Martín et al. (2017) [
40] and Lacko et al. (2023) [
25] state, it is a bad or undesirable output. Even though various DEA models exist to differentiate between favorable and unfavorable outcomes, Martín et al. (2017) suggest sticking to a well-established method that considers certain variables as inputs [
40].
The first output variable in the research is the already-mentioned number of nights (international guests), and the characteristic of an efficient destination in this research context is reflected in the ability to produce a greater number of overnight stays from a given number of tourist arrivals. Another output variable used in many studies is international tourism receipts (USD million). Receipts from tourism, in addition to the number of tourists, are one of the main indicators of tourism activity [
60]. The following output variables represent the socio-economic impact of tourism. The tourism sector contributes to the socio-economic process directly and indirectly. The authors’ choice of variables was made considering previous studies and the research method used. Therefore, since the combination of variables of different scale types (e.g., ratio and non-ratio) may not be appropriate in DEA models [
58], the variables of the T&T industry’s direct contribution to employment and the T&T industry’s direct contribution to GDP will be used, rather than ratios such as employment and GDP multiplier.
The fifth output variable in the study, which represents T&T demand sustainability, is the inbound length of stay. Inbound length of stay is one of the variables within the T&T Demand Sustainability pillar of the TTDI. The length of stay refers to the number of days spent in the destination country [
20]. Also, according to Nurmatov et al. (2021) [
58], the length of stay variable, along with the overnight stays and rate variables, is one of the most used output variables as a proxy for occupancy in DEA tourism studies. The average length of stay is positively related to tourism income. The length of stay also has significant sustainability implications. A higher frequency but shorter length of trips raise total transport-related emissions. This also implies that, for destinations to sustain the same number of guest nights and the associated income level, the number of tourist arrivals must increase [
33]. The length of stay is also linked to more dispersed visitor travel flows, as having more time enables tourists to visit regional destinations, which in turn distributes the economic benefits of tourism away from high-volume regional destinations, while also mitigating the environmental effects of energy-intensive travel [
29].
Descriptive statistics for the specific inputs and outputs are presented in
Table 1.
5. Results
By application of the abovementioned output-oriented DEA model with a variable return to scale, the efficiency scores were calculated. From the data presented in
Table 2, it can be concluded that tourism performances in the selected European countries have a significant level of efficiency, since the average efficiency is above 80% (84%). More than 50% of the observed countries (16) achieved the highest possible efficiency score. Lithuania and Estonia have the lowest efficiencies, below 50%, and Hungary, Albania, and Bulgaria have efficiencies between 50 and 60%.
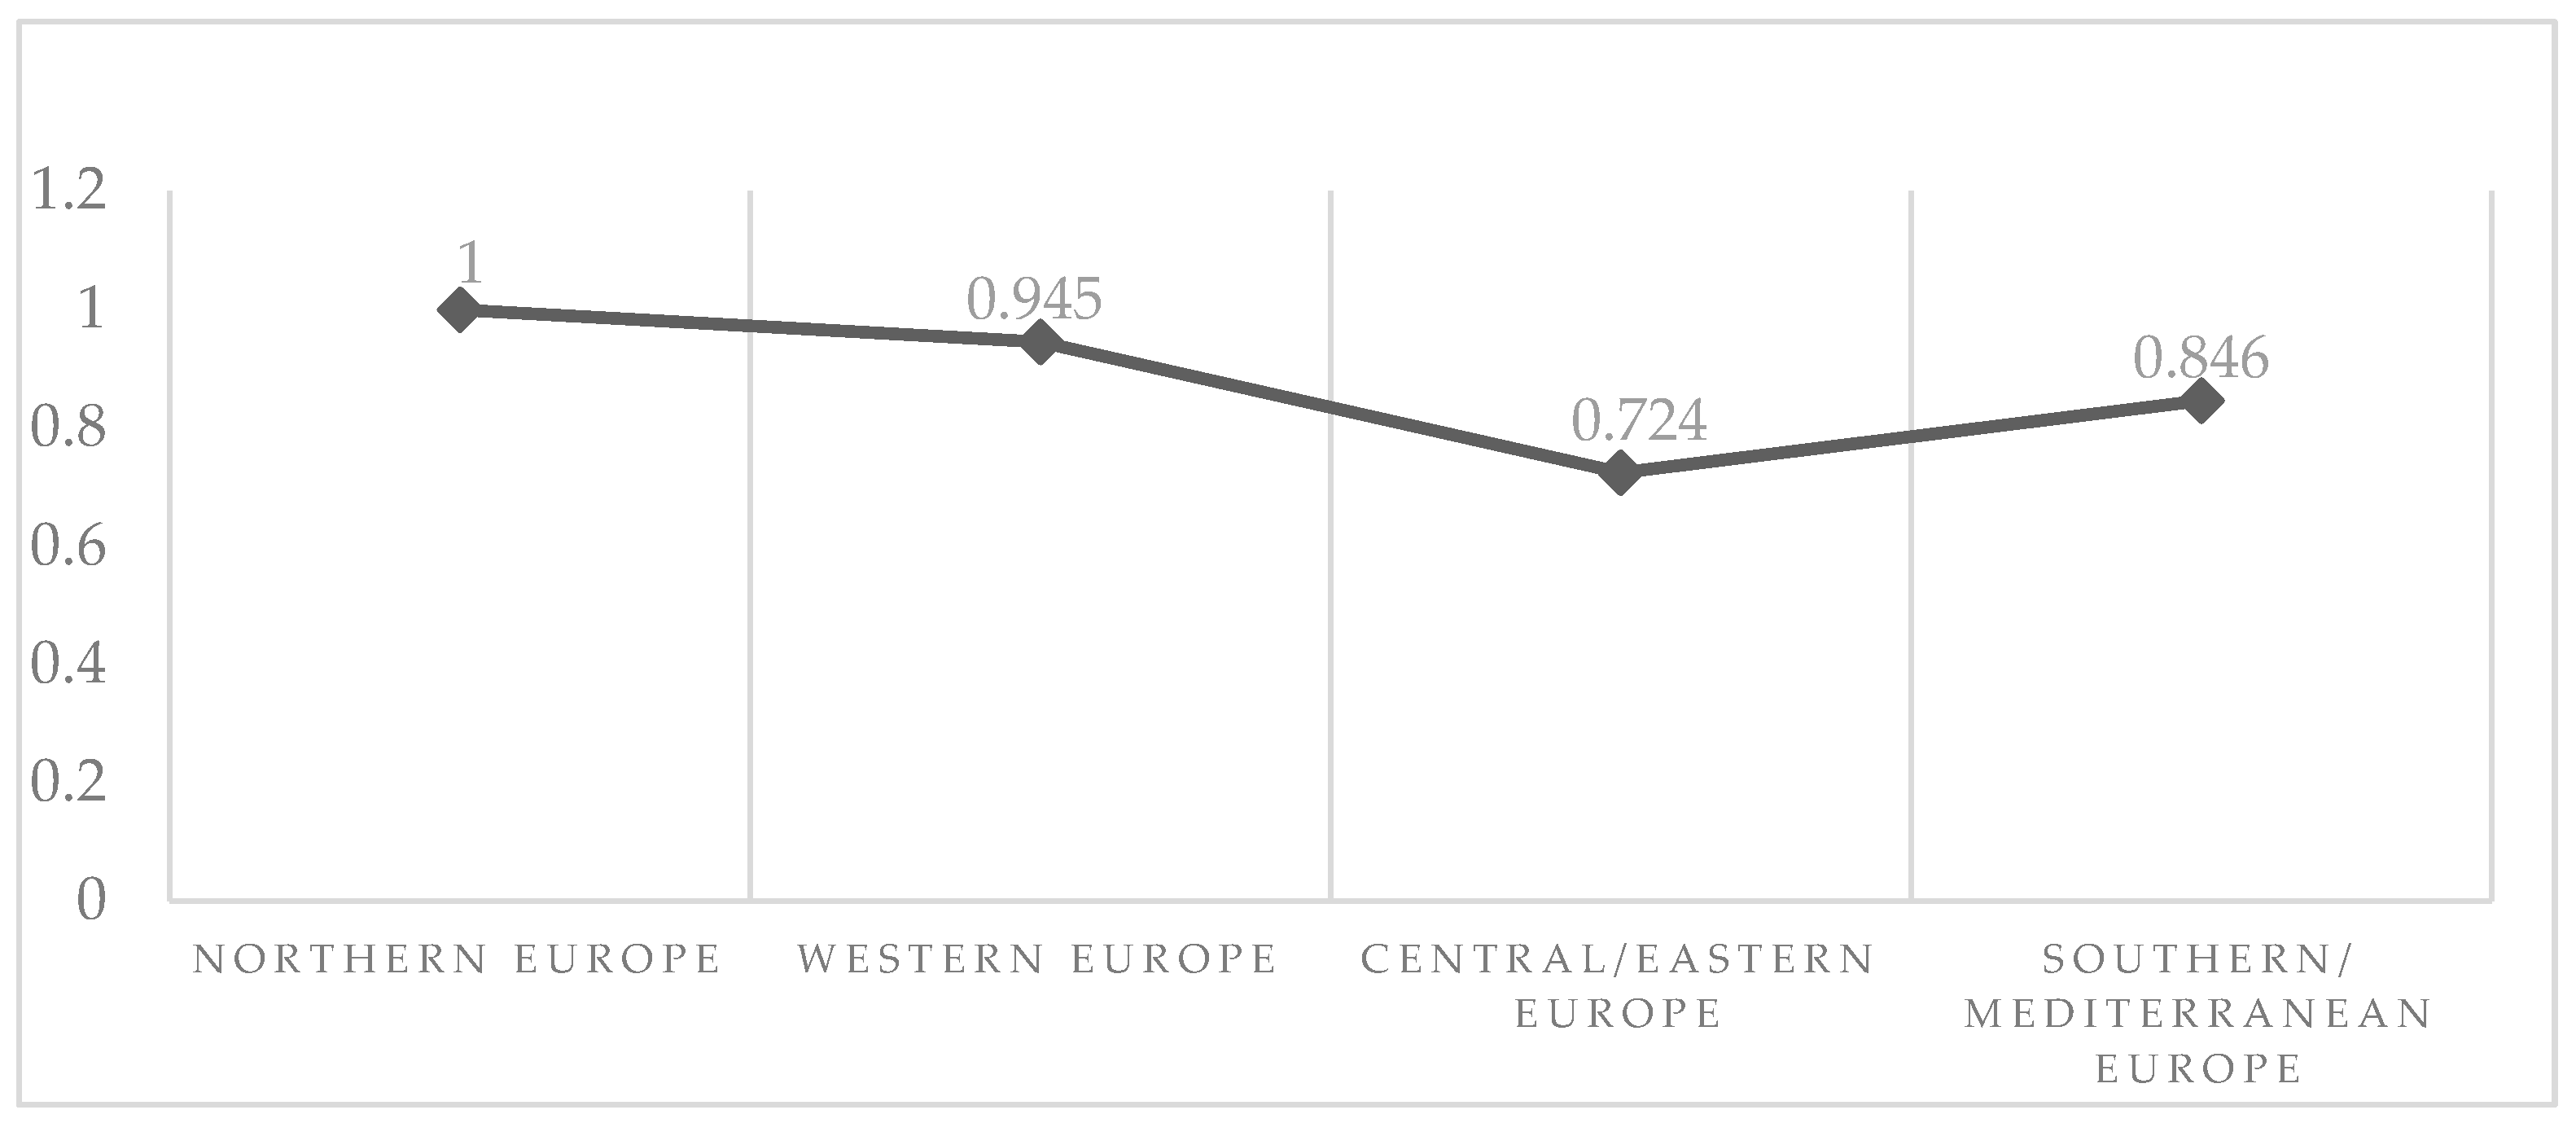
Based on country efficiency scores, it would be interesting to calculate average tour-ism efficiency at the level of regions of Europe, based on the World Tourism Organization [
5] division into Northern Europe, Western Europe, Central/Eastern Europe, and South-ern/Mediterranean Europe, to see whether there are significant differences in average efficiency between these regions. Based on the average efficiencies within the European regions, it can be concluded that the maximum efficiency is obtained in Northern Europe and the worst tourism efficiency in Central/Eastern Europe (
Figure 1).
Highly developed countries from Northern and Western Europe also show the highest possible efficiency score when it comes to sustainable development, as indicated by the results of Łozowicka (2020). In her study on the evaluation of the efficiency of sustainable development policy implementation in selected EU member states, Łozowicka (2020) [
61] found that countries belonging to the regions of Northern and Western Europe are the most efficient countries, while inefficient countries characterized by lower levels of wealth are usually those from Central and Eastern Europe. It is also interesting that in both studies, Belgium is an exception and has a worse output-to-input ratio compared to the efficient countries.
Countries that achieve an efficiency score lower than 100% can enhance their efficiency by boosting the level of certain outputs, but sometimes it is also necessary to reduce the level of inputs. Hence, besides efficiency scores, DEA also offers decision makers valuable insights into potential methods for enhancing efficiency. Projected (ideal) values of input and output variables are presented in
Table A2. Therefore, if the observed country is inefficient, those projections show the way of achieving the maximum level of efficiency by increasing the output variables and reducing the level of inputs. For example, Belgium should increase all outputs to the projected values presented in
Table A2 and reduce GHG intensity to 0.34192, in order to obtain the highest efficiency score.
6. Discussion
It is noteworthy that the best results when it comes to assessing the efficiency of tourism from the perspective of sustainability are generally achieved by highly developed countries from Northern and Western Europe, while from a regional point of view, the worst performance is in the countries of Central/Eastern Europe (CEE). In general, these countries perform poorly in all components of sustainability in tourism. The countries of the CEE region are the least successful in converting tourist arrivals into overnight stays, and have the shortest inbound length of stay, which is an indicator of the unsustainability of demand and the characteristics of inefficient destinations. Also, these countries, on average, show the highest GHG intensity values, which adversely affects the sustainability of the environment. The economic effects of tourism in the countries of this region, in general, are very weak compared to in other regions, when it comes to the direct contribution of tourism to GDP and international tourism receipts per arrival.
Therefore, policymakers in these CEE countries, in order to prevent further environmental degradation, should work on improving environmental policies. Using environmental taxes for this purpose can be a useful tool [
62]. As an example of good practice in this regard, Western European countries can be singled out, which generally have very low GHG intensity values, except for Belgium, whose score is slightly higher than other countries in this region, but still below the average for European countries. Belgium is also the only country in the Western European region that is not efficient, while other countries in this region achieve the highest possible tourism efficiency score.
However, to achieve environmental sustainability in destinations, residents’ environmental citizenship behavior is as essential as that of visitors [
63]. The greater the benefits that local residents receive from tourism, the more inclined they will be to protect the area’s natural and cultural heritage and endorse tourism initiatives. If they do not benefit from tourism growth, they could become bitter, which might deter tourists from a destination, since tourists do not like visiting places where they are not welcomed [
22].
The findings from the research conducted by Bassi and Martín (2024) [
64], which explores the readiness of residents from 27 EU countries to alter their travel and tourism practices to adopt more sustainable behaviors, are encouraging. The likelihood of citizens altering their tourism habits to preserve the environment relies on their sociodemographic characteristics and the European country in which they reside. However, the study indicates that 48.4% of Europeans are ready to cut down on waste while on holiday, 35.5% will choose transportation with lower ecological effects, 35% are prepared to spend extra for environmental protection, 34.8% claim that they will reduce water consumption, and 33.7% are ready to support initiatives that mitigate carbon emissions, including tree planting [
64].
In addition to the average values at the regional level, it is important to look at the individual scores of certain countries. The countries that achieved the highest possible tourism efficiency score within the CEE region are Azerbaijan, Romania, and Moldova. Based on the tourism performance data for these countries, it is noted that the high efficiency scores of these countries come mainly from above-average length of stay values (Azerbaijan), or very high receipts per tourist, achieved by Romania and Moldova, in which countries the number of receipts is generally considered to be among the highest in Europe (after Luxembourg).
Proper demand management can contribute to the development of tourism towards sustainability. In this context, proper demand management can refer to prioritizing specific inbound tourism markets, such as those from neighboring countries for short-haul travel, as opposed to long-haul air travel, which has the most problematic environmental impact [
17]. Since the tourism industry depends on transportation, especially air travel, which is a mode of travel that consumes a lot of energy and produces significant emissions that cannot be fully replaced, it emits significant GHGs [
20]. Travel distance and transportation mode are the primary factors affecting eco-efficiency [
26]. As a result, shorter travel distances are essential for sustainability. Additionally, eco-efficiency can be improved by extended length of stay and higher daily expenditures [
26]. One of the key goals in developing efficient marketing strategies is to influence the average length of stay in the desired direction [
32]. Therefore, prioritizing segments of visitors with extended lengths of stay [
17] and focusing marketing efforts on specific target groups [
33], such as the elderly, who tend to stay longer [
65], or segments with higher daily expenditures [
17], can contribute to tourism sustainability.
Increasing the length of stay can be influenced by improving the attractiveness of the destination [
66]. Although tourist infrastructure is a factor of attractiveness and an important driver of tourism development, it is important that tourist capacities are not oversized in relation to tourist demand, because this causes a decrease in the efficiency of tourist destinations. In this regard, based on the projected (ideal) values presented in
Table A2, Bulgaria and North Macedonia are particularly singled out, which, in addition to increasing all outputs to the projected values, should reduce the accommodation capacity by over 120% (Bulgaria), i.e., around 100% (North Macedonia), to obtain the highest efficiency score.
Compared to other studies [
11,
12,
48,
49] that use DEA to assess the efficiency of tourism in European countries, it is noticeable that certain countries, such as Luxembourg, Malta, and Croatia, regardless of the different input and output variables used, are often among the most efficient. Based on the above, it can be concluded that the mentioned countries manage the development of tourism in a sustainable way, and can represent a good example for policymakers, and, in general, for all tourism stakeholders interested in tourism development. In the case of Luxembourg, its high efficiency score is mainly due to its very high number of international tourism receipts per arrival, which is more than six times higher than the average for European countries. Luxembourg also has a very good (low) value of the greenhouse gas intensity indicator, which is the lowest compared to other countries in the region. Malta and Croatia, compared to other countries, have very high values of the inbound length of stay variable, which is caused by the characteristics of the dominant form of tourism (coastal tourism) developed in these countries, and which represents one of the indicators for measuring the sustainability of demand. However, it would be important in future research to use some other variables to represent demand sustainability, especially considering the results of Obadić and Pehar’s research. Based on a sample of Mediterranean countries, the authors [
67] found that the country with the highest seasonality is Croatia, where 66.9% more overnight stays are recorded in the peak month (August) compared to the slowest month (January). Also, this research shows that as much as 32.77% of all nights spent in Croatia are recorded in August, compared to only 0.49% of nights spent in January, which can partly be explained by Croatia’s strong focus on coastal tourism [
67]. High seasonality, which leads to a significant influx of tourists in short intervals, significantly affects environmental quality and the quality of tourism services [
13]. Therefore, it would be particularly important to monitor, in the long term, how high seasonality affects environmental sustainability.
Bearing in mind the limitations of DEA, in that it does not allow the use of too many variables so that the method does not lose its discriminatory power, and bearing in mind the specificities of tourism in countries that have proven to be the most efficient in the largest number of studies, it is very important in future research to use some other variables to represent demand sustainability, such as, for example, the seasonality of international tourist arrivals or geographically dispersed tourism.
7. Conclusions
This research assesses the efficiency of tourism in European countries with a broader approach to sustainability, using variables representing sustainability of demand, environmental sustainability, and the socio-economic impact of tourism. Sustainable tourism is essential for the sector because, although it can stimulate the local economy and provide job opportunities, it can also lead to negative impacts, such as overuse of resources, the displacement of wildlife, and damage to local cultures. The aim of sustainable tourism is to enhance the positive impacts while minimizing the negative effects on a destination [
62].
A significant challenging issue that can be emphasized for most European countries is the very low value of the inbound length of stay variable. The short length of stay of international tourists is the result of the characteristics of a form of tourism that is predominantly developed in European countries, namely city break tourism, which, by definition, includes a short or weekend tour of the city. The exception is in Mediterranean countries, such as Malta and Croatia, where the inbound length of stay is significantly higher than the average value for European countries, which is again conditioned by the form of tourism that is predominantly developed in those countries, that is, coastal tourism. Extending the length of stay during summer is simpler, as the weather is more favorable [
68,
69]. However, previous studies have shown that these countries are characterized by some other problems of demand sustainability, such as very high seasonality.
Bearing in mind that, in order to maintain the discriminatory power of DEA, the model does not allow the use of too many variables, accordingly, it would be very useful and significant in future research evaluating the efficiency of tourism from a sustainable perspective to include a variable such as the seasonality of international tourist arrivals, which could certainly cause different efficiency scores and provide some new insights, especially when it comes to demand sustainability in the tourism sector. Sustainability of demand is one of the topics that is very current and important, especially for the region of Europe, within which there is a large number of mature destinations that face numerous problems of overtourism. High seasonality, meaning a large concentration of tourists in short periods, greatly affects the environment’s quality and the quality of tourism services [
13]. Consequently, it is crucial to observe, over the long term, how high seasonality, assessed as the proportion of international tourist arrivals during peak season against the total yearly international tourist arrivals, influences environmental sustainability. Also, apart from seasonality, it would be important to analyze other indicators of demand sustainability, such as geographically dispersed tourism. Heavily concentrated tourists in a few destinations cause negative effects, such as overcrowding, pressure on resources, and dissatisfaction of local residents.
Sustainable management of tourism demand, which maximizes benefits for local communities while reducing negative impacts like overcrowding, will be an essential part of T&T development [
15]. Investments and policies should focus on dispersing tourism to rural, natural, and secondary destinations, by enhancing infrastructure and accessibility to make them more attractive and increase their ability to host guests [
20]. The UNWTO has established strategies and measures to address issues in urban areas, including overcrowding and efficient use of a destination’s carrying capacity. Among these are the promotion of attractions and events that disperse visitors to avoid crowding in specific locations, implementing time-based dynamic pricing, determining the carrying capacity of urban regions, targeting lower-impact visitor segments, and ensuring that local communities gain from tourism [
20]. The tourism industry, which depends on efficient transportation, can greatly benefit from Mobility as a Service (MaaS), a concept that combines various transportation services into a single digital platform, providing a solution to urban mobility issues. It also helps destinations to manage tourist traffic, alleviating overcrowding and promoting sustainable tourism [
70].
In addition to challenges related to demand sustainability, some countries face serious challenges when it comes to environmental sustainability. It is noticeable and worrying that countries predominantly in Central/Eastern Europe, but also some in Southern/Mediterranean Europe, have very high GHG intensity values, which negatively affects the environment. Bearing in mind that a healthy and clean environment represents one of the most important tourist resources, the aforementioned factor can significantly threaten the environmental sustainability of these countries, which will have a negative impact on their competitiveness in the international tourism market. Consequently, decision makers in these nations should focus on enhancing environmental policies to avoid additional ecological deterioration. Employing environmental taxes for this aim can be an effective instrument [
62]. In recent times, the T&T industry’s significant impact on climate change through GHG emissions has drawn more attention and heightened worries. The industry depends on transportation, especially air travel, which is an energy-intensive and emissions-heavy form of travel that cannot be entirely substituted, releasing significant GHGs and playing a role in 8% of worldwide GHG emissions in 2019. Considering that T&T GHG emissions rose by an average of 2.5% per year during the decade prior to the pandemic, it is anticipated that comparable growth rates could re-emerge in the post-pandemic phase of T&T [
20]. Sustainable aviation fuels (SAFs) could provide one possible solution to mitigate aviation emissions, provided that the challenges and risks linked to SAFs, such as land use for biomaterial production or emissions from crop-derived SAFs in aircraft, are addressed [
20]. Nonetheless, for destinations to attain environmental sustainability, the environmental citizenship behavior of residents is just as crucial as that of visitors [
63].
To address the recognized challenges and improve the sustainability of tourism, it is essential to strategically increase the length of stay. Increasing the length of stay can be influenced by enhancing the attractiveness of the destination [
66] or by focusing marketing initiatives toward target groups [
33] that tend to stay longer, like elderly tourists [
65]. The length of stay has significant implications for sustainability. Shorter but more frequent trips lead to higher overall transport-related emissions, implying that for destinations to sustain the same guest nights and associated revenue, tourist arrivals need to rise [
33]. The length of stay is also associated with more dispersed visitor travel patterns, since longer visits enable tourists to explore regional destinations, thus spreading the economic advantages of tourism beyond major regional destinations, while also reducing the environmental impact of energy-intensive travel [
29]. The length of stay is positively associated with tourism income. There is widespread agreement that the length of stay is related to tourismexpenditure, although the average daily spending seems to decrease with longer stays [
33].
The limitations of this research are primarily associated with the applied methodology, as the outcomes of DEA models rely heavily on the sample and variables chosen [
71,
72]. Consequently, changing the number of countries included in the analysis or selecting different input or output variables would definitely impact the efficiency scores. Also, the availability of data significantly influenced the selection of the sample and variables. It is important to recognize that the efficiency scores derived from DEA are relative measures, and these results do not offer conclusive insights into the tourism efficiency of countries; they merely give a preliminary understanding of the input/output balance based on the chosen variables [
21]. Employing additional (recommended) variables could offer a more comprehensive perspective on the tourism efficiency of the countries analyzed. In future studies, it might be valuable to apply a two-stage DEA model (with the Tobit regression model in the second stage), in order to identify significant factors that influence efficiency scores.


