1. Introduction
Transportation in urban areas affects key aspects of modern societies, such as the quality of life, economic development, and environmental sustainability [
1]. Rapid urbanization and population growth have exerted significant pressure on the planning and management of urban transportation systems. Urban transportation research is critical for comprehending these complex environmental and social interactions and developing effective solutions [
1].
In this context, bibliometric analysis is a powerful tool for understanding the quantitative and qualitative characteristics of the scientific literature on urban transportation. Bibliometrics helps visualize the body of knowledge by examining the relationships between scientific publications, publication trends, most frequently cited works, and interdisciplinary collaboration [
2]. This type of analysis can help researchers and policymakers identify important issues and trends in the field of urban transportation, shaping future research and policy agenda.
Historically, urban transportation research has concentrated on the physical aspects of transportation infrastructure, as well as the performance of public transportation networks. However, in recent years, technological improvements and shifting societal requirements have prompted researchers and politicians to adopt broader approaches to this topic. This larger approach encompasses issues such as sustainable transportation regulations, Intelligent Transportation Systems, travel behavior analysis, environmental implications, and social injustice [
1]. Another key aspect of sustainable urban mobility is tackling gender disparities, social exclusion, and equity challenges, all of which are critical to meeting Agenda 2030 goals. According to research, women and underprivileged communities frequently experience severe impediments in accessing transportation systems, resulting in restricted mobility, economic disadvantages, and social marginalization [
3]. Urban transport research has traditionally focused on the physical characteristics of transport infrastructure and the performance of public transport systems. However, in recent years, technological advances and changing societal needs have led researchers and policymakers to adopt a broader perspective in this field. This broader perspective includes topics such as sustainable transport policies, intelligent transport systems, travel behavior analysis, environmental impacts, and social inequality [
1]. Another critical dimension of sustainable urban mobility involves addressing gender gaps, social exclusion, and equity issues, which are pivotal in achieving the goals of Agenda 2030. Research highlights that women and marginalized communities often face significant barriers in accessing transportation systems, resulting in reduced mobility opportunities, economic disadvantages, and social exclusion [
4]. By taking into account the unique travel habits, security concerns, and accessibility requirements of various groups, gender-responsive and -inclusive transportation design seeks to close these gaps. For example, initiatives such as improving last-mile connectivity, integrating affordable and safe public transportation, and fostering pedestrian-friendly environments can significantly reduce these inequalities. Incorporating these aspects into urban transportation systems not only promotes equity, but also ensures that sustainable mobility solutions are socially inclusive and aligned with broader Sustainable Development Goals (SDGs). Future urban mobility policies must prioritize inclusivity as a cornerstone for fostering a just and equitable transition to sustainable cities.
Bibliometric analysis provides an opportunity to examine the scientific literature on a topic in detail. It serves as a means to provide a comprehensive overview of past and current studies, visualize and map data, identify trends, shed light on future studies, and offer a distinct advantage to researchers in these respects [
5]. In this study, Biblioshiny, a web-based bibliometric analysis platform, was used to collect and process numerous academic publications in the field of urban transportation. Biblioshiny facilitates data collection, evaluation, and visualization by providing information on the chronological development of research in urban transportation, leading authors, journals, and keywords. In addition, VOSviewer, an advanced network visualization tool, has been used to create network maps showing keywords and their evolution over the years to reveal emerging trends and research themes for urban transportation researchers [
6,
7].
This thorough bibliometric analysis aims to provide readers with a comprehensive understanding of the scholarly evolution of urban transportation research. Tracing significant individuals and charting the changing boundaries of urban transportation studies reveals scholarly milestones. Beyond satisfying the curiosity of academics, this effort is poised to provide practical insights to decision-makers, policy practitioners, and researchers to solve urban transportation problems and address complex real-world challenges in urban transportation. By embarking on this bibliometric survey, the intention was to introduce readers to the rich tapestry of research in the field of urban transportation and explore the threads that connect the past, present, and future of the ever-evolving field of transportation studies.
Novelty of This Study
This study makes a unique contribution to the field of urban transportation research by conducting a comprehensive bibliometric analysis that focuses exclusively on the recent surge in research output between 2018 and 2023. Unlike previous bibliometric studies that often cover broader or more generalized timeframes, this paper highlights emerging themes, such as the integration of public health, advanced simulation tools (e.g., SUMO and ns-3), and interdisciplinary approaches to urban mobility. By combining Biblioshiny and VOSviewer to map the evolution to visualize the evolution of keywords and collaborative networks, this study provides fresh insights into global trends, research hotspots, and technological innovations that shape urban transportation research. These findings not only fill a gap in the literature, but also offer direction for researchers, policymakers, and urban planners.
The existing literature on urban transportation and sustainable mobility has primarily focused on specific regional or temporal contexts, with few comprehensive reviews providing a global perspective on recent trends and innovations. This study fills this gap by conducting a bibliometric analysis of 2000 articles published between 2018 and 2023, offering both a broad temporal overview and insights into spatial variations in the research focus.
This research paper is structured as follows.
Section 2 introduces the bibliometric analysis, research gaps, and research topics, as well as a brief overview of urban transportation.
Section 3 introduces the research strategy in terms of materials and methods.
Section 4 summarizes and evaluates the research findings, and identifies relevant research issues and trends in the field of urban transport.
Section 5 contains the discussion, while
Section 6 outlines recommendations for future research.
2. A Brief Overview of Urban Transportation
Urban transportation and urban mobility are critical areas of study that address the complex interactions between infrastructure, societal needs, and technological advancements within urban settings. The evolving dynamics of urban transportation systems and mobility patterns are influenced by various factors including population growth, environmental concerns, and technological innovation.
Urban transportation systems encompass a range of modes including public transit (buses, trams, and subways), private vehicles, bicycles, and pedestrian pathways. The efficiency and sustainability of these systems are paramount in addressing urban congestion, pollution, and accessibility issues.
Newman and Kenworthy [
8] highlighted the importance of integrating land use and transportation planning to promote sustainable urban development. They contend that compact city layouts, when backed by effective public transportation, may drastically reduce the use of private automobiles, which will reduce greenhouse gas emissions and ease traffic.
Public transit systems are also essential for ensuring equitable access to urban amenities. Litman [
9] emphasized the role of public transportation in enhancing social equity by providing affordable mobility options for all socioeconomic groups. Furthermore, comprehensive public transit networks can mitigate the adverse environmental impacts associated with urban transportation by reducing the overall number of vehicle miles traveled (VMT). The effectiveness of public transit is often measured based on its coverage, frequency, and reliability. Cervero [
10] explored the concept of transit-oriented development (TOD), where residential and commercial areas are designed to maximize access to public transportation, thereby encouraging higher transit ridership and reducing dependence on private cars.
In addition, the advent of technological innovation has significantly transformed urban mobility. The rise of smart mobility solutions, such as electric vehicles (EVs), autonomous vehicles (AVs), and shared mobility services (ride hailing and bike sharing), presents both opportunities and challenges for urban transportation systems. Gonzalez et al. [
11] highlight the potential of EVs to reduce urban air pollution and dependence on fossil fuels. However, they also highlight the need for an adequate charging infrastructure and the integration of renewable energy sources to maximize the environmental benefits of EVs. However, the transition to autonomous vehicles (AVs) is not without challenges, particularly during the mixed-use phase, when both AVs and conventional vehicles coexist on roads. This transitional state can limit the realization of AV-related benefits, such as reduced congestion and enhanced safety, owing to the potential conflicts between human-driven and autonomous vehicles. Effective policies, infrastructure adaptations, and public awareness initiatives are necessary to mitigate these challenges and facilitate the integration of AVs into existing transportation systems.
Xie, Gou, and Gui [
12] underscore the positive impact of EV adoption on urban air quality improvement, particularly in regions like Wuhan, where electrification policies have been implemented. Similarly, Tao [
13] highlighted the dynamic relationship between EV uptake and green development, arguing that local government competition plays a crucial role in accelerating EV adoption while ensuring its alignment with sustainable urban policies. Autonomous vehicles are expected to revolutionize urban mobility by enhancing safety, reducing traffic congestion, and improving the efficiency of transportation networks. However, their widespread adoption requires substantial advancements in technology, regulatory frameworks, and public acceptance [
14]. In their systematic review, Olayode et al. [
15] examined the applications, impacts, and public perceptions of AVs, noting that, while AVs hold significant promise, their deployment must address challenges related to infrastructure, ethical considerations, and societal readiness. Shared mobility services have gained popularity because of their convenience and cost-effectiveness. Shaheen et al. [
16] examine the impacts of ride-hailing and car-sharing services on urban transportation, noting that, while these services can complement public transit and reduce the need for private car ownership, they can also contribute to increased VMT and traffic congestion if not properly managed. Furthermore, the environmental and social impacts of urban transportation systems are significant considerations in planning and policymaking. Banister [
17] emphasizes the need for a paradigm shift towards sustainable mobility, which prioritizes walking, cycling, and public transit over private car use. This shift could lead to reduced emissions, improved public health, and enhanced urban livability. Equitable access to transportation is crucial for fostering inclusive urban environments. Grengs [
18] explores the concept of “transport justice”, advocating for transportation policies that address the needs of marginalized communities and ensure the fair distribution of mobility resources.
Moreover, the future of urban transportation and mobility lies in the integration of innovative technologies, sustainable practices, and inclusive policies. The overall effectiveness and user experience of urban mobility systems can be improved by the creation of multimodal transportation networks that seamlessly link different forms of transportation [
19].
Recent studies have introduced graph neural networks (GNNs) as a promising approach to urban transportation modeling. Li et al. [
20] proposed an end-to-end heterogeneous graph neural network for traffic assignment, which enables the better prediction and allocation of traffic flow in complex urban networks. Similarly, Zhang et al. [
21] utilized GNNs for nationwide human mobility prediction and demonstrated the efficacy of these methods in capturing human movement patterns and predicting future mobility trends. These advancements reflect the increasing use of deep learning techniques to address the challenges of urban mobility and enhance the accuracy and efficiency of transportation systems [
20,
21]. These research papers represent state-of-the-art (SOTA) methodologies in urban transportation studies, highlighting cutting-edge approaches for managing complex traffic and mobility data with high precision.
Recent advances in neural network applications have further transformed urban mobility research by enabling more accurate traffic prediction, route optimization, and real-time decision making. In particular, deep learning approaches such as graph neural networks have proven effective in capturing the complex spatial and temporal dependencies within urban transportation networks. For instance, Liu and Meidani [
22] demonstrated that end-to-end heterogeneous graph neural networks can significantly enhance traffic assignment accuracy by modeling intricate urban network dynamics, thereby offering promising improvements in efficiency and sustainability. This integration of neural network methodologies into urban mobility planning represents a pivotal step toward smarter transportation systems that can dynamically respond to real-world challenges.
In summary, urban transportation and mobility are dynamic fields influenced by technological advancements, environmental considerations, and social equity issues. Effective planning and policymaking, supported by continuous research and innovation, are essential for the development of sustainable and inclusive urban transportation systems. Thus, conducting a thorough bibliometric analysis of urban transportation and mobility is pivotal for understanding the underlying mechanisms and trends that shape these concepts.
2.1. Bibliometric Analysis
Bibliometric analysis is a valuable method for monitoring research trends and tracking discoveries across various fields. For instance, Demir et al. [
5] utilized the Scopus search engine to review studies on sensitivity analysis in multi-criteria decision making (MCDM). They analyzed 1374 articles using VOSviewer (version 1.6.18), Biblioshiny (version 4.1.3), and Citespace (version 6.3.R1 Basic). Twinomurinzi and Mageto [
23] conducted a bibliometric review of smart mobility research by examining 3223 documents from the Web of Science Core Collection with the help of VOSviewer and CiteSpace. They emphasized the integration of advanced technologies, such as IoT and AI, in transportation systems. Additionally, Ceccato et al. [
24] analyzed 245 articles on passenger safety in public transportation systems using VOSviewer, providing insights into safety concerns in railway transportation. Moreover, Mirabi and Noorid [
25] recently carried out a bibliometric study to examine current research trends and patterns in the spheres of urban mobility and transportation planning. Utilizing the Scopus database, they accumulated a dataset comprising 1255 publications spanning from 1995 to 2021. VOSviewer and the Bibliometrix R-package were employed to conduct an analysis, visualizing and charting co-authorship networks, citation trends, and keyword co-occurrences. Their research underscores the substantial increase in publications and identifies the key authors, institutions, and collaborative networks operating in these areas. While Mirabi and Noorid [
25] provided valuable insights into urban mobility and transportation planning, their analysis primarily spans from 1995 to 2021. By contrast, this study focuses on the more recent period of 2018–2023, capturing emerging trends and innovations in the field, particularly in the context of sustainable mobility and smart transportation solutions. Additionally, this study delves deeper into thematic clusters and research gaps, providing a more targeted perspective on advancements that shape contemporary urban mobility research. Finally, Zhiyou Long [
26] performed a comprehensive bibliometric analysis on how urban-built environments impact travel behavior using 1745 publications from the Web of Science database, identifying key research clusters and trends, and highlighting the significant contributions from institutions in the USA and China. The author used network analysis and content analysis tools, such as VOSviewer.
These studies showcase the diverse applications of bibliometric analysis for understanding and advancing urban mobility and transportation planning. Each study utilized comprehensive datasets and sophisticated software to reveal trends, identify research gaps, and suggest future research directions.
2.2. Research Gaps and Research Questions
A comprehensive review of existing academic papers in the field of urban transportation revealed critical research needs.
In this study, quantitative tools, such as Bibliometrix, Biblioshiny, R software with a web-based interface, and VOSviewer, were used to design a bibliometric analysis for articles related to urban transportation in the field of social sciences, engineering, and environmental sciences in the Scopus database. This study established a conceptual framework for urban transportation publications and identified the most influential articles and prolific contributors to the field. These results provide valuable insights for transportation researchers, helping them understand current and future research trends. The main objective of this research was to find answers to the following questions.
What is the trajectory of the growth and citation trend status of articles on urban transportation?
Who are the most cited major authors in the field?
What are the most cited publications, journals, organizations, and countries?
What are the priority research points and key topics in related applications in the field of urban transportation?
This study can help urban transportation researchers understand current and future research trends and, thus, design more innovative and creative research by revealing the conceptual richness of urban transportation studies.
3. Materials and Methods
In the first step, the Scopus database was chosen for the research. In the second step, the keywords used were urban transportation, document type: article, publication language: English, publication type: journal, and publication year: 2018–2023. Reviews, conference proceedings, book chapters, articles or reviews, and commentaries published on preprint websites, editorials, and letters were excluded. Step three involved conducting performance and mapping analyses. In the fourth step, Biblioshiny and VOSviewer were utilized.
Evaluation Metrics
We employed several standard evaluation metrics commonly used in bibliometric studies to ensure the robustness and validity of the bibliometric analysis. These include the following.
Annual Growth Rate (AGR): We calculated the AGR of publications from 2018 to 2023 to assess the overall growth in research output in the field of urban transportation. AGR was computed as the percentage change in the number of publications each year compared to the previous year, providing insights into the trends and dynamics of the field.
Citation Analysis: We assessed the impact of individual articles, journals, and authors by analyzing citation counts. This metric helped helps evaluate the influence and relevance of the research within the field. We also identified the most cited articles to highlight their key contributions to the literature.
Co-authorship and Collaboration Patterns: The level of international collaboration was evaluated by tracking co-authorship across different countries and institutions. This metric revealed the extent of interdisciplinary and international cooperation in urban transportation research.
Keyword Co-occurrence and Clustering: We used VOSviewer to analyze the co-occurrence of keywords, allowing us to identify research clusters and emerging themes. This approach aids in visualizing the evolving focus areas within urban transportation research, such as sustainable mobility, smart cities, and transportation efficiency.
On the other hand, considering the strengths of different approaches, bibliometric analysis tools, such as Biblioshiny, VOSviewer, and keyword analysis, were employed.
Biblioshiny: This platform was utilized to collect and analyze a large dataset of urban transportation publications. It provides a user-friendly interface for data visualization and in-depth bibliometric analysis, including citation analysis, author and journal impacts, and publication trends.
VOSviewer: This tool enabled the creation of network maps of co-occurring keywords, which allowed us to identify thematic clusters in urban transportation research. It also enabled us to track the evolution of these themes over time, highlighting the emerging focus on public health, walkability, and simulation-based approaches, such as SUMO and ns-3.
Keyword Analysis: Using VOSviewer, we conducted a keyword co-occurrence analysis to explore the relationships between terms. We categorized the keywords into two primary clusters: sustainable urban mobility (e.g., urban mobility, smart cities) and motor transportation efficiency (e.g., travel time, vehicles, and intelligent systems). This clustering approach revealed the dual focus of current urban transportation research: promoting sustainability and optimizing transportation efficiency.
By providing further details on these evaluation metrics and methodological approaches, we hope to strengthen the overall analysis in this study.
4. Results of Bibliometric Analysis of Publications on Urban Transportation
4.1. Performance Analysis
A comprehensive descriptive analysis of publications was conducted, as well as an assessment of the annual publication growth rate and an estimate of the average number of citations per publication. A graph, commonly referred to as a Sankey diagram, was used to compare three separate areas, such as determining which journal has the most publications and citations and which organization and document have the most publications and citations. In addition to data performance analysis, this study also identified and evaluated authors and countries with the highest output in terms of publications and citations.
4.1.1. General Overview of the Database
A descriptive analysis of studies in the field of urban transportation was conducted using Biblioshiny.
Figure 1 shows the main information in the data file.
Between 2018 and 2023, 2000 articles on urban transportation from 617 sources (journals) in the Scopus database were evaluated. Publications increased by 31.32% annually; the average age of publications was 2.92 years, and each received an average of 12.19 citations. Among the 5609 authors, 204 published single-author papers. The proportion of international co-authorships in the documents was 30.15%.
4.1.2. Annual Increase in Publications
Figure 2 illustrates shows the evolution of documents over time in the bibliometric analysis of research in the field of urban transportation.
According to
Figure 2, there has been growing interest in urban transportation analysis by scientists worldwide. Although the number of publications fluctuated over time, it showed an overall upward trend. There were 453 publications in 2023, 420 in 2022, 432 in 2021, 337 in 2020, 242 in 2019, and 116 in 2018. Notably, 2023 recorded the highest increase in research on urban transportation.
4.1.3. Average Annual Citations
Figure 3 shows the status of the annual citations in the bibliometric analysis, focusing on urban transportation research. In
Figure 3, the column called “MeanTCperArt” refers to “Mean Total Citations per Article”, which represents the average number of citations received by each article in the dataset over the entire study period. Essentially, this is the total number of citations divided by the total number of articles. Furthermore, the column called “MeanTCperYear” in
Figure 3 refers to the “Mean Total Citations per Year”. This metric calculates the average number of citations per article per year, normalized for the varying lengths of time articles have been available to accumulate citations, providing a more time-sensitive perspective on citation impact.
4.1.4. Sankey Diagram
The three parameters to be associated (country, author, and keyword) are specified by the software Rstudio-Bibliometrix-Biblioshiny (version 4.1.3) in this “Three Field Plot” layout;
Figure 4 highlights the most important ones for each parameter.
The box sizes in
Figure 4 show the strength of the relationship between the components. The size of the boxes in this graph corresponds to the influential aspects of the literature. The leading country is “China”, the leading author is “Liu Y.”, and the leading keyword is “urban mobility”.
Specifically, the large box representing China indicates not only its dominant publication volume, but also its central role in international collaborations within urban transportation research. Similarly, the prominence of Liu Y. highlights his influential contributions, which have shaped many of the emerging trends in the field. The substantial size of the ’urban mobility’ keyword box underscores a growing research focus on sustainable and integrated transportation systems, reflecting shifts in policy and technological innovation. These visual insights help to pinpoint key drivers of the literature and suggest potential directions for future research in urban mobility.
4.1.5. Most Cited and Most Published Journals
Table 1 presents the ranking of urban transportation publication sources based on the number of publications.
According to
Table 1, “Sustainability (Switzerland)” ranks first with 200 articles, followed by “IEEE Transactions on Intelligent Transportation Systems” with 48 articles and “Journal of Transport Geography” with 45 articles.
Table 2 highlights the ranking of urban transportation publication sources based on citations to publications.
According to
Table 2, “Sustainability (Swıtzerland)” ranks first with 1347 citations. “Journal of Transport Geography” follows with 865 citations, and “Transport Policy” ranks third with 844 citations.
4.1.6. Most Important Connections
Table 3 shows the studies published in the field of urban transportation by the institutions or affiliated organizations of the authors participating in the study.
“Southeast University” ranked first with 85 publications between 2018 and 2023, while “Aristotle University of Thessaloniki” ranked second with 62 publications and “Massachusetts Institute of Technology” ranked third with 60 publications.
4.1.7. Frequently Cited Authors by Number of Publications
A total of 2000 research papers on urban transportation were published by 5609 authors in different publications.
Figure 5 highlights the most influential authors in terms of their publications worldwide.
Several authors have made significant contributions to urban mobility and transportation research. Yaqi Liu, associated with ORCID ID 0000-0002-2296-165X, has authored 16 articles, focusing on areas such as vehicle group dynamics in urban road networks. Sotirios Basbas, affiliated with the Aristotle University of Thessaloniki, Greece, has published 14 articles, with research interests including the effects of the COVID-19 pandemic on bike-sharing systems. Yongxin Liu, holding ORCID ID 0000-0003-4527-8623, serves as an Assistant Professor of Mathematics at Embry–Riddle Aeronautical University in Daytona Beach, Florida, and has contributed 14 articles related to urban mobility. Jian Wang, with 13 publications, has explored topics such as reverse reconstruction methods of vehicle group situations in urban road networks. Extensive research by these authors has significantly advanced our understanding of urban transportation systems. Therefore, Liu Y ranks top with 16 articles, Basbas S and Wang Y rank second with 14 articles, and Wang J ranks third with 13 articles. The prominence of authors like Liu Y, who leads with 16 publications, reflects the concentrated research efforts in regions or institutions with strong academic contributions. By highlighting these leading authors, bibliometric analysis emphasizes key figures that drive the conversation in sustainable urban mobility. This information is not only valuable for researchers seeking to identify potential collaborators, but also for those looking to stay at the forefront of emerging trends and groundbreaking studies in the field.
4.1.8. Most Productive Countries
The countries with the highest numbers of publications are given in
Figure 6.
On the map (
Figure 6), dark blue represents China, blue represents countries like India, Serbia, Iran, Turkey, the USA, and the UK, and gray represents countries with no publications. As shown in
Figure 6, China has the highest number of publications (803). China was followed by Brazil (701), the USA (559), and Italy (512).
The most cited countries are listed in
Table 4.
As shown in
Table 4, the USA has the highest number of citations (2697), followed by China (2285), Spain (1886), and Italy (1829).
Figure 7 shows the global cooperation map.
Countries with strong connections are more likely to collaborate. In the field of urban transportation, China cooperates with the USA, the United Kingdom, Hong Kong, Singapore, and Australia. The USA collaborates with the United Kingdom, Italy, and Singapore, while Brazil cooperates with the USA, and Germany collaborates with the Netherlands. It can be inferred that China is the country with the most international collaborations.
4.1.9. Most Cited Document
The most productive paper is the most cited paper.
Table 5 lists the 10 most productive articles.
The most cited article is “Effects of the COVID-19 Lockdown on Urban Mobility: Empirical Evidence from the City of Santander (Spain)” by Aloi et al. (2020), published in Sustainability with 329 citations. This article is followed by “A Deep Reinforcement Learning Network for Traffic Light Cycle Control”, published in IEEE Transactions on Vehicular Technology by Liang et al. (2019) with 305 citations. The third most cited article is “Process Safety and Environmental Impacts of COVID-19 on Public Transport Ridership in Sweden: Analysis of Ticket Validations, Sales, and Passenger Counts” by Jenelius and Cebecauer (2020), published in the journal Transportation Research Interdisciplinary Perspectives with 280 citations. In this way, Teixeira and Lopes (2020) ranks 4th with 278 citations, Dembski et al. (2020) 5th with 201 citations, Faisal et al. (2019) 6th with 190 citations, Lyons (2018) 7th with 171 citations, Campisi et al. (2020) 8th with 168 citations, Ma et al. (2018) 9th with 162 citations and Mouratidis and Papagiannakis (2021) 10th with 143 citations.
4.2. Analysis of Science Mapping
Scientific mapping employs computer tools to visualize, analyze, and simulate various scientific and technological processes.
4.2.1. Conceptual Structure Map
This section shows the conceptual structure map, the network map based on the author’s keywords, and the theme map. The conceptual structure map is shown in
Figure 8.
The red and blue clusters in
Figure 8 illustrate the results of a conceptual structural analysis based on a factor analysis of keywords in urban transportation research. Each cluster corresponded to a distinct thematic grouping of related concepts and ideas, as identified by their significant high factor loads along two primary dimensions. The red cluster focuses on keywords associated with sustainability and innovative urban mobility solutions, such as “urban mobility”, “smart city”, and “bicycles”, emphasizing themes like eco-friendly transportation, technological integration, and active travel modes. In contrast, the blue cluster group keywords focused on the efficiency and functionality of motorized transportation systems, including “travel time”, “vehicles”, and “intelligent systems”. These clusters reflect the dual focus of urban transportation research on advancing sustainability (red cluster) and optimizing motorized transportation efficiency (blue cluster). This approach offers a holistic understanding of the field’s conceptual structure. Lastly, the green cluster represents a weaker thematic grouping involving vague terms, such as “article” and “human”.
When the keywords of publications in the field of urban transportation were analyzed using factor analysis, certain ideas emerged within the red cluster with high factor loads in the first dimension. Keywords such as “urban mobility”, “smart city”, “urban area”, “bicycles”, and “travel behavior” are collected here. Keywords such as “intuitive motor transportation”, “travel time”, “vehicles”, and “intelligent systems” are gathered in the blue cluster.
In this sense, let us delve into the significance of each keyword, especially within the context of urban planning and development.
To begin with, in the context of the red cluster, it is essential to mention that “urban mobility” refers to the efficient and effective movement of people and goods within urban areas. It is crucial for the functioning of cities, affecting economic productivity, quality of life, and environmental sustainability. Efficient urban mobility systems reduce congestion, lower emissions, and improve accessibility to various urban services [
27]. On the other hand, a “smart city” utilizes digital technologies and data to improve urban services and infrastructure. This includes various applications, from traffic management to energy distribution, aimed at enhancing the quality of life for residents while promoting sustainability [
28]. Smart cities integrate various ICT (Information and Communication Technology) tools to optimize urban mobility, making transportation systems more efficient and responsive to real-time conditions. Additionally, an “urban area” is a region characterized by high population density and vast human-built features compared to surrounding areas. Understanding the dynamics of urban areas is essential for planning and implementing effective mobility solutions. Urban areas are the primary focus for developing smart city initiatives and enhancing urban mobility [
29]. Furthermore, “bicycles” represent a sustainable and efficient mode of urban transport. Promoting bicycle use in urban areas can reduce traffic congestion, lower greenhouse gas emissions, and improve public health. Bicycle infrastructure is often a key component of smart city strategies to promote eco-friendly and active modes of transport [
30]. In addition, “travel behavior” refers to the study of how individuals make decisions about their travel, including modes of transport, travel times, and routes. Understanding travel behavior is critical for designing effective urban mobility systems and policies. Analyzing travel behavior helps in forecasting demand, planning infrastructure, and implementing policies that encourage sustainable travel choices [
17].
Secondly, in the context of the blue cluster, it is crucial to indicate that “motor transportation” encompasses the use of motor vehicles such as cars, trucks, buses, and motorcycles for the movement of people and goods. It is the backbone of modern urban mobility, essential for economic activities and daily commuting. However, it also contributes significantly to urban challenges like congestion, air pollution, and greenhouse gas emissions [
31]. Moreover, “travel time” refers to the duration spent moving from one location to another. It is a critical factor in transportation planning and policymaking because it affects productivity, quality of life, and economic efficiency. Reducing travel time through efficient transportation systems can significantly enhance urban living and economic performance [
32]. Also, “vehicles” are the primary means of motor transportation, playing a crucial role in urban mobility by facilitating the movement of people and goods. However, high reliance on personal vehicles can lead to traffic congestion, pollution, and increased demand for parking spaces [
9]. Moreover, “intelligent systems” in transportation refer to the application of advanced technologies and data analytics to improve the efficiency, safety, and sustainability of transportation networks. This includes Intelligent Transportation Systems (ITSs), which utilize real-time data, automated control systems, and communication technologies to enhance traffic management, reduce congestion, and optimize travel times [
33].
4.2.2. Thematic Map
The clusters in the motor theme section of the diagram represent the clusters belonging to the most basic fields of study of the keyword under study. The clusters in the core theme section of the diagram indicate clusters where the keyword of interest is fundamental and in a state of transformation, i.e., continuing to evolve. The emerging or declining theme section of the diagram illustrates newly emerging or declining keywords, while the niche theme represents keywords that are the focus of significant work but remain isolated from other studies. Therefore, to understand which scientific studies belong to which themes and which ones are at the forefront of the keyword under consideration, it is necessary to consider the basic theme and motor theme sections of the diagram.
A thematic review of urban transportation articles was conducted using bibliometrics and author’s keywords to identify the main review topics of the field.
Figure 9 shows that studies in the field of urban transportation are grouped under four themes, albeit with different intensities
The four categories in
Figure 9—“Niche Themes”, “Motor Themes”, “Emerging or Declining Themes”, and “Basic Themes”—represent distinct thematic classifications of research topics in urban transportation based on their centrality and density. “Niche Themes” are highly specialized topics with limited connections to the broader field, often representing advanced focused research areas that contribute to specific aspects of urban transportation. “Motor Themes” are well-developed and influential topics that are both highly central and dense, forming the core of the field’s research and driving significant scientific progress. “Emerging or Declining Themes” are topics with low centrality and density, indicating areas that may be in the early stages of development or experiencing a decline in scholarly interest. Lastly, “Basic Themes” are foundational topics with high centrality but lower density, serving as the bedrock of the field and encompassing broad general concepts that support various subfields. This categorization provides valuable insights into the current state and evolution of urban transportation research.
Considering the author’s keywords, keywords such as “urban transport”, “mobility, public transport”, “urban mobility”, and “traffic congestion” come to the fore in scientific studies. Let us explore the importance of each of these keywords within the context of urban transportation and mobility. From this point of view, “urban transport” encompasses all modes of transportation used within urban areas, including public transit, private vehicles, cycling, walking, and emerging modes like shared mobility services. It is essential for facilitating the movement of people and goods within cities, supporting economic activities, and ensuring access to services and opportunities. Effective urban transportation systems are critical for reducing traffic congestion, minimizing environmental impact, and enhancing the quality of urban life [
31]. Additionally, “mobility” refers to the ability of individuals and goods to move seamlessly and efficiently from one place to another. In urban contexts, mobility is a critical factor influencing economic productivity, social inclusion, and overall quality of life. Enhancing mobility entails optimizing transport infrastructure, services, and policies to ensure people can access jobs, education, healthcare, and other essential services with ease and minimal delay [
17]. Moreover, “public transport” includes systems such as buses, trams, trains, and subways that provide shared transportation services to the public. It is a crucial component of urban transportation systems, offering an efficient and sustainable alternative to private car use. Public transportation can help reduce traffic congestion, lower emissions, and provide affordable mobility options for all urban residents, including those who cannot afford or choose not to use private vehicles [
10]. Moreover, “urban mobility” is the broader concept encompassing all forms of movement within urban areas, including public transport, private vehicles, cycling, and walking. It involves the interplay of various modes of transport and infrastructure to ensure efficient, sustainable, and inclusive movement of people and goods. Enhancing urban mobility requires integrated planning and policies that address the diverse needs of urban populations and promote sustainable transport options [
34]. Furthermore, “traffic congestion” occurs when there is an excess demand for road space, leading to slower speeds, longer trip times, and increased vehicular queuing. It is a significant challenge in urban areas, contributing to air pollution, economic losses, and reduced quality of life. The effective management of traffic congestion involves strategies such as improving public transport, implementing traffic management systems, and encouraging alternative modes of transport like cycling and walking [
35].
4.2.3. Trending Topics
The trending topics in the literature in the field of urban transportation from 2018 to 2023 are given in
Table 6.
According to
Table 6, “Urban transport” was the top trending topic in the first quarter of 2020, the second quarter of 2021, and the third quarter of 2022. “Mobility” was also a hot topic in the same periods. Currently, “COVID-19, vehicles, autonomous vehicles, and reinforcement learning” are the top trending topics in this area.
4.2.4. Keyword Co-Occurrence Analysis
Keywords, serving as descriptive terms or phrases for an article, significantly influence the prominence of its statements. To visualize the interconnectedness of research findings, we employed VOSviewer to analyze the co-occurrence of keywords within the study and its broader knowledge base. This analysis yielded a comprehensive list of 5796 keywords extracted from the indexed terms associated with the article. As shown in
Figure 10, 235 keywords were considered for review after increasing the threshold setting in the VOSviewer application to three.
A different set of keywords is created with each color. In
Figure 10, each circle represents the presence of a specific term and sub-domain of urban transportation in the transportation domain. A circle with a similar color represents the distribution in a comparison region. The largest cluster, by the number of elements, is called “urban mobility”. This cluster contains keywords such as the AHP, simulation, and a GIS. The second-largest cluster is named “smart cities”. It contains keywords such as traffic congestion, VANET, and SUMO. The third-largest cluster is called “mobility” and includes keywords such as informality, transitions, governance, and city.
Leveraging AHP, Simulation, and GIS for Enhanced Urban Mobility Planning
Here is an explanation of the importance of the AHP, simulation, and a GIS in the context of urban mobility according to the largest cluster. Within this scope, firstly, the Analytic Hierarchy Process (AHP) is a decision-making framework that helps prioritize and evaluate various aspects of urban mobility. It involves breaking down complex decisions into a hierarchy of simpler problems and comparing them pairwise to derive priority scales. The AHP helps in making informed decisions about urban mobility infrastructure by weighing factors such as cost, environmental impact, and social benefits [
36]. For example, it can prioritize where to invest in new public transit routes versus road expansions. Policymakers use the AHP to evaluate and compare different transportation policies’ potential impacts, helping ensure that the chosen policies align with broader urban planning goals [
37]. The process involves various stakeholders, ensuring that multiple perspectives are considered, leading to more balanced and accepted decisions [
38].
Secondly, simulation techniques enable the creation of virtual urban mobility systems, providing a platform to assess and forecast the consequences of various scenarios. By employing simulation models, researchers can gain valuable insights into traffic flow dynamics, identify potential congestion hotspots, and evaluate the impact of proposed interventions, such as adjustments to traffic signal timings or modifications to road networks [
39]. For example, cities can simulate the impact of a new traffic signal system before implementation. They are critical for planning emergency evacuations by modeling various disaster scenarios and optimizing evacuation routes [
40]. Simulations can optimize public transportation schedules, routes, and capacities, ensuring efficient service and reducing wait times [
41].
Thirdly, Geographic Information Systems (GISs) play a pivotal role in collecting, managing, and analyzing spatial data pertinent to urban mobility. A GIS is essential for optimizing route planning across different transportation modes by incorporating real-time traffic data and geographic insights. [
42]. For instance, it helps in designing bus routes that minimize travel time and maximize coverage. A GIS aids in the maintenance and management of urban infrastructure by providing precise geographical data on roads, bridges, and public transit networks [
43]. A GIS enables the evaluation of environmental impacts by analyzing spatial data on air quality, noise pollution, and green spaces. This capability is vital for promoting sustainable urban mobility planning [
44].
Temporal Dynamics and Emerging Trends in Urban Mobility Keywords
In addition to these studies, the keywords “overlay visualization” were colored differently based on the year of publication using the VOSviewer program, which also allowed for the determination of the time intervals in which they appeared in the literature [
45]. In our illustration, 2020 is the typical (yellow) year when newly added terminology was published. The amount of time that had passed since the items’ publication determined their colors.
Figure 11 displays the blue–green–yellow color range, covering the period from May 2020 to early 2022.
While previously used keywords such as “passenger transport”, “walking”, and “big data” were the keywords intensively studied in the period from May 2020 to early 2021, it can be said that keywords such as “public health”, “walkability”, “SUMO”, and “ns-3” have just started to be used in the literature.
In this context, it is essential to briefly explain the popularity of the keywords “passenger transport”, “walking”, and “big data” in urban mobility. To begin with, passenger transportation systems—including public transit, taxis, and ride-sharing services—are essential for moving large numbers of people efficiently within urban areas. With growing urban populations, the need for effective passenger transport solutions has increased significantly [
41]. Public transportation reduces traffic congestion and lowers carbon emissions, contributing to environmental sustainability [
9]. Secondly, walking is a fundamental mode of transportation that offers significant health and environmental benefits. Walking improves physical health and reduces the risk of various diseases [
46]. It is also the most eco-friendly mode of transport, helping reduce reliance on motor vehicles and lowering pollution levels [
47]. Thirdly, big data involves the analysis of vast datasets to improve urban mobility systems. Big data analytics provides insights into traffic patterns and commuter behavior, aiding in better decision making [
48]. It allows for the real-time monitoring and management of transportation networks, enhancing operational efficiency [
49]. In summary, “passenger transport”, “walking”, and “big data” are popular in urban mobility due to their contributions to efficiency, sustainability, health, and informed decision making, which are crucial for developing modern and resilient urban transportation systems.
New Dimensions in Urban Mobility: Integrating Health, Walkability, and Advanced Simulations
In addition to the definition of the important terms mentioned earlier, here is a short explanation of the newly emerging concepts in the literature known as “public health”, “walkability”, “SUMO”, and “ns-3”, particularly within the context of urban mobility. To begin with, public health refers to the science and practice of protecting and improving the health of communities through education, policymaking, and research for disease and injury prevention. Effective urban mobility strategies can significantly enhance public health by reducing pollution, promoting physical activity, and decreasing traffic-related injuries [
50]. Secondly, walkability refers to how friendly an area is to walking, which depends on factors like the presence of sidewalks, safety, and the proximity of amenities. High walkability is associated with better health outcomes, reduced traffic congestion, and increased social interaction [
51]. Thirdly, SUMO (Simulation of Urban Mobility) is an open-source, highly portable, microscopic, and continuous road traffic simulation package designed to handle large road networks. It is used to simulate and analyze traffic patterns, optimize traffic light settings, and test new mobility concepts [
52]. SUMO is widely recognized in urban transportation research for enabling the evaluation of transportation system performance under varying conditions, such as changes in infrastructure, traffic demand, or policy interventions. In the context of urban transportation research, SUMO is used in the following ways.
Optimize traffic flow: By simulating different traffic scenarios and optimizing signal timings, urban planners can reduce congestion and improve the efficiency of transportation networks.
Assess sustainability: SUMO allows for the evaluation of environmental impacts, such as vehicle emissions, which is essential for studying sustainable urban mobility.
Test policy measures: SUMO provides a platform to model the effects of different policies, such as congestion pricing, on travel behavior and overall system efficiency.
The adoption of SUMO in academic and professional studies highlights the increasing reliance on simulation-driven methods in urban transportation planning. These approaches offer a versatile and economical means to evaluate intricate urban settings before applying practical solutions. Consequently, SUMO is integral to facilitating informed decisions aimed at achieving intelligent and sustainable urban mobility systems.
New Horizons in Urban Mobility: Enhancing Community Health and Digital Innovation
Lastly, ns-3 (Network Simulator 3) is a discrete-event network simulator for Internet systems, targeted primarily for research and educational use. It is widely used to simulate and study the performance of network protocols and Internet systems, including those related to vehicular communications and Intelligent Transportation Systems (ITSs) [
53]. However, its application has expanded into urban transportation research, particularly in studies that explore the interaction between transportation systems and communication networks, such as ITSs. The significance of ns-3 in urban mobility research lies in its ability to achieve the following.
Simulate communication networks in ITSs: ns-3 can model the exchange of data between vehicles (vehicle-to-vehicle, V2V) and between vehicles and infrastructure (vehicle-to-infrastructure, V2I). This capability is essential for the development of connected vehicle technologies and autonomous driving systems, which are central to the future of urban mobility.
Evaluate traffic management systems: ns-3 is a valuable tool for simulating and optimizing traffic management protocols that depend on real-time communication to enhance safety and efficiency. For instance, it can model dynamic traffic signal controls or real-time traffic monitoring systems to test and refine their performance under various scenarios.
Assess the impact of communication delays: With communication networks being integral to modern transportation systems, ns-3 allows researchers to investigate how network delays or failures affect urban mobility solutions. This is especially critical for evaluating system performance during congestion or emergencies.
By emphasizing the increasing synergy between transportation systems and communication technologies, ns-3 empowers researchers to tackle the complexities of incorporating digital innovations into transportation infrastructure. Its application becomes ever more pertinent as cities aim to develop smarter, more interconnected, and more efficient urban mobility systems.
In summary, public health, walkability, SUMO, and ns-3 are important terms in urban mobility due to their focus on improving community health, enhancing pedestrian-friendly environments, simulating traffic patterns, and analyzing network performance, respectively.
4.3. From Descriptive Statistics to Meaningful Insights
The descriptive statistics provided in this section highlight significant trends and emerging themes in urban transportation research. The observed increase in keywords such as “autonomous vehicles”, “SUMO”, and “reinforcement learning” aligns with the technological evolution of the transportation sector, emphasizing the growing importance of simulation and machine learning tools. These advancements enable researchers and practitioners to model complex systems, optimize traffic flow, and evaluate sustainable transportation strategies with greater precision.
Furthermore, the prominence of keywords like “public health” and “walkability” indicates a paradigm shift in urban planning toward more people-centric and health-conscious design approaches. This trend reflects the increasing recognition of mobility as a determinant of public health, urging policymakers to prioritize pedestrian infrastructure, reduce vehicle dependency, and promote active travel modes.
These findings offer practical insights for urban planners and policymakers. For instance, the prominence of the keyword cluster “urban mobility”, encompassing terms such as “AHP”, “GIS”, and “simulation”, highlights the critical role of multi-criteria decision-making tools and spatial data analysis in designing efficient, sustainable, and inclusive transportation systems. Policymakers are urged to integrate these tools into their evaluation of various transport policies and investment decisions.
Additionally, the analysis underscores the continued influence of topics like “COVID-19” on urban mobility research, demonstrating how global disruptions can reshape transportation dynamics. These insights lay the groundwork for further investigation into the interplay between technology, public health, and sustainability in defining the future of urban mobility.
5. Discussion
5.1. Bibliometric Analysis of Urban Transportation Publications
This study utilized Biblioshiny, a web-based platform for bibliometric analysis, to gather and analyze a large volume of academic publications in the urban transportation field. Biblioshiny enables data collection, assessment, and visualization, offering insights into the chronological progression of urban transportation research, prominent authors, journals, and keywords. Additionally, VOSviewer, a sophisticated network visualization tool, was employed to construct network maps illustrating keyword trends and their evolution over time, unveiling emerging research themes and trends in urban transport. The comprehensive bibliometric analysis aimed to offer readers an extensive overview of the academic advancement of urban transportation studies. In this context, between 2018 and 2023, this study evaluated 2000 articles on urban transportation from 617 journals in the Scopus database. The number of publications increased by an average of 31.32% annually. The average age of the publications was 2.92 years, and each article received an average of 12.19 citations. Out of 5609 authors, 204 published single-authored papers. Additionally, 30.15% of the total documents had international co-authorship.
5.2. Publication Trends and Leading Contributors in Urban Transportation Research
In 2023, urban transportation research reached its peak with 453 publications, surpassing the output of previous years, including 2018, 2019, 2020, 2021, and 2022. However, 2018 stands out for achieving the highest citation rate, with an average of 29.71 citations per study in this domain.
Furthermore, the primary country is “China”, the main author is “Liu Y.”, and the primary keyword is “urban mobility” concerning the Sankey diagram analyzing the significant features of the literature on urban transportation.
In addition, the analysis reveals that Sustainability (Switzerland) leads in the number of publications on urban transportation, contributing 200 articles, followed by IEEE Transactions on Intelligent Transportation Systems with 48 articles and Journal of Transport Geography with 45 articles. In terms of citations, Sustainability (Switzerland) also ranks first with 1347 citations, while the Journal of Transport Geography and Transport Policy follow closely with 865 and 844 citations, respectively.
Moreover, in the area of urban transportation, “Southeast University” emerged at the top with 85 publications from 2018 to 2023, followed by “Aristotle University of Thessaloniki” with 62 publications and “Massachusetts Institute of Technology” with 60 publications, according to studies from the institutions or affiliated organizations of the authors.
5.3. Key Contributors and Global Collaboration in Urban Transportation Research
A total of 2000 research papers on urban transportation were authored by 5609 individuals across diverse publications. Among the most influential contributors globally, Liu Y ranks first with 16 articles, followed by Basbas S and Wang Y, each with 14 articles, and Wang J in third place with 13 articles.
Concerning the discussions about urban transportation, China has the highest number of broadcasts (803), followed by Brazil (701), the USA (559), and Italy (512). The most frequently mentioned country is the USA (2697), followed by China (2285), Spain (1886), and Italy (1829). In the field of urban transportation, China collaborates with the USA, the United Kingdom, Hong Kong, Singapore, and Australia. The USA collaborates with the United Kingdom, Italy, and Singapore. Brazil collaborates with the USA, and Germany with the Netherlands. It can be concluded that China is the most active in international cooperation in this area.
The most cited papers tend to reflect the productivity of their authors. For example, the article titled “Effects of the COVID-19 Lockdown on Urban Mobility: Empirical Evidence from the City of Santander (Spain)” by Aloi et al. (2020) leads with 329 citations. In second place is “A Deep Reinforcement Learning Network for Traffic Light Cycle Control” by Liang et al. (2019), published in IEEE Transactions on Vehicular Technology, has 305 citations. The third-most-cited paper, “Process Safety and Environmental Impacts of COVID-19 on Public Transport Ridership in Sweden: Analysis of Ticket Validations, Sales, and Passenger Counts” by Jenelius and Cebecauer (2020), published in Transportation Research Interdisciplinary Perspectives, has been cited 280 times.
5.4. Keyword Factor Analysis: Major Themes in Urban Transportation
Keyword factor analysis in the urban transportation literature reveals two major clusters. The first cluster includes terms such as urban mobility, smart city, urban area, bicycles, and travel behavior, reflecting a focus on sustainable and behavioral aspects of urban mobility. The second cluster comprises keywords like intuitive motor transportation, travel time, vehicles, and intelligent systems, highlighting technological advancements and efficiency in transportation systems.
The relationship between these keywords collected in the first cluster is intrinsic to developing sustainable, efficient, and livable urban environments. In this sense, smart city technologies enhance urban mobility by providing real-time data and analytics. For example, smart traffic management systems can optimize traffic flow and reduce congestion, directly improving urban mobility [
54]. Also, effective urban mobility solutions are tailored to the specific needs of urban areas, which vary widely in terms of population density, infrastructure, and economic activities. Urban mobility strategies must consider the unique characteristics of each urban area to be effective [
55]. Bicycles are a cornerstone of sustainable urban mobility strategies. Incorporating cycling infrastructure into urban planning allows cities to reduce dependence on motor vehicles, resulting in decreased emissions and better public health outcomes [
30]. Moreover, smart city initiatives collect and analyze data on travel behavior to inform transportation planning and policy. Understanding how people move through the city allows for the development of more efficient and user-friendly transport systems [
27]. Furthermore, travel behavior in urban areas is influenced by factors such as the availability of public transport, walkability, and cycling infrastructure. Policies aimed at modifying travel behavior, such as congestion pricing or incentives for public transportation use, can lead to more sustainable urban mobility patterns [
17].
Recognizing the connections among these keywords enables urban planners, policymakers, and researchers to craft holistic strategies. These strategies aim to improve urban living by advancing mobility, fostering sustainability, and leveraging technological innovations.
On the other hand, the relationship between the keywords collected in the second cluster is integral to developing efficient and sustainable urban transportation systems. In this context, the efficiency of motor transportation directly impacts travel time. Factors such as traffic congestion, road infrastructure, and traffic management practices significantly influence how long it takes to travel from one point to another. Reducing travel time can improve economic productivity and quality of life [
56]. Also, vehicles are the core components of motor transportation. The type, number, and efficiency of vehicles in use affect traffic flow, road safety, and environmental impact. Policies promoting fuel-efficient and electric vehicles can mitigate negative environmental impacts [
31]. Moreover, intelligent systems are designed to optimize travel by reducing delays, improving traffic flow, and efficiently managing traffic incidents through real-time data utilization. For instance, adaptive traffic signal control systems dynamically adjust signal timings based on live traffic conditions, significantly minimizing delays and enhancing travel times [
33]. Moreover, intelligent systems can enhance the efficiency and safety of vehicle operations. Features such as automated driving, vehicle-to-vehicle communication, and real-time navigation contribute to reducing accidents, improving fuel efficiency, and easing traffic congestion. The integration of ITSs with vehicles is a crucial aspect of developing smart and sustainable urban transportation systems [
57].
5.5. Enhancing Urban Mobility Through Intelligent Systems and Integrated Planning
In addition, the application of intelligent systems in motor transportation can transform urban mobility by reducing congestion, improving safety, and lowering emissions. Smart traffic management, dynamic toll pricing, and real-time public transit information are examples of how intelligent systems optimize motor transportation [
58]. Understanding these interconnections empowers urban planners, policymakers, and engineers to design transportation systems that are not only efficient and sustainable, but also tailored to the demands of modern urban populations.
Additionally, a comprehensive analysis of scholarly articles on urban transportation was carried out using bibliometrics and author-provided keywords to determine the primary focus areas in the field. The findings revealed that terms like urban transport, mobility, public transport, urban mobility, and traffic congestion are prominently featured in academic research.
The connection among these keywords is crucial for creating effective and long-lasting urban transportation systems. In this context, firstly, urban transportation systems are designed to enhance mobility within cities. Efficient urban transportation options, such as well-connected public transportation networks and safe cycling infrastructure, improve overall mobility by providing reliable and diverse options for movement [
31]. Secondly, public transportation is a cornerstone of urban transportation systems. Expanding and improving public transportation services can significantly enhance urban mobility, reduce reliance on private cars, and alleviate traffic congestion [
10]. Thirdly, high-quality public transportation services improve mobility by offering affordable and efficient travel options. Public transportation can connect various parts of a city, ensuring that all residents have access to essential services and opportunities, thus promoting social inclusion and reducing inequality [
17]. Fourthly, effective urban mobility strategies are essential for managing traffic congestion. By promoting public transport, cycling, and walking, cities can reduce the number of private vehicles on the road, thus easing congestion and improving travel times for all modes of transport [
35]. Fifthly, improving public transportation remains a vital strategy for mitigating traffic congestion. Efficient, reliable, and convenient public transportation options provide a compelling alternative to private car usage, thereby reducing the volume of vehicles on the road and alleviating congestion [
10]. Lastly, comprehensive urban transportation planning must address congestion through a multifaceted approach, combining infrastructure enhancements, demand management strategies, and policies that promote sustainable transport modes. This integrated approach ensures that urban transportation systems can effectively support expanding populations and economic activities without succumbing to overwhelming congestion [
35]. By grasping these interrelationships, urban planners, policymakers, and researchers can develop holistic strategies that improve mobility, advance sustainability, and integrate technological innovations to enhance urban living.
5.6. Integrative Frameworks and Emerging Trends in Urban Mobility
In addition, based on the keyword co-occurrence analysis carried out using VOSviewer to emphasize the common findings of the study with keywords and the study’s knowledge base, the most extensive cluster, known as “urban mobility”, includes keywords like AHP, simulation, and GIS. The integration of the AHP, simulation, and a GIS offers a holistic framework for tackling urban mobility challenges. Specifically, the AHP helps prioritize projects, simulation tests these priorities under various scenarios, and a GIS maps out and visualizes impacts and feasibility. This integration ensures that decisions are underpinned by rigorous data analysis, predictive modeling, and comprehensive stakeholder input, fostering the development of effective and sustainable mobility solutions. It allows cities to create adaptive systems that can respond to changing conditions and emerging challenges in urban mobility. By combining these tools, urban planners and policymakers can develop smarter, more efficient, and more sustainable urban transportation networks. In summary, the AHP, simulation, and a GIS each serve essential functions in urban mobility planning by providing the analytical, predictive, and spatial capabilities required for sound decision making and efficient management. Their combined use results in more informed, streamlined, and sustainable urban mobility strategies.
In addition to these analyses, the VOSviewer software version 1.6.20 was used to analyze the keywords “overlay visualization” and color them based on the year of publication. This helped identify the time intervals in which these keywords appeared in the literature. The analysis revealed that, from May 2020 to early 2021, keywords like passenger transport, walking, and big data were heavily studied, while newer keywords such as public health, walkability, SUMO, and NS-3 have recently started to emerge in the literature. It seems that emerging terms such as public health, walkability, SUMO, and NS-3 are gaining traction in the literature, signaling a shift toward new research frontiers that will shape the future of urban mobility planning.
6. Conclusions
This bibliometric exploration into urban transportation research underscores the dynamic and rapidly evolving nature of this field from 2018 to 2023. Analyzing 2000 articles from 617 journals within the Scopus database reveals critical trends and emerging themes shaping the discourse on urban transportation.
Key findings include a substantial Annual Growth Rate of 31.32% in publications, with 2023 marking the peak year for research output. China has emerged as a leading contributor to urban transportation research, both in terms of publication volume and international collaborations. Prominent authors such as Liu Y. and influential journals like “Sustainability (Switzerland)” and “IEEE Transactions on Intelligent Transportation Systems” underscore the global and interdisciplinary efforts in advancing this field.
The analysis identified two primary keyword clusters. The first emphasizes sustainable urban mobility, incorporating terms like urban mobility, smart cities, and travel behavior. The second focuses on motor transportation efficiency, with keywords such as travel time, vehicles, and intelligent systems. These clusters reflect the dual priorities of advancing sustainability and improving transportation efficiency through technological innovation.
Emerging keywords such as public health, walkability, SUMO (Simulation of Urban Mobility), and ns-3 (a discrete-event network simulator) indicate new directions in urban transportation research. These terms suggest a growing interest in the intersection of transportation with broader societal impacts and technological advancements. The inclusion of public health emphasizes the increasing recognition of the health implications of urban mobility, while walkability highlights a shift towards more pedestrian-friendly urban environments. Advanced simulation tools like SUMO and ns-3 demonstrate the increasing reliance on sophisticated modeling and analysis techniques to tackle complex urban transportation challenges, reflecting the field’s commitment to integrating societal impacts with technological advancements.
The integration of tools such as the AHP (Analytic Hierarchy Process), simulation, and GISs (Geographic Information Systems) demonstrates a comprehensive approach to urban mobility planning. These methodologies enable urban planners to prioritize projects, test various scenarios, and visualize their impacts, leading to more informed and sustainable decisions.
In conclusion, this bibliometric analysis provides valuable insights into the current state and future directions of urban transportation research. The findings underscore the importance of sustainability, technological innovation, and interdisciplinary collaboration in addressing the challenges of urban mobility. As new themes like public health and walkability gain prominence, they will likely shape the development of more holistic and inclusive urban transportation systems. These insights provide valuable guidance for researchers, policymakers, and urban planners in crafting strategies that elevate urban living by advancing mobility, promoting sustainability, and leveraging technological innovations.
6.1. Novel Insights and Contributions
It is believed that the insights of this paper offer valuable contributions to the field by emphasizing the evolving trends in urban mobility and the novel applications of simulation tools and interdisciplinary collaborations. In this context, three main subheadings are identified.
Emerging Themes and Keywords: The analysis of this study identifies emerging keywords such as public health, walkability, SUMO, and NS-3, which reflect growing interdisciplinary concerns in urban transportation. These themes are gaining prominence in recent years and signal a shift toward more holistic and integrated approaches to urban mobility, incorporating public health and advanced simulation tools, areas not extensively discussed in the previous literature.
Growth of International Collaborations: The bibliometric analysis reveals China’s dominant role in urban transportation research, especially in international collaborations, suggesting a shift in global research leadership and influence. This insight has implications for future research priorities and collaborations across regions.
Technological Integration: This study’s focus on the integration of the AHP, simulation, and a GIS provides a novel framework for decision making in urban mobility. The integration of these tools provides a holistic framework for assessing and planning sustainable urban transportation systems, addressing gaps that have been underexplored in previous research.
6.2. Future Directions and Practical Implications
Building upon the key findings of this study, several future directions and practical implications emerge that could guide urban transportation research and practice.
Advancing Public Health and Walkability Research
The growing emphasis on themes like public health and walkability underscores the importance of exploring the connections between urban mobility and health outcomes, paving the way for interdisciplinary research in this area. Future studies could explore how urban transportation systems can actively promote healthier lifestyles through policies that prioritize pedestrian-friendly infrastructure, reduced vehicular emissions, and improved access to green spaces.
Leveraging Simulation Tools for Policy Development
The adoption of advanced simulation tools such as SUMO and NS-3 offers immense potential for urban planners to test and refine transportation policies in virtual environments. Future research could prioritize the practical implementation of these tools to assess the effects of mobility solutions, such as congestion pricing, shared mobility services, and multimodal integration strategies.
Enhancing Sustainability through Technological Innovations
Intelligent Transportation Systems (ITSs), electric and driverless cars, and smart city platforms are examples of emerging technologies that present chances to improve transportation effectiveness and lessen environmental impact. Taking into account the social and environmental ramifications of these technologies, researchers and policymakers should give top priority to incorporating them into long-term urban development plans.
Strengthening International Collaboration
The dominant role of China in urban transportation research underscores the importance of fostering international partnerships. Future efforts should aim to facilitate global knowledge exchange, particularly between countries with advanced technological capabilities and those facing unique transportation challenges. This collaboration has the potential to accelerate the adoption of innovative and context-specific solutions.
Policy Integration and Cross-Sectoral Approaches
Urban mobility is closely linked to other domains, such as housing, land use, and environmental planning. In order to ensure that infrastructure expenditures result in both mobility and environmental benefits, policymakers should take into account integrated methods that address transportation concerns alongside more general urban development issues.
By addressing these future directions, researchers and practitioners can build on the insights from this study to develop urban transportation systems that are not only sustainable, but also equitable and adaptive to emerging challenges. These practical implications aim to bridge the gap between academic research and real-world applications, ensuring that urban mobility solutions effectively meet the needs of diverse stakeholders.
This research serves as a foundation for policymakers, urban planners, transportation authorities, and researchers aiming to improve sustainable mobility. By highlighting global trends, key themes, and innovations in urban transportation, this study offers valuable insights for developing strategies that enhance urban mobility, promote sustainability, and address challenges such as congestion, pollution, and social equity.
6.3. Limitations of This Study
While this bibliometric analysis provides valuable insights into recent trends and innovations in urban transportation research, several limitations should be noted. Firstly, this study relies solely on data from the Scopus database, which, while comprehensive, may exclude relevant studies indexed in other databases such as Web of Science or IEEE Xplore. Secondly, the analysis focuses on a relatively short timeframe (2018–2023), which, while capturing emerging trends, might overlook longer-term developments in the field. Thirdly, this study’s reliance on keyword- and citation-based metrics may not fully capture the qualitative aspects of research impact or the nuances of interdisciplinary collaboration. Addressing these limitations in future studies could provide us with a more comprehensive understanding of the field.


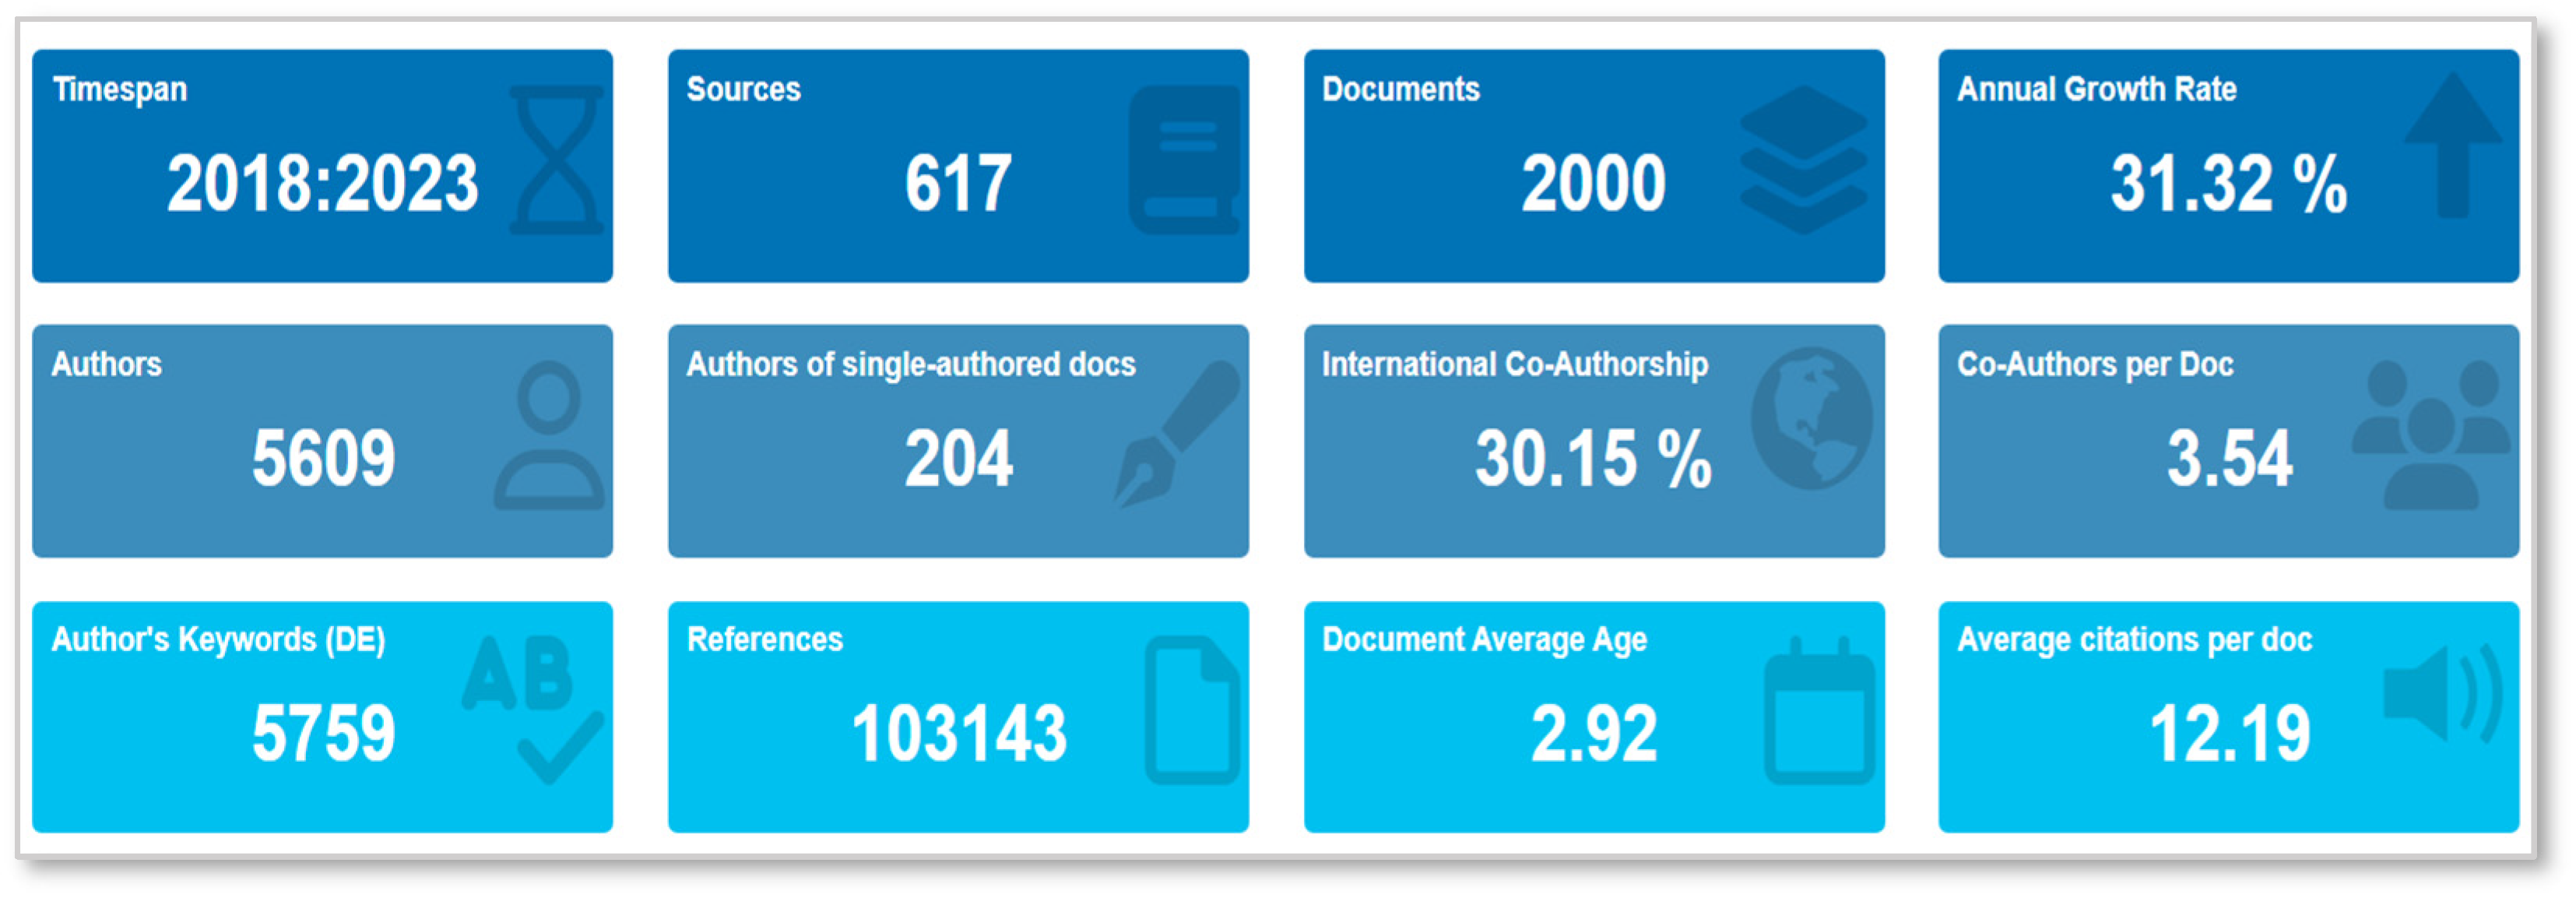

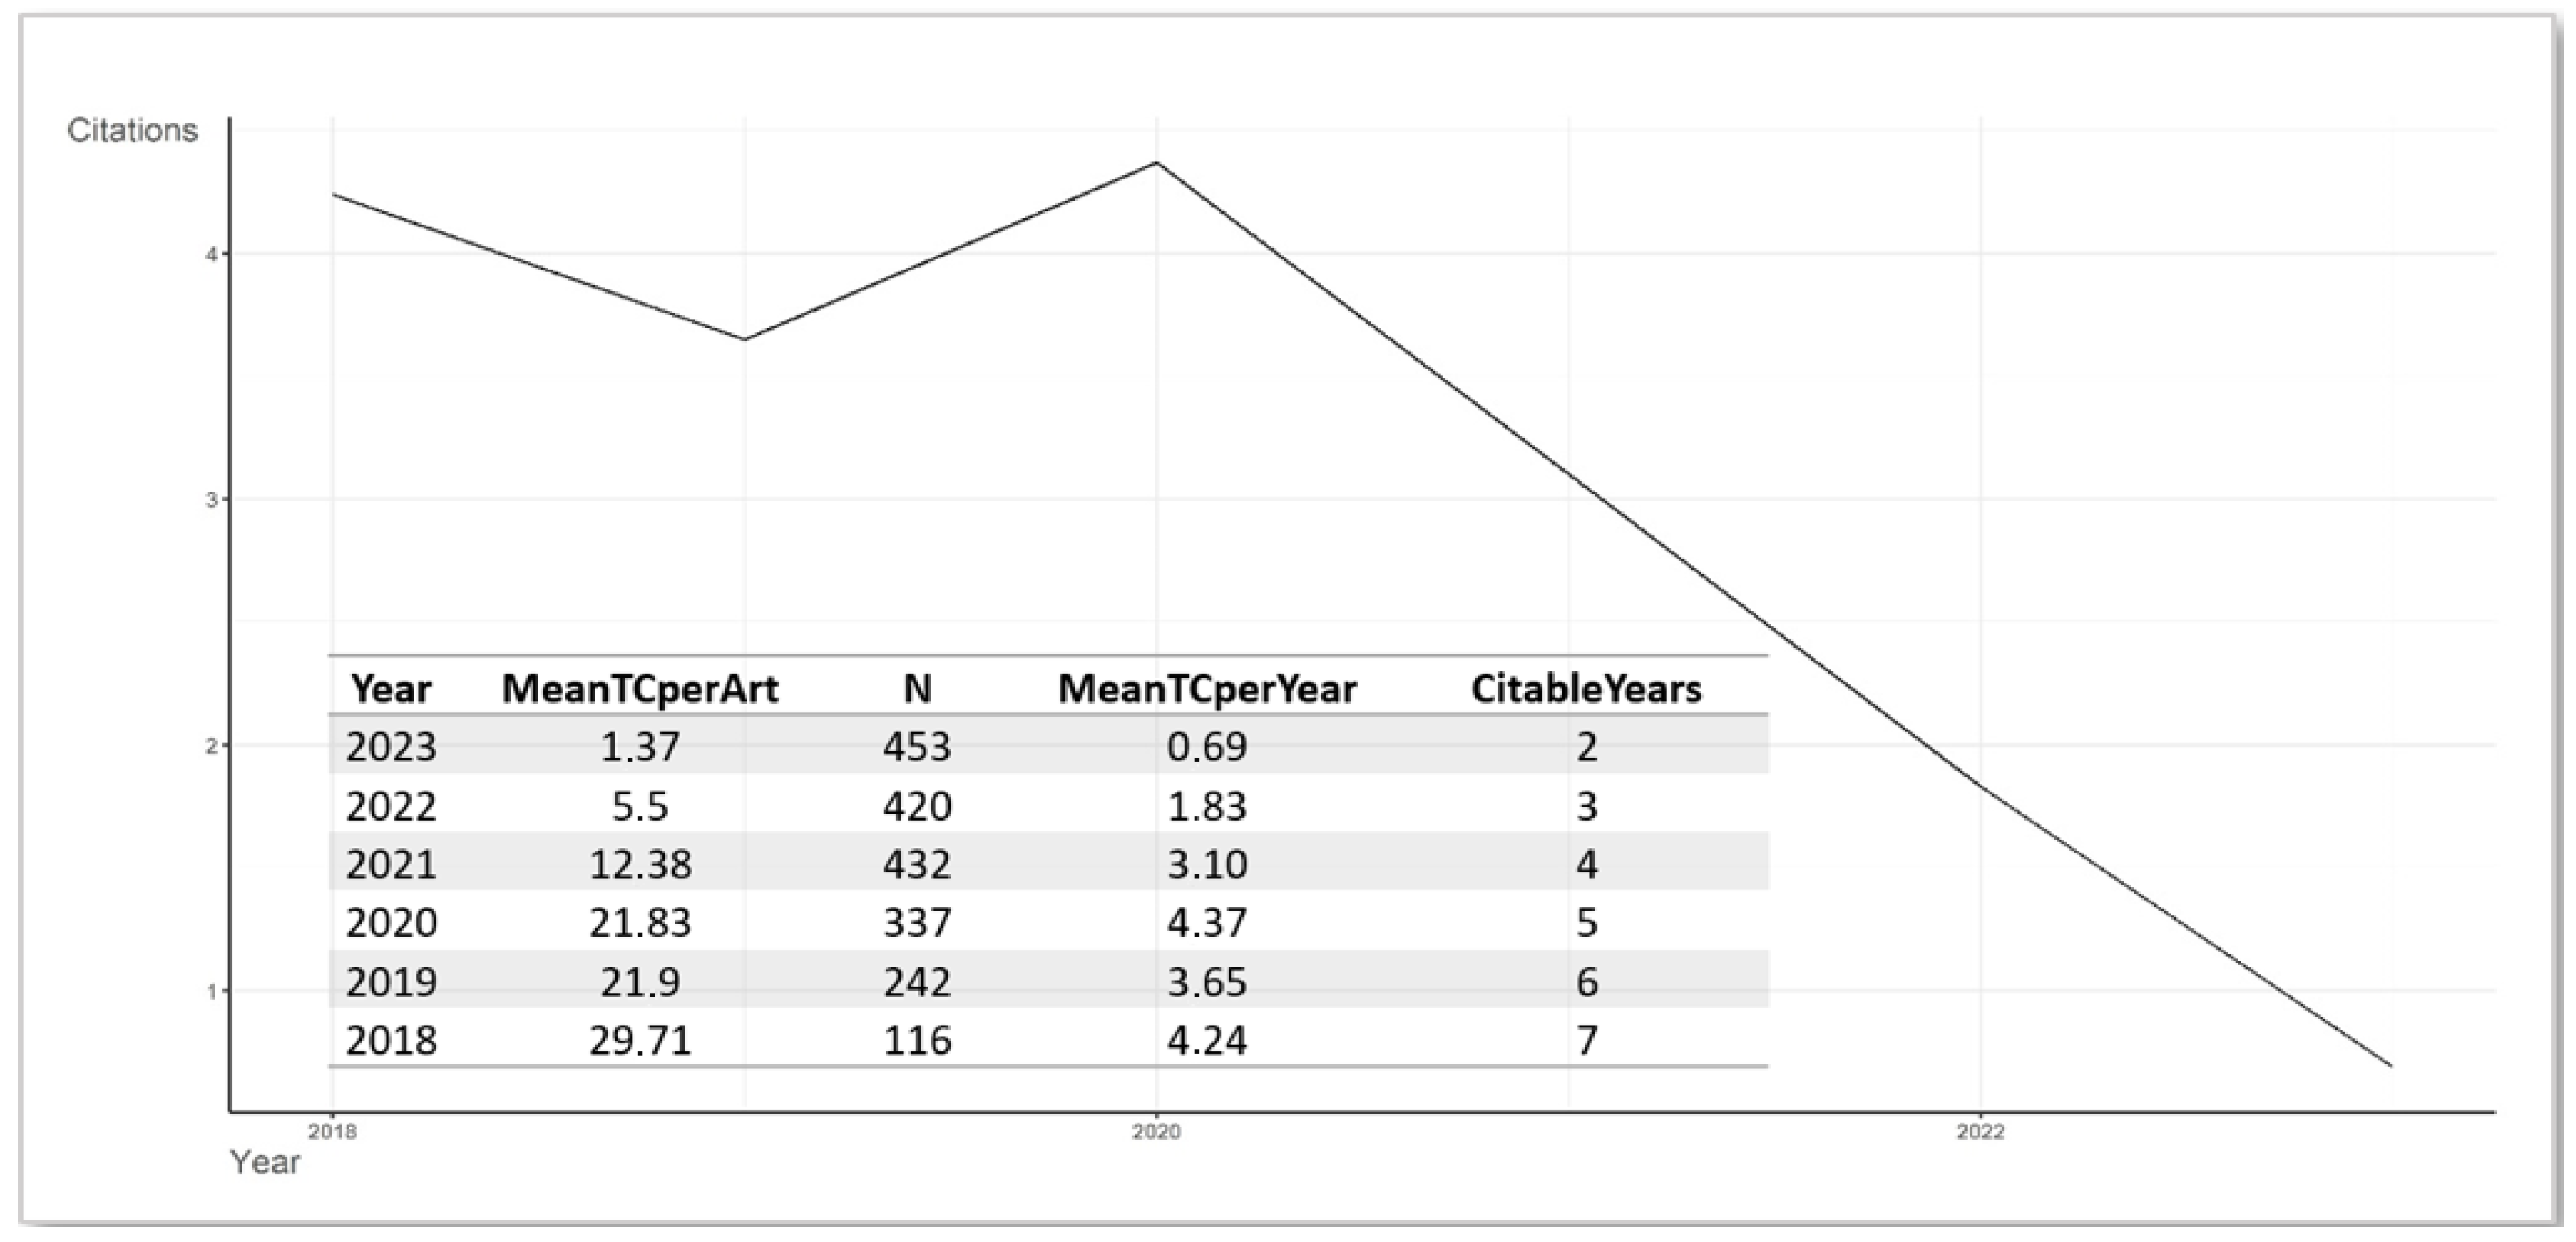


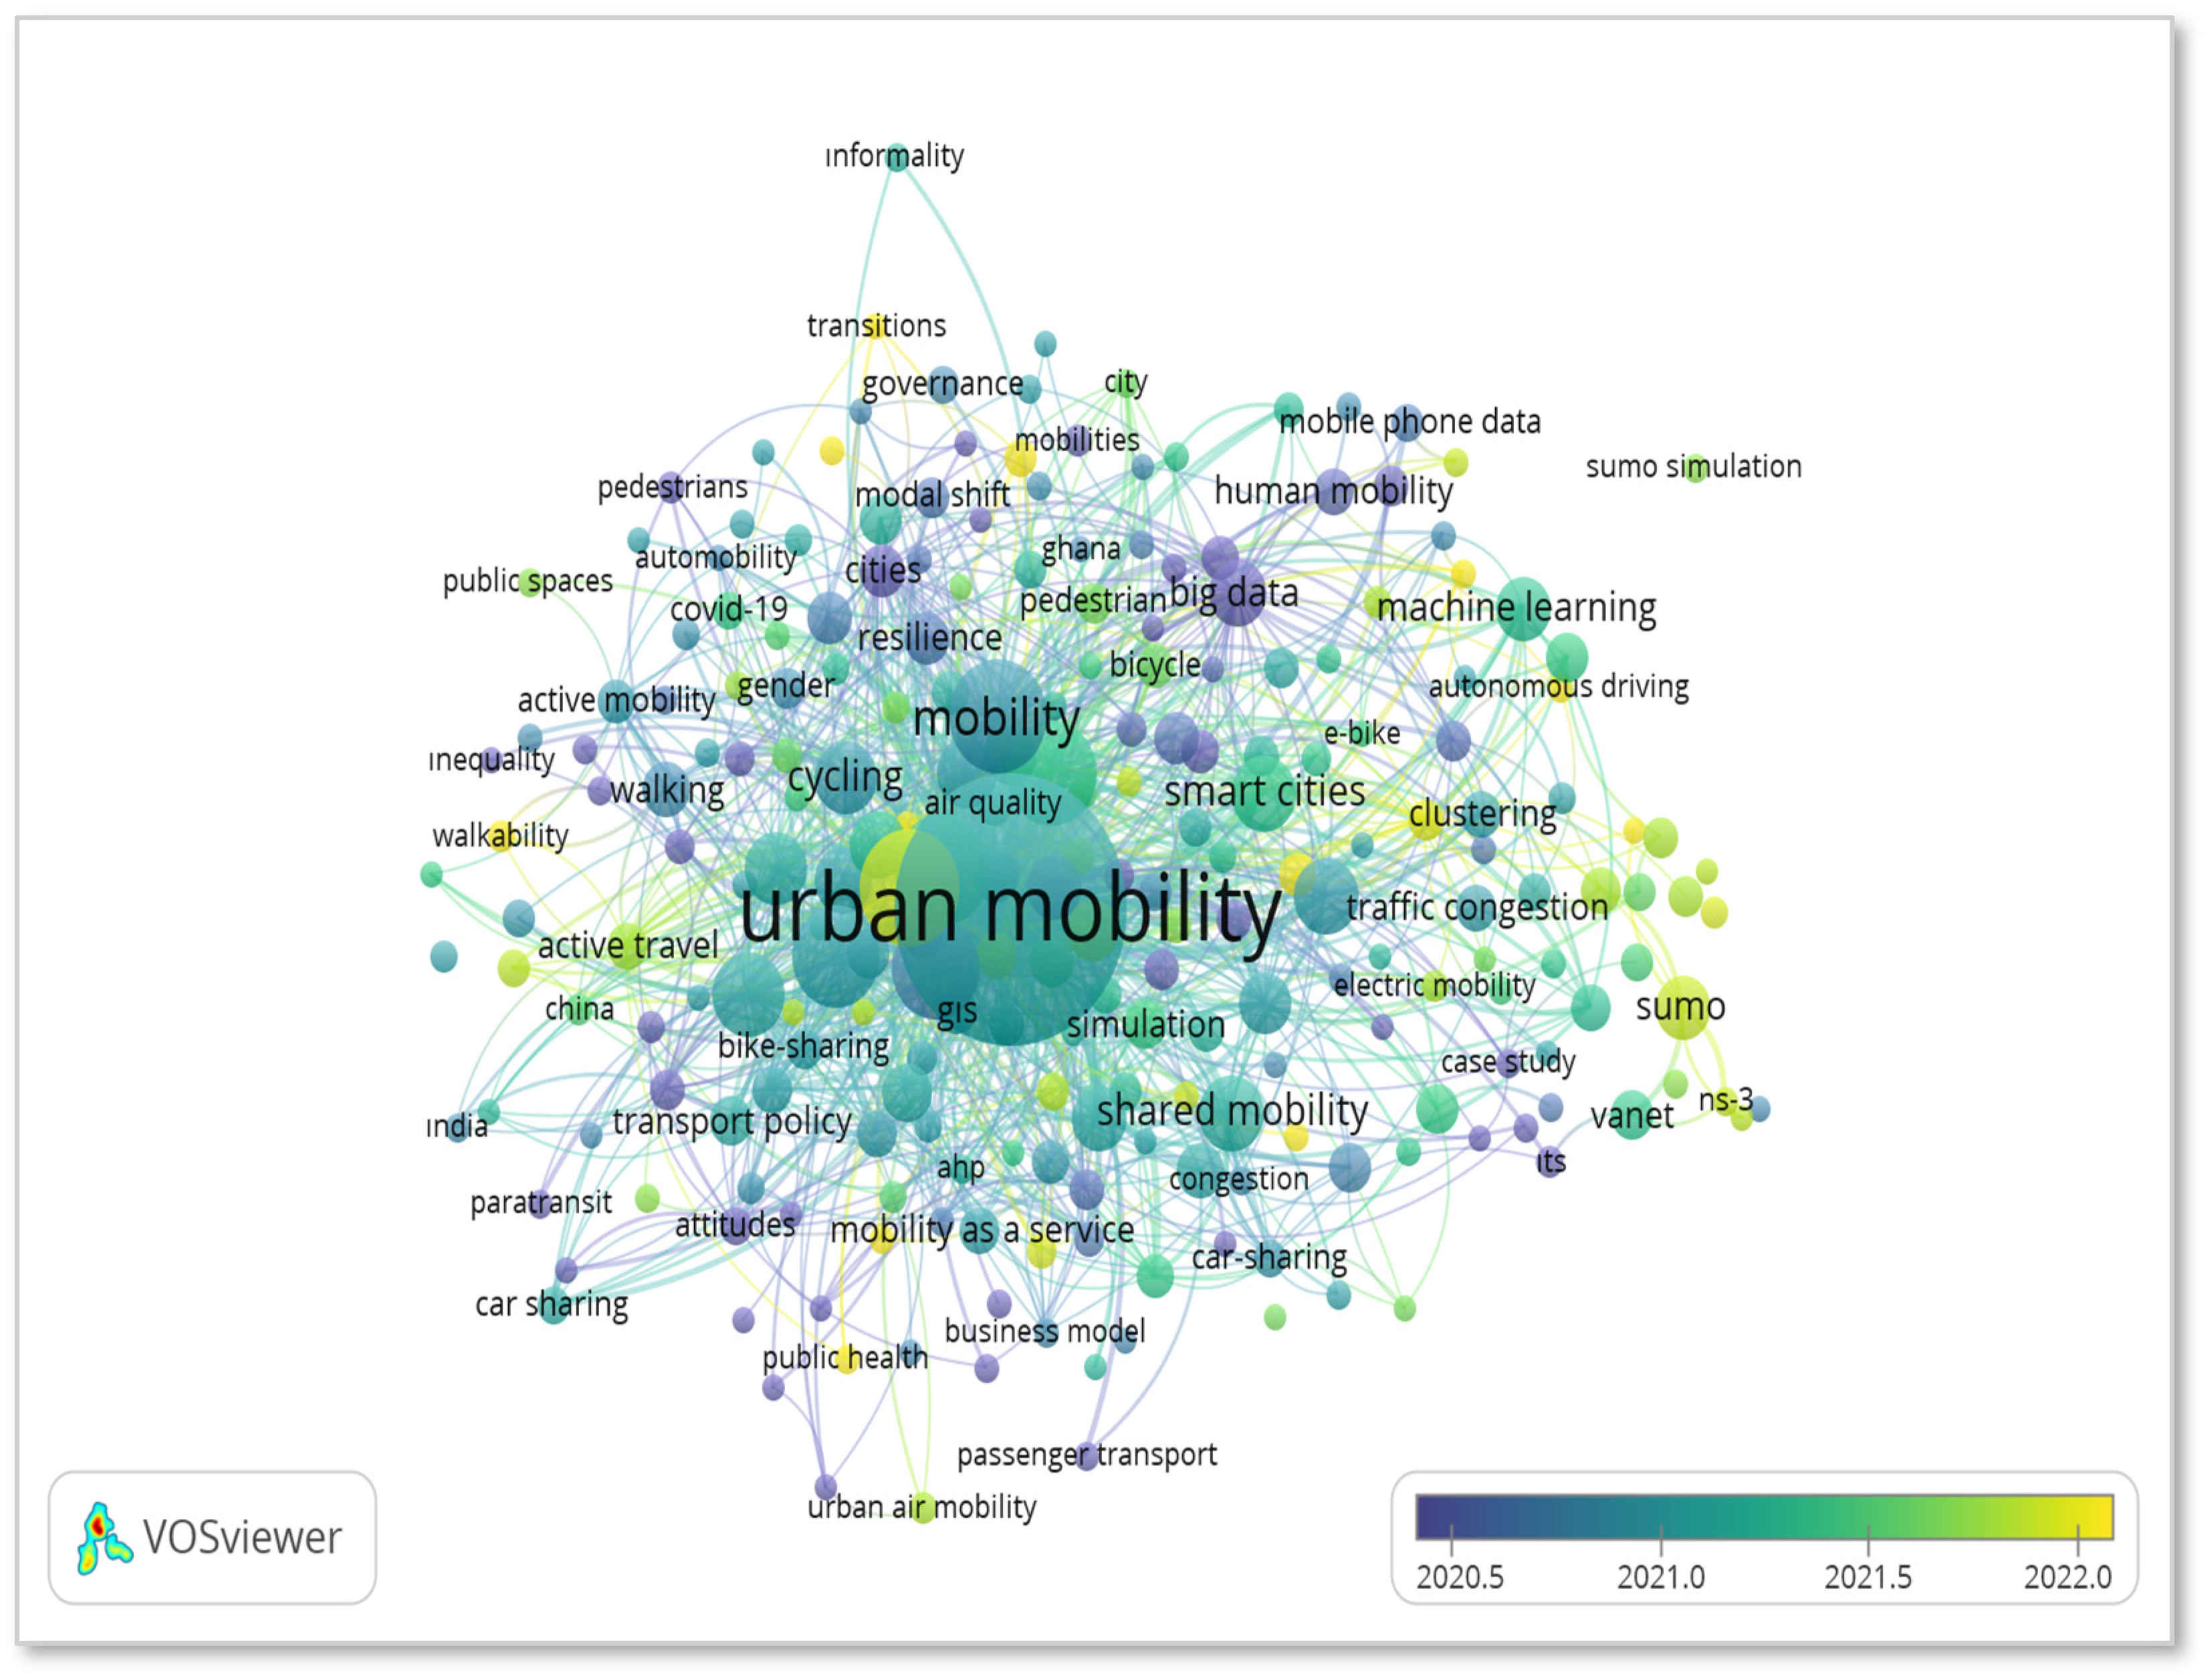
