Abstract
Based on data from China and 80 countries belonging to the Belt and Road Initiative (BRI) for the period 2010–2022, this study employs a benchmark panel regression model to thoroughly analyze the impact of digital economy development on carbon emission reduction in BRI countries. The research findings indicate that the development of the digital economy in BRI countries has facilitated carbon emission reduction. This effect exhibits heterogeneity. Compared to other regions, the impact is more pronounced in countries with higher levels of socio-economic development, located in Africa and Europe, and along the Land Silk Road, and BRI countries neighboring China. The mechanisms through which this effect operates include industrial structure adjustment, technological innovation, and changes in energy intensity. Based on these insights, specific and targeted development recommendations for BRI countries at different levels of development and geographical distributions are proposed. These suggestions focus on strengthening infrastructure construction to bridge the digital divide; enhancing technological capabilities and promoting the integration of the digital economy with the real economy to upgrade industrial structures; and implementing differentiated digital economy development strategies to reduce energy consumption, among other measures.
1. Introduction
The report of the 20th National Congress of the Communist Party of China points out the need to accelerate the construction of Digital China, promote deep integration of the digital economy with the real economy, and facilitate the broad application of digital technology in all areas of economic and social development [1]. It further emphasizes the strategic significance of developing the digital economy. Since President Xi Jinping first proposed the concept of the “Digital Silk Road” at the first Belt and Road Forum for International Cooperation, international cooperation in the digital economy among countries along the Belt and Road has become increasingly profound [2]. By the end of 2022, China had signed Memorandums of Understanding (MoUs) on “Digital Silk Road” cooperation with 17 countries and e-commerce cooperation MoUs with 30 countries, and the “Memorandum of Understanding on Strengthening Investment Cooperation in the Field of Digital Economy” with 18 countries and regions [3]. Promoting high-quality development among countries along the route is the inevitable direction for the “Digital Silk Road” to deepen and solidify, and it is also the ultimate goal for the “Digital Silk Road” to proceed steadily and sustainably.
Carbon emission reduction is one of the key issues in the process of high-quality development of countries along the Belt and Road. Since the ratification of the Paris Agreement in 2015, nations globally have endeavored to meet their carbon reduction objectives as a measure against climate change. Concurrently, the development of environmentally sustainable initiatives along the Belt and Road has been prioritized on the international agenda. An increasing number of scholars are recognizing the robust vitality and resilience inherent in the digital economy. They are beginning to focus on the significant role that the digital economy plays in facilitating carbon emission reductions through industrial structure upgrading and technological innovation [4]. The diverse developmental contexts of countries along the Belt and Road underscore the timeliness and practical significance of an in-depth examination of the pivotal role that the digital economy plays in carbon emission reduction. Within a broader framework of cooperative mechanisms, such an analysis can significantly contribute to achieving the shared objective of high-quality development among these nations.
2. Review of Related Literature
2.1. Research on the Development of the Digital Economy
In domestic research, scholars focus on the role of the digital economy and the channels through which it plays its role. Wu et al. [5], from the perspective of China A-share market, investigate the impact of digital economy attention on enterprise innovation, and their conclusion shows that the digital economy has a positive correlation with innovation. From another angle, Zhang et al. [6] focus on residents and families. By measuring the development of the digital economy in China, they establish a model between digital finance and residents’ income and family entrepreneurship, which proves that the development of digital finance is helpful to improve family income and rural residents’ entrepreneurship, but it is not conducive to urban residents’ entrepreneurship, providing a new research framework for digital economy analysis. Based on the framework built by Zhang et al. [6], Zhao et al. [7] further introduced the mechanism of entrepreneurial activity and concluded that the digital economy can promote high-quality economic development, with the characteristics of diminishing marginal effects and spatial spillover effects by establishing a panel fixed-effects model, threshold model, and intermediary effect model. The development of the digital economy not only exhibits spatial spillover effects but also enhances regional innovation capabilities, thereby promoting the upgrading of industrial structures. The extent of this influence, however, varies heterogeneously across different regions [8].
Foreign scholar Afolabi [9] confirmed that digital infrastructure construction in Africa has a significant positive impact on the digital economy through empirical methods; the uncertainty of economic policies has slowed down the digital economy growth of all income groups in African countries, and the heterogeneity among countries is obvious. Scholars such as Shahbaz et al. [10] used dynamic panel modeling to analyze the impact of the digital economy on energy transformation. The digital economy can exert a positive influence on the energy structure through both direct and indirect channels, including governmental governance. Significant heterogeneity exists among countries across different continents in this regard, owing to variations in governmental governance mechanisms and policies.
2.2. Research on Carbon Emissions
At the application level, the research on carbon emissions spans many departments, including finance, agriculture, and industry. Jiang et al. [11] established two carbon emission groups by using a difference method and the Fisher combination test, which proved that green credit and green venture capital had significant carbon emission reduction effects. On this basis, Meng et al. [12] then used the dynamic panel model and impulse response function to explain the mechanism by which green finance promotes carbon emission reduction by improving energy efficiency, with the emphasis on subsidies from the Chinese government. Regarding urban governance, Zhang et al. [13] expounded the direct and indirect effects on carbon emission reduction from the perspective of encouraging enterprises to favor cleaner production technology and catalyzing economic agglomeration in the process of urbanization [14].
Foreign research mainly focuses on the impact of enterprise development and policies on carbon emission reduction. Dewarlheyns et al. [15] take the European Union as a case study to explore the risks related to enterprise carbon emission reduction policies. The leading position of the European Union in global carbon emissions has led to the cognitive bias of decision makers and aggravated the risk of enterprises. In addition, the development of the carbon emissions trading policy (CETP) also has an important impact on carbon emissions. Zhang et al. [16] confirmed that the Porter hypothesis was not valid, but the method could significantly improve the innovation level of the pilot areas and then play a positive role in carbon emission reduction. At the same time, Derindag et al. [17] used panel data to reveal the nonlinear relationship between carbon emissions and foreign direct investment and found that the trade openness must reach a certain threshold to achieve carbon emission reduction effects.
2.3. Research on the Effect of the Digital Economy on Carbon Emission Reduction and Its Application in Countries Along the “Belt and Road”
Wang et al. [18] started from the perspective of the degree of coupling and coordination between economic growth and carbon emissions, indicating that improving the capacity for technological innovation, upgrading the energy consumption structure, and promoting the development of the tertiary industry are the functional mechanisms by which digital technology enables the coupling and coordinated development of economic growth and carbon emissions. Scholars such as Zuo et al. [19] have shown through the mechanism test that the digital economy can reduce carbon emissions by improving the level of social and economic development, reducing the level of energy consumption, and adjusting the structure of energy production. Ma et al. [20] have empirically studied the impact of the digital economy on carbon emission intensity and its internal mechanism by introducing two key intermediary variables, namely, technological innovation and high-quality development of industrial chain. The research structure shows that digital economy can reduce carbon emission intensity through technological innovation and high-quality development of industrial chain. However, as a new research direction, Shi et al. [21] analyzed the impact and heterogeneity of the development of digital trade in relation to China’s carbon emission reduction from the production side and the consumption side. For example, on the consumption side, upgrading rural residents’ consumption has a significant inhibitory effect on carbon emissions, while upgrading urban residents’ consumption results in a trend of promoting carbon emissions. Similarly, Li et al. [22] have constructed the theoretical framework and transmission mechanism of carbon emission reduction in the digital economy from the production and consumption sides of China’s market, and found that the digital economy can significantly reduce the intensity of carbon emissions and achieve the effect of carbon emission reduction. Wang et al. [23] have analyzed the impact and mechanism of the digital economy in relation to carbon emissions from the perspective of production technology by using the perspective of the Solow model including the production function. However, it is a shame that there is no similar research method in the “Belt and Road” field that closely links social production and social consumption.
In the Belt and Road field, Wei et al. [24], by studying the impact of the digital economy on carbon emissions in 48 countries along the Belt and Road, concluded that digital trade in countries along the Belt and Road has an inverted U-shaped impact on carbon emissions, and pointed out that the higher the level of economic development and the better the institutional environment, the more significant the inverted U-shaped impact of digital trade on carbon emissions, but this study did not deeply analyze its impact mechanism. The above-mentioned scholars explain this mechanism of action, but there is no common starting point and there is a lack of more general and in-depth analysis [25].
2.4. Literature Survey
Currently, scholars in academic circles have obtained an extensive understanding and expansion of research perspectives, methodologies, and pathways concerning carbon emission reduction and the digital economy. However, certain limitations remain: Firstly, the measurement methods employed by different scholars for assessing the level of the digital economy and carbon emission reduction require further optimization and refinement to ensure the accuracy and reliability of subsequent research, Secondly, the research objects and regions are mostly concentrated in developed countries and developing countries with high development levels, ignoring the estimation and calculation of underdeveloped areas [26]. Through a literature review, it is found that the digital economy has an impact on regional carbon emissions in the following aspects: it plays a role by reducing the energy consumption effect, industrial upgrading effect, technological progress effect, and digital infrastructure empowerment effect [27].
The mechanism of the impact of the development of the digital economy on carbon emission reduction is complex. In order to further expand the scope of research objects, use perfect evaluation methods to discover, and understand the mechanism of the impact of various departments on carbon emission reduction and the purpose of common contact media, the marginal contributions of this paper may lie in the following three aspects [28]. First, this paper can combine the analytic hierarchy process with the entropy weight method to construct a digital economy index system in a more objective and effective way and apply it to countries along the Belt and Road [29]. Secondly, this article analyzes the direct and indirect mechanistic impact of digital economy development on carbon emissions from two levels, which are broader and easier to understand, so as to make the context of the article clear [30]. Finally, there are a large number of countries along the Belt and Road. Considering the different roles of countries in different stages of development and different geographical locations, we will study the countries in groups and analyze the impact of the digital economy on carbon emission reduction in detail from multiple channels to improve research in this field [31].
3. Theoretical Analysis and Research Hypothesis
As a novel economic form, the digital economy leverages advanced technologies such as big data, the Internet of Things (IOT), and artificial intelligence. By deeply integrating with traditional economic forms, it collaborates from both the production and consumption ends to drive the traditional economy toward lower costs, higher efficiency, and greater circulation [32]. This integration fosters economies of scale and scope, reduces resource input and consumption, enhances production efficiency, and lowers transaction costs. Consequently, this process helps to reduce the carbon emissions of countries along the Belt and Road, contributing to more sustainable and environmentally friendly economic development.
From the production side, the digital economy can enhance production efficiency, cut unnecessary costs, and optimize resource allocation. As a pivotal production factor in the digital economy, data can free a significant workforce from simple and repetitive manual tasks [33]. Moreover, the non-competitive, non-exclusive, and external nature of data has accelerated their collection and application. Enterprises can now design products that better meet market demands using up-to-date data, thereby responding more effectively to market needs. This reduces energy consumption and waste from information asymmetry, enhances resource allocation efficiency, and lowers carbon emission intensity along the “Belt and Road”. Additionally, the same data can be used simultaneously across different production departments, eliminating redundant data collection and reducing operational costs for businesses.
This streamlined approach not only improves efficiency but also supports sustainability efforts by minimizing the carbon footprint associated with operations. From the consumer side, the digital economy can significantly reduce transaction costs for consumers, stimulate demand, drive economies of scale, and thereby promote carbon emission reduction. As the application of digital technology deepens, online trading and e-commerce have become an integral part of consumers’ lives. The continuous optimization of online shopping platforms has brought numerous conveniences to consumers’ lives. On the one hand, consumers can select their preferred products through online shopping, and these items can be delivered directly to their homes via logistics services, making consumer behavior more convenient, reducing search and transaction costs, and promoting carbon emission reduction in countries along the route. On the other hand, the digital economy aids in improving residents’ consumption habits and enhancing the quality of their consumption [34]; with the continuous enhancement in residents’ environmental awareness, consumers will increasingly favor green products and services. The rise in green consumption behaviors will contribute to the reduction in carbon emission intensity in countries along the route. Based on the above analysis, this paper proposes the following hypotheses:
Hypothesis 1.
The development of the digital economy in countries along the Belt and Road has a direct effect on promoting carbon emission reduction.
In addition to directly influencing the production and consumption ends to promote carbon emission reduction, the development of the digital economy can also indirectly affect these areas through various channels, thereby further reducing carbon emissions. As a new economic form, the digital economy can help countries along the Belt and Road reduce their carbon emission intensity and achieve “high-quality” development by guiding industrial structures toward rational and advanced development, improving energy utilization, and enhancing technological innovation.
From the perspective of technological progress, the development of the digital economy enhances technological diversification and positively promotes technological advancement [35]. Continuous and diversified technological progress helps enterprises eliminate outdated technologies, reduce the use of high-pollution and high-energy-consumption technologies in production, and encourage a shift toward “green production”. This transition gradually reduces energy consumption in production. Moreover, advanced technologies bring lower costs to enterprises, facilitating the spread of low-energy and low-pollution technologies within the same industry and across its upstream and downstream sectors, thereby reducing overall energy consumption and lowering carbon emission intensity.
From the perspective of industrial structure upgrading, on the production side, the digital economy drives the digital transformation of traditional industries, promoting the shift from high-energy and high-pollution industries to intelligent and refined production modes. This improves resource allocation efficiency, reduces energy dependence, accelerates the elimination of outdated production capacities, and fosters the growth of emerging low-carbon industries such as digital intelligent manufacturing and green data centers. These changes reshape the industrial structure and reduce carbon emissions at the source. On the consumer side, the digital economy stimulates the development of new business models and alters consumption patterns [36]. For example, the sharing economy reduces resource idleness and waste, while e-commerce platforms promote the circulation of green products. Consumer demand drives the industrial structure to upgrade in a greener and lower carbon direction, thus achieving carbon emission reduction goals. Additionally, the digital economy is primarily applied in the tertiary sector, leading to an increase in its share. According to the “Seligson–Chenery” model, a higher proportion of the tertiary sector indicates a more advanced industrial structure. Given that the tertiary sector is characterized by lower pollution and energy consumption, its development results in significantly lower carbon emissions compared to the secondary sector, further reducing carbon emission intensity. The application of digital technology in different industries also deepens inter-industry relationships, improves coordination, and optimizes resource allocation, contributing to a more rational industrial structure and reduced energy consumption.
From the perspective of energy utilization, on the production side, the digital economy leverages big data, artificial intelligence, and other technologies to create intelligent energy management systems. These systems accurately analyze energy usage, optimize energy distribution, and intelligently regulate and control equipment, thereby improving energy efficiency, eliminating high-energy and low-efficiency production processes, and reducing energy consumption and carbon emissions. On the consumer side, the digital economy utilizes e-commerce platforms, smart home appliances, and other channels and devices. This approach not only promotes green consumption by pushing energy-saving product information to consumers but also helps them manage energy use more effectively through the energy monitoring and automatic adjustment features of smart devices. By addressing both production and consumption, this dual strategy effectively supports carbon emission reduction (Figure 1).
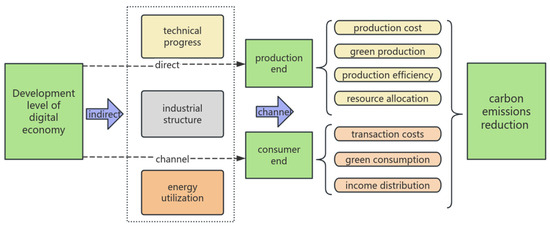
Figure 1.
Mechanism diagram of how digital economy promotes carbon emission reduction.
This streamlined approach enhances consumer awareness of energy-efficient products while enabling smarter energy management, thereby promoting sustainability from both ends of the supply chain. Based on the above analysis, this paper proposes the following hypotheses:
Hypothesis 2.
The development of the digital economy in countries along the “Belt and Road” indirectly promotes carbon emission reduction through the channel of technological progress.
Hypothesis 3.
The development of the digital economy in countries along the “Belt and Road” indirectly promotes carbon emission reduction through the channel of adjusting and upgrading the industrial structure.
Hypothesis 4.
The development of the digital economy in countries along the “Belt and Road” indirectly promotes carbon emission reduction by reducing energy intensity.
4. Empirical Design
4.1. Evaluation Index System of Digital Economy
This paper selects three first-level indicators and seven second-level indicators of the digital economy to construct an index system for measuring the current development level of the digital economy. The methodology draws from the work of Liu et al. [31] and Acemoglu et al. [37]. Three first-level indicators—digital infrastructure construction, digital talent innovation environment, and digital openness—are selected to build a digital economy index system. For digital infrastructure construction, the number of fixed broadband users, the number of cellular mobile network users, and the number of secure Internet servers are chosen as secondary indicators. The enrollment rate in higher education of the school-age population and the number of resident patents are selected as secondary indicators of the digital talent innovation environment. High-tech exports and exports of information and communication technology (ICT) products are chosen as secondary indicators of digital openness.
Digital infrastructure construction, digital talent innovation environment, and digital openness are selected as the first-level indicators, and the rigorous research results of predecessors are used for reference, which has a solid theoretical foundation. Digital infrastructure construction covers secondary indicators such as the number of fixed broadband and cellular mobile network users and the number of secure Internet servers, which are the “soil” for the digital economy to take root and reflect the basic ability of a country to access and carry out digital economic activities. The innovation environment of digital talents is supported by the enrollment rate in higher education of the school-age population and the number of patents of residents, which highlights the key drive of manpower and innovation elements in the development of the digital economy and provides a breakthrough point for theoretically exploring the driving force for the sustainable growth of the digital economy. The degree of digital openness is measured by the export of high-tech and information and communication technology products, which conforms to the theory of cross-regional linkage of the digital economy under the background of globalization and shows the international competitiveness of a country’s digital industry. By refining these indicators, we can intuitively present the shortcomings and advantages of digital economy development in various countries. For example, if there are few broadband users in a country, it means that the infrastructure needs to be improved. Many patents lead to strong innovation. This provides a targeted direction for policy makers in countries along the route, and can also light up the “navigation mark” for the investment layout of cross-border enterprises, promote the coordinated and complementary development of the digital economy in countries along the route according to the flexible decision-making of digital openness and talent reserve, activate the vitality of the regional digital economy, and move toward digital prosperity at the same time.
The data for the construction of the digital economy indicator system are sourced from the World Bank database, the World Intellectual Property Report published annually by the World Intellectual Property Organization, the UNCTAD database, and the International Telecommunication Union data.
4.2. Measurement Method of Digital Economic Indicators
Multi-criteria decision analysis (MCDA) originated in the 1950s. With the development of operational research and system analysis methods, people began to pay attention to MCDA. From the 1960s to the 1970s, its theoretical basis was gradually formed, and classic methods such as the AHP appeared and were initially applied with the help of computer technology. From the 1980s to the 1990s, it entered a period of rapid development, and many new methods emerged and became widely used in many fields. Since the 21st century, MCDA has been integrated with artificial intelligence and big data and applied in emerging fields. At the same time, international exchanges and cooperation have been strengthened. The purpose of development is to provide more scientific and effective decision-making methods and tools under the background of socio-economic development, complex decision-making issues, and technological progress in related disciplines.
The effective identification of standard weights is a key step in the process of multi-criteria decision analysis, because the result depends largely on the importance of the assigned standards [38]. Even a small change in the standard weight value will have a significant impact on the ranking obtained from the MCDA evaluation [39]. In order to promote the process of determining the correlation of standards, various weighting methods have been developed, which can be roughly divided into three categories, namely, objective, subjective, and mixed methods [40].
A subjective weighting method uses the knowledge and experience of experts to guide the calculation and ensure that the results are based on credible and verified information [41]. Commonly used subjective methods to determine the standard weight include the AHP [42], fuzzy AHP [43], best and worst method [44], Kemi median index [45], etc. These methods meet the complexity and uncertainty of different degrees in decision-making scenarios through their different mechanisms and extensions. In terms of application, Wang [46] used the fuzzy analytic hierarchy process to study the weight assignment of evaluation indexes of the international competitiveness of the film industry. Han et al. [47] used the expert group decision-making method to select the relevant indicators and combined this with the analytic hierarchy process to build the government chief data officer competency model. However, this method is easily influenced by subjective bias and inconsistent expert judgment, which may lead to the distortion of the indicative relationship between the compared criteria [48]. An objective weighting method uses information measurement technology based on a decision matrix to calculate the standard weight so that the decision support system can run autonomously without the participation of experts [49]. The advantage of objective weighting methods is to eliminate subjectivity, ensure consistency, and reduce deviation by relying on quantitative data in the decision matrix. As can be seen from the literature, people eagerly apply these methods to various decision-making problems. For example, in the weight processing of digital economic indicators, the existing research generally chooses the principal component analysis method [50], but the component analysis method is only suitable for the weight distribution between parallel indicators. There is an obvious progressive relationship in the classification of indicators, and some scholars refer to the NBI index weight determination method to give weights [51]. On the whole, many scholars also focus on the construction of a digital economy index system and measure the digital economy index with the help of the entropy weight method. For example, Zhang and Jiao [52] built an evaluation index system of digital economy development and used the entropy method and the index method to measure the development of the digital economy in China Wang and Shang [53] measured the level of the digital economy by using the entropy weight method, which proved that the development of the digital economy can significantly inhibit carbon emissions. In addition, in other fields, Petrovi et al. [54] used the entropy method combined with the TOPSIS method to evaluate the annual operation efficiency of passenger and freight road transportation in Serbia. Zhang et al. [55] used the entropy weight method and the TOPSIS method to verify the panel data of blockchain industry development in 15 provinces in China. However, the adoption of such objective methods may be limited by the quality and completeness of the available data, and in addition, they often fail to fully capture the nuances of expert knowledge or the background factors specific to decision-making issues. The hybrid method combines objective and subjective weighting techniques, aiming at reducing potential bias and using the insights of domain experts [56]. These methods benefit from the advantages of subjective methods, extract expert knowledge, and combine it with objective weighting methods to reduce the inconsistency and noise of expert responses [57]. In application, the LBWA and MULTIMOOSRAL models are the latest methods used at present. The existing literature shows the application of LBWA in various real-life scenarios; for example, Biswas et al. [58] used the actual score (AS) measure of the image blur number (PFN) to extend the basic frame of LBWA in the image blur (PF) environment, and applied this extended frame to solve practical problems related to social entrepreneurship or social entrepreneurs (SEs) under the background of COVID-19. Biswas et al. [59] applied the comprehensive group decision-making framework of PIPRECIA and used the level-based weight evaluation LBWA to determine facility location planning. Jakovljevic et al. [60] proposed a new MCDM technology, which sorted the alternatives by defining the relationship between ideal and anti-ideal alternatives (RADERIA), and applied it to the human resource evaluation of transportation companies. On the other hand, the application of the MULTIMOOSRAL method has not reached the diffusion level. Some recent applications of the MULTIMOOSRAL method include supplier selection [61], sustainable energy selection [62], and so on. However, when subjective knowledge and opinions need to be consistent with the measurement standard of data information, the hybrid method is particularly useful and can provide highly reliable and robust results. However, the mixed weight method is not effective for problems with highly personalized characteristics, where expert preference should be given priority in the evaluation process.
In this paper, subjective evaluation methods rely on the subjective judgment and experience of evaluators. Different evaluators may achieve different results due to personal preferences and cognitive differences, lacking objectivity and consistency. There are many countries along the Belt and Road, and their development status and resource endowment are different. Therefore, it is difficult for subjective evaluation methods to comprehensively and accurately consider the relationship and importance of various indicators for complex multi-index evaluation problems, and it is also difficult for us to find an effective and comprehensive subjective evaluation method [63]. In addition, there are few studies on the application of new methods, such as LBWA, MULTIMOOSRAL, and Fuzzy-RANCOM, in the field of the digital economy and carbon emissions. At the same time, due to the complex environment of countries along the Belt and Road, we need to be cautious about the introduction of new methods. However, objective weighting methods determine the weight based on the discrete degree of the data themselves, which is not interfered by subjective factors; they can reflect the actual situation more truly and are more suitable for the evaluation of complex systems. At the same time, the introduction of the TOPSIS method [64], by calculating the relative closeness of each scheme to the ideal solution and the negative ideal solution, can more intuitively and accurately rank and optimize multiple schemes, not only fully considering the objective weight of each index but also synthesizing the overall performance of each scheme under all indicators; it can provide a more comprehensive, targeted, and operable basis for decision-making, thus making the evaluation result more scientific and reasonable.
The entropy method can objectively determine the weight of multi-dimensional indicators, and the TOPSIS method can approximate the ideal ranking of multi-objective decisions and achieve better evaluation results [65]. In addition, the entropy weight TOPSIS comprehensive evaluation method is commonly used for measuring the level of the digital economy. In recent years, a large number of scholars have applied this method to this field. Zhang et al. [66] adopted the entropy weight TOPSIS method to determine the development level of the digital economy and new urbanization through the degree of deviation or proximity to positive and negative ideal solutions of each index. Ouyang and Li [67] established the comprehensive evaluation index system of rural revitalization and the digital economy, and then measured the level of rural revitalization and the digital economy with the help of the entropy weight method and TOPSIS. Similarly, Qiu [68] constructed the evaluation index system of the digital economy from five dimensions, digital infrastructure, digital innovation, industrial digitalization, digital industrialization, and digital governance, and then made an empirical evaluation and analysis of the development level of the digital economy in 30 provinces of China from the regional level by using the entropy TOPSIS method. Wang et al. [69] used the entropy TOPSIS method to evaluate the development level of the digital economy in nine provinces (regions) of the Yellow River Basin from 2016 to 2020. He et al. [64] selected 25 index systems related to the digital economy level from the CNKI database and then selected the entropy weight TOPSIS method to calculate the final digital measurement value. Fu et al. [70] applied the relative objective entropy weight TOPSIS method to construct the digital platform openness index (DPOI) which they used to evaluate the openness of 22 digital platforms in China.
Therefore, this paper draws on the practices of Guo et al. [4] and He et al. [64], adopting a combination of the entropy method (objective weighting) and TOPSIS to determine the index weights of the digital economy index system. By using Stata 18 calculation, the index weights are presented in Table 1 (Digital economy index). The weight calculation process is as follows:

Table 1.
Evaluation index system of digital economy.
- (1)
- Entropy method (objective weighting)
Step 1: collect seven secondary index data points of 80 countries along the Belt and Road from 2010 to 2022 and standardize the original data by using the range method. In order to avoid the meaningless index when taking the entropy value, a smaller real number of 0.0001 is added to the collected data:
where i is the country, j is the j th indicator, and t is the year. is the data of the j index of the i th country in the t year, is the standardized data, and and are the maximum and minimum values of the j index, respectively.
Step 2: calculate the sample weight and entropy value.
Pijt = , where r is the number of countries and t is the number of years.
Step 3: calculate the difference coefficient (redundancy) of item i.
Dj = 1 − Ej
Step 4: calculate the index weight and index comprehensive score.
, where s represents the number of secondary indicators.
The weights calculated by using the entropy method are shown in Table 1.
- (2)
- TOPSIS analysis
Step 1: obtain the weighted standardized decision matrix by combining the standardized matrix with the weights obtained by using the entropy weight method.
Step 2: determine the ideal solution and the negative ideal solution.
Step 3: calculate the distance from each evaluation object to the positive and negative ideal solutions.
Step 4: calculate the comprehensive evaluation index.
4.3. Variables and Data Sources
In this paper, the list of countries participating in the “Belt and Road” initiative was obtained, and based on the availability and completeness of the data, some countries with missing data were excluded. Ultimately, panel data from 80 countries along the “Belt and Road” were selected as the samples for this study, covering the period from 2010 to 2022. The selected sample countries along the Belt and Road are shown in Appendix A. To ensure the robustness of the research, the 80 countries span all continents. Trend extrapolation and exponential smoothing techniques were employed to supplement missing data for some countries, further enhancing the reliability of the study. To avoid large data differences and potential heteroscedasticity issues, the carbon emission intensity was logarithmically transformed. The ratio of the output value of the tertiary industry to the output value of the secondary industry was reduced by 5% during data processing using Stata 18.
For example, Table 2 shows the correlation variable. The variables explained in this paper are as follows: lnce: the logarithm of carbon emission intensity; total carbon emissions divided by the GDP of each country; and carbon emission intensity, which is used to measure a country’s carbon emission level as it not only pays attention to carbon emissions but also reflects the development level of the GDP of each country. The core explanatory variable is dig: the digital economy index. There is no unified method to measure the digital economy in the world. The method usually adopted by academic circles is to build a digital economy index to measure the development level of the digital economy in countries and regions. Therefore, this paper uses three first-level indicators and seven second-level indicators to build a digital economy index system and calculate the digital economy indexes of various countries. The intermediate variables are as follows: the ratio of the output value of the tertiary industry to the output value of the secondary industry (thse), the intensity level of one-time energy use (elev), and the export of high-tech products, which accounts for the export of manufactured goods (TEC). We use the intensity level of disposable energy to measure the level of energy utilization. The level of technological progress is measured by the number of patent applications by residents. The ratio of the output value of the tertiary industry to the output value of the secondary industry is used to measure industrial upgrading. The control variables are as follows: seper: the degree of industrialization; PCG: GDP per capita, calculated as the GDP of each country/the total population of each country; City: the proportion of urban population in the national population.
4.4. Modeling
(1) In view of the first hypothesis proposed in this paper—that the development of the digital economy in countries along the Belt and Road has a direct driving effect on promoting carbon emission reduction—this paper explores the causal relationship between these factors from an economic perspective to verify the first hypothesis. Drawing on the practices of Qing [63] and Liu et al. [31], a benchmark panel regression model is constructed which will serve as the benchmark model for subsequent empirical analysis.
Among them, i represents the country and t represents the year. represents the logarithm of the carbon emission level of the i-th country in the t-th year. represents the intercept term. and represent regression coefficients. j is the j-th control variable, and indicates the value of the j-th control variable of the i-th country in the t-th year. n is the number of control variables. represents the individual fixed effects that have cross-sectional changes but no changes over time. represents the time fixed effects that have no cross-sectional changes but change over time. represents the random error term.
(2) The benchmark model is constructed to verify that the growth of the digital economy can effectively promote carbon emission reduction, which helps to validate Hypothesis 1. In addition to direct effects, the digital economy may also have indirect effects on promoting carbon emission reduction, including but not limited to technological progress and energy efficiency [63] and industry restructuring [32]. Therefore, this paper constructs a mediation effect model to test whether there is a mediation effect. Currently, the most commonly used methods for testing mediation effects are Baron and Kenny’s [71] stepwise regression method, the three-step method of Wen et al. [72], and the two-step method of Jiang [73]. Jiang [73] argues that due to endogeneity issues, the mediation effect verified by the three-step method can only be considered associative rather than causal. However, there is limited research verifying the feasibility of the two-step method. This paper refers to Baron and Kenny’s [71] causal steps method to test the possible mediation effect and explore the indirect effect of the digital economy on carbon emission reduction. The mediation effect model is constructed as follows:
Among them, i represents the country, t represents the year, represents the number of patents of the i-th country in the t-th year, represents the one-time energy use intensity level of the i-th country in the t-th year (calculated in constant US dollars in 2011), and represents the ratio of the output value of the tertiary industry to the output value of the secondary industry of the i-th country in the t-th year. , , , , and represent the intercept term, while , , , , , and and , , , , , and represent the regression coefficients.
4.5. Data Characteristic
In order to understand the basic characteristics of the variables used in this paper, a descriptive statistical analysis is conducted on these variables, and the results are as follows:
Table 2 and Table 3 show the definitions of the main variables and their descriptive statistics, respectively.
Table 3.
Descriptive statistics.
Table 2.
Correlation variable.
Table 2.
Correlation variable.
| Variable Name | Variable Symbol | Variable Attribute | Data Source |
|---|---|---|---|
| Logarithm of carbon emission intensity | lnce | Explained variable | World Bank database |
| Digital economic index | dig | Core explanatory variable | Digital economy index system |
| Proportion of industrial output value | thse | mediator variable | World Bank database |
| Intensity level of disposable energy use | elev | mediator variable | World Bank database |
| Export of high-tech products accounts for export of manufactured goods | TEC | mediator variable | World Bank database |
| Per capita GDP | PCG | mediator variable | World Bank database |
| Degree of industrialization | seper | mediator variable | World Bank database |
| Urbanization rate | city | mediator variable | World Bank database |
| Foreign direct investment | FDI | mediator variable | World Bank database |
Calculated by Stata 18, as shown in Table 3, the average value of the log carbon emission level (lnce) is 1.375, the standard deviation is 0.642, and the maximum and minimum values are 2.498 and 0.232, respectively. The average value of the digital economic index (dig) is 0.0487, the standard deviation is 0.0439, and the maximum and minimum values are 0.169 and 0.006, respectively. It shows that compared with the carbon emission level, the digital economy is different in different countries and different years. Because there are seven secondary indicators used to evaluate the digital economy, there are great differences among countries in the seven indicators, so the development of the digital economy level in different countries is more unbalanced. The standard deviation of per capita GDP and the net inflow of foreign direct investment in each country reaches 11.4 and 62.72, respectively, further explaining the development differences in different countries and different years. Generally speaking, there are considerable differences in the selected variables, which reflects that there are obvious differences in many fields in different countries in different periods.
Multicollinearity is a serious problem in the setting and testing of models. If there is serious multicollinearity between the variables of the benchmark model, the empirical results of the benchmark model will be greatly disturbed. In order to eliminate the interference of multicollinearity, this paper first analyzes the correlation of the variables selected in the benchmark model and tests the multicollinearity. From the correlation analysis in Table 4, it can be seen that the correlation between the explained variable, carbon emission intensity (lnce), and the core explanatory variable (dig) is significant at the level of 1%, indicating that there is a clear correlation between them. The VIF (Variance Inflation Factor) is usually used to test multicollinearity. As shown in Table 5, in the multicollinearity test, the VIF values of the variables are all less than 5, and the average value of the VIF is 1.55, which shows that there is no serious multicollinearity problem in the benchmark model, and that the model meets the empirical requirements, so further regression analysis can be carried out. According to the unit root test results in Table 6, the values of all variables are stable.
Table 4.
Correlation analysis.
Table 5.
Multiple collinearity test.
Table 6.
Unit root test.
5. Empirical Results and Analysis
5.1. Benchmark Regression Model
As shown in Table 7, the regression coefficient between the digital economy index and carbon emission intensity is negative without adding the control variables, and the result is significant at the level of 1%, indicating that the development of the digital economy can inhibit carbon emission intensity. Considering that the regression results are disturbed by other factors, the control variables such as urbanization level, per capita GDP, direct foreign investment level, and the proportion of the output value of the secondary industry to the gross national product are gradually added to the benchmark regression model for re-examination. The results show that the regression coefficient between the digital economy index and carbon emission intensity is always negative, and the regression coefficient is always significant at the level of 1%, which verifies H1; that is, the development of the digital economy can promote carbon emission reduction through direct effects.
Table 7.
Benchmark regression results of promotion effect of digital economy on carbon emission reduction.
5.2. Robustness Test
In the process of promoting carbon emission reduction through the development of the digital economy, endogenous problems may arise due to model selection, reverse causality, or other factors. For example, the development level of the digital economy cannot immediately affect carbon emission reduction, and there is a certain gap between them. Different countries are at different stages of development, adopt different economic policies, and have different levels of acceptance of the digital economy. The OLS model or the random-effects model may be more realistic than the fixed-effects model. Such factors may lead to the correlation between the explanatory variables and error terms, further affecting the empirical results. Therefore, referring to the practices of She [68] and Qing [63], this paper adopts the following measures to verify the robustness: using the Hausman test; taking the exponential lag of the digital economic index as a tool variable and adopting the two-stage least square method (2SLS) for regression; deleting some regression samples; replacing the core explanatory variables with per capita carbon emissions; using the lagging variable test.
- (1)
- Hausman inspection
The mixed OLS method, fixed-effects model, and random-effects model are usually used in benchmark regression of panel model. Therefore, this paper uses the mixed OLS method and the fixed-effect models to test the model (1), selects the better model through comparison, tests the model (1) with the random-effect models, and compares the random-effects model and the fixed-effects model by using the Hausman test to decide on the final model. After testing, the fixed-effects model has p = 0 < 0.05, and the individual effect is significant, so the fixed-effects model is better than the mixed OLS model. As shown in Table 8, after the houseman test, the fixed-effects model has p = 0 < 0.05, so the fixed-effects model is superior to the random-effects model. Therefore, this paper uses the fixed-effect models for benchmark regression.
Table 8.
Hausman inspection.
- (2)
- Two-stage least square method (2SLS method) and adjusting sample
The two-stage least square method (2SLS) is often used to test the endogeneity caused by bidirectional causality between variables. In this paper, the digital economic index (dig) is taken as a tool variable, and then the two-stage least square method (2SLS) is adopted. As shown in column (1) of Table 9, the weak instrumental variable hypothesis and the unrecognized hypothesis are adopted, and the regression coefficient is significant at the level of 1%. In the second stage, considering the impact during the COVID-19 epidemic, the samples from 2010 to 2019 are selected and regressed after adding the instrumental variables. As shown in the second column of Table 9, the regression coefficient of the digital trade development index to carbon emission intensity is −1.140, and the regression coefficient is significant at the level of 5%. The two regression coefficients are both negative, the numerical difference is not significant, and the regression coefficients are both significant. The above test shows that the instrumental variables selected in this paper are reasonable and can be used for regression testing, and the effect of the digital economy on promoting carbon emission reduction is still significant under the two-stage least square method with instrumental variables. The results are close to those of the benchmark regression model, which proves that the benchmark regression model is relatively stable.
Table 9.
Two-stage least square method and adjusting sample.
- (3)
- Replace the explained variables
Considering that the digital economy index varies greatly among countries, lnce (logarithm of carbon emission intensity) is selected as the explained variable in the previous model. We let go of this assumption in the robustness test, replace lnce (logarithm of carbon emission intensity) in the benchmark regression model with PC (per capita carbon emission, total carbon emission of each country/population of each country), and regress to test the robustness. As shown in column (1) of Table 10, the regression coefficient of the core explanatory variable dig (digital economy index) to the explained variable PC is still significant at the level of 1%, which proves that the regression of the benchmark regression model is relatively robust.
Table 10.
Replacing variables and lagging variable test.
- (4)
- Lagging variable test
In order to solve the model’s endogeneity and investigate the lag of the impact of the development of the digital economy on carbon emissions, the digital economy was treated as lag phase I and lag phase II, and then re-entered into the model regression. As shown in columns (2) and (3) of Table 10, the regression coefficient of the digital economy index to carbon emission intensity is still negative, and it is significant at the level of 0.01, which proves that the results of the benchmark regression are still robust. It also shows that the development of the digital economy lags behind the carbon emissions of countries along the Belt and Road; that is, the development of the digital economy in countries along the Belt and Road can promote carbon emission reduction through direct effects.
5.3. Heterogeneity Analysis
5.3.1. Heterogeneity of Geographical Location
There are numerous countries along the “Belt and Road”, and differences in resource endowments and development levels among these countries may influence the development of the digital economy and carbon emission intensity, potentially impacting the regression results. Therefore, this paper categorizes the selected 80 countries into five groups based on their continents—Asia and Oceania, Europe, Africa, North America, and Latin America and South America—and conducts group regression to explore the impact of the digital economy on carbon emission intensity in countries on different continents.
As shown in Table 11, the digital economy has achieved remarkable results in promoting carbon emission reduction in countries along the “Belt and Road” in Africa and Europe. Africa has a large demand for infrastructure construction, a large space for industrial structure optimization, and abundant renewable energy, while Europe benefits from high digital technology, strict environmental policies, and leading energy structure transformation. In Asia, the inconspicuous effect may be due to the huge group of developing countries, the great differences in the development stages of the digital economy, the complex industrial structure, and the unreasonable energy structure. In America, the inconspicuous effect may be due to the unbalanced digital economy structure, imperfect policies and market mechanisms, and special energy consumption structure.
Table 11.
Analysis of geographical location heterogeneity.
5.3.2. Heterogeneity of Development Stage
Due to the different development stages of countries along the “Belt and Road”, these countries inevitably have great differences in economic and cultural development levels, scientific and technological progress, factor endowment, and other related factors. These differences may greatly affect the effectiveness of digital economy development in reducing carbon emissions in countries along the route. Therefore, based on the classification method of national development stages provided by the United Nations, this paper divides the 80 sample countries into three groups: developed countries, developing countries, and least developed countries. Developed countries include 18 countries such as Singapore and Italy; developing countries are made up of 50 countries, including China, Cuba, and Lebanon; least developed countries include 12 countries, such as Cambodia, Uganda, and Zambia. By constructing a benchmark regression model and analyzing it by grouping regression, this study aims to explore the impact of digital economy development on carbon emission intensity in countries along the Belt and Road at different stages.
As shown in Table 12, the effect of the digital economy in promoting carbon emission reduction is more significant in developed countries than in developing countries, but the effect is nonexistent in the least developed countries. In developed countries, digital technology is advanced and can be widely used in various industries to improve production efficiency and reduce energy consumption accurately and efficiently. At the same time, its strict environmental policy promotes enterprises to use digital technology to reduce emissions, and the energy structure transformation is also ahead. These factors make the digital economy have a significant effect on carbon emission reduction. However, the digital economy in developing countries is in the development stage, the infrastructure and technology application are not perfect, the industrial structure is complex, the proportion of traditional industries is high, and the energy structure is not sufficient, which limits the role of the digital economy in promoting carbon emission reduction. In the least developed countries, due to the lack of basic conditions for the development of the digital economy, such as technology, capital, infrastructure, etc., industries mostly exist in the form of high energy consumption and low efficiency, and it is difficult to effectively reduce emissions through the digital economy, so the effect of the digital economy in promoting carbon emission reduction is completely invisible.
Table 12.
Heterogeneity analysis of development stage.
5.3.3. Heterogeneity of Maritime Silk Road and Land Silk Road Countries
According to different geographical and traffic factors, we study the impacts of economic development in countries along the Maritime Silk Road and the Land Silk Road on carbon emissions, because the countries along the Maritime Silk Road have boosted their economies by virtue of marine trade and marine industry, and the carbon emissions generated by their activities, such as the shipping and port industry, have a unique formation mechanism and influencing scope, which are related to marine ecology and regional sustainable trade. Countries along the Land Silk Road mainly rely on land transportation and cross-border economic and trade cooperation to develop their economies. The energy consumption structure and industrial carbon emission characteristics are obviously different from those in coastal areas, as shown in Table 13, columns (1) and (2). In terms of the effect of the digital economy in promoting carbon emission reduction, countries along the Land Silk Road are more obvious than those along the Maritime Silk Road, and the coefficient is larger. As seen from historical factors, the Land Silk Road has a long tradition of economic and trade exchanges, which is conducive to digitally remolding the traditional model to reduce emissions. In addition, countries along the Land Silk Road are in the stage of rapidly upgrading their industrial structure, and the digital economy can quickly meet the demand to reduce emissions, while countries along the Maritime Silk Road rely heavily on the traditional marine industry and have many constraints on industrial transformation. In addition, the port transformation of countries along the sea faces financial and technical problems, and intelligent upgrading is slow. The transformation of transportation hubs in countries along the Land Silk Road is difficult, and energy conservation can be achieved quickly by using the digital economy.
Table 13.
Heterogeneity analysis of Maritime Silk Road and Land Silk Road countries and territorial contiguity.
5.3.4. Heterogeneity of Proximity to China
It is important to study the influence of economic development on carbon emissions from the countries along the Belt and Road, which border our territory, because the countries that border China are more closely linked with China in terms of economic and trade exchanges, energy cooperation, infrastructure interconnection, and other aspects, and their economic development model and carbon emissions are influenced by geographical factors, which can help us accurately grasp the changing trend of carbon emissions between China and neighboring countries at different degrees, thus providing a strong basis for differentiated coordinated emission reduction and green development strategies. As shown in Table 13, columns (3) and (4), the digital economy development of countries along the Belt and Road bordering the territory of China has a greater coefficient of action in promoting carbon emission reduction, which shows that the countries along the Belt and Road are relatively concentrated and bordered, and it is convenient to build a regional integration low-carbon model for coordinated emission reduction.
5.4. Mechanism Test
The direct effect of the digital economy on carbon emission reduction has been discussed in the empirical section, and the benchmark regression has been completed, including the robustness test and multicollinearity test of the benchmark regression. To further verify the effect of the development of the digital economy on carbon emission reduction, this paper proposes Hypothesis 2 (H2): the digital economy can promote carbon emission reduction through indirect effects. Drawing on the practices of Yang et al. [27] and Jin et al. [25], taking the TEC as an intermediary variable to verify the technological progress channel, taking the level of one-time energy intensity (elev) as an intermediate variable to verify the energy efficiency channel [74] and using the ratio of the output value of the tertiary industry to the output value of the secondary industry (thse) as the intermediary variable to verify the industrial structure upgrading channel, the intermediary effect model is employed to study whether there are indirect channels through which the development of the digital economy in countries along the Belt and Road Initiative can promote carbon emission reduction [75].
5.4.1. Technological Innovation Channel
The causal step method is used to test the mediating effect of TEC as a mediating variable. The results are shown in Table 14. Under the benchmark model in the first column of the table, the coefficient between the digital economy and carbon emission intensity is significant at the level of 1%, indicating that the digital economy can promote carbon emission reduction through direct effects. In column (2) of the table, the explained variable is changed to TEC for regression, and it is found that the regression coefficient between the digital economy and TEC is significant at the level of 1%, which shows that the development of the digital economy has promoted technological progress. In column (3) of the table, TEC and dig are added to the benchmark regression model. After regression, the regression coefficients between TEC, dig, and carbon emission intensity are all negative, and they are significant at the level of 1%, indicating that technological progress can promote carbon emission reduction. This shows that the development of the digital economy in countries along the Belt and Road can promote carbon emission reduction through indirect routes of technological progress, which verifies H2.
Table 14.
The test results of the mechanism of technological innovation channels.
5.4.2. Industrial Structure Upgrading Channel
As shown in Table 15, columns (1) and (2), respectively, regress the relationship between dig and lnce as explanatory variables and the relationship between thse and dig as interpreted variables. The regression results show that the digital economic index can promote the upgrading of industrial structure, which is significant at the level of 5%. Count. In column (3) of the table, thse and dig are added to the basic regression model, and it is found that their coefficients with the logarithm of carbon emission intensity are significant at the level of 1%; that is, the upgrading of industrial structure can promote carbon emission reduction. This shows that the digital economy can promote carbon emission reduction through the rationalization and upgrading of industrial structure; that is, the digital economy along the Belt and Road can indirectly promote carbon emission reduction through the upgrading of industrial structure, which verifies H3.
Table 15.
The test results of the mechanism of industrial structure upgrading channels.
5.4.3. Energy Intensity Channel
The third intermediate test in this paper chooses the intensity of primary energy use as the intermediate variable. As shown in Table 16, item (2) in the table is the regression result with energy intensity as the explained variable. It can be seen that the regression coefficient between the digital economy index and energy efficiency is negative, and it is significant at the level of 1%, which shows that the higher the digital economy index, the lower the one-time energy intensity level, and verifies that the development of the digital economy can reduce the energy intensity level of various countries. In column (3) of the table, elev and dig are added to the benchmark regression model for regression, and the regression coefficient between the energy intensity level and carbon emission intensity is positive, which is significant at the level of 1%, indicating that the higher the energy intensity level, the higher the carbon emission level. This shows that the development of the digital economy in countries along the Belt and Road can promote carbon emission reduction by indirectly reducing the energy intensity level, which verifies H4.
Table 16.
The test results of the mechanism of energy intensity channels.
6. Conclusions and Enlightenment
In summary, this paper concludes that the development of the digital economy in BRI countries significantly influences carbon emission reduction both directly and indirectly. Indirect effects manifest through alterations in industrial structure, reductions in energy intensity, and advancements in technology, which in turn impact production and consumption patterns.
From a heterogeneity analysis perspective, the direct effect of the digital economy on carbon emissions shows significant differences across regions. In Africa and Europe, the effect is pronounced at the 1% significance level, whereas in Asia, Oceania, and the Americas, no significant impact is observed. Notably, there are substantial disparities in the development levels of the digital economy among continents. Developed countries exhibit a more pronounced role in promoting carbon emission reductions compared to developing countries, while the least developed countries show little to no significant effect. Moreover, the influence of the digital economy on carbon emission reductions is more significant for countries along the Land Silk Road than for those along the Maritime Silk Road. Specifically, countries bordering China along the Silk Road benefit from a higher coefficient of promotion regarding carbon emission reductions due to their digital economies. The countries of the “Belt and Road” Initiative (BRI) exhibit a wide geographic distribution and diverse national conditions, making it impractical to apply a one-size-fits-all approach to digital economy policies.
For developed nations and Maritime Silk Road countries, optimizing the innovation environment for the digital economy and sharing digital technologies can significantly enhance global efforts toward carbon emission reduction. Given the considerable disparity in innovation capabilities among BRI countries, all parties should prioritize the training of digital technology innovators. Strengthening international cooperation to share advanced digital technologies will further support the development of digital technology both domestically and internationally.
Developing countries and those along the Land Silk Road must expedite the transformation of their industrial and energy structures to contribute to carbon emissions reductions. It is crucial to balance current economic development with future sustainability. When accepting industrial transfers, these countries should emphasize the application of low-energy and low-pollution technologies to prevent increased carbon intensity. Concurrently, active collaboration with various governments is essential to nurture domestic “green industries” that can gradually replace high-pollution, high-energy-consuming sectors.
Author Contributions
Conceptualization, X.Z.; methodology, K.C. and Z.W.; software, K.C. and Z.W.; formal analysis, Z.Z.; writing—original draft, X.Z., K.C. and Z.W.; writing—review and editing, X.Z., K.C. and Z.Z.; funding acquisition, X.Z. Z.Z. is responsible for future questions from readers as the corresponding author. All authors have read and agreed to the published version of the manuscript.
Funding
This research was funded by the Social Science Planning Fund Program, Shangdong Province, under grant number 23CSDJ70.
Institutional Review Board Statement
Not applicable.
Informed Consent Statement
Not applicable.
Data Availability Statement
The data presented in this paper are available on request from the corresponding author.
Conflicts of Interest
The authors declare no conflicts of interest.
Appendix A
| Area | Country |
| Asia and Oceania | China, UAE, Oman, Azerbaijan, Pakistan, Kazakhstan, Georgia, Qatar, Kyrgyzstan, Cambodia, Kuwait, Lebanon, Malaysia, Bangladesh, Saudi Arabia, Tajikistan, Thailand, Turkey, Turkmenistan, Uzbekistan, Singapore, Iran, Indonesia, Jordan, Vietnam, Armenia, Sri Lanka, New Zealand, and Papua New Guinea. |
| Africa | Egypt, Angola, Algeria, Ghana, Cameroon, Côte d’Ivoire, Kenya, South Africa, Morocco, Senegal, Selali, Tunisia, Uganda, Chad, Central Africa, Zambia, Benin, Burkina Faso, Ethiopia, Madagascar, and Nigeria. |
| Europe | Albania, Estonia, Austria, Belarus, Bulgaria, Poland, Russia, Czech Republic, Croatia, Romania, Portugal, Slovakia, Greece, Hungary, Italy, and Serbia. |
| South America | Argentina, Peru, Bolivia, Ecuador, Guyana, Venezuela, Uruguay, and Chile. |
| North America and Latin America | Panama, Dominican Republic, Grenada, Cuba, Nicaragua, Costa Rica, and Honduras. |
References
- United Nations. United Nations. United Nations Conference on Trade and Development. In Digital Economy Report; United Nations: Geneva, Switzerland, 2021; Volume 2021, pp. 1–21. [Google Scholar]
- Feng, D.L.; Shen, S.Z. The relationship between symbiosis environment and the China’s OFDI efficiency: Empirical evidence based on the perspective of five links of the “the Belt and Road”. Econ. Probl. 2023, 4, 21–30. [Google Scholar]
- The Central People ’s Government of the People ’s Republic of China. Jointly Building the “Belt and Road”: A Major Practice in Building a Community of Shared Future for Mankind; The State Council Information Office of the People’s Republic of China: Beijing, China, 2023.
- Guo, C.; You, J.X.; Peng, B.D.; Xu, H.J. A model for evaluating pilots’ competency based on entropy weight-AHP method and TOPSIS. J. Tongji Univ. 2023, 51, 1983–1990. [Google Scholar]
- Wu, Q.Q.; Qalati, S.A.; Hussain, R.Y.; Irshad, H.; Tajeddini, K.; Siddique, D.; Gamage, T.C. The effect of enterprises’ attention to digital economy on innovation and cost control: Evidence from A-stock market of China. J. Innov. Knowl. 2023, 8, 100415. [Google Scholar]
- Zhang, X.; Wan, G.H.; Zhang, J.J.; He, Z.Y. Digital economy, financial inclusion, and inclusive growth. Econ. Res. J. 2019, 54, 71–86. [Google Scholar]
- Zhao, T.; Zhang, Z.; Liang, S.K. Digital economy, entrepreneurship, and high-quality economic development: Empirical evidence from urban China. J. Manag. World 2020, 10, 65–75. [Google Scholar]
- Zuo, X.M.; Xia, B.Q. Research on the upgrading of industrial structure empowered by digital economy from the perspective of regional innovation. Financ. Theory Pract. 2023, 10, 44–53. [Google Scholar]
- Afolabi, J.A. Advancing digital economy in Africa: The role of critical enablers. Technol. Soc. 2023, 75, 102367. [Google Scholar] [CrossRef]
- Shahbaz, M.; Wang, J.D.; Dong, K.Y.; Zhao, J. The impact of digital economy on energy transition across the globe: The mediating role of government governance. Renew. Sust. Energ. Rev. 2022, 166, 112620. [Google Scholar] [CrossRef]
- Jiang, H.L.; Wang, W.D.; Wang, L.; Wu, J.H. The effects of the carbon emission reduction of China’s green finance—An analysis based on green credit and green venture investment. J. Mod. Financ. 2020, 11, 39–48. [Google Scholar]
- Meng, Y.X.; Liu, L.; Ran, Q.Y. Does green finance improve energy efficiency?—Based on a Chinese government R&D subsidy perspective. Ecol. Econ. 2023, 39, 45–53. [Google Scholar]
- Zhang, T.F.; Yang, J.; Sheng, P.F. The impacts and channels of urbanization on carbon dioxide emissions in China. China Popul. Resour. Environ. 2016, 26, 47–57. [Google Scholar]
- Shao, S.; Zhang, K.; Dou, J.M. Effects of economic agglomeration on energy saving and emission reduction: Theory and empirical evidence from China. J. Manag. World 2019, 35, 36–60. [Google Scholar]
- Dewarlheyns, N.; Schoubben, F.; Struyfs, K.; Hulle, C.V. The influence of carbon risk on firm value: Evidence from the European Union Emission Trading Scheme. J. Environ. Manag. 2023, 344, 118293. [Google Scholar] [CrossRef] [PubMed]
- Zhang, Y.X.; Zeng, S.B.; Wu, Q.S.; Fu, J.Y.; Li, T.P. A study on the impact of the carbon emissions trading policy on the mining industry based on Porter hypothesis. Resour. Policy 2023, 87, 104349. [Google Scholar] [CrossRef]
- Derindag, O.F.; Maydydura, A.; Kalra, A.; Wang, W.K.; Chang, B.H. Carbon emission and the rising effect of trade openness and foreign direct investment: Evidence from a threshold regression model. Heliyon 2023, 9, e17448. [Google Scholar] [CrossRef] [PubMed]
- Wang, L.; Fang, X.M. Digital technology empowers coupling and coordinated development between economic growth and carbon emissions. J. Tech. Econ. Manag. 2024, 10, 7–13. [Google Scholar]
- Zuo, X.H.; Qian, P.C. Research on the impact of carbon emission reduction empowered by the development of the digital economy. Tax. Econ. 2024, 5, 54–63. [Google Scholar]
- Ma, Y.F.; Liu, B.B. How the digital economy affects carbon intensity—Based on the empirical evidence of the chain mediation effect of technological innovation and high-quality development of the industrial chain. J. Xi’an Univ. Technol. 2024, 1–11. [Google Scholar]
- Shi, X.T. Research on the impact of digital trade on China’s carbon emissions reduction under the background of dual carbon. Prices Mon. 2024, 7, 28–38. [Google Scholar] [CrossRef]
- Li, Y.; Jiang, Q.S. Analysis of carbon emission reduction effect of digital economy: Based on the dual path analysis of production and consumption. J. Nanjing Audit. Univ. 2023, 20, 81–90. [Google Scholar]
- Wang, L.; Zhao, Z.Y.; Xu, X.J. The impact and mechanism of digital economy on carbon emissions. J. Hebei Univ. Econ. Bus. 2024, 45, 45–59. [Google Scholar]
- Wei, Z.W.; Fan, F. The impact of digital trade on carbon emissions based on the empirical evidence of 48 countries along the Belt and Road. Mod. Econ. Res. 2023, 8, 65–77. [Google Scholar]
- Jin, G.C.; Wang, G.L.; He, Y.R. Digitization level, industrial structure adjustment and regional carbon emission reduction. Stat. Decis. 2023, 3, 27–32. [Google Scholar]
- Wang, Y.F.; Liu, J. Carbon emission reduction effect of China′s regional digital trade under the dual carbon target. Soft Sci. 2023, 37, 73–79. [Google Scholar]
- Yang, G.Q.; Wang, H.S.; Fan, H.S.; Yue, Z.Y. Carbon reduction effect of digital economy: Theoretical analysis and empirical evidence. China Ind. Econ. 2023, 5, 80–98. [Google Scholar]
- Wang, W.G.; Wang, Y.L.; Fan, D. Effects and mechanisms of the digital economy for carbon emission reduction. China Environ. Sci. 2023, 43, 4437–4448. [Google Scholar]
- Wang, W.J.; Hu, C.J. Digital finance, scientific and technological innovation and carbon emission: Empirical study based on provincial panel data. J. Tianjin Univ. Commer. 2022, 42, 40–48. [Google Scholar]
- Zhu, H. Research on the relationship between digital economy and carbon emissions reduction: From the perspective of new structural economics. Secretary 2022, 4, 84–95. [Google Scholar]
- Liu, L.J.; Zhang, J.J.; Zeng, Y.T. On the effect of digital economy on promoting high-quality development of the co-constructing of the Belt and Road. J. Cent. South Univ. Soc. Sci. 2022, 28, 122–135. [Google Scholar]
- Han, J.; Jiang, R.Y.; Sun, Y.W. Digital service trade and carbon emissions—Empirical research based on 50 countries. Int. Bus. 2021, 6, 34–49. [Google Scholar]
- Qi, Y.D.; Liu, H.H. A study on the factor property and the market-oriented allocation mechanism of data in digital economy. Econ. Rev. J. 2020, 11, 63–76. [Google Scholar]
- Jiang, X.J. Resource reorganization and the growth of the service industry in an interconnected society. Econ. Res. J. 2017, 52, 4–17. [Google Scholar]
- Liu, Y.J.; Zhang, Y.B.; Cai, X. Does the development of the digital economy lead to technological gaps or technological catch-up? Empirical evidence from the belt and road countries. Econ. Res. J. 2024, 59, 192–208. [Google Scholar]
- Zhang, C.B. How Does the digital economy affect the intensity of carbon emissions?—Based on the dual perspectives of upgrading and rationalization of industrial structure. Sci. Sci. Manag. S. T. 2024, 45, 56–73. [Google Scholar]
- Acemoglu, D.; Akcigit, U.; Hanley, D.; Kerr, W. Transition to clean technology. J. Polit. Econ. 2016, 124, 52–104. [Google Scholar] [CrossRef]
- Yusop, Z.B.; Ahmed, K.; Shirazi, S.M.; Zardari, N.H. Weighting Methods and Their Effects on Multi-Criteria Decision Making Model Outcomes in Water Resources Management; Springer: Cham, Switzerland, 2015. [Google Scholar]
- Sahabuddin, M.I.; Khan, I. Multi-criteria decision analysis methods for energy sector’s sustainability assessment: Robustness analysis through criteria weight change. Sustain. Energy Technol. Assess. 2021, 47, 101380. [Google Scholar] [CrossRef]
- Alemi-Ardakani, M.; Milani, A.S.; Yannacopoulos, S.; Shokouhi, G. On the effect of subjective objective and combinative weighting in multiple criteria decision making: A case study on impact optimization of composites. Expert Syst. Appl 2016, 46, 426–438. [Google Scholar] [CrossRef]
- Odu, G.O. Weighting methods for multi-criteria decision making technique. J. Appl. Sci. Environ. Manag. 2019, 23, 1449. [Google Scholar] [CrossRef]
- Yu, D.; Kou, G.; Xu, Z.; Shi, S. Analysis of collaboration evolution in AHP research: 1982–2018. Int. J. Inf. Technol. Decis. Mak. 2021, 20, 7–36. [Google Scholar] [CrossRef]
- Liu, Y.; Eckert, C.M.; Earl, C. A review of fuzzy AHP methods for decision-making with subjective judgements. Expert Syst. Appl. 2020, 161, 113738. [Google Scholar] [CrossRef]
- Madurai Elavarasan, R.; Leoponraj, S.; Dheeraj, A.; Irfan, M.; Gangaram Sundar, G.; Mahesh, G.K. PV-Diesel-Hydrogen fuel cell based grid connected configurations for an institutional building using BWM framework and cost optimization algorithm. Sustain. Energy Technol. Assess. 2021, 43, 100934. [Google Scholar] [CrossRef]
- Kis, Ö.; Can, G.F.; Toktas, P. Warehouse location selection for an electricity distribution company by KEMIRA-M method. Pamukkale Univ. J. Eng. Sci. 2020, 26, 227–240. [Google Scholar] [CrossRef]
- Wang, B.B. Research on the evaluation of international competitiveness of the movie industry: Based on fuzzy hierarchical analysis. Film. Art 2024, 4, 146–153. [Google Scholar]
- Han, X.; Zhang, Y.; Jiang, X.Y. Research on the competency model construction of the government chief data officer based on the hierarchical analysis method. Sci. Technol. Manag. Res. 2024, 44, 155–163. [Google Scholar]
- Xu, Z.X.; Ding, R.Z. Measurement, prediction and path selection of the quality of interprovincial economic development in China in the new era. China Rev. Political Econ. 2019, 10, 172–194. [Google Scholar]
- Mukhametzyanov, I. Specific character of objective methods for determining weights of criteria in MCDM problems: Entropy CRITIC and SD. Decis. Mak. Appl. Manag. Eng. 2021, 4, 76–105. [Google Scholar] [CrossRef]
- Sun, Z.; Hou, Y.L. How Does industrial intelligence reshape the employment structure of Chinese labor force. China Ind. Econ. 2019, 5, 61–79. [Google Scholar]
- Liu, J.; Yang, Y.Y.; Zhang, S.F. Research on the measurement and driving factors of China’s digital economy. Shanghai J. Econ. 2020, 6, 81–96. [Google Scholar]
- Zhang, X.L.; Jiao, Y.X. A preliminary study of China’s digital economy development index and its application. Zhejiang Soc. Sci. 2017, 4, 32–40. [Google Scholar]
- Wang, X.X.; Shang, J. Digital economy, economic growth and carbon emission performance improvement. Stat. Decis. 2024, 40, 124–129. [Google Scholar]
- Petrovic, N.; Živojinovic, T.; Mihajlović, J. Evaluating the annual operational efficiency of passenger and freight road transport in Serbia through entropy and TOPSIS methods. J. Eng. Manag. Syst. Eng. 2023, 2, 204–211. [Google Scholar] [CrossRef]
- Zhang, H.; Xiong, H.H.; Liu, Y.Q. Research on performance evaluation of China’s blockchain industry ecosystem based on entropy weight method and TOPSIS. Sci. Technol. Manag. Res. 2023, 43, 38–45. [Google Scholar]
- Sahin, M. Location selection by multi-criteria decision-making methods based on objective and subjective weightings. Knowl. Inf. Syst. 2021, 63, 1991–2021. [Google Scholar] [CrossRef]
- Paramanik, A.R.; Sarkar, S.; Sarkar, B. OSWMI: An objective-subjective weighted method for minimizing inconsistency in multi-criteria decision making. Comput. Ind. Eng. 2022, 169, 108138. [Google Scholar] [CrossRef]
- Biswas, S.; Majumder, S.; Pamucar, D.; Dawn, S.K. An extended LBWA framework in picture fuzzy environment using actual score measures application in social enterprise systems. Int. J. Enterp. Inf. Syst. 2021, 17, 37–68. [Google Scholar] [CrossRef]
- Biswas, S.; Pamucar, D. Facility location selection for b-schools in Indian context: A multi-criteria group decision based analysis. Axioms 2020, 9, 77. [Google Scholar] [CrossRef]
- Jakovljevic, V.; Zizovic, M.; Pamucar, D.; Stević, Ž.; Albijanic, M. Evaluation of human resources in transportation companies using multi-criteria model for ranking alternatives by defining relations between ideal and anti-ideal alternative (RADERIA). Mathematics 2021, 9, 976. [Google Scholar] [CrossRef]
- Ulutaş, A.; Stanujkic, D.; Karabasevic, D.; Popovic, G.; Zavadskas, E.K.; Smarandache, F.; Brauers, W.K. Developing of a novel integrated MCDM MULTIMOOSRAL approach for supplier selection. Informatica 2021, 32, 145–161. [Google Scholar] [CrossRef]
- Mousavi, S.A.; Hafezalkotob, A.; Ghezavati, V.; Abdi, F. An integrated framework for new sustainable waste-to-energy technology selection and risk assessment: An R-TODIM-R-MULTIMOOSRAL approach. J. Clean. Prod. 2022, 335, 130146. [Google Scholar] [CrossRef]
- Qing, C.Y. Digital Economy, Carbon Emission Reduction and High-Quality Economic Development: Based on Provincial Panel Data; Nanchang University: Nanchang, China, 2024. [Google Scholar]
- He, Y.; Wang, M.; Yuan, C. Digital economy and low-carbon trade competitiveness: A multidimensional analysis of China’s manufacturing sector. Sustainability 2025, 17, 274. [Google Scholar] [CrossRef]
- Liu, Y.J.; Tang, J.X. Measurement and spatial-temporal evolution characteristics of high-quality development Level of China’s Tourism. Stat. Decis. 2022, 38, 91–96. [Google Scholar]
- Zhang, Y.; Cao, J.J.; Han, S.D. Coupling and coordination between provincial digital economy and new urbanization and its influencing factors. Stat. Decis. 2024, 40, 116–120. [Google Scholar]
- Ouyang, Q.; Li, Z.Z. The implementation path of digital economy leading rural revitalization in Guangdong province. South China Rural. Area 2024, 40, 35–40. [Google Scholar]
- Qiu, W.H. Evaluating China’s digital economy development level based on entropy weight TOPSIS. J. Heihe Univ. 2024, 15, 60–64. [Google Scholar]
- Wang, Y.Z.; Song, G.J.; Wang, T. Evaluation of the level of digital economy development and its spatial-temporal evolution analysis in the Yellow River Basin. Yellow River 2024, 46, 11–17. [Google Scholar]
- Fu, W.; Sun, J.; Lee, X.D. Research on the openness of digital platforms based on entropy-weighted TOPSIS: Evidence from China. Sustainability 2023, 15, 3322. [Google Scholar] [CrossRef]
- Baron, R.M.; Kenny, D.A. The moderator-mediator variable distinction in social psychological research: Conceptual, strategic, and statistical considerations. J. Pers. Soc. Psychol. 1986, 51, 1173–1182. [Google Scholar] [CrossRef] [PubMed]
- Wen, Z.L.; Zhang, L.; Hou, J.T. Testing and application of the mediating effects. Acta Psychol. Sin. 2004, 5, 614–620. [Google Scholar]
- Jiang, T. Mediating and moderating effects in empirical research on causal inference. China Ind. Econ. 2022, 5, 100–120. [Google Scholar]
- Yue, S.J.; Zhang, X.H. Study on the impact of digital economy on energy intensity. J. Nanchang Univ. Soc. Sci. 2023, 54, 77–90. [Google Scholar]
- She, Q.Z.; Wu, L.; Zheng, J. Digital economy, economic aggregation and carbon emissions. Stat. Decis. 2022, 38, 5–10. [Google Scholar]
Disclaimer/Publisher’s Note: The statements, opinions and data contained in all publications are solely those of the individual author(s) and contributor(s) and not of MDPI and/or the editor(s). MDPI and/or the editor(s) disclaim responsibility for any injury to people or property resulting from any ideas, methods, instructions or products referred to in the content. |
© 2025 by the authors. Licensee MDPI, Basel, Switzerland. This article is an open access article distributed under the terms and conditions of the Creative Commons Attribution (CC BY) license (https://creativecommons.org/licenses/by/4.0/).