
Xanthan- and Gelatine-Based Composites Used as Nursery Groundcovers: Assessment of Soil Microbiology and Seedling Performance

 , , , , , , ,
  , , and
Abstract
1. Introduction
- Can the developed groundcovers improve early plant performance in terms of vegetative status and growth?
- Are they effective in controlling weed proliferation?
- Do they have any influence on the community composition and activity of the soil microbiota?
- How do they perform compared to commercially available alternatives?
2. Materials and Methods
2.1. Materials
2.2. Sample Preparation
2.3. Experimental Techniques
2.3.1. Evaluation of Groundcover Effects on Seedling Performance
2.3.2. Determination of Soil Properties
2.3.3. Microbiological Analysis
3. Results and Discussion
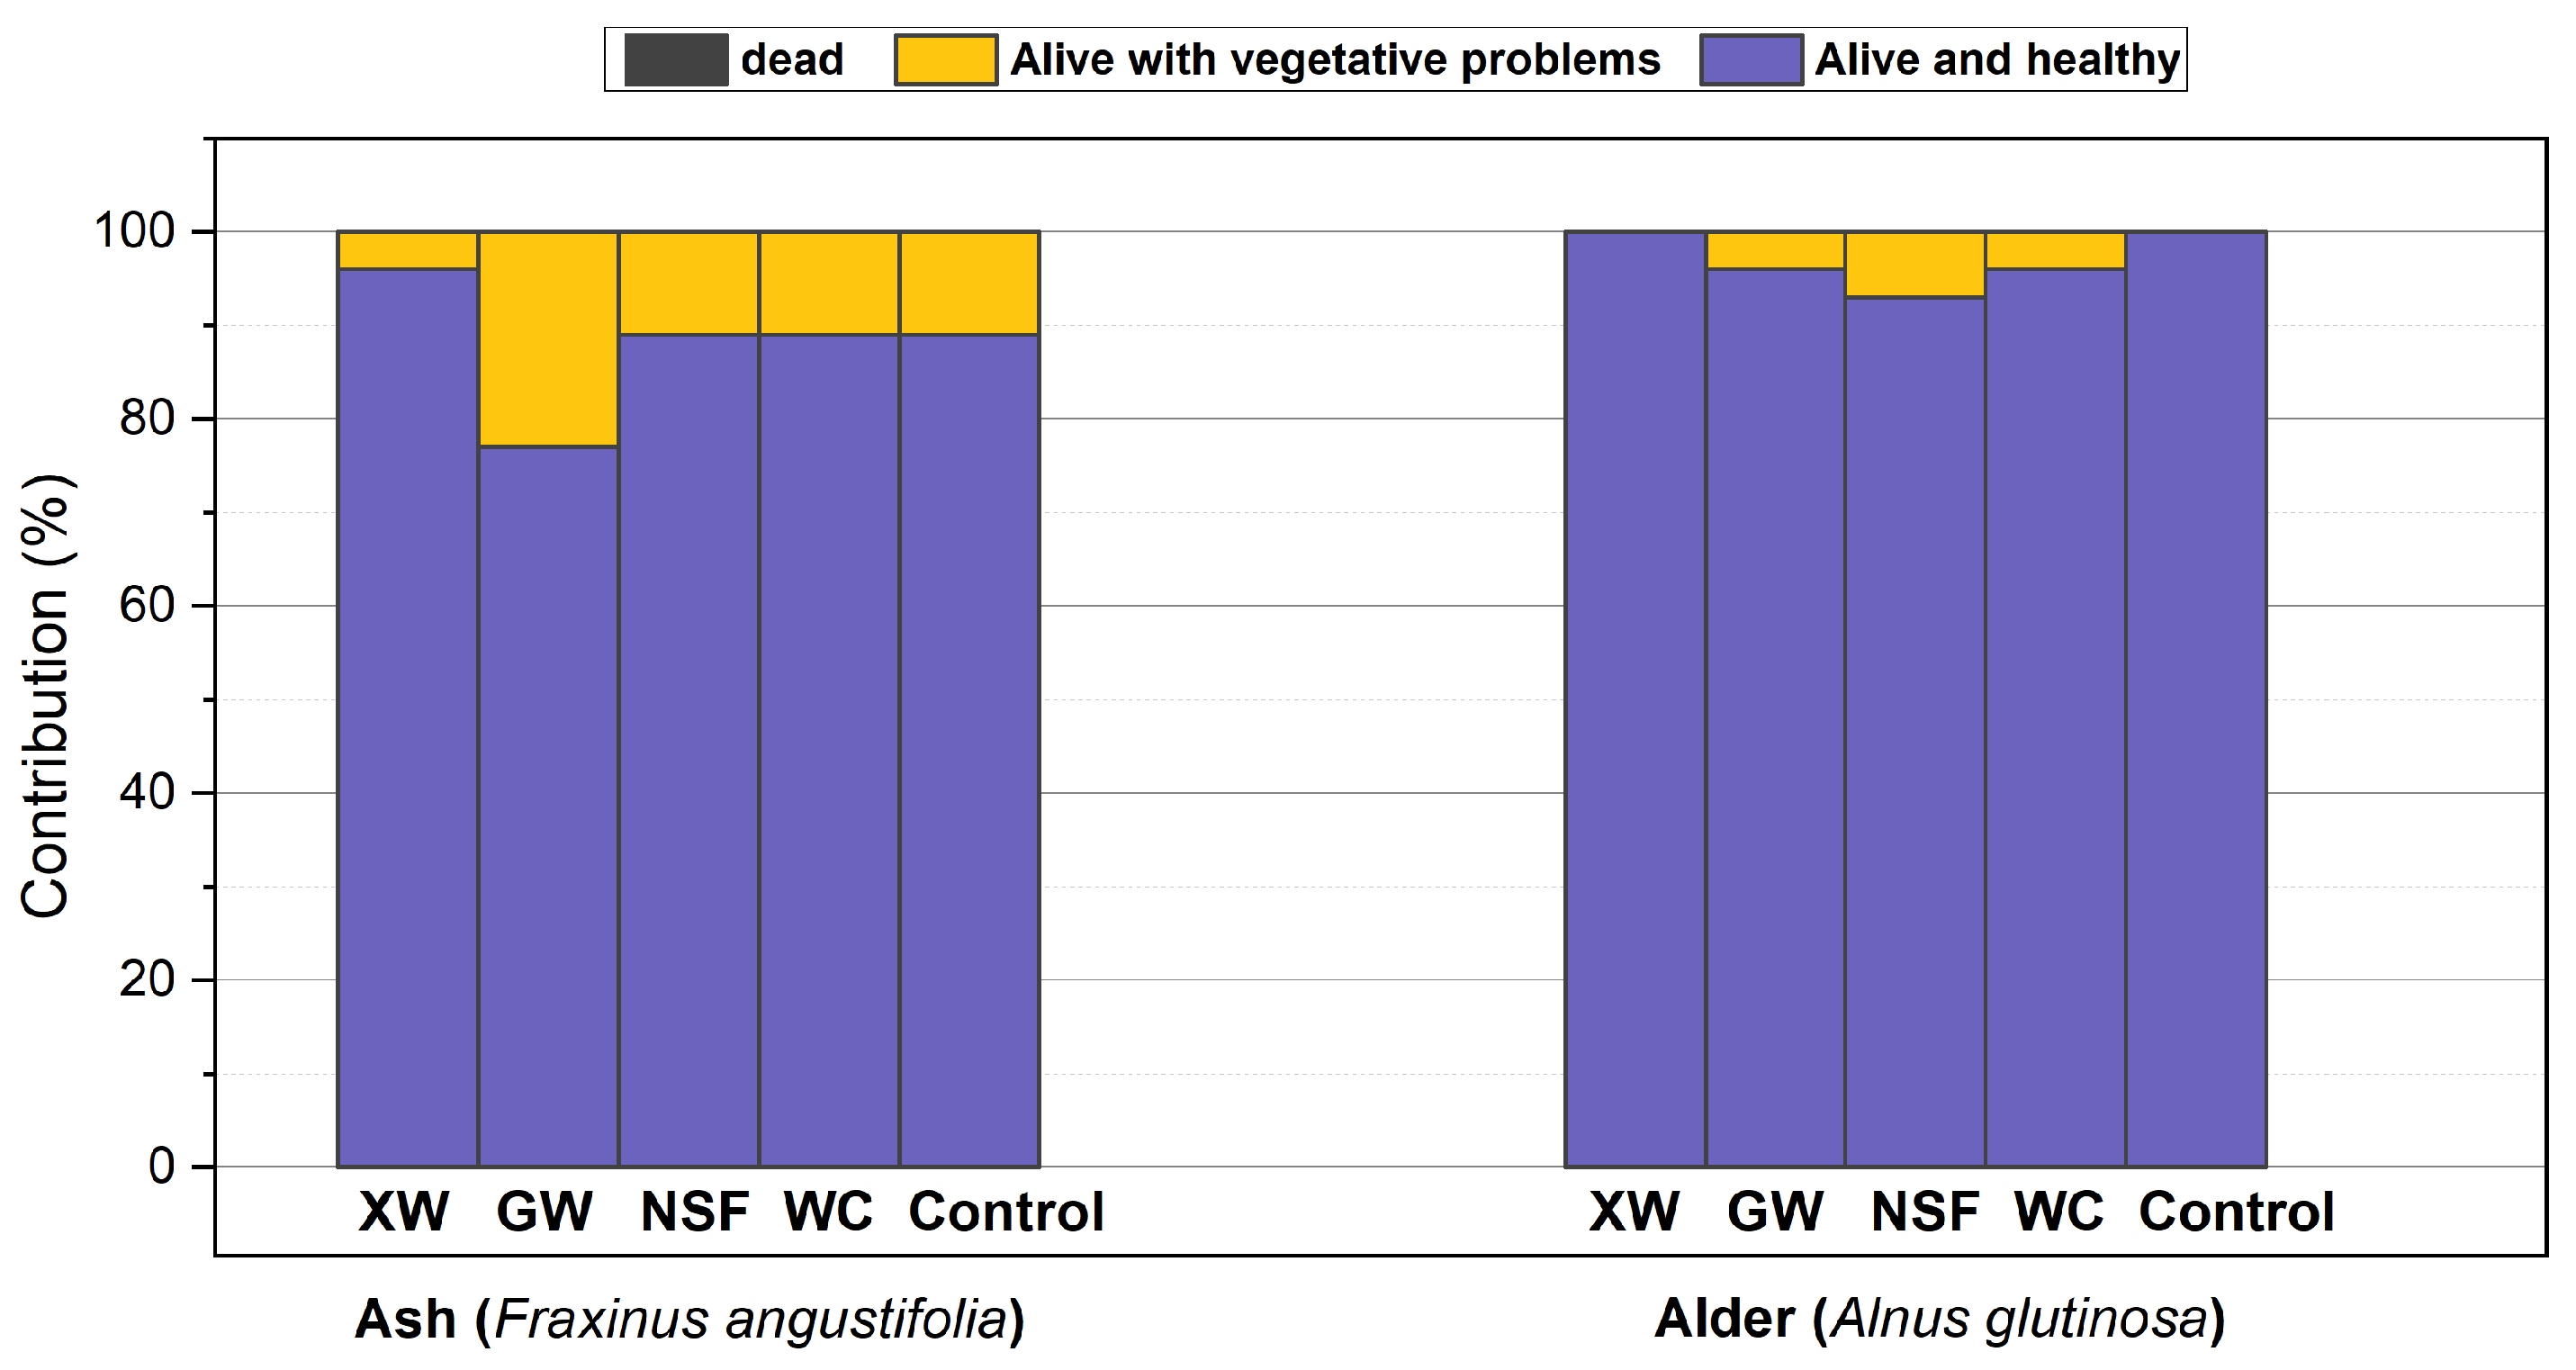
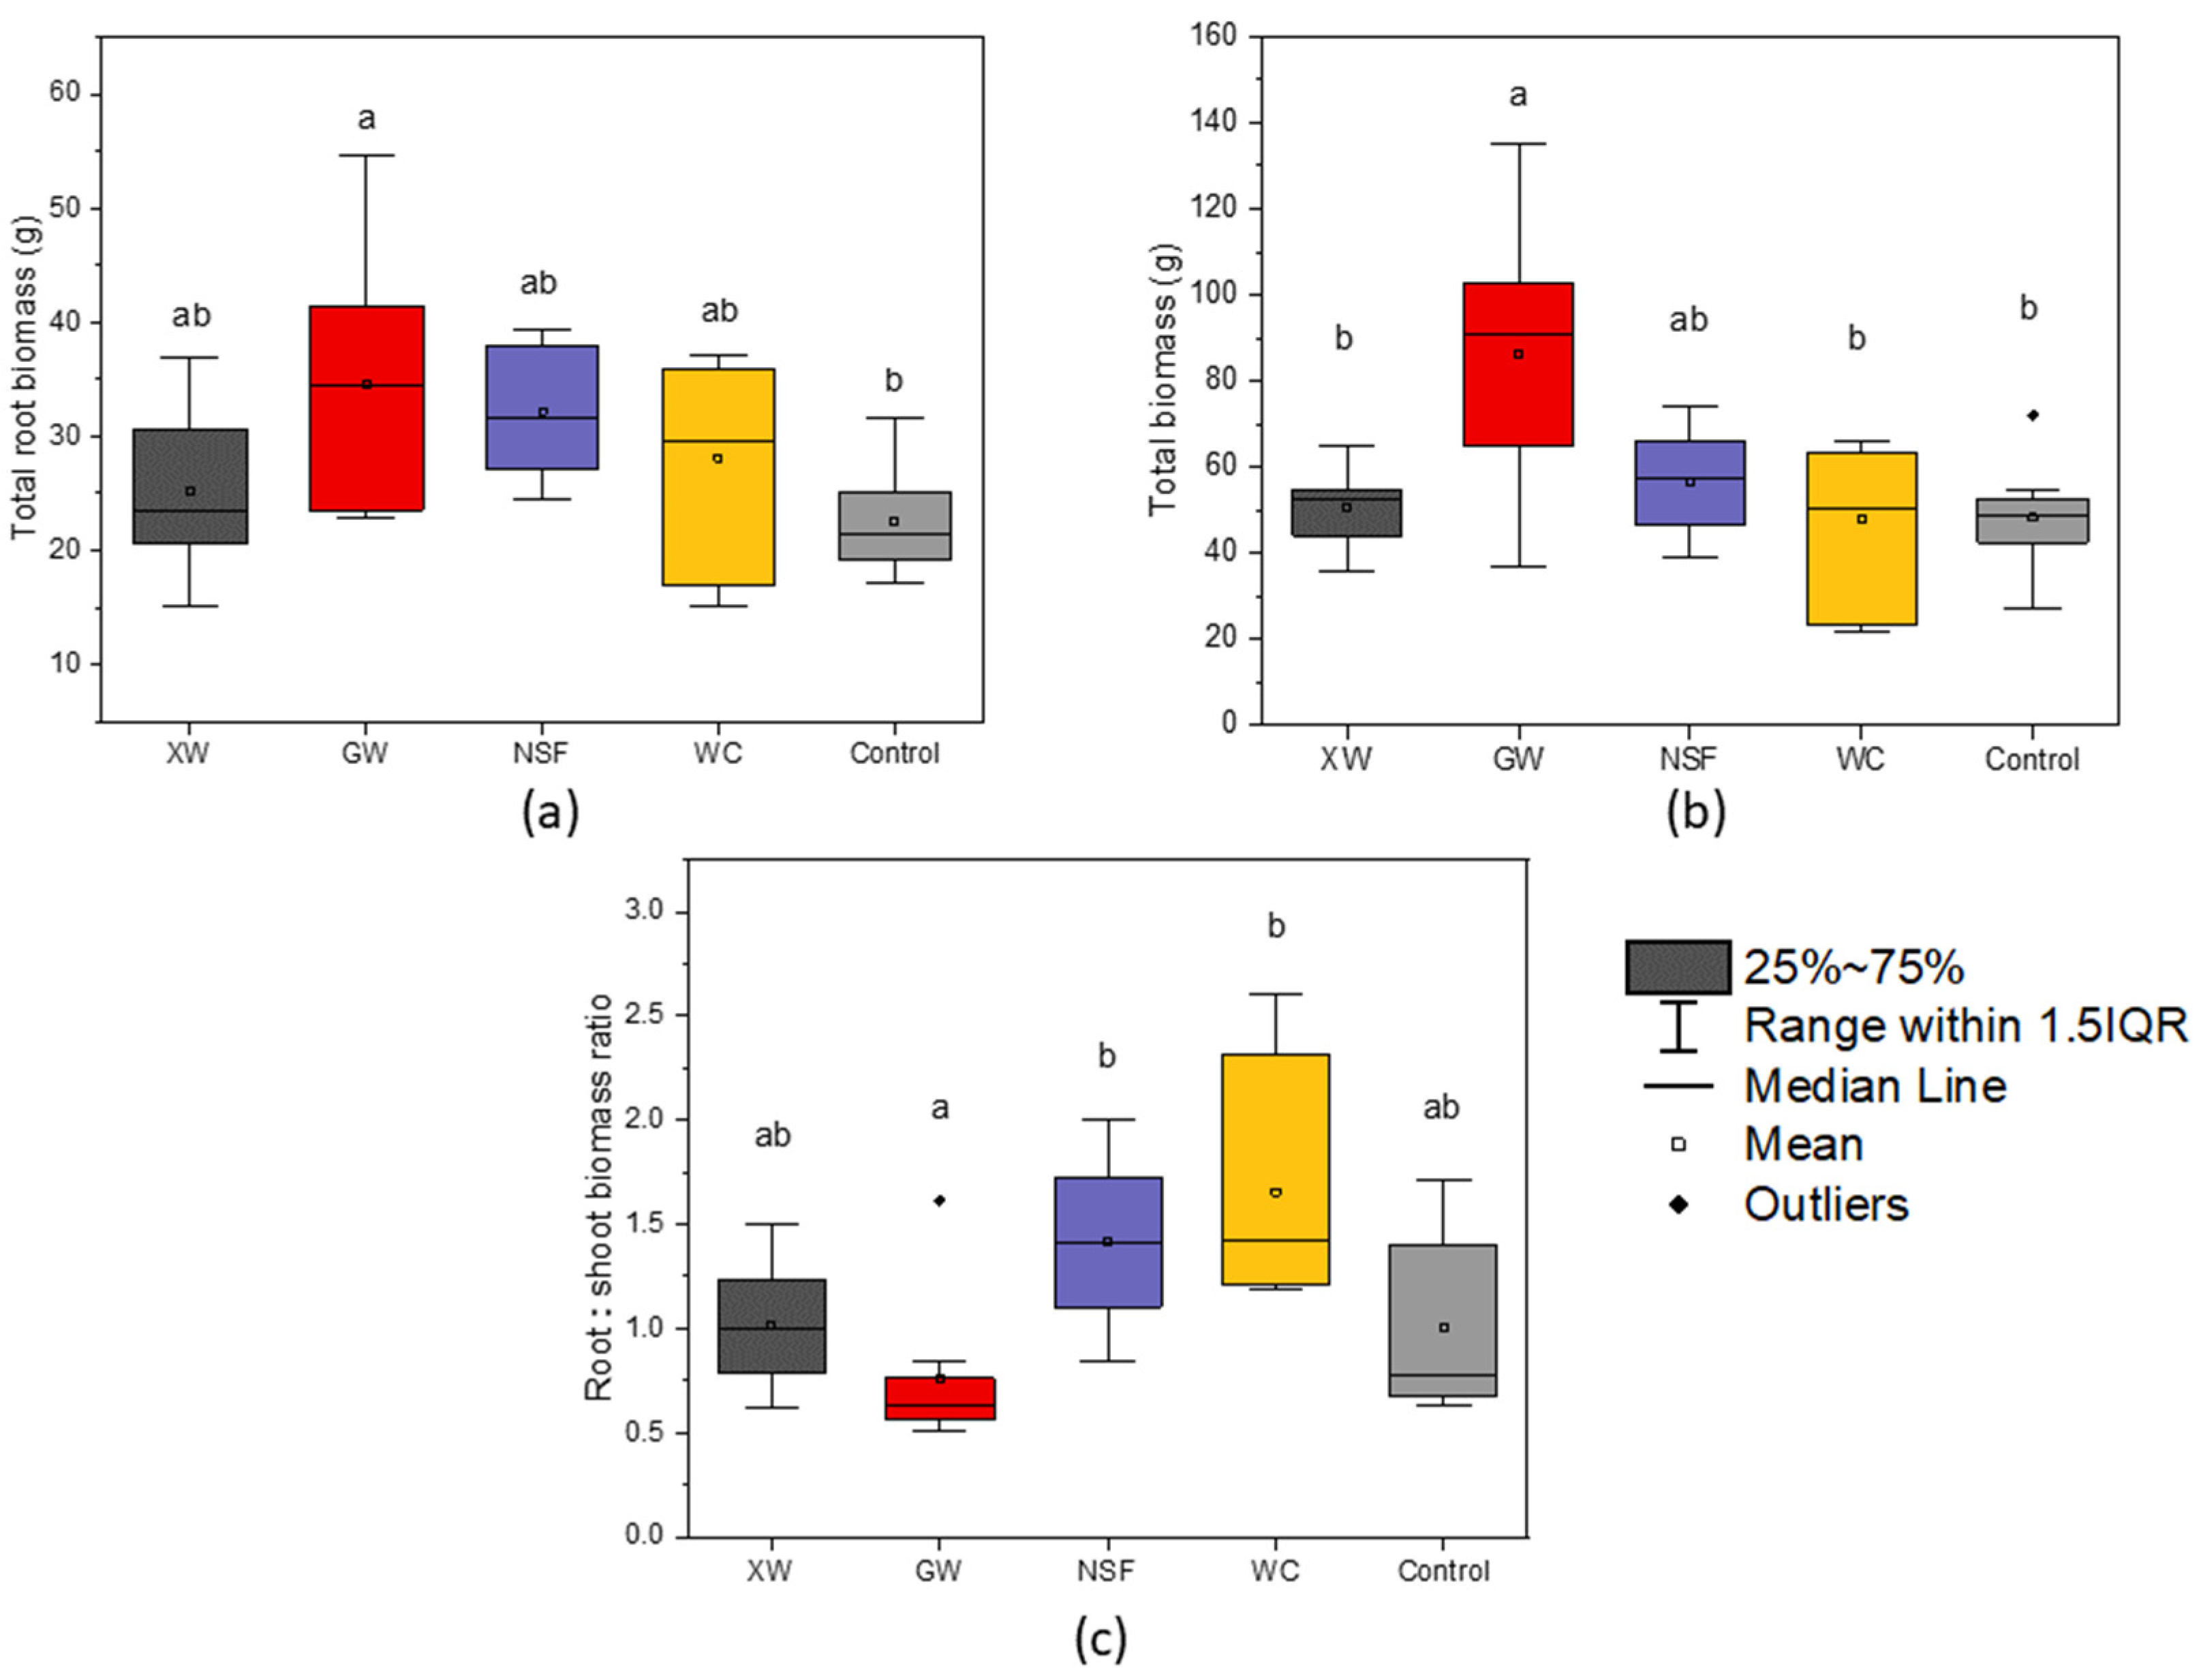
3.1. Evaluation of Groundcover Effects on Seedling Performance
3.2. Determination of Soil Properties
Soil Physico-Chemical Characteristics
3.3. Microbiological Analysis
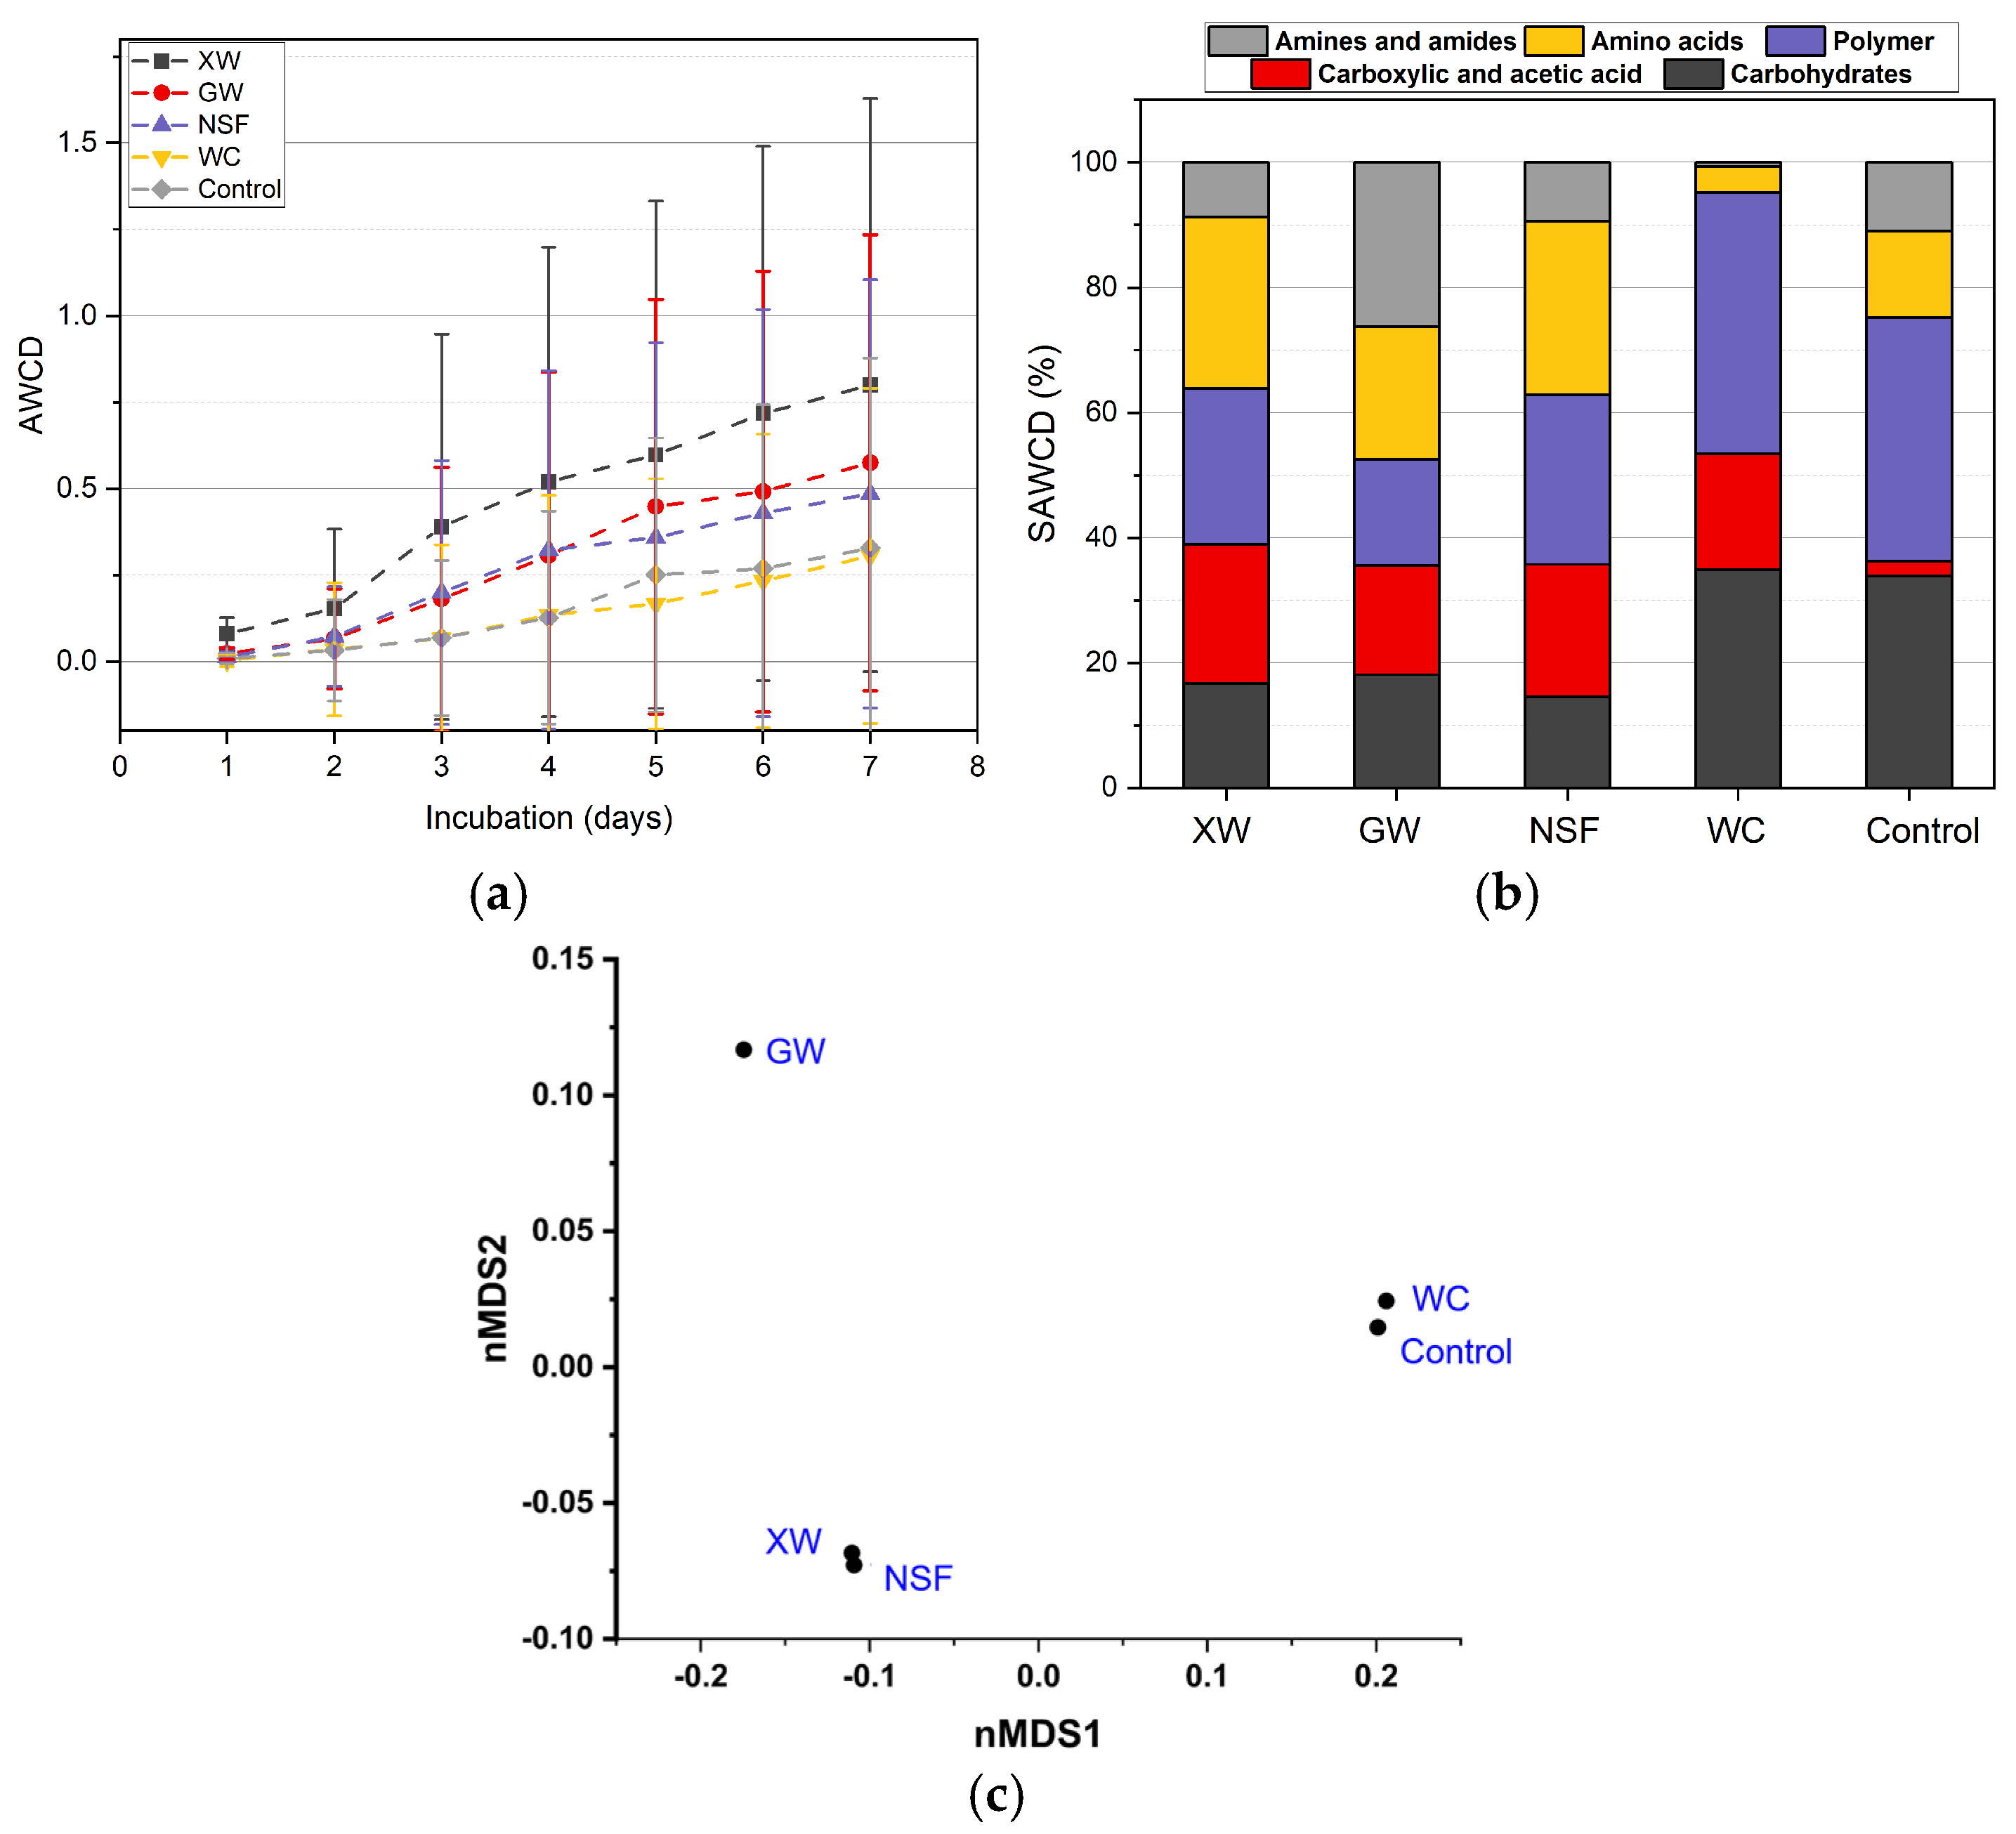
3.3.1. Community-Level Physiological Profiling
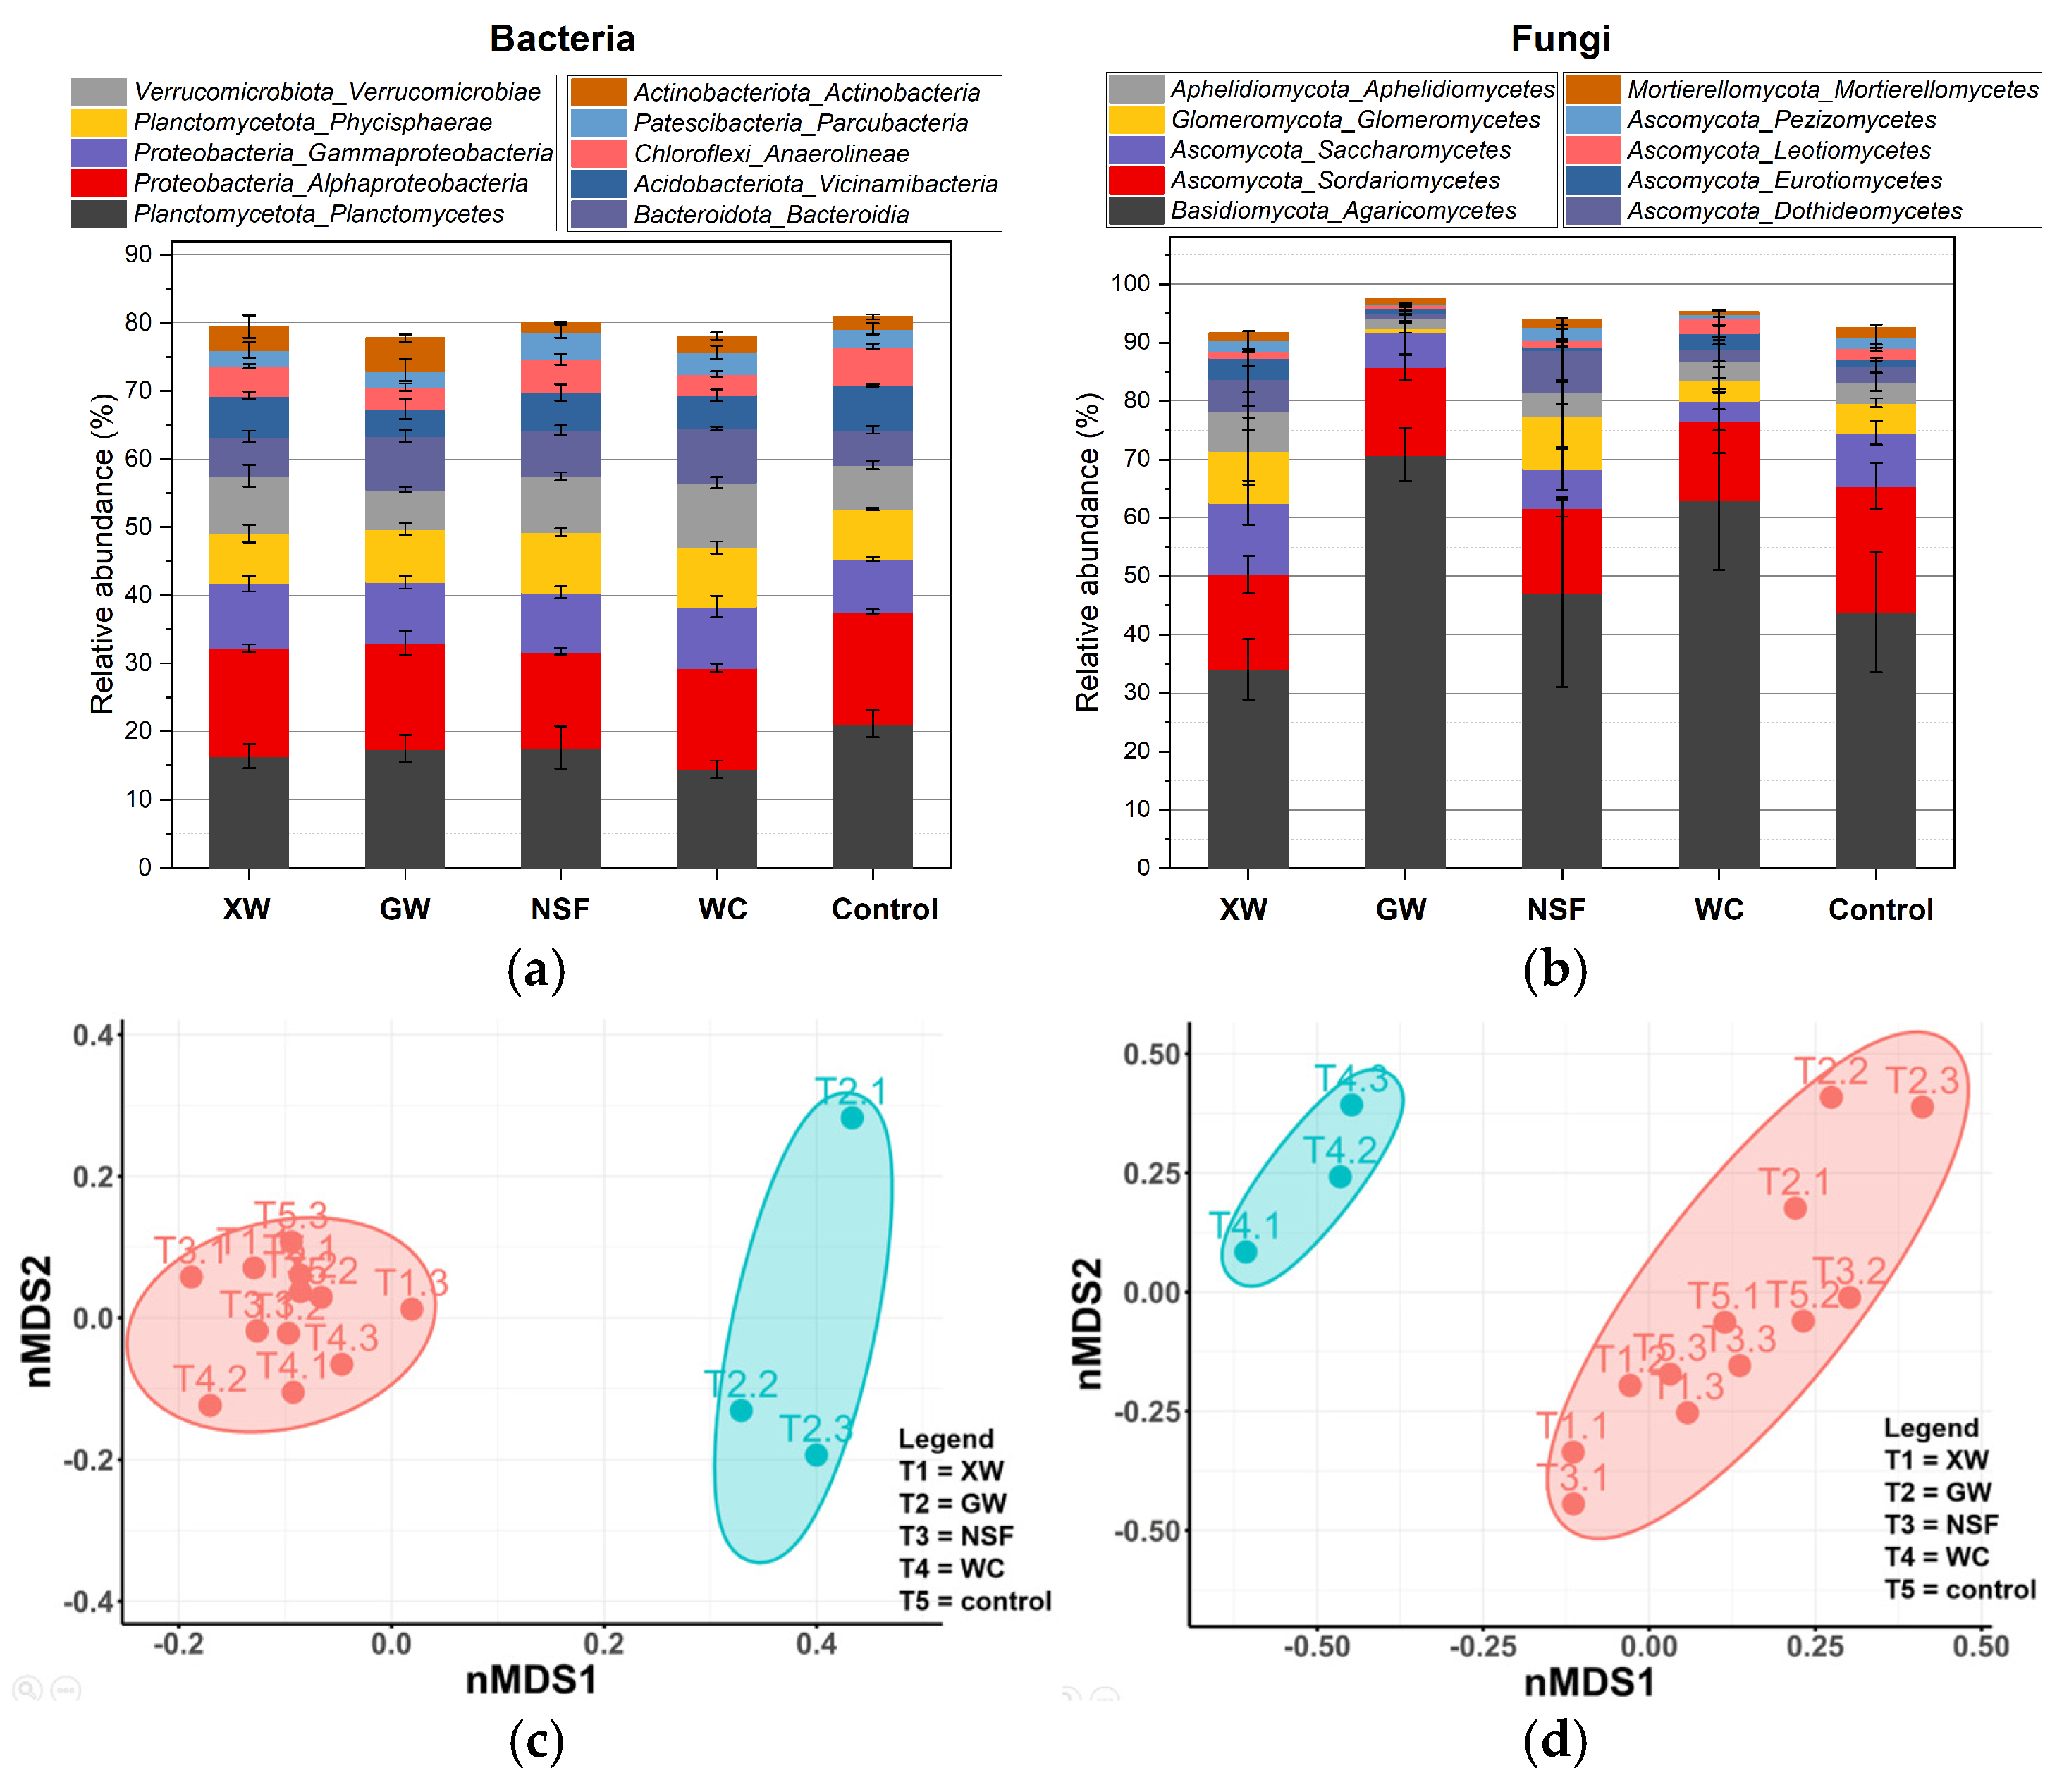
3.3.2. Dominant and Differentially Abundant Phylotype Determination in Soils
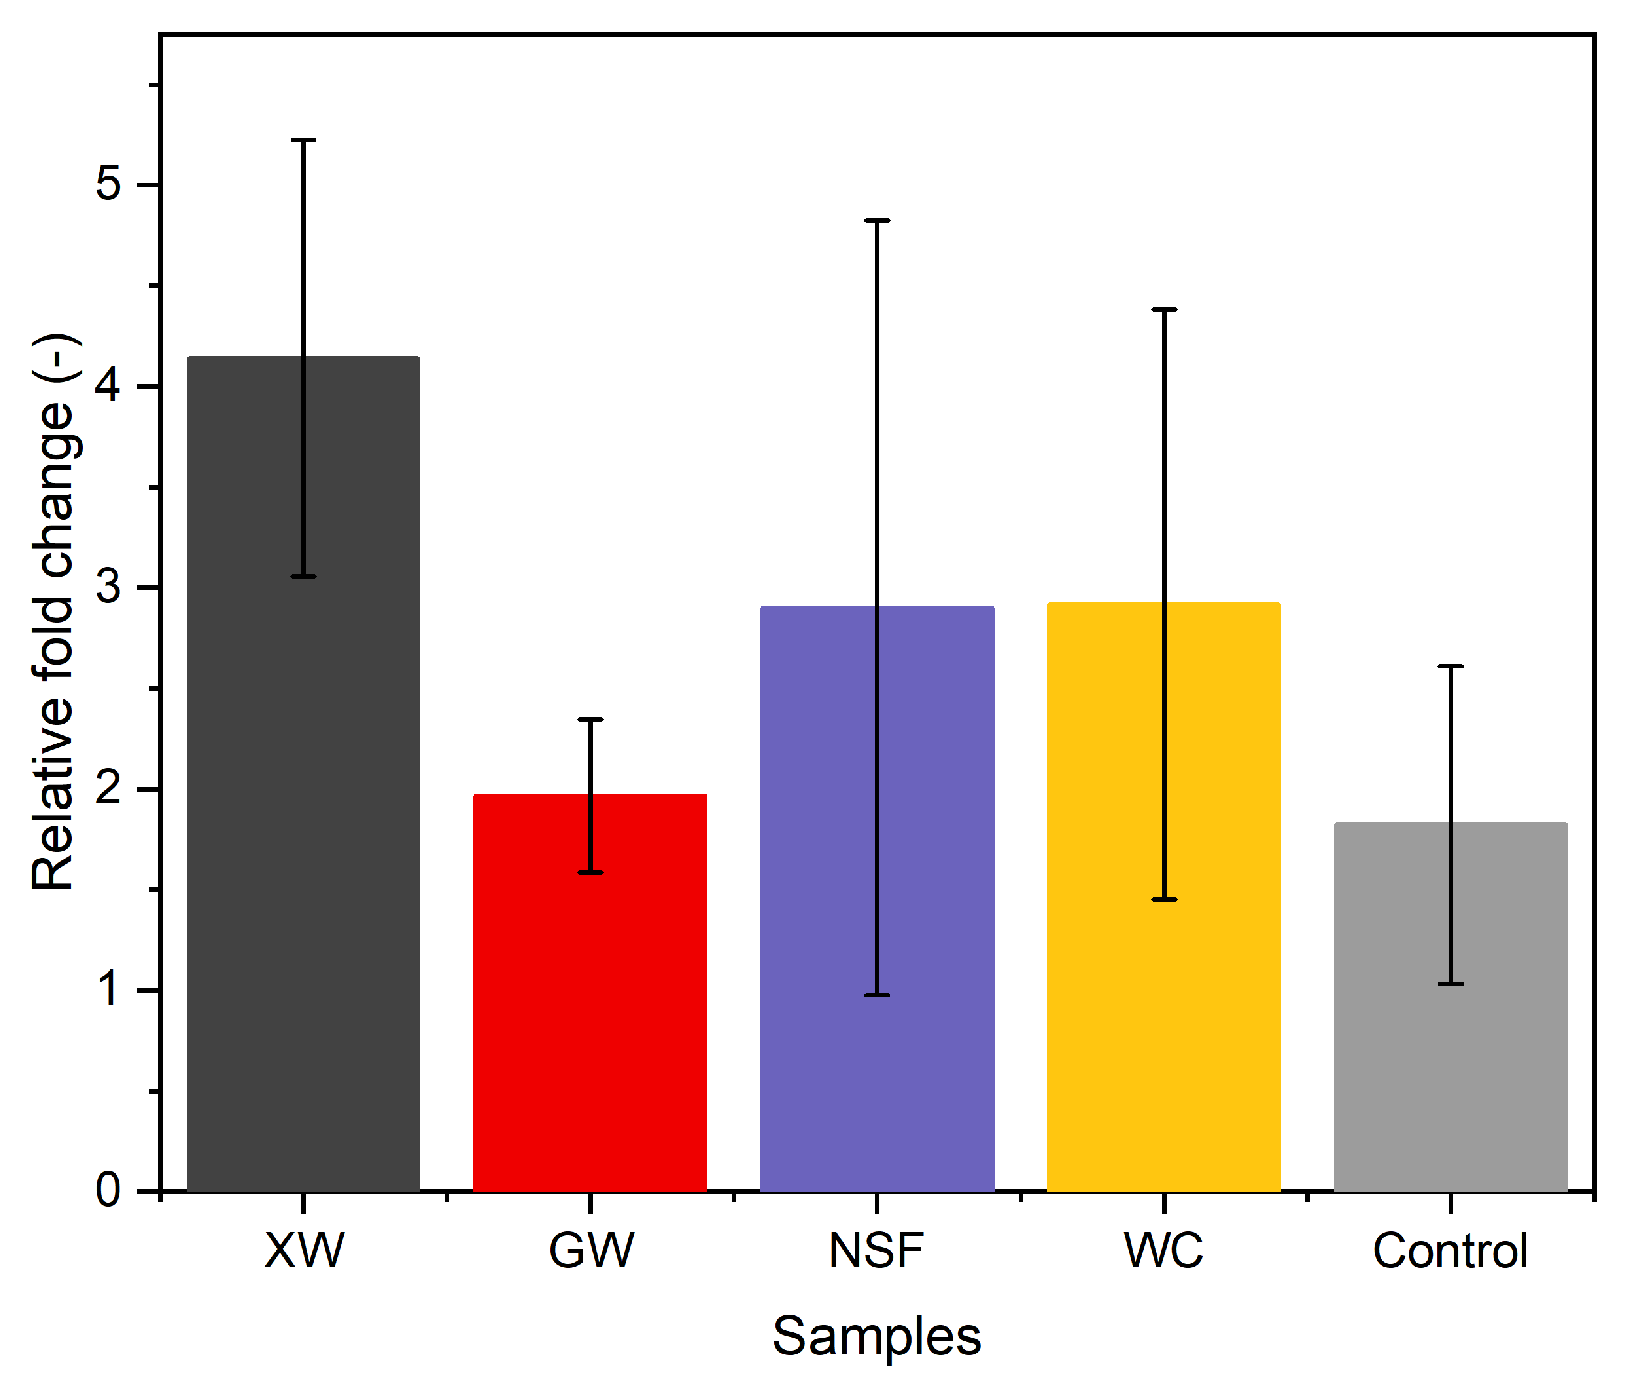
3.3.3. Alteration in Soil nifH Gene Copy Number
4. Conclusions
Supplementary Materials
Author Contributions
Funding
Data Availability Statement
Conflicts of Interest
References
- Harrington, L.J.; Lewis, S.; Perkins-Kirkpatrick, S.E.; King, A.D.; Otto, F.E.L. Embracing the complexity of extreme weather events when quantifying their likelihood of recurrence in a warming world. Environ. Res. Lett. 2019, 14, 024018. [Google Scholar] [CrossRef]
- Lehner, B.; Döll, P.; Alcamo, J.; Henrichs, T.; Kaspar, F. Estimating the Impact of Global Change on Flood and Drought Risks in Europe: A Continental, Integrated Analysis. Clim. Change 2006, 75, 273–299. [Google Scholar] [CrossRef]
- Ferrarin, C.; Lionello, P.; Orlić, M.; Raicich, F.; Salvadori, G. Venice as a paradigm of coastal flooding under multiple compound drivers. Sci. Rep. 2022, 12, 5754. [Google Scholar] [CrossRef] [PubMed]
- Vicente-Serrano, S.M.; Lopez-Moreno, J.-I.; Beguería, S.; Lorenzo-Lacruz, J.; Sanchez-Lorenzo, A.; García-Ruiz, J.M.; Azorin-Molina, C.; Morán-Tejeda, E.; Revuelto, J.; Trigo, R.; et al. Evidence of increasing drought severity caused by temperature rise in southern Europe. Environ. Res. Lett. 2014, 9, 044001. [Google Scholar] [CrossRef]
- Russo, A.; Gouveia, C.M.; Dutra, E.; Soares, P.M.M.; Trigo, R.M. The synergy between drought and extremely hot summers in the Mediterranean. Environ. Res. Lett. 2019, 14, 014011. [Google Scholar] [CrossRef]
- Toreti, A.; Bavera, D.; Acosta Navarro, J.; Arias Muñoz, C.; Avanzi, F.; Barbosa, P.; de Jager, A.; Di Ciollo, C.; Ferraris, L.; Fioravanti, G.; et al. Drought in Europe June 2023; Publications Office of the European Union: Luxembourg, 2023. [Google Scholar]
- Berardi, D.; Picarelli, A.; Tettamanzi, M. Siccità e Alluvioni, Così Diverse ma Anche Così Simili; Laboratorio Ref Ricerche: Milan, Italy, 2023; pp. 1–28. [Google Scholar]
- European Forest Fire Information System (EFFIS). Fire Weather Index. Available online: https://effis.jrc.ec.europa.eu/ (accessed on 21 January 2024).
- Neave, M.; Rayburg, S. A field investigation into the effects of progressive rainfall-induced soil seal and crust development on runoff and erosion rates: The impact of surface cover. Geomorphology 2007, 87, 378–390. [Google Scholar] [CrossRef]
- Mirzabaev, A.; Wu, J.E.J.; García-Oliva, F.; Hussein, I.A.G.; Iqbal, M.H.; Kimutai, J.; Knowles, T.; Meza, F.; Nedjraoui, D.; Tena, F.; et al. Desertification. In Climate Change and Land. An IPCC Special Report on Climate Change, Desertification, Land Degradation, Sustainable Land Management, Food Security, and Greenhouse Gas Fluxes in Terrestrial Ecosystems; IPCC: Geneva, Switzerland, 2019; Volume 3, pp. 249–343. [Google Scholar]
- European Environment Agency. What Is Soil Sealing and Why Is It Important to Monitor It? Available online: https://www.eea.europa.eu/help/faq/what-is-soil-sealing-and (accessed on 21 January 2024).
- European Court of Auditor. Combating Desertification in the EU: A Growing Threat in Need of More Action; European Court of Auditor: Luxembourg, 2018. [Google Scholar]
- Estrela, T.; Marcuello, C.; Iglesias, A. Water Resources Problems in Southern Europe; European Topic Centre on Inland Waters: Copenhagen, Denmark, 1996; pp. 34–35. [Google Scholar]
- Álvarez-Martínez, J.; Gómez-Villar, A.; Lasanta, T. The Use of Goats Grazing to Restore Pastures Invaded by Shrubs and Avoid Desertification: A Preliminary Case Study in the Spanish Cantabrian Mountains. Land Degrad. Dev. 2016, 27, 3–13. [Google Scholar] [CrossRef]
- Berthe, Y. The Role of Forestry in Combating Desertification; Food and Agriculture Organization: Rome, Italy, 1997. [Google Scholar]
- Zerga, B. Rangeland degradation and restoration: A global perspective. Point J. Agric. Biotechnol. Res. 2015, 1, 37–54. [Google Scholar]
- Intergovernmental Panel on Climate Change. Climate Change 2023: Synthesis Report. Contribution of Working Groups I, II and III to the Sixth Assessment Report of the Intergovernmental Panel on Climate Change. In Climate Change 2023; IPCC: Geneva, Switzerland, 2023. [Google Scholar]
- Reyer, C.; Guericke, M.; Ibisch, P.L. Climate change mitigation via afforestation, reforestation and deforestation avoidance: And what about adaptation to environmental change? New For. 2009, 38, 15–34. [Google Scholar] [CrossRef]
- Ganteaume, A.; Barbero, R.; Jappiot, M.; Maillé, E. Understanding future changes to fires in southern Europe and their impacts on the wildland-urban interface. J. Saf. Sci. Resil. 2021, 2, 20–29. [Google Scholar] [CrossRef]
- Molina-Terrén, D.M.; Xanthopoulos, G.; Diakakis, M.; Ribeiro, L.; Caballero, D.; Delogu, G.M.; Viegas, D.X.; Silva, C.A.; Cardil, A. Analysis of forest fire fatalities in Southern Europe: Spain, Portugal, Greece and Sardinia (Italy). Int. J. Wildland Fire 2019, 28, 85–98. [Google Scholar] [CrossRef]
- Yıldız, O.; Eşen, D.; Sargıncı, M.; Çetin, B.; Toprak, B.; Dönmez, A.H. Restoration success in afforestation sites established at different times in arid lands of Central Anatolia. For. Ecol. Manag. 2022, 503, 119808. [Google Scholar] [CrossRef]
- Cao, S.; Chen, L.; Shankman, D.; Wang, C.; Wang, X.; Zhang, H. Excessive reliance on afforestation in China’s arid and semi-arid regions: Lessons in ecological restoration. Earth-Sci. Rev. 2011, 104, 240–245. [Google Scholar] [CrossRef]
- Cortina, J.; Amat, B.; Castillo, V.; Fuentes, D.; Maestre, F.T.; Padilla, F.M.; Rojo, L. The restoration of vegetation cover in the semi-arid Iberian southeast. J. Arid Environ. 2011, 75, 1377–1384. [Google Scholar] [CrossRef]
- Groninger, J.W.; Baer, S.G.; Babassana, D.-A.; Allen, D.H. Planted green ash (Fraxinus pennsylvanica Marsh.) and herbaceous vegetation responses to initial competition control during the first 3 years of afforestation. For. Ecol. Manag. 2004, 189, 161–170. [Google Scholar] [CrossRef]
- Nickelson, J.B.; Holzmueller, E.J.; Groninger, J.W.; Lesmeister, D.B. Previous Land Use and Invasive Species Impacts on Long-term Afforestation Success. Forests 2015, 6, 3123–3135. [Google Scholar] [CrossRef]
- Rose, R.; Carlson, W.C.; Morgan, P. The Target Seedling Concept. In Proceedings of the Target Seedling Symposium: Proceedings, Combined Meeting of the Western Forest Nursery Associations, Roseburg, OR, USA, 13–17 August 1990. [Google Scholar]
- Oliet, J.A.; Ortiz de Urbina, E.; Sanchez-Pinillos, M.; Tardio-Cerrillo, G. Matching seedling size to planting conditions: Interactive response with soil moisture. Iforest—Biogeosci. For. 2019, 12, 220–225. [Google Scholar] [CrossRef]
- Vitone, A.; Coello, J.; Piqué, M.; Rovira, P. Use of innovative groundcovers in Mediterranean afforestations: Aerial and belowground effects in hybrid walnut. Ann. Silvic. Res. 2016, 40, 134–147. [Google Scholar] [CrossRef]
- Matyjaszczyk, E.; Skrzecz, I. How European Union accession and implementation of obligatory integrated pest management influenced forest protection against diseases and weeds: A case study from Poland. Crop Prot. 2020, 127, 104986. [Google Scholar] [CrossRef]
- Coello, J.; Piqué, M. Soil Conditioners and Groundcovers for Sustainable and Cost Efficient Tree Planting in Europe and the Mediterranean; Centre Tecnològic Forestal de Catalunya, CTFC: Catalonia, Spain, 2016; pp. 1–60. [Google Scholar]
- Polymer. BIOPAC A 5001. Available online: https://www.polymersrl.eu/agricoltura/biopac-a-5001/ (accessed on 21 January 2024).
- Novamont. Mater-Bi Mulch Film for Processing Tomato. Available online: https://agro.novamont.com/en/page.php?id_page=88 (accessed on 21 January 2024).
- Courty, P.-E.; Buée, M.; Diedhiou, A.G.; Frey-Klett, P.; Le Tacon, F.; Rineau, F.; Turpault, M.-P.; Uroz, S.; Garbaye, J. The role of ectomycorrhizal communities in forest ecosystem processes: New perspectives and emerging concepts. Soil Biol. Biochem. 2010, 42, 679–698. [Google Scholar] [CrossRef]
- Uroz, S.; Oger, P.; Lepleux, C.; Collignon, C.; Frey-Klett, P.; Turpault, M.-P. Bacterial weathering and its contribution to nutrient cycling in temperate forest ecosystems. Res. Microbiol. 2011, 162, 820–831. [Google Scholar] [CrossRef] [PubMed]
- Moyano, F.E.; Manzoni, S.; Chenu, C. Responses of soil heterotrophic respiration to moisture availability: An exploration of processes and models. Soil Biol. Biochem. 2013, 59, 72–85. [Google Scholar] [CrossRef]
- Parton, W.; Silver, W.L.; Burke, I.C.; Grassens, L.; Harmon, M.E.; Currie, W.S.; King, J.Y.; Adair, E.C.; Brandt, L.A.; Hart, S.C.; et al. Global-Scale Similarities in Nitrogen Release Patterns During Long-Term Decomposition. Science 2007, 315, 361–364. [Google Scholar] [CrossRef] [PubMed]
- Benard, P.; Bickel, S.; Kaestner, A.; Lehmann, P.; Carminati, A. Extracellular polymeric substances from soil-grown bacteria delay evaporative drying. Adv. Water Resour. 2023, 172, 104364. [Google Scholar] [CrossRef]
- Nazari, M.; Bickel, S.; Benard, P.; Mason-Jones, K.; Carminati, A.; Dippold, M.A. Biogels in Soils: Plant Mucilage as a Biofilm Matrix That Shapes the Rhizosphere Microbial Habitat. Front. Plant Sci. 2022, 12, 798992. [Google Scholar] [CrossRef]
- Sherman, L.; Coleman, M.D. Forest soil respiration and exoenzyme activity in western North America following thinning, residue removal for biofuel production, and compensatory soil amendments. GCB Bioenergy 2020, 12, 223–236. [Google Scholar] [CrossRef]
- Rivera, D.; Mejías, V.; Jáuregui, B.M.; Costa-Tenorio, M.; López-Archilla, A.I.; Peco, B. Spreading Topsoil Encourages Ecological Restoration on Embankments: Soil Fertility, Microbial Activity and Vegetation Cover. PLoS ONE 2014, 9, e101413. [Google Scholar] [CrossRef]
- Storr, T.; Simmons, R.W.; Hannam, J.A. Using frost-sensitive cover crops for timely nitrogen mineralization and soil moisture management. Soil Use Manag. 2021, 37, 427–435. [Google Scholar] [CrossRef]
- Sorze, A.; Valentini, F.; Dorigato, A.; Pegoretti, A. Development of a Xanthan Gum Based Superabsorbent and Water Retaining Composites for Agricultural and Forestry Applications. Molecules 2023, 28, 1952. [Google Scholar] [CrossRef]
- Sorze, A.; Valentini, F.; Smolar, J.; Logar, J.; Pegoretti, A.; Dorigato, A. Effect of Different Cellulose Fillers on the Properties of Xanthan-Based Composites for Soil Conditioning Applications. Materials 2023, 16, 7285. [Google Scholar] [CrossRef]
- Sorze, A.; Valentini, F.; Burin Mucignat, M.; Pegoretti, A.; Dorigato, A. Multifunctional xanthan gum/wood fibers based hydrogels as novel topsoil covers for forestry and agricultural applications. Carbohydr. Polym. Technol. Appl. 2024, 7, 100520. [Google Scholar] [CrossRef]
- Picchio, M.L.; Linck, Y.G.; Monti, G.A.; Gugliotta, L.M.; Minari, R.J.; Alvarez Igarzabal, C.I. Casein films crosslinked by tannic acid for food packaging applications. Food Hydrocoll. 2018, 84, 424–434. [Google Scholar] [CrossRef]
- O’Kelly, B.C.; Sivakumar, V. Water Content Determinations for Peat and Other Organic Soils Using the Oven-Drying Method. Dry. Technol. 2014, 32, 631–643. [Google Scholar] [CrossRef]
- Maphuhla, N.G.; Lewu, F.B.; Oyedeji, O.O. The Effects of Physicochemical Parameters on Analysed Soil Enzyme Activity from Alice Landfill Site. Int. J. Environ. Res. Public Health 2021, 18, 221. [Google Scholar] [CrossRef]
- McGowen, E.B.; Sharma, S.; Deng, S.; Zhang, H.; Warren, J.G. An Automated Laboratory Method for Measuring CO2 Emissions from Soils. Agric. Environ. Lett. 2018, 3, 180008. [Google Scholar] [CrossRef]
- Fan, F.; Li, Z.; Wakelin, S.A.; Yu, W.; Liang, Y. Mineral fertilizer alters cellulolytic community structure and suppresses soil cellobiohydrolase activity in a long-term fertilization experiment. Soil Biol. Biochem. 2012, 55, 70–77. [Google Scholar] [CrossRef]
- Koner, S.; Chen, J.-S.; Hsu, B.-M.; Rathod, J.; Huang, S.-W.; Chien, H.-Y.; Hussain, B.; Chan, M.W.Y. Depth-resolved microbial diversity and functional profiles of trichloroethylene-contaminated soils for Biolog EcoPlate-based biostimulation strategy. J. Hazard. Mater. 2022, 424, 127266. [Google Scholar] [CrossRef]
- Németh, I.; Molnár, S.; Vaszita, E.; Molnár, M. The Biolog EcoPlate™ Technique for Assessing the Effect of Metal Oxide Nanoparticles on Freshwater Microbial Communities. Nanomaterials 2021, 11, 1777. [Google Scholar] [CrossRef]
- Thijs, S.; Op De Beeck, M.; Beckers, B.; Truyens, S.; Stevens, V.; Van Hamme, J.D.; Weyens, N.; Vangronsveld, J. Comparative Evaluation of Four Bacteria-Specific Primer Pairs for 16S rRNA Gene Surveys. Front. Microbiol. 2017, 8, 494. [Google Scholar] [CrossRef]
- Halwachs, B.; Madhusudhan, N.; Krause, R.; Nilsson, R.H.; Moissl-Eichinger, C.; Högenauer, C.; Thallinger, G.G.; Gorkiewicz, G. Critical Issues in Mycobiota Analysis. Front. Microbiol. 2017, 8, 180. [Google Scholar] [CrossRef]
- Caporaso, J.G.; Kuczynski, J.; Stombaugh, J.; Bittinger, K.; Bushman, F.D.; Costello, E.K.; Fierer, N.; Peña, A.G.; Goodrich, J.K.; Gordon, J.I.; et al. QIIME allows analysis of high-throughput community sequencing data. Nat. Methods 2010, 7, 335–336. [Google Scholar] [CrossRef] [PubMed]
- Callahan, B.J.; McMurdie, P.J.; Rosen, M.J.; Han, A.W.; Johnson, A.J.A.; Holmes, S.P. DADA2: High-resolution sample inference from Illumina amplicon data. Nat. Methods 2016, 13, 581–583. [Google Scholar] [CrossRef] [PubMed]
- Chakraborty, A.; Aziz Chowdhury, A.; Bhakat, K.; Islam, E. Elevated level of arsenic negatively influences nifH gene expression of isolated soil bacteria in culture condition as well as soil system. Environ. Geochem. Health 2019, 41, 1953–1966. [Google Scholar] [CrossRef] [PubMed]
- Geissler, L.; Meunier, V.; Rädecker, N.; Perna, G.; Rodolfo-Metalpa, R.; Houlbrèque, F.; Voolstra, C.R. Highly Variable and Non-complex Diazotroph Communities in Corals From Ambient and High CO2 Environments. Front. Mar. Sci. 2021, 8, 754682. [Google Scholar] [CrossRef]
- Krishnan, K.; Schindelbeck, R.; Kurtz, K.S.M.; van Es, H. Soil Health Assessment. In Soil Analysis: Recent Trends and Applications; Rakshit, A., Ghosh, S., Chakraborty, S., Philip, V., Datta, A., Eds.; Springer: Singapore, 2020; pp. 199–219. [Google Scholar]
- Zhang, Y.; Li, X.; Xiao, M.; Feng, Z.; Yu, Y.; Yao, H. Effects of microplastics on soil carbon dioxide emissions and the microbial functional genes involved in organic carbon decomposition in agricultural soil. Sci. Total Environ. 2022, 806, 150714. [Google Scholar] [CrossRef]
- Cui, J.; Yang, B.; Zhang, M.; Song, D.; Xu, X.; Ai, C.; Liang, G.; Zhou, W. Investigating the effects of organic amendments on soil microbial composition and its linkage to soil organic carbon: A global meta-analysis. Sci. Total Environ. 2023, 894, 164899. [Google Scholar] [CrossRef]
- Liu, X.; Chen, Q.; Zhang, H.; Zhang, J.; Chen, Y.; Yao, F.; Chen, Y. Effects of exogenous organic matter addition on agricultural soil microbial communities and relevant enzyme activities in southern China. Sci. Rep. 2023, 13, 8045. [Google Scholar] [CrossRef]
- Zhang, F.-G.; Zhang, Q.-G. Microbial diversity limits soil heterotrophic respiration and mitigates the respiration response to moisture increase. Soil Biol. Biochem. 2016, 98, 180–185. [Google Scholar] [CrossRef]
- Yang, W.; Cai, X.; Wang, Y.; Diao, L.; Xia, L.; An, S.; Luo, Y.; Cheng, X. Increased Soil Bacterial Abundance but Decreased Bacterial Diversity and Shifted Bacterial Community Composition Following Secondary Succession of Old-Field. Forests 2022, 13, 1628. [Google Scholar] [CrossRef]
- Cherobaeva, A.S.; Kizilova, A.K.; Stepanov, A.L.; Kravchenko, I.K. Molecular analysis of the diversity of nitrifying bacteria in the soils of the forest and steppe zones of European Russia. Microbiology 2011, 80, 395–402. [Google Scholar] [CrossRef]
- Bruto, M.; Prigent-Combaret, C.; Muller, D.; Moënne-Loccoz, Y. Analysis of genes contributing to plant-beneficial functions in plant growth-promoting rhizobacteria and related Proteobacteria. Sci. Rep. 2014, 4, 6261. [Google Scholar] [CrossRef] [PubMed]
- Leff, J.W.; Nemergut, D.R.; Grandy, A.S.; O’Neill, S.P.; Wickings, K.; Townsend, A.R.; Cleveland, C.C. The Effects of Soil Bacterial Community Structure on Decomposition in a Tropical Rain Forest. Ecosystems 2012, 15, 284–298. [Google Scholar] [CrossRef]
- Nemergut, D.R.; Cleveland, C.C.; Wieder, W.R.; Washenberger, C.L.; Townsend, A.R. Plot-scale manipulations of organic matter inputs to soils correlate with shifts in microbial community composition in a lowland tropical rain forest. Soil Biol. Biochem. 2010, 42, 2153–2160. [Google Scholar] [CrossRef]
- Koopmann, A.-K.; Schuster, C.; Torres-Rodríguez, J.; Kain, S.; Pertl-Obermeyer, H.; Petutschnigg, A.; Hüsing, N. Tannin-Based Hybrid Materials and Their Applications: A Review. Molecules 2020, 25, 4910. [Google Scholar] [CrossRef] [PubMed]
- Marian Ioana, M.; Vonk Peter, J.; Valdes Ivan, D.; Barry, K.; Bostock, B.; Carver, A.; Daum, C.; Lerner, H.; Lipzen, A.; Park, H.; et al. The Transcription Factor Roc1 Is a Key Regulator of Cellulose Degradation in the Wood-Decaying Mushroom Schizophyllum commune. mBio 2022, 13, e00628-22. [Google Scholar] [CrossRef] [PubMed]
- Javed, Z.; Tripathi, G.D.; Mishra, M.; Dashora, K. Actinomycetes—The microbial machinery for the organic-cycling, plant growth, and sustainable soil health. Biocatal. Agric. Biotechnol. 2021, 31, 101893. [Google Scholar] [CrossRef]
- Zhang, W.; Lu, Z.; Yang, K.; Zhu, J. Impacts of conversion from secondary forests to larch plantations on the structure and function of microbial communities. Appl. Soil Ecol. 2017, 111, 73–83. [Google Scholar] [CrossRef]
- Brachmann, A.; Parniske, M. The Most Widespread Symbiosis on Earth. PLoS Biol. 2006, 4, e239. [Google Scholar] [CrossRef]
- Andersen, B.; Poulsen, R.; Hansen, G.H. Cellulolytic and xylanolytic activities of common indoor fungi. Int. Biodeterior. Biodegrad. 2016, 107, 111–116. [Google Scholar] [CrossRef]
- Mazoyon, C.; Hirel, B.; Pecourt, A.; Catterou, M.; Gutierrez, L.; Sarazin, V.; Dubois, F.; Duclercq, J. Sphingomonas sediminicola Is an Endosymbiotic Bacterium Able to Induce the Formation of Root Nodules in Pea (Pisum sativum L.) and to Enhance Plant Biomass Production. Microorganisms 2023, 11, 199. [Google Scholar] [CrossRef]


| Sample | Xanthan Gum [wt%] | Gelatine [wt%] | Glycerol [wt%] | Citric Acid [wt%] | Tannic Acid [wt%] | Fibres [wt%] | Water [wt%] |
|---|---|---|---|---|---|---|---|
| Xanthan-based composites | 3.5 | - | 4.2 | 2 | - | 3.5 | 86.8 |
| Gelatine-based composites | - | 15 | - | - | 2 | 12 | 71 |
| Treatment | Material | Thickness [mm] | Grammage [g/m2] |
|---|---|---|---|
| XW | Xanthan gum + wood fibres | 3 | 900 |
| GW | Gelatine + wood fibres | 8 | 2400 |
| NSF | Natural + synthetic fibres (Thermodisc®) | 3 | 375 |
| WC | Woodchips | 40 | 8000 |
| Control | No groundcover | - | - |
| Tree | Treatment | Diameter Growth Rate [mm/year] | Height Growth Rate [mm/year] | Aerial Volume Growth Rate [cm3/year] |
|---|---|---|---|---|
| Ash | XW | 8.2 ± 0.3 b | 107.7 ± 4.6 | 45.8 ± 3.2 b |
| GW | 12.2 ± 0.5 a | 103.0 ± 5.7 | 84.5 ± 7.8 a | |
| NSF | 8.0 ± 0.3 b | 99.0 ± 4.8 | 41.2 ± 2.5 b | |
| WC | 7.7 ± 0.3 b | 94.6 ± 5.2 | 38.0 ± 3.5 b | |
| Control | 7.6 ± 0.2 b | 104.6 ± 4.1 | 39.5 ± 2.4 b | |
| p-Value | <0.001 * | 0.346 | <0.001 * | |
| Alder | XW | 10.3 ± 0.3 | 134.8 ± 5.3 | 108.6 ± 6.4 ab |
| GW | 11.1 ± 0.5 | 143.0 ± 4.6 | 128.8 ± 9.0 a | |
| NSF | 10.6 ± 0.6 | 134.5 ± 4.1 | 106.1 ± 8.7 ab | |
| WC | 11.7 ± 0.5 | 136.2 ± 6.2 | 129.7 ± 8.1 a | |
| Control | 10.3 ± 0.5 | 133.1 ± 4.5 | 99.8 ± 7.7 b | |
| p-Value | 0.238 | 0.667 | 0.023 * |
| Tree | Growth Parameter | Weed Proliferation | ||
|---|---|---|---|---|
| Zero | Low | High | ||
| Ash | Diameter [mm] | 13.4 ± 0.6 | 11.8 ± 0.2 | 11.7 ± 0.3 |
| Height [cm] | 120.6 ± 4.6 | 117.0 ± 2.7 | 124.0 ± 6.8 | |
| Aerial volume [cm3] | 60.8 ± 7.6 | 46.1 ± 2.4 | 48.7 ± 5.4 | |
| Alder | Diameter [mm] | 15.9 ± 0.2 | 14.7 ± 0.4 | - |
| Height [cm] | 173.8 ± 2.7 | 155.9 ± 6.8 | - | |
| Aerial volume [cm3] | 122.7 ± 4.2 | 96.7 ± 6.6 | - | |
| Samples | Moisture Content [%] | pH [-] | ||
|---|---|---|---|---|
| RT | Oven | RT | Oven | |
| XW | 34.4 ± 0.4 a | 36.5 ± 21.4 a | 7.2 ± 0.1 a | 6.8 ± 0.02 a |
| GW | 15.2 ± 4.7 a | 31.9 ± 7.6 a | 6.1 ± 0.3 b | 5.8 ± 0.3 b |
| NSF | 32.2 ± 12.5 a | 43.4 ± 5.2 a | 7.1 ± 0.2 a | 6.7 ± 0.05 a |
| WC | 27.1 ± 10.7 a | 44.2 ± 10.6 a | 6.7 ± 0.2 a | 6.2 ± 0.05 b |
| Control | 25.5 ± 8.5 a | 43.0 ± 7.9 a | 7.2 ± 0.2 a | 6.7 ± 0.06 a |
| Samples | ORP [mV] | N [g/kg of Soil] | C [g/kg of Soil] | Heterotrophic Soil Respiration Rate [µg CO2/g∙h] | |
|---|---|---|---|---|---|
| RT | Oven | ||||
| XW | −51.3 ± 8.5c | −27.0 ± 1.0 c | 12.0 ± 1.5 a | 331.4 ± 29.7 ab | 63.3 ± 1.1 b |
| GW | 19.0 ± 9.9 a | 34.5 ± 16.3 a | 12.9 ± 1.7 a | 306.4 ± 32.5 b | 72.0 ± 2.0 a |
| NSF | −45.0 ± 9.0 bc | −25.3 ± 3.1 c | 10.8 ± 0.4 a | 305.6 ± 12.5 b | 39.7 ± 1.4 c |
| WC | −23.7 ± 12.6 b | 5.7 ± 2.3 b | 10.0 ± 1.6 a | 392.4 ± 21.2 a | 43.0 ± 2.4 c |
| Control | −53.0 ± 9.5 c | −23.3 ± 3.8 c | 11.2 ± 1.0 a | 316.1 ± 37.1 b | 28.5 ± 1.2 d |
Disclaimer/Publisher’s Note: The statements, opinions and data contained in all publications are solely those of the individual author(s) and contributor(s) and not of MDPI and/or the editor(s). MDPI and/or the editor(s) disclaim responsibility for any injury to people or property resulting from any ideas, methods, instructions or products referred to in the content. |
© 2025 by the authors. Licensee MDPI, Basel, Switzerland. This article is an open access article distributed under the terms and conditions of the Creative Commons Attribution (CC BY) license (https://creativecommons.org/licenses/by/4.0/).
Share and Cite
Valentini, F.; Sorze, A.; Coello, J.; Ros, L.; Chowdhury, A.A.; Piergiacomo, F.; Casapiccola, G.; Brusetti, L.; Bösing, J.; Hirschmüller, S.; et al. Xanthan- and Gelatine-Based Composites Used as Nursery Groundcovers: Assessment of Soil Microbiology and Seedling Performance. Sustainability 2025, 17, 1265. https://doi.org/10.3390/su17031265
Valentini F, Sorze A, Coello J, Ros L, Chowdhury AA, Piergiacomo F, Casapiccola G, Brusetti L, Bösing J, Hirschmüller S, et al. Xanthan- and Gelatine-Based Composites Used as Nursery Groundcovers: Assessment of Soil Microbiology and Seedling Performance. Sustainability. 2025; 17(3):1265. https://doi.org/10.3390/su17031265
Chicago/Turabian StyleValentini, Francesco, Alessandro Sorze, Jaime Coello, Laura Ros, Atif Aziz Chowdhury, Federica Piergiacomo, Giulia Casapiccola, Lorenzo Brusetti, Janine Bösing, Sebastian Hirschmüller, and et al. 2025. "Xanthan- and Gelatine-Based Composites Used as Nursery Groundcovers: Assessment of Soil Microbiology and Seedling Performance" Sustainability 17, no. 3: 1265. https://doi.org/10.3390/su17031265
APA StyleValentini, F., Sorze, A., Coello, J., Ros, L., Chowdhury, A. A., Piergiacomo, F., Casapiccola, G., Brusetti, L., Bösing, J., Hirschmüller, S., & Dorigato, A. (2025). Xanthan- and Gelatine-Based Composites Used as Nursery Groundcovers: Assessment of Soil Microbiology and Seedling Performance. Sustainability, 17(3), 1265. https://doi.org/10.3390/su17031265