Article

Government-Led Digital Governance and the Digital Divide Among Cities: Implications for Sustainable Digital Transformation in China

1
School of Public Administration, Guilin University of Technology, Guilin 541004, China
2
School of Politics and Public Administration, Guangxi Normal University, Guilin 541006, China
*
Author to whom correspondence should be addressed.
Sustainability 2025, 17(23), 10700; https://doi.org/10.3390/su172310700
Submission received: 31 October 2025 / Revised: 22 November 2025 / Accepted: 26 November 2025 / Published: 28 November 2025

Abstract

Drawing on panel data from 279 prefecture-level cities in China from 2011 to 2022, this study employs the National Pilot Policy of Information Benefiting the People (NPIB) as a quasi-natural experiment to examine how government-led digital governance shapes the digital divide among cities. Using a difference-in-differences (DID) design combined with mediation and spatial analyses, the results demonstrate that the NPIB policy significantly narrowed inter-city digital disparities, with findings robust across alternative model specifications and placebo tests. Mechanism analysis shows that digital governance promotes inclusion primarily through three pathways: strengthening strategic policy orientation, enhancing technological innovation capacity, and stimulating digital market vitality. Heterogeneity analysis indicates that policy effects vary by regional development, urbanization level, and fiscal autonomy, being most pronounced in eastern cities and those with moderate urbanization and fiscal self-sufficiency. Spatial analysis reveals that while digital governance improves local inclusion, it can generate negative spillovers among neighboring cities with similar economic structures, partially offsetting aggregate gains. Overall, the findings highlight the importance of regionally differentiated strategies, cross-regional coordination, and sustained investment in digital infrastructure to promote balanced, inclusive, and sustainable digital transformation—providing practical insights for developing countries aiming to bridge structural divides and advance digital sustainability.

1. Introduction

The accelerating wave of global digitalization has profoundly reshaped governance paradigms and public service delivery worldwide. Yet, this transformation has also brought about new governance challenges. International institutions such as the OECD and the World Bank emphasize that while digital technologies can foster innovation and administrative efficiency, they also risk widening structural disparities and undermining the goals of inclusive and sustainable development [1], especially in developing countries with insufficient infrastructure and unbalanced regional development [2]. Addressing the digital divide has thus become a central task for achieving the United Nations’ Sustainable Development Goals (SDGs), particularly those concerning reduced inequalities and sustainable cities.
In response, many countries have sought to institutionalize digital governance as a policy tool for achieving digital inclusion. Kenya’s M-Pesa system has revolutionized financial access; Estonia’s national digital identity underpins a highly integrated e-government platform; and both Finland and India have enhanced digital participation through nationwide skills programs and the Digital India initiative. These experiences demonstrate that digital governance is no longer merely a technological project but a fundamental institutional mechanism for ensuring equitable access to digital benefits. In response, many countries have sought to institutionalize digital governance as a policy tool for achieving digital inclusion. Kenya’s M-Pesa system has revolutionized financial access; Estonia’s national digital identity underpins a highly integrated e-government platform; and both Finland and India have enhanced digital participation through nationwide skills programs and the Digital India initiative. These experiences demonstrate that digital governance is no longer merely a technological project but a fundamental institutional mechanism for ensuring equitable access to digital benefits.
As the world’s largest developing country, China has actively advanced digital transformation, positioning digital governance as a central pillar of national modernization. Under the frameworks of Digital China and New-type Smart Cities, the central government has launched a series of institutional reforms to enhance data integration, platform interconnectivity, and public service inclusiveness. Among them, the National Pilot Policy of Information Benefiting the People (NPIB), initiated in 2014, stands out as a landmark experiment in government-led digital governance. The NPIB integrates fiscal incentives, performance evaluation mechanisms, and digital infrastructure construction to promote information sharing and cross-departmental coordination. It requires pilot cities to establish unified data platforms, digitize key public services, and interlink administrative systems across sectors and regions. As shown in Figure 1, the 80 pilot cities are widely distributed across eastern, central, and western China, reflecting diverse digital foundations and policy capacities. This spatially differentiated implementation provides an ideal quasi-experimental setting to assess how institutionalized digital governance affects regional digital inequality and spatial diffusion of digital benefits.
Although research on the digital divide has expanded substantially, most studies focus on disparities in infrastructure, digital skills, and socio-economic benefits associated with technology adoption [3]. Prior work has highlighted the importance of connectivity, digital literacy, and social structures [4], yet the institutional role of government-led governance, particularly how it shapes the spatial distribution of digital resources and mediates regional inequalities remains underexplored. This gap is especially pronounced in China, where persistent differences in infrastructure and administrative capacity suggest that technological investments alone are insufficient; understanding the influence of policy design, organizational capacity, and governance coordination is therefore essential for promoting inclusive digital development.
Against this backdrop, this study asks: to what extent can government-led digital governance, as exemplified by the NPIB initiative, alleviate inter-city digital inequalities and generate spatial effects across regions? Drawing on the NPIB’s institutional setting as a quasi-natural experiment, this study empirically identifies the causal and spatial effects of government-led digital governance on the urban digital divide. In doing so, it contributes to ongoing debates on how governance systems mediate digital transformation and shape regional equity.
This study makes three primary contributions. First, at the theoretical level, it develops an analytical framework integrating institutional, technological, and market dimensions to explain how governments can enhance urban digital development and reshape the spatial configuration of regional digitalization. Second, at the methodological level, it leverages the exogenous policy design of the NPIB pilot to identify the causal effects of government-led digital governance, improving the robustness of empirical inference through a spatial difference-in-differences approach. Third, at the practical level, it uncovers the spatio-temporal evolution of China’s urban digital divide and provides policy insights for balancing efficiency and equity in national digital strategies—an essential condition for achieving sustainable, inclusive, and coordinated regional development.
The remainder of this paper is organized as follows. Section 2 presents the literature review, highlighting existing research on digital disparities and the role of government-led governance. Section 3 develops the theoretical framework and research hypotheses. Section 4 outlines the empirical design and data sources. Section 5 presents the empirical analysis, including the causal effects of government-led digital governance on inter-city digital divides, the underlying mechanisms, and spatial effects. Section 6 provides a discussion of the findings, situating them within broader theoretical and policy contexts. Finally, Section 7 concludes the paper by summarizing the main findings and offering policy implications for promoting balanced and inclusive digital development.

2. Literature Review

2.1. Digital Divide: Dimensions and Spatial Perspectives

Academic research on the digital divide has traditionally focused on three dimensions: access, use, and outcomes. The access divide highlights inequalities in infrastructure and connectivity [5]; the usage divide concerns disparities in digital literacy, skills, and motivations [6]; and the outcome divide emphasizes unequal social, economic, and welfare benefits derived from digitalization [7]. These dimensions trace the evolution of digital inequality from technological access to differentiated capabilities and, ultimately, to unequal socio-economic returns. Yet, this line of research has produced a path dependency: early emphasis on measurable individual and technological factors led to the relative neglect of institutional influences, even though policy frameworks, administrative coordination, and governance capacity increasingly determine how digital opportunities are created and distributed [8]. Inter-city differences therefore reflect not only technological and economic endowments [9] but also heterogeneous capacities in policy execution and institutional support [10].
As digital transformation deepens, scholars have increasingly adopted spatial perspectives to analyze territorial patterns of digital inequality. Macro-level studies reveal substantial disparities and spatial dependence across cities in digital infrastructure, innovation activity, and economic development [11,12]; meso-level research highlights intra-urban segmentation shaped by urban–rural hierarchies and social differentiation [13,14]; and micro-level work shows that education, social capital, and occupational structure drive disparities in digital usage, contributing to the “second-level digital divide” [15]. Despite these advances, spatial analyses often stop at identifying where digital gaps occur, offering limited insight into the institutional mechanisms underlying them. Existing studies rarely clarify how local governance, through policy design, administrative capacity, and strategic coordination, causally shapes digital development or reduces regional disparities. As a result, the ways government-led interventions may mitigate structural inequalities or, conversely, reinforce spatial concentration remain insufficiently explained. This gap is particularly salient in contexts where government action plays a central role in promoting balanced and inclusive digital development [16,17].

2.2. Government-Led Digital Governance and Institutional Mechanisms

To address these limitations, recent scholarship conceptualizes digital transformation as an institutional and organizational process rather than a purely technological one. National and regional policies shape the direction and diffusion of digital innovation; organizational capabilities in data governance, inter-agency coordination, and resource integration determine the effectiveness of implementation; and human capital mediates the translation of digital tools into actual usage outcomes [18]. Within this framework, digital governance functions as a crucial mechanism through which governments steer digital transformation toward more balanced regional development, influencing both the scale and spatial distribution of digital resources [19].
Nevertheless, empirical findings on the effects of government-led digital governance remain mixed. Some studies suggest that digitalization enhances administrative efficiency, improves service accessibility, and promotes regional equity [20,21], while others caution that, without adequate institutional safeguards, it may intensify spatial concentration, entrench pre-existing structural inequalities, and exacerbate social exclusion [22]. These tensions are particularly evident in China, where pronounced disparities in digital infrastructure and governance capacity indicate that technological investment alone is insufficient; institutional arrangements and organizational capacity ultimately determine whether digital transformation narrows or widens inter-city disparities [23]. Consequently, empirical research is needed to identify the conditions under which government-led digital governance promotes, rather than reinforces, inter-city digital equity, and to clarify the institutional mechanisms through which governance shapes the evolution of regional digital disparities.

3. Theoretical Background and Hypothesis

3.1. Integrative Theoretical Framework

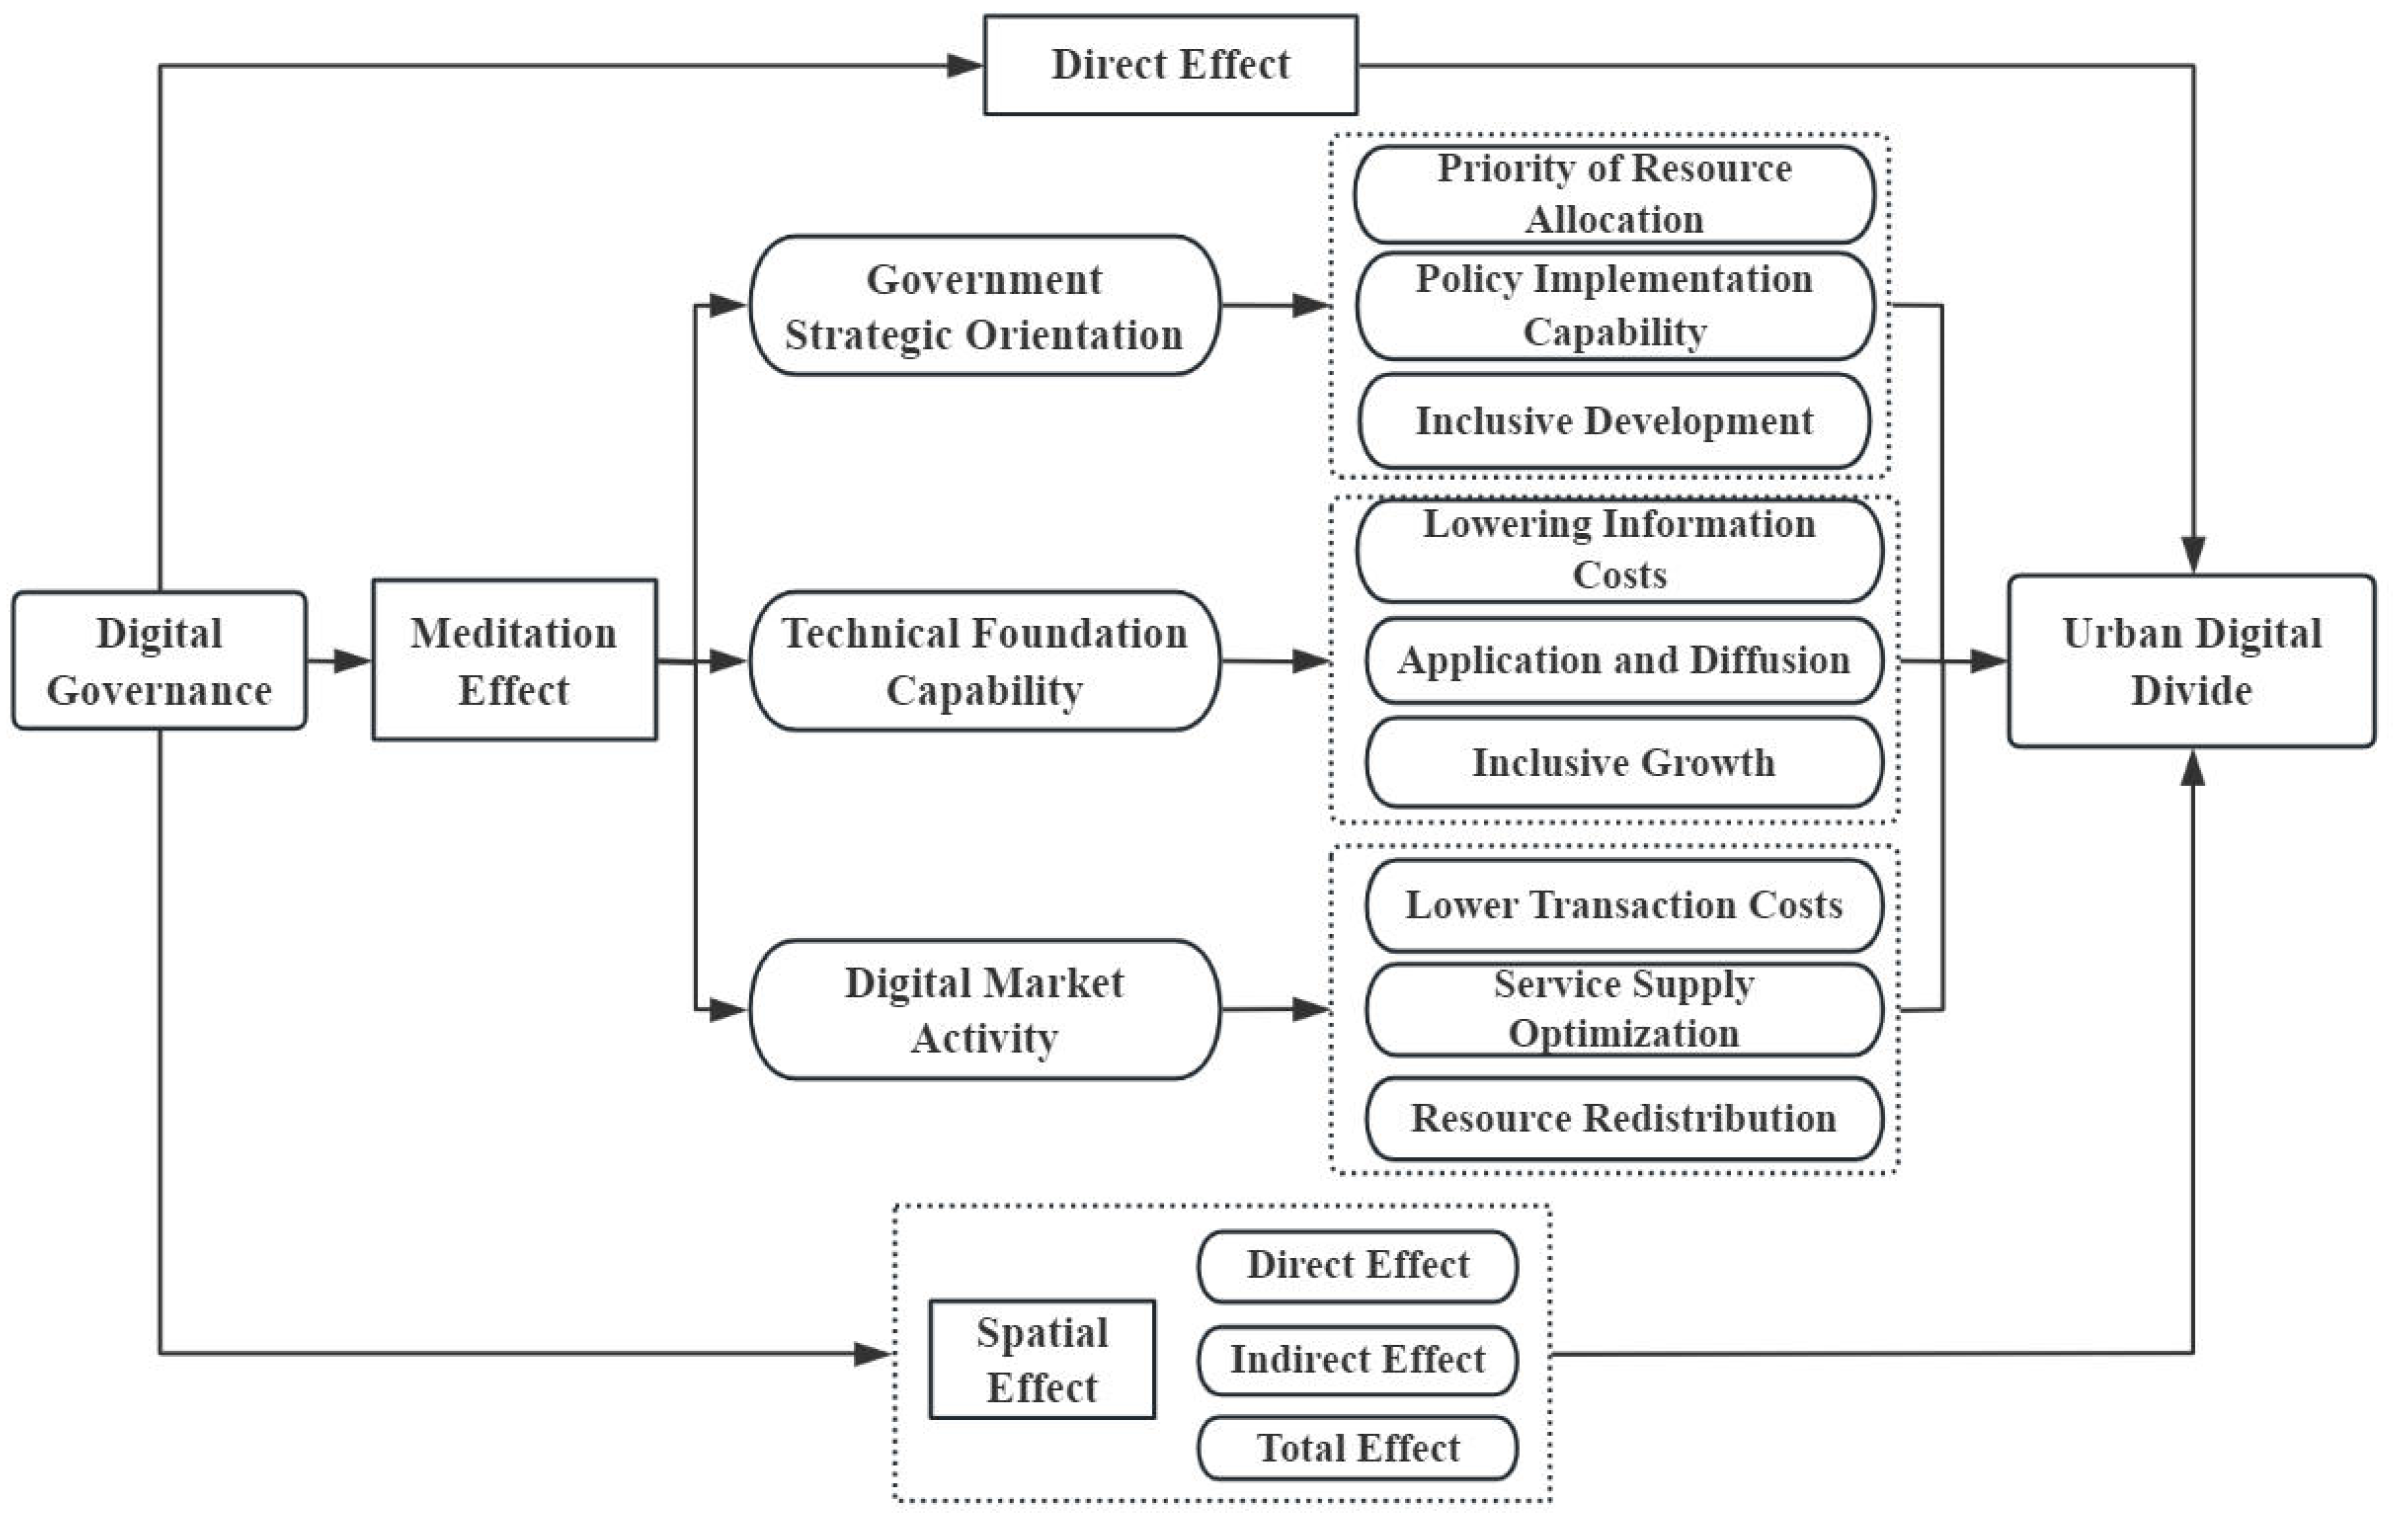
To understand why cities diverge in digital development, it is essential to move beyond single-factor explanations and consider how institutional arrangements, technology adoption, and spatial interdependence jointly shape urban trajectories. Government interventions set rules, allocate resources, guide policy implementation, and promote inclusiveness. Figure 2 conceptualizes government action as a foundational force operating through three interlinked pathways. Strategic orientation clarifies priorities and coordinates actions; technological capacity lowers information costs, facilitates application and diffusion, and supports inclusive growth; digital market vitality reduces transaction costs, optimizes service supply, and redistributes resources. These mechanisms are mutually reinforcing, propagating across spatially interconnected cities and generating spillovers or competitive pressures shaping regional convergence or polarization. This framework provides a coherent basis for understanding how government-led digital governance affects inter-city digital disparities.

3.2. Impact of NPIB on Urban Digital Divide

The digital divide, as a prominent manifestation of uneven development in the digital age, reflects structural inequalities between cities in their capacity to access and utilize information, foster digital literacy, and participate in the digital economy [24,25]. Without institutional intervention, such gaps tend to widen under the “Matthew effect,” leaving some cities persistently disadvantaged [26].
Government-led digital governance offers a crucial means to address these disparities. It can improve digital resource allocation by accelerating broadband and fibre-optic deployment, dismantling structural barriers that historically favoured core cities, and increasing network availability in peripheral regions [27]. Additionally, it enhances public service provision through integrated data platforms and online services, improving efficiency, coverage, and transparency [28]. Finally, government-led governance strengthens institutional capacity by promoting inter-agency coordination and local policy responsiveness, creating opportunities for digital industries and alleviating inequalities in urban digital performance [29].
Within this broader governance paradigm, the National Pilot Policy of Information Benefiting the People (NPIB), launched in 2014, provides a representative quasi-natural experiment of state-led digital transformation. By promoting the deployment of digital infrastructure, integration of government data platforms, and capacity-building initiatives, NPIB enables cities to better leverage these resources to reduce inter-city digital disparities. These measures not only provide essential financial and technical support but also establish a governance framework that guides cities toward more balanced digital development. The policy may particularly benefit lagging cities that lack the resources or institutional capacity to catch up with digital frontrunners. By potentially facilitating convergence in urban digital development, NPIB can help narrow the digital divide, which can be empirically captured through the annual range or dispersion of cities’ digital levels, highlighting its role in fostering a more balanced and equitable digital ecosystem. Based on the above theoretical analysis, we propose the following hypothesis:
H1. 
Government-led digital governance, as exemplified by the NPIB policy, significantly reduces the digital divide among cities.

3.3. Meditation Effect of NPIB on Urban Digital Divide

Digital governance theory posits that improving governmental effectiveness through digital technologies is not merely a technical process but the result of strategic leadership, technological empowerment, and multi-actor collaboration [30]. Building on this foundation, this study proposes an integrated framework to explain how the NPIB policy indirectly influences the urban digital divide. The pilot programme functions as an institutional intervention operating through three interrelated dimensions. First, the strategic–institutional dimension provides direction and impetus for digital governance via top-level design and incentive mechanisms [31]. Second, the technological–capacity dimension encompasses digital infrastructure, platform functionality, and innovation capability that underpin governance effectiveness [32]. Third, the interaction–collaboration dimension emphasizes participatory ecosystems, where government coordination stimulates engagement and innovation among market actors [33]. Collectively, these dimensions form the core mediating channels through which digital governance mitigates structural disparities. The subsequent sections detail how each dimension contributes to narrowing the urban digital divide.

3.3.1. Government Strategic Orientation

In advancing digital transformation, government-led digital governance extends well beyond the provision of infrastructure and technology; it fundamentally depends on the strategic formulation and implementation of digital policies. The NPIB policy, as a nationally mandated institutional arrangement, has played a pivotal role in steering this process. It not only sets explicit digital development objectives for participating cities but also establishes accompanying performance assessment systems and fiscal support mechanisms, thereby enhancing both the enforcement and the sustainability of policy implementation [34]. Under this national framework, local governments have strengthened their capacity for digital transformation by setting strategic goals, operationalising evaluation criteria, and concentrating financial and human resources to ensure coherent execution [35]. Likewise, government-led digital initiatives, through policy incentives and the improvement of institutional environments, have directly stimulated firms’ capacity for digital innovation, underscoring the central role of policy intervention in shaping and sustaining strategic action [36].
A clear digital strategic orientation provides an institutional foundation for bridging the digital divide. First, by guiding the prioritisation of resource allocation, such a strategy accelerates the development of digital infrastructure and promotes greater parity in access conditions across cities, thereby alleviating the structural disadvantages faced by less developed areas [37]. Second, policy implementation under strong strategic leadership has accelerated the digitalisation of public services, enabling pilot cities to advance digital applications and institutional delivery in a more systematic and wide-reaching manner. This, in turn, has reduced disparities among cities in the scope and depth of digital adoption [38]. Finally, through deliberate institutional design and policy direction, digital strategies embed inclusive development objectives within the broader digitalisation process, allowing more cities to share the institutional gains generated by the digital economy and mitigating differences in digital capabilities at a deeper level [39]. In essence, digital strategic orientation performs a dual role in governance, acting both as a mechanism of institutional transmission and as an instrument of equitable distribution. It therefore constitutes a key mediating pathway through which government efforts contribute to narrowing inter-city digital disparities. Based on this reasoning, we formulate the Hypothesis 2:
H2. 
Government-led digital governance significantly reduces the digital divide in pilot cities by strengthening digital strategic guidance.

3.3.2. Technological Innovation Capacity

Technological innovation capacity serves as a central driver of urban digital transformation and a cornerstone of digital competitiveness. It also functions as a key transmission channel through which government-led digital governance exerts its policy effects. The NPIB policy, through careful institutional design and strategic resource allocation, provides an enabling institutional environment for the development and strengthening of technological innovation capabilities. On the one hand, sustained policy incentives and coordinated resource integration by governments can effectively guide innovation actors to increase investment in research and development, thereby accelerating the creation, iteration, and application of cutting-edge digital technologies [40]. On the other hand, by promoting open government data and information-sharing mechanisms, the government enhances its own transparency and efficiency while simultaneously expanding the practical scope for technology-driven solutions and databased innovation [41]. Furthermore, the continuous improvement of the business environment substantially reduces institutional transaction costs for innovative entities, fostering a conducive ecosystem for the concentration and diffusion of key innovation resources such as technology, talent, and capital [42].
Within this process, the enhancement of technological innovation capacity directly drives the advancement of urban digital development, effectively narrowing the gap between pilot cities and digital frontrunners. Advanced technological capabilities—such as high-speed broadband and cloud computing—substantially reduce the costs of information access, transmission, and processing, enabling less-developed cities to overcome the initial barrier of the “access divide” more rapidly [43]. Moreover, technological progress has empowered the digital and intelligent transformation of essential public services, including education, healthcare, transport, and finance. This transformation has markedly improved the overall quality, accessibility, and equity of public service provision across cities [44]. In addition, a strong foundation of technological capability provides fertile ground for the emergence of new forms and models of the digital economy, creating unprecedented opportunities for firms and individuals alike. This, in turn, reinforces the endogenous momentum and resilience of urban digital growth [45]. Through the effective intervention of government-led digital governance, the NPIB policy enables pilot cities to strengthen their technological innovation capacity, progressively move towards the digital frontier, and ultimately catch up with leading cities, thereby reducing the inter-urban digital divide. Based on this reasoning, we formulate Hypothesis 3:
H3. 
Government-led digital governance reduces the digital divide among pilot cities by enhancing their technological innovation capacity.

3.3.3. Digital Market Vitality

Digital market dynamism is a critical indicator of a city’s digital economic health and maturity, reflecting the efficiency of transactions and the effectiveness of resource allocation within digital environments. government-led digital governance plays a pivotal role in fostering such vitality by creating an open, fair, and efficient market environment that facilitates cross-regional resource flows and equal access to opportunities. In doing so, it helps to narrow the digital divide between cities. The NPIB policy contributes to this process through several key mechanisms. First, the promotion of open government data and the sharing of public information resources provide market participants with high-quality, low-cost data inputs and reliable digital platforms. This encourages data-driven business model innovation and the development of new digital applications [46]. Second, by deepening administrative reforms, improving the digital business environment, and strengthening digital public infrastructure, governments can significantly lower entry and operational costs, thereby enhancing firms’ and individuals’ willingness to participate in the digital economy [47]. Moreover, government support for the digital economic ecosystem—particularly through knowledge dissemination and policy incentives for digital transformation—enables micro and small enterprises to strengthen their digital capabilities. This, in turn, enhances the efficiency and speed of key production and transaction processes, reinforcing network effects and the potential for scale expansion [48].
As digital market vitality improves, pilot cities are better positioned to overcome developmental bottlenecks and catch up with leading regions. On one hand, an efficient market attracts innovative resources, enhances knowledge absorption, and strengthens the application of big data, thereby improving the competitiveness of digital industrial clusters and their position within value chains [49]. On the other hand, a dynamic market ecosystem fosters diverse digital services and business models, broadening the scope and depth of digital applications [50]. Ultimately, by cultivating stronger endogenous momentum through these mechanisms, pilot cities narrow disparities in infrastructure, industry, and application development, contributing to the reduction in regional digital divides [51]. Based on this reasoning, we formulate Hypothesis 4:
H4. 
Government-led digital governance reduces the digital divide among pilot cities by stimulating digital market dynamism.

3.4. Spatial Effect of NPIB on Urban Digital Divide

Government-led digital governance, as an institutionalised public policy, often transcends administrative boundaries and exhibits significant spatial externalities across geographical regions [52]. However, the spatial effects of digital governance are not necessarily unidirectional or uniformly positive; rather, they operate through the dual mechanisms of “spillover” and “polarisation” [53]. On the one hand, spillover effects arise through policy demonstration and technological diffusion, whereby successful practices and institutional learning in pilot cities are replicated or adapted elsewhere, promoting digital development in neighbouring areas [54]. On the other hand, the concentrated allocation of policy resources, fiscal support, and technological assets often grants pilot cities a dual advantage—both institutional and structural—enabling them to attract innovation capital and high-skilled talent [55]. This process of “institutional centralisation” and “factor absorption” can result in competitive imbalances, where surrounding cities experience resource outflows and constrained development opportunities. As pilot cities strengthen their dominance in digital infrastructure and innovation ecosystems, the broader regional landscape may become increasingly polarised rather than convergent, characterised by a “strong-get-stronger” dynamic and mounting pressure on neighbouring areas [40]. Building on this logic, this study contends that the spatial effects of government-led digital governance are not evenly diffused but instead may reinforce existing disparities through a polarisation mechanism, thereby widening the inter-city digital divide. Based on this reasoning, we formulate the fifth hypothesis:
H5. 
Government-led digital governance exerts a negative spatial spillover effect on the digital divide among cities. The digital progress of pilot cities may, to some extent, inhibit the advancement of neighbouring cities, and this polarisation effect is particularly pronounced among cities with similar economic and geographical characteristics.

4. Data Sources and Variable Definitions

4.1. Sample Selection and Data Sources

The data used in this study are mainly drawn from official statistical authorities and authoritative databases, ensuring high reliability and comparability. Specifically, macroeconomic and social indicators are obtained from the China Statistical Yearbook and China City Statistical Yearbook; communication and informatization data come from the Statistical Bulletin on the Development of China’s Communications Industry, the Statistical Bulletin on China’s Information and Communications Industry, and the Peking University Inclusive Finance Index; patent data are sourced from the National Intellectual Property Administration database; and government digital policy intensity is derived from provincial and municipal government reports as well as the Peking University Law and Legal Information Database. Overall, the dataset integrates yearbooks, industry bulletins, official documents, and professional databases, ensuring comprehensive and consistent coverage. Missing values are processed through linear interpolation.

4.2. Variables

4.2.1. Dependent Variable

Urban Digital Divide. The establishment of the indicator system is grounded in both theoretical and empirical considerations. First, from a theoretical perspective, the multidimensional structure of the urban digital divide has been widely discussed in existing studies, which generally highlight the progressive logic of “access–use–outcome”. Following this framework, the present study decomposes the inter-urban digital divide into three analytical dimensions (see Table 1), digital infrastructure access, digital application and literacy, and digital economic efficiency, so as to capture the hierarchical nature of urban digital development from physical accessibility to economic output. Second, from an empirical perspective, the selected indicators draw on the data availability and measurement practices in national statistical systems and prior empirical studies [56]. Indicators such as optical cable density and Internet access ports per capita are consistent with the conventional measurement of infrastructure accessibility in ICT development assessments by the ITU and MIIT. Meanwhile, Internet penetration rate, mobile phone penetration rate, and digital economy employment are adopted to reflect actual usage capabilities and digital literacy at the application level. The economic efficiency dimension further incorporates telecommunication revenue per capita and three sub-dimensions of the Digital Financial Inclusion Index developed by Peking University, which capture the breadth, depth, and digitalization degree of inclusive financial services. Third, in terms of design principles, the construction follows the criteria of scientific validity, systematic coherence, and data comparability. All selected indicators are continuous and positively oriented, ensuring that higher values correspond to smaller inter-urban digital gaps and higher levels of inclusive digital development. This comprehensive framework thus enables a systematic and measurable depiction of urban digital disparities within the evolving context of China’s digital economy.
In this study, the urban digital divide is measured using a standardized relative digital divide index, grounded in relative deprivation theory [57] and benchmarking management theory [58], which emphasize that inequalities are perceived relative to peers or best-practice benchmarks. The index captures each city’s shortfall in digital development compared with the top-performing city in the same period, reflecting perceived digital inequality and the social-psychological dimension of the divide. A composite digital development score is first calculated using the entropy method, weighting indicators across infrastructure, applications, and economic outcomes. Following [14], scores are dynamically normalized against the period’s maximum and minimum, allowing the index to capture evolving relative disparities while controlling for overall improvements. Similar benchmarking approaches are used internationally, such as the European Commission’s Digital Economy and Society Index (DESI) and the World Bank’s Digital Adoption Index, which compare regions or countries against top performers. This approach thus provides a robust, internationally informed measure of inter-city digital disparities, integrating both structural and perceptual dimensions. The calculation formula is as follows:
D i g i t a l   D i v i d e i t = m a x ( S t ) S i t m a x ( S t ) m i n ( S t )
where Sit represents the composite digital development score of city i in year t, and max(St) and min(St) represent the maximum and minimum scores across all cities in that year. To ensure robustness against potential outliers, the index is further recalibrated using median-based scaling in subsequent tests, with consistent results obtained.

4.2.2. Independent Variable

Dummy variable for the NPIB policy. This study examines a sample of cities designated as NPIB pilot cities in 2014. Cities participating in the NPIB are classified as the treatment group and assigned a value of 1, while non-pilot cities form the control group and are assigned a value of 0. For cities in the treatment group, the variable takes a value of 1 in the year of implementation and all subsequent years, and 0 in the years prior to implementation. For non-pilot cities, the variable remains 0 for all years. The core explanatory variable in this paper is the interaction term (NPIB) between this dummy variable and the year dummy, which captures whether city i was under the NPIB policy in year t.

4.2.3. Control Variables

To reduce omitted variable bias, this paper incorporates the following control variables into the model, drawing on existing literature [59,60].
(1)
Economic development level (GDP): measured by the natural logarithm of per capita GDP. Economic status not only affects the capacity for investment in digital infrastructure but may also directly influence the inter-urban digital divide.
(2)
Social consumption level (Cons): represented by the logarithm of total retail sales of social consumer goods. Consumption activity reflects the demand potential for digital products and services, which in turn has an impact on the digital divide.
(3)
Industrial structure (Ind): measured by the proportion of tertiary industry added value to GDP. A more developed tertiary industry brings richer digital application scenarios, which may help narrow the digital divide.
(4)
Government fiscal support (Gov): measured by the proportion of local fiscal expenditure to GDP. Government investment in digital public services and infrastructure is directly related to the evolution of the digital divide.
(5)
Human capital (Hcap): measured by the number of college students per 100,000 people. Educational attainment and talent reserves affect the ability to absorb digital technologies, thereby exerting a significant influence on the digital divide.

4.2.4. Mediating Variables

Grounded in the preceding theoretical framework, this study examines how government-led digital governance influences the urban digital divide from three interrelated dimensions: strategic orientation, technological innovation capacity, and digital market vitality. Through the NPIB policy, governments shape the trajectory of urban digital transformation by directing strategic priorities and allocating resources. The strategic orientation of digital governance reflects the extent to which local governments prioritize and implement digitalization within their policy agendas. Drawing on existing research [61], this study conducts textual analysis of annual government work reports across Chinese prefecture-level cities, identifying the frequency of 60 digitalization-related keywords. As the primary reference text for local policy formulation [62], the government work report provides a reliable proxy for understanding policy emphasis. A higher frequency of digital-related keywords indicates a stronger governmental focus on digital transformation, which in turn suggests greater administrative effort in promoting digital infrastructure and public service innovation [63]. In the technological dimension, the number of digital patent applications per capita is widely recognized as a key indicator of innovation performance and technological accumulation [64]. This measure captures both the intensity of regional innovation activity and the capacity to leverage technology for digital access and utilization. Cities with stronger technological innovation capacity are better positioned to reduce digital barriers through technology diffusion and application, thereby narrowing the digital divide. From the market perspective, this study employs per capita e-commerce transaction value as a proxy for digital market vitality. This indicator is commonly used in industry analyses and global reports, such as Global eCommerce Spending per Capita, to assess the depth of consumer engagement and market dynamism within digital platforms. After controlling for population size, per capita e-commerce spending effectively reflects the prosperity of a city’s digital economy. A more dynamic market environment expands residents’ access to digital goods and services, enhances the inclusiveness of digital benefits, and ultimately mitigates disparities across cities along the chain of digital access, usage, and returns.
Table 2 presents the descriptive statistics of the variables.

4.3. Empirical Model

In 2014, national-level authorities, including the National Development and Reform Commission and the Central Cyberspace Affairs Commission, jointly launched the “National Pilot Policy of Information Benefiting the People” and designated 80 cities as the first batch of pilot areas. The pilot coverage spanned 23 provinces, 5 autonomous regions, and 4 municipalities directly under the central government; notably, the selection process did not rely entirely on the existing digitalisation level of the cities, which gave it a certain degree of randomness. In this paper, the 2014 NPIB policy is treated as an exogenous shock, and the difference-in-differences method is adopted to identify its impact on the inter-urban digital divide. Specifically, cities included in the 2014 pilot list are classified into the treatment group, while non-selected cities form the control group. Using panel data of 279 prefecture-level cities from 2011 to 2022, this study estimates the net effect of the policy implementation on the inter-urban digital divide, and based on this, the model is set as follows:
Digital   Divide it   = α 0 + α 1 N P I B i t + θ X i t + δ i + μ t + ε i t
Here, Digital Divideᵢₜ is used to measure the level of digital divide in city i during period t. The core explanatory variable, NPIBit, represents the dummy variable for the NPIB policy. Xᵢₜ denotes a set of control variables; δᵢ stands for city-specific fixed effects, μₜ represents time fixed effects, and εᵢₜ denotes the random error term. The same notation applies below.
To examine the specific transmission mechanisms through which government-led digital governance affects the inter-urban digital divide, this paper draws on the research of Jiang (2024) [65] and others to construct an econometric model for mechanism testing. The specific model specification is shown in Equation (2), where Mᵢₜ represents the mediating variable:
M i t = α 0 + α 1 N P I B i t + θ X i t + δ i + μ t + ε i t
This paper employs a spatial econometric Equation (3) to conduct a rigorous test on the spatial correlation structure of the digital divide. Given that the Spatial Durbin Model (SDM) can simultaneously capture spatial correlation and random disturbances while providing unbiased estimates, this study selects the SDM to assess the spatial effects of government-led digital governance on the inter-urban external digital divide. This method not only helps obtain more reliable estimates of “local effects” but also reveals the mechanism through which policies function in overall balanced development. In doing so, it provides a systematic basis for an in-depth understanding of the complex effects of government-led digital governance and offers key insights for formulating inclusive digital policies that promote coordinated regional development.
D i g i t a l D i v i d e i t = ρ W D i g i t a l D i v i d e i t + θ 1 N P I B i t + θ 2 W N P I B i t + θ 3 X i t + θ 4 W X i t + ε i + λ t + μ i t
Here, ρ denotes the spatial autoregressive coefficient, and W represents the spatial weight matrix. WDigital Divideit, WNPIBit, and WXᵢₜ, respectively, stand for the spatial lag terms of Digital Divide, NPIB, and the control variables. θ is the regression coefficient in the Spatial Durbin Model (SDM).
This paper adopts an economic geography nested matrix as the spatial weight matrix (see Equation (4)), and this choice is based primarily on two considerations. First, a single geographical adjacency matrix cannot fully reflect the actual interconnections between cities. The spatial effects of digital development are not only influenced by geographical proximity, but also closely related to the similarity of regional economic development levels. Second, by integrating both geographical distance and economic differences, the economic geography nested matrix can more accurately depict the diffusion and transmission characteristics of digital governance and the digital divide across regions. Therefore, this matrix is better able to reflect the spatial and economic interaction between cities in the process of digital development. Here, GDPᵢ and GDPⱼ represent the average per capita GDP of each city, while dᵢⱼ denotes the geographical distance between the two cities.
W = 1 2 G D P i ¯ G D P j ¯ + 1 2 d i j , i j 0 , i = j

5. Results

5.1. Temporal and Spatial Evolution Trends of the Digital Divide

5.1.1. Temporal Evolution of the Urban Digital Divide

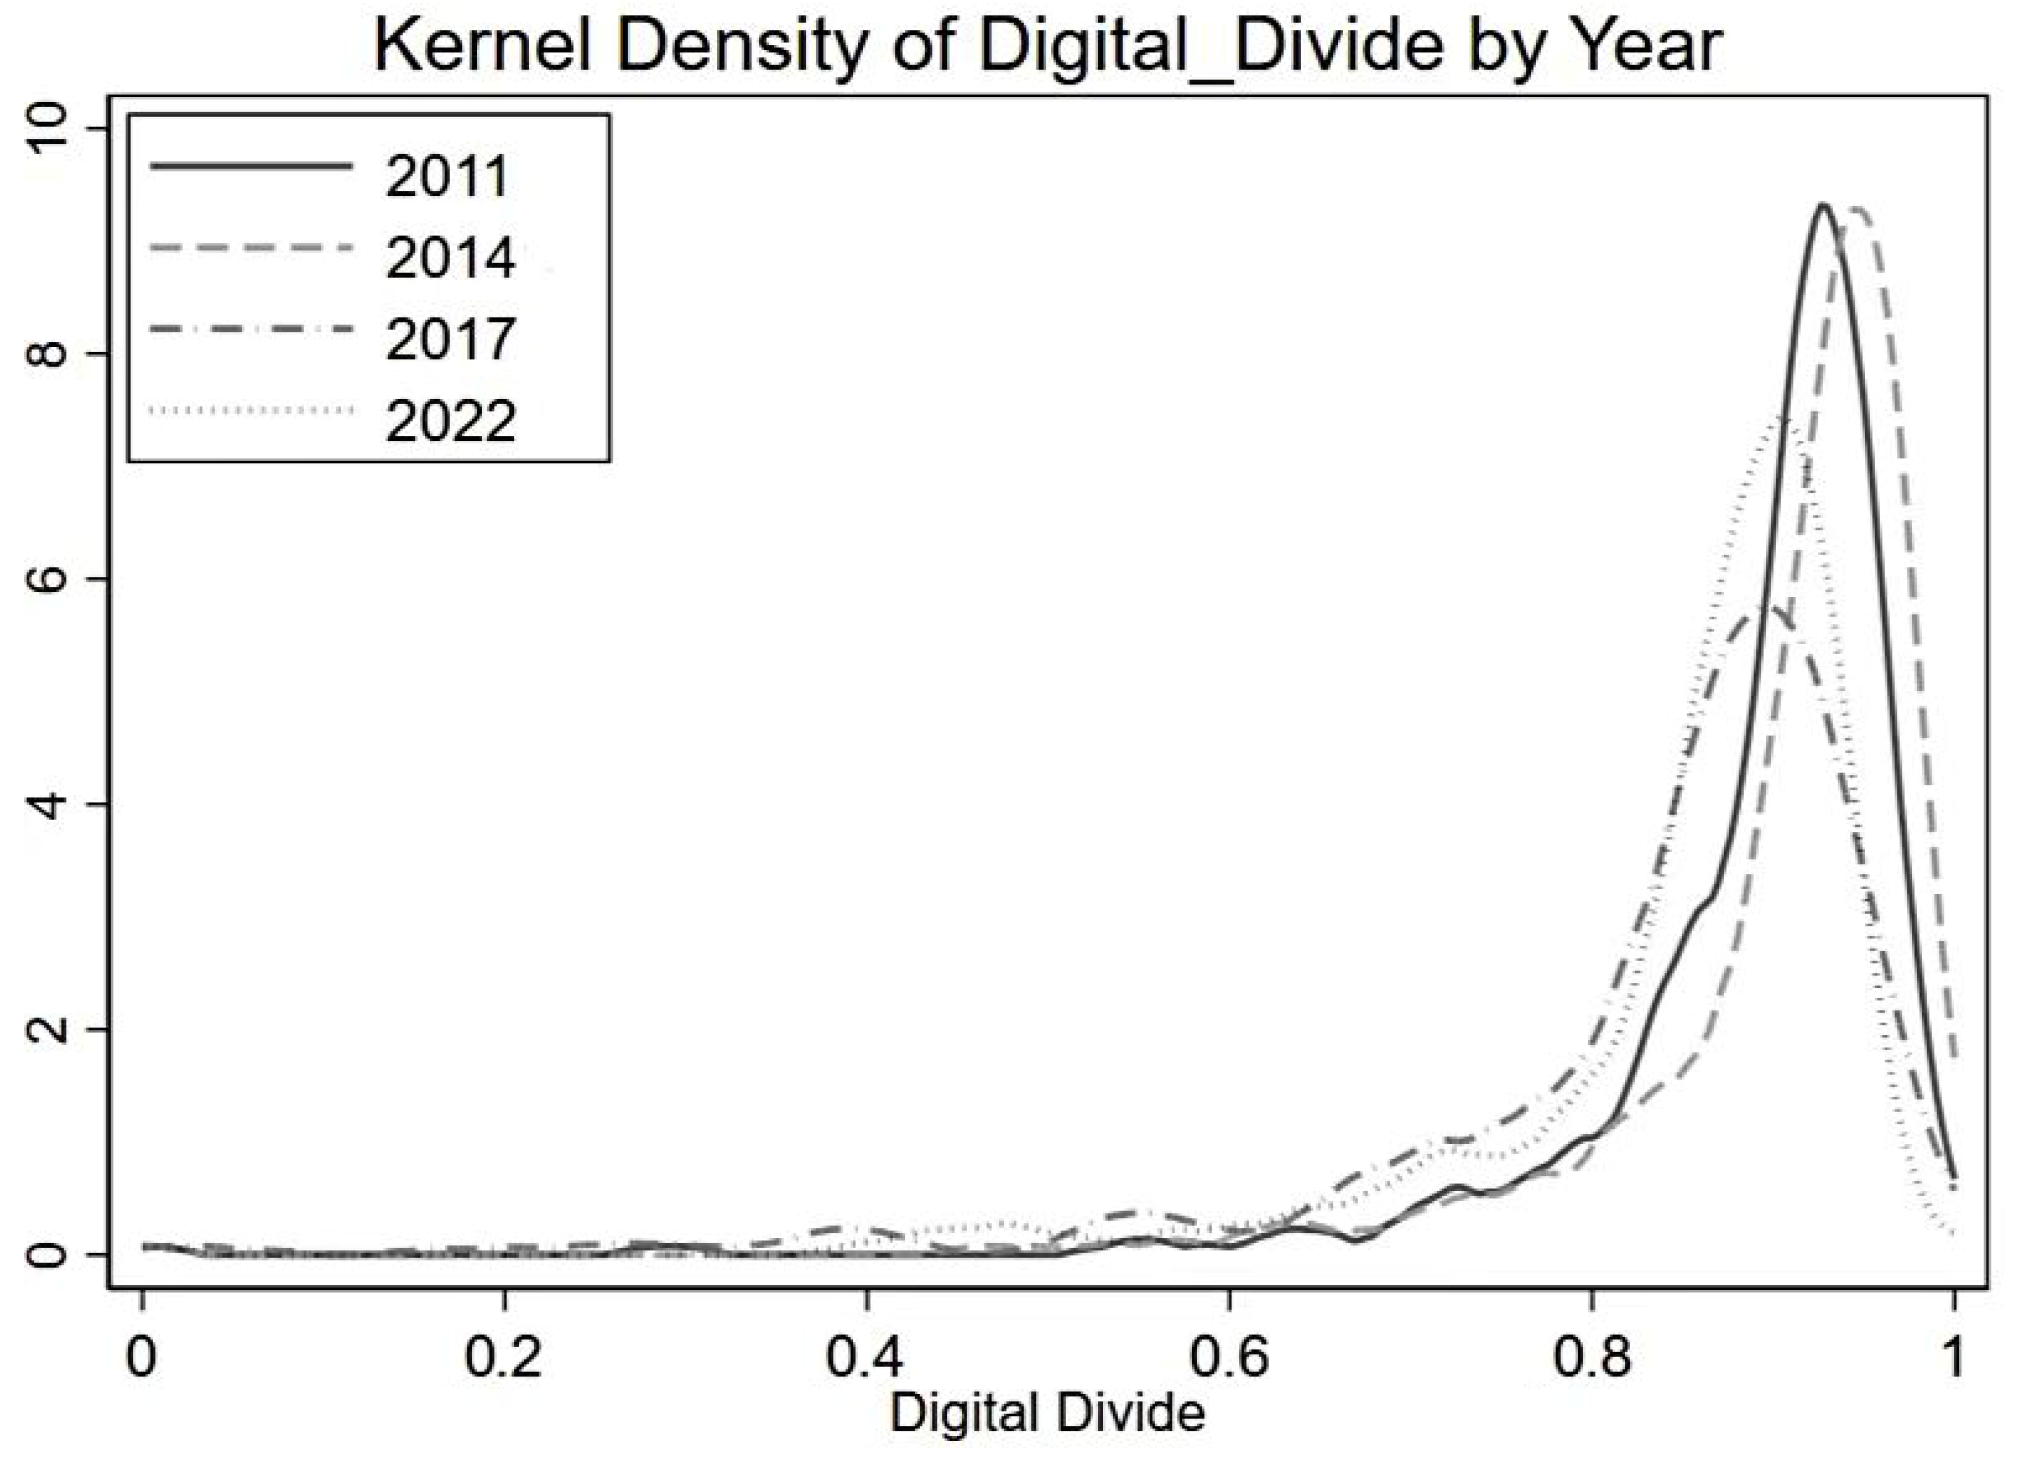
Figure 3 illustrates the kernel density distribution of the urban digital divide in China from 2011 to 2022. The distribution was initially right-skewed, indicating that most cities remained at relatively low digital development levels. Between 2011 and 2014, the curve was concentrated and steep, reflecting a homogeneous stage of progress. From 2017 onward, the distribution shifted slightly left, suggesting that some cities improved relative to the national frontier. By 2022, the curve showed modest convergence, with most cities advancing, although disparities among cities persisted. These patterns highlight the evolving temporal dynamics of urban digital development over the study period.

5.1.2. Spatial Evolution of the Urban Digital Divide

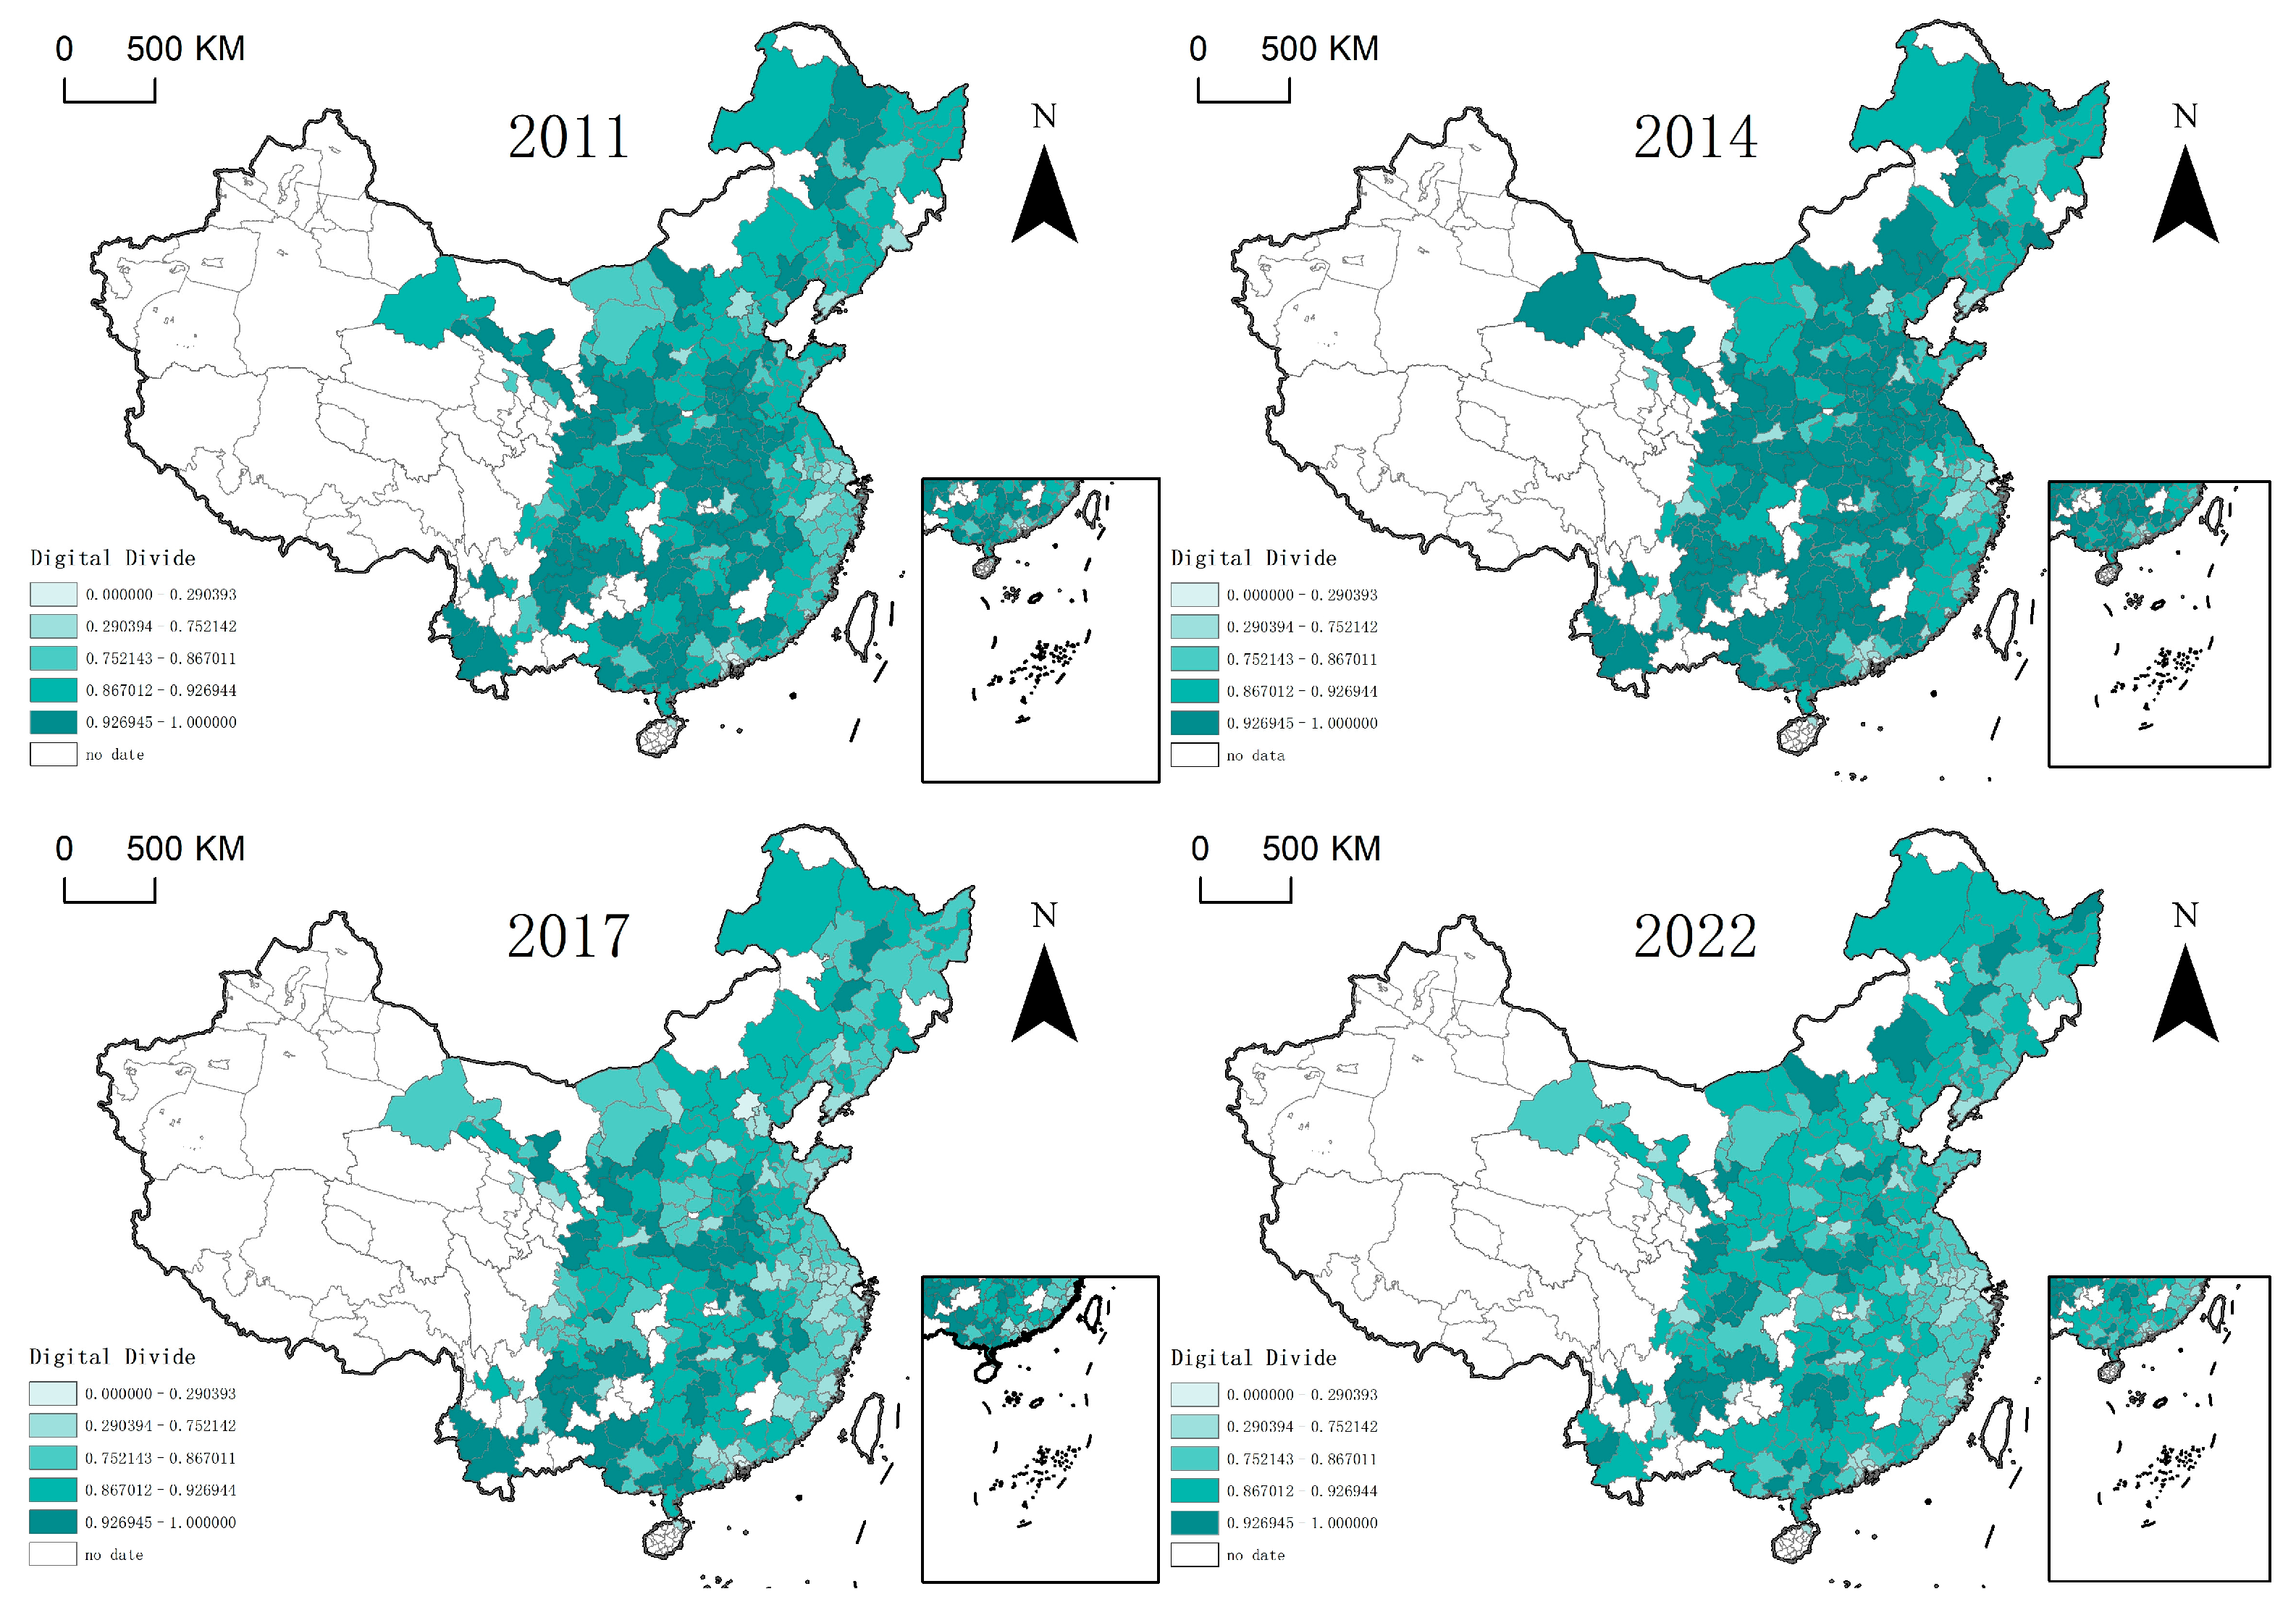
To examine spatial patterns, ArcGIS 10.8 was used to map the urban digital divide across Chinese cities (see Figure 4). A persistent East–West gradient is evident: eastern coastal cities generally exhibit lower gap values, central regions are intermediate, and western areas, particularly northwest and southwest, form high-gap clusters. Over time, many initially high-gap regions improved, reflecting the positive effects of policy interventions and infrastructure expansion. However, several localities remained in persistently high-gap states, highlighting structural and regional constraints that continue to challenge inclusive digital development. This spatial perspective reveals that, despite overall temporal convergence, significant regional disparities persist and require targeted governance strategies.

5.2. Main Results

Table 3 presents the benchmark regression results on the impact of government-led digital governance on the inter-urban digital divide. Columns (1)–(4) report estimates controlling for different sets of covariates, as well as time and city fixed effects. The coefficient of the NPIB variable is consistently negative and statistically significant at the 1% level across all specifications, indicating that the NPIB policy substantially reduced the urban digital divide. In Column (4), after controlling for city characteristics, time, and individual effects simultaneously, the coefficient remains significant, confirming the robust effect of NPIB implementation in narrowing inter-city digital disparities.

5.3. Robustness Tests

5.3.1. Parallel Trend Test

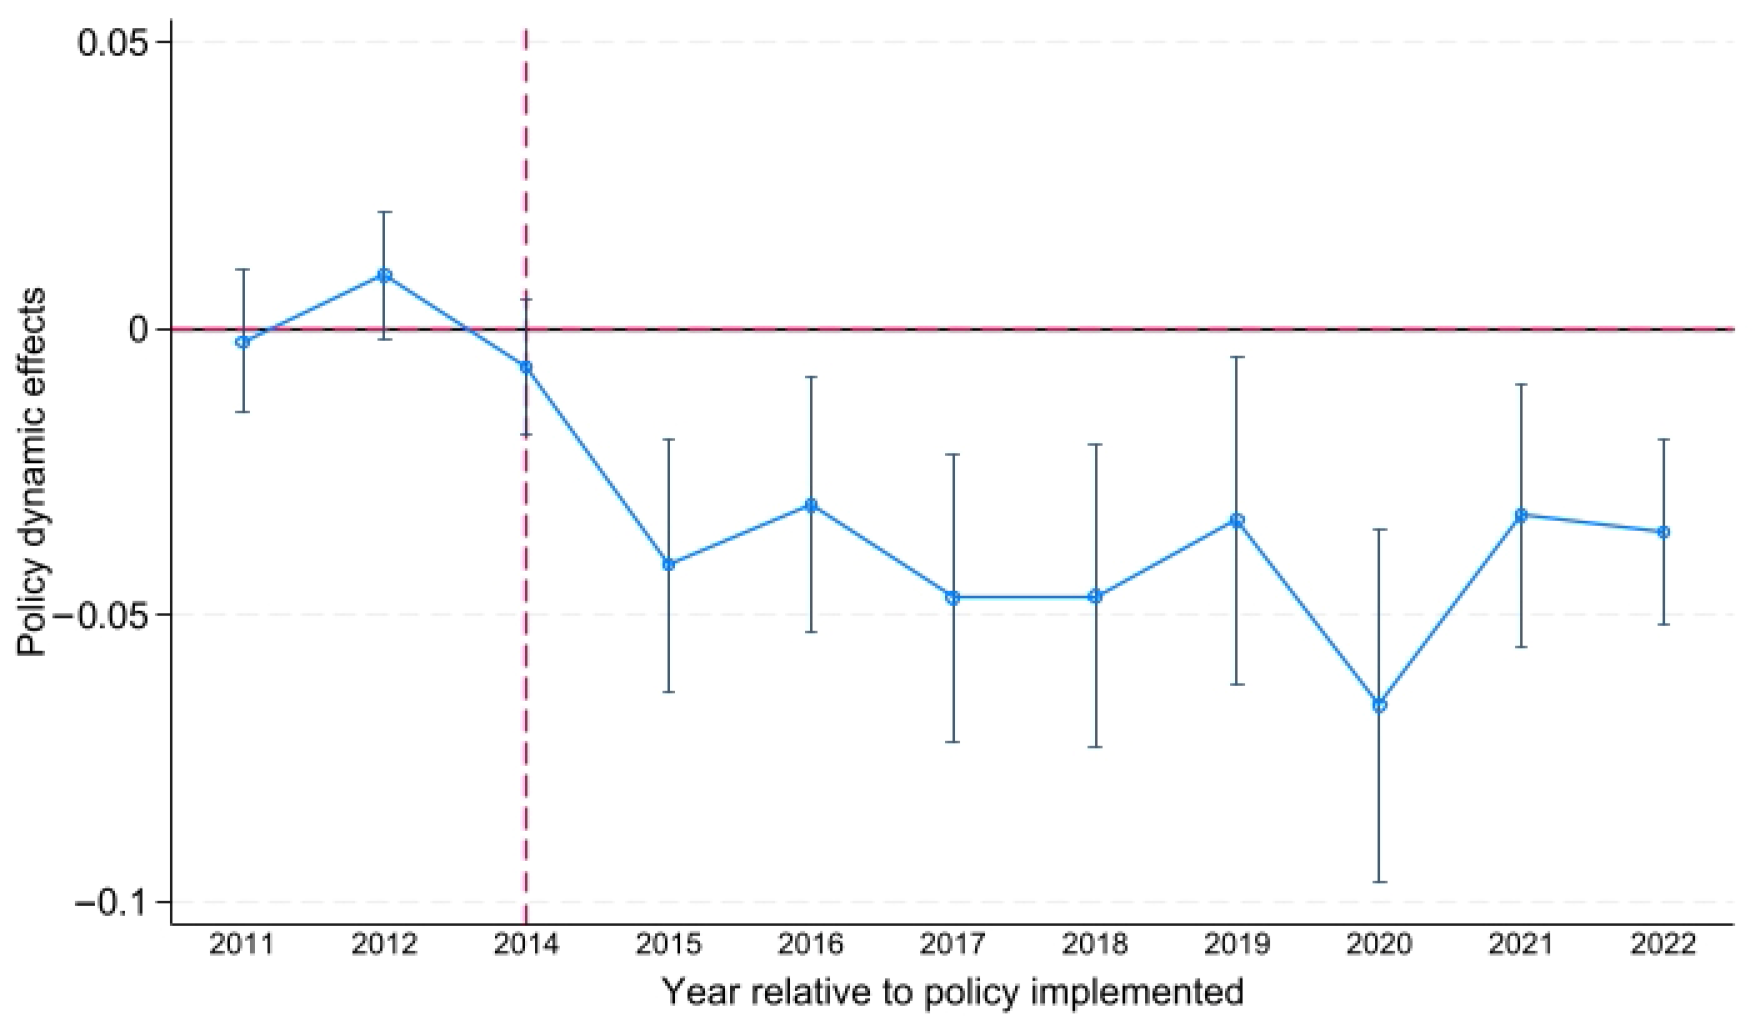
The validity of the difference-in-differences approach depends on the parallel trend assumption, i.e., that in the absence of the NPIB, the urban digital divide in treatment and control cities would have followed similar trends. Following Jacobson et al. (1993) [66] and Li et al. (2016) [67], we employ an event study framework to test this assumption, specified as follows:
D i g i t a l D i v i d e i t = α 0 + k = 3 , k 1 8 β k · N P I B i t   =   k + θ X i t + δ i + μ t + ε i t
In the regression results, NPIBit=k is a dummy variable for the k-th year relative to NPIB implementation; its estimated coefficient βₖ captures the difference in the digital divide between pilot and non-pilot cities in that year. As shown in Figure 5, before NPIB implementation, all confidence intervals intersect the zero line, indicating parallel trends between pilot and non-pilot cities. After the policy launch, the impact on the urban digital divide intensified, peaking in 2017, and then gradually declined. Differences between pilot and non-pilot cities narrowed over time, reflecting convergence in later years.

5.3.2. Placebo Test

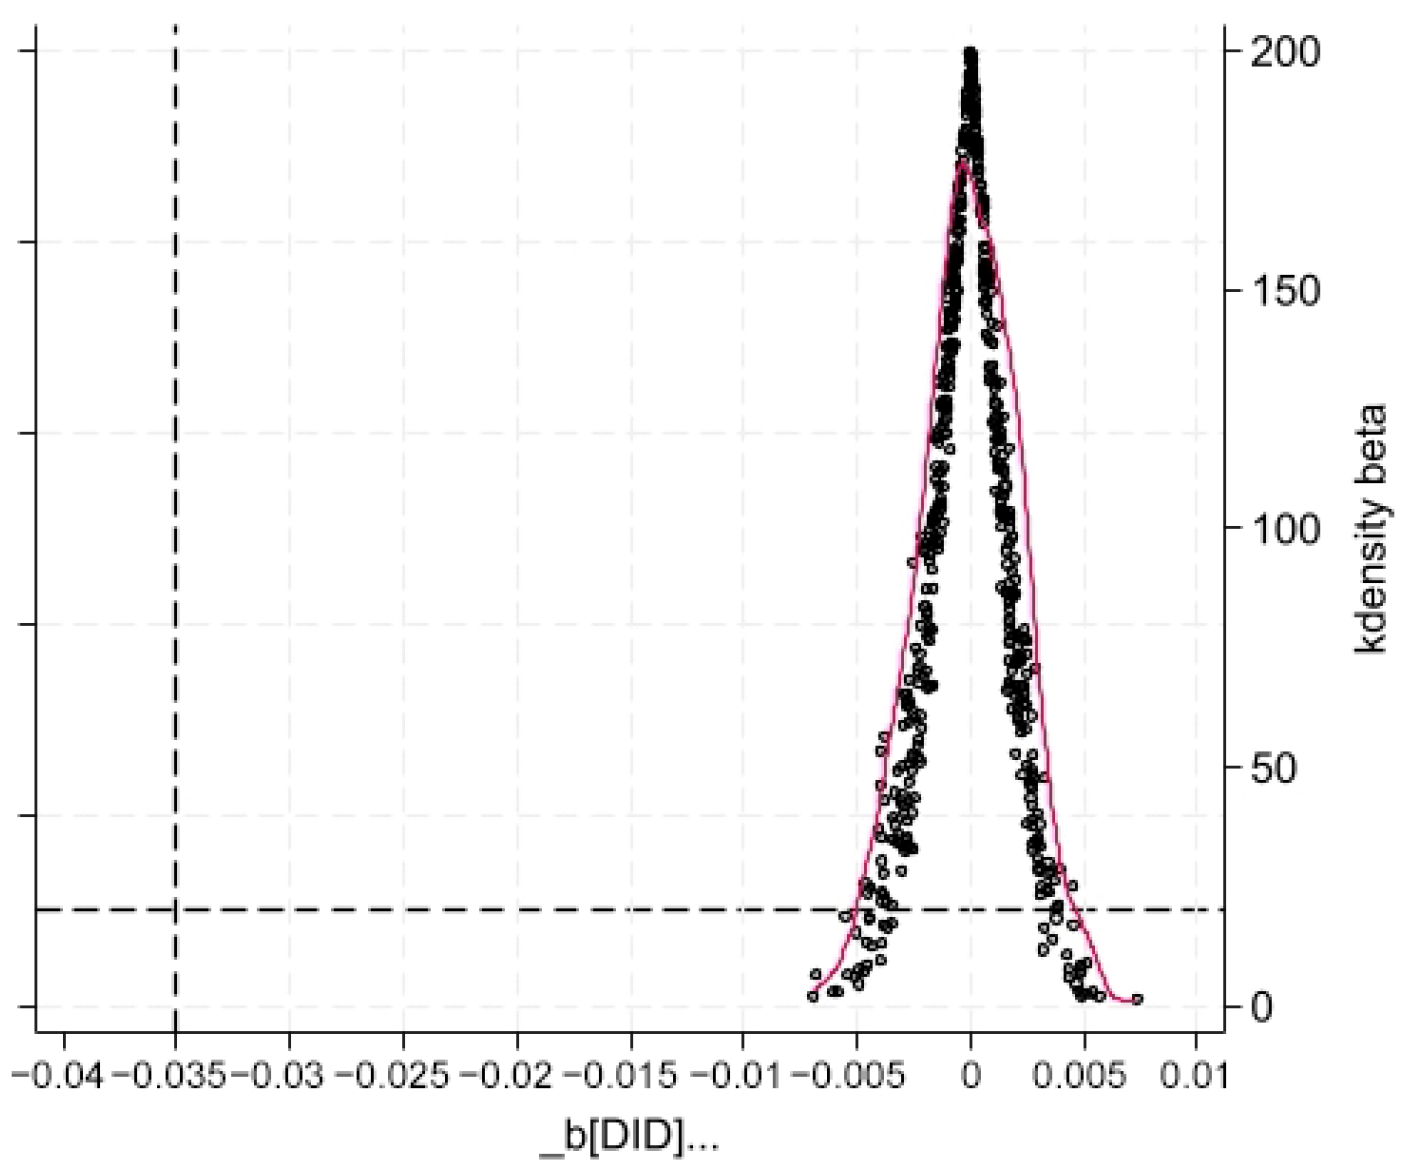
To check robustness, a placebo test was conducted by randomly assigning the policy to pseudo-treated cities 500 times. As shown in Figure 6, the estimated coefficients are centered around zero with a sharp kernel density curve, indicating no systematic effect under random assignment. The main regression coefficient of the actual NPIB treatment is −0.035, clearly separated from this distribution, demonstrating that the observed policy effect significantly deviates from coefficients generated under random assignment.

5.3.3. Robustness Checks Using PSM-DID and IV

To address potential selection bias and endogeneity in NPIB pilot city assignment, this study applies both Propensity Score Matching–Difference-in-Differences (PSM-DID) and instrumental variable (IV) approaches. For the PSM-DID, all control variables from the benchmark regression are used as matching variables, with a Logit model estimating the propensity score for each city. Nearest-neighbor, radius, and kernel matching methods are applied. After matching, covariate imbalance is substantially reduced, with no imbalance exceeding 15%, indicating good matching quality. Columns (1)–(3) of Table 4 report the PSM-DID estimates, showing that NPIB participation significantly reduces the urban digital divide.
For the IV approach, this study follows Xing et al. (2023) [68] and uses the interaction between historical communication data from 1984 and a post-policy dummy as the instrumental variable for NPIB participation. This historical indicator provides a plausibly exogenous source of variation for identifying policy assignment.
Column (4) of Table 4 reports the first-stage results, showing that the instrument is strongly and significantly correlated with NPIB participation, with a Kleibergen–Paap rk Wald F statistic of 31.542, well above the threshold of 10. Column (5) presents the second-stage estimates, indicating that NPIB participation significantly reduces the urban digital divide. These results confirm that the main findings remain robust after addressing potential endogeneity.

5.3.4. Other Robustness Checks

Several robustness tests were conducted to ensure the reliability of the baseline results. First, We re-measure the digital-divide index using a robust dispersion estimator based on the national yearly median and the median absolute deviation (MAD) to reduce the influence of extreme values (see Equation (7)). This approach follows established robust inequality and scale-estimation practice [69]. Higher values indicate relative improvement, while lower values indicate a deepening divide. Regression results using this indicator (Column 1, Table 5) remain consistent with the benchmark estimates.
D i g i t a l D i v i d e _ r o b u s t i t = S it M e d i a n ( S t ) M e i d a n ( | S i t M e d i a n ( S t ) | )
Second, the four centrally administered municipalities (Beijing, Shanghai, Tianjin, Chongqing) were excluded to avoid extreme-value bias due to their policy and resource advantages. The NPIB coefficient remains significantly negative (Column 2, Table 5), indicating that the main findings are not driven by these municipalities.
Third, province×year fixed effects were added to control for unobservable province-level time-varying shocks, such as industrial policies, fiscal transfers, or macroeconomic fluctuations. Results (Column 3, Table 5) are consistent with the baseline regression.
Fourth, the sample period was restricted to 2011–2017 to avoid potential post-policy demonstration effects. The estimated NPIB coefficient remains robust (Column 4, Table 5).
Fifth, the double machine learning (DML) approach was applied, using Neyman-orthogonal estimating equations with cross-fitting and Lasso prediction, addressing high-dimensionality and multicollinearity. The NPIB coefficient remains significantly negative at the 1% level (Column 5, Table 5).
Finally, potential interference from other concurrent policies—including the “Broadband China” Pilot Cities (BCP), Smart City Pilot (SCP), and Government Data Opening (GDO), was controlled by including dummy variables for these programs in the regression. Column 6–9 of Table 5 shows that the NPIB coefficient remains significantly negative when these policies are considered individually and simultaneously, confirming that the main conclusions are not affected by other digital governance initiatives.
Collectively, these tests demonstrate that the benchmark results are robust across different variable constructions, sample restrictions, model specifications, and policy interference controls.

5.4. Mechanism Analysis

Table 6 reports the mechanism analysis results for government strategic orientation, technological innovation capacity, and digital market vitality. Across all six specifications, the NPIB coefficient remains positive and statistically significant at the 1% level. Specifically, Columns (1)–(2) show that NPIB participation is associated with a coefficient of 0.001 for government strategic orientation; Columns (3)–(4) indicate that technological innovation capacity increases significantly, with a coefficient of 1.668; and Columns (5)–(6) demonstrate that digital market vitality is also significantly higher in pilot cities, with a coefficient of 0.711. Overall, these results suggest that NPIB pilot cities exhibit significantly stronger performance across the three dimensions compared with non-pilot cities.

5.5. Heterogeneity Analysis

5.5.1. Geographic Region

Table 7 reports the heterogeneous policy effects across geographic regions. In eastern cities, the NPIB coefficient is −0.048 and significant at the 1% level, indicating a clearly measurable reduction in the digital divide. In central regions, the coefficient is −0.017 and significant at the 5% level, showing a moderate but statistically significant effect. In western regions, the coefficient is −0.031 and significant at the 10% level, suggesting a weaker yet still observable reduction.
Further results based on the Hu Huanyong Line show that the coefficient for the southeast side is −0.039 and significant at the 1% level, whereas the coefficient for the northwest side is statistically insignificant. These findings indicate substantial regional variation in the magnitude of NPIB’s impact.

5.5.2. Urbanization Rate and Government Fiscal Self-Sufficiency Level

Columns (1)–(3) of Table 8 report the heterogeneity results by urbanization level. In low-urbanization regions, the NPIB coefficient is −0.009 and statistically insignificant. In medium-urbanization regions, the coefficient is −0.028 and significant at the 1% level, indicating a clear reduction in the digital divide. In high-urbanization regions, the coefficient is −0.004 and insignificant. Overall, the estimated effects differ across urbanization levels, with the most pronounced impact observed in medium-urbanization cities.
Columns (4)–(6) present the heterogeneity results by fiscal self-sufficiency rate. For regions with low fiscal self-sufficiency, the coefficient is −0.006 and insignificant. For medium fiscal self-sufficiency regions, the coefficient is −0.025 and significant at the 1% level. For high fiscal self-sufficiency regions, the coefficient is −0.034 and significant at the 10% level. The results indicate that the policy effects vary across fiscal conditions, with the most substantial impact found in regions with medium fiscal self-sufficiency.

5.6. Spatial Effect Analysis

The evolution of the urban digital divide is spatially interdependent, as core digital economy factors, data flow, technology diffusion, digital capital, and talent, cross administrative boundaries. Ignoring this spatial dependence may violate the “independent observation” assumption in traditional econometric methods, potentially biasing estimates and overlooking NPIB’s spillover effects on non-pilot cities.

5.6.1. Spatial Correlation Test and Model Selection

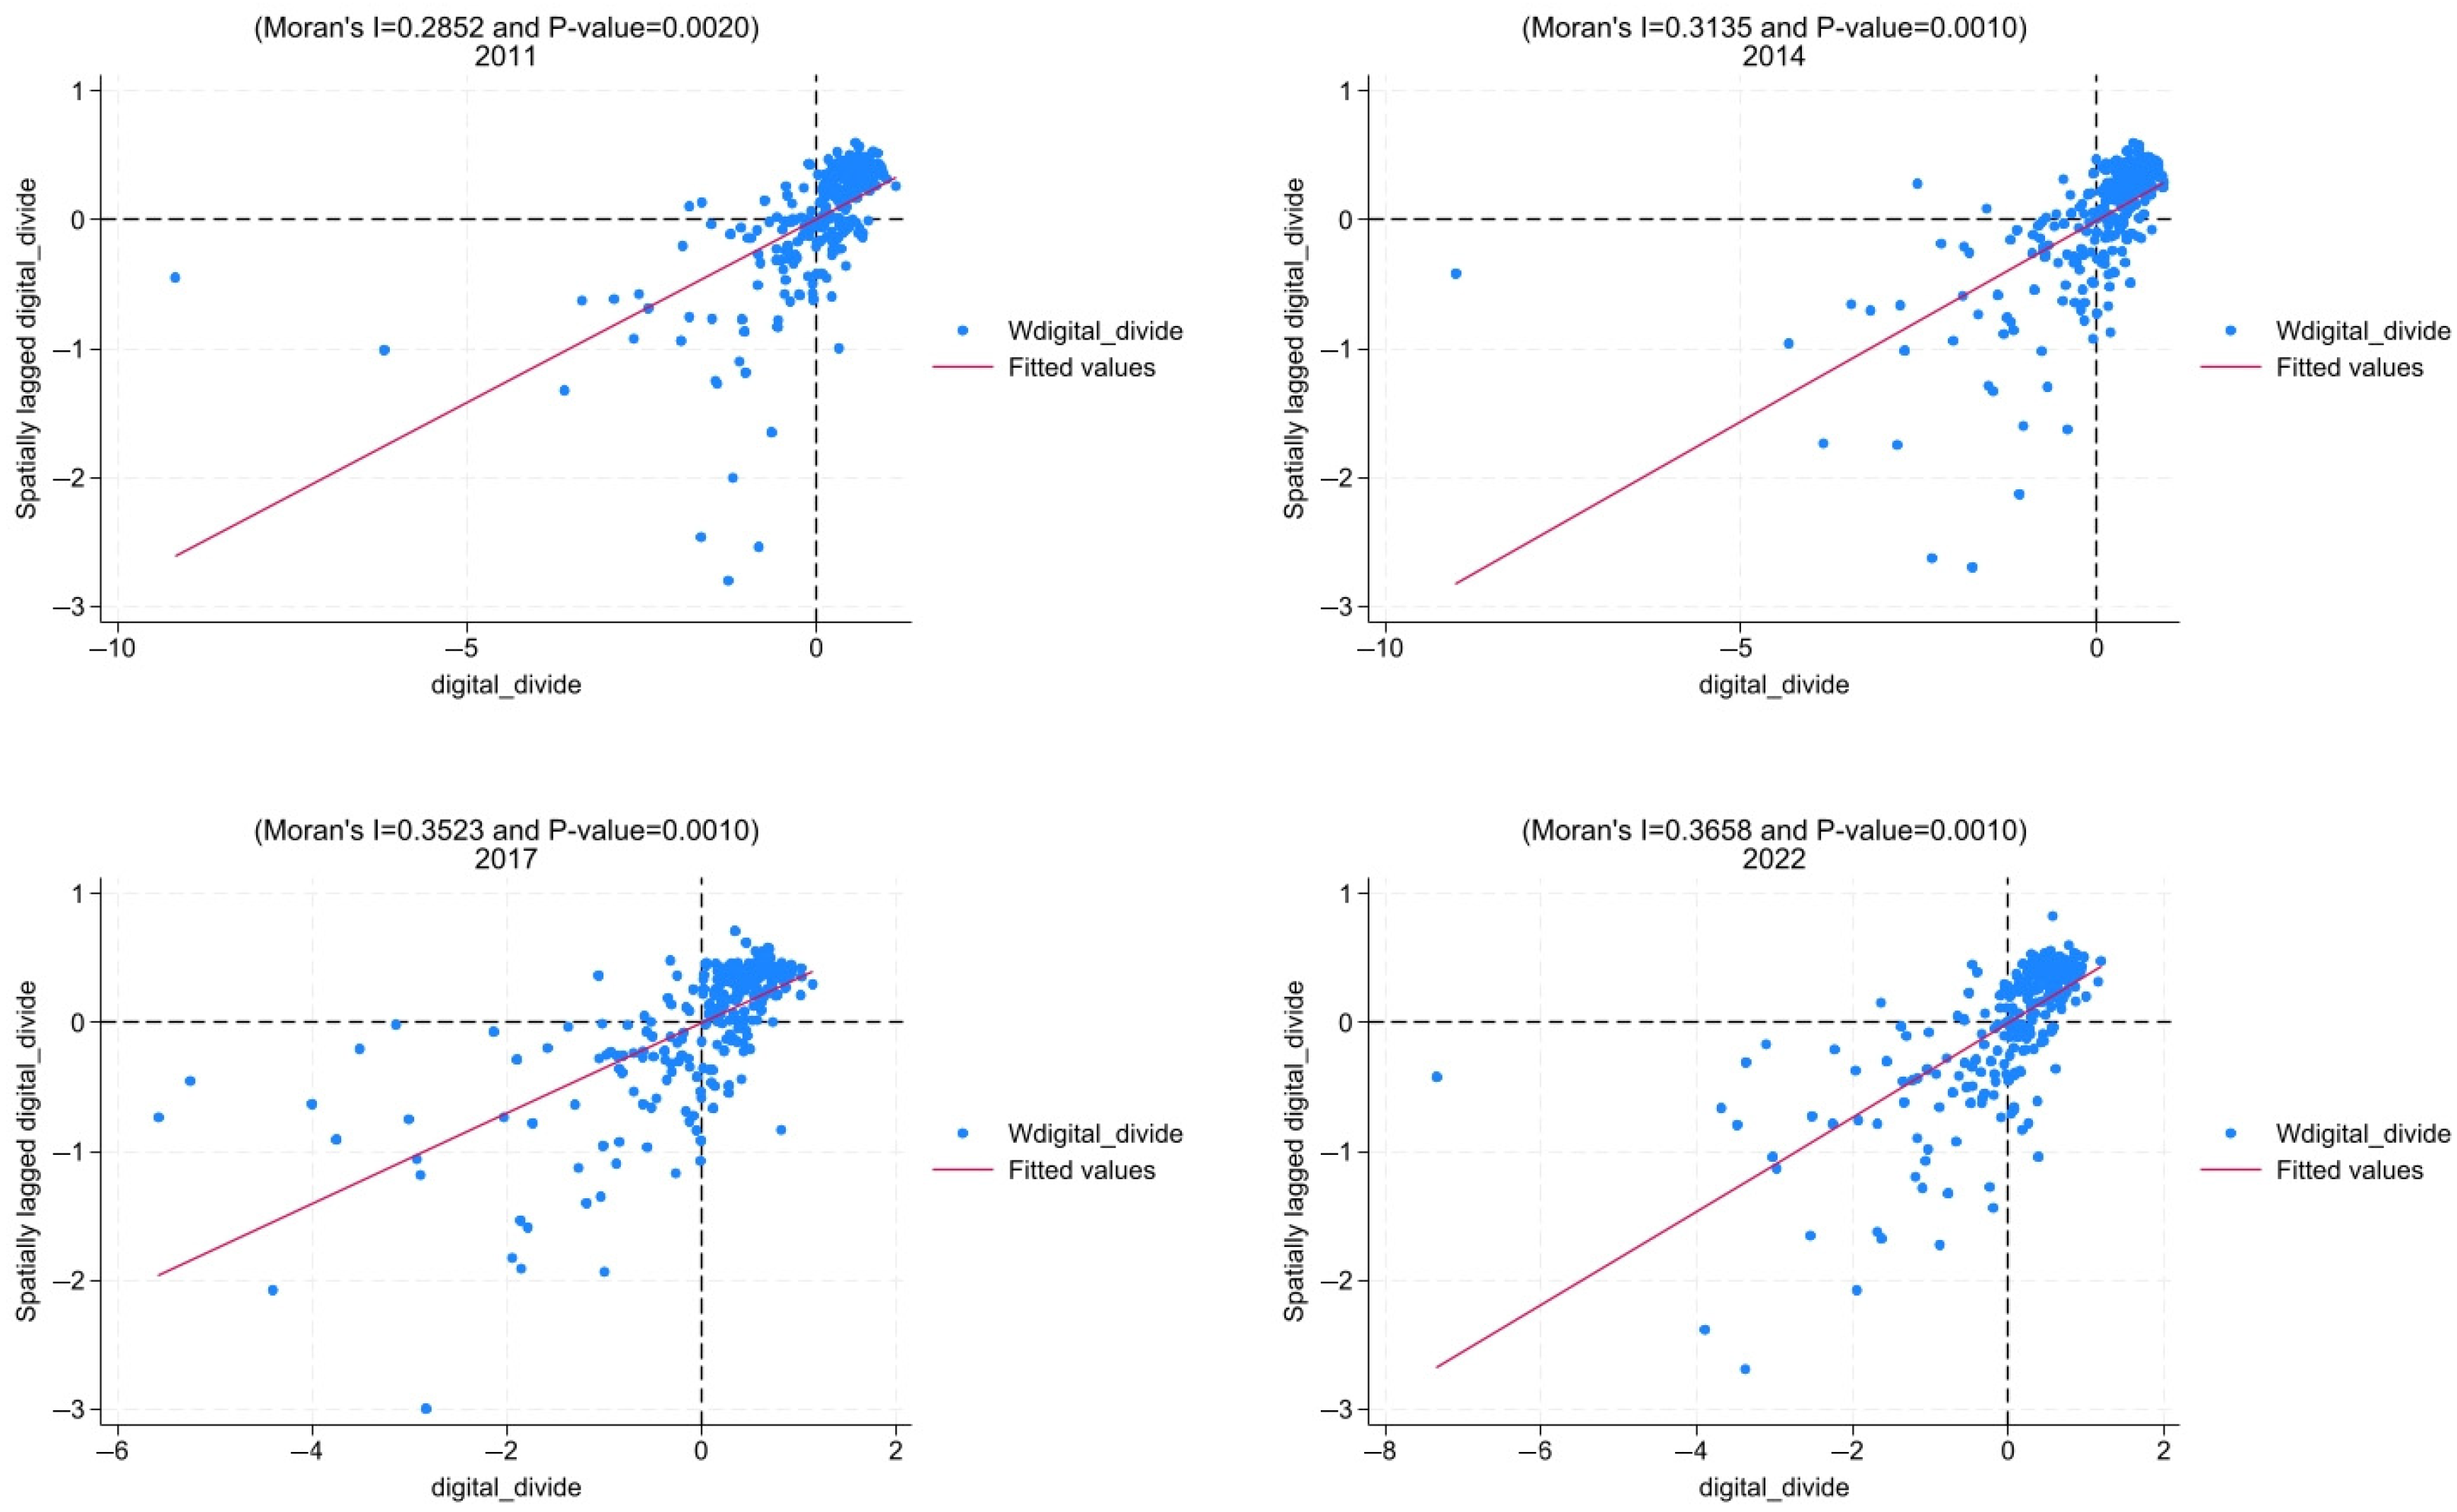
Given the potential spatial dependence in the digital divide, this paper first conducts a spatial correlation test. The results show that Moran’s I values for China’s urban digital divide from 2011 to 2022 are all significantly positive at the 1% level, indicating clear spatial clustering (see Table A1 in Appendix A). The Moran scatter plots for 2011 and 2022 (see Figure A1 in Appendix A) further show distinct “high–high” and “low–low” spatial patterns, confirming that cities with similar levels of the digital divide tend to cluster geographically.
The spatial effect tests further identify the specific form of spatial correlation (see Table A2 in Appendix A), ensuring the model’s scientific validity and the reliability of parameter estimation. The LM test indicates that both the spatial lag and error terms are significant, suggesting that the SEM, SAR, and SDM are all applicable candidates. The Hausman test supports the use of a fixed-effects model, while the LR and Wald tests (both significant at the 5% level) reject the simplification of the SDM. Consequently, this study employs the fixed-effects Spatial Durbin Model for subsequent analysis.

5.6.2. Regression Results of SDM

Table 9 reports the Spatial Durbin Model estimates using an economic geography nested matrix. After controlling for fixed effects and multidimensional controls, the direct (local) effect of NPIB is significantly negative at the 1% level, indicating that pilot cities experience a reduction in the urban digital divide. In contrast, the indirect (spillover) effect is significantly positive at the 1% level, suggesting that neighboring non-pilot cities experience a relative widening of the digital divide. The combined overall effect is statistically insignificant, reflecting the offset between local improvements and regional negative externalities.

6. Discussion

The empirical results demonstrate that government-led digital governance, exemplified by the NPIB policy, plays a substantive role in narrowing inter-city digital disparities. Beyond technological inputs, institutional design and governance capacity emerge as critical determinants of digital inclusion in transitional economies. The policy’s effects operate through three interrelated pathways, strategic orientation, technological capacity, and digital market vitality, which, respectively shape policy priorities, enable technology adoption and diffusion, and stimulate local digital ecosystems. At the same time, the spatial analysis reveals an important nuance: while within-city disparities decline, cross-city spillovers remain weak or even become polarized among structurally similar cities. This pattern suggests that policy-driven competition and heterogeneous administrative capacity can constrain aggregate regional gains, underscoring the need for stronger cross-regional coordination and institutional harmonization.
These findings resonate with and extend existing scholarship on digital governance and spatial inequality. Prior research emphasizes that effective digital transformation requires institutional reforms alongside technological deployment [70] and that the performance of digital governance depends on the co-evolution of technology and organizational arrangements [28]. Our results substantiate these arguments by empirically identifying three governance mechanisms—strategic orientation, technological capacity, and digital market vitality, that translate policy intent into measurable improvements in digital development. OECD guidance similarly highlights the need for resilient, interoperable, and inclusive digital systems, aligning with the governance pathways identified here. However, the effectiveness of these mechanisms varies with local resources, governance capacity, and urban characteristics, being strongest in cities with sufficient fiscal resources, moderate urbanization, and capable institutions, where policy incentives are effectively absorbed and amplified, while weaker or misaligned conditions constrain their impact. Consistent with insights from Giest (2025) [71], the negative spatial spillovers observed in our analysis further indicate that governance capacity not only shapes local policy gains but also conditions how institutional effects propagate across space. This refines theoretical understandings of spatial inequality by showing that institutional interventions can inadvertently reinforce regional divergence when absorptive capacity is uneven.
Several limitations should be acknowledged. Despite the quasi-natural experiment design strengthening causal inference, unobserved institutional factors—such as political incentives or informal governance practices—may still influence policy implementation. The digital divide index, while comprehensive, does not fully capture qualitative aspects of digital inclusion, including trust in digital services, algorithmic fairness, and digital safety. Moreover, the empirical results of this study are grounded in China’s multilevel administrative structure and policy implementation system. The applicability of these spatial effects to other countries or regions may vary and should be assessed in light of their institutional arrangements and governance capacities. Finally, the focus on prefecture-level cities leaves open important questions regarding within-city disparities, particularly in rapidly expanding metropolitan regions. These boundary conditions point to fruitful directions for future research and emphasize that while government-led digital governance is a powerful tool, its effectiveness ultimately depends on institutional context and inter-jurisdictional coordination.

7. Conclusions and Policy Implications

7.1. Conclusions

This study evaluates whether government-led digital governance can effectively reduce inter-city digital disparities in China by treating the NPIB policy as a quasi-natural experiment and analysing panel data for 279 prefecture-level cities from 2011 to 2022. The results reveal several key conclusions.
First, China’s urban digital divide exhibited a shift from overall convergence to polarized convergence, with eastern cities generally maintaining lower disparities and many western cities experiencing persistent stagnation. Second, the implementation of the NPIB policy significantly narrowed inter-city digital inequality, a finding that remains robust across a series of verification tests. Third, the analysis identifies three core pathways through which digital governance promotes digital inclusion: stronger strategic orientation, enhanced technological capacity, and greater digital market dynamism. Fourth, the policy effects are heterogeneous, being more pronounced in eastern cities, in jurisdictions with moderate levels of urbanization, and in cities with stronger fiscal autonomy. Finally, spatial analyses show that although the policy reduces local disparities, spillover effects are weak or even polarizing among structurally similar neighboring cities, resulting in a limited net regional impact.
Overall, the findings confirm that government-led digital governance can play a meaningful role in reducing urban digital inequality, while also underscoring the unevenness of its benefits across regions.

7.2. Policy Implications

The conclusions of this study show that government-led digital governance can significantly narrow inter-city digital inequality, yet the process remains uneven across regions and exhibits limited or even negative spatial spillovers among structurally similar cities. These findings indicate that future policy design must reinforce the institutional foundations that allowed NPIB to be effective while addressing the structural vulnerabilities exposed by the spatial analysis. The most urgent priority is to prevent the emerging pattern of “polarized convergence,” in which digitally advanced cities continue to improve while many western or fiscally constrained cities stagnate. To counter this tendency, national authorities should deepen long-term coordination mechanisms that transcend administrative boundaries, particularly through unified data standards, shared digital public infrastructure, and incentive-compatible fiscal transfers, to ensure that localized digital experimentation contributes to broader regional cohesion rather than reinforcing unequal trajectories.
Building on the heterogeneity and mechanism results, a more differentiated multi-level governance strategy is needed to extend the effects of strategic orientation, technological upgrading, and digital market dynamism, three key pathways confirmed in this study. At the provincial level, the priority is to create institutional conditions that allow these city-level mechanisms to diffuse rather than remain locked within leading urban hubs. Provinces can establish cross-city digital collaboration corridors, promote interoperability of local digital platforms, and design fiscal arrangements that support institutional learning in lagging cities. These interventions directly address the weak or negative spatial spillovers identified in the analysis by reducing policy fragmentation and preventing adjacent cities from engaging in parallel but disconnected digital initiatives. At the municipal level, where NPIB exerts its direct influence, the focus should be on strengthening the three mechanisms internally: embedding clearer strategic digital development roadmaps, accelerating technological upgrading through partnerships with research institutions and firms, and enhancing digital market vitality by expanding open-data ecosystems and inclusive digital service interfaces. Such city-level actions are particularly critical for moderately urbanized jurisdictions, which the results show to be the most responsive to national digital initiatives.
Finally, while the NPIB case is rooted in China’s administratively coordinated context, its broader relevance lies in demonstrating how government-led digital governance can serve as a transitional instrument to reduce structural divides—provided it is embedded in institutionalized collaboration and long-term capacity building. International organizations and developing countries can draw from this experience by investing in digital public goods that facilitate interoperability, promoting cross-border policy learning, and supporting cities facing persistent digital stagnation. Ultimately, the Chinese case illustrates an institutional logic rather than a fixed template: digital inequality narrows most effectively when strategic orientation, technological capacity, and market activation are jointly strengthened at the municipal level and when higher-level governments create the connective tissue that prevents localized progress from solidifying into spatially uneven development.

Author Contributions

Conceptualization, C.Z.; Methodology, C.Z.; Supervision, C.Z.; Writing—Review & Editing, C.Z. and Y.D.; Investigation, S.W. and M.J.; Data Curation, S.W., Y.D. and M.J.; Formal Analysis, S.W.; Writing—Original Draft, S.W.; Validation, Y.D.; Visualization, Y.D. and M.J. All authors have read and agreed to the published version of the manuscript.

Funding

This research was funded by the National Social Science Fund of China, “Research on the Information Behavior and Assistance Mechanism of Digital Poor People in Ethnic Regions in the Intelligent Age” (Grant No. 23XMZ022); the Guangxi Philosophy and Social Science Planning Research Project, “Survey of Typical Cases of Digital Government Construction in Guangxi and Research on the Path of High-Quality Development” (Grant No. 22BGL005); and the Innovation Project of Guangxi Graduate Education (Grant No. YCSW2025424).

Institutional Review Board Statement

Not applicable.

Informed Consent Statement

Not applicable.

Data Availability Statement

The data presented in this study are available on request from the corresponding author due to confidentiality agreements and the need to protect sensitive information.

Conflicts of Interest

The authors declare no conflicts of interest.

Appendix A

Table A1. Moran’s I of Digital Divide in China from 2011 to 2022.
Moran’s IEPStdZ-Scorep-Value
20110.285−0.0040.02810.1480.000
20120.263−0.0040.0289.5840.000
20130.345−0.0040.02911.9390.000
20140.313−0.0040.02911.0290.000
20150.351−0.0040.03011.9730.000
20160.327−0.0040.02911.2420.000
20170.352−0.0040.03011.9850.000
20180.333−0.0040.03011.3750.000
20190.260−0.0040.0298.9520.000
20200.310−0.0040.03010.5440.000
20210.119−0.0040.0294.2680.000
20220.366−0.0040.02912.5250.000
Table A2. Spatial econometric test results.
TestH0Statisticp-ValueConclusions
LM TestLM test no spital error473.2380.000SDM
robust LM test no spital error157.0700.000
LM test no spital lag319.0580.000
robust LM test no spital lag2.8900.089
LR TestSDM can degenerate into SEM13.9500.030Reject Simplification
SDM can degenerate into SAR12.8700.045
Wald-SARSDM can degenerate into SEM12.8900.044
Wald-SEMSDM can degenerate into SAR14.0200.029
Hausman TestRandom Effects148.0300.000Fixed Effects
Figure A1. Scatter diagram of Digital Divide in China from 2011 to 2022.
Sustainability 17 10700 g0a1

References

  1. OECD. OECD Digital Economy Outlook 2024 (Volume 1): Embracing the Technology Frontier; OECD Publishing: Paris, France, 2024; pp. 1–2. [Google Scholar]
  2. Hilbert, M. Big Data for Development: A Review of Promises and Challenges. Dev. Policy Rev. 2016, 34, 135–174. [Google Scholar] [CrossRef]
  3. Norris, P. Digital Divide: Civic Engagement, Information Poverty, and the Internet Worldwide; Cambridge University Press: Cambridge, UK, 2001; pp. 26–27. [Google Scholar] [CrossRef]
  4. Hargittai, E. Second-Level Digital Divide: Differences in People’s Online Skills. First Monday 2002, 7, 942. [Google Scholar] [CrossRef]
  5. Van Dijk, J. The Digital Divide; Polity Press: Cambridge, UK, 2020; p. 134. [Google Scholar]
  6. Johanna, H.E. A Corresponding Fields Model for the Links between Social and Digital Exclusion. Commun. Theory 2012, 22, 4. [Google Scholar] [CrossRef]
  7. Ragnedda, M.; Muschert, G. Theorizing Digital Divides and Digital Inequalities; Routledge: New York, NY, USA, 2016; pp. 21–34. [Google Scholar]
  8. Vassilakopoulou, P.; Hustad, E. Bridging Digital Divides: A Literature Review and Research Agenda for Information Systems Research. Inf. Syst. Front. 2021, 25, 955–969. [Google Scholar] [CrossRef]
  9. Hou, X.; Gao, J. Toward Common Prosperity: Measuring Decrease in Inequality in China Prefecture-Level Cities. Struct. Change Econ. Dyn. 2025, 72, 29–46. [Google Scholar] [CrossRef]
  10. Pick, J.B.; Nishida, T. Digital Divides in the World and Its Regions: A Spatial and Multivariate Analysis of Technological Utilization. Technol. Forecast. Soc. Change 2015, 91, 1–17. [Google Scholar] [CrossRef]
  11. Song, Z.; Wang, C.; Bergmann, L. China’s Prefectural Digital Divide: Spatial Analysis and Multivariate Determinants of ICT Diffusion. Int. J. Inf. Manag. 2020, 52, 102072. [Google Scholar] [CrossRef]
  12. Jiao, Z.; Xia, Z. Is the Digital Divide Inhibiting Urban Energy Transitions?—Evidence from China. Energies 2025, 18, 905. [Google Scholar] [CrossRef]
  13. de Clercq, M.; D’Haese, M.; Buysse, J. Economic Growth and Broadband Access: The European Urban–Rural Digital Divide. Telecommun. Policy 2023, 47, 102579. [Google Scholar] [CrossRef]
  14. Yuan, H.; Feng, W. Tracks to Tech Equity: How High-Speed Rail Bridges the Digital Divide within Cities? Prefecture-Level Evidence from China. Socio-Econ. Plan. Sci. 2025, 98, 102152. [Google Scholar] [CrossRef]
  15. Ragnedda, M.; Gladkova, A. (Eds.) Digital Inequalities in the Global South; Palgrave Macmillan: Cham, Switzerland, 2020; pp. 17–30. [Google Scholar] [CrossRef]
  16. Cordella, A.; Bonina, C.M. A Public Value Perspective for ICT-Enabled Public Sector Reforms: A Theoretical Reflection. Gov. Inf. Q. 2012, 29, 512–520. [Google Scholar] [CrossRef]
  17. Caragliu, A.; Del Bo, C. Smart Cities and the Urban Digital Divide. J. Urban Technol. 2023, 20, 123–145. [Google Scholar] [CrossRef]
  18. Haug, N.; Dan, S.; Mergel, I. Digitally-induced Change in the Public Sector: A Systematic Review and Research Agenda. Public Manag. Rev. 2023, 26, 1963–1987. [Google Scholar] [CrossRef]
  19. Newman, J.; Hoole, C. The Intersection of Productivity and Governance Capacity in Spatial Inequality: The Case of England’s Devolution Periphery. Contemp. Soc. Sci. 2024, 19, 555–582. [Google Scholar] [CrossRef]
  20. Shapiro, C.; Varian, H.R. Information Rules: A Strategic Guide to the Network Economy; Harvard Business School Press: Boston, MA, USA, 1999; pp. 175–178. [Google Scholar]
  21. Tapscott, D.; Tapscott, A. Blockchain Revolution: How the Technology Behind Bitcoin Is Changing Money, Business, and the World; Penguin Random House: New York, NY, USA, 2016; pp. 141–183. [Google Scholar]
  22. Acemoglu, D.; Restrepo, P. Robots and Jobs: Evidence from US Labor Markets. J. Political Econ. 2020, 128, 2188–2244. [Google Scholar] [CrossRef]
  23. Liu, J. Regional “Digital Divide”, Technology-Led Failure, Policy Localization: Analysis of Spatial Characteristics of Urban Digital Governance Capability. J. Huaqiao Univ. (Philos. Soc. Sci.) 2022, 6, 74–86. [Google Scholar]
  24. DiMaggio, P.; Hargittai, E. From the “Digital Divide” to “Digital Inequality”: Studying Internet Use as Penetration Increases; Princeton University: Princeton, NJ, USA, 2001; pp. 11–31. [Google Scholar]
  25. van Dijk, J. Digital Divide Research, Achievements and Shortcomings. Poetics 2006, 34, 221–235. [Google Scholar] [CrossRef]
  26. Warschauer, M. Technology and Social Inclusion: Rethinking the Digital Divide; MIT Press: Cambridge, MA, USA, 2003; pp. 11–31. [Google Scholar] [CrossRef]
  27. Du, Z.-Y.; Wang, Q. Digital Infrastructure and Innovation: Digital Divide or Digital Dividend? J. Innov. Knowl. 2024, 9, 100542. [Google Scholar] [CrossRef]
  28. Lyu, Y.; Xie, J.; Meng, X.; Wang, X. Digital Economy and Institutional Dynamics: Striving for Equitable Public Service in a Digitally Transformed Era. Front. Public Health 2024, 12, 1330044. [Google Scholar] [CrossRef] [PubMed]
  29. Janssen, M.; van den Hoven, J. Big and Open Linked Data (BOLD) in Government: A Challenge to Transparency and Privacy? Gov. Inf. Q. 2015, 32, 363–368. [Google Scholar] [CrossRef]
  30. Margetts, H.; Dunleavy, P. The Second Wave of Digital-Era Governance: A Quasi-Paradigm for Government on the Web. Philos. Trans. R. Soc. A Math. Phys. Eng. Sci. 2013, 371, 1–17. [Google Scholar] [CrossRef]
  31. Vigoda-Gadot, E.; Mizrahi, S. The Digital Governance Puzzle: Towards Integrative Theory of Humans, Machines, and Organizations in Public Management. Technol. Soc. 2024, 77, 102530. [Google Scholar] [CrossRef]
  32. Hanisch, M.; Goldsby, C.M.; Fabian, N.E.; Oehmichen, J. Digital Governance: A Conceptual Framework and Research Agenda. J. Bus. Res. 2023, 162, 113777. [Google Scholar] [CrossRef]
  33. Chen, K.; Li, Q.; Shoaib, M.; Ameer, W.; Jiang, T. Does Improved Digital Governance in Government Promote Natural Resource Management? Quasi-Natural Experiments Based on Smart City Pilots. Resour. Policy 2024, 90, 104721. [Google Scholar] [CrossRef]
  34. Meng, C.; Wang, L.; Lin, Y. Digital Governance and Carbon Emission Reduction: Evidence from “National Pilot Policy of Information Benefiting the People” in China. J. Environ. Manag. 2024, 368, 122179. [Google Scholar] [CrossRef] [PubMed]
  35. Zhou, W.; Lyu, Z.; Chen, S. Mechanisms Influencing the Digital Transformation Performance of Local Governments: Evidence from China. Systems 2024, 12, 30. [Google Scholar] [CrossRef]
  36. Wang, X.; Li, Y.; Tian, L.; Hou, Y. Government Digital Initiatives and Firm Digital Innovation: Evidence from China. Technovation 2023, 119, 102545. [Google Scholar] [CrossRef]
  37. Li, X.; Yue, S. Does the Government Digital Attention Improve China’s Digital Economy Output Efficiency: Accelerator or Inhibitor. Econ. Anal. Policy 2025, 85, 607–625. [Google Scholar] [CrossRef]
  38. Xu, Y.; Men, Y.; Yang, L. The Impact of China’s Big Data Pilot Zone Policy on Public Service Quality: A Mixed Methods Study. J. Asian Public Policy 2024, 1–29. [Google Scholar] [CrossRef]
  39. Kolotouchkina, O.; Ripoll González, L.; Belabas, W. Smart Cities, Digital Inequalities, and the Challenge of Inclusion. Smart Cities 2024, 7, 3355–3370. [Google Scholar] [CrossRef]
  40. Du, Z.; Wang, Q. Diffusion or Polarization: The Spatial Spillover of Digitalization on Urban Innovation. Ann. Reg. Sci. 2025, 74, 65–98. [Google Scholar] [CrossRef]
  41. Ansari, B.; Barati, M.; Martin, E.G. A Comprehensive Review of the State of Open Government Data. Gov. Inf. Q. 2022, 39, 101657. [Google Scholar] [CrossRef]
  42. Hu, G.; He, S.; Dong, X.; Li, C.; Wang, Z.; Wang, Z.; Mardani, A. The Impact of Urban Digital Platforms on Entrepreneurial Activity: Evidence from China. J. Innov. Knowl. 2024, 9, 100468. [Google Scholar] [CrossRef]
  43. Hussain, H.; Jun, W.; Radulescu, M. Innovation Performance in the Digital Divide Context: Nexus of Digital Infrastructure, Digital Innovation, and E-Knowledge. J. Knowl. Econ. 2025, 16, 3772–3792. [Google Scholar] [CrossRef]
  44. Xu, X.; Zhang, Y.; Wang, Y.; Zhao, C.; Zhang, Y.; Xie, X. Impact of Regional Digital Transformation on Public Health: An Empirical Analysis Based on 31 Provinces in China. BMC Public Health 2025, 25, 2485. [Google Scholar] [CrossRef]
  45. Yang, Z.; Zhang, J. Digital Infrastructure Construction and the Development of New-Quality Productive Forces in Enterprises. Sci. Rep. 2025, 15, 24671. [Google Scholar] [CrossRef]
  46. Xu, S.; Liu, J.; Li, S.; Zheng, Y. Barriers to and Mechanism for Open Government Data Use by the Private Sectors: A Grounded Theory Approach. Gov. Inf. Q. 2025, 42, 102044. [Google Scholar] [CrossRef]
  47. Wen, H.; Liu, Y.; Zhou, F. New-Type Infrastructure and Urban Economic Resilience: Evidence from China. Int. Rev. Econ. Finance 2024, 96, 103560. [Google Scholar] [CrossRef]
  48. Shirish, A.; Srivastava, S.C.; Panteli, N.; O’Shanahan, J. A Knowledge-Centric Model for Government-Orchestrated Digital Transformation among the Microbusiness Sector. J. Strateg. Inf. Syst. 2025, 34, 101870. [Google Scholar] [CrossRef]
  49. Khan, A.; Tao, M. Knowledge Absorption Capacity’s Efficacy to Enhance Innovation Performance through Big Data Analytics and Digital Platform Capability. J. Innov. Knowl. 2022, 7, 100201. [Google Scholar] [CrossRef]
  50. van Dijk, J. The Deepening Divide: Inequality in the Information Society; Sage Publications: Thousand Oaks, CA, USA, 2005. [Google Scholar] [CrossRef]
  51. Liu, H.; Wang, X.; Wang, Z.; Che, Y. Does Digitalization Mitigate Regional Inequalities? Evidence from China. Geogr. Sustain. 2024, 5, 52–63. [Google Scholar] [CrossRef]
  52. Zhang, H.; Zhang, K.; Yan, T.; Cao, X. The Impact of Digital Infrastructure on Regional Green Innovation Efficiency through Industrial Agglomeration and Diversification. Humanit. Soc. Sci. Commun. 2025, 12, 220. [Google Scholar] [CrossRef]
  53. Li, C.; He, W.; Cao, E. Impact of Green Data Center Pilots on the Digital Economy Development: An Empirical Study Based on Dual Machine Learning Methods. Comput. Ind. Eng. 2025, 201, 110914. [Google Scholar] [CrossRef]
  54. Chen, Q.; Ding, X.; Wang, T. Can Open Government Data Improve Urban Innovation? Empirical Research from a Dual Perspective in China. Gov. Inf. Q. 2025, 42, 102059. [Google Scholar] [CrossRef]
  55. Wu, T.; Xu, W.; Kung, C.-C. The Impact of Data Elements on Urban Sustainable Development: Evidence from the Big Data Policy in China. Technol. Soc. 2025, 81, 102800. [Google Scholar] [CrossRef]
  56. Xu, W.; Zhou, J.; Liu, C. The Impact of Digital Economy on Urban Carbon Emissions: Based on the Analysis of Spatial Effects. Geogr. Res. 2022, 41, 111–129. [Google Scholar]
  57. Runciman, W.G. Relative Deprivation and Social Justice: A Study of Attitudes to Social Inequality in Twentieth-Century England; University of California Press: Berkeley, CA, USA, 1966; pp. 9–36. [Google Scholar]
  58. Moriarty, J.P. En Route to a Theory of Benchmarking. Benchmarking Int. J. 2009, 16, 8–25. [Google Scholar] [CrossRef]
  59. Hong, X.; Chen, Q.; Man, D.; Shi, C.; Wang, N. The Impact of Digitalization on the Rich and the Poor: Digital Divide or Digital Inclusion? Technol. Soc. 2024, 78, 102634. [Google Scholar] [CrossRef]
  60. Peng, Z.; Dan, T. Digital Dividend or Digital Divide? Digital Economy and Urban–Rural Income Inequality in China. Telecommun. Policy 2023, 47, 102616. [Google Scholar] [CrossRef]
  61. Zhang, P.; Wang, S.; Li, B. Harnessing Government Digital Attention: Reducing Carbon Emissions through the Pathways of Digitalization. Struct. Change Econ. Dyn. 2025, 74, 1008–1019. [Google Scholar] [CrossRef]
  62. Zhang, P. Target Interactions and Target Aspiration Level Adaptation: How Do Government Leaders Tackle the “Environment–Economy” Nexus? Public Adm. Rev. 2021, 81, 220–230. [Google Scholar] [CrossRef]
  63. Sun, Z.; Wei, W. Green Technology Innovation and Corporate Brand Competitiveness: An Analysis Based on the Role of Environmental Policy. Financ. Res. Lett. 2025, 71, 106421. [Google Scholar] [CrossRef]
  64. Zhang, M.; Partridge, M.D.; Song, H. Amenities and the Geography of Innovation: Evidence from Chinese Cities. Ann. Reg. Sci. 2020, 65, 105–145. [Google Scholar] [CrossRef]
  65. Jiang, Z.; Yuan, C.; Xu, J. The Impact of Digital Government on Energy Sustainability: Empirical Evidence from Prefecture-Level Cities in China. Technol. Forecast. Soc. Change 2024, 209, 123776. [Google Scholar] [CrossRef]
  66. Jacobson, L.S.; LaLonde, R.J.; Sullivan, D.G. Earnings Losses of Displaced Workers. Am. Econ. Rev. 1993, 83, 685–709. [Google Scholar] [CrossRef]
  67. Li, P.; Lu, Y.; Wang, J. Does Flattening Government Improve Economic Performance? Evidence from China. J. Dev. Econ. 2016, 123, 18–37. [Google Scholar] [CrossRef]
  68. Xing, L.; Han, D.H.; Xie, H. Government Digital Policy Breaks the Mystery of “Limited Participation” in China’s Home Finance Market. Sci. Rep. 2023, 13, 20233. [Google Scholar] [CrossRef] [PubMed]
  69. Aaberge, R.; Mogstad, M. Robust inequality comparisons. J. Econ. Inequal. 2011, 9, 353–371. [Google Scholar] [CrossRef][Green Version]
  70. Tan, S.Y.; Taeihagh, A. Smart City Governance in Developing Countries: A Systematic Literature Review. Sustainability 2020, 12, 899. [Google Scholar] [CrossRef]
  71. Giest, S. The intersection of digital and social infrastructures in (a)spatial policymaking. Policy Sci. 2025, 58, 369–384. [Google Scholar] [CrossRef]
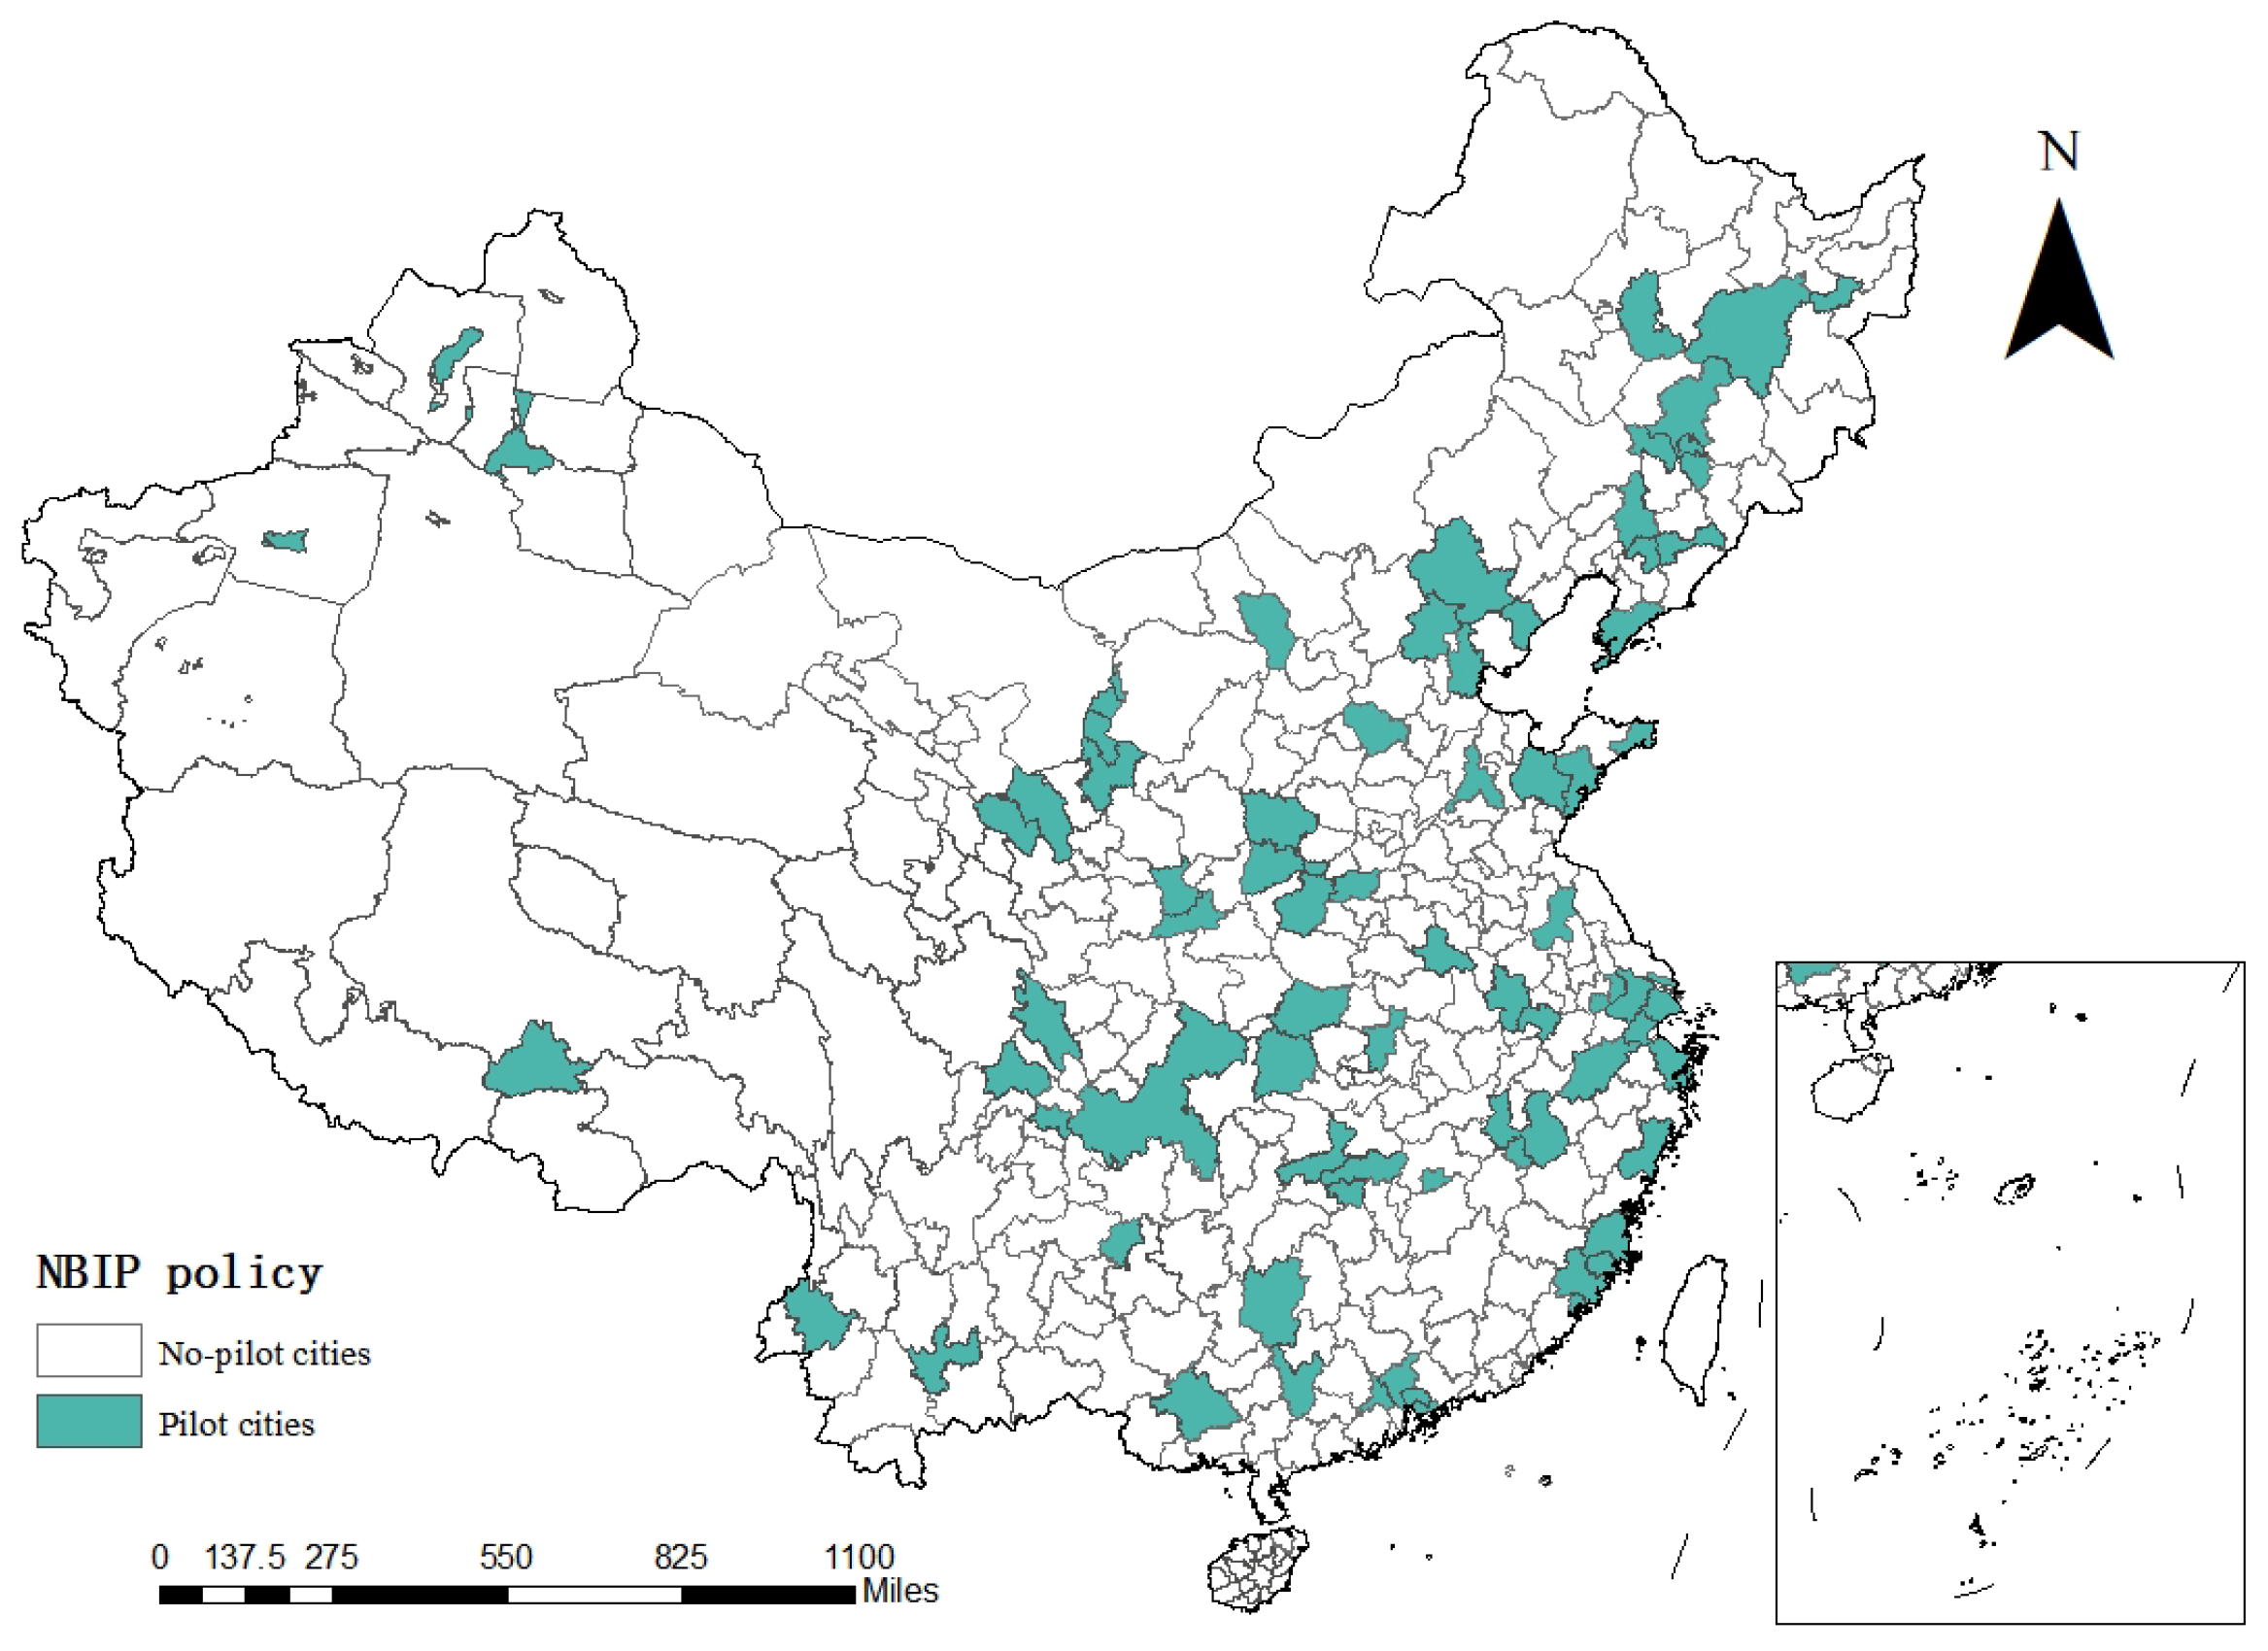
Figure 1. Pilot cities of the NPIB policy.
Sustainability 17 10700 g001
Figure 2. Theoretical Mechanism Framework.
Sustainability 17 10700 g002
Figure 3. Kernel density map from 2011 to 2022.
Sustainability 17 10700 g003
Figure 4. Spatial distribution of urban Digital Divide across China from 2011 to 2022.
Sustainability 17 10700 g004
Figure 5. Parallel trend test.
Sustainability 17 10700 g005
Figure 6. Placebo test.
Sustainability 17 10700 g006
Table 1. Measurement Index System of Urban Digital Divide.
Target LayerSystem LayerIndex LayerUnitAttribute
Urban Digital DivideDigital Infrastructure AccessOptical Cable Densitykm/km2+
Internet Access Ports per Capitaports/person+
Digital Application and LiteracyInternet Penetration Rate%+
Mobile Phone Penetration Rate%+
Digital economy employment%+
Digital Economic PerformanceTelecommunications Revenue per Capita105 CNY+
Breadth of Digital Financial InclusionIndex (0–100)+
Depth of Digital Financial InclusionIndex (0–100)+
Degree of Digitalisation in Inclusive FinanceIndex (0–100)+
Table 2. Descriptive statistics.
Variable TypeVariable NameMeanStd. DevMinMaxN
Dependent VariableDigital Divide0.8600.1280.0001.0003348
Independent variableNPIB0.1880.3910.0001.0003348
Control variablesGdp10.7830.5628.77312.4563348
Cons15.6831.02512.61219.0133348
Ind42.6889.85014.36083.8703348
Gov0.2000.0960.0441.5933348
Hcap0.0200.0250.0000.1473348
Mediating VariablesStrategy0.0040.0030.0000.0343348
Technology3.3642.1090.00010.8093348
Market0.8861.7130.01326.5893348
Table 3. The effects of NPIB pilots on Digital Divide.
Digital Divide
(1)(2)(3)(4)
NPIB−0.120 ***−0.033 ***−0.034 ***−0.035 ***
(0.019)(0.011)(0.008)(0.009)
Gdp −0.076 *** −0.032 ***
(0.013) (0.009)
Cons −0.010 0.005
(0.007) (0.005)
Ind −0.002 *** −0.001 *
(0.001) (0.000)
Gov −0.070 0.041
(0.058) (0.025)
Hcap −1.295 *** −0.510
(0.337) (0.380)
_cons0.883 ***1.973 ***0.890 ***1.178 ***
(0.005)(0.216)(0.003)(0.080)
City FENONOYESYES
Year FENONOYESYES
N3348334833483348
R20.1340.4710.3300.339
* p < 0.10, *** p < 0.01.
Table 4. Robustness Estimates: PSM-DID and IV.
PSM-DIDIV Estimation
(1) Nearest Neighbor Matching(2) Radius Matching(3) Kernel Matching(4) Phase I(5) Phase II
NPIB−0.017 **−0.026 ***−0.021 *** −0.049 ***
(−2.009)(−3.439)(−3.584) (0.018)
IV 0.673 ***
(0.120)
ControlsYESYESYESYESYES
City FEYESYESYESYESYES
Year FEYESYESYESYESYES
N8373102288733483348
R20.3780.3290.3510.6880.337
Kleibergen–Paap rk LM 60.708
[0.000]
Kleibergen–Paap rk Wald F 31.542
{16.38}
** p < 0.05, *** p < 0.01.
Table 5. Other robustness test results.
Recalculate DVExclude MunicipalitiesAdding Fixed EffectsShorting
Sample Period
DML ModleExcluding Policy Interference
(1)(2)(3)(4)(5)(6)(7)(8)(9)
NPIB0.182 ***−0.030 ***−0.032 ***−0.030 ***−0.036 ***−0.030 ***−0.035 ***−0.035 ***−0.030 ***
(0.069)(0.009)(0.008)(0.008)(0.009)(0.008)(0.009)(0.009)(0.008)
BCP −0.015 ** −0.015 **
(0.006) (0.007)
SCP 0.003 0.004
(0.005) (0.005)
GDO 0.0000.001
(0.005)(0.005)
_cons−5.539 ***1.184 ***1.083 ***0.543−0.0011.193 ***1.181 ***1.179 ***1.199 ***
(1.096)(0.078)(0.131)(0.330)(0.000)(0.077)(0.080)(0.080)(0.078)
ControlsYESYESYESYESYESYESYESYESYES
City FEYESYESYESYESYESYESYESYESYES
Year FEYESYESYESYESYESYESYESYESYES
N334833003348195333483348334833483348
R20.0410.3330.5220.3160.3420.3390.3390.342
** p < 0.05, *** p < 0.01.
Table 6. Mechanism analysis results.
StrategyTechnologyMarket
(1)(2)(3)(4)(5)(6)
NPIB0.001 ***0.001 ***1.682 ***1.668 ***0.754 ***0.711 ***
(0.000)(0.000)(0.403)(0.402)(0.239)(0.248)
_cons0.001 ***−0.0020.427 ***−1.0210.275 ***3.541
(0.000)(0.005)(0.108)(3.482)(0.057)(2.750)
ControlsNOYESNOYESNOYES
City FEYESYESYESYESYESYES
Year FEYESYESYESYESYESYES
N334833483348334833483348
R20.5630.5640.1940.2150.2520.257
*** p < 0.01.
Table 7. Heterogeneity analysis results.
Eastern, Central, and Western RegionsHu Line
(1)
Eastern
Region
(2)
Center
Region
(3)
West
Region
(4)
Noutheastern Side
(5)
Northeastern Side
NPIB−0.048 ***−0.017 **−0.031 *−0.039 ***0.019
(0.016)(0.008)(0.016)(0.009)(0.036)
_cons1.299 ***1.251 ***0.941 ***1.179 ***2.078 ***
(0.160)(0.113)(0.201)(0.082)(0.710)
ControlsYESYESYESYESYES
City FEYESYESYESYESYES
Year FEYESYESYESYESYES
N118811889723084264
R20.3900.4440.2740.3640.290
* p < 0.10, ** p < 0.05, *** p < 0.01.
Table 8. Heterogeneity analysis results.
Urbanization RateGovernment Fiscal Self-Sufficiency
(1)
Low
(2)
Middle
(3)
High
(4)
Low
(5)
Middle
(6)
High
NPIB−0.009−0.028 ***−0.004−0.006−0.025 ***−0.034 *
(0.009)(0.008)(0.044)(0.007)(0.008)(0.020)
_cons1.251 ***1.112 ***1.751 ***1.066 ***1.537 ***2.126 ***
(0.150)(0.094)(0.554)(0.096)(0.219)(0.665)
ControlsYESYESYESYESYESYES
City FEYESYESYESYESYESYES
Year FEYESYESYESYESYESYES
N13228443722112732504
R20.4560.3750.4160.3210.4330.474
* p < 0.10, *** p < 0.01.
Table 9. Estimation results of Spatial DID model.
Digital Divide
(1)(2)
Spa-rho−0.083 **−0.083 **
(0.035)(0.035)
NPIB−0.033 ***−0.033 ***
(0.004)(0.005)
W×NPIB0.021 *0.028 **
(0.012)(0.012)
Direct−0.033 ***−0.034 ***
(0.005)(0.005)
Indirect0.021 **0.029 ***
(0.010)(0.011)
Total−0.013−0.005
(0.011)(0.011)
Sigma2-e1.178 ***1.104 ***
(0.080)(0.086)
ControlsNOYES
City FEYESYES
Year FEYESYES
N33483348
R20.1240.444
* p < 0.10, ** p < 0.05, *** p < 0.01.
Disclaimer/Publisher’s Note: The statements, opinions and data contained in all publications are solely those of the individual author(s) and contributor(s) and not of MDPI and/or the editor(s). MDPI and/or the editor(s) disclaim responsibility for any injury to people or property resulting from any ideas, methods, instructions or products referred to in the content.