Article

A Grey Wolf Optimization Approach for Solving Constrained Economic Dispatch in Power Systems

by
Olukorede Tijani Adenuga
1,2,* and
Senthil Krishnamurthy
1
1
Department of Electrical, Electronic, and Computer Engineering, Cape Peninsula University of Technology, Cape Town 7535, South Africa
2
Department of Mechatronics Engineering, Federal University of Technology and Environmental Sciences, Iyin-Ekiti 362005, Ekiti State, Nigeria
*
Author to whom correspondence should be addressed.
Sustainability 2025, 17(23), 10648; https://doi.org/10.3390/su172310648
Submission received: 21 October 2025 / Revised: 19 November 2025 / Accepted: 25 November 2025 / Published: 27 November 2025
(This article belongs to the Special Issue Power Systems Optimization and Sustainable Energy)

Abstract

In this study, the economic dispatch problems, which are indispensable in electrical engineering, are addressed utilizing Grey Wolf Optimization (GWO). Conventional mathematical methods struggle to provide quick, reliable solutions to nonlinear problems in power systems with many generation units. An economic dispatch solution operates by allocating generation sets with the lowest fuel costs to meet predetermined power balance constraints. GWO is a meta-heuristic set of rules that has garnered significant attention in the literature due to its suitable exploratory and exploitative properties, rapid and mature convergence rate, and straightforward architecture. When dealing with a nonlinear constraints problem, such as ED, it has gained significant recognition for its balance of exploration and exploitation, reliable convergence characteristics, and simple implementation framework. The proposed Grey Wolf Optimization algorithm is evaluated using real-world generation case benchmark comparisons for 3-unit, 6-unit, and 15-unit systems. Results demonstrate the impact of incorporating renewable energy source (RES) uncertainty; fuel costs increase significantly from USD 7598 to USD 21,240 for the 3-unit system, USD 13,397 to USD 46,216,658 for the 6-unit system, and USD 32,622.55 to USD 33,723.11 for the 15-unit system, highlighting that RES integration is more economically viable in larger systems. The paper’s significant contribution is its essential mechanism for power systems, which enables lower global energy costs, improved operational efficiency, and enhanced grid reliability through strategic resource allocation in a constrained economic dispatch energy management system.

1. Introduction

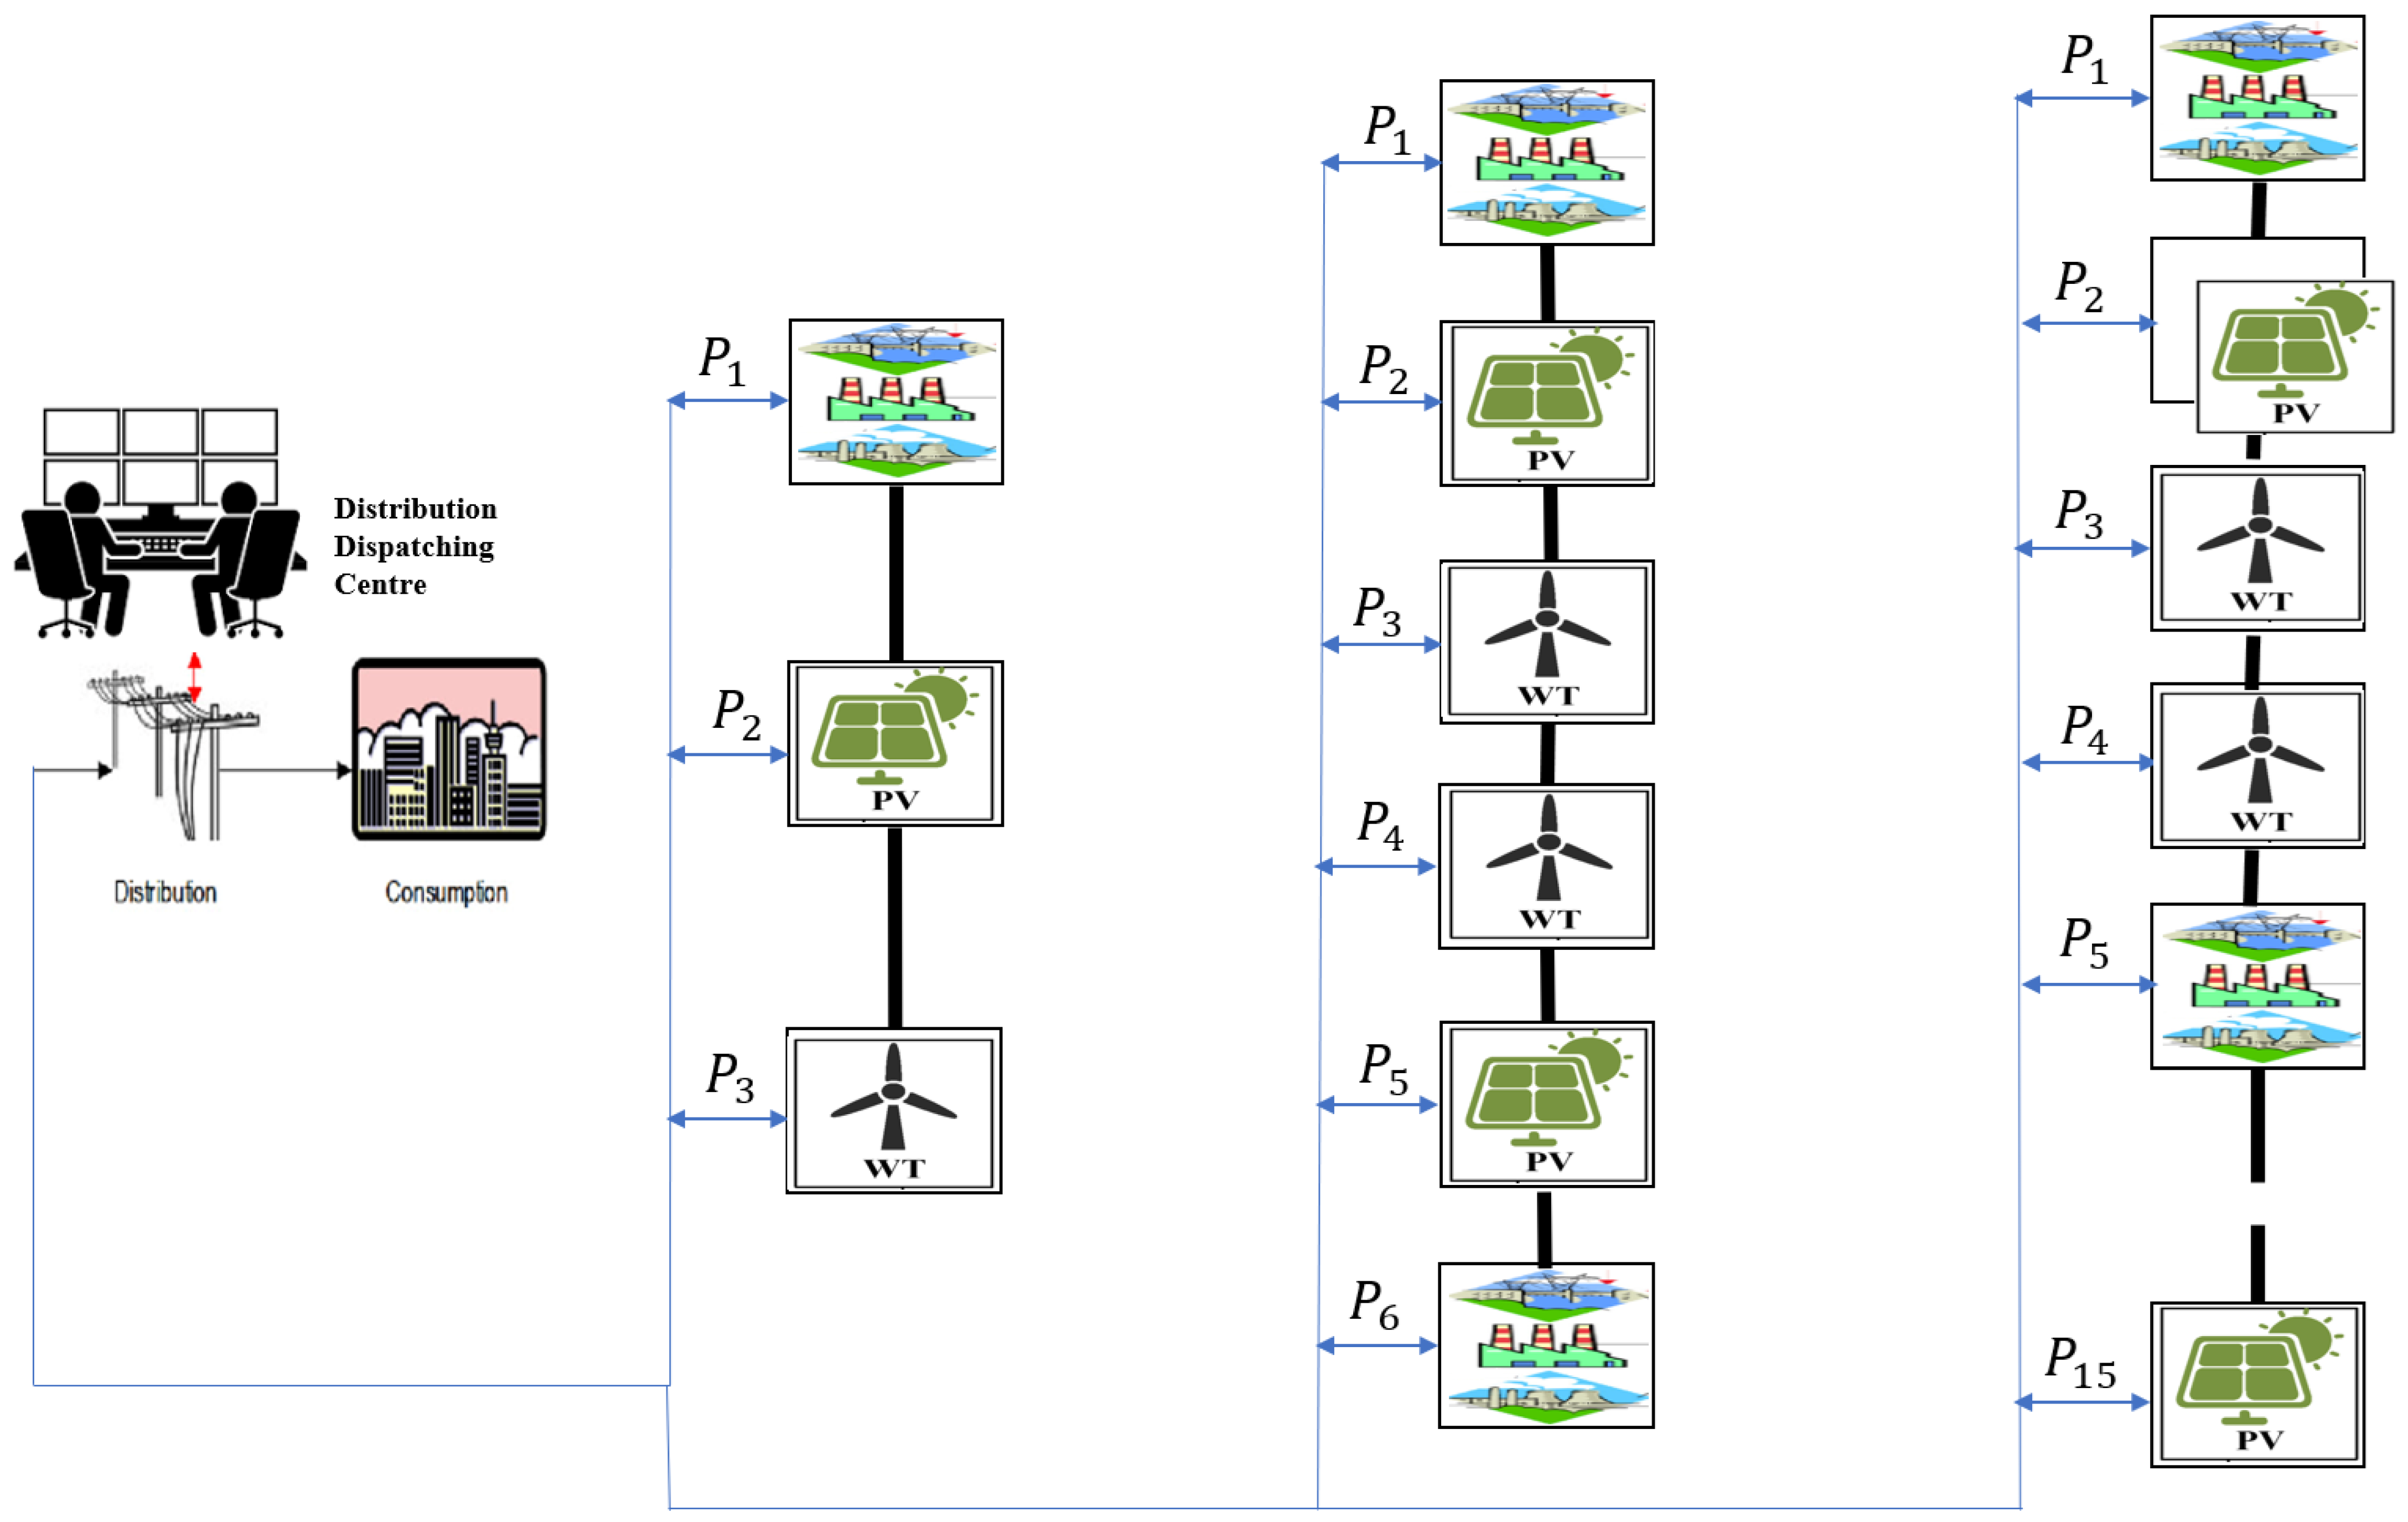
The development of sustainable energy scheduling and industrial power system operations ensures a reliable, practical representation of industrial energy networks, fostering environmental, economic, and technological advancement. The electricity market has become more competitive and open due to rising energy consumption. Economic dispatch (ED) is a valuable tool in modern energy systems. A management system for operations and planning in economic dispatch is essential for sustaining power system efficiency. Reducing production costs and improving system dependability maximizes thermal units’ energy efficiency through effective dispatch. The constrained economic dispatch problem (CEDP) utilizes optimization to determine the optimal generator solution that maximizes or minimizes operational cost in practical scenarios, subject to constraints. The goal of CEDP is noteworthy in power system operational forecasting, given power balance constraints and limits such as ramp-rate limits, transmission losses, and prohibited zones. CEDP is a non-convex, nonlinear optimization problem that is challenging to solve using calculus-based methods; meta-heuristics or evolutionary optimization methods have proven capable of addressing a wide range of optimization problems [1]. The escalating concerns regarding the climatic impacts of fossil fuel consumption and expenditure per kilowatt-hour render RESs increasingly appealing, as elucidated in the energy–carbon nexus model for the forthcoming low-carbon products within the transport-manufacturing sector [1]. Ref. [2] indicates that sustainable, clean, and RESs have gained notable competitiveness in recent years, driven by technological advances and the imposition of environmental regulations. Renewable energy sources such as photovoltaics, wind turbines, and energy storage systems facilitate the establishment of a hybrid system (HS). These methodologies can minimize operational downtime and enhance power supply reliability while being more cost-effective than traditional grid power systems [3]. Variability in weather conditions significantly influences the output of wind turbines and photovoltaic systems, thereby impeding their optimal utilization. Consequently, the incorporation of renewable energy sources into hybrid systems dictates the cautious evaluation of economic viability and energy-managing strategies [2]. Figure 1 illustrates a schematic diagram of an economic dispatch problem in a single- and multi-area HS with grid integration and industrial/domestic loads.

Proposed Innovation Study Contribution

Under power-balance constraints and the generator’s upper and lower operating limits, the ED problem minimizes overall operative cost. The supply of renewable energy sources is uncertain, and grid-integrated RES subsystems use quadratic uncertainty cost functions for RES generation. However, optimization methodologies can effectively address key economic dispatch challenges in the power system.
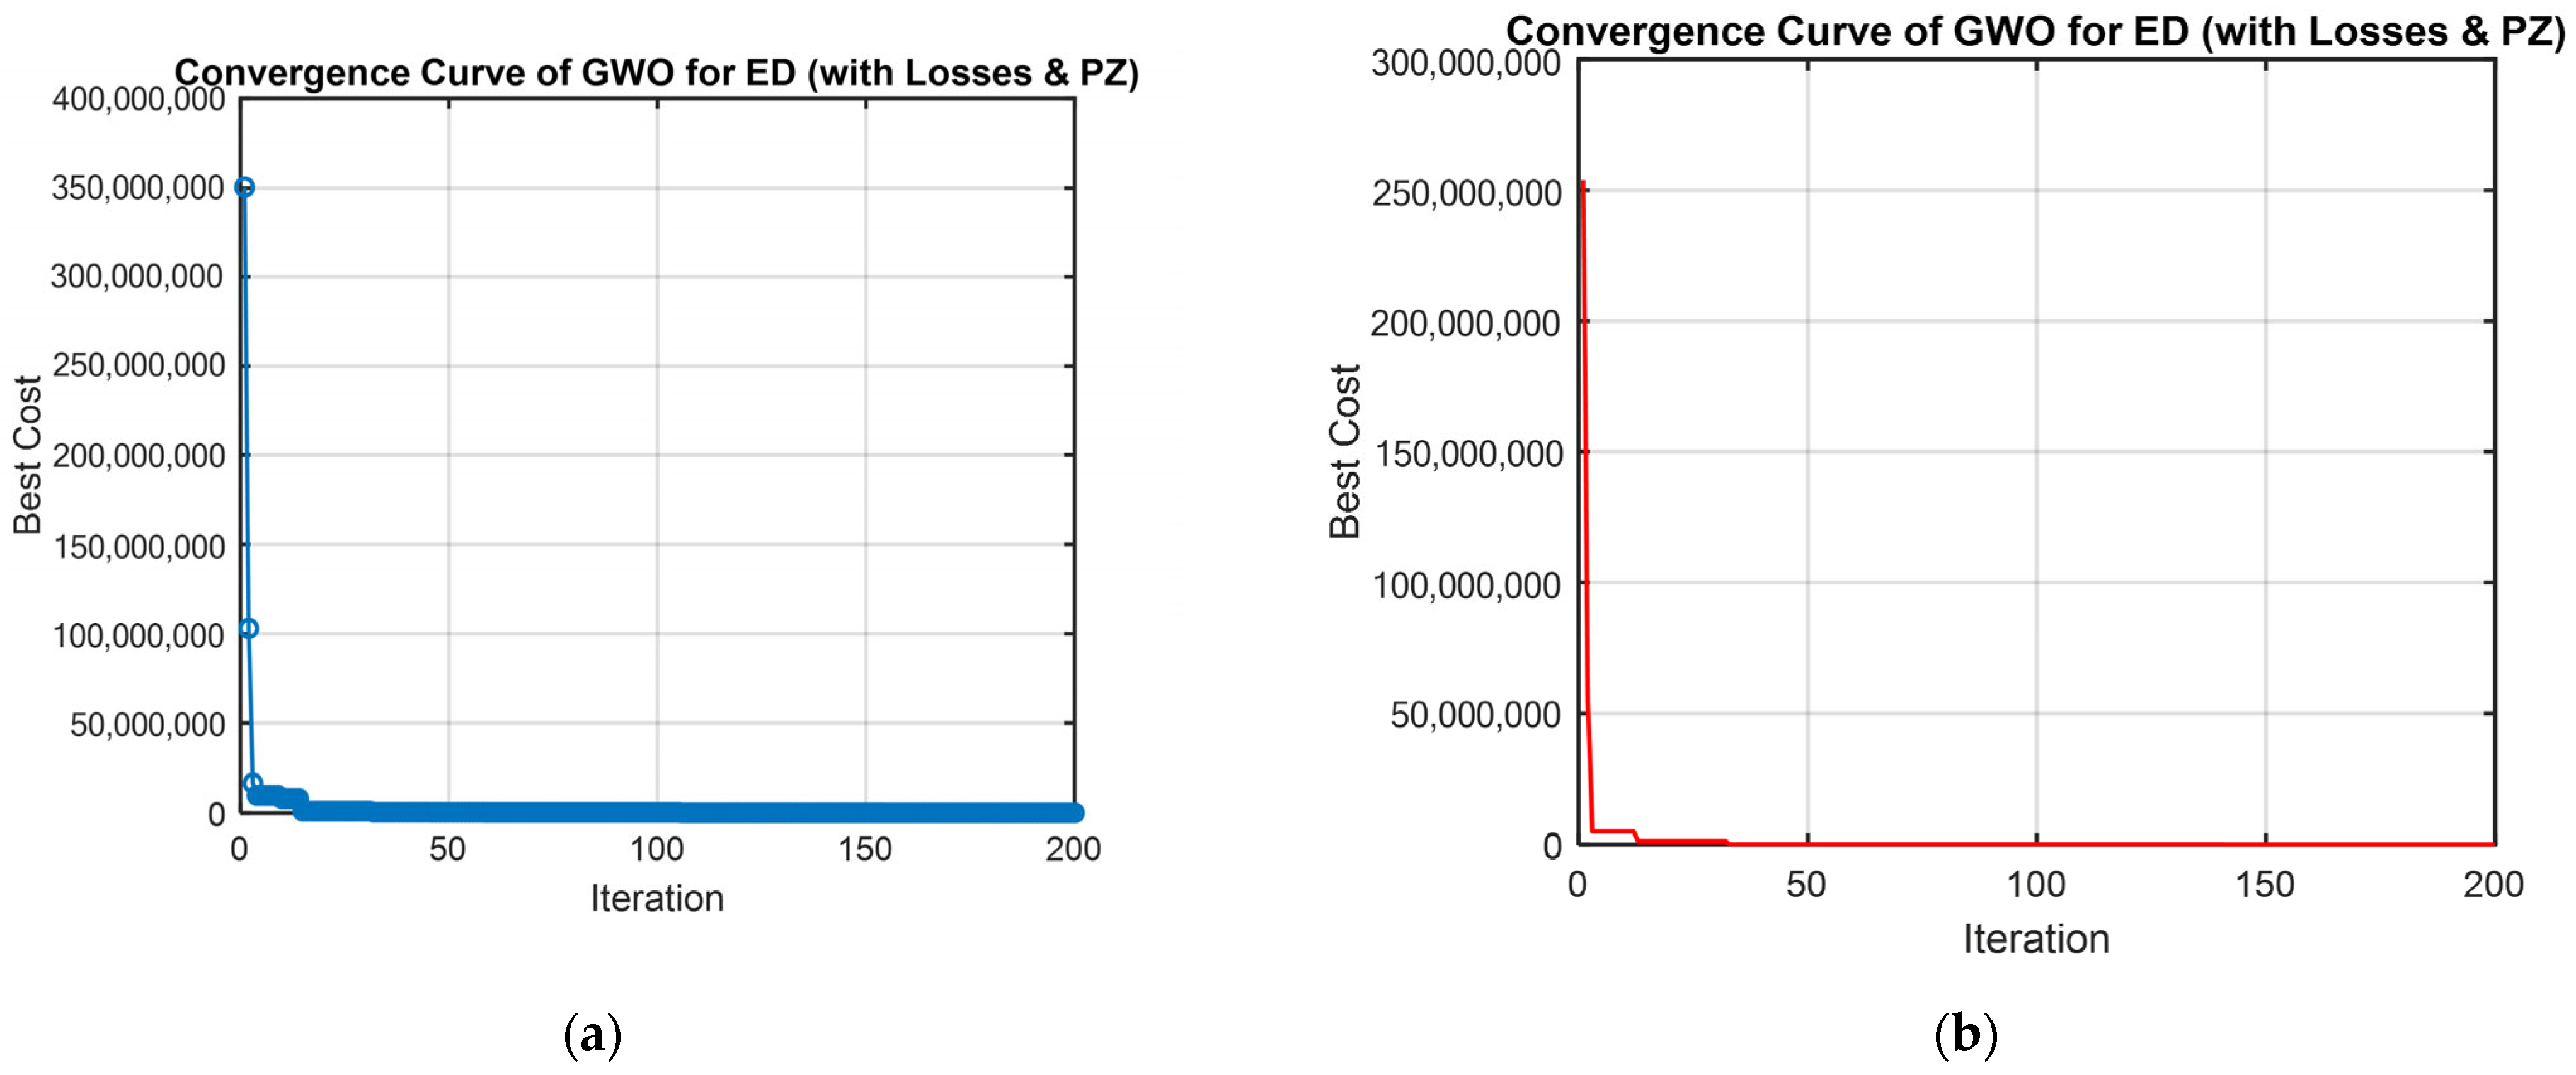
The paper’s significant contribution is its essential mechanism for power systems, which enables lower global energy costs, improved operational efficiency, and enhanced grid reliability through strategic resource allocation in constrained economic dispatch. This technique minimizes operating costs while complying with operational restrictions. The practical challenges of real-world economic dispatch optimization need changes in dynamics to increase the overall efficiency and effectiveness of power system network operation. Furthermore, a Grey Wolf Optimization application in power system optimization will reduce the total operating cost of all producing units supplying the grid while also satisfying network constraints, promoting technological development, and advancing sustainable power system development. The generator output trajectories repeatedly adjust unit dispatch levels, gradually settling within viable operating ranges while ensuring compliance with generating and banned zone constraints. This practical matching makes the proposed GWO more appropriate for near-real-time applications, which broaden the applicability of GWO to the contemporary stochastic nature of constrained ED for grid procedures by bringing optimization outputs into line. This, in turn, demonstrates the performance of the proposed GWO-based ED framework, as evidenced by a rapid drop in the objective function convergence curve during the first few iterations, followed by stabilization, indicating the algorithm’s ability to achieve a near-optimal solution while addressing power balance challenges efficiently.
The study highlights are as follows:
i.
A constrained economic dispatch with integrated RESs within a multi-unit generation system to meet power balance demand using GWO is proposed;
ii.
A simulation environment is used to address power balance demand in a grid-tied RES-hybrid system.
iii.
Case studies and benchmark comparisons of the 3-unit, 6-unit, and 15-unit systems are presented.
This study aims to develop and evaluate a Grey Wolf Optimization (GWO) method for solving constrained economic dispatch problems that include transmission losses, prohibited operating zones, and ramp-rate limits. Renewable energy sources are incorporated using Monte Carlo-based uncertainty cost functions to reflect realistic variations in generation. The method is applied to 3-unit, 6-unit, and 15-unit benchmark systems to assess performance across different system sizes. The paper is structured as follows. Section 2 presents meta-heuristics and evolutionary-computation optimization methods for constrained ED problems. Section 3 defines the GWO method. Section 4 presents the case studies and benchmark comparison simulation results and discussion. Section 5 concludes and suggests future work.

2. Literature Review

Numerous derivative-based methodologies, including traditional optimization techniques predicated on dynamic programming (DP) [4], Lagrangian relaxation [5], branch and bound approaches [6], gradient descent method [7], lambda iteration method (LIM) [8], linear programming (LP) [9], quadratic programming (QP) [10] coordination equations [11], and MINLP [12], which assume a monotonically snowballing piecewise linear cost function, are effectively employed to address the ED problems. Solutions to ED challenges using dynamic programming can yield prohibitively large dimensions, requiring substantial computational resources. Due to the incorporation of nonlinear attributes, including ramp-rate constraints, POZ regions, and nonlinear cost functions, these methodologies become impractical for real-world systems and fail to identify the global optimal solution. Given the extensive array of ED problems of an exceedingly nonlinear nature, conventional calculus-based methodologies perform inadequately and become trapped in local optima. In recent years, these strategies have been successfully used to handle ED problems that are neither convex, smooth, nor differentiable. However, when related to other approaches (Table 1), such as differential evolution (DE), Woodpecker Mating Algorithm (WMA), equilibrium optimizer (EO), (L-HMDE), diversity-based parallel particle swarm optimization (DPPSO), crow search algorithm (CSO), crow search Teaching-Learning-Based Optimization (TLBO), and Memetic Salp Swarm (SSS) algorithm, GWO exhibits the most substantial overall superiority, followed by PSO. The PSO method demonstrates rapid yet premature convergence during mid-optimal search processes, whereas it shows a slower convergence rate in more refined search scenarios. Numerous methodologies exist for enhancing PSOs by manipulating population sizes, thereby increasing the likelihood of achieving swifter, more precise convergence. This paper undertakes a thorough examination of GWO algorithms. Application-related challenges can significantly affect the computational demands of optimization processes. The careful selection of appropriate programming libraries, languages, and compilers is imperative for improving the computational efficiency of the optimization algorithm. The operating system, along with other integral CPU and RAM computer mechanisms, plays a crucial role in ensuring optimal computing performance across a variety of tasks. Engineers are required to assess the resources at their disposal to tackle an optimization problem effectively and to evaluate various alternatives for resolution in compliance with established criteria. The fuel cost function accounts for restricted operational zones and a range of fuel alternatives in a nonconvex problem.
Global optimization has grown in prominence, with numerous stochastic and deterministic approaches being proposed over the past decade, advancing the ever-expanding field. Due to constraints, mathematical approaches may fail to yield practical, globally optimal solutions for ED. Evolutionary computation has several compensations over other stochastic algorithms, including consistent performance and global search abilities. Despite much exploration, reliable resolutions to the realistic ED problem continue to appear. If computations were performed at each site, solving the load dispatch problem would be highly complicated and time-consuming. As a result, a quick strategy is required for this aim. Nonlinear thermal-generating units require distinct solutions for optimal generation scheduling in nonconvex economic dispatch situations. Conventional power plants are costly to operate because of high energy prices and maintenance expenses. Since they are primarily located in remote areas, power plants rely on long transmission lines to deliver power from producers to consumers. The economic dispatch problem, like many complex engineering optimization problems, exhibits nonlinear and nonconvex characteristics. Because of several local extrema, computational approaches may fail to identify the global extremum, making it challenging to find the best solution. Because of limited resources, rising generation costs, and expanding demand, modern power systems require maximum energy efficiency. To demonstrate their effectiveness, the proposed GWO methods were compared with other heuristics for computation, after validating the ideal solution selected to address a constrained ED problem. Power systems are highly reliant on adequate, responsive power supplies, which increase power system energy losses, instability, and voltage profile—providing appropriate responsive power loss reduction, increased stability margins, and improved voltage profile. This study focuses on the constrained economic dispatch caused by steam valve action or shaft-bearing vibrations, which can limit the generating unit’s power output, therefore protecting the unit and achieving the maximum fuel cost optimization.

3. Materials and Methods

3.1. Materials

Economic dispatch is a significant operational scheduling feature of power systems. ED minimizes energy cost, generation operational conditions, and transmission limitations. In this paper, the mechanisms work together adaptively to meet grid thermal generation load integrated with renewable energy sources (Figure 2). Using a case study and an AI system, the combined solution is obtained and tested on a standard IEEE bus test system. In the simulation, the GWO method was implemented in MATLAB R2022b 9.9 toolboxes on Windows 11 with an Intel Core i7 processor. Fitness values represent the prey’s distance from the wolf. The fitness value classifies wolves into three groups, each of which is used to minimize the objective function via a transformation, with a maximum of 200 iterations. Figure 2 presents the distributor dispatching order for constrained economic dispatch with integrated renewable energy sources.

3.2. Methods

The power-balance constraint prevents overproduction by requiring that generated power equals the load demand, transmission network losses. Equation (1) describes the economic dispatch problems with committed units, generation output (Pi) linked to a single bus-bar, and cost (Ci) inclusive of losses, PZ, and ramp-rate.
Generator Quadratic Cost Function
The ED cost function optimization problem is articulated as a quadratic cost sum function. Each generator i has a function written as
F i P i = a P i 2 + b i P i + c i
Total generation cost
F P = i = 1 n a P i 2 + b i P i + c i
Power Balance Constraint
The thermal generator’s total power output units demand aggregate power equivalence with the load, together with the incurred total transmission losses. Consequently, the equality constraint can be expressed mathematically as
t = 1 N P G i P L = P D
If this constraint is violated, a significant penalty (1 × 10⁶) is added to discourage infeasible objective function solutions.
Transmission Loss Constraint
Kron’s loss formula, also known as the B-coefficient formulation, is used to compute system transmission loss using power flow coefficients. The transmission network losses are calculated using the B-coefficient method:
P L = i = 1 N j = i N P i , B i , j P j + i = 1 N B 0 i , P i + B 00   M W
The transmission network loss constraint can be expressed as follows.
With loss model coefficient symmetric matrix B ∈ B     R n x n , vector B n R n x n , and scalar B i Using the model, B 0 i model, and the B 00 model in the code.
Where P i = active unit in power generation; P j = active unit j power generation; and B i , j ,   B 0 i ,   B 00 = transmission loss coefficients.
Prohibited Operation Zones (PZ)
The generating units may contain POZ due to mechanical factors on their input–output curves, such as shaft bearing vibrations or auxiliary components unit faults, including the feed pumps and boilers. These zones prevent operation within certain output ranges to avoid mechanical damage or stability issues. Additionally, ramp-rate limits restrict the speed at which a generator can increase or decrease its output between consecutive time intervals. To maintain feasible operation, prohibited operating zones (PZs) and ramp-rate limits (UR and DR) are included in the fitness function through penalty terms. Any output that falls within a prohibited zone or exceeds ramping limits adds a penalty to the total fuel cost. This ensures that the dispatch schedule minimizes fuel cost while keeping generator outputs within allowed ranges and respecting ramping constraints. In practice, the feasible operating range for each generating unit can be expressed as follows:
P G i P i 1 L   ,   P i 1 U     P i 2 L   ,   P i 2 U . ni 1
Prohibited zones for unit i are penalized as an interval collection Z 1 = a i 1 ,   b i 1 ,   a i 2 ,   b i 2 , . a i k ,   b i k
Delivered power to the load:
Demand imbalance penalty (absolute divergence in code) with M   a s   10 6 :
p e n a l t y d P = M P d e l i v e r e d P P d ,
The code reduces a penalized objective (an unconstrained formulation with bound restrictions and penalties).
Ramp-Rate Limits (UR, DR)
To ensure efficient operation, each producing unit’s operational range is limited by ramp-rate constraints that require it to run between two specific zones. The ith generator’s power output (Pi) cannot exceed the previous interval’s power output (Pio) by more than the up-ramp rate limit (UR) or less than the down-ramp rate limit (DR). This constraint can be mathematically represented as
P G i m i n = max ( P _ G i . P G i 0 D R i )
P G i m a x = min ( P ¯ G i . P G i 0 U R i )
Fuel cost and loss model
Total fuel cost:
Minimize   F T o t a l = i = 1 N a P i 2 + b i P i + c i + P G i P D P L
where λ = 106 is a significant penalty factor that enforces the power balance constraint
C f u e l P = i = 1 N C i P
P d e l i v e r e d P = t = 1 N P i P l o s s P

3.3. Description of the Test Systems

3.3.1. Test System 1

The simulation ED incorporates data from coal-fired power plants operated by South Africa’s energy behemoths, as well as from the Solar PV Company website. The demand is 850 MW, 1263 MW, and 2630 MW, with a maximum of two hundred iterations for GWO. Applied on IEEE 14-, IEEE 30-, and IEEE 118- bus systems, comprising 3 generators, 6 generators, and 15 generators, using zero quadratic cost coefficients for renewable energy sources (RESs). The quadratic functions cost for conventionally generated power was developed using plant input–output quadratic function parameters, while the solar PV plant input–output cost functions were Monte Carlo uncertainty cost functions from the literature. The ED issues associated with altering load demand and producing unit numbers are investigated using 3-, 6-, and 15-unit case studies. GWO models grey wolf population dynamics, guiding the search agent through interactions and collaboration among wolves. The GWO approach simulates a ranked wolf pack structure, with alpha, beta, delta, and omega representing the pack leaders. Their placements are iteratively modified to find the ideal solution. The beta offers feedback to the alpha while also enforcing the alpha’s directives throughout the pack. The omega, the lowest-ranking grey wolf, is repeatedly scapegoated.

3.3.2. Test System 2

IEEE 14-, IEEE 30-, and IEEE 118-Bus Systems Comprising 3 Generators, 6 Generators, and 15 Generators, Using Monte Carlo UCF for RESs
Uncertainty cost function (UCF) modelling in the context of ED may pose analytical challenges for quantifying the anticipated cost of uncertainty, which is mathematically incorporated through probability distributions for individually significant renewable energy sources (RES). Modelling the availability of primary RESs for these technologies enables power-scheduling optimization [24]. The stochastic generator may exhibit discrepancies when compared to the actual power dispatched. W a v , i and power projected via the system operator W s , i . Consequently, it is imperative to account for the cost of uncertainty through potential underestimations ( W s , i < W a v , i ) or overestimation ( W s , i > W a v , i ).
U C F = C u , i W s , i ,   W a v , i + C o , i W s , i ,   W a v , i
Uncertainty in renewable energy sources is modelled using Monte Carlo simulation [25]. The resulting uncertainty cost function (UCF) is then integrated into the economic dispatch optimization to provide a reliable assessment. The main steps for carrying out the simulation [26,27] are as follows:
  • A power value denotes power i, as calculated by the ED solar generator model, W P V . s . i . Monte Carlo replication produced a random irradiance rate that represents the RES’s functional-uncertainty cost.
  • For the generator i ( G i in a Monte Carlo scenario), the irradiance random value is calculated using a log-normal probability distribution.
  • The solar power-generated W P V . s . i comparisons are derived from random irradiance.
  • To estimate uncertainty cost, use the following formulas. If W P V . s . i < W P V . i , use the underestimated state; if W P V . i < W P V . s . i , use the overestimated state.
  • Steps 2–4 are specified Monte Carlo repetitive scenarios.
  • The entire accumulated cost expected value is determined; this is the UCF value.
  • Steps 1–6 are repeated for each conceivable power value programmed into the economic dispatch model ( W P V . s . i ).
The quadratic function is modelled using the MATLAB R2022b 9.9 toolboxes to run the best approximation to program the ED UCF while the optimization problem is being solved. The simulation was developed to solve optimal power flow challenges, primarily for academics and educators [25]. The solar PV UCF approximation for the best illustration is as follows:
f W P V . s . i = 0.331 W P V . s . i 2 + 33.544 W P V . s . i 918.558
To be included in ED models, the UCF must meet specific criteria.
W P V . s . i 25   M W
With this knowledge, it is possible to represent the UCF as a programmed power polynomial as a self-determining variable and its quadratic approximation (Equation (15)) for wind turbines as follows:
f W m . s . i = 1.744 W m . s . i 2 + 3.643 W m . s . i 183.851
Although this function accurately depicts the behaviour of the expected value of uncertainty cost, using it in economic dispatch models may be impossible or difficult since the cost functions utilized in them are comparable to the UCF. This scenario is one in which this plant has a power value dispatched. W P V . s . i and W m . s . i is proposed, since the uncertainty cost function may then be expressed as a quadratic function and incorporated into the ED models.

3.4. Grey Wolf Algorithm for Solving Constrained ED Problems

Step 1: The number of search agents (or wolves) is used to estimate the population size. Except for the final randomization, all generating units are initialized at random between their lower and upper fundamental power working limitations, ensuring that each component’s generator capacity (agents or wolves) requirements are met. The last unit’s active power generation is evaluated using the data in Table 1 to determine whether it meets the inequality criterion, i.e., infeasible reinitialized solutions. Various initially generated solution sets are based on population size. The acceptable solution set reflects the search agents’ perspectives. A location matrix is created using the original search agents [28].
Step 2: Set up search agents’ location vectors to locate and encircle prey within the grey wolf’s upper and lower boundaries. The maximum iteration number has also been set. Assume that N is the number of search agents (wolves) specified in the code—SearchAgent s_no = 30 and N G is the number of generators (search space dimension).
Each candidate solution (wolf position) is a vector:
X i = P i 1 P i 1 , , P i N G , i = 1 , 2 , , N G
where P i j is the power of generator j in wolf i .
Identification of the top three leaders
At each iteration t, X α is the best cost, X β is the 2nd best, and X δ is 3rd best.
Compute the decreasing coefficient
a t = 2 2 t T m a x
T m a x are 200 iterations in the code.
For each wolf (p) and dimension (j), update using the three potential positions
A 1 = 2 a r 1 a ,   C 1 = 2 r 2 D α = C 1 X α J X j p ,   X j 1 = X α J A 1 D α , A 2 = 2 a r 3 a ,   C 1 = 2 r 4 D β = C 2 X β J X j p ,   X j 2 = X β J A 2 D β , A 3 = 2 a r 3 a ,   C 1 = 2 r 6 D δ = C 3 X δ J X j p ,   X j 3 = X δ J A 3 D δ ,
Then set
X j p     X j 1 + X j 2 + X j 3 3
Step 3: Assess each solution’s fitness values. Fitness values represent the prey’s distance from the wolf. The fitness value classifies wolves into three groups: a, b, and d. To capture prey, grey wolves alter their hunting behaviour using Equation (15).
Objective Cost Function
Putting all the pieces together, the fitness function computed in fitnesswithlosses (P, model) is
f i t n e s s P = t 1 N G a P i 2 + b i P i + c i + 10 6 t = 1 N P i P l o s s P P d + PZ penalties
Subject to P i m i n . a c t P i P i m a x . a c t   i
Step 4: Use Equations (16)–(20) to update the positions of search agents.
Step 5: Repeat steps 3–4 until they reach the prey.
Step 6: After a predetermined number of iterations, the process terminates.
The flow chart is illustrated in Figure 3.

3.4.1. Case 1: 3-Unit Generator System with the Demand of 850 MW Using Monte Carlo Uncertainty Cost Functions with RESs

The three-unit case study generator system with 850 MW load demand data [29,30] was simulated using Monte Carlo UCF for RESs. In minimum circumstances, the search space’s capability does not require multiple wolves to identify the best solution; however, for maximum circumstances, rapid space intensification necessitates the exploration of numerous wolves to determine the global optimum precisely. Table 2 presents IEEE 14-bus system cost data for the 3-unit system’s power constraints used in the GWO for ED, as well as the anticipated ramp-down and ramp-up limit constraints and the prohibited zone.

3.4.2. Case 2: Six-Unit Generator System with 1263 MW Power Demand

The 6-unit generator case study load-demand data for 1263 MW employs a coefficient-loss value [29,30] and Monte Carlo UCF for RESs. The IEEE 30-bus system has 26 buses and 46 transmission lines, 6 × 100 for RES units and thermal, including Monte Carlo UCF. Table 3 shows the IEEE 30-bus system power-constraint cost data for 6-unit systems applied in the proposed GWO, which uses UR and DR limits and generator-banned zones as key model limitations, as well as a partial solution for unit commitment.

3.4.3. Case 3: Fifteen-Unit Generator System with Demand of 2630 MW

Table 4 presents 15 thermal input–output characteristics and 7 thermal and 8 RESs Monte Carlo UCFs with a population dimension of 15 × 100 in case 3. The planned ED GWO with UR and DR restrictions resulted in 15 × 15 prohibited zones.
The transmission loss B-matrix illustrates the relative strength of loss interactions among generators. Most coefficients are very small, indicating that individual generator pairs contribute only minor losses to the system. A few higher-value coefficients appear as brighter regions, showing stronger loss effects, while darker regions indicate minimal or negative interactions. The transmission losses are generally well distributed, with only a few generator combinations contributing significantly more than others. Overall, the matrix reflects a system with moderate and localized loss influences.

4. Results and Discussion

The developed GWO effectively established the maximum yearly cost savings and significantly increased the solar PV self-consumption, resulting in a substantial cost advantage compared to other heuristic approaches. However, for small-scale systems such as the three-unit case, the GWO algorithm does not require a large number of search agents to identify the optimal solution. The algorithm inherently incorporates the positions of the three leading wolves, alpha (X1), beta (X2), and delta (X3), to guide the rest of the population, regardless of the system size or test case. The GWO parameters are tuned to efficiently explore and exploit the search space to locate the best solution, as a key feature of the algorithm. Still, at medium (6 units) and large scales (118 units), the search agents improved the accuracy and speed of the wolf’s issue space search. We developed a novel GWO technique for large-scale RES integration into the grid for dispatch. Operating energy prices and line losses (TLLs) are established as objective functions for determining the optimal solar PV generator sizing and allocation. To obtain optimal performance across a wide range of operational settings, employs a multi-objective GWO approach with different scenarios.

4.1. Test Case 1

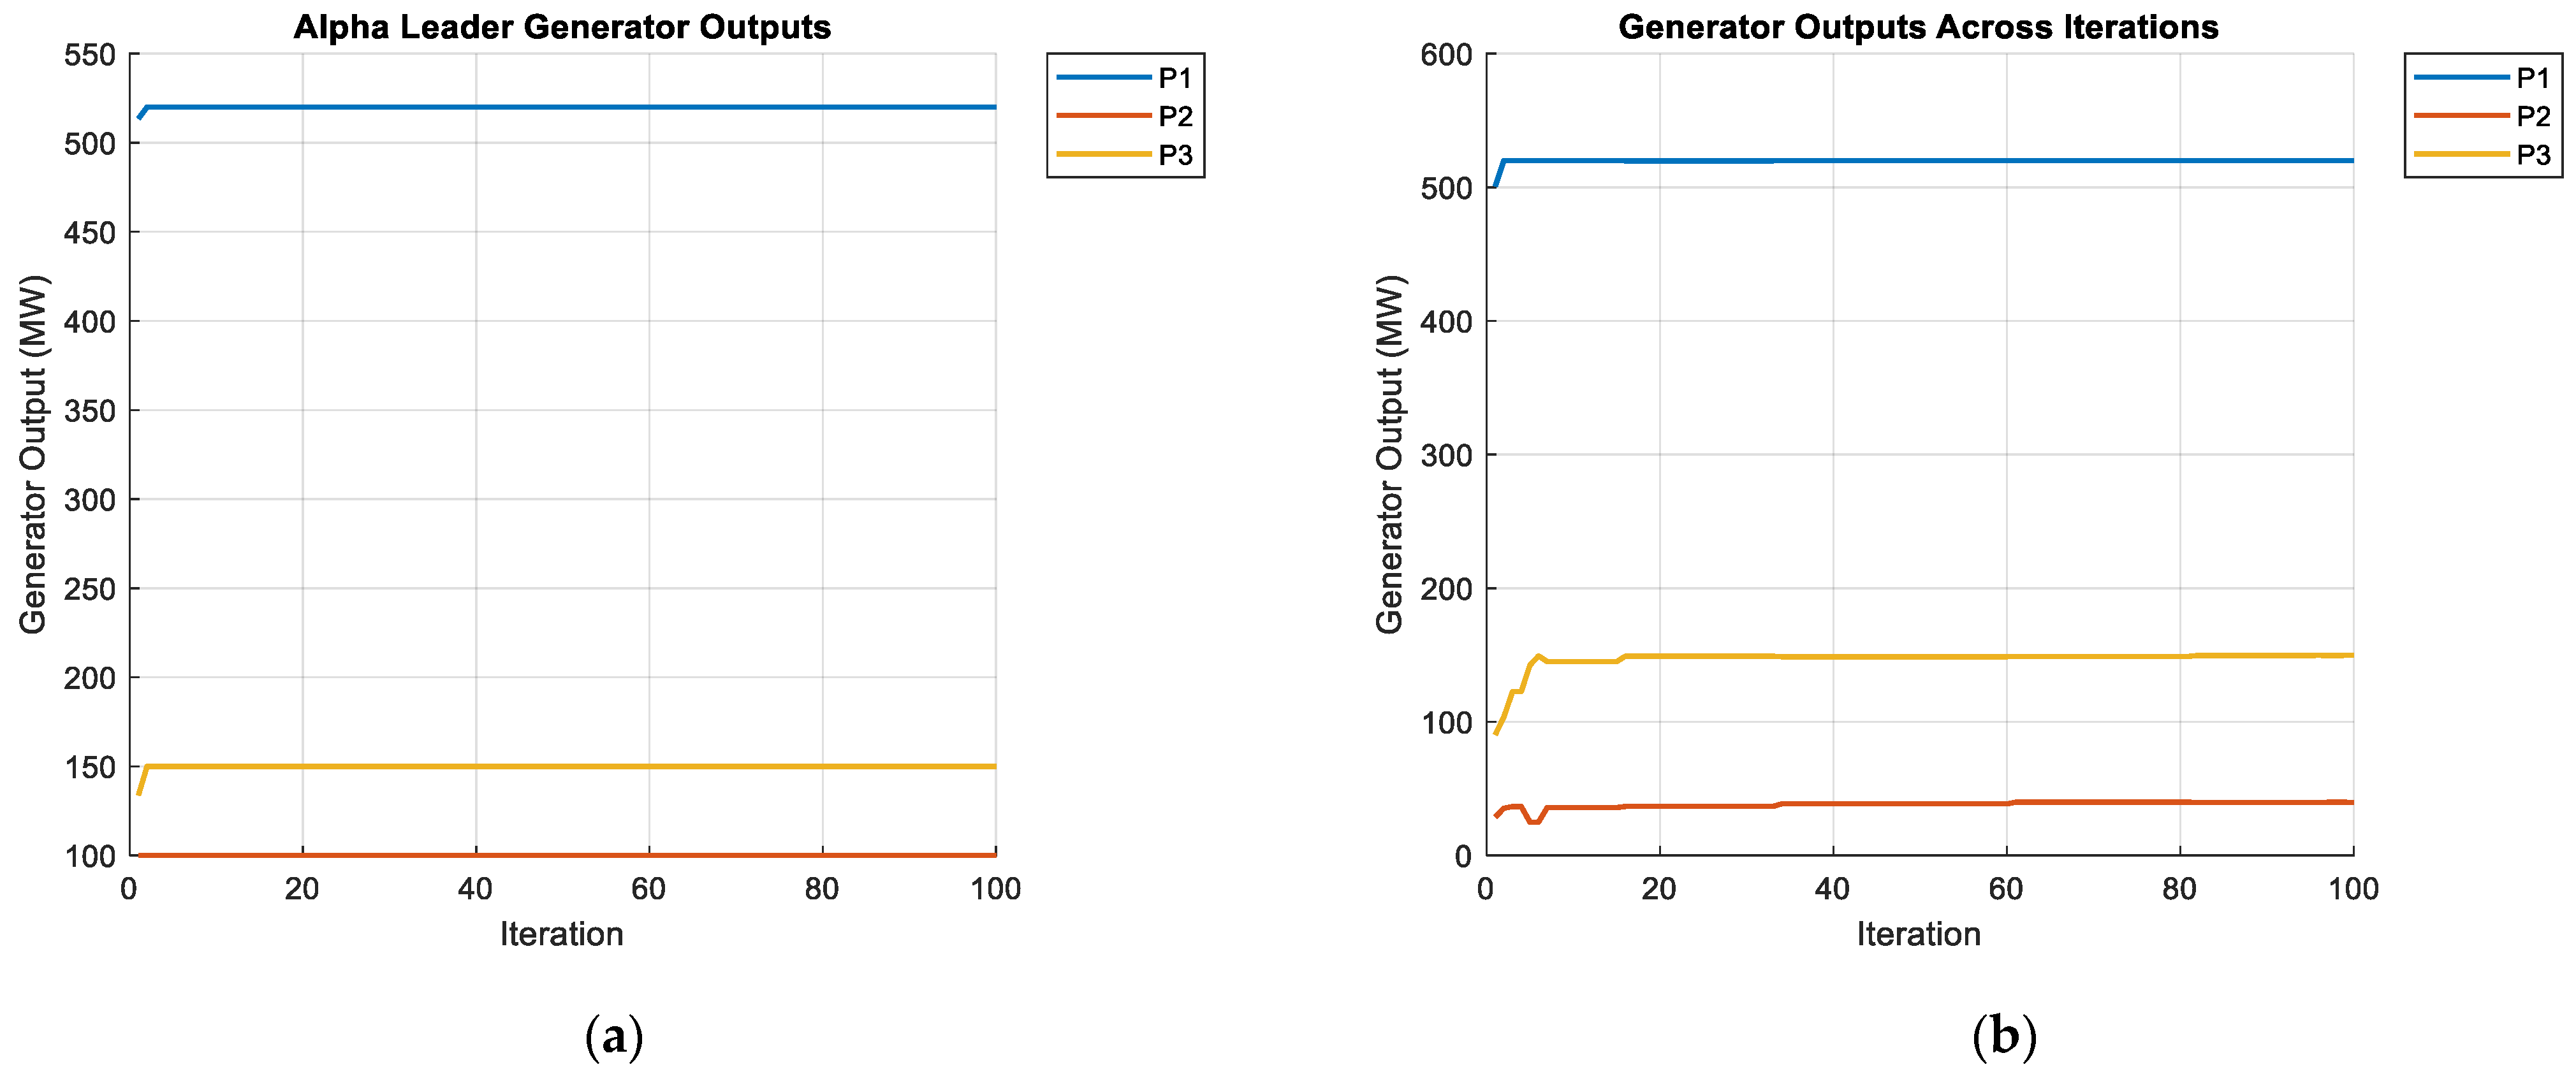
Test system 1 consists of a three-unit generation system operating with multiple fuel options. The fuel cost function coefficients used in the analysis, including transmission losses within the power-balance constraints, are illustrated in Figure 4, Figure 5 and Figure 6. The defined load demand in this experimental system is 850 MW, as shown in Table 1. The ability of the suggested methodology to meet all limitations while producing workable results amply illustrates its superiority. As the GWO method is based on stochastic principles, variations in the simulation outcomes are anticipated. Because economic dispatch is a real-time operational task, each run of the programme should converge toward an optimal or near-optimal solution. To assess the performance of the proposed GWO-based approach, the results for test system 1 are compared with those obtained from alternative methods, including PSO with evolutionary enhancements [31], GA [29,32], conventional algebraic techniques [33], and SCA- and βHC-based approaches [34].
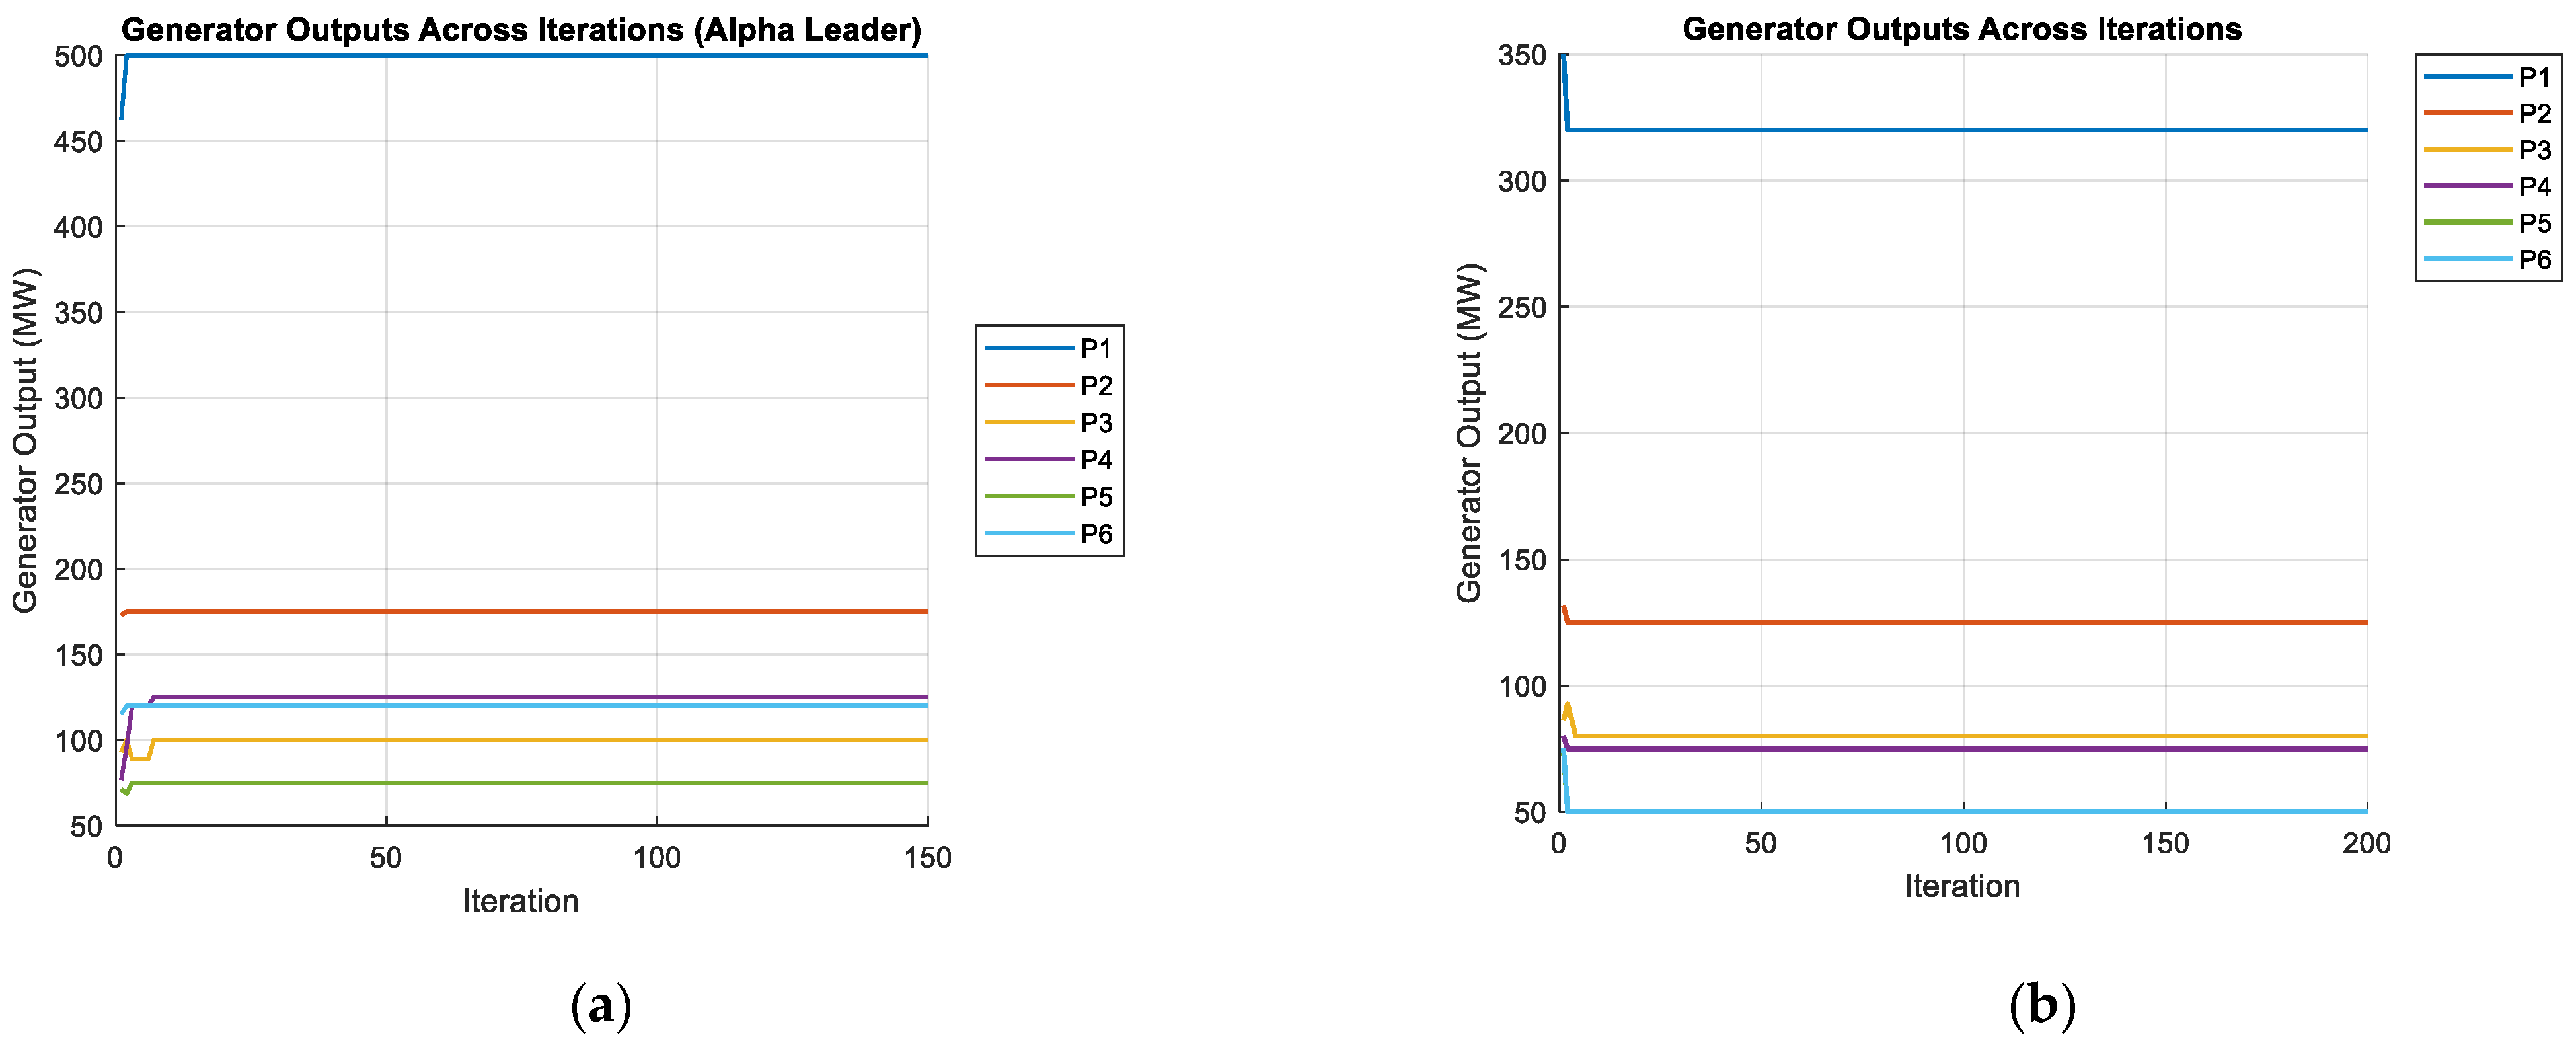
The relative outcomes are presented in Table 5. The findings indicate that the optimal, suboptimal, and average costs obtained by the GWO method are lower than those produced by alternative methodologies, underscoring its superior solution quality. Furthermore, the mean simulation duration for the proposed GWO technique is markedly shorter than that of the other algorithms analyzed in this paper. Consequently, it can be inferred that the GWO method is more computationally efficient than the different methods. The GWO convergence characteristics for the specific test system are illustrated in Figure 7, Figure 8 and Figure 9.
The GWO framework demonstrates superior computational efficiency and cost minimization compared to other methods. In the three-unit system, GWO achieves a best fuel cost of USD 7598.11; while PSO with evolutionary technique reports USD 8230.38; the conventional algebraic method, USD 8242.00; GA, USD 8234.10; and the memetic sine cosine algorithm, USD 8194.35. When considering RES uncertainty in the fuel cost coefficients, the proposed GWO yields USD 21,239.98, as shown in Table 5. These results indicate that GWO effectively reduces fuel costs while ensuring system feasibility, outperforming PSO, GA, and SCA-βHC across various configurations, with a percentage reduction relative to GWO PSO (7.65%), conventional algebraic (7.81%), GA (7.69%), and SCA-βHC (7.27%), and an increase in cost under RES uncertainty (179.5%). This analysis confirms GWO’s effectiveness in minimizing fuel costs while maintaining operational feasibility, with RES integration highlighting the impact of uncertainty on smaller systems.

4.2. Test Case 2

To test the approach for medium-sized ED problems, the overall load demand is calculated at 1263 MW for a slightly complex power system with six thermal power units. To validate the GWO technique, the considered test system losses are compared to those from PSO with evolutionary techniques [33], GA [29,32], PSO [29,31], and (SCA- and βHC) [34] for the most effective solutions, optimal generation scheduling, and comparison. Table 6 summarizes other optimization strategies from the literature and demonstrates that GWO outpaces other methods of computing efficiency and solution quality. The proposed GWO approach is compared with other methods in terms of power loss, fuel cost, and the percentage deviation of FC. Table 6 presents statistical data from the methodologies mentioned earlier, directly quoted from their respective references.
In Table 6, the Grey Wolf Optimizer (GWO) provides the lowest fuel cost among all compared methods in the six-unit test system, achieving 13,397.0625. Other techniques produced higher costs: PSO with evolutionary enhancement (15,445.486621), standard PSO (15,447), GA (15,459), and the memetic sine–cosine method (15,444.48). The percentage deviations relative to GWO are approximately 15.3%, 15.3%, 15.4%, and 15.3%, respectively, confirming that GWO delivers the most efficient cost performance. The RES-based fuel-coefficient case (46,216,657.9535) is significantly higher, with a deviation exceeding 344,000% compared to the GWO base case.

4.3. Test Case 3

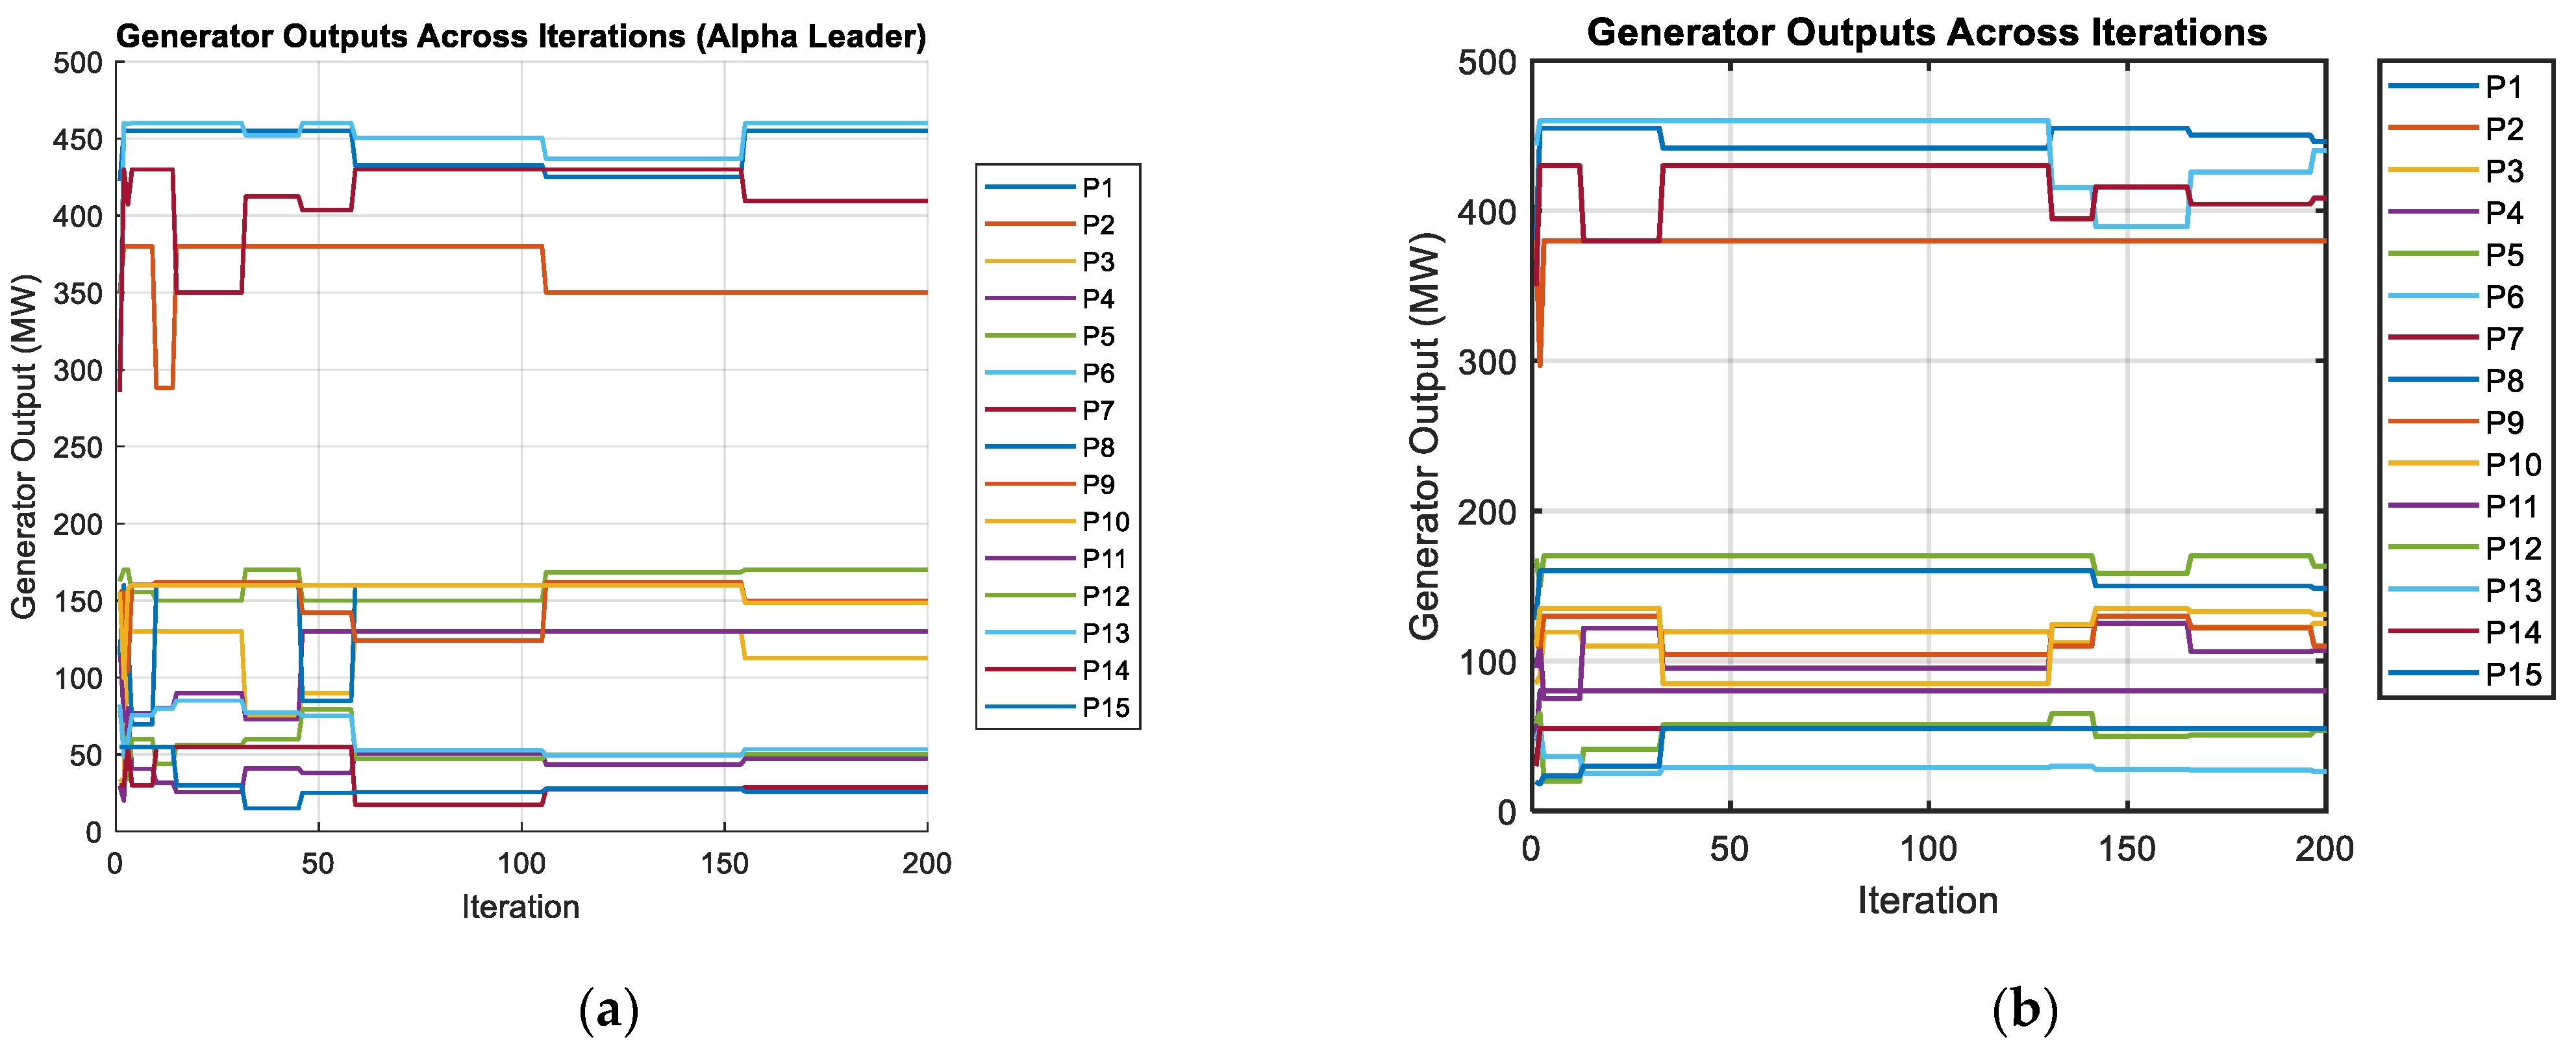
The proposed GWO method for solving economic dispatch problems is further assessed using a 15-unit generating system with a load demand of 2630 MW. The performance of the method in complex, nonlinear operating conditions is examined by considering ramp-rate limits, prohibited operating zones, and transmission losses. Table 5 presents the optimized generation schedule and corresponding fuel cost for the 15 units using the proposed GWO approach. The simulation results show that GWO consistently produces feasible and reliable solutions. To evaluate the effectiveness of the method, the GWO results are compared with those from PSO with evolutionary modifications [33], GA [30,34], standard PSO [30,33], and the SCA- and βHC-based methods [31]. Figure 10, Figure 11 and Figure 12 illustrate the convergence behaviour of the proposed method toward the minimum achievable cost for the 15-unit system. In practice, grid operators are expected to exercise sound judgment in selecting the most suitable generating units when scheduling power plants.
The fuel cost obtained using GWO is 32,622.5, serving as the reference for comparison. PSO with evolutionary enhancement produces a slightly lower cost (32,569), a deviation of –0.164%. Standard PSO (32,708) and the memetic sine–cosine method (32,761.5) deviate by 0.26% and 0.43%, respectively. The GA method shows a higher deviation of 1.50% with a cost of 33,113. The RES-based fuel coefficient scenario records 33,723.1, representing a 3.37% increase relative to the GWO result in Table 7. The breakdown of fuel cost, penalty, and total objective reveals that, while initial solutions incurred substantial penalties due to power imbalance and constraint breaches, these penalties decreased as iterations progressed, leaving lower fuel costs as the primary objective. This demonstrates how the method decreases constraint breaches (penalties) while minimizing overall operational costs. The findings indicate that GWO may successfully balance cost minimization with system feasibility in solving the ED problem. The GWO framework beats other approaches in terms of computing efficiency and fuel cost.
The findings show that the Grey Wolf Optimizer (GWO) effectively balances cost minimization and system feasibility in solving the economic dispatch problem. The method outperforms alternative approaches in computational efficiency and achieves the lowest fuel costs. For a load demand of 850 MW, the fuel expenditure obtained was USD 7598.1148 using the quadratic cost function and USD 21,239.98 under the RES-uncertainty cost function, outperforming PSO with evolutionary techniques [33], GA [30,32], conventional algebraic methods [35], and the SCA and βHC techniques [31].
For a load demand of 1263 MW, the corresponding fuel costs were USD 13,397.0625 with the quadratic coefficient and USD 46,216,657.9535 under the RES-uncertainty function, again superior to the results produced by PSO with evolutionary techniques [33], GA [30,32], PSO [30,34], and SCA- and βHC-based methods [34]. In the case of a 2630 MW load, the achieved fuel costs were USD 32,622.5 using the quadratic coefficient and USD 33,723.1 for the RES-uncertainty function, outperforming PSO with evolutionary techniques [33], GA [30,32], PSO [30,31], and SCA and βHC methods [34].
An examination of the fuel cost, penalty values, and total objective function reveals that initial solutions incurred significant penalties due to power imbalance and constraint violations. As iterations progressed, these penalties were progressively reduced, leaving fuel cost minimization as the dominant objective. This demonstrates the ability of the method to reduce constraint violations while lowering overall operating cost. Overall, the results confirm that the GWO approach successfully reconciles cost optimization and feasibility in addressing the ED problem, and it exceeds the performance of competing methods in both computing efficiency and fuel cost.
When RES uncertainty is introduced, additional spinning reserves, higher unit commitment levels, greater ramping capability, and penalties for generation deviations all contribute to higher operating costs. Thermal units may operate below their optimal efficiency to maintain required reserves, and reserve-related or deviation-related costs often dominate when RES output is highly variable. In larger multi-unit systems, these costs increase nonlinearly as more units are committed and reserve margins grow. Evidence from the literature and from practical stochastic dispatch applications shows that incorporating RES uncertainty typically increases operating costs by roughly an order of magnitude, and under severe uncertainty or strict reserve requirements, costs may rise by several orders of magnitude. These trends align with the observed escalation in fuel cost when uncertainty margins are high, reserve constraints are tight, penalties for deviations are significant, or frequent ramping of thermal units is required.

5. Conclusions

This paper applies the Grey Wolf Optimization (GWO) method to solve the economic dispatch (ED) problem while considering fuel cost characteristics, prohibited operating zones, and ramp-rate limits. The approach is evaluated on 3-unit, 6-unit, and 15-unit systems, and extended to include uncertainty in renewable energy contributions through a Monte Carlo-based cost model. Across all systems, GWO consistently provides strong feasibility and cost-minimization performance under nonlinear and constrained operating conditions. In the three-unit system, GWO achieves the lowest fuel cost at USD 7598.11, outperforming PSO, GA, the conventional algebraic method, and the memetic sine cosine approach, which show cost differences ranging from 7.27% to 7.81%. Under renewable-energy uncertainty, the cost rises to USD 21,239.98, a 179.5% increase, showing the strong impact of uncertainty on small systems. In the six-unit system, GWO again yields the lowest cost, at USD 13,397.0625, with alternative methods producing values 15.3–15.4% higher. The RES-based cost is significantly greater, reflecting the sensitivity of uncertainty models. For the 15-unit system, GWO records USD 32,622.5, with deviations between –0.164% and 1.50% for other techniques. RES-based uncertainty reduces the cost by 3.37% compared with Ref. [35], showing a 3.3% reduction in operating cost, improved flexibility, and lower voltage deviation. Overall, GWO shows reliable convergence, effective cost reduction, and strong applicability to grid-tied hybrid systems. Future work will focus on integrating electric vehicle charging stations to further increase self-consumption and overall system efficiency.

Author Contributions

O.T.A. and S.K.: conceptualization, methodology, O.T.A.: software, validation, O.T.A., S.K. and O.T.A.: formal analysis, investigation, O.T.A.: resources, data, O.T.A. and S.K.: editing, supervision, visualization, project administration, funding acquisition. O.T.A. and S.K.: writing—reviewing and editing. All authors have read and agreed to the published version of the manuscript.

Funding

This work was supported in part by the National Research Foundation (NRF), under Thuthuka Grant 138177; in part by the Eskom Tertiary Education Support Program (TESP) through a research grant; and in part by the Eskom Power Plant Engineering Institute (EPPEI).

Institutional Review Board Statement

Not applicable.

Informed Consent Statement

Not applicable.

Data Availability Statement

Data are contained within the article.

Acknowledgments

The researchers acknowledge the support and assistance of the Center for Intelligent Systems and Emerging Technologies at the Department of Electrical, Electronic, and Computer Engineering, Cape Peninsula University of Technology, Bellville, Cape Town 7535, South Africa, and the Department of Mechatronics Engineering, Federal University of Technology and Environmental Sciences, Iyin-Ekiti, Ekiti State, Nigeria, for their financial and material assistance in executing this research project. The opinions presented in this paper are those of the authors and not the funders.

Conflicts of Interest

The authors declare no conflicts of interest.

References

  1. Gharehchopogh, F.S.; Ucan, A.; Ibrikci, T.; Arasteh, B.; Isik, G. Slime Mould Algorithm: A comprehensive survey of its variants and applications. Arch. Comput. Methods Eng. 2023, 30, 2683–2723. [Google Scholar] [CrossRef] [PubMed]
  2. Adenuga, O.T.; Krishnamurthy, S. Economic Power Dispatch of a Grid-Tied Photovoltaic-Based Energy Management System: Co-Optimization Approach. Mathematics 2023, 11, 3266. [Google Scholar] [CrossRef]
  3. Adenuga, O.T. Particle Swarm Optimization Method for Energy Management of the Hybrid System of an Electric Vehicle Charging Station. Ph.D. Thesis, Cape Peninsula University of Technology, Cape Town, South Africa, 2024. Available online: https://etd.cput.ac.za/bitstream/20.500.11838/4164/1/Adenuga%2c%20OT_223119016.pdf (accessed on 19 March 2025).
  4. Liang, Z.X.; Glover, J.D. A zoom feature for a dynamic programming solution to economic dispatch including transmission losses. IEEE Trans. Power Syst. 1992, 7, 544–550. [Google Scholar] [CrossRef]
  5. El-Keib, A.A.; Ma, H.; Hart, J.L. Environmentally constrained economic dispatch using the Lagrangian relaxation method. IEEE Trans. Power Syst. 1994, 9, 1723–1729. [Google Scholar] [CrossRef]
  6. Chen, C.L.; Wang, S.C. Branch- and bound scheduling for thermal generating units. IEEE Trans. Energy Convers. 1993, 8, 184–189. [Google Scholar] [CrossRef]
  7. Dodu, J.C.; Martin, P.; Merlin, A.; Pouget, J. An optimal formulation and solution of short-range operating problems for a power system with flow constraints. IEEE Proc. 1972, 60, 54–63. [Google Scholar] [CrossRef]
  8. Aravindhababu, P.; Nayar, K.R. Economic dispatch based on optimal lambda using radial basis function network. Int. J. Electr. Power Energy Syst. 2002, 24, 551–556. [Google Scholar] [CrossRef]
  9. Parikh, J.; Chattopadhyay, D. A multi-area linear programming approach for analysis of economic operation of the Indian power system. IEEE Trans. Power Syst. 1996, 11, 52–58. [Google Scholar] [CrossRef]
  10. Nanda, J.; Hari, L.; Kothari, M.L. Economic emission dispatch with line flow constraints using a classical technique. IEE Proc. Gener. Trans. Distrib. 1994, 141, 1–10. [Google Scholar] [CrossRef]
  11. Goeritno, A. Implementation of the Coordination Equation for Determining the Transport-Related Losses in Economic Dispatch Phenomena. Math. Model. Eng. Probl. 2020, 07, 293–298. [Google Scholar] [CrossRef]
  12. Adenuga, O.T.; Krishnamurthy, S. An MINLP Optimization Method to Solve the RES-Hybrid System Economic Dispatch of an Electric Vehicle Charging Station. World Electr. Veh. J. 2025, 16, 266. [Google Scholar] [CrossRef]
  13. Agnihotri, S.; Atre, A.; Verma, H.K. Equilibrium Optimizer for Solving Economic Dispatch Problem. In Proceedings of the PIICON 2020—9th IEEE Power India International Conference, Sonepat, India, 28 February–1 March 2020. [Google Scholar] [CrossRef]
  14. Visutarrom, T.; Chiang, T.C. Economic dispatch using metaheuristics: Algorithms, problems, and solutions. Appl. Soft Comput. 2023, 150, 110891. [Google Scholar] [CrossRef]
  15. Mundotiya, P.; Shrimal, S.; Koli, A.; Kansotia, G.; Meena, N.; Tiwari, H. Metaheuristic Optimization Techniques for Economic Dispatch in Power Generation: A Review. In Proceedings of the 2024 International Conference on Computer, Electronics, Electrical Engineering & their Applications (IC2E3), Srinagar Garhwal, India, 6–7 June 2024; pp. 1–6. [Google Scholar] [CrossRef]
  16. Sheta, A.; Ali, A.; Baareh, A.; Aljahdali, S. Meta-heuristic Search Algorithms for Solving the Economic Load Dispatch Problem. In Proceedings of the 2022 3rd International Conference on Artificial Intelligence, Robotics and Control (AIRC), Cairo, Egypt, 10–12 May 2022; pp. 87–92. [Google Scholar] [CrossRef]
  17. Karimzadeh Parizi, M.; Keynia, F.; Khatibi Bardsiri, A. Woodpecker Mating Algorithm for Optimal Economic Load Dispatch in a Power System with Conventional Generators. Int. J. Ind. Electron. Control Optim. 2021, 4, 221–234. [Google Scholar] [CrossRef]
  18. Xin, J.; Yu, L.; Wang, J.; Li, N. A diversity-based parallel particle swarm optimization for nonconvex economic dispatch problem. Trans. Inst. Meas. Control 2022, 45, 452–465. [Google Scholar] [CrossRef]
  19. Rahimoon, A.A.; Abdullah, M.N.; Yassim, H.M.; Raza, A.; Soomro, S.A. Lightning Search Algorithm for Economic Dispatch Solution Considering Practical Constraints and Transmission Loss. In Proceedings of the 2024 IEEE 4th International Conference in Power Engineering Applications (ICPEA), Pulau Pinang, Malaysia, 4–5 March 2024; pp. 214–219. [Google Scholar] [CrossRef]
  20. Spea, S.R. Non-convex constrained economic power dispatch with prohibited operating zones and piecewise quadratic cost functions. Int. J. Electr. Comput. Eng. 2020, 10, 4469–4477. [Google Scholar] [CrossRef]
  21. Muraleedharan, S.; Babu, C.A.; Sasidharanpillai, A.K. Modified Opposition-Based Particle Swarm Optimization for Combined Economic and Emission Dispatch Problem. Electr. Power Compon. Syst. 2024, 1–15. [Google Scholar] [CrossRef]
  22. Castro, C.A. The solution of the economic dispatch problem via an efficient Teaching-Learning-Based Optimization method. Trans. Energy Syst. Eng. Appl. 2023, 4, 35–55. [Google Scholar] [CrossRef]
  23. Kassaymeh, S.; Abdullah, S.; Al-Betar, M.A.; Alweshah, M. Salp swarm optimizer for modeling the software fault prediction problem. J. King Saud Univ.—Comput. Inf. Sci. 2022, 34, 3365–3378. [Google Scholar] [CrossRef]
  24. Martınez, C.A.; Rivera, S.R. Quadratic Modelling of Uncertainty Costs for Renewable Generation and its Application on Economic Dispatch; Facultad de Ciencias Basicasc, Programa de Matemáticas, Universidad Nacional de Colombia: Bogotá, Colombia, 2018; Volume V, pp. 37–61. [Google Scholar]
  25. Arévalo, J.; Santos, F.; Rivera, S. Uncertainty Cost Functions for Solar Photovoltaic Generation, Wind Energy Generation, and Plug-In Electric Vehicles: Mathematical Expected Value and Verification by Monte Carlo Simulation. Int. J. Power Energy Convers. 2019, 10, 171–207. [Google Scholar] [CrossRef]
  26. Sanchez, F.S.M.; Sichać, S.J.P.; Rodriguez, S.R.R. Formulación de funciones de Costo de Incertidumbre en Pequeñas Centrales Hidroeléctricas dentro de una Microgrid. Ing. USBmed 2017, 8, 29–36. [Google Scholar] [CrossRef]
  27. Varan, M.; Erduman, A.; Menevşeoğlu, F.A. Grey Wolf Optimization Algorithm-Based Optimal Reactive Power Dispatch with Wind-Integrated Power Systems. Energies 2023, 16, 5021. [Google Scholar] [CrossRef]
  28. Gaing, Z.L. Particle swarm optimization to solving the economic dispatch considering the generator constraints. IEEE Trans. Power Syst. 2003, 18, 1187–1195. [Google Scholar] [CrossRef]
  29. Krishnamurthy, S.; Tzoneva, R.; Apostolov, A. Method for a Parallel Solution of a Combined Economic Emission Dispatch Problem. Electr. Power Compon. Syst. 2017, 45, 393–409. [Google Scholar] [CrossRef]
  30. Chen, P.; Chang, H. Large-scale economic dispatch by genetic algorithm. IEEE Trans. Power Syst. 1995, 10, 1919–1926. [Google Scholar] [CrossRef]
  31. Al-Betar, M.A.; Awadallah, M.A.; Zitar, R.A.; Assaleh, K. Economic load dispatch using memetic sine cosine algorithm. J. Ambient Intell. Hum. Comput. 2023, 14, 11685–11713. [Google Scholar] [CrossRef] [PubMed]
  32. Ali, R.; Al-Roomi. Economic Load Dispatch Test Systems Repository; Dalhousie University, Electrical and Computer Engineering: Halifax, NS, Canada, 2016; Available online: https://www.al-roomi.org/economic-dispatch (accessed on 8 June 2023).
  33. Saadat, H. Power System Analysis; McGraw-Hill Companies: Columbus, OH, USA, 1999. [Google Scholar]
  34. Kuo, C.C. A novel coding scheme for practical economic dispatch by modified particle swarm approach. IEEE Trans. Power Syst. 2008, 23, 1825–1835. [Google Scholar] [CrossRef]
  35. Meng, Q.; He, Y.; Hussain, S.; Lu, J.; Guerrero, J.M. Optimized energy storage configuration for enhanced flexibility in renewable-integrated power systems. J. Energy Storage 2025, 132, 117735. [Google Scholar] [CrossRef]
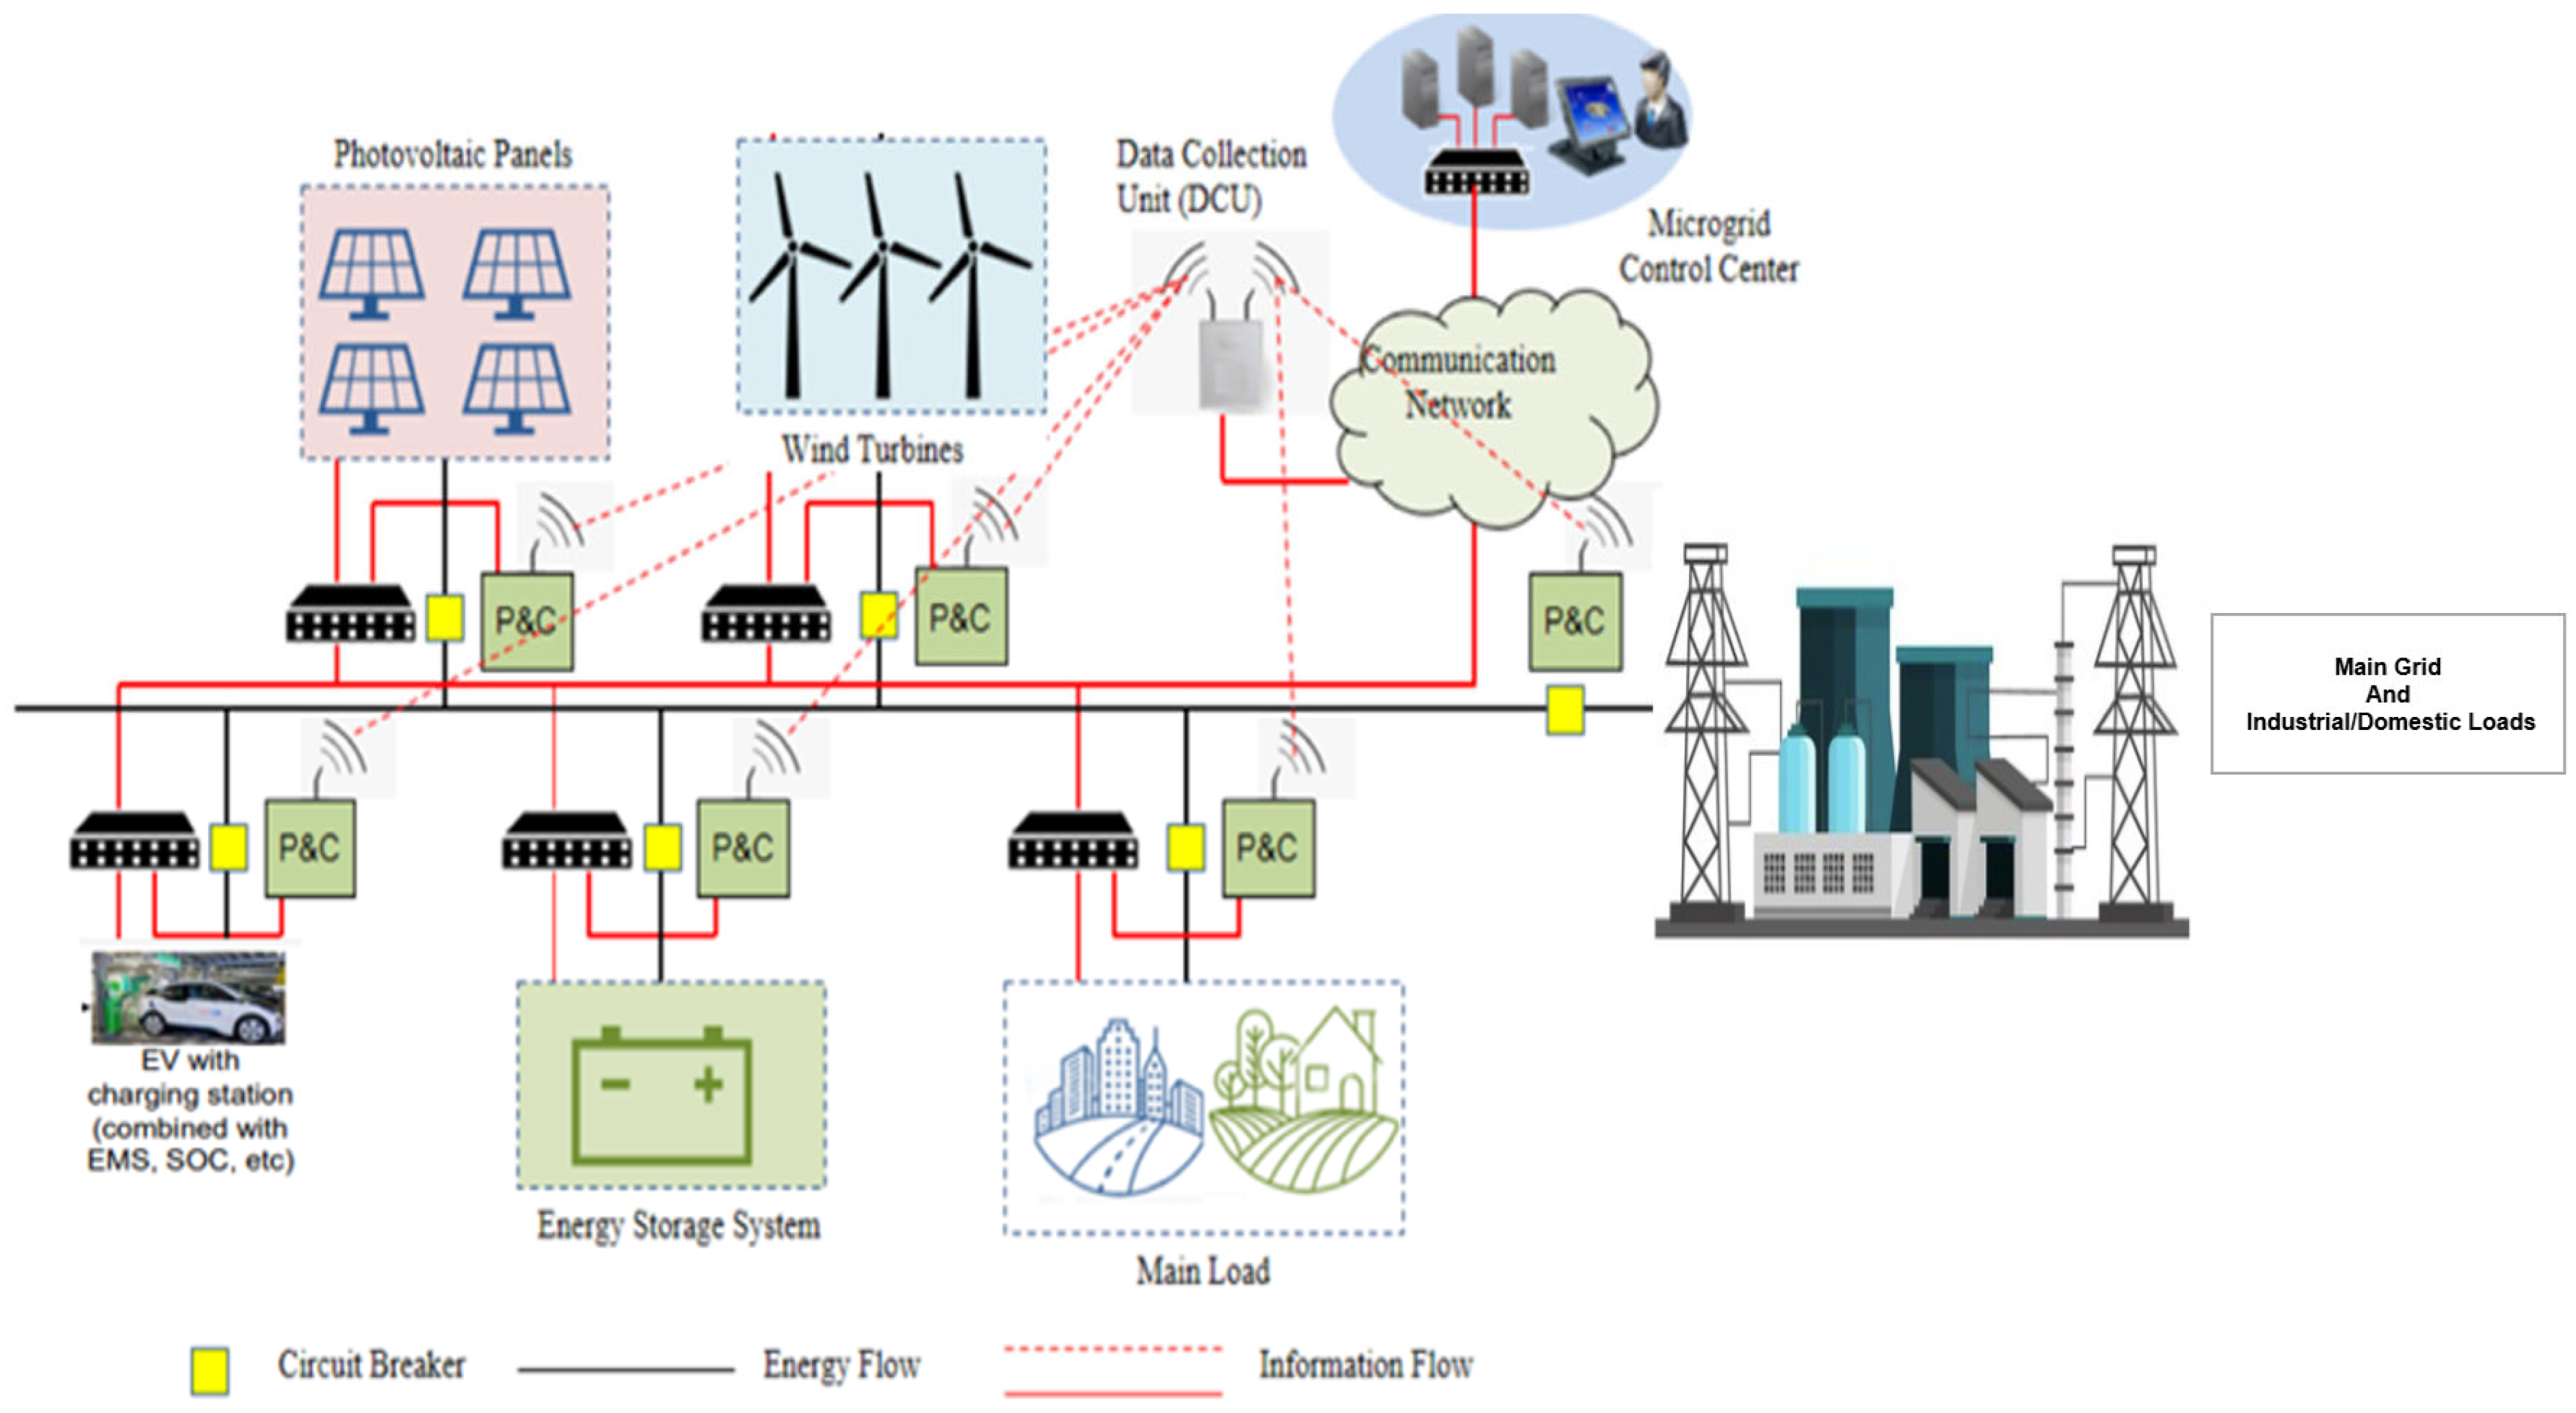
Figure 1. Schematic diagram of an economic dispatch problem in a single- and multi-area hybrid energy system with grid integration and industrial/domestic loads.
Sustainability 17 10648 g001
Figure 2. Distributor dispatching order for constrained economic dispatch with integrated renewable energy sources. The arrow is an interface between distribution line with distribution dispatch center.
Sustainability 17 10648 g002
Figure 3. Flowchart of grey wolf algorithm for solving constrained ED problems.
Sustainability 17 10648 g003
Figure 4. Test results for the three-unit ED objective (cost + penalty) simulation: (a) convergence curve of GWO for three thermal units with losses and PZ; (b) convergence curve of GWO using RES for one thermal, one wind turbine, and one solar PV unit.
Sustainability 17 10648 g004
Figure 5. Test results for the three-unit ED generator outputs across iterations simulation: (a) convergence curve of GWO for three thermal units with losses and PZ; (b) convergence curve of GWO using RES for one thermal, one wind turbine, and one solar PV unit.
Sustainability 17 10648 g005
Figure 6. Test results for the three-unit ED generator outputs fuel cost simulation: (a) convergence curve of GWO for three thermal units with losses and PZ; (b) convergence curve of GWO using RES for one thermal, one wind turbine, and one solar PV unit.
Sustainability 17 10648 g006
Figure 7. Test results for the six-unit ED objective (cost + penalty) simulation: (a) convergence curve of GWO for three thermal units with losses and PZ; (b) convergence curve of GWO using RES for two thermal, two wind turbines, and two solar PV units.
Sustainability 17 10648 g007
Figure 8. Test results for the simulation of six-unit ED generator outputs across iterations: (a) convergence curve of GWO for three thermal units with losses and PZ; (b) convergence curve of GWO using RES for two thermal, two wind turbines, and two solar PV units.
Sustainability 17 10648 g008
Figure 9. Test results for the six-unit ED generator outputs fuel cost simulation: (a) convergence curve of GWO for three thermal units with losses and PZ; (b) convergence curve of GWO using RES for two thermal, two wind turbines, and two solar PV units.
Sustainability 17 10648 g009
Figure 10. Test results for the 15-unit ED objective (cost + penalty) simulation: (a) convergence curve of GWO for three thermal units with losses and PZ; (b) convergence curve of GWO using RES for seven thermal, four wind turbines, and four solar PV units.
Sustainability 17 10648 g010
Figure 11. Test results for the 15-unit ED generator outputs across iterations simulation: (a) convergence curve of GWO for three thermal units with losses and PZ; (b) convergence curve of GWO using RES for seven thermal, four wind turbines, and four solar PV units.
Sustainability 17 10648 g011
Figure 12. Test results for the 15-unit ED generator outputs fuel cost simulation: (a) convergence curve of GWO for three thermal units with losses and PZ; (b) convergence curve of GWO using RES for seven thermal, four wind turbines, and four solar PV units.
Sustainability 17 10648 g012
Table 1. Optimization technique/solution approach for constrained ED problems with losses, POZ, and limits.
Ref.Optimization Technique/Solution ApproachObjectives/Constraints AddressedTest Power System Considered
[13]Equilibrium Optimizer
  • Fuel cost reduction and valve point effects.
  • Transmission losses and ramp rate limits.
  • Test systems consisting of 13-, 15-, and 140-unit systems.
[14]Differential evolution-based algorithm (L-HMDE).
  • Power balance constraint for handling repair.
  • Penalty mechanisms with transmission losses, prohibited zones, and ramp-rate limits.
  • Tested on 6-, 10-, 13-, 15-, 20-, 40-, 110-, 140- and 160- unit systems.
[15]Metaheuristic Optimization Techniques
  • Operational costs constraint addressing transmission losses and generation limits.
  • Applied to combined heat and power economic dispatch (CHPED).
[16]Crow Search Algorithm, and Differential Evolution (DE) Optimization Algorithm
  • Operational constraints, while minimizing power costs and power losses.
  • Test systems consisting of three- and six-unit systems.
[17]Woodpecker Mating Algorithm
  • Fuel cost reduction, prohibited operating zones (POZ), valve-point effects (VPE), ramp-rate restrictions, and transmission losses.
  • Implemented on a six-unit system.
[18]Diversity-based parallel particle swarm optimization (DPPSO)
  • Total generating costs minimization.
  • Valve-point impacts, transmission losses, restricted operating zones, and ramp rate limits.
  • Implementation details such as particle definition, evaluation function design, and equality and inequality management strategies have been thoroughly addressed.
[19]Crow search algorithm
  • Power balance, restricted operation zones, generating limits, and transmission power losses.
  • Verified through testing on 6-unit, 10-unit, and 15-unit test systems.
[20]Genetic Algorithm variants
  • Fuel cost reduction.
  • Operating zones (POZ), valve point effect (VPE), and transmission line losses.
  • Three benchmark test systems of 6-, 10-, and 15-unit systems.
[21]Lightning Search Algorithm (LSA)
  • Power balance (PB), ramp rate limits (RRL), and prohibited operating zone (PoZ) with and without power losses.
  • Tested across three distinct test systems with 6, 13, and 38 generating units.
[22]Particle swarm optimization (PSO) algorithm
  • Fuel cost reduction and CPU time efficiency.
  • Three thermal generating test systems, 6-, 10-, and 40- units, were considered to validate the proposed method.
[23]Salp Swarm Algorithm (SSSA)
  • Load demands are addressed with two additional constraints:
  • Prohibited Operating Zones and Ramp Rate Limits.
  • Tested on 3-, 6-, 13-, 15-, 40-, and 80- unit systems with 850 MW.
[24]Memetic Salp Swarm Algorithm (MSSA),
  • Load balance and power output.
  • Prohibited operating zones and ramp-rate limits.
  • Tested on 3-, 6-, 13-, 15-, 40-, and 80- unit systems.
Table 2. IEEE 14-bus system quadratics cost data and Monte Carlo uncertainty cost functions for RESs for 3-unit systems.
Bus
No
Generator Limits [MW]Fuel Cost Coefficients Without RESsFuel Cost Coefficients with RESs
PmaxPminai [USD/MW2h]bi [USD/MWh]ci
[USD/h]
ai [USD/MW2h]bi
[USD/MWh]
ci
[USD/h]
1 1006005617.920.00165617.920.0016
2 1004003107.850.0019918.55833.5440.331
5 50200787.970.0048183.8513.6431.744
Transmission loss coefficients
B01B
0.01890−0.00342−0.0076600.00029400.0000901−0.0000507
0.00009010.00052100.0000953
B00 = 0.000014−0.00005070.00009530.0000953
Table 3. IEEE 30-bus system quadratics cost data and Monte Carlo uncertainty cost functions for RESs for 6-unit systems.
Bus
No
Generator Limits [MW]Fuel Cost Coefficients Without RESsFuel Cost Coefficients with RESs
PmaxPminai [USD/MW2h]bi
[USD/MWh]
ci
[USD/h]
ai [USD/MW2h]bi
[USD/MWh]
ci
[USD/h]
1 100 500 2407.000.00702407.000.0070
2 50 200 20010.00.0095918.55833.5440.331
5 80 300 2208.50.0090183.8513.6431.744
8 50 150 20011.00.0090918.55833.5440.331
11 50 200 22010.50.0080183.8513.6431.744
13 50 120 19012.00.007519012.00.0075
Transmission loss coefficients
B01B
−0.3908 −0.12790.70470.0017 0.0012 0.0007−0.0001-0.0005-0.0002
0.0012 0.0014 0.0009 0.0001-0.0006-0.0001
0.05910.2161−0.66350.0007 0.0009 0.0031 0.0000-0.0010-0.0006
−0.0001 0.0001 0.0000 0.0024-0.0006-0.0008
B00=0.056−0.0005−0.0006−0.00100.00060.0129−0.0002
−0.0002−0.0001−0.00060.0008−0.00020.0150
Table 4. IEEE 118-bus system quadratics fuel cost and generator data using Monte Carlo uncertainty cost functions for RESs for 15-unit systems.
Bus
No
Generator Limits [MW]Fuel Cost Coefficients Without RESsFuel Cost Coefficients with RESs
PmaxPminai [USD/MW2h]bi
[USD/MWh]
ci
[USD/h]
ai [USD/MW2h]bi
[USD/MWh]
ci
[USD/h]
1 15045567110.100.000367110.100.0003
2 15045557410.200.000157410.200.0001
5 201303748.800.0011918.55833.5440.331
4201303748.800.0011183.8513.6431.744
415047046110.400.000246110.400.0002
5 13546063010.100.000363010.100.0003
81354655489.800.00035489.800.0003
106030022711.200.000322711.200.0003
252516217311.200.0008918.55833.5440.331
262516017510.700.0012183.8513.6431.744
30208018610.200.0035918.55833.5440.331
3720802309.900.0055183.8513.6431.744
38258522513.100.0003918.55833.5440.331
63155530912.100.0019183.8513.6431.744
64155532312.400.004432312.400.004
Table 5. Comparative statistical outcomes of the GWO method indicate the optimal economic dispatch solutions compared with other optimization algorithms, PD = 850 [MW].
AlgorithmPSO with Evolutionary Technique [33]Conventional
Algebraic
Method [35]
GA Method [29,32]Memetic Sine Cosine Algorithm (SCA-βHC) [34]Proposed GWO with Fuel Cost CoefficientsProposed GWO with Fuel Cost Coefficients Using RES
P1 32.604748446.71474.81300.26 520520
P2 64.680578173.01178.64400.00 10039.9644
P3 54.989919265.00262.21149.73150149.6442
Power Loss 2.3404702.3419 31.09603.01792.7237
Delivered152.341152.341276.031244.4640770706.88
Fuel cost [USD]8234.078234.088234.108234.077598.114821,239.98
%Deviation of FC for GWO compared to the literature7.657.817.697.270179.5
Table 6. Comparative statistical outcomes of the GWO method indicate the optimal economic dispatch solutions compared with other optimization algorithms, PD = 1263 [MW].
AlgorithmPSO with Evolutionary Technique [33]PSO
Method
[29,31]
GA Method [29,32]Memetic Sine Cosine Algorithm (SCA-βHC) [34]Proposed GWO with Fuel Cost CoefficientsProposed GWO with Fuel Cost Coefficients Using RES
P1 440.576558446.71474.81447.39 MW500320
P2 167.436910173.01178.64173.31 MW175125
P3 278.235609265.00262.21263.47 MW10080
P4 150.000000139.00134.28138.55 MW12575
P5 157.606137165.23151.90165.65 MW7550
P6 81.22444486.7874.1887.19 MW12050
Power Loss 12.07965812.73313.02231.096024.31809.7161
Delivered 1275.0796581275.71276.031244.46401070.6820690.2839
Fuel cost FC [USD]15,445.48662115,44715,45915,444.4813,397.062546,216,657.9535
%Deviation of FC for GWO compared to the literature15.315.315.415.30344
Table 7. Comparative statistical outcomes of the GWO method indicate the optimal economic dispatch solutions compared with other optimization algorithms, PD = 2630 [MW].
AlgorithmPSO with Evolutionary Technique [33]PSO
Method
[30,31]
GA Method [30,32]Memetic Sine Cosine Algorithm (SCA-βHC) [34]Proposed GWO with Fuel Cost CoefficientsProposed GWO with Fuel Cost Coefficients Using RES
P1 455.00455.00415.31454.99 MW455.00 455
P2 455.00380.00359.72379.99 MW380.00380
P3 130.00130.00104.43129.99 MW111.67119.65
P4 130.00130.0074.99129.99 MW130.00101.73
P5 286.41170.00380.00151.35 MW170.00170
P6 460.00460.00426.79455.74 MW349.99460
P7 465.00430.00341.32429.86430.00430
P8 60.0060.00124.79126.14124.37134.06
P9 25.0071.05133.1468.68146.69129.74
P10 37.56159.8589.26110.49160.00135
P11 80.0080.0060.0072.55 80.0035
P12 80.0080.0050.0079.7780.0065
P13 25.0025.0038.7731.8220.0946.16
P14 15.0015.0041.9417.1034.4855
P15 15.0015.0032.6421.9827.1915.76
Delivered 2630.02630.02630.02660.512629.96
Power Loss 28.9730.9013.0230.502.85 102.10
Fuel cost [USD]32,56932,70833,11332,761.532,622.533,723.1
%Deviation of FC for GWO compared to the literature0.1640.261.500.425803.37
Disclaimer/Publisher’s Note: The statements, opinions and data contained in all publications are solely those of the individual author(s) and contributor(s) and not of MDPI and/or the editor(s). MDPI and/or the editor(s) disclaim responsibility for any injury to people or property resulting from any ideas, methods, instructions or products referred to in the content.