Article

Developing a Model for Determining the Charging Station Location for Electric Vehicles

by
Sura Hussein Mijdim AL_HAMEEDAWI
1,* and
Halit Ozen
2
1
Department of Civil Engineering, Faculty of Civil Engineering, Yildiz Technical University, Istanbul 34220, Turkey
2
Department of Civil Engineering, Faculty of Civil Engineering, Istanbul Technical University, Istanbul 34469, Turkey
*
Author to whom correspondence should be addressed.
Sustainability 2025, 17(23), 10562; https://doi.org/10.3390/su172310562
Submission received: 2 November 2025 / Revised: 19 November 2025 / Accepted: 21 November 2025 / Published: 25 November 2025

Abstract

Electric vehicles, or EVs, have taken the spotlight in recent years in attempts to minimize the negative environmental effects associated with conventional modes of transportation. The location of charging infrastructure is an significant roadblock to promoting EV adoption; it demands careful planning in order to ensure the sustainability of EV use. Models like the Flow Capturing Location Model (FCLM) and Flow Refueling Location Model (FRLM) address this by considering operational constraints, system features, and uncertainties to provide effective solutions. In this study, Using MATLAB, R2020a the FCLM and FRLM were applied in Al-Karkh, Baghdad. When combined, the results revealed three key outcomes: identification of the nodes most frequently connected by traffic flows, with the shortest path method used to exclude paths that could not be utilized due to vehicle range limitations, and determination of the best nodes located along the shortest feasible routes dependent on the number of stations that the models chose.

1. Introduction

Despite the growing awareness of climate change, greenhouse gas emissions and other pollutants resulting from fossil fuel consumption, industrial activities, transportation, and human actions continue to remain at high levels [1]. The advancements in transportation systems during the 19th century, coupled with the emergence of a new social middle class, laid the foundation for the rapid growth of tourism [2]. Electric mobility has been expanding rapidly, with China emerging as the largest electric vehicle (EV) market, followed by Europe and the United States. In terms of EV market share, Norway led the world in 2019, with electric vehicles accounting for 13% of the total vehicle stock and holding a 56% share of new car sales [3]. In recent years, electric vehicles (EVs) have gained prominence as a sustainable transportation alternative, driven largely by government incentives, their positive environmental impact, reduced operational costs, and lower noise levels [4]. The use of electric vehicles (EVs) offers a viable pathway toward sustainable transportation by reducing emissions and supporting global net-zero carbon aspirations [5]. EVs are widely regarded as a promising solution to address the challenges of rising carbon emissions and reliance on fossil fuels. However, the widespread adoption of EVs remains hindered by several barriers, including range anxiety, prolonged charging times, and inadequate charging infrastructure [6]. Growing concerns about fossil fuel depletion and greenhouse gas emissions have accelerated the global shift from conventional vehicles to electric vehicles (EVs). Advances in clean energy technologies have further supported this transition. However, the rapid rise in EV adoption has highlighted major challenges, particularly the limited, uneven, and costly charging infrastructure. These shortcomings continue to restrict wider EV use. As demand increases, more public charging stations are being installed, and recent research has focused on determining optimal locations for these stations to better support the expanding EV network. [7]. As a critical supporting infrastructure for the development of electric vehicles, EV charging stations play an essential role in providing reliable charging services [8]. Adequate charging infrastructure is essential for achieving transport decarbonization targets. Although the deployment of electric vehicle infrastructure has accelerated, significant uncertainty persists within the charging market. For instance, research has highlighted disparities in the distribution of charging stations, a trend that remains somewhat expected as the market continues to prioritize early adopters [9]. Studies have demonstrated that the lack of refueling infrastructure is one of the most significant barriers facing alternative fuel vehicles (AFVs), even when they offer comparable range and safety perceptions to conventional gasoline-powered vehicles [10]. The primary challenge facing the EV charging technology industry is determining the optimal capacity and location of electric vehicle charging stations [11].
Hodgson first introduced the Flow Capturing Location Problem in 1990, which led to the establishment of the Flow Capturing Location Model [12]. Location-allocation models are employed to represent an urban transportation network where the set of transportation nodes is defined along with the set of links connecting these nodes. These links correspond to critical road interactions, major areas, or locations with high traffic density [13]. Traditional distance-minimizing and -covering models typically treat demand as weights concentrated at specific nodes. However, in network systems, demand is not always expressed at nodes; for certain types of facilities, demand arises from traffic flows between origins and destinations [14]. While demand is often represented as weights at nodes, the objective of facility location optimization is to serve this demand by allocating it to the most suitable facilities [13]. The Fuel Refueling Location Problem (FRLP) is a conceptual model designed to identify the optimal placement of refueling stations for vehicles with limited driving ranges, such as hydrogen fuel cell and electric vehicles. This problem is especially significant when the objective is to enable and support long-distance travel for such vehicles [15]. Vehicles may deviate from their designated shortest routes in order to refuel [16]. This model builds upon the Flow Capture Location Model (FCLM), which was developed to prevent double-counting of traffic flows served by multiple stations along a route. It focuses on identifying the optimal placement of refueling facilities for alternative fuel vehicles, such as hydrogen fuel cell vehicles (HFVs) [17].
Several studies have concentrated on location-based approaches to optimize the initial investment in infrastructure. For instance, the p-median problem (where p represents the number of facilities to be sited) has been applied to minimize the total travel time to the nearest refueling stations for a set of trips in metropolitan areas of California. Case study results indicate that relying solely on percentage metrics may not provide a reliable basis for determining the number of stations required in a given area [18]. For long-distance intercity trips, alternative-fuel (AF) vehicles may require multiple refueling stops at various locations along their route, adding complexity to the AF refueling station location problem [19]. This study examined the placement of charging stations along a highway network, distinguishing between stations accessible from a single driving direction and those accessible from both directions. However, all of these approaches overlook the interdependencies with the electrical grid, as well as round-trip travel and time-dependent charging demand [20].
The strategic planning of charging infrastructure plays a critical role in fostering the adoption of electric vehicles (EVs) and other alternative fuel vehicles. A key challenge for decision-makers is determining the optimal number and locations of charging stations to meet customer recharging demands while adhering to real-world constraints. This challenge is encapsulated in the Charging Station Location Problem (CSLP), a subset of facility location problems that aims to optimize the spatial distribution of charging stations [21]. Matlab knows all of the standard functions found on scientific calculators and even many of the special functions such as Bessel functions. Matlab also has several other functions that do not perform mathematical functions but are useful in programming. Two of the more useful housekeeping commands are max and min, which return the maximum and minimum values of an array [22]. The objective of this model is to minimize the number of charging stations required to ensure full connectivity coverage across the urban network within the study area.
The Flow Capturing Location Model (FCLM) and the Flow Refueling Location Model (FRLM) determine the number of charging ports required at each station under realistic traffic scenarios. MATLAB is used to implement these models, and the code is provided to evaluate the siting methods and rationale for their application. The analysis links vehicle ranges to traffic flow and identifies the shortest paths between origin–destination (O-D) pairs, considering the specific city as a zone. The study is conducted in the context of the urban road network, focusing on peak traffic patterns observed in the densely populated areas of Baghdad, Iraq.

2. Flow Capturing Location Model and Flow Refueling Location Model

The Flow Capturing Location Model (FCLM), introduced by Hodgson, optimizes facility placement and demand allocation by integrating traffic flows into a unified network, maximizing flow capture while minimizing cannibalization. Unlike traditional models, the Flow Capturing Location Model (FCLM) takes a comprehensive approach by evaluating all facilities together, providing a more integrated solution to location planning. However, applying the FCLM to real urban networks remains difficult because of their large scale, structural complexity, and the influence of distinct residential and commercial zones on travel behavior. To overcome these challenges, future studies should focus on improving the model’s computational efficiency and integrating spatial and behavioral data to better reflect real-world conditions. Doing so would strengthen the FCLM’s ability to optimize facility locations within complex transportation systems [23].
The objective (1) aims to maximize the amount of flow captured. As appears in Table 1, using the model symbols in Table 2, Flow can only be captured if there is at least one facility located at a node capable of capturing it (2) and exactly p facilities are established.
Q represents the set of potential facility locations along a given path q and let p denote the number of facilities to be located [24]. The primary objective is to formulate an optimization function that maximizes the total refueling capacity achievable with p facilities. This objective stems from the critical need to ensure that vehicles are refueled before exhausting their fuel supply, thereby maintaining uninterrupted operation and efficiency. The Flow Capturing Location Model (FCLM), originally developed by Hodgson, addresses the issue of double-counting flows that are captured by multiple facilities along a single path. In the integer programming formulation of the FCLM, the binary variable yq is introduced to ensure that even if the left-hand side of constraint (2) contains multiple xk variables equal to one (indicating the presence of facilities at various locations), the value of yq cannot exceed one [23]. This constraint prevents the overestimation of flow capture by ensuring that each path’s flow is counted only once, regardless of the number of facilities it passes [25].
The Flow Refueling Location Model (FRLM) is a path-based approach designed to optimize the placement of alternative-fuel stations. This model focuses on locating p stations to maximize the traffic flow of origin–destination (O–D) trips that can be refueled within the maximum driving range of a vehicle on a single tank of fuel or battery charge [26]. For longer trips, the model accounts for combinations of stations along the route to accommodate O–D trips that cannot be completed with refueling at just one station [27].
The objective function (4), designed to maximize the total flow that can be refueled with p facilities, is the same as in the FCLM [28]. Constraint (5) is similar to constraint (2) in the FCLM, but with the distinction that it requires at least one eligible combination of facilities h to be open for paths to be refueled, rather than ensuring at least one eligible facility i is open on path q. Constraint (6) ensures that vh remains zero unless all facilities in combination h are open. Constraint (7) specifies that exactly p facilities must be constructed, and constraint (8) enforces the integrality conditions for the variables, all of which are binary [29].

3. Prepare Initial Solution

This study focuses on developing optimal charging station locations within a transportation network, considering the level of charging needs. The process involves the following steps:
  • Identify the Traffic Flow Network
Start by choosing a real-world traffic flow network to analyze. Identify potential facility nodes within the network and assign each node a weight that represents the likelihood of customers needing charging services. These weights will help determine which nodes are most critical for strategically placing charging stations across the city.
2.
Calculate Path Requirements
Assess the needs of each route in the network by calculating the distances between nodes and mapping the driving paths of electric vehicles (EVs). This analysis helps reveal which areas are likely to have the highest demand for charging infrastructure.
3.
Connect Nodes and Determine Station Numbers
Connect each identified node to its corresponding region or city and estimate how many charging stations are needed in each location. This approach ensures sufficient coverage and easy access for EV users while aligning station placement with traffic flow and charging demand

Case Study and Solution Procedures

With an estimated population with more than seven million, Baghdad stands as Iraq’s largest urban center [30]. The city is a notable example of severe traffic congestion, with levels far exceeding those found in other major cities across the region [31]. Due to the limited number of studies on arterial road capacity—and the challenges posed by high traffic volumes, mixed vehicle types, and frequent lane-changing—traffic flow on Baghdad’s urban arterials tends to be highly irregular and heterogeneous [32]. The Haifa, Juafir, and Allawi districts outline the city’s main boundaries, while Figure 1 shows its three major zones. The intersections at nodes (1, 5, 6, 9, 14, and 12) face very high traffic volumes on two main approaches, which serve as key paths for commuters, freight, and public transit, often causing congestion. Its location along a street that connects with two secondary streets adds complexity, as fast through-traffic meets slower local flows. In addition, the surrounding concentration of commercial and socio-economic activities are strategically located along key transportation corridors; thus, Baghdad serves as a vital hub and remains one of the most congested areas in Iraq. The main features used to select the nodes can be summarized as follows:
  • The location experiences exceptionally high traffic volumes on two approaches.
  • The location is located along an expressway that intersects with two secondary streets.
  • A concentration of locations for commercial or other socio-economic activities are situated in proximity to the intersection [33].
In response to these challenges, Baghdad aims to develop a more integrated and sustainable transportation system, expand urban green spaces, reduce greenhouse gas emissions, and enhance overall environmental quality. Any new transportation infrastructure is intended to serve as a key component of a revised, comprehensive city master plan [33].
The city’s transportation network consists of fifteen nodes—strategically located points within the road system—that connect five distinct urban sub-centers across the metropolitan area. Accurate information on these nodes and the lengths of roads was sourced from OpenStreetMap, a geographic information system (GIS) platform. As shown in Figure 1, this data was analyzed to estimate traffic flow rates, which reached 23,702 vehicles during the morning, midday, and evening peak periods.
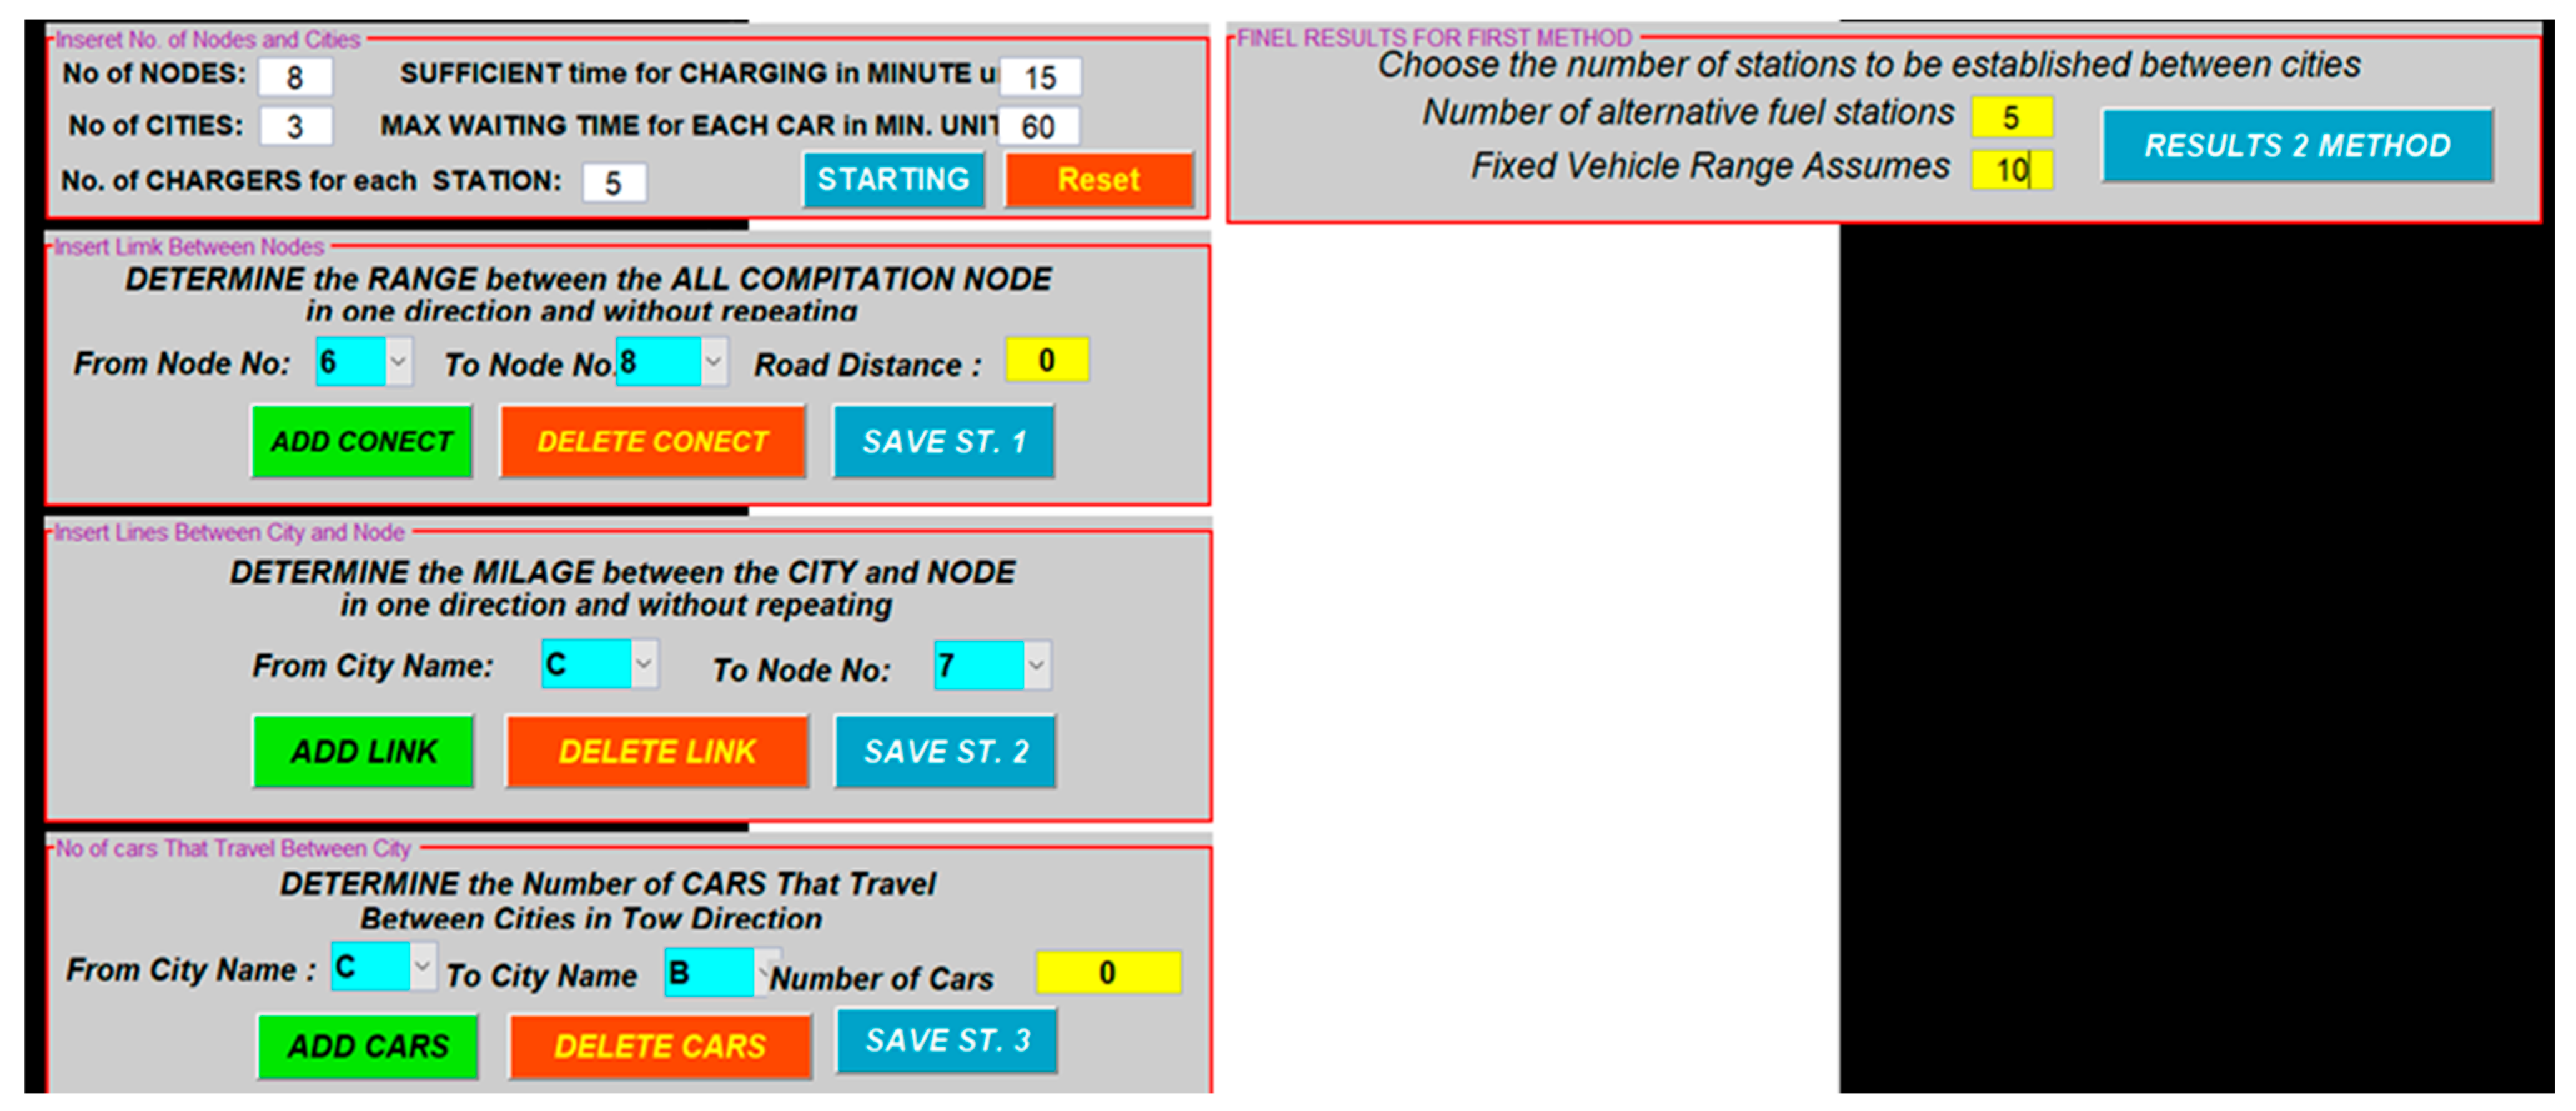
Upon running the MATLAB program and executing the code, a dedicated interface window opens, prompting the user to input the necessary data for the analysis. As presented in Table 3, all node identifiers and their associated origin–destination distances were imported directly from OpenStreetMap.
As illustrated in Table 4, the input parameters include the number of nodes, the number of cities, charging duration, the maximum permissible waiting time for charging, and the number of chargers available at each station. Entering this data initiates the development of the city case study.
Subsequently, as illustrated in Figure 2, the MATLAB interface displays a design layout that facilitates the processing and visualization of the input parameters. This interface serves as an interactive environment for monitoring the progress of data entry and analysis, ensuring that all specified parameters are effectively integrated into the computational workflow.
As shown in Table 5, a portion of the MATLAB code is dedicated to outputting the specific stations at their respective nodes upon completing the data entry process.
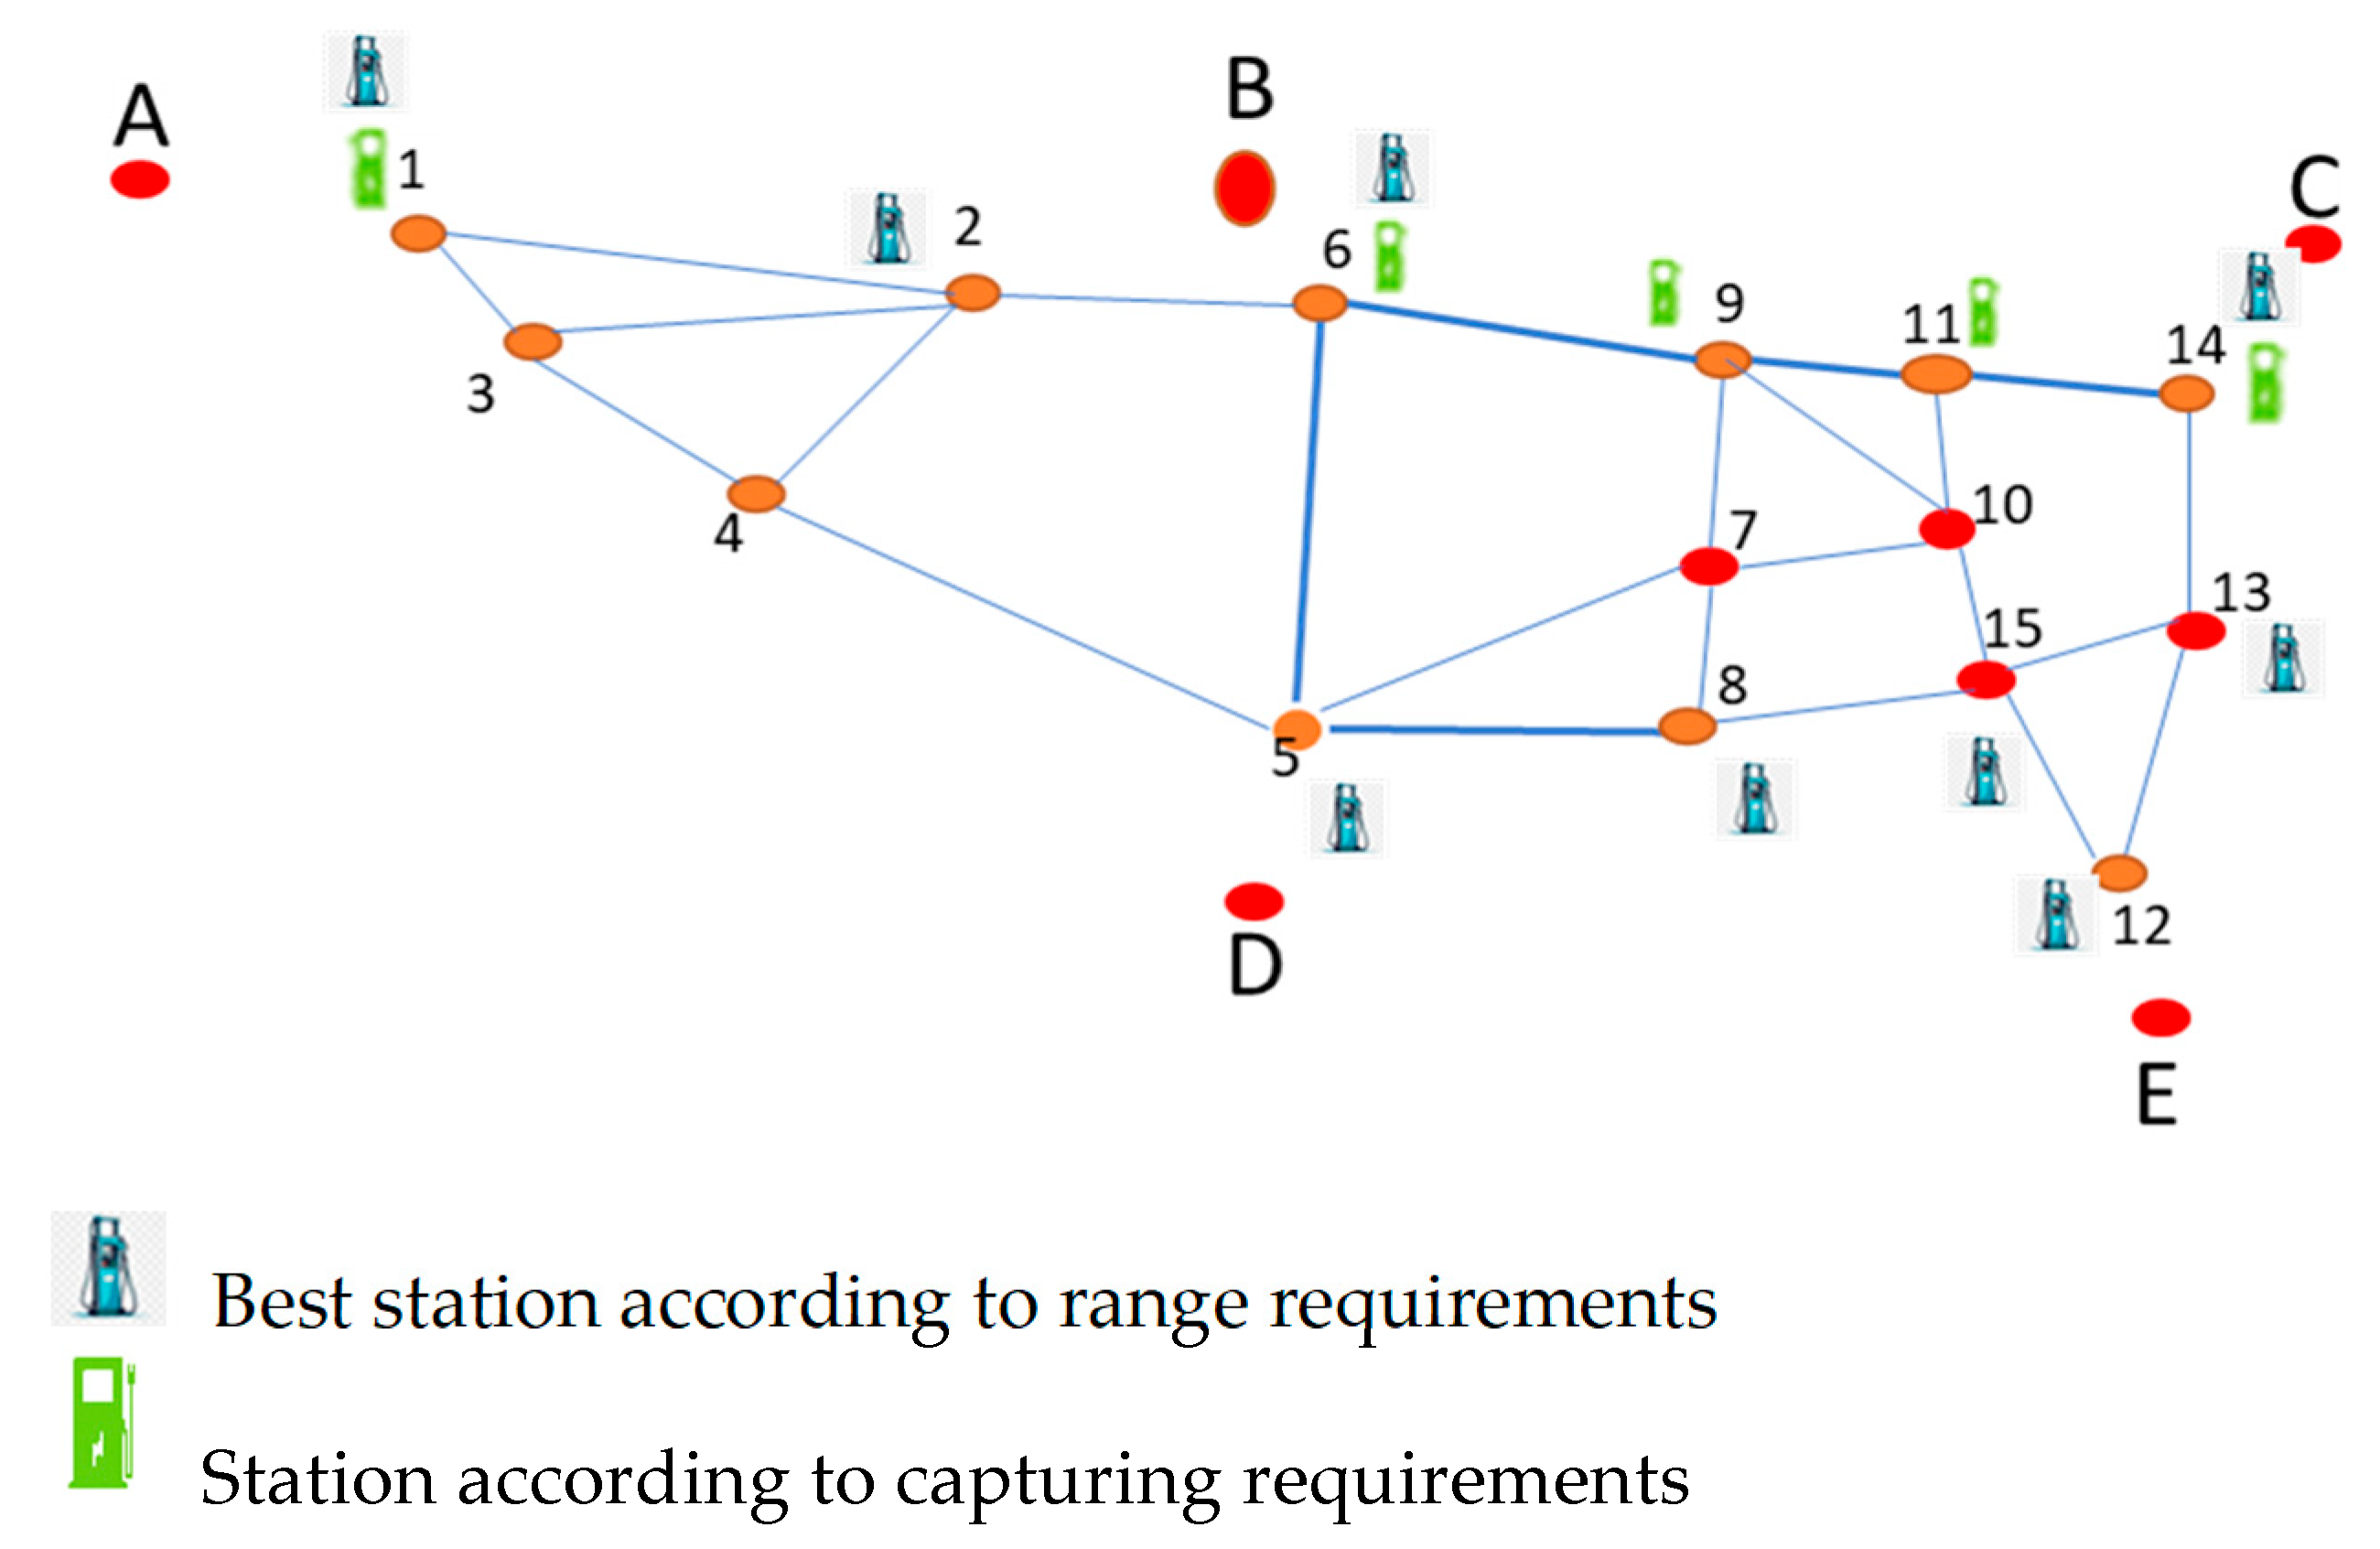
Following the data definition and saving process, as outlined in Section 3, the analysis produces two methodological outputs. The first output focuses on the optimal network design. For example, if an investment plan involves constructing five stations within a given area, the number and configuration of alternative station locations will be generated based on the FRLM and FCLM models, as illustrated in Figure 3.
Phase 1 of data analysis
In the capturing model, nodes were prioritized according to traffic flow from highest to lowest, as shown in Table 6. As a result, nine nodes were identified for potential station construction, with five nodes selected as the most optimal locations for investment.
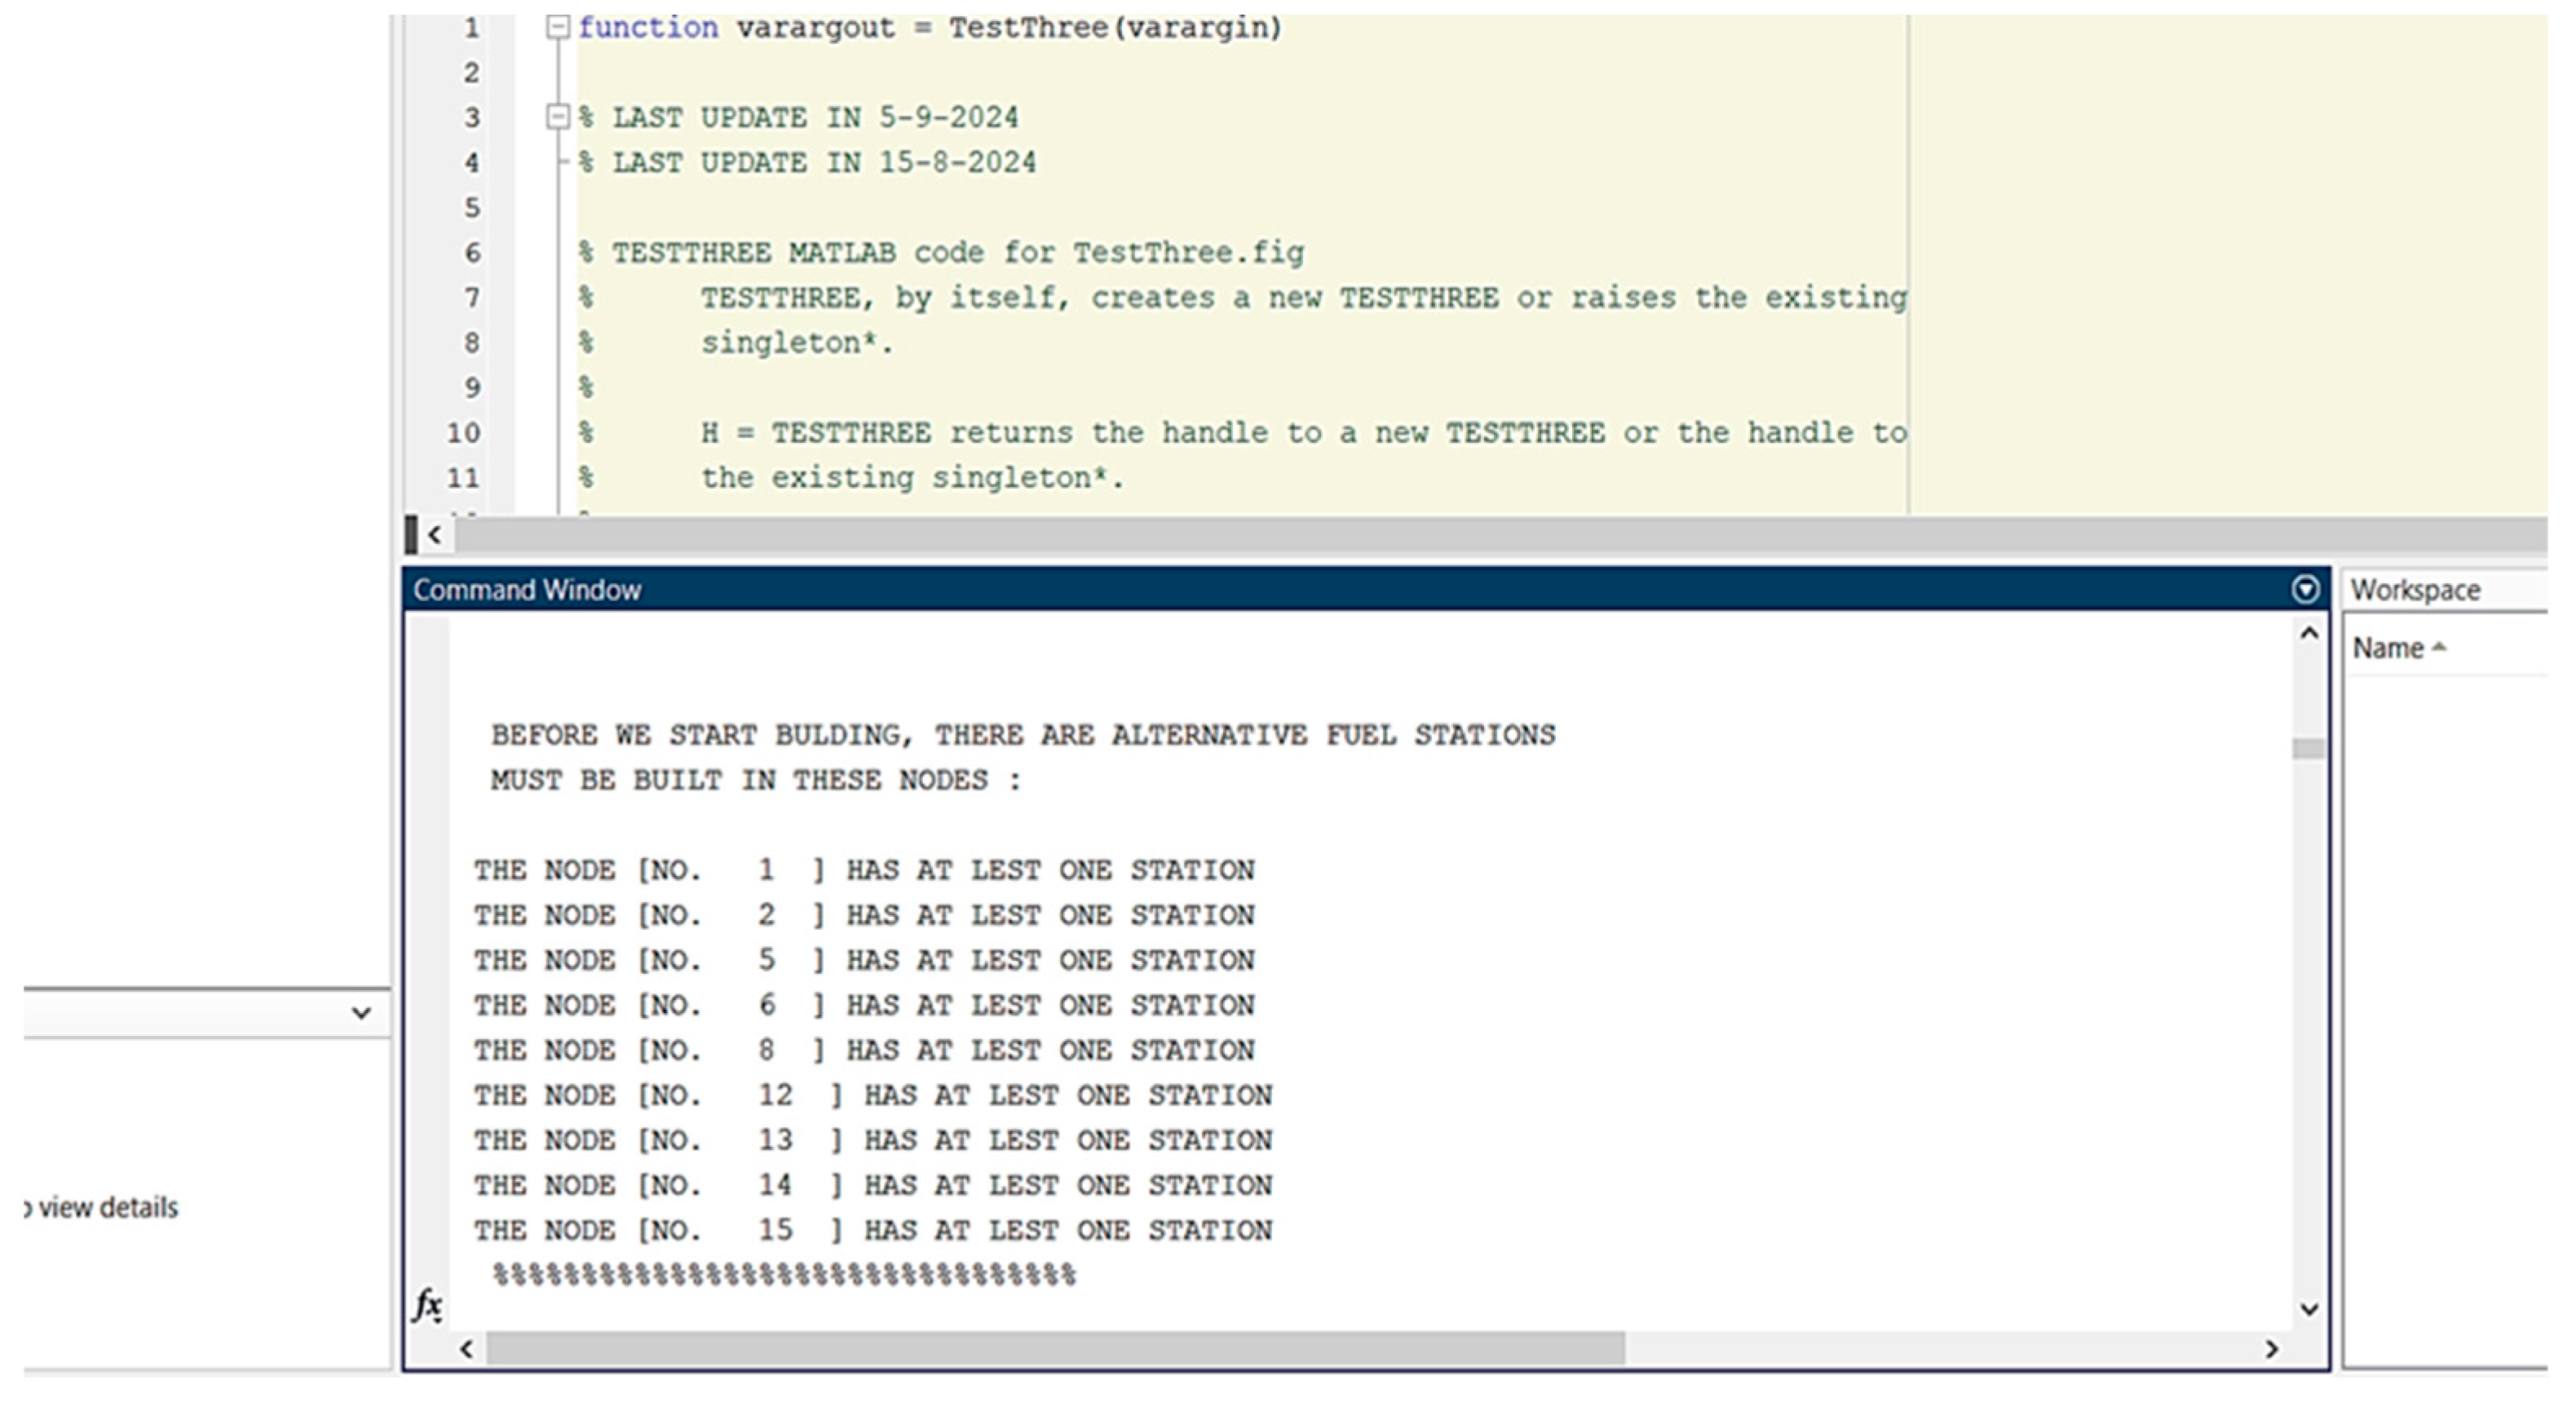
Following the data definition and saving process, as outlined in Section 3, the analysis produces two methodological outputs. The first output focuses on the optimal design, for example, if five stations are chosen as the number of alternative fuel stations to be built in this area, their locations are 11–6–1–14–9, based on vehicle range assumptions (60 km), illustrated in Figure 4 for reference. Additionally, the optimal facility locations and the corresponding nodes where stations should be constructed can be determined as nine nodes: 1-2-5-6-8-12-13-14-15. These results are also illustrated in Figure 4. The second output is based on nodes which can capture regions from the areas of the highest traffic flow to the lowest. In this case, the decision is made to establish five stations within the network, achieving the desired outcome.
Phase 2 of data analysis
Case 1: Node Analysis
The employed methodology generates two distinct outputs, both of which support the decision-making process for station placement, as detailed in Table 7. The first method produces a ranked sequence of nodes based on the number of vehicles captured at each location. Node 11 records 15,986 vehicles, highlighting its strategic importance, as it intersects the primary traffic flow between the southern and northern regions of Baghdad.
An auxiliary window provides detailed outputs of multiple equations for the ALL optimal nodes, including the distribution of flow volumes, as illustrated in Figure 5.
Case 2:
The results obtained from the second methodological approach yielded, in their first output, a situation with a total of 20 paths, as detailed in Table 8. This was determined based on the principles of the Flow Refueling Location Model (FRLM), and was computationally identified using the MATLAB code developed for this purpose.
Following an examination of the 20 shortest paths and their associated traffic flow patterns, assuming a maximum operational range of 60 km for this study, the analysis code in Matlab identified 10 paths that were not allowed as the distance between nodes was more than the vehicles’ assumed maximum operational range based on the principles of the Flow Refueling Location Model (FRLM) as indicated in Table 9.
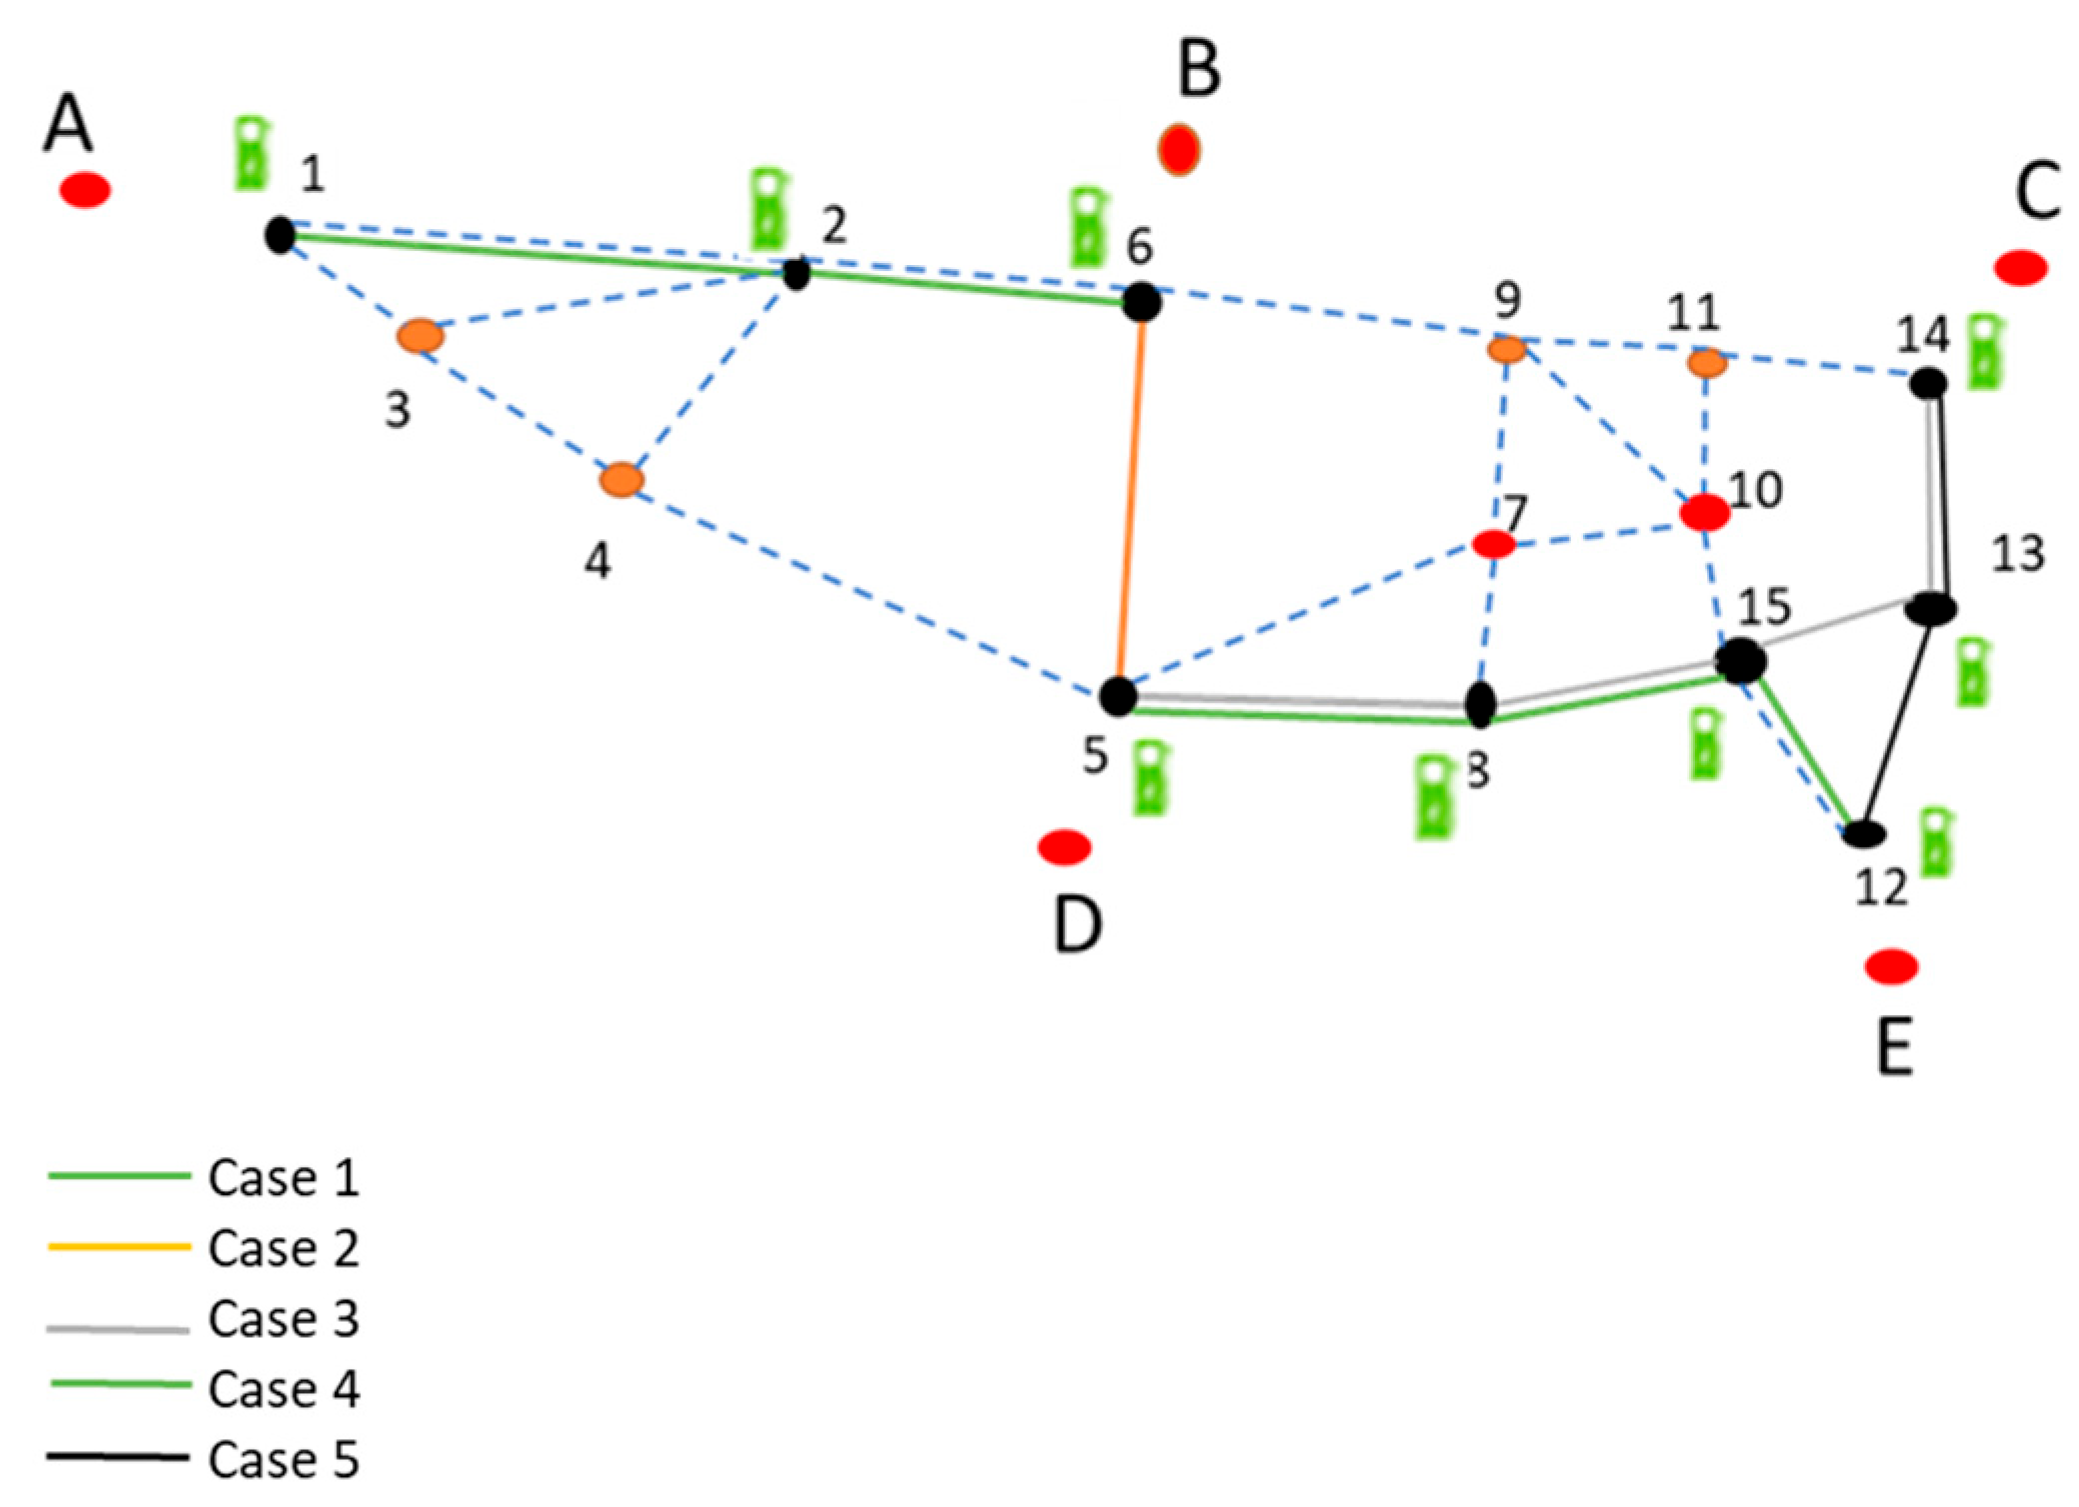
An analysis of the third methodology, specifically identifying the shortest paths with nodes, constrained by an assumed vehicle range of 60 km, was conducted for the Baghdad region. This method found 10 paths with nodes that were suitable for vehicles to travel within the study area. In path A2B, vehicles needed to stop at City B to recharge if they started with a full charge at City A. This necessitated the placement of two charging stations along this path. Similarly, for the path D81513C, four charging stations are required: one at City D (already established) and additional stations at nodes 8, 15, and 13, with City C as the destination. For the path D815E, only one additional charging station is needed, in City E, as stations are already in place at nodes D, 8, and 15 from the previous path. Finally, the path E13C does not require new charging stations, as it is already accounted for within the existing network. These findings are summarized in Table 10, which outlines the charging station requirements for the nine nodes analyzed in the region.
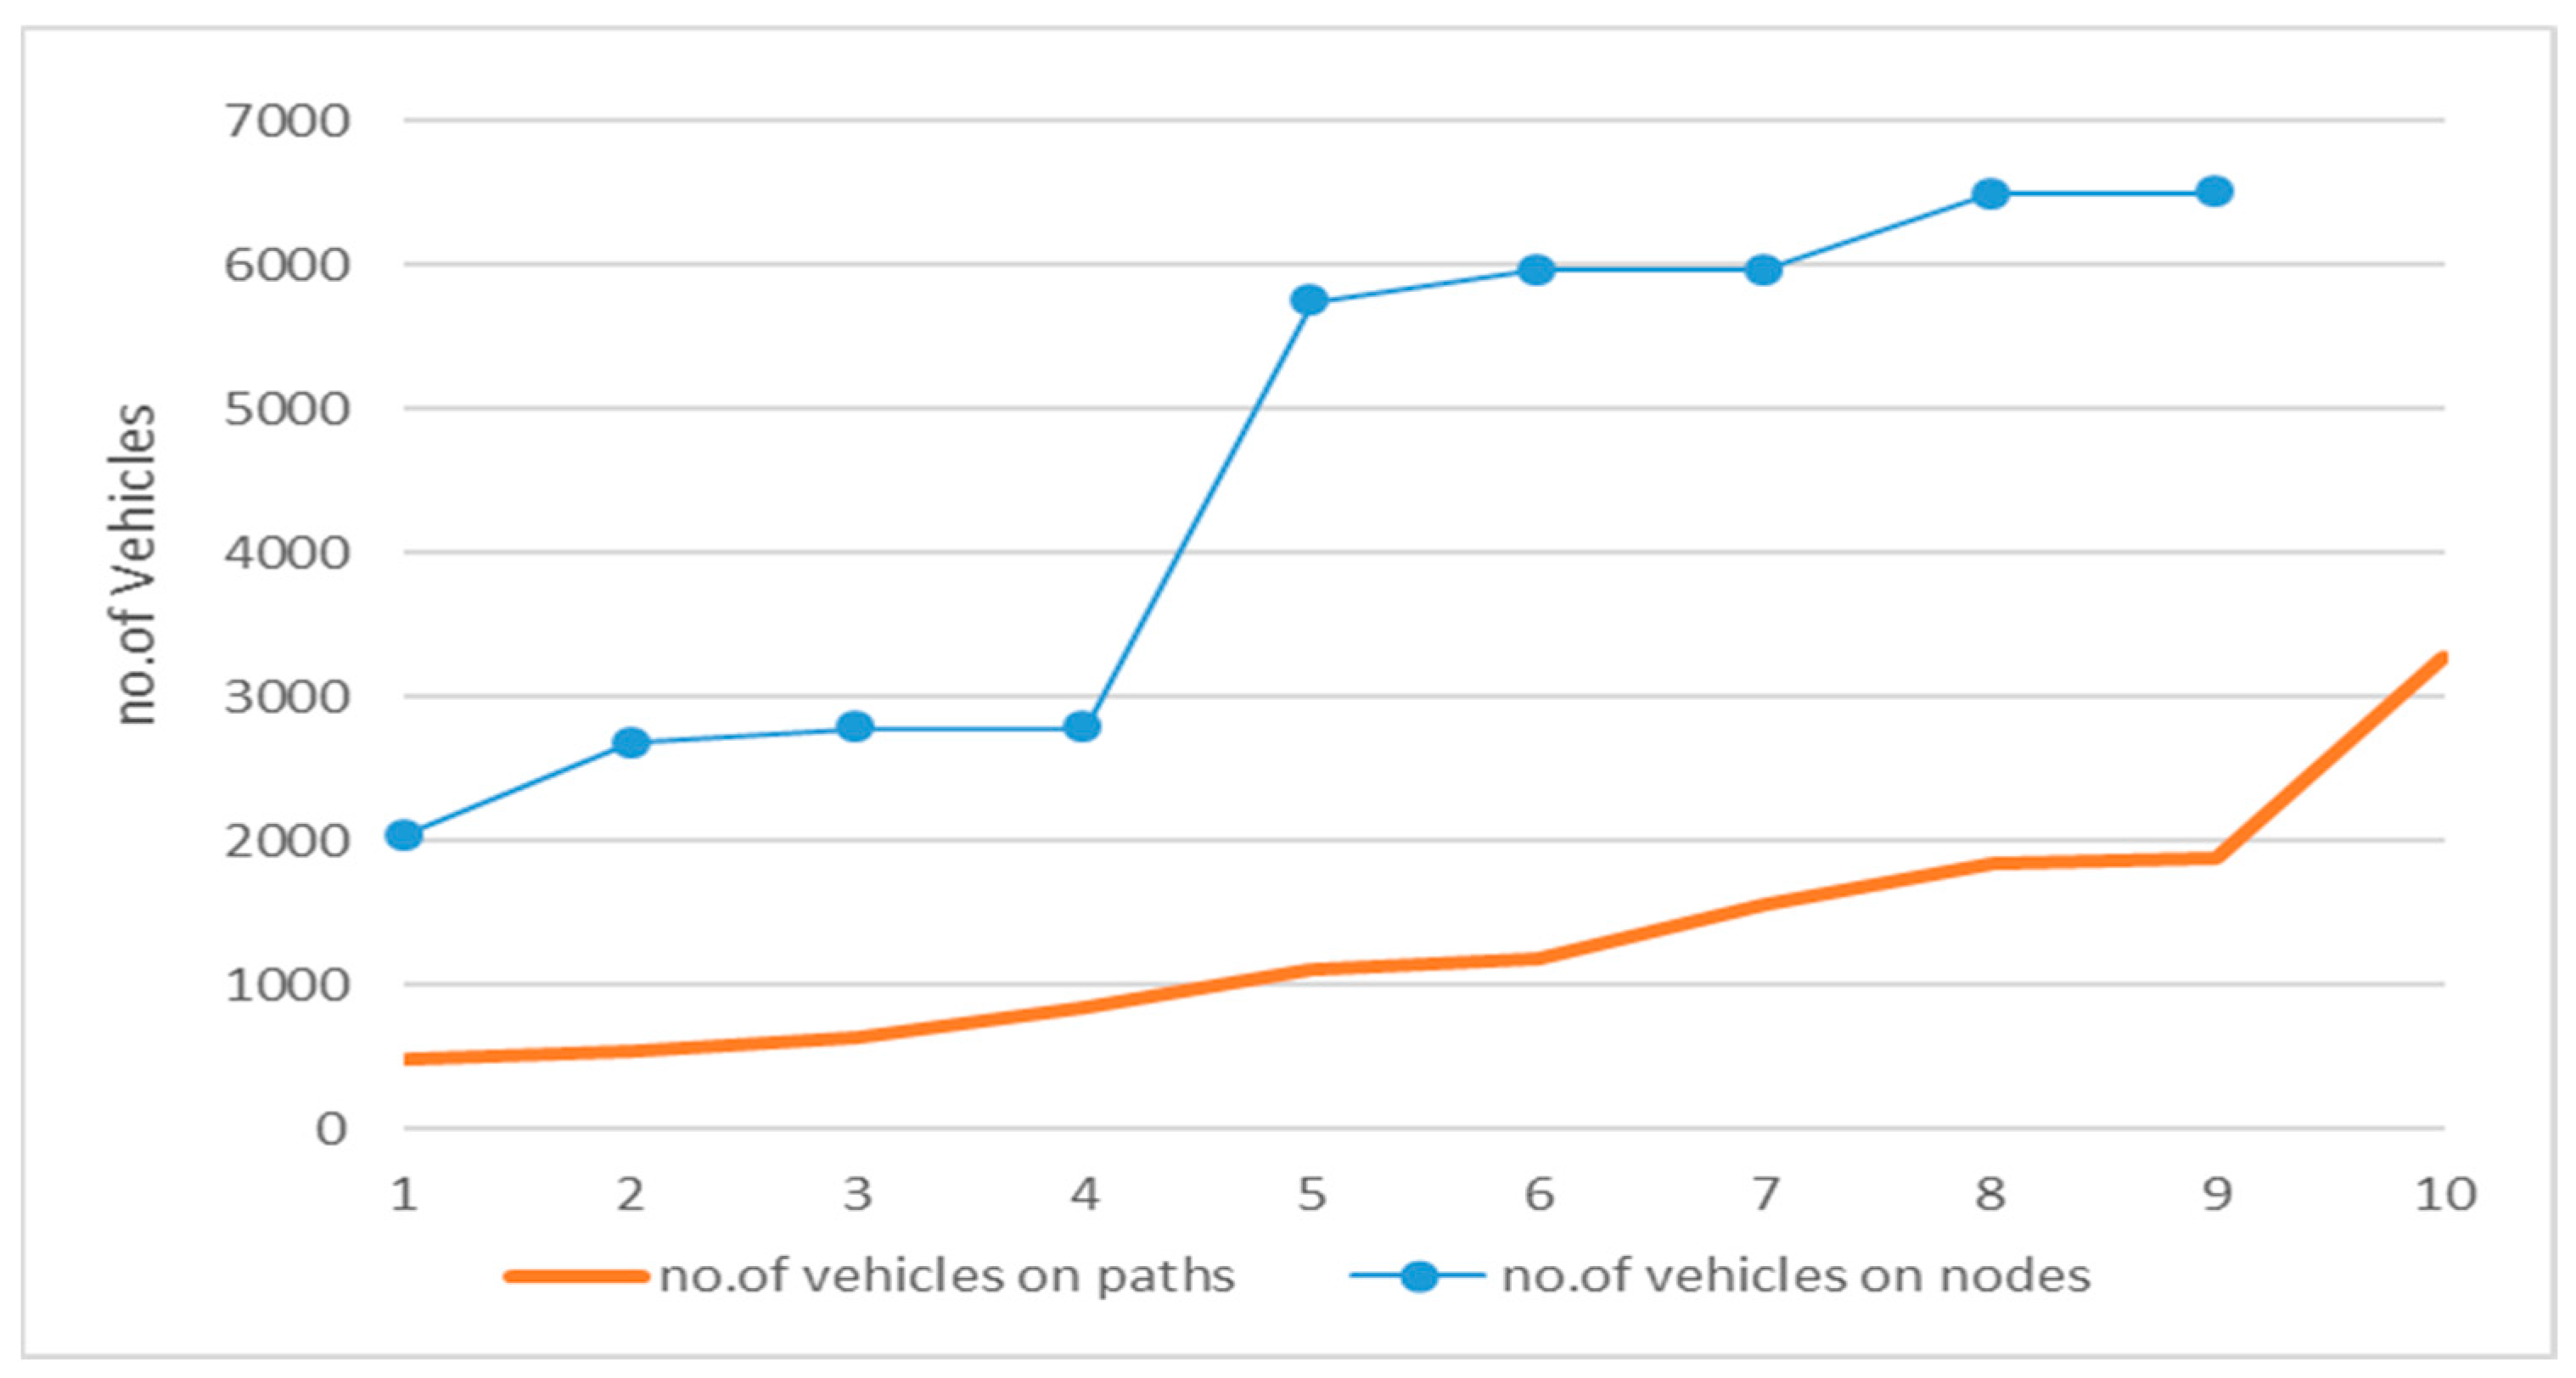
As a result, routes that are not necessarily the shortest are often used to reach destinations due to variations in the assumed vehicle range of 60 km—examples include paths like AE, AD, AC, etc. By applying the Flow Capturing model analysis, it becomes clear that, beyond the 10 identified routes, there are 9 critical nodes (1, 2, 5, 6, 8, 12, 13, 14, and 15) that experience significant traffic flow, as summarized in Table 6. Based on this analysis, the optimal number of charging stations for the area is determined to be 9, effectively serving both the 10 paths and the 9 key nodes. The data also shows fluctuations in vehicle numbers across different paths and nodes, with node ‘E’ being the most congested, experiencing a difference of approximately 6496 vehicles. Nodes collect vehicle flows from all of the shortest allowed paths that pass through them, as seen in Figure 6. Those positioned along several high-volume routes accumulate higher frequencies, making them strong candidates for optimal charging station placement.
Figure 7 illustrates these variations, highlighting the differences in vehicle coverage between paths and nodes. This discrepancy emphasizes the importance of carefully selecting node locations based on the number of vehicles they capture to ensure the most efficient placement of charging stations.
This insight simplifies the decision-making process for selecting optimal charging station locations. However, the analysis does not account for the actual number of vehicles arriving, as incorporating factors such as charging times and waiting times could yield different results.

4. Conclusions

This study is the first on Baghdad’s Al-Karkh side to optimize charging station placement by analyzing the Flow Capturing Location Model (FCLM) and the Flow Refueling Location Model (FRLM). While earlier approaches offered insights, they overlooked the investment needed to build an appropriate number of stations to meet capacity needs—factors that are critical for handling charging demand efficiently. To fill this gap, this study develops an optimal strategy for selecting station locations based on city data and traffic patterns. Three MATLAB-implemented methods are proposed: one prioritizing paths, one focusing on nodes, and one integrating vehicle recharging demand. The approach combines the Flow Capturing Location Model (FCLM) and the Flow Refueling Location Model (FRLM) using two distinct MATLAB-based designs.
The first phase prioritizes nodes with the highest flow capture, then progresses to those with lower values. This analysis identified 11 optimal charging station sites in its regional analysis, but due to the need to build no more than five stations, the selection was refined to five key nodes: 11, 6, 1, 14, and 9. Should the broader set of optimal facility locations be built, it would include nodes 1, 2, 5, 6, 8, 12, 13, 14, and 15, as shown in Table 10. This approach balances coverage efficiency with infrastructure optimization.
The second phase identifies the shortest routes between origin and destination points, considering an electric vehicle range that was assumed to be (60 km) and traffic flow. The analysis found 20 possible paths, but 10 were excluded due to distance limits. Table 8 and Table 9 show the feasible paths with strategically placed nodes. Charging stations are unevenly distributed, focusing on high-traffic areas to maximize use and minimize detours, while keeping the network flexible for future expansion.
However, this analysis overlooks the number of arriving vehicles, which could affect results when charging and waiting times are considered. A gap also exists between the city’s capacity for station development and projected investments, mainly due to limited data on the required charging ports. Since EVs take about 30 min to recharge, optimizing station locations requires us to factor in both charging and waiting times. Further research is needed to refine the method and create a more practical plan for urban EV infrastructure.

Author Contributions

Conceptualization, S.H.M.A.; Methodology, S.H.M.A.; Software, S.H.M.A.; Formal analysis, S.H.M.A.; Resources, S.H.M.A.; Data curation, S.H.M.A.; Writing—original draft, S.H.M.A.; Supervision, H.O. All authors have read and agreed to the published version of the manuscript.

Funding

This research received no external funding.

Institutional Review Board Statement

Not applicable.

Informed Consent Statement

Not applicable.

Data Availability Statement

The original contributions presented in this study are included in the article. Further inquiries can be directed to the corresponding author.

Conflicts of Interest

The authors declare no conflicts of interest.

References

  1. Raihan, A.; Rashid, M.; Voumik, L.C.; Akter, S.; Esquivias, M.A. The dynamic impacts of economic growth, financial globalization, fossil fuel, renewable energy, and urbanization on load capacity factor in Mexico. Sustainability 2023, 15, 13462. [Google Scholar] [CrossRef]
  2. Yang, Z.; Zhang, S.; Liu, J.; Sun, H. Network of tourism–industrial complex in cities: Typologies and implications through a critical literature review. Int. J. Environ. Res. Public Health 2022, 19, 4934. [Google Scholar] [CrossRef] [PubMed]
  3. Sørensen, Å.L.; Lindberg, K.B.; Sartori, I.; Andresen, I. Analysis of residential EV energy flexibility potential based on real-world charging reports and smart meter data. Energy Build. 2021, 241, 110923. [Google Scholar] [CrossRef]
  4. Davidov, S.; Pantoš, M. Optimization model for charging infrastructure planning with electric power system reliability check. Energy 2019, 166, 886–894. [Google Scholar] [CrossRef]
  5. Hamwi, H.; Rushby, T.; Mahdy, M.; Bahaj, A.S. Effects of high ambient temperature on electric vehicle efficiency and range: Case study of Kuwait. Energies 2022, 15, 3178. [Google Scholar] [CrossRef]
  6. Shen, Z.-J.M.; Feng, B.; Mao, C.; Ran, L. Optimization models for electric vehicle service operations: A literature review. Transp. Res. Part B Methodol. 2019, 128, 462–477. [Google Scholar] [CrossRef]
  7. Yuvaraj, T.; Devabalaji, R.K.; Kumar, J.A.; Thanikanti, S.B.; Nwulu, N.I. A comprehensive review and analysis of the allocation of electric vehicle charging stations in distribution networks. IEEE Access 2024, 12, 5404–5461. [Google Scholar] [CrossRef]
  8. Lin, W.; Hua, G. The flow capturing location model and algorithm of electric vehicle charging stations. In Proceedings of the 2015 International Conference on Logistics, Informatics and Service Sciences (LISS), Barcelona, Spain, 27–29 July 2015; IEEE: Piscataway, NJ, USA, 2015; pp. 1–6. [Google Scholar]
  9. Hopkins, E.; Potoglou, D.; Orford, S.; Cipcigan, L. Can the equitable roll out of electric vehicle charging infrastructure be achieved? Renew. Sustain. Energy Rev. 2023, 182, 113398. [Google Scholar] [CrossRef]
  10. Capar, I.; Kuby, M.; Leon, V.J.; Tsai, Y.-J. An arc cover–path-cover formulation and strategic analysis of alternative-fuel station locations. Eur. J. Oper. Res. 2013, 227, 142–151. [Google Scholar] [CrossRef]
  11. Daşcıoğlu, B.G.; Tuzkaya, G.; Kılıç, H.S. A model for determining the locations of electric vehicles’ charging stations in Istanbul. Pamukkale Üniver. Mühendis. Bilim. Derg. 2019, 25, 1056–1061. [Google Scholar] [CrossRef]
  12. Hodgson, M.J. A flow-capturing location-allocation model. Geogr. Anal. 1990, 22, 270–279. [Google Scholar] [CrossRef]
  13. Xiao, S.; Lei, X.; Huang, T.; Wang, X. Coordinated planning for fast charging stations and distribution networks based on an improved flow capture location model. CSEE J. Power Energy Syst. 2022, 9, 1505–1516. [Google Scholar] [CrossRef]
  14. Saksuriya, P.; Likasiri, C. Balancing Staff Finishing Times vs. Minimizing Total Travel Distance in Home Healthcare Scheduling. Appl. Sci. 2024, 14, 7381. [Google Scholar] [CrossRef]
  15. Sugishita, N.; Carvalho, M.; Atallah, R. The Strength of Fuel Refueling Location Problem Formulations. arXiv 2024, arXiv:2409.04554. [Google Scholar] [CrossRef]
  16. Abbaas, O.; Ventura, J.A. An edge scanning method for the continuous deviation-flow refueling station location problem on a general network. Networks 2022, 79, 264–291. [Google Scholar] [CrossRef]
  17. Isaac, N.; Saha, A.K. A review of the optimization strategies and methods used to locate hydrogen fuel refueling stations. Energies 2023, 16, 2171. [Google Scholar] [CrossRef]
  18. Hernández, B.; Alkayas, A.; Azar, E.; Mayyas, A.T. Mathematical model for the placement of hydrogen refueling stations to support future fuel cell trucks. IEEE Access 2021, 9, 148118–148131. [Google Scholar] [CrossRef]
  19. Lin, C.-C.; Lin, C.-C. The p-center flow-refueling facility location problem. Transp. Res. Part B Methodol. 2018, 118, 124–142. [Google Scholar] [CrossRef]
  20. Scheiper, B. Strategic Planning of Charging Infrastructure for Battery Electric Vehicles Considering Interactions with the Energy Sector. Ph.D. Dissertation, Rheinisch-Westfälische Technische Hochschule Aachen, Aachen, Germany, 2021. [Google Scholar]
  21. Kchaou-Boujelben, M. Charging station location problem: A comprehensive review on models and solution approaches. Transp. Res. Part C Emerg. Technol. 2021, 132, 103376. [Google Scholar] [CrossRef]
  22. Spencer, R.L.; Ware, M. Introduction to MATLAB; Brigham Young University: Provo, UT, USA, 2008; Volume 7, p. 2008. [Google Scholar]
  23. Capar, I.; Kuby, M. An efficient formulation of the flow refueling location model for alternative-fuel stations. IIE Trans. 2012, 44, 622–636. [Google Scholar] [CrossRef]
  24. Hodgson, M.J.; Rosing, K.E.; Leontien, A.; Storrier, G. Applying the flow-capturing location-allocation model to an authentic network: Edmonton, Canada. Eur. J. Oper. Res. 1996, 90, 427–443. [Google Scholar] [CrossRef]
  25. Hwang, S.W.; Kweon, S.J.; Ventura, J.A. An alternative fuel refueling station location model considering detour traffic flows on a highway road system. J. Adv. Transp. 2020, 2020, 9473831. [Google Scholar] [CrossRef]
  26. Park, T. A heuristic approach to the location of the refueling stations for the alternative fuel vehicles. ICIC Express Lett. Part B Appl. 2017, 8, 519–524. [Google Scholar]
  27. Kuby, M.; Lim, S. The flow-refueling location problem for alternative-fuel vehicles. Socio-Econ. Plan. Sci. 2005, 39, 125–145. [Google Scholar] [CrossRef]
  28. Hodgson, M.J. Developments in flow-based location-allocation models. In Econometric Advances in Spatial Modelling and Methodology: Essays in Honour of Jean Paelinck; Springer: Boston, MA, USA, 1998; pp. 119–132. [Google Scholar]
  29. Tong, D.; Murray, A.T. Location analysis: Developments on the horizon. In Regional Research Frontiers-Vol. 2: Methodological Advances, Regional Systems Modeling and Open Sciences; Springer: Cham, Switzerland, 2017; pp. 193–208. [Google Scholar]
  30. Mohamedmeki, M.Z.; Al-Mumaiz, M. Improving the transportation system in Baghdad city. In IOP Conference Series: Materials Science and Engineering, Proceeding of the 4th International Conference on Engineering Sciences (ICES 2020), Kerbala, Iraq, 5–6 December 2020; IOP Publishing: Bristol, UK, 2021; Volume 1067, p. 012087. [Google Scholar]
  31. Ali, S.M.; Al-hemiary, E. Baghdad Vehicle Traffic Congestion: Case Study. Avrupa Bilim Teknol. Derg. 2023, 48, 34–39. [Google Scholar]
  32. Alkaissi, Z.A. Capacity Estimation of Urban Road in Baghdad City: A Case Study of Palestine Arterial Road. ARPN J. Eng. Appl. Sci. 2018, 13, 8456–8484. [Google Scholar]
  33. Abdulkareem, M.; Mohammed, A.; Khudair, M. Evaluation and improvement of traffic operation for al-furat signalized intersection in Baghdad city. Int. J. Eng. Res. Ind. Appl. 2016, 9, 15–25. [Google Scholar]
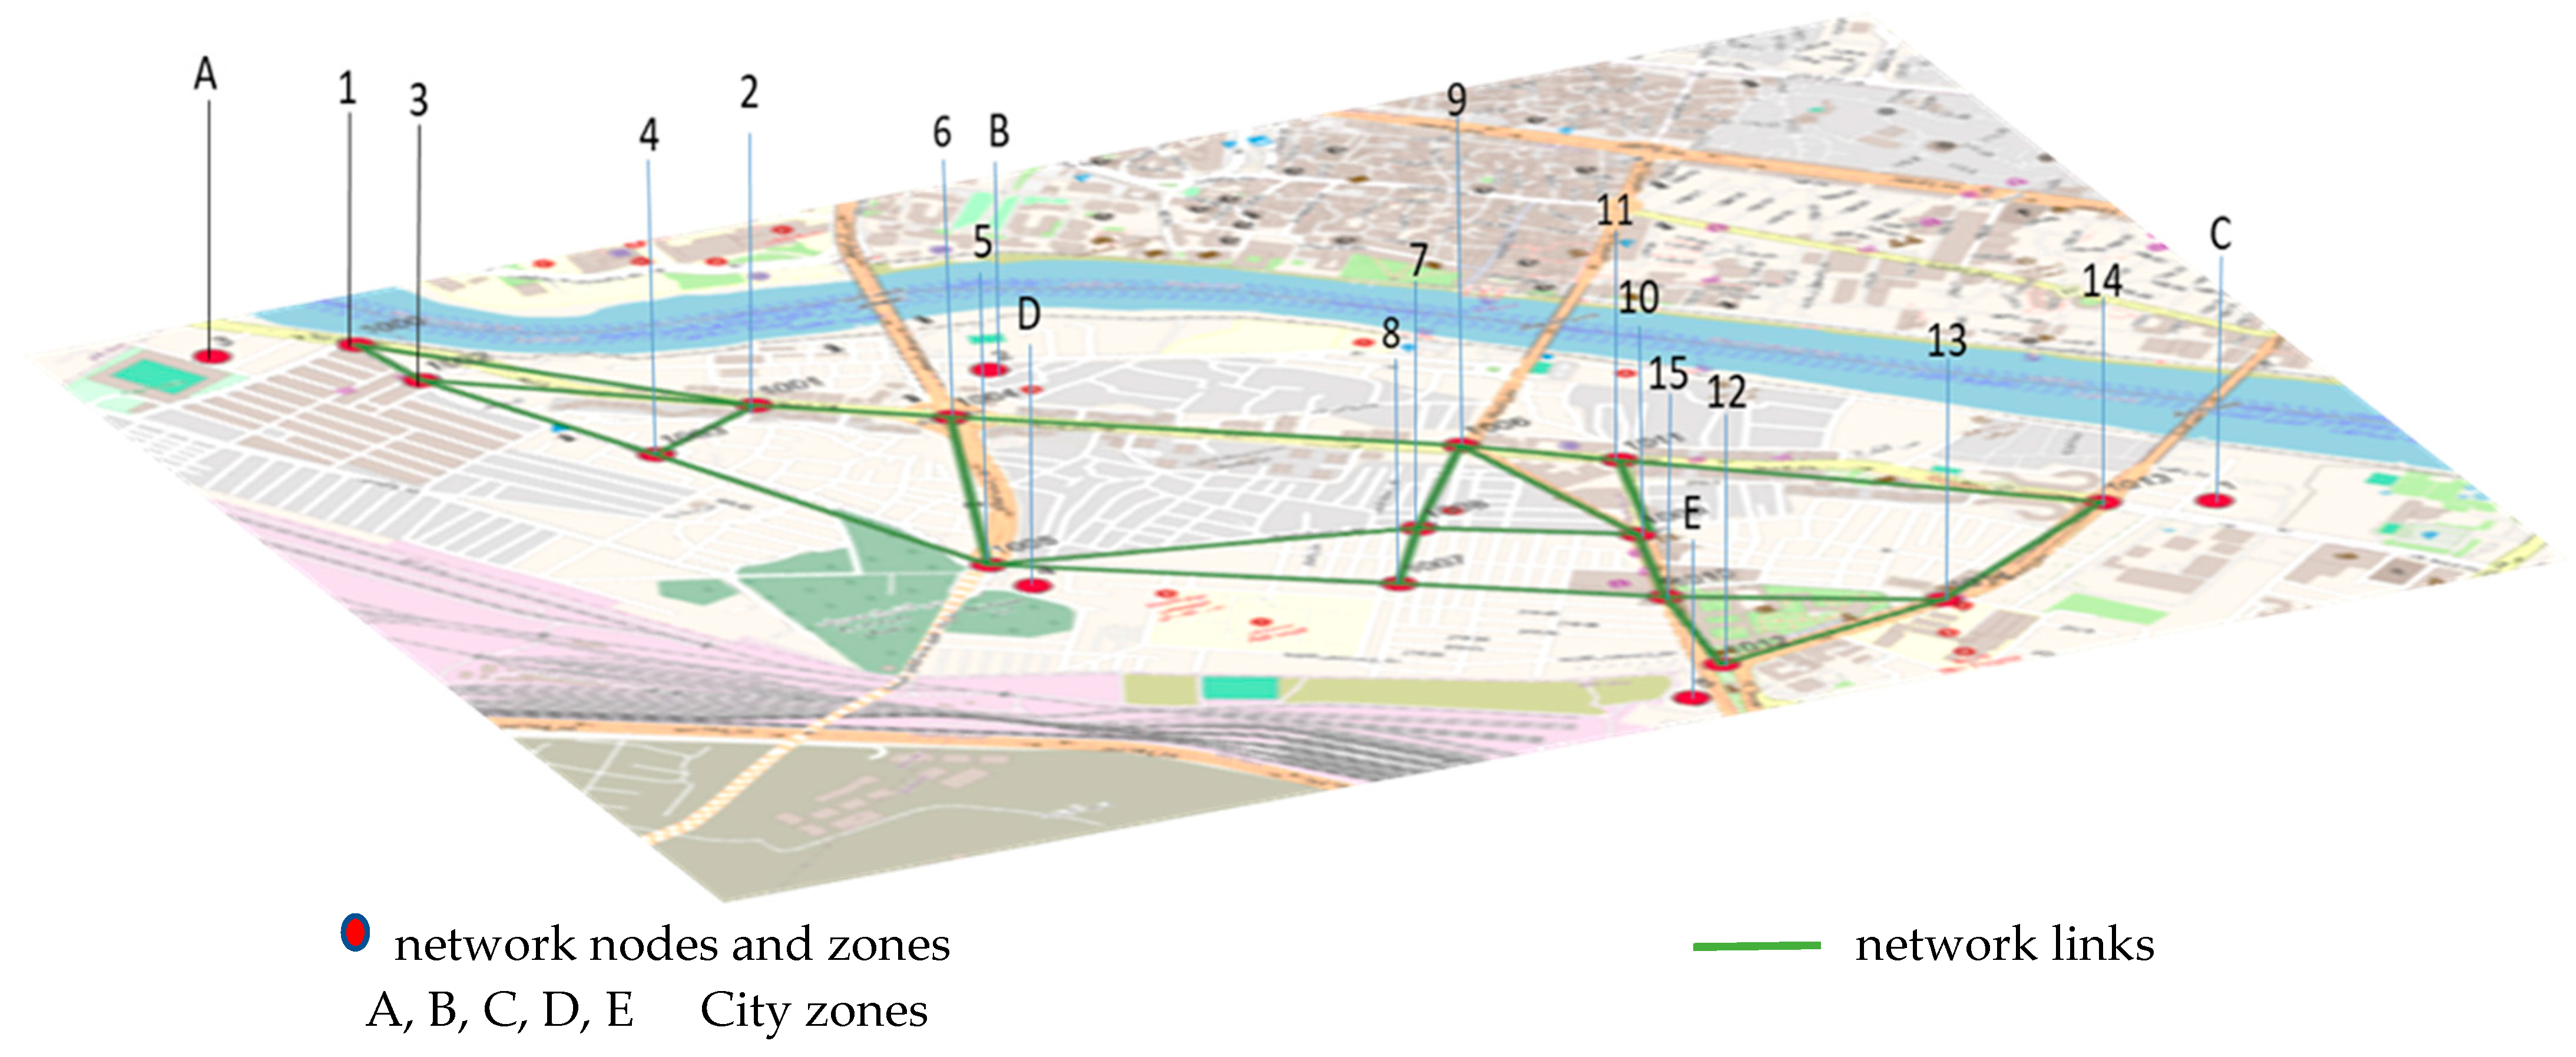
Figure 1. Transportation network (the Haifa, Juafir, and Allawi City Road Network in Baghdad).
Sustainability 17 10562 g001
Figure 2. The MATLAB interface presents a structured design layout that enables visualization and management of the input parameters.
Sustainability 17 10562 g002
Figure 3. The MATLAB interface presents a structured design layout that displays the input parameters after processing, providing a clear and organized visualization of the data used in the analysis.
Sustainability 17 10562 g003
Figure 4. The distribution of electric stations is shown based on the capturing model.
Sustainability 17 10562 g004
Figure 5. The user interface and command window, displaying the final results of the analysis, including optimal paths, facility locations, and flow distributions.
Sustainability 17 10562 g005
Figure 6. Paths for different cases.
Sustainability 17 10562 g006
Figure 7. Relationship Between the Number of Vehicles on Paths and Nodes.
Sustainability 17 10562 g007
Table 1. Model mathematical equation.
ModelEquationMathematical FormulationDetailed ExplanationEV Interpretation
FCLM (Flow Capture Location Model)(1) M a x   Z 1 = q Q   f q   y q Objective function: maximize the total weighted flow covered by stations. Each flow Z has a weight fq (e.g., number of vehicles).Ensures that the placement of stations captures the maximum traffic flow of EVs on major roads.
(2) s . t . i N q   x i y q q Q Coverage constraint: a flow Z is covered if there is at least one station along its candidate path Nq.An EV trip is considered feasible if at least one charging station lies on the route.
(3) i N q   x i = p Station budget: exactly P stations must be located among all candidate sites Nq.Limits the number of charging stations due to budget or infrastructure constraints.
(4) x i ,   y q 0 , 1 q Q ,   i N Binary variables: xk = 1
if a station is built at site i;
yq = 1 if flow k is covered.
Indicates yes/no decision: whether to build a station or whether a trip is covered.
FRLM (Flow Refueling Location Model)(5) M a x   Z 1 = q Q   f q   y q Objective: maximize the total demand (flows) that can be fully refueled across complete routes. Each route Z has weight fq.Focuses on ensuring entire trips (not just parts) are possible for EVs.
(6) s .   t .   h H b q h u h y q q Q Feasibility constraint: for each route q, and for each sub segment h, there must be at least one station in the feasible interval yq.Guarantees EVs can refuel/charge within driving range limits on all trip segments.
(7) a h i ,   x i u h ,   h H ,   İ a h i = 1 A facility combination h is “open” (uh = 1) only if all its required stations are sited (xi = 1)ahi: equals 1 if facility i belongs to combination h.
(8) i X i = p Station budget: at most, p stations can be built.Models real-world financial/policy limitations in charging station rollout.
(9) X i ,   u h ,   y q 0 , 1 i ,   h ,   q , Binary variables: xi = 1 if a station is built at site i; yq = 1 if route p is fully covered.Ensures a binary outcome: a route is either feasible for EVs or not.
Table 2. Model symbol.
SymbolDefinition
ZObjective function: total flow volume captured at least once
pNumber of facilities to be located
QSet of all O–D pairs
HSet of all potential facility combinations
Nqset of potential facility locations capable of capturing q
qIndex of origin–destination (O–D) pairs (and their shortest paths)
hIndex of facility combinations
iIndex of potential facility locations
f₍q₎Flow volume on the shortest path between O–D pair q
b₍qh₎Coefficient = 1 if facility combination h can refuel O–D pair q; 0 otherwise
a₍hi₎Coefficient = 1 if facility iii is included in combination h; 0 otherwise
y₍q₎Binary variable = 1 if flow fq is captured, 0 otherwise
u₍h₎Binary variable = 1 if all facilities in combination h are open, 0 otherwise
x₍i₎Binary variable = 1 if a facility is located at site k, 0 otherwise
Table 3. Distances between connected nodes.
First Node (Origin)ABDEC113425111514
Second Node (destination)165121423456691011
Mileageconnectorconnectorconnectorconnectorconnector591561612756222370
First Node (origin)6997881081215111412
Second Node (destination)97105577151513101313
Mileage72304062572030372540254239
Table 4. Planning parameters of algorithm programming.
ParameterValueParameterValue
Number of nodes15Distance between O–DTable 1
Number of cities5Connection between every city with nodesTable 1
Sufficient time to charge in min30Traffic flow between each city23,702
Maximum time for each vehicle in min.60Number of alternative stations5
Number of chargers in each station5Fixed vehicle range assumed60
Table 5. Partial algorithm output—nodes with alternative station availability.
NoFifth Panel—Mark the Station Exits in Each Node
1Nodeic = Nodeic + 1; % (3 Times in our Example, A, B and C)
2    for idm = 1: NONode
3        if(id~ = idm)      % JUST when ‘A’ != ‘A’ and ‘B’ != ‘B’ and so means (1 != 1) and(2 != 2) and so
4          if(isempty(str2num(G.Nodes.Name{idm})))     % JUST if (id) is CHAR ‘A’ ‘B’ ‘C’
5                % just for [6 Times] in our Example (3 cites * tow way)
6                [P,d] = shortestpath(G,G.Nodes.Name{id},G.Nodes.Name{idm});
7                NewP = “”;
8                namesToInteger= [];
9                for i = 1: size(P, 2)
10                   NewP = strcat(NewP, string (P(i)));
11                End
12                TZN= [TZN; NewP];
13                for i = 1: size(P,2)     % for each [P] covert it to integer
14                   if i == 1
15                      namesToInteger(i) = id;
16                   elseif i == size(P,2)
                      namesToInteger(i) = idm;
                   Else
                     if  isletter(string(P(i)))
                          [Ro Col]= find (CityNodeLink == string(P(i)));
                           namesToInteger(i) = CityNodeLink(Ro, 2);
                     Else
             .
           .
           .
                  .
                ss = 0;
                comb = [];
                comb2 = [];
                for k =1: size(nam,1)
                   h = nam(k, :);
                   if A1(h(1,1), h(1,2)) >= 1
  if (ps (1) == char(CarsInPath(k,1)))   && (ps(end) == char(CarsInPath(k,2)))
         NoCAR= CarsInPath(k,3);         % TO BRING NO OF CARS FOR ALL PATHES
         kk = 0;
         for j = 1: length(ps)
             for m = 1: length(NodeName)
                if (ps(j) == char(NodeName(m)))
1622         End
Table 6. Potential and selected station nodes for alternative fueling locations.
Selected Stations Potential Stations
No12345No123456789
Suggestion of optimal node locations1161149Nodes where stations should be located1256812131415
Table 7. The first method presents the results of the analysis, including the ranked sequence of nodes based on vehicle traffic volume and their suitability for alternative fuel station placement.
No1234567891011
Nodes that are best for station-location11651491213284
No. of vehicles15,98615,23310,67710,0179551762974425780540847752034
Table 8. The second method presents results based on the Flow Refueling Location Model (FRLM).
CasePathNo. VehiclesCasePathNo. Vehicles
1E → C
12-13-14
[E13C]
327811E → B
12-15-10-9-6
[E15109B]
[996]
2C → B
14-11-9-6
[C119B]
[1995]12A → D
1-3-4-5
[A34D]
[925]
3B → C
6-9-11-14
[B911C]
[1873]13B → D
6-5
[BD]
[856]
4D → B
5-6
[DB]
[1833]14B → A
6-2-1
[B2A]
[845]
5C → E
14-13-12
[C13E]
[1558]15C → A
14-11-9-6-2-1
[C119B2A
[736]
6D → A
5-4-3-1
[D43A]
[1234]16E → A
12-10-9-6-2-1
[E15109B2A]
[725]
7A → B
1-2-6
[A2B]
[1189]17A → E
1-2-6-9-10-15-12
[A2B91015E]
[710]
8D → E
5-8-15-12
[D815E]
[1114]18C → D
14-13-15-8-5
[C13158D]
[632]
9B → E
6-9-10-15-12
[B91015E]
[1090]19E → D
12-15-8-5
[E158D]
[546]
10A → C
1-2-6-9-11-14
[A2B911C]
[1078]20D → C
5-8-15-13-14
[D81513C]
[489]
Table 9. Paths that are NOT allowed for vehicles due to exceeding the assumed maximum operational range.
No.12345678910
The pathA34DA2B91015EA2B911CD43AB91015EB911CE15109B2AE15109BC119B2AC119B
Table 10. Cases with paths for vehicles based on range constraints and node connectivity.
CaseO-DNo of VehiclesStation
p
NodeNo of VehiclesFrequencyFrequency %
1A2B11892A1203425%
B2A8452267827%
2BD18732B65740414%
DB1833D56487616%
3D81513C48948278127%
C13158D63215278127%
4D815E11141E126496616%
E158D546135957415%
5E13C32780C145957415%
C13E1558total40,911 100%
Disclaimer/Publisher’s Note: The statements, opinions and data contained in all publications are solely those of the individual author(s) and contributor(s) and not of MDPI and/or the editor(s). MDPI and/or the editor(s) disclaim responsibility for any injury to people or property resulting from any ideas, methods, instructions or products referred to in the content.