Article

Evaluation of Indoor Thermal Environment and Air Quality in Stone Cave Dwellings in Northern Shanxi, China

College of Architecture and Art, Taiyuan University of Technology, Taiyuan 030024, China
*
Author to whom correspondence should be addressed.
Sustainability 2025, 17(23), 10563; https://doi.org/10.3390/su172310563
Submission received: 13 October 2025 / Revised: 16 November 2025 / Accepted: 22 November 2025 / Published: 25 November 2025

Abstract

Traditional stone cave dwellings in northern Shanxi exhibit distinct differences from conventional cave dwellings in terms of form and material, characterized by their freestanding stone-built structures that possess unique value. In the context of rapid urbanization, these dwellings encounter issues related to decreasing quantities and a lack of comprehensive systematic research. This research utilizes a mixed objective–subjective methodology to assess the indoor environment of the stone cave dwellings in Dongwa Village, Shuozhou City. Thermal comfort is evaluated using the PMV-PPD and TSV models, whereas air quality is assessed through gray correlation analysis. Results indicate: (1) The thermal inertia of stone cave dwellings’ envelopes significantly surpasses that of brick structures. However, their exterior wall and roof thermal conductance coefficients exceed national standard limits, respectively, by 4 times and 1.7 times; (2) The PMV thermal neutral temperature (21.32 °C) was notably higher than the TSV thermal neutral temperature (10.96 °C), suggesting that residents have developed cold adaptation. The thermal preference temperature (12.75 °C) exceeded the TSV value, reflecting strong resident demand for improvements; (3) Winter pollutant exceedance rates were markedly higher than those in summer, with air quality classified as experiencing “heavy pollution” levels. Residents reported a high level of subjective satisfaction, suggesting the presence of a cognitive bias. This study aims to reveal environmental issues in traditional local stone cave dwellings under modern residential demands, providing references for sustainable improvements in rural building environments.

1. Introduction

Rural regions in northern China predominantly utilize decentralized heating methods, including heated kangs, firewalls, and stoves. The energy consumption is high, but the heating effect is inadequate, resulting in a harsh indoor thermal environment during winter that fails to meet basic living requirements [1]. Inadequate fuel combustion significantly impacts air quality and poses health risks to residents, particularly the elderly, who are more susceptible to respiratory diseases and allergic reactions [2].
As a quintessential form of traditional northern dwellings, cave dwellings hold significant potential for rural revitalization and cultural heritage preservation [3]. However, existing research has mainly focused on cliff-side cave dwellings in northwestern China, with limited studies on independent stone cave dwellings [4]. Under varying climatic conditions [5,6] and architectural types [7,8], residents’ subjective perceptions of comfort can differ substantially. Consequently, it is essential to investigate indoor environmental conditions across different regions and cave-dwelling types.
Independent stone cave dwellings, characterized by their freestanding structure and stone masonry, differ markedly from traditional cave dwellings in form and material. They represent a distinctive traditional residential type in northern Shanxi. Affected by urbanization and rural population outflow, the number of such traditional dwellings continues to decline without receiving adequate attention or protection. Currently, systematic investigations and research on the indoor thermal environment and air quality of such dwellings remain scarce.
In recent years, with the in-depth implementation of sustainable development concepts, China has shifted its policy on traditional residential preservation from “demolishing old structures to build new ones” to “optimizing through preservation”. Meanwhile, the advancement of rural living environment improvement, beautiful countryside initiatives, and energy transition strategies has created a favorable policy context for the green renewal of traditional dwellings.
Against this backdrop, this article selects the independent stone cave dwelling located in Dongwa Village, Shuozhou City, as the subject of study. The main objectives of this study are as follows:
  • Measure and analyze the heat transfer coefficient and thermal inertia index of building envelopes to determine the thermal performance of residential buildings and the daily fluctuation characteristics of indoor temperature and humidity.
  • Combine objective and subjective surveys with the PMV and TSV models to evaluate indoor thermal comfort levels, calculate thermal neutral temperatures and thermal preference temperatures, and analyze residents’ thermal adaptation capabilities and thermal environment needs under cold conditions.
  • Continuously monitor the dynamic changes in indoor pollutant concentrations during winter and summer to assess pollution levels and exceedance rates, systematically evaluate air quality grades, and reveal discrepancies between residents’ subjective perceptions and objective pollution levels.
This article presents research findings that offer a scientific foundation for enhancing stone cave dwelling design and improving indoor environments, while also serving as a valuable reference for the study of similar local architecture.

2. Literature Review

Driven by the dual impetus of rapid global urbanization and the sustainable development agenda, green development has become a core requirement for urban and rural construction [9]. As important carriers of regional characteristics and cultural heritage, traditional dwellings hold both academic value and practical significance for indoor environmental research.
The indoor environment primarily encompasses two components: thermal environments and air quality. The indoor thermal environment encompasses several environmental factors influencing the human body’s perception of warmth and coldness, including temperature, relative humidity, airflow velocity, and radiative heat transfer [10]. Currently, scholars at home and abroad have conducted in-depth research on the indoor thermal environment and thermal comfort of traditional dwellings in different climatic regions [11,12,13]. Studies indicate that the right temperature and relative humidity levels contribute to bodily comfort [14], whereas inadequate ventilation negatively impacts indoor air quality and relative humidity levels [15]. Furthermore, the structure of the building envelope directly influences the indoor thermal environment [16]. Portuguese granite dwellings achieve effective thermal stability through 80 cm-thick walls [17]. Zhang L et al. investigated the thick walls of traditional earthen dwellings in Turpan, revealing their effective thermal inertia, which contributes to the stabilization of indoor temperatures [18]. Regarding the evaluation of wall thermal performance, a relatively systematic research methodology has been established. Scholars mainly adopt quantitative methods, such as using internal infrared thermal imaging to accurately determine wall U-values [19]. Eduardo R et al. applied the simplified hot-box-heat-flux-meter method to analyze the thermal performance of heritage building facades [20], while Luca E estimated building heat transfer coefficients via non-contact methods [21].
It is widely acknowledged that a comfortable indoor thermal environment is a key factor in residential energy conservation and sustainable development, as well as a crucial element in people’s pursuit of the built environment. Therefore, providing a comfortable thermal environment for residential buildings is of great significance [22]. To improve building thermal comfort performance, scholars at home and abroad have conducted in-depth research from multiple perspectives. Federica R et al. adopted the aNSGA-II algorithm to carry out multi-objective optimization of building investment costs, energy demands, and operational emissions [23]. Xu J explored the application potential of radiative cooling materials in regulating indoor thermal environments [24]. Rui W combined XGBoost with genetic algorithms to propose a rapid intelligent optimization method suitable for thermal comfort in Beijing’s traditional courtyard houses [25].
Furthermore, indoor thermal comfort, as a core indicator for evaluating indoor thermal environments, has become a focal point of current research [26]. It directly reflects occupants’ subjective comfort perceptions within architectural spaces and serves as a critical consideration in building environment design. Thermal comfort is not only closely related to human health and work efficiency, but also significantly affects occupants’ behavioral performance [27]. Currently, research in this field mainly uses the PMV-PPD index as an evaluation metric [28]. For example, Wen X et al. analyzed and evaluated indoor thermal comfort levels under different heating systems using the PMV-PPD framework [29]. However, numerous field studies have shown that PMV predictions often deviate from actual thermal sensation votes [30]. Therefore, this study will comprehensively adopt both PMV and TSV evaluation methods to assess indoor thermal comfort more thoroughly and accurately.
Indoor air quality refers to the concentration of various components present in indoor air, while indoor air pollution indicates the concentration of different pollutant gases present in that air [10]. Research indicates that indoor air quality is affected by multiple factors, including the lifestyle habits of residents and their heating methods [31]. Ding Y’s research on rural architecture in Chongqing [32] and Ferhat K’s study on Kazakh dwellings [33] both confirm that residents’ living habits are the primary cause of indoor air pollution. Lin Liu, Ilie, A. M. C, and other scholars found that localized heating methods are associated with poor indoor air quality, and recommended targeted improvement measures for the heating season [34,35]. The influence of various heating methods on indoor air quality differs, with biomass boiler heating [36,37] and solar floor radiation heating [38] demonstrating effectiveness in enhancing indoor air quality. Many residents currently possess a limited understanding of indoor pollutants. Zhang M’s assessment of indoor air quality in rural residential areas utilizing various heating methods in northern Shanxi, China, revealed that a majority of rural residents held excessively optimistic subjective assessments of indoor air quality concerning coal-fired boiler radiator heating and heated kang heating [39].
Furthermore, a unified comprehensive evaluation method for indoor air quality is presently lacking. Methods frequently employed encompass gray relational analysis [40] and fuzzy comprehensive evaluation [41]. Wang Z et al. assessed indoor air quality in rural residences in Harbin, China, employing gray relational analysis and fuzzy comprehensive evaluation, concluding that gray relational analysis demonstrated significantly higher resolution than fuzzy comprehensive evaluation [42]. Therefore, this study employed gray relational analysis to evaluate the research subjects.

3. Materials and Methods

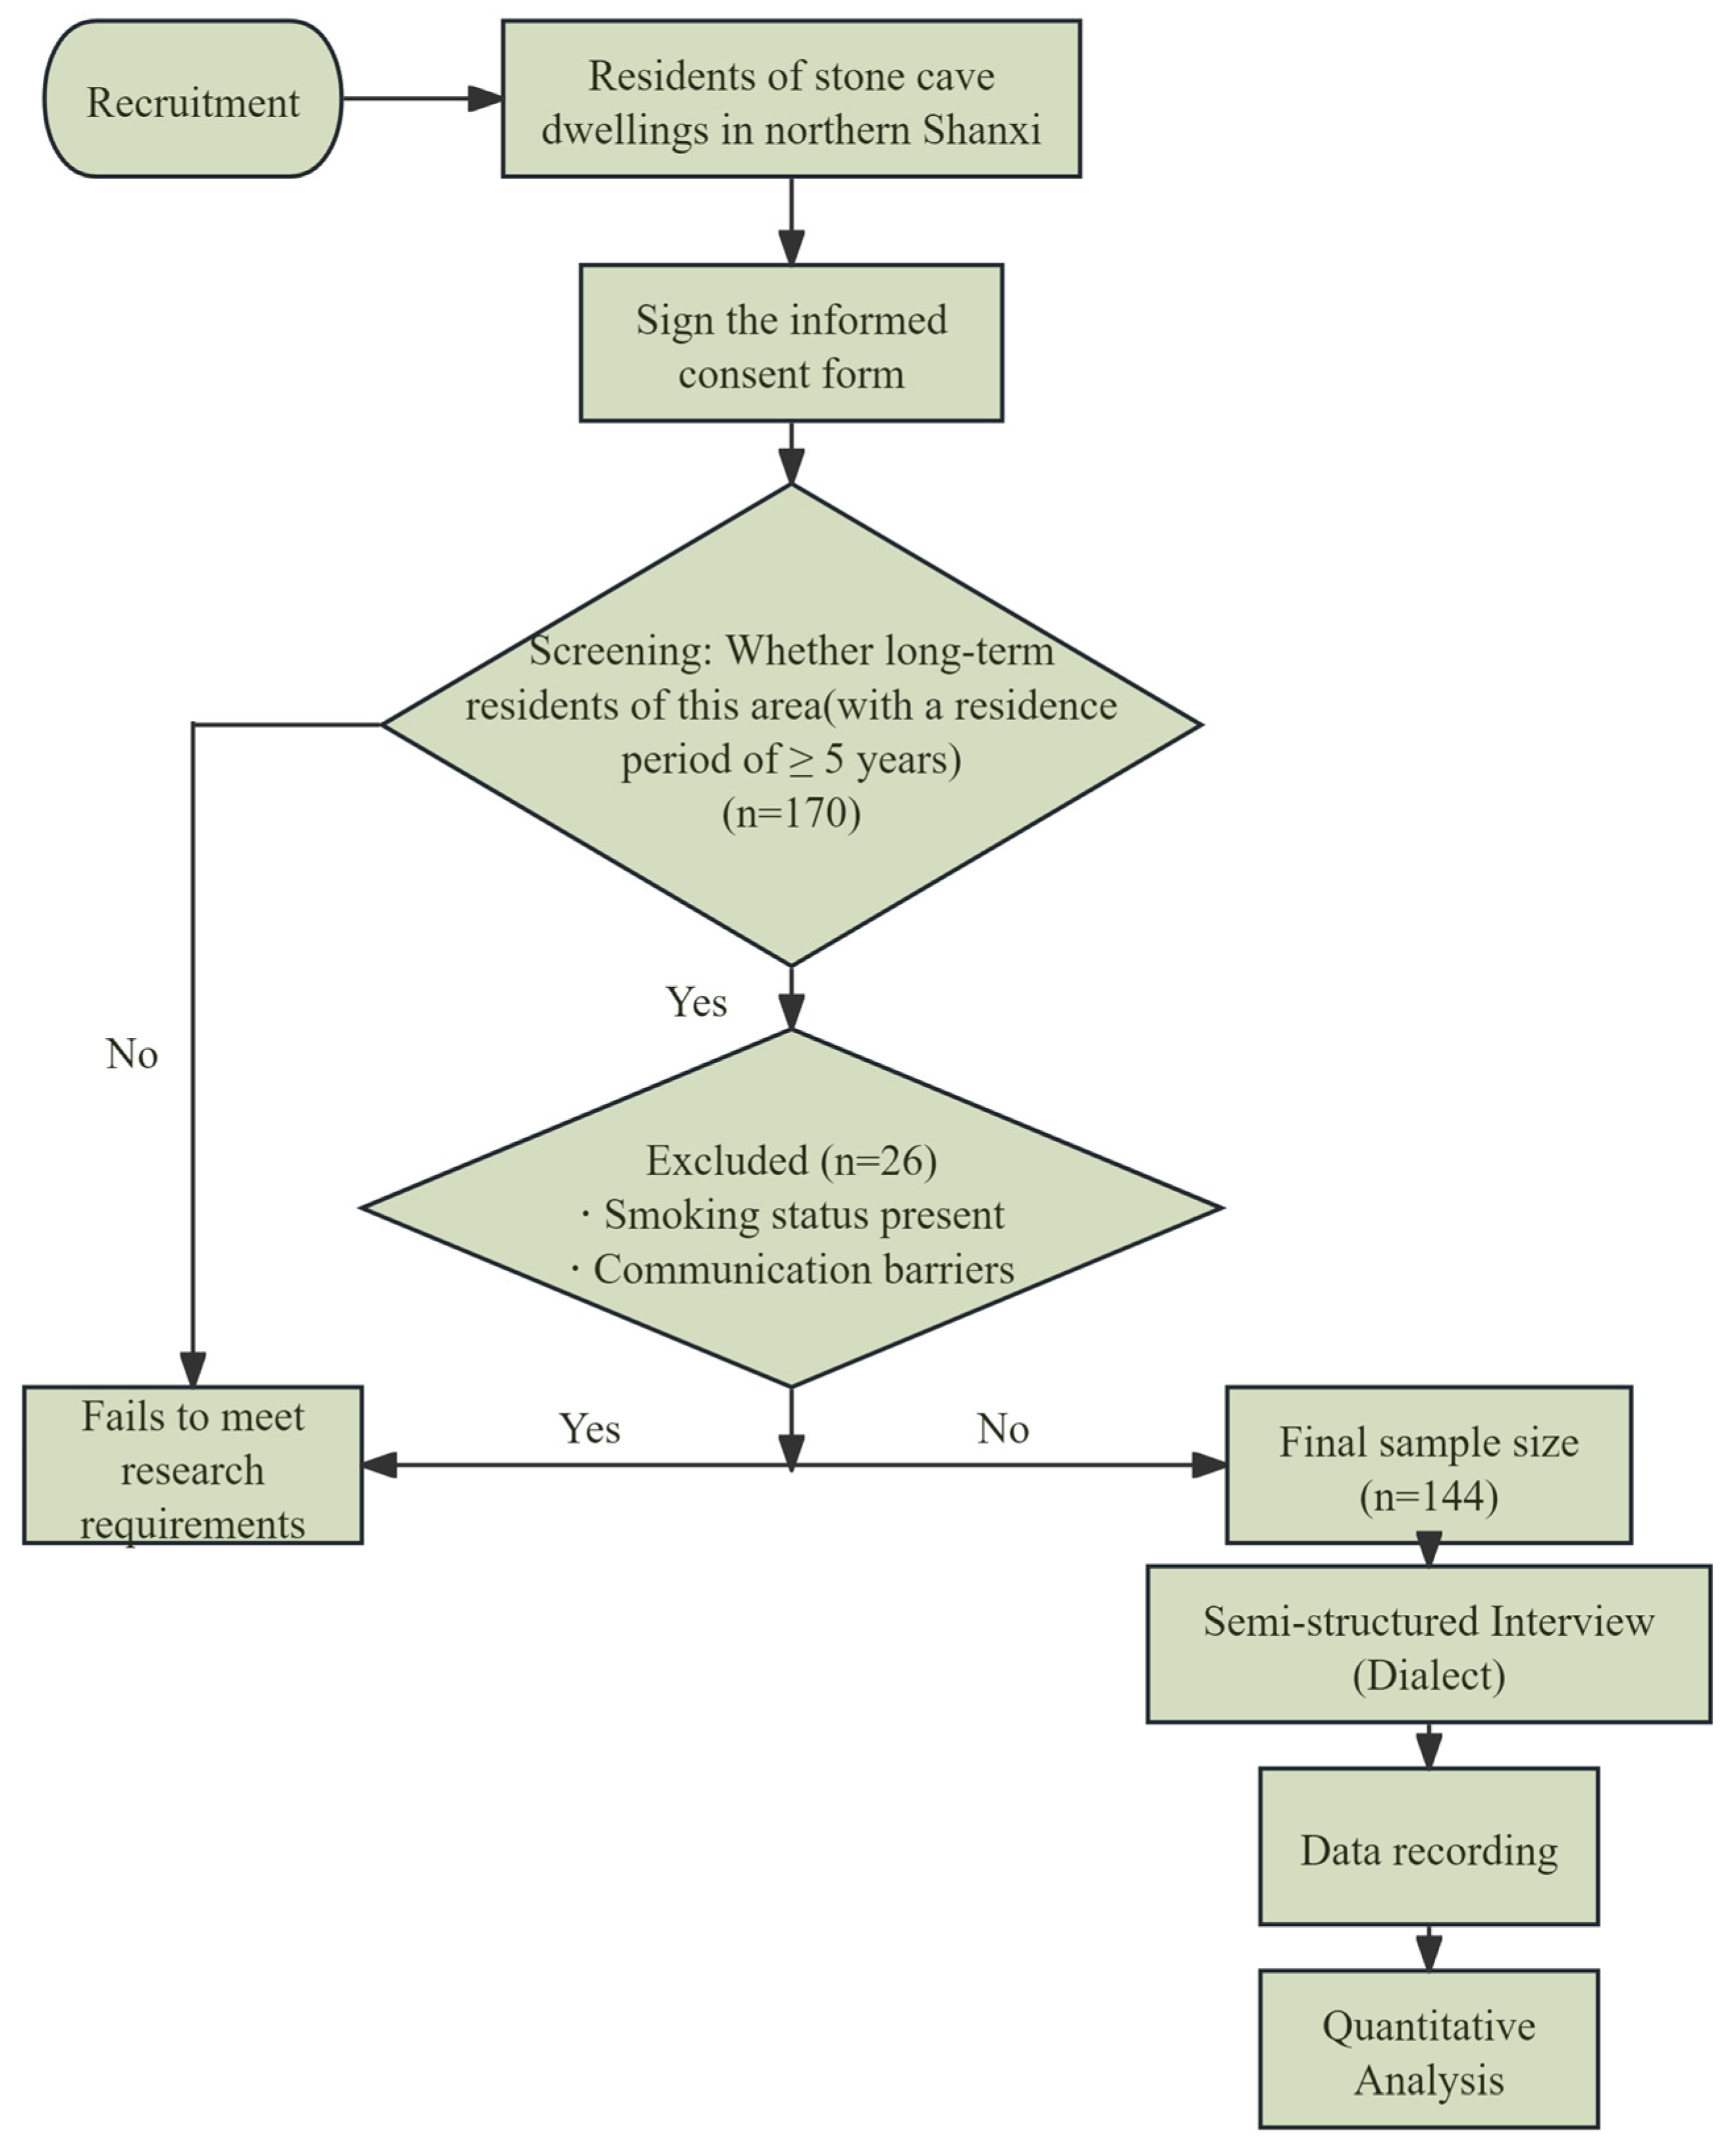
The methodology flowchart for this study is shown in Figure 1.

3.1. Location and Climate

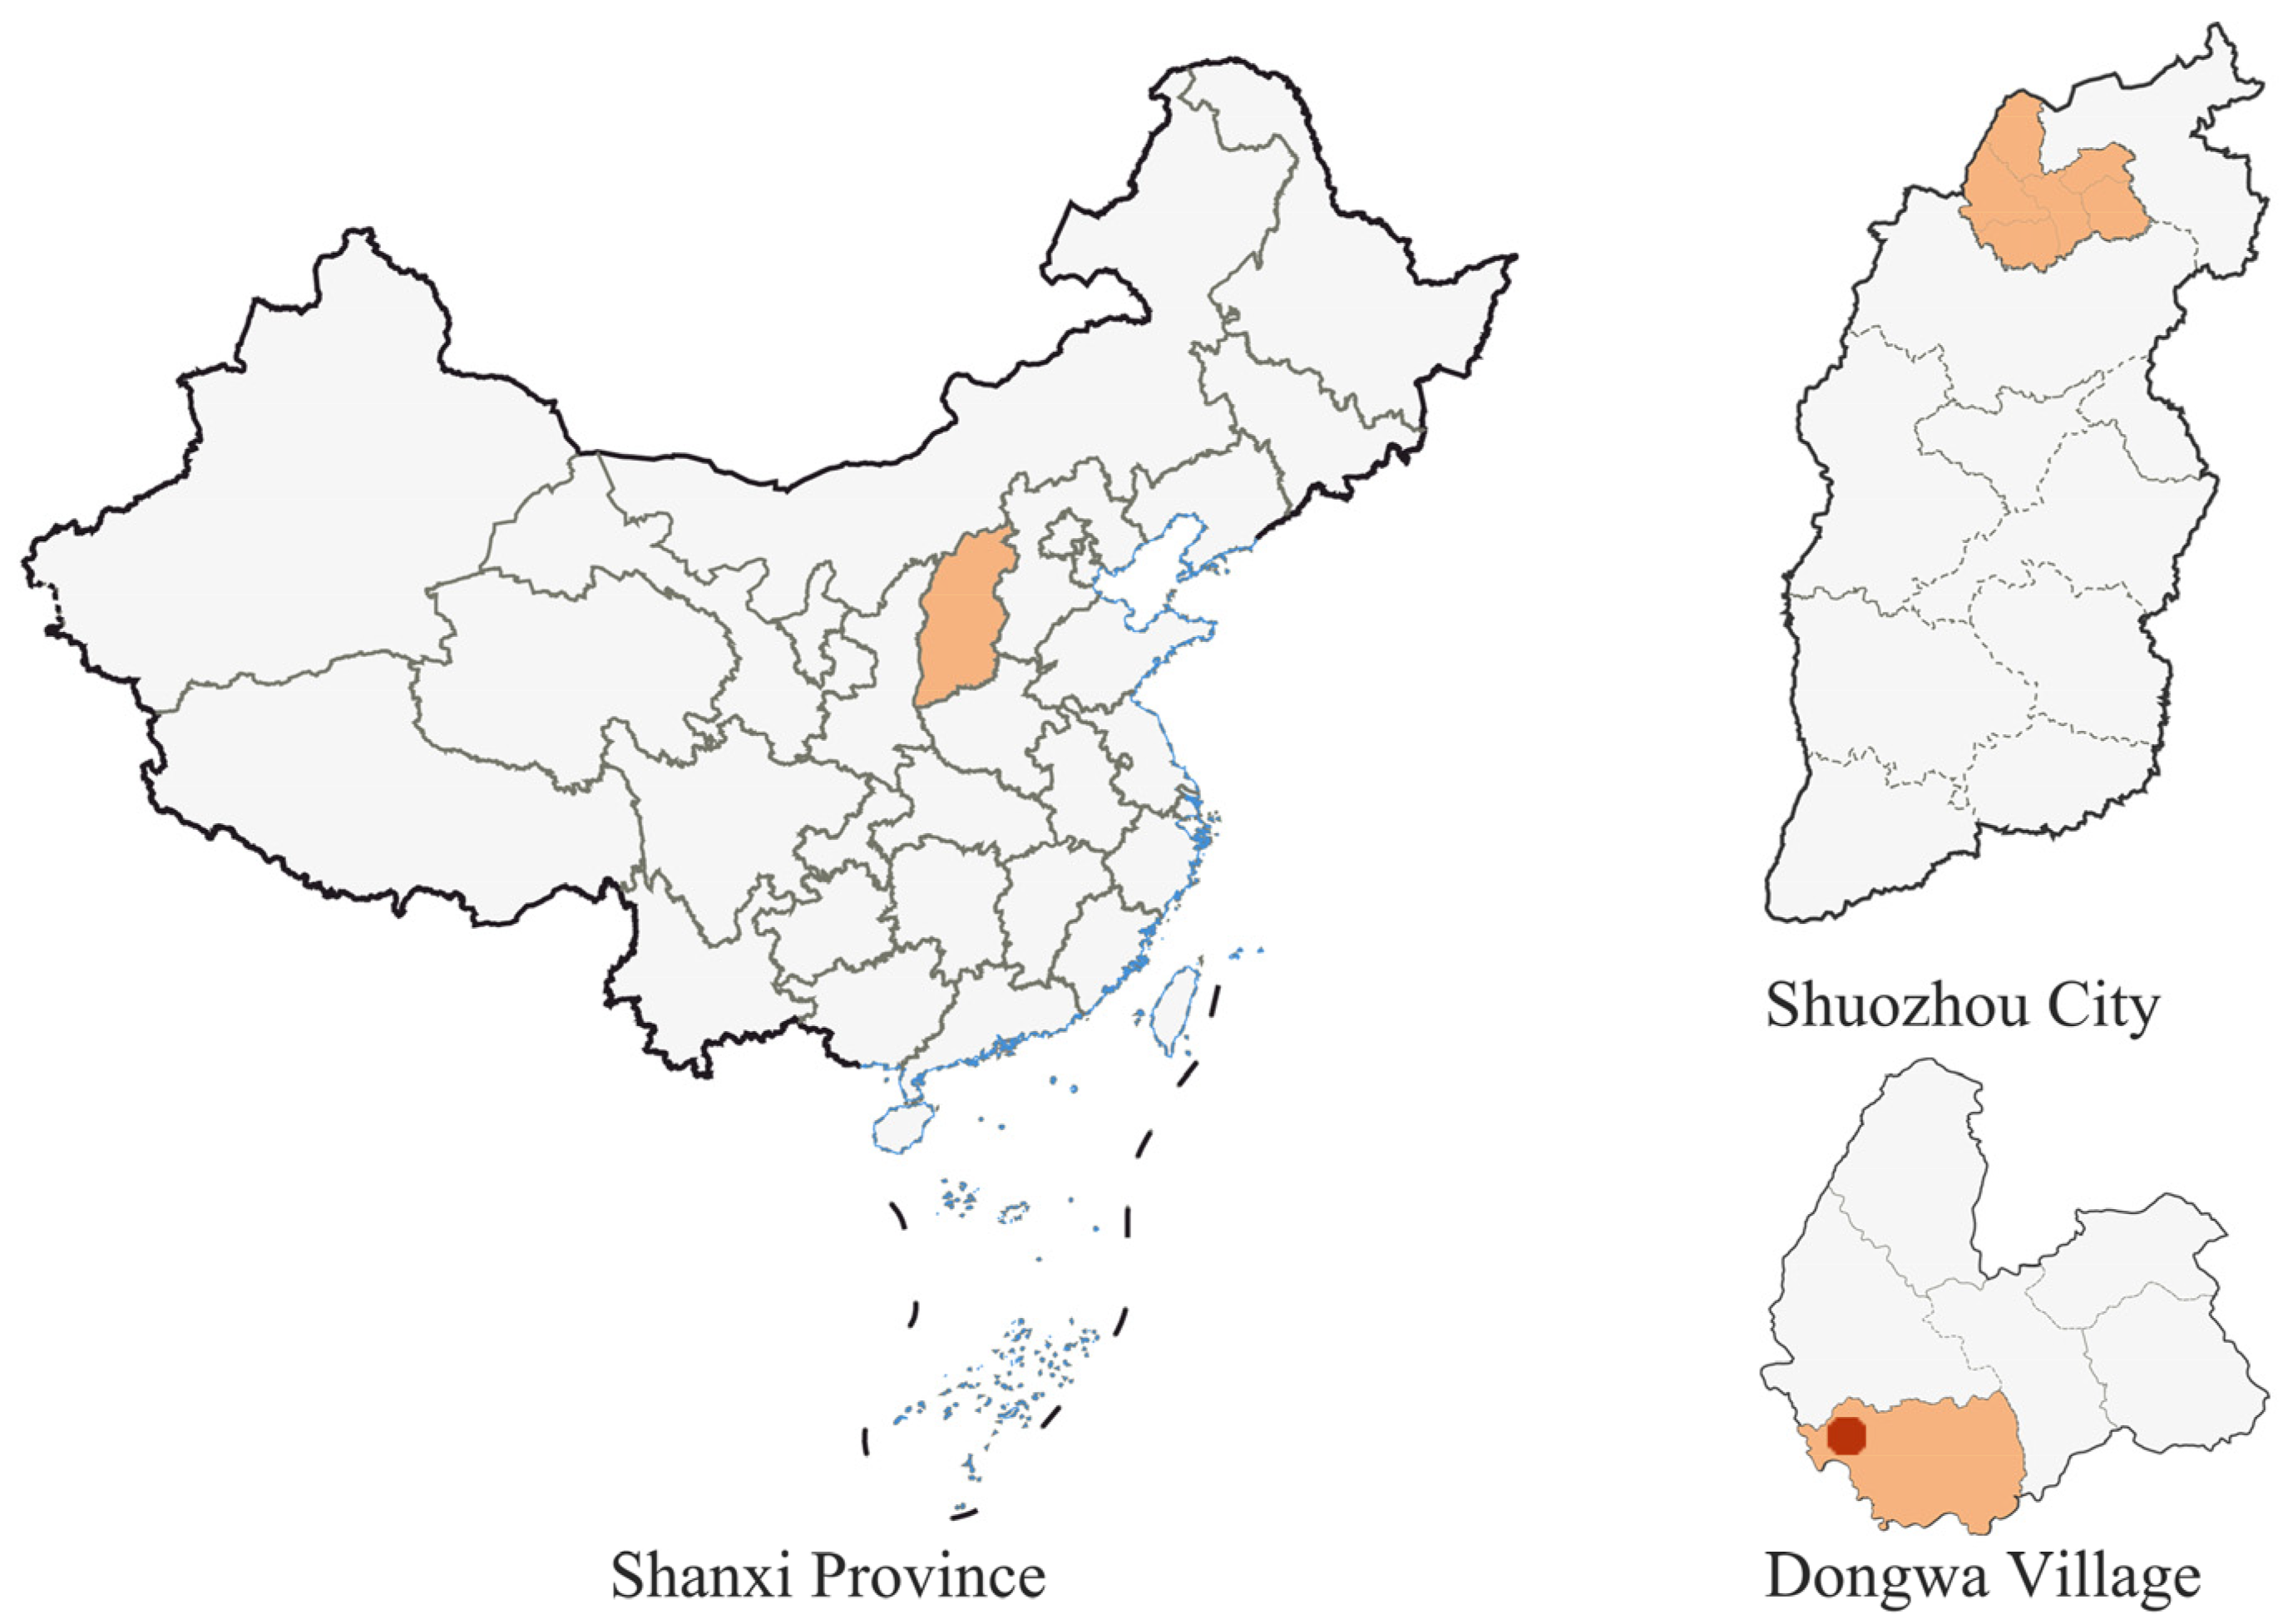
Dongwa Village is situated in Limin Town, Shuozhou City. The majority of houses in the village consist of independent stone cave dwellings, which are enveloped in a substantial layer of soil. Dongwa Village is situated in the transitional zone between the Loess Plateau and the Northern China Plain (Figure 2), as per “GB/T 50824-2013, Energy-saving design standards for rural residential buildings” [43]. The region experiences a typical continental monsoon climate, characterized by cold and dry winters and hot, windy summers.

3.2. Architectural Description

Based on field investigations, stone cave dwellings in northern Shanxi show high consistency in construction forms and indoor heating methods. Therefore, this study selected representative stone cave dwellings in Dongwa Village as the research subjects. These stone cave dwellings were created from locally sourced stone and loess, featuring distinctive designs for construction and well-adapted. The stone cave dwelling is constructed on level terrain, featuring ‘ox-leg’ buttresses composed of limestone and clay, with an arch positioned atop the buttresses and then covered with limestone flakes and soil to create a flat roof. The structure features an opening of approximately 3 m, a depth ranging from 5 to 6 m, wall thicknesses between 0.6 and 0.7 m, single-sided lighting, and double-leaf wooden doors, along with single-glazed wooden windows that are fixed and cannot be opened.
The primary characteristics of the stone cave dwellings in this region include simple construction methods and distinctive building materials. The construction process is efficient, with collaboration between villagers and local stonemasons, which effectively lowers costs. Additionally, the stone cave dwelling exhibits strong sustainability, as discarded stone can be naturally recovered into the environment or repurposed without adverse ecological effects. The utilization of stone in the construction of stone cave dwellings enhances their sturdiness and durability, resulting in a service life that spans decades to centuries, aligning with sustainable development principles.

3.3. Field Measurement

January is the coldest month of the year in northern Shanxi, coinciding with peak heating demand—during which both building energy consumption and heating pollutant emissions reach their highest levels. To investigate the indoor thermal environment and air quality characteristics of stone cave dwellings during this period, this study conducted questionnaire surveys on indoor thermal environment and air quality among residents of northern Shanxi’s stone cave dwellings in January 2024 and January 2025, with comparative testing carried out in July of the same years.
Stone cave dwellings in Dongwa Village are typically heated by cooking stoves connected to kangs. Monitoring was conducted during the winter heating season (11–17 January), with comparative testing in summer (22–28 July) to better understand variations in the indoor environment. Given the more severe indoor temperature and humidity conditions of stone cave dwellings in winter, this study focused primarily on their winter indoor thermal environment.
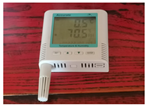
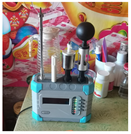
Throughout the monitoring period, all data were collected through 24 h continuous monitoring. The tested stone cave dwellings maintained a consistent stove-heated kang with windows closed, ensuring data consistency and comparability. Monitored parameters included indoor and outdoor temperature and humidity, as well as indoor concentrations of PM2.5, PM10, CO2, and TVOC. Specific instrument models and accuracy specifications are detailed in Table 1. All instruments underwent pre-test validation before formal testing to ensure measurement accuracy and stability.
The methodology for measuring point layout and parameter testing adhered to the “GB/T 18883-2022, Indoor air quality standards” [44], which requires a measuring point at the center of any room measuring less than 25 m2. In this study, all room areas measured were under 25 m2, necessitating the establishment of a measurement point at the center of the testing room, as illustrated in Figure 3.
For hot and humid environments, a measurement point is established at a height of 1.5 m above the ground in both the heated and unheated rooms of stone cave dwellings, with data collected at 10 min intervals. For air quality evaluation, a measurement point is located in the heating room of the stone cave dwelling, where indoor air concentrations of PM2.5, PM10, CO2, and TVOC are monitored continuously throughout the day, reflecting the daily habits of the residents. This study focuses more on the indoor heat environment in stone cave dwellings during winter, given the more severe conditions of heat and humidity in that season.

3.4. Subjective Survey

The survey findings are considered representative as all study participants were long-term residents of the area and spent a minimum of 30 min in the designated room. The format adheres to the sample size calculation formula:
n = Z α / 2 2 1 P P d 2
where n is the minimum sample size, Z α / 2 is the normal standard distribution ( Z α / 2 = 1.96 ) at a confidence level of 95% and α   =   0.05 , P is the prevalence/population proportion, usually taking a value of 0.5, and d is the tolerable margin of error.
The subjective questionnaire in this study was primarily designed with reference to ASHRAE Standard 55 [45], covering participants’ basic information, subjective perceptions, current activity status, and clothing conditions (see Appendix A for details). All survey participants are self-sufficient farmers with relatively similar economic levels.
Given that the research subjects were predominantly middle-aged and elderly individuals unfamiliar with electronic devices, traditional questionnaire surveys had limitations. To ensure data quality, this study adopted dialect-based interviews, with researchers transcribing responses on behalf of participants.
A simple random sampling method was used to select 170 households living in heated by cooking stoves connected to kangs stone cave dwellings as research subjects, and 170 questionnaires were distributed. Respondents were aged 19 to 85, with a male-to-female ratio of 1.2:1. During data processing, questionnaires were excluded if respondents smoked or if information collection was incomplete due to age-related hearing impairments, resulting in 144 valid responses. Statistical summaries of respondent demographics are detailed in Table 2.

3.5. Data Preprocessing

This study used SPSS software 27.0 to test the reliability and validity of the survey questionnaires (Table 3). Reliability analysis showed that the Cronbach’s α coefficient of the Indoor Thermal Environment Composite Scale was 0.700 (>0.7), and that of the Indoor Air Quality Composite Scale was 0.828 (>0.7). These results indicate that the questionnaire demonstrates good overall reliability and meets the requirements for statistical analysis. For validity, the KMO and Bartlett’s sphericity test results showed that the KMO value of the Indoor Thermal Environment Composite Scale was 0.733 (>0.6), and the KMO value of the Indoor Air Quality Composite Scale was 0.668 (>0.6), with a significance probability p = 0.000 (<0.05). This demonstrates that the questionnaire data have good construct validity and are suitable for factor analysis.

3.6. Evaluation Method

3.6.1. Thermal Comfort Evaluation Method

The distinctive structural features of rural houses result in all building components, excluding the foundation, being in direct contact with the external environment. Inadequate insulation of building envelope structures can reduce internal surface temperatures, potentially resulting in cold radiation. The thermal comfort of rural residents primarily relies on air temperature and average radiation temperature.
The mean radiant temperature ( t r ) was determined by analyzing the results of air temperature ( t a ), globe temperature ( t g ), and air velocity ( v a ). The diameter ( D ) is 0.05 m, and the emissivity ( ε g ) is 0.95. The calculation method is presented in Formula (2):
t r ¯ = [ ( t g + 273 ) 4 + 1.1 × 10 8 × v a 0.6 ε g × D 0.4 ( t g t a ) ] 1 4 273
Operative temperature ( t o p ) was selected as the evaluation index, incorporating the influences of air temperature ( t a ) and mean radiant temperature ( t r ) on human thermal sensation. When the indoor air velocity is below 0.2 m/s or the temperature difference between tr and ta is less than 4 °C, Formula (3) can be used:
t o p = ( t a + t r ) 2
Research shows that during winter in stone cave dwellings, occupants typically wear undergarments, woolen pants, sweaters, outer pants, coats, cotton socks, and cotton slippers. According to GB/T 50785-2012 “Evaluation standard for indoor heat and humidity environment of civil buildings” [46], the thermal resistance of this clothing configuration is 1.5 clo. Villagers usually remain seated indoors during winter rest periods, resulting in a metabolic rate of 1.0 met for most individuals.
The PMV-PPD model is currently the internationally recognized method for evaluating thermal comfort. Developed by Professor Fanger based on ISO 7730 [47] and ASHRAE standards 55 [45], its core principle is that the closer the PMV value is to 0, the better the human thermal comfort. However, multiple field studies have shown that discrepancies often exist between PMV predictions and actual Thermal Sensation Voting (TSV) results. Therefore, this study uses both the PMV and TSV models to conduct a comparative assessment of thermal comfort conditions.

3.6.2. Gray Relational Analysis Method

Professor Deng Julong established gray system theory, a system science that focuses on the analysis of systems with little data and sparse samples, in the early 1980s. One of the primary methods, gray correlation analysis, looks for similarities between sequence curves. The correlation increases as the curves get closer together.
Preprocess the original data using the indoor air quality evaluation standard sequence as the reference sequence. Y i i Q = { 1 , 2 , , m } , the comparison sequence consists of the measured data X j obtained from on-site testing experiments, where j R = { 1 , 2 , , n } .
Y i = { y i ( 1 ) , y i ( 2 ) , , y i ( k ) , y i ( h ) }   k H = { 1 , 2 , , h } X j = x j 1 , x j 2 , , x j k , , x j h   k H = { 1 , 2 , , h }
The assessment of indoor air quality is significantly linked to the effects of environmental pollution on human health, with the classification levels presented in Table 4 frequently utilized in environmental evaluations [48].
The levels of pollutants in rural home indoor air quality tests varied greatly. Transforming components into dimensionless values reduces numerical differences. Weber–Fechner’s law, which states that the amount of the reaction is proportional to the logarithm of the stimulus: R = k l o g S , can be used to process pollutant concentrations to match human perception and compare them. A decibel-based matching calculation approach (Equation (4)) [49] can better compare pollutant concentrations and estimate indoor air quality.
L = k log n n 0
The formula is as follows: k is the constant that corresponds to the pollutant parameter; n 0 is the background value of each pollutant; and n is the concentration value that was evaluated on site.
Follow these steps to process the evaluation criteria sequence [50]:
Δ min = min i   min j   min k y i ( k ) x j ( k )
Δ max = max i   max j   max k y i ( k ) x j ( k )
Δ i j ( k ) = y i ( k ) x j ( k )
The gray correlation coefficient between the reference and comparison sequences should then be determined using Equation (8), and the correlation degree should be determined using Equation (9).
ξ i , j ( k ) = Δ min + ρ Δ max Δ i , j ( k ) + ρ Δ max
r i , j = 1 l k = 1 l ξ i j ( k ) , i Q , j R , k H
The resolution coefficient, ρ ( 0 < ρ < 1 ), is typically taken as 0.5; the correlation degree, r i , j , represents the degree of similarity between the Y i and X j sequence curves; and the correlation coefficients, ξ i j ( k ) , comprehensively reflect the magnitude of the correlation coefficients of all data points. A closer association between Y i and X j is indicated by bigger values of r i , j . An m × n order association matrix is formed by the relational degrees r i , j , i M, j N.
R = r 1 , 1 r 1 , 2 r 1 , n r 2 , 1 r 2 , 2 r 2 , n r m , 1 r m , 2 r m , n

4. Results and Discussion

4.1. Analysis of Objective Test Results

4.1.1. Thermal Performance Analysis

Research indicates that traditional stone cave dwellings were predominantly used in Dongwa Village and its surrounding areas of Shuozhou City. Over time, however, ordinary brick houses have gradually become more prevalent. Comparing the thermal performance of these two structures can further clarify the advantages and disadvantages of stone cave dwellings in regulating indoor temperatures and maintaining a comfortable living environment.
Field measurements were conducted to determine the envelope construction parameters of the stone cave dwellings. Key thermal performance indicators—including total thermal resistance, thermal inertia, and thermal transmittance—were calculated in accordance with GB50176-2016 “Thermal Design Code for Civil Buildings” [51]. A detailed comparison of the thermal performance between stone cave dwellings and conventional brick houses is presented in Table 5.
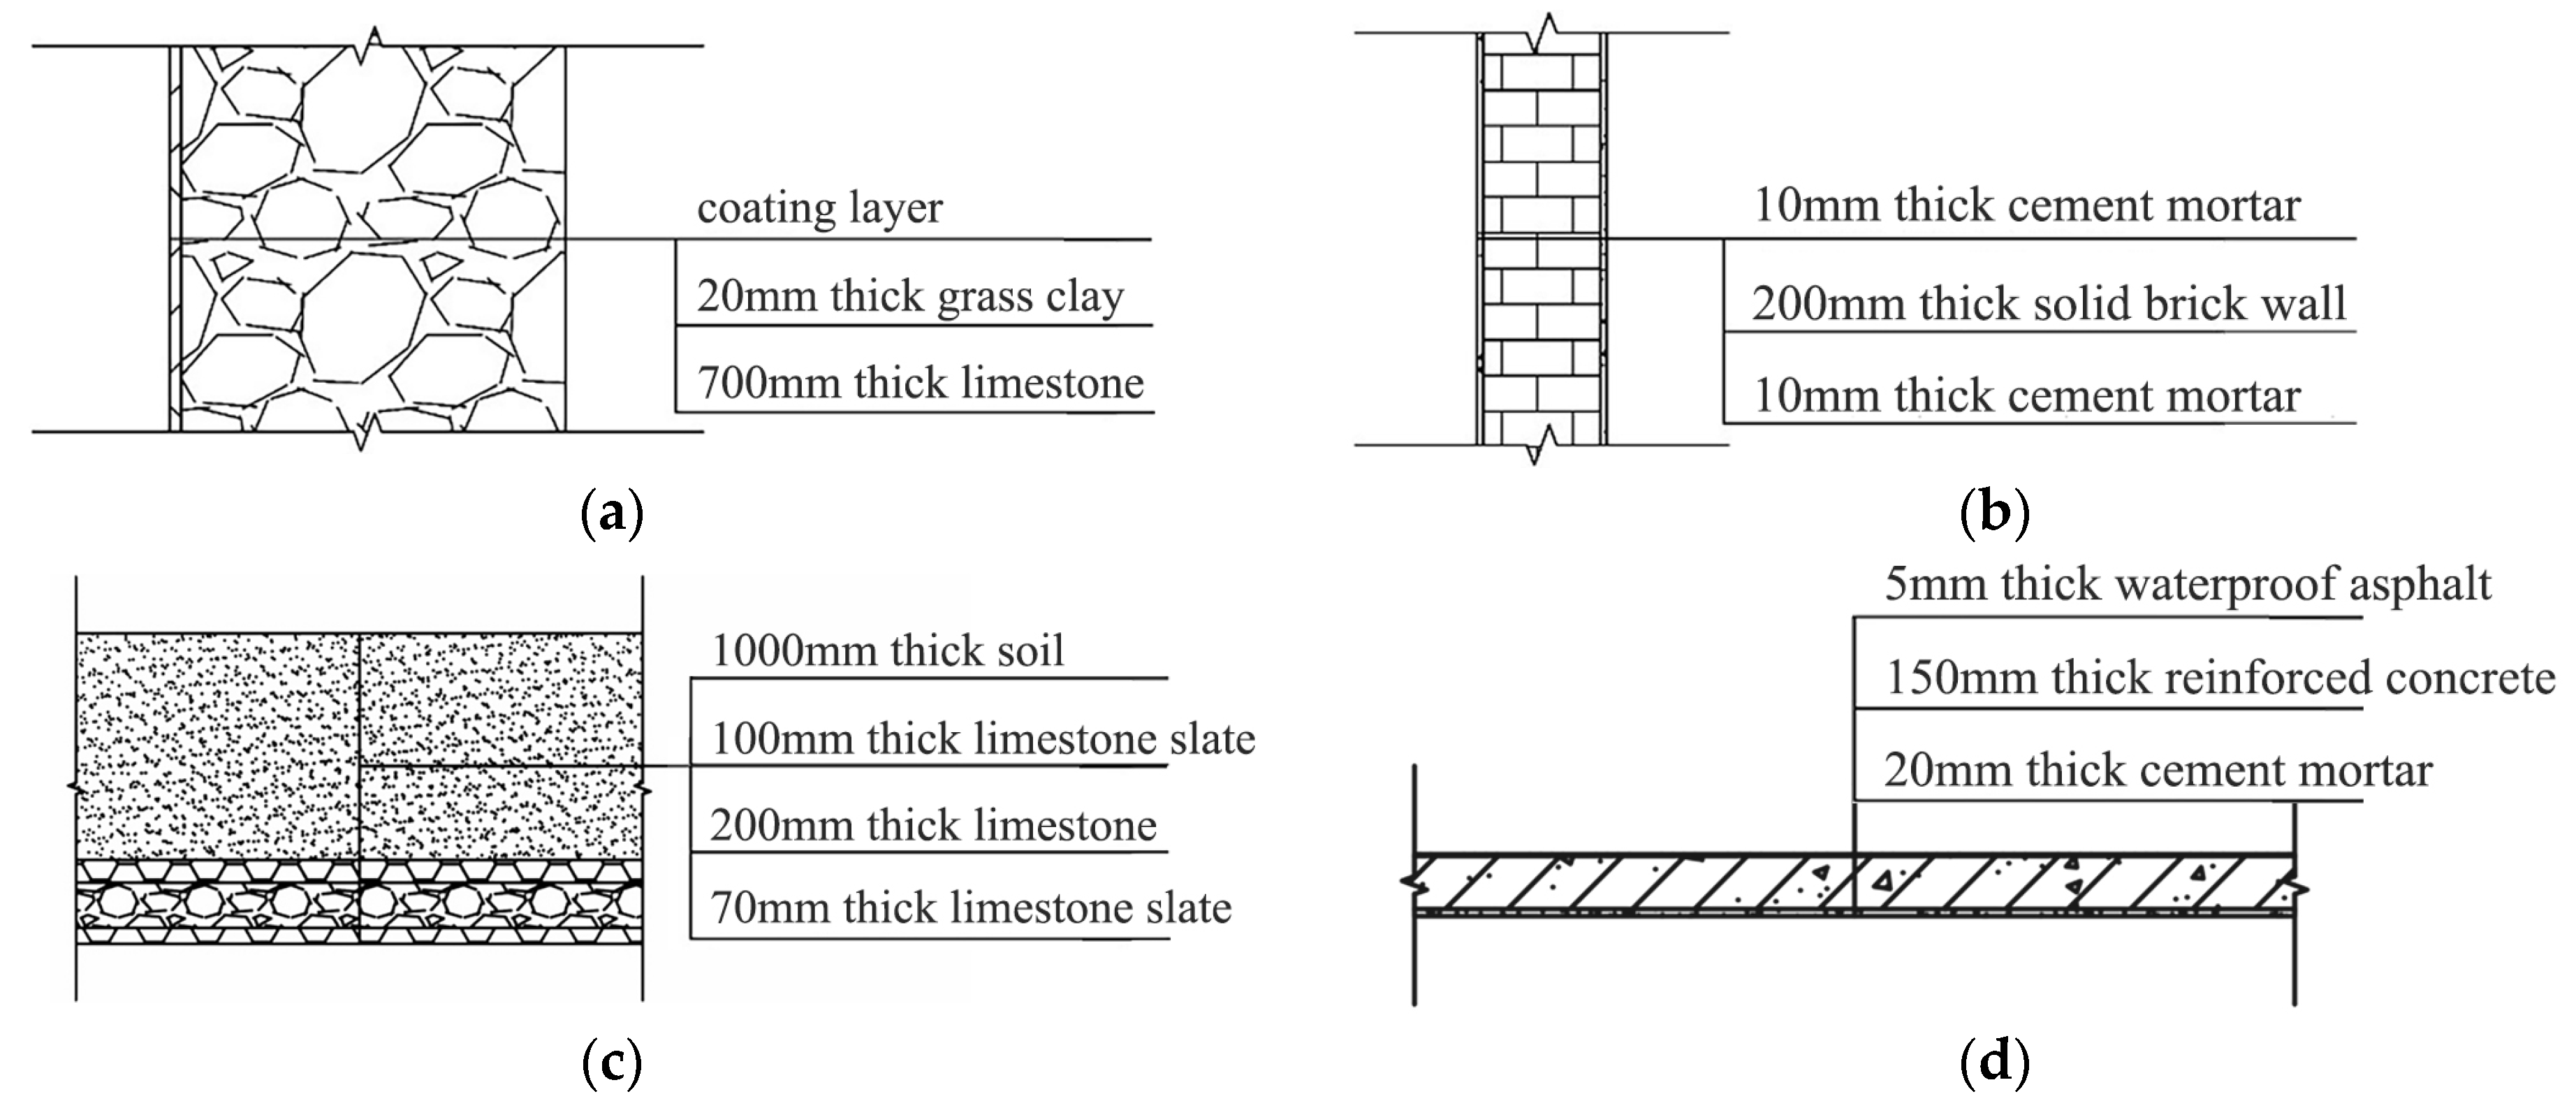
As illustrated in Figure 4, stone cave dwellings possess robust stone outer walls and a dual-layered mud plaster composition (coarse oat straw mud layer plus fine clay layer), augmenting the thermal insulation and heat retention capabilities of the walls. They are composed of limestone and dirt. In comparison to traditional brick buildings, the stone cave’s outer structure demonstrates superior overall thermal resistance and significantly enhanced thermal inertia (Table 5). This illustrates the stone cave dwellings’ enhanced efficacy in regulating and stabilizing inside temperatures compared to conventional brick edifices. Both stone cave dwellings and traditional brick homes demonstrate heat conductivity coefficients significantly surpassing normal thresholds [43]. It signifies that the thermal performance of local residential building envelopes is predominantly inadequate, not conforming to contemporary energy efficiency standards and necessitating immediate enhancement measures.

4.1.2. Analysis of the Indoor Thermal Environment Test Results

On-site research and testing revealed a significant relative humidity issue within the stone cave dwelling. “GB/T 50785-2012, Evaluation standard for indoor heat and humidity environment of civil buildings” [46] specifies that the appropriate indoor relative humidity range during winter is 30% to 60%. The relative humidity levels recorded in stone cave dwellings exceed the established standard significantly.
As shown in Figure 5a, the humidity in the unheated room far exceeds that outdoors, while the heated room’s humidity falls between the two. Excessive humidity not only reduces living comfort but also endangers occupants’ health. The root causes are poor drainage and inadequate air circulation—particularly in winter, when outdoor dryness and insufficient indoor ventilation hinder moisture dissipation, significantly affecting the indoor environment and living experience. Regarding temperature, Figure 5b shows that despite significant outdoor temperature fluctuations, the unheated room maintains a stable indoor temperature of 1.6 °C, reflecting the stone cave dwelling’s inherent thermal regulation capacity. Although the cooking stove-heated room’s temperature curve remains stable and higher than the unheated room (averaging 8.7 °C), it is below the 14 °C standard for winter heating design in rural residential buildings [43], indicating poor heating efficiency. The combination of low temperatures and high humidity exacerbates the thermal environment problems in stone cave dwellings.

4.1.3. Analysis of the Indoor Air Pollution Test Results

During the testing period, indoor air sample data from conventional stove-kang heating stone cave dwellings in the region were chosen for examination. The exceedance rate is the proportion of detection data for each pollutant that surpasses the standard limit within the whole dataset. All statistical data are derived from on-site monitoring tests, with the particular results of the exceedance rate presented in Table 6.
According to Table 6, there is a significant seasonal difference in pollutant exceedance. The PM2.5 exceedance rate is highest in winter, being 1.3 times greater than in summer. The PM10 exceedance rate in winter is nearly 1.8 times higher than in summer, indicating a significant difference. Regarding CO2, the exceedance rate is markedly elevated in winter compared to summer. There has been no instance of CO2 levels exceeding the standard during summer; the exceedance rate of TVOC in winter is 3.3 times greater than that in summer. Comprehensive analysis shows that the rate of indoor pollutant concentration exceeding the standard in winter has significantly increased compared to summer, with the most significant difference in CO2 exceeding the standard rate between winter and summer. It is speculated that there is a direct relationship between indoor heating and biomass combustion, and in summer, residents frequently open wooden doors for ventilation and heat dissipation, which promotes good indoor air circulation and effectively reduces the problem of pollutant accumulation and exceeding standards.
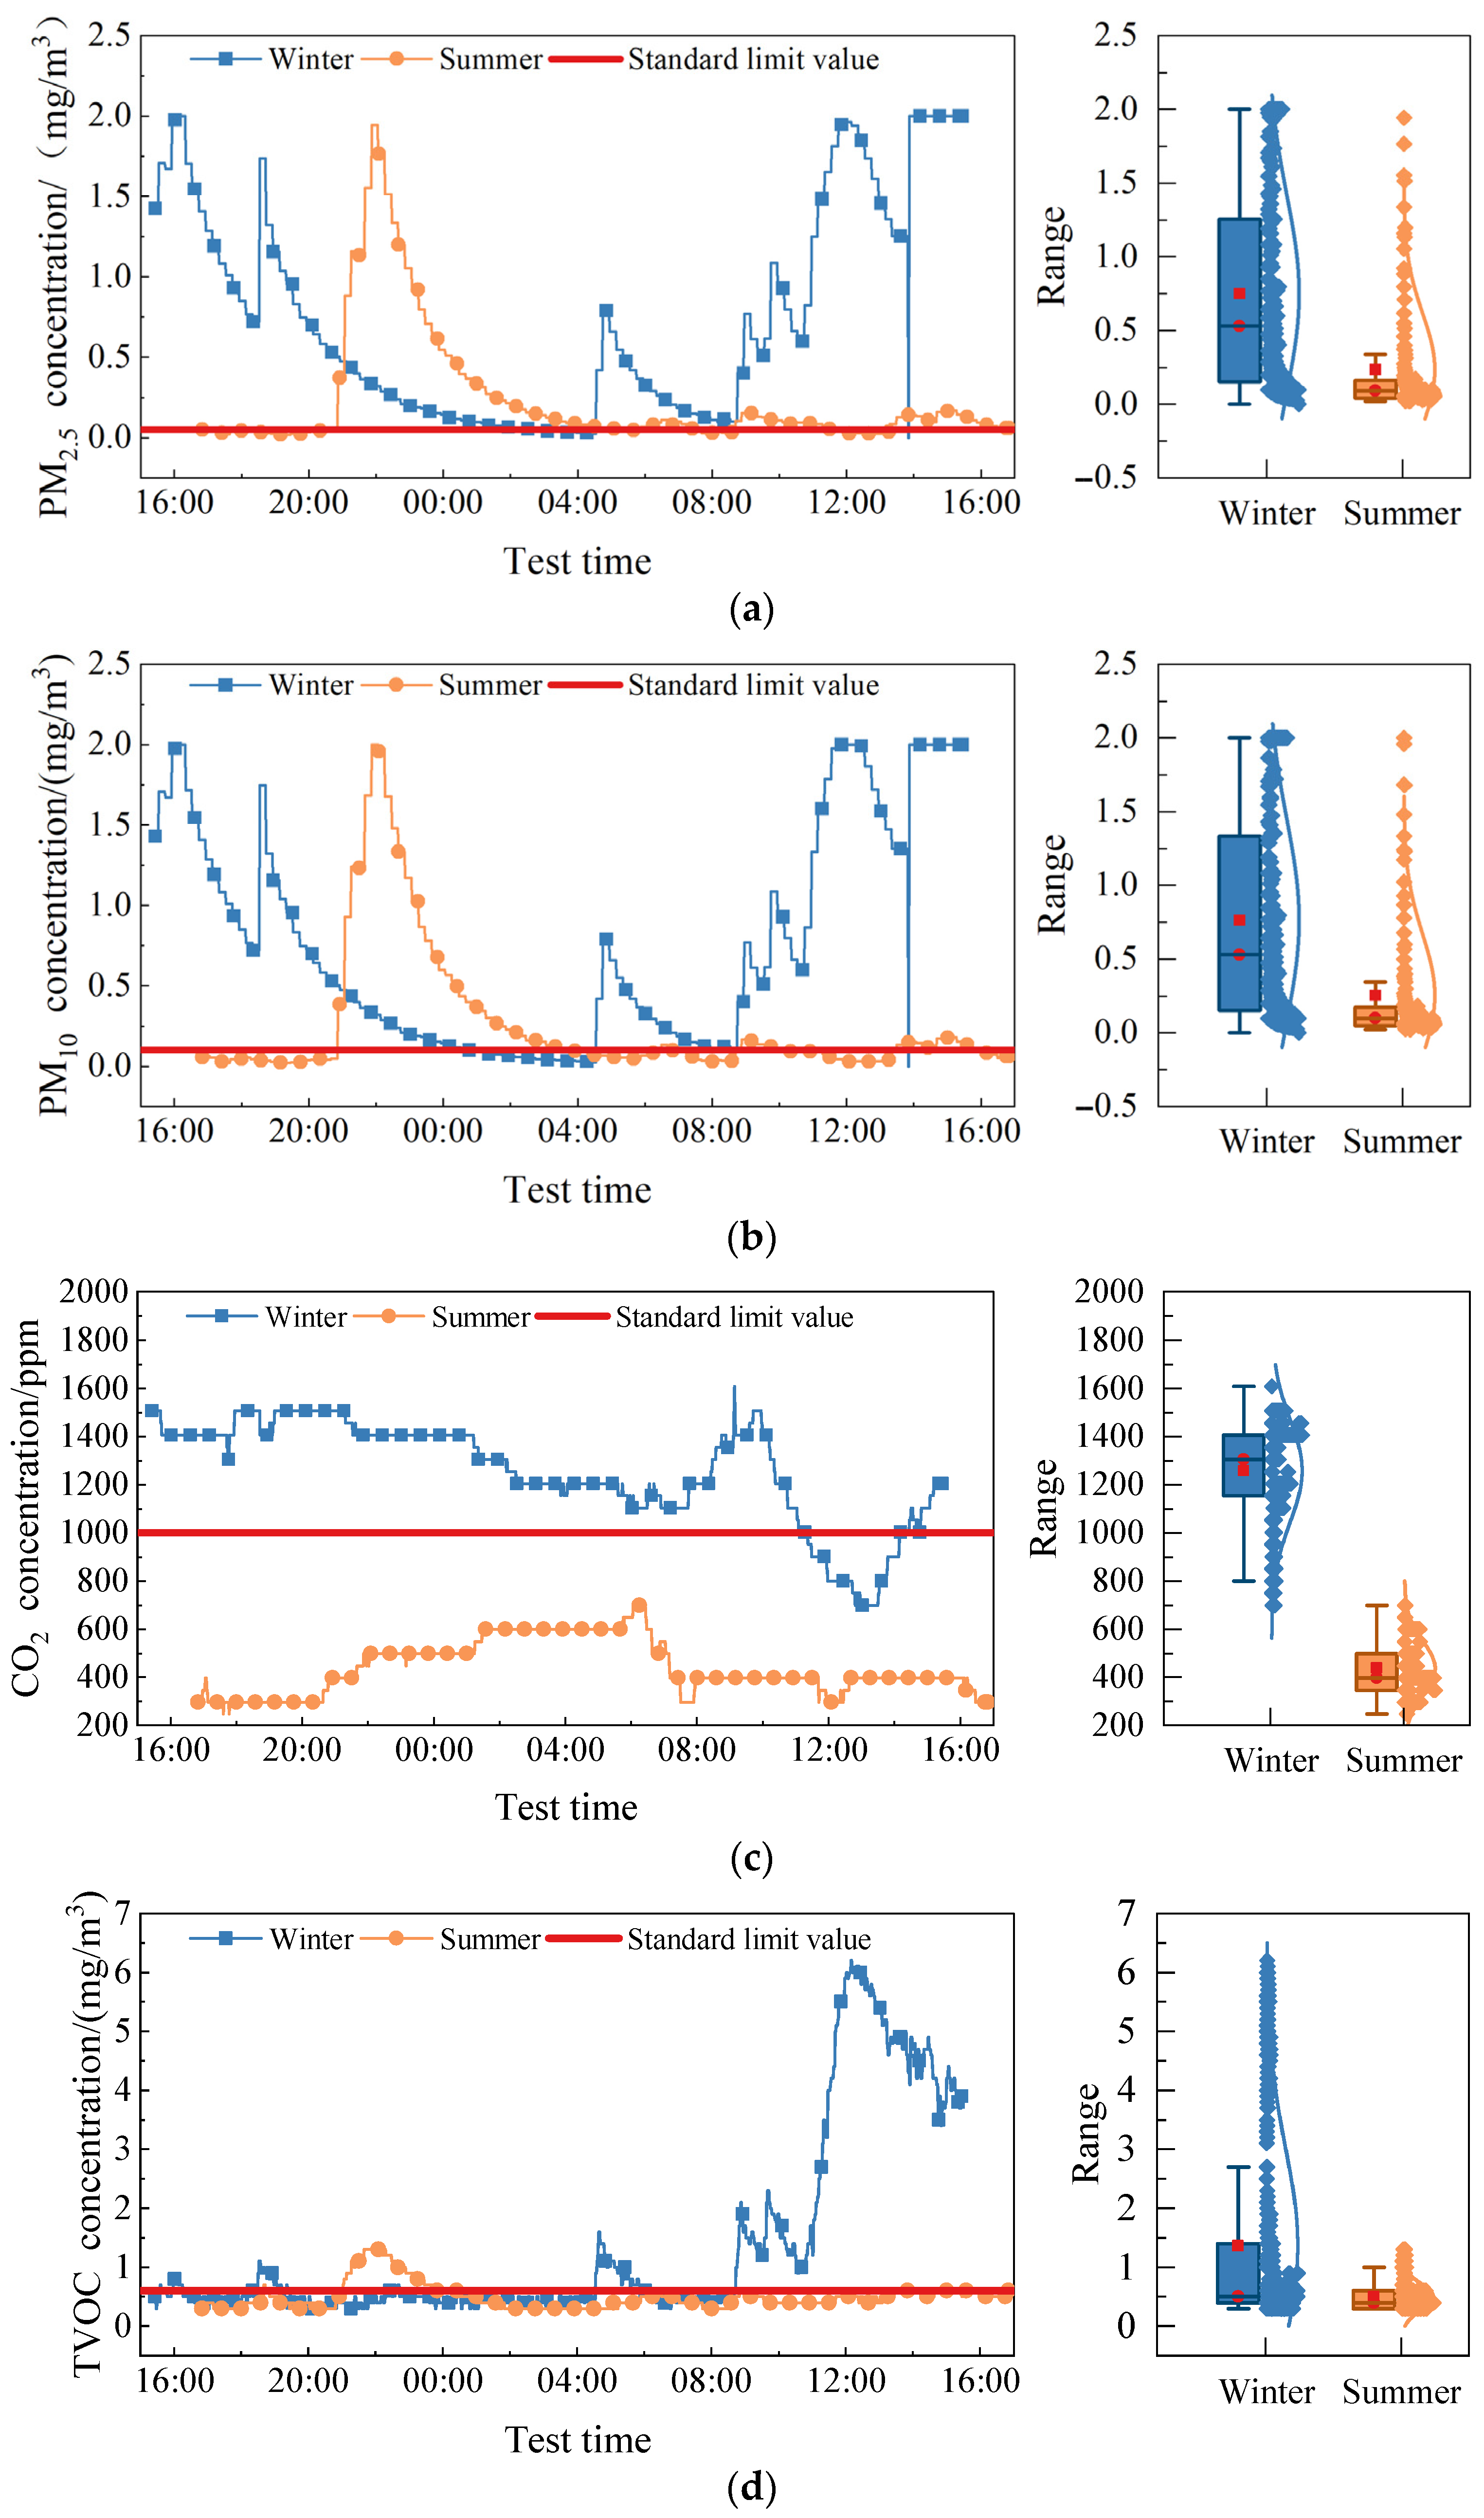
Figure 6a,b illustrates significant variations in indoor PM2.5 and PM10 concentrations in stone cave dwellings between winter and summer. These concentrations exhibit intermittent peak fluctuations throughout the day, correlating with the residents’ periodic addition of firewood. The PM2.5 concentration in winter far exceeds the standard limit in the early stage of fuel combustion [44], so it is necessary to ventilate appropriately during this period to reduce PM2.5 and PM10 concentrations.
Figure 6c indicates that the indoor CO2 concentration in stone cave dwellings during winter surpasses the standard limit of 1000 ppm [44]. This occurs because doors and windows are frequently sealed, leading to significant indoor CO2 accumulation. Figure 6d indicates that the indoor TVOC concentration in stone cave dwellings during summer exhibits a consistent fluctuation range throughout the day, remaining around the standard limit. During winter, the indoor concentration of total TVOC progressively rises from 10:00 AM to 2:00 PM. Research observations indicate a correlation between residents’ cooking and fuel usage behaviors.
Independent samples t-tests revealed statistically significant differences in indoor pollutant concentrations between winter and summer (p < 0.05), with winter levels consistently higher than those in summer. Single-sample t-test results further indicated that the mean concentrations of various pollutants significantly exceeded national standard limits during multiple winter time periods (p < 0.05). Conversely, in summer, the average concentrations of CO2 and TVOC were below the limits, and this difference was also statistically significant (p < 0.05). In summary, the data confirms that indoor environments face more severe pollution issues in winter. It is recommended to prioritize targeted strengthening of indoor environmental pollution prevention and control measures during this season.

4.2. Indoor Thermal Environment Assessment

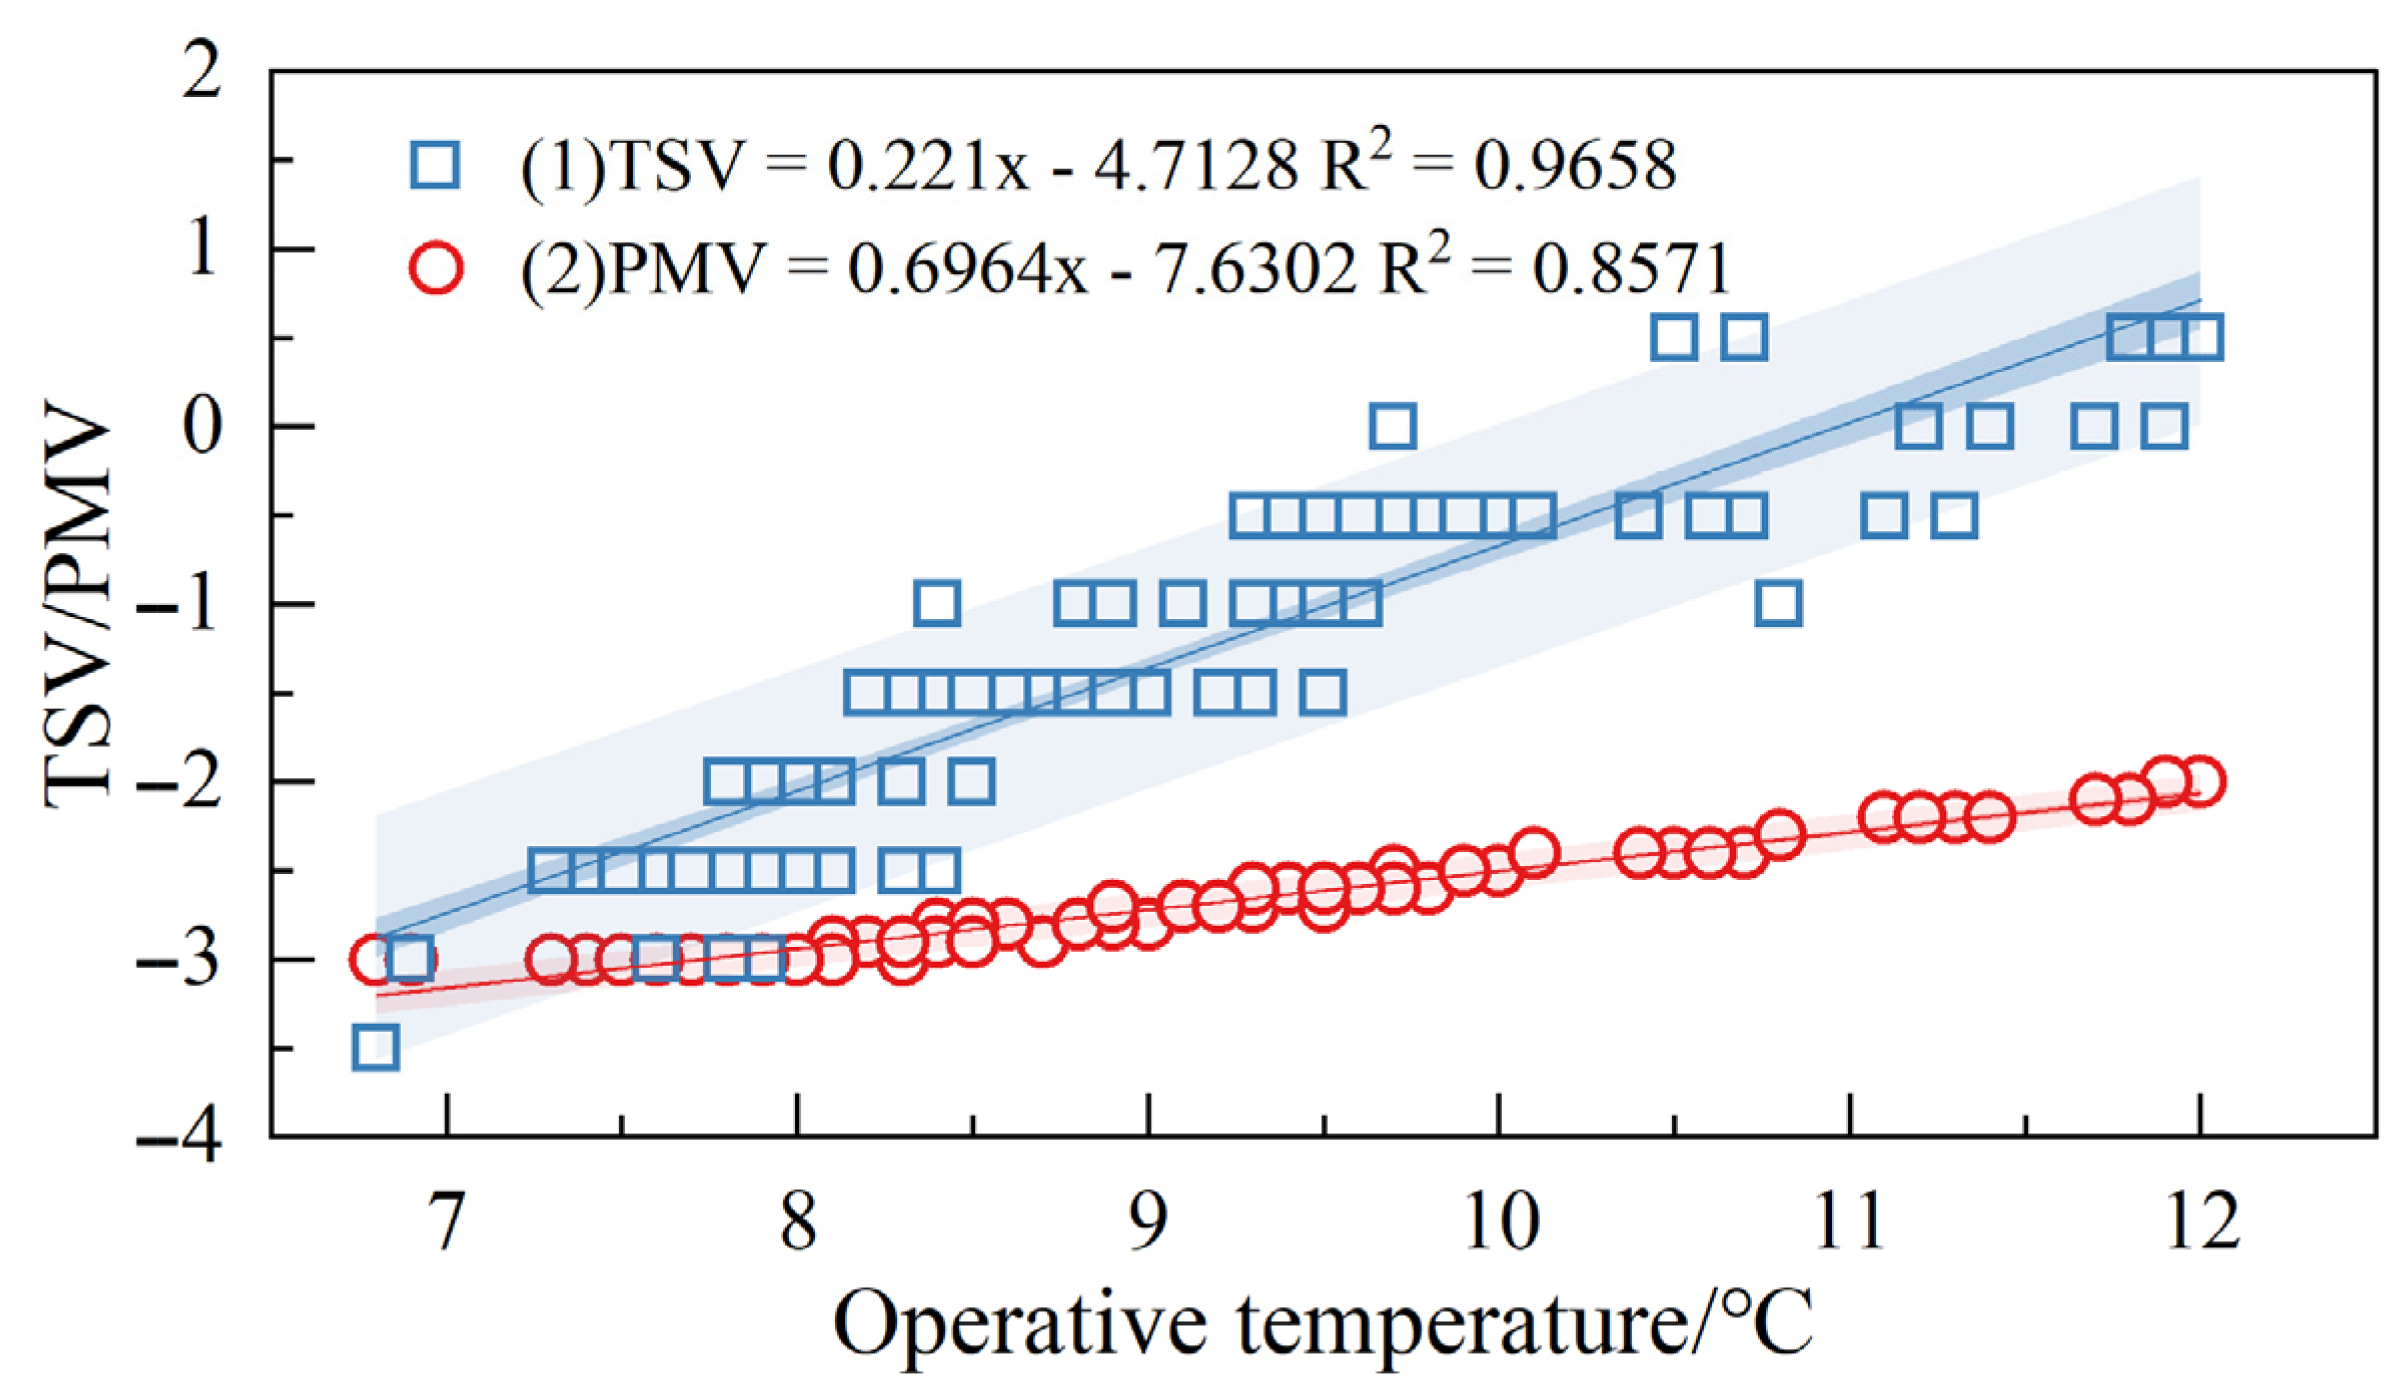
Correlation tests were conducted on the Thermal Sensation Vote (TSV), Predicted Mean Vote (PMV), and Cave Operating Temperature (top) using IBM SPSS software 27.0. Results indicate significant correlations among all three factors. Furthermore, regression analysis of these variables yielded regression Equations (1) and (2), whose slopes can be interpreted as residents’ sensitivity to air temperature changes. Analysis revealed that the revised TSV model achieved an R2 value of 0.843, while the PMV model attained an R2 value of 0.964—both exhibiting significant positive correlations. The White test for heteroscedasticity showed the TSV model had a p-value of 0.534 (>0.05), indicating no heteroscedasticity; the PMV model yielded a p-value of 0.037 (<0.05), indicating the presence of heteroscedasticity. Since PMV values, derived from objective parameters, exhibit concentrated distribution in low-scoring zones, robust standard error regression was employed to address this issue.
As shown in Figure 7, with increasing operating temperature, the TSV and PMV curves exhibit a pronounced “scissors effect,” indicating that stone cave dwellers‘ actual perception of temperature changes is more sensitive than theoretical predictions, which reflects the limitations of the PMV model in evaluating thermal comfort in cold-region cave dwellings. This systematic deviation stems from inherent differences between the models: PMV is derived from objective environmental parameters, while TSV integrates subjective factors such as individual thermal preferences, living habits, and psychological expectations.
Data in Table 7 further reveal that the PMV model’s thermal neutral temperature (21.32 °C) is significantly higher than the TSV result (10.96 °C), with a broader thermal comfort range. It confirms that residents’ cold adaptation—developed through prolonged exposure to frigid environments—allows them to maintain satisfactory thermal sensations at lower temperatures, a finding consistent with multiple studies in cold regions [4,52,53]. Therefore, in cold-region thermal comfort assessments, the TSV model may better align with residents’ actual thermal perceptions.
Furthermore, as shown in Figure 8, integration of subjective questionnaire results reveals that residents’ thermal preference temperature (12.75 °C) exceeds the TSV thermal neutral temperature. It confirms that while tolerating the existing environment, residents still express clear demands for thermal environment improvements—providing a key basis for optimizing the thermal conditions of cave dwellings.

4.3. Indoor Air Quality Evaluation

4.3.1. Analysis of Subjective Survey Results

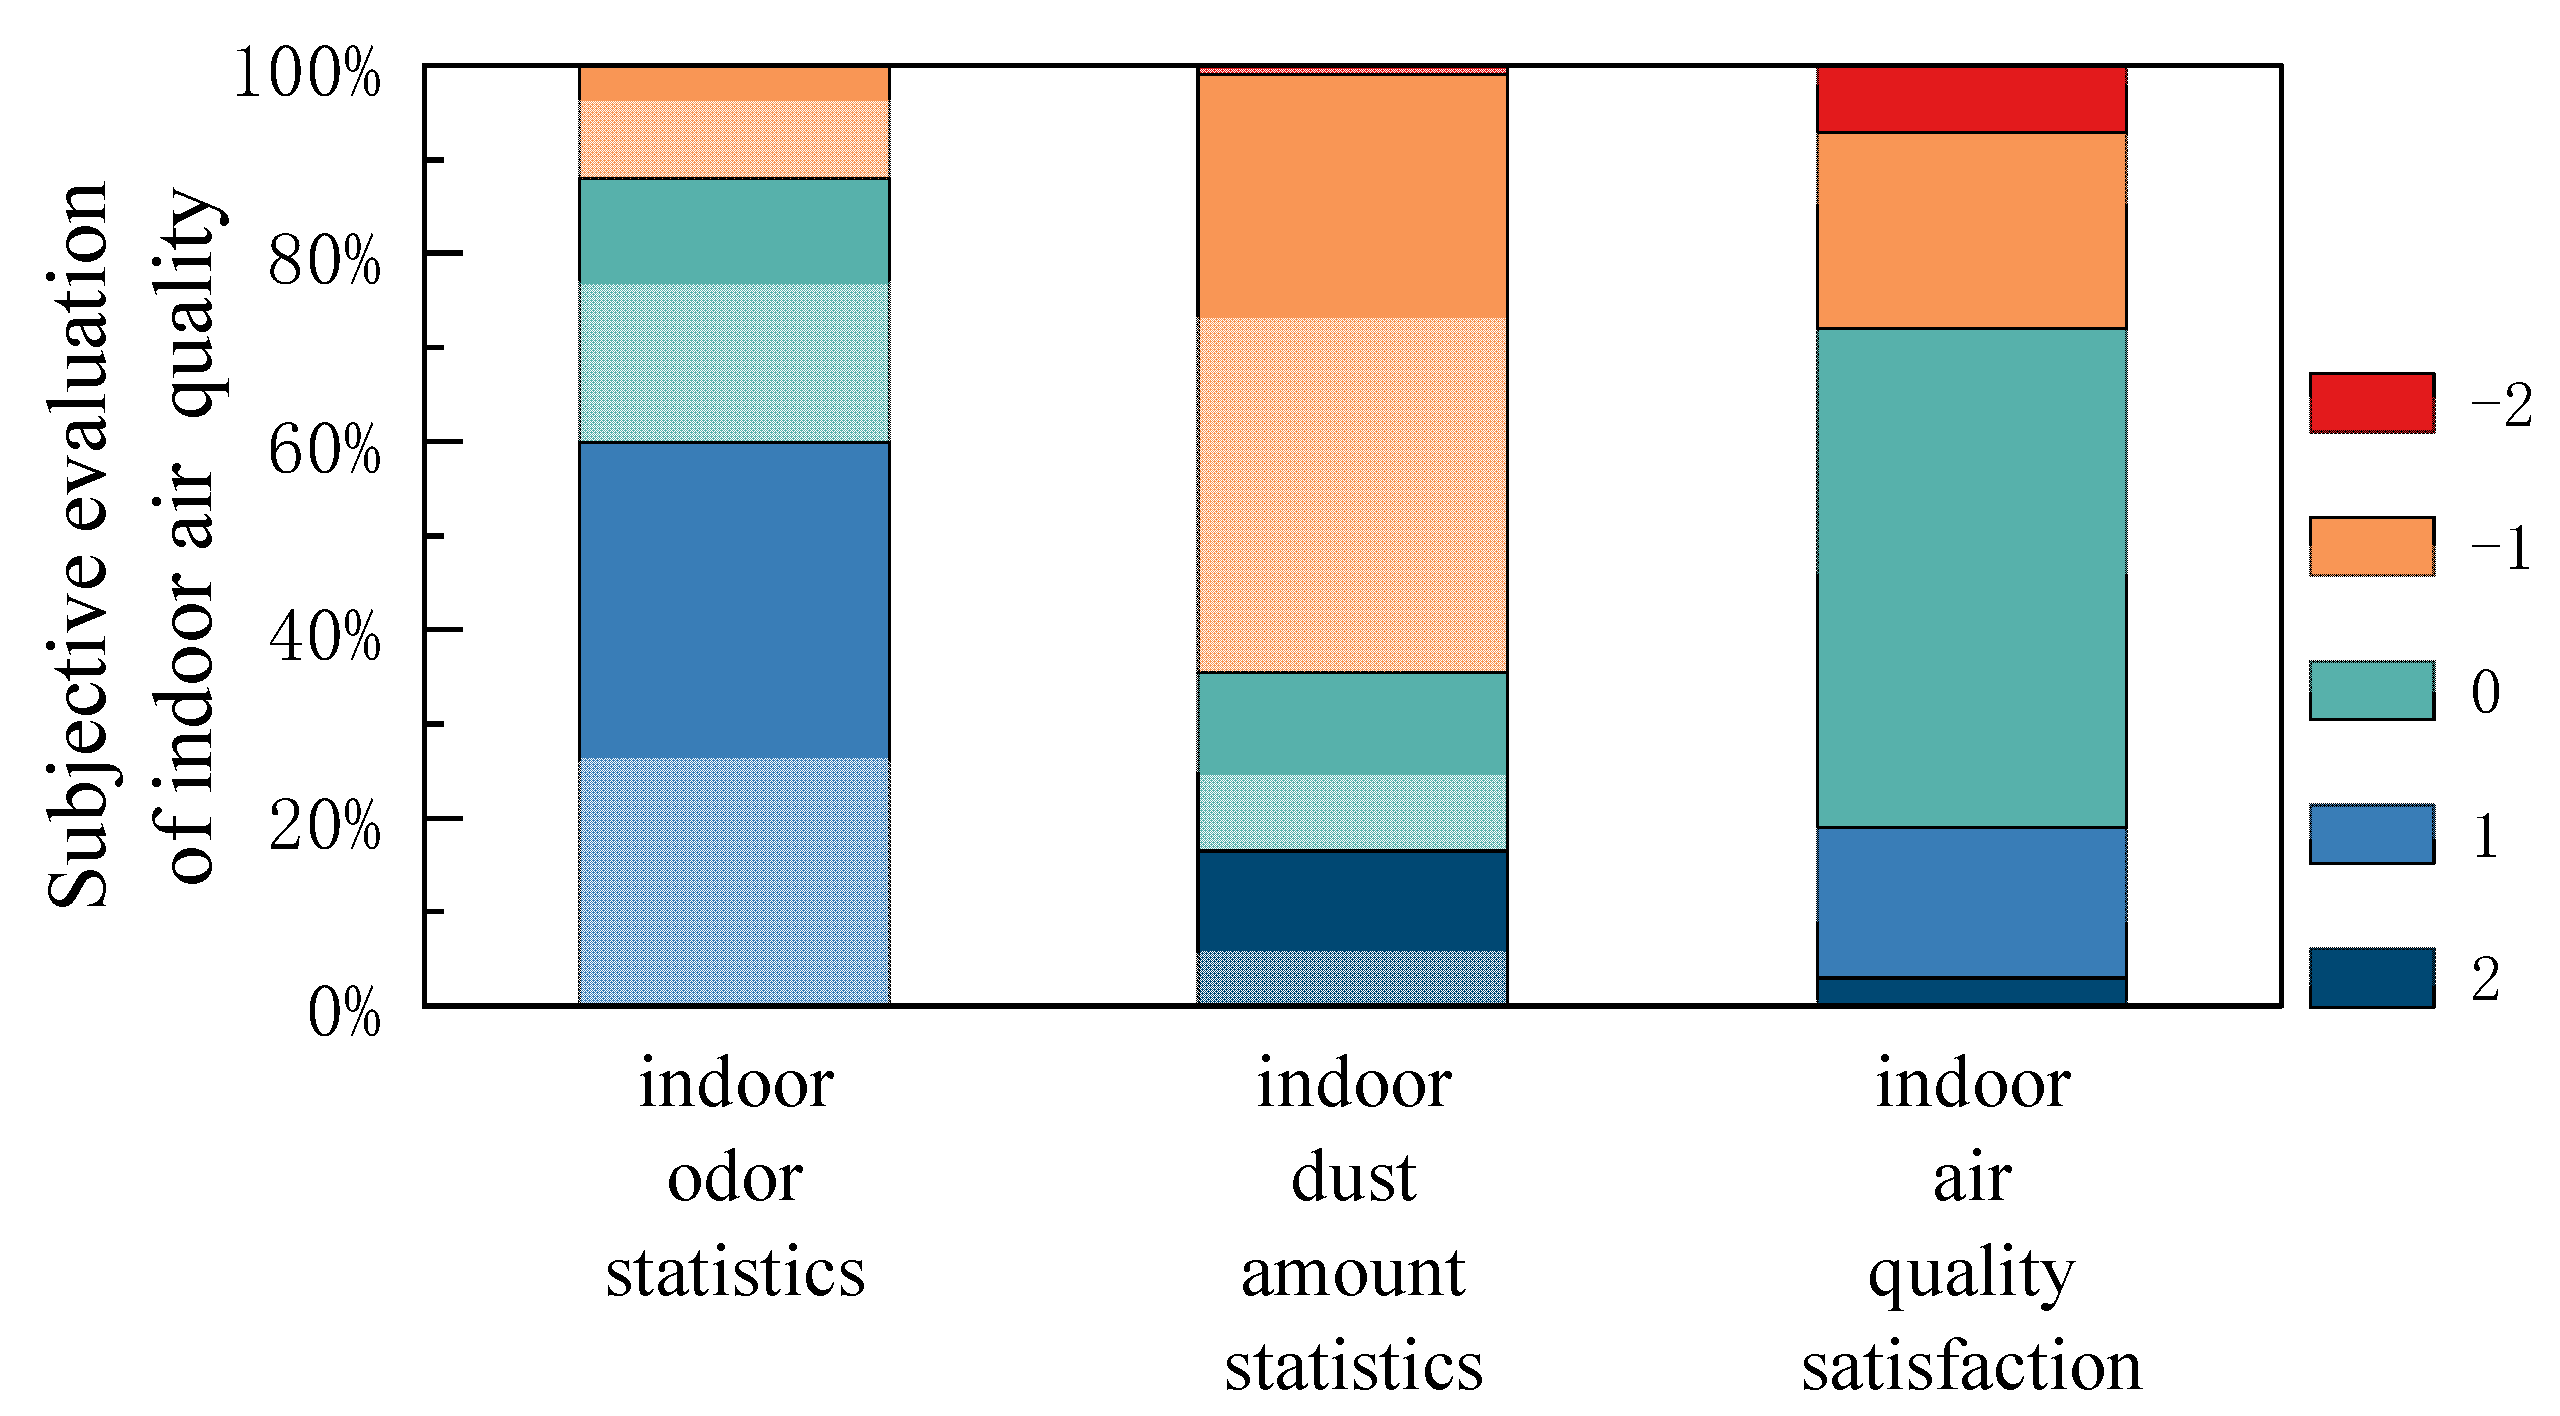
The findings of the subjective investigation are presented below. Approximately 3.5% of individuals perceive indoor odors as intolerable, whereas around 60% consider them to be mild. Approximately 63.5% of individuals perceive a minimal presence of indoor dust, while around 16.5% perceive a significant accumulation of indoor dust. Approximately 21% of individuals report being “dissatisfied” with indoor air quality, whereas 53% of residents indicate they are “basically satisfied” with it (Figure 9). There is no significant correlation between the objective concentrations of indoor air pollutants and residents’ subjective satisfaction ratings; in some cases, a negative correlation even emerges. This indicates that residents’ subjective satisfaction with indoor air quality diverges from objective test results.
This phenomenon may be attributed to several contributing factors: (1) Long-term exposure to polluted environments may induce sensory adaptation, leading residents to develop olfactory de-sensitization to persistent pollutants; (2) In severely cold weather, residents often prioritize thermal comfort over air quality, habitually reducing ventilation to maintain indoor temperatures; (3) Survey responses indicate that residents’ assessments of air quality rely heavily on noticeable sensory indicators (such as smoke or odors), while their awareness of health risks posed by colorless, odorless pollutants like PM2.5 remains relatively limited.

4.3.2. Evaluation Using the Gray Relational Analysis Method

1.
Data processing
Utilizing indoor air quality evaluation standards [49] (refer to Table 8) and field test data for indoor air quality (refer to Table 9) using Equation (4).
This yielded dimensionless indoor air quality evaluation standards for stone cave dwellings (Table 10) and measured concentration values of indoor pollutants (Table 11).
2.
Establishing a correlation matrix
Using Equations (5)–(7), ∆max and ∆min can be obtained.
Δ min = min i   min j   min k y i ( k ) y j ( k ) = 0.137
Δ max = max i   max j   max k y i ( k ) y j ( k ) = 5 . 837
3.
Indoor air quality grade assessment
Table 12 illustrates a comparison of evaluation levels for four indoor pollutants across winter and summer. The air quality in stone cave dwellings is classified as “Heavy pollution” during winter and “Medium pollution” in summer, demonstrating a notable increase in air pollution levels in winter compared to summer. Increased indoor air pollution during winter is attributed to heating methods that involve the combustion of wood or coal. Harmful gases emitted by these materials accumulate indoors in the absence of effective ventilation, resulting in degraded air quality. Furthermore, maintaining closed doors and windows for heat retention results in inadequate ventilation, leading to the accumulation of indoor pollutants and elevated concentration levels.
Although air quality varies between winter and summer, the overall indoor air quality in stone cave dwellings remains poor and requires prompt improvement. Ventilation can be enhanced by opening windows regularly and installing ventilation equipment. Alternatively, pollution sources can be reduced by prioritizing clean energy heating methods in winter. Where conditions are limited, the combustion efficiency of existing stove-heated kangs can be improved, and clean stoves meeting emission standards should be adopted.

5. Conclusions

This research assessed the indoor conditions of stone cave dwellings in northern Shanxi, yielding the following primary conclusions:
(1)
Thermal Performance Analysis: Compared to conventional brick houses, traditional stone cave dwellings in northern Shanxi exhibit superior thermal stability (high thermal inertia index). However, their envelope insulation is severely inadequate relative to national standards. Quantitative analysis indicates that the thermal transmittance coefficients of their exterior walls and roofs exceed national limits by 4 times and 1.7 times, respectively, leading to substantial heat loss in winter. Additionally, indoor humidity levels in stone cave dwellings are excessively high, and the existing stove-heated kang system is inefficient, making it difficult to maintain baseline indoor temperatures. Recommendations include prioritizing thermal insulation upgrades for the building envelope to reduce heat transfer coefficients, while simultaneously improving the heating system and installing ventilation facilities. These measures would elevate indoor temperature and humidity to standard ranges (temperature ≥ 14 °C, humidity 30–60%).
(2)
Thermal Comfort Evaluation: The theoretical thermal neutral temperature calculated by the PMV model (21.32 °C) is significantly higher than the actual thermal neutral temperature determined by TSV (10.96 °C). This clearly indicates that residents have achieved perceived thermal neutrality in colder environments through behavioral adjustments and physiological adaptation. It demonstrates the limitations of the PMV model in such specific environments, while the TSV model may better align with residents’ actual thermal comfort. However, residents’ self-reported thermal preference temperature (12.75 °C) remains higher than their TSV neutral temperature. This indicates that while residents passively adapt to the cold, they still express a clear desire for improved thermal environments. Therefore, subsequent improvement targets should be set at least at 12.75 °C, with the National Standard for Indoor Temperature in Rural Dwellings (14 °C) recommended as a more optimal goal.
(3)
Air Pollutant Concentration and Quality Assessment: Under stove-heated conditions, the primary indoor air pollutants in stone cave dwellings are PM2.5, PM10, CO2, and TVOC. Monitoring data indicate that pollution is particularly severe in winter, with exceedance rates for PM2.5, PM10, and CO2 all exceeding 80%. While pollution levels decrease in summer, exceedance rates for PM2.5 and PM10 remain high (71.5% and 47.5%, respectively). A comprehensive evaluation based on gray relational analysis reveals that indoor air quality in summer is classified as “moderately polluted,” while it deteriorates to “heavily polluted” in winter. Notably, subjective questionnaire surveys show that residents’ self-reported perceptions of indoor air quality were generally more favorable than objective measurements, indicating insufficient awareness of actual pollution risks and weak sensory capabilities. Therefore, there is an urgent need to enhance public risk awareness through health promotion and science education, thereby building public support for implementing effective pollution control measures such as clean heating and improved ventilation.
However, this study still has several limitations. First, although stone cave dwellings, as traditional residential buildings, exhibit excellent thermal stability, their material structure has inherent flaws: the envelope has a high heat transfer coefficient, resulting in insufficient thermal insulation performance in winter. Second, most cave dwellings adopt stove-heated kang, which is highly polluting and subject to limited ventilation conditions. This is not conducive to pollutant diffusion, thereby exacerbating indoor air pollution caused by the use of non-clean energy. Third, restricted by research conditions, the sample size is limited, and the geographical distribution is concentrated. The proportion of elderly residents among the respondents is relatively high, and their environmental perception patterns formed through long-term adaptation may introduce group biases in subjective evaluations. In addition, field monitoring was mainly conducted in winter and summer, failing to systematically cover the transitional spring and autumn seasons. Future research needs to further expand the temporal scope of observations.
Author Contributions

Conceptualization, X.D. and Y.L.; methodology, Y.L.; formal analysis, Y.L.; investigation, Y.L.; resources, X.D.; data curation, Y.L.; writing—original draft preparation, Y.L.; writing—review and editing, X.D. and Y.L.; supervision, X.D.; project administration, X.D. All authors have read and agreed to the published version of the manuscript.

Funding

This research was funded by the National Natural Science Foundation of China, grant number 52208026; Exploration of Research-Oriented Learning Models for “Architectural Technology Experimental Practice Courses” Under the Concept of Integrating Science and Education 2024 Shanxi Provincial Higher Education General Teaching Reform and Innovation Project, grant number J20240225.

Institutional Review Board Statement

The study was conducted according to the guidelines of the Declaration of Helsinki and approved by the Biomedical Ethics Committee of Taiyuan University of Technology (protocol code TYUT2025070403).

Informed Consent Statement

Informed consent was obtained from all subjects involved in the study. Written informed consent has been obtained from the patients to publish this paper.

Data Availability Statement

The original contributions presented in the study are included in the article; further inquiries can be directed to the corresponding author.

Acknowledgments

The authors thank all those who participated in the survey.

Conflicts of Interest

The authors declare no conflicts of interest.

Appendix A

Indoor Thermal Environment and Indoor Air Quality Questionnaire
Gender: □ Male □ Female
Age:
Length of residence at the current address:
Annual personal income:
Subject’s current activity status:
□ Recumbent (reclining) □ Sitting posture □ Standing □ Walking
Health condition: □ Very good □ Good □ Average □ Poor □ Very poor
Does anyone in your household smoke: □ Yes □ No
1. What is your evaluation of the current temperature?
□ Very uncomfortable
□ Uncomfortable
□ Slightly uncomfortable
□ Neutral
□ Slightly comfortable
□ Comfortable
□ Very comfortable
2. What are your expectations for the current temperature?
□ Increase □ No change □ Decrease
3. What is your evaluation of the current humidity?
□ Very humid
□ Humid
□ Slightly humid
□ Neutral
□ Slightly dry
□ Dry
□ Very dry
4. What are your expectations for the current humidity?
□ Increase □ No change □ Decrease
5. How do you feel about the current indoor odor?
□ No odor
□ Very slight odor
□ Slight odor
□ Strong odor
□ Unbearable
6. What is your evaluation of the current indoor dust condition?
□ Not at all
□ Little
□ Average
□ Much
□ Very much
7. How do you perceive the current indoor air quality?
□ Very satisfied
□ Satisfied
□ Basically satisfied
□ Dissatisfied
□ Very dissatisfied

References

  1. Sheng, X. Field Testing and Analysis of Thermal Comfort in Rural and Urban Dwellings in Severe Cold Regions; Harbin Institute of Technology: Harbin, China, 2013. [Google Scholar]
  2. Gu, Y.; Li, Y.; Jia, Z.; Gao, W. Study on the effects of rural indoor thermal environment on cardiovascular physiological parameters of the elderly. Build. Sci. 2023, 39, 213–218. [Google Scholar]
  3. Feng, W.; Meng, Y. Research on the Construction and Sustainable Development of Cave Dwellings in Mogou Village, Mengzhou City. Buildings 2025, 15, 1460. [Google Scholar] [CrossRef]
  4. Cheng, X.; Jing, S.; Yang, Y.; Xu, W.; Wang, Z.; Lan, Z. Study on the indoor thermal comfort of cave dwellings in cold areas of China. J. Build. Eng. 2024, 86, 108949. [Google Scholar] [CrossRef]
  5. Minh, L.D.; Yoon, P.D.; Jeongyeop, B.; Prapavee, K.; Seongju, C. Multi-criteria decision making for adaptive façade optimal design in varied climates: Energy, daylight, occupants’ comfort, and outdoor view analysis. Build. Environ. 2022, 223, 109479. [Google Scholar] [CrossRef]
  6. Shi, L.; Wang, J.; Han, X.; Wei, W.; Guo, Y.; Liu, J. Natural ventilation of underground shelters to improve indoor thermal and moisture environments in the various climates of China. Tunn. Undergr. Space Technol. Inc. Trenchless Technol. Res. 2024, 153, 105916. [Google Scholar] [CrossRef]
  7. Barreca, F.; Tirella, V. A self-built shelter in wood and agglomerated cork panels for temporary use in Mediterranean climate areas. Energy Build. 2017, 142, 1–7. [Google Scholar] [CrossRef]
  8. Okafor, M.U.; Osita, A.B.; Kenneth, O.; Udochukwu, M.; Clinton, A. Evaluation of Indoor Thermal Comfort Conditions of Residential Traditional and Modern Buildings in a Warm-Humid Climate. Sustainability 2022, 14, 12138. [Google Scholar] [CrossRef]
  9. The Ministry of Housing and Urban-Rural Development and the National Development and Reform Commission issued the Implementation Programme for Carbon Peak in Urban and Rural Construction. Shanghai Energy Conserv. 2022, 941.
  10. Dong, X.; Shi, X.; Jin, M. A review of indoor environment research on farmhouse heating season in the northern region. Archit. Cult. 2021, 31–32. [Google Scholar] [CrossRef]
  11. Zhang, T.; Duan, Y.; Jiao, Z.; Ye, X.; Hu, Q.; Fukuda, H.; Gao, W. Towards Improving Rural Living Environment for Chinese Cold Region Based on Investigation of Thermal Environment and Space Usage Status. Buildings 2022, 12, 2139. [Google Scholar] [CrossRef]
  12. Jinya, T. Field investigation of lifestyle and indoor environment with COVID-19 in facilities for older adults in cold regions of Japan. E3S Web Conf. 2023, 396, 01027. [Google Scholar]
  13. Kumar, S.D.; Bahadur, R.H.; Genku, K.; Masanori, S. Study on wintry comfort temperature and thermal improvement of houses in cold, temperate, and subtropical regions of Nepal. Build. Environ. 2021, 191, 107569. [Google Scholar] [CrossRef]
  14. Yuan, M.; Wang, Y. Experimental study on the effect of indoor air temperature and humidity on human thermal comfort. Build. Energy Conserv. 2014, 42, 17–20. [Google Scholar]
  15. Gao, C.; Xiang, J.; Wu, S.; Liu, Q. Simulation Study on the Influence of Indoor and Outdoor Ventilation on Thermal Comfort in Zero Energy Buildings. IOP Conf. Ser. Earth Environ. Sci. 2021, 719, 022038. [Google Scholar] [CrossRef]
  16. Hong, X.; Zhang, G.; Zhang, Y. The effects of building layouts and envelope on indoor thermal environment of Hui style traditional buildings in Wuyuan. E3S Web Conf. 2020, 194, 05013. [Google Scholar] [CrossRef]
  17. Khei, S.; Mateus, R.; Ortega, J.; Llorente, R.B. Long-Term Monitoring of Thermal Performance in Vernacular Buildings: A Case Study in Montesinho Natural Park, Portugal. IOP Conf. Ser. Earth Environ. Sci. 2025, 1536, 012017. [Google Scholar] [CrossRef]
  18. Zhang, L.; Han, Q.; Jin, G.; Zhu, Y.; Cui, X.; Han, W.; Yu, H. Thermal environment testing and climate adaptation analysis of traditional dwellings in extremely dry and hot regions. Build. Sci. 2023, 39, 50–56. [Google Scholar]
  19. Tejedor, B.; Casals, M.; Gangolells, M. Assessing the influence of operating conditions and thermophysical properties on the accuracy of in-situ measured U -values using quantitative internal infrared thermography. Energy Build. 2018, 171, 64–75. [Google Scholar] [CrossRef]
  20. Roque, E.; Vicente, R.; Almeida, R.M.S.F.; Silva, J.M.D.; Ferreira, A.V. Thermal characterisation of traditional wall solution of built heritage using the simple hot box-heat flow meter method: In situ measurements and numerical simulation. Appl. Therm. Eng. 2020, 169, 114935. [Google Scholar] [CrossRef]
  21. Evangelisti, L.; Cristo, E.D.; Monteleone, S.; Guattari, C.; Gori, P.; Rubeis, T.D.; Ambrosini, D. Development and validation of a non-contact method for U-value estimation in heritage and existing buildings. Results Eng. 2025, 28, 107276. [Google Scholar] [CrossRef]
  22. Holmes, M.J.; Hacker, J.N. Climate change, thermal comfort and energy: Meeting the design challenges of the 21st century. Energy Build. 2007, 39, 802–814. [Google Scholar] [CrossRef]
  23. Rosso, F.; Ciancio, V.; Dell’Olmo, J.; Salata, F. Multi-objective optimization of building retrofit in the Mediterranean climate by means of genetic algorithm application. Energy Build. 2020, 216, 109945. [Google Scholar] [CrossRef]
  24. Xu, J.; Xie, W.; Han, H.; Xiao, C.; Li, J.; Zhang, Y.; Chen, S.; Zhao, B.; Zhang, D.; Zhou, H. Radiative Cooling Materials for Extreme Environmental Applications. Nano-Micro Lett. 2025, 17, 324. [Google Scholar] [CrossRef]
  25. Wu, R.; Huang, M.; Huang, G.; Liu, X. Digital-driven optimisation methods for the thermal comfort and spatial form of traditional Beijing Siheyuan architecture. Indoor Built Environ. 2025, 34, 1183–1204. [Google Scholar] [CrossRef]
  26. Wang, X.; Qiu, Y.; Yang, Y. Integrated Control Strategy for Indoor Environments Based on Thermal Comfort and Enthalpy Values. Sci. Technol. Eng. 2022, 22, 6270–6277. [Google Scholar]
  27. Syah, A.F.; Rozita, H.; Norfazilah, A.; Mazni, B.; Hasni Ja’afar, M. Assessment of indoor thermal comfort temperature and related behavioural adaptations: A systematic review. Environ. Sci. Pollut. Res. Int. 2023, 30, 73137–73149. [Google Scholar]
  28. Yu, Z.; Guo, Z.; Ling, Z.; Chen, Y. Research on Low-Carbon Building Design Strategies for Folk Dwellings in Hanzhong Based on Single Objective Optimization. Buildings 2024, 14, 2154. [Google Scholar] [CrossRef]
  29. Wen, X.; Guan, W.; Li, J.; Li, H. The Impact of Heating Methods on Indoor Environments in Rural Dwellings. Chin. J. Agric. Mach. Chem. 2018, 39, 63–70. [Google Scholar]
  30. Sharma, R.; Sharma, V. Thermal comfort analysis of vernacular mud houses in the low hills of Himachal Pradesh in winters. Environ. Dev. Sustain. 2025; prepublish. [Google Scholar] [CrossRef]
  31. Sainnokhoi, T.A.; Tuvshinbayar, Y.; Ochir, M.B.; Varanka, B.E.; Hubai, K.; Teke, G.; Trájer, A.; Tumurbus, A.; Kováts, N. Indoor environments: Evaluating air quality in Ulaanbaatar’s traditional gers. Chemosphere 2025, 377, 144338. [Google Scholar] [CrossRef]
  32. Ding, Y.; Yao, Y. Characteristics of winter indoor thermal environment and air quality of traditional village buildings in Chongqing. Sci. Technol. Eng. 2023, 23, 2115–2121. [Google Scholar]
  33. Karaca, F.; Guney, M.; Agibayeva, A.; Otesh, N.; Kulimbet, M.; Glushkova, N.; Chang, Y.; Sekikawa, A.; Davletov, K. Indoor air quality in Kazakh households: Evaluating PM2.5 levels generated by cooking activities. Eng. Rep. 2024, 6, e12845. [Google Scholar] [CrossRef]
  34. Liu, L.; Gao, J.; Luo, Z.; Liu, J.; Wang, L.; Yuan, Y. Field investigation of indoor air quality and its association with heating lifestyles among older people in severe cold rural China. J. Build. Eng. 2024, 95, 110086. [Google Scholar] [CrossRef]
  35. Ilie, A.M.C.; Dagvadorj, A.; Byambadorj, E.; Ariunsaikhan, A.; Tsogtsaikhan, A.; Nyamsambuu, O.E.; Bombyk, M. Addressing Air Pollution in Ulaanbaatar and Evaluating Indoor Air Quality in Gers with Cooking, Heating, and Insulation Packages (CHIP) †. Environ. Sci. Proc. 2023, 27, 26. [Google Scholar]
  36. Wang, D.; Liu, L.; Li, H.; Zheng, K.; Xu, Z.; Jia, S. Indoor environmental evaluation of different clean heating methods in rural houses in Tianjin. Build. Sci. 2020, 36, 126–132. [Google Scholar]
  37. Maksimul, I.M.; Roshan, W.; Hisham, Z.; Marshall, J.D.; Rob, B.; Grieshop, A.P. Assessing the Effects of Stove Use Patterns and Kitchen Chimneys on Indoor Air Quality during a Multiyear Cookstove Randomized Control Trial in Rural India. Environ. Sci. Technol. 2022, 56, 8326–8337. [Google Scholar] [CrossRef]
  38. Li, J.; Guan, W.; Li, H.; Huang, J.; Wang, C. Research on the effect of heating mode on indoor air quality in rural areas with severe cold. J. Sol. Energy 2020, 41, 232–239. [Google Scholar]
  39. Zhang, M.; Dong, X.; Feng, J. Indoor Air Quality Evaluation in Rural Houses Using Different Heating Methods in Northern Shanxi, China. Sustainability 2024, 16, 5912. [Google Scholar] [CrossRef]
  40. Wang, W.; Chen, Y.; Xie, Y.; Wu, L. Research on Influence Factors of Air Quality in the Host Area of the 24th Winter Olympic Games Based on Grey Relational Analysis. Front. Environ. Sci. 2021, 9, 757533. [Google Scholar] [CrossRef]
  41. Peng, Z.; Su, P.; Chen, W. Indoor Air Quality Assessment of Metro Stations Based on the Optimal Combination Weight and Improved Fuzzy Comprehensive Evaluation. J. Environ. Eng. 2023, 149. [Google Scholar] [CrossRef]
  42. Wang, Z.; Tang, R. Evaluation of indoor air quality in farmhouses in winter in severe cold areas. Build. Sci. 2016, 32, 48–53. [Google Scholar]
  43. GB/T 50824-2013; Energy-Saving Design Standards for Rural Residential Buildings. General Administration of Quality Supervision, Inspection and Quarantine of the People’s Republic of China: Beijing, China, 2013.
  44. GB/T 18883-2022; Indoor Air Quality Standards. State Administration of Market Supervision and Administration, National Standardization Management Committee: Beijing, China, 2022.
  45. ANSI/ASHRAE Standard 55-2023; Thermal Environmental Conditions for Human Occupancy. American National Standards Institute: New York, NY, USA, 2023.
  46. GB/T 50785-2012; Evaluation Standard for Indoor Heat and Humidity Environment of Civil Buildings. General Administration of Quality Supervision, Inspection and Quarantine of the People’s Republic of China: Beijing, China, 2012.
  47. ISO 7726; Ergonomics of the Thermal Environment—Instruments for Measuring Physical Quantities. German Institute for Standardization: Berlin, Germany, 2002.
  48. Lu, Y. Environmental Assessment, 2nd ed.; Tongji University Press: Shanghai, China, 1999. [Google Scholar]
  49. Jokl, M.V. Evaluation of indoor air quality using the decibel concept based on carbon dioxide and TVOC. Build. Environ. 2000, 35, 677–697. [Google Scholar] [CrossRef]
  50. Li, N.; Zhu, C.; Wen, W. Gray evaluation of indoor air quality. J. Hunan Univ. (Nat. Sci. Ed.) 2002, 29, 85–91. [Google Scholar]
  51. GB50176-2016; Thermal Design Code for Civil Buildings. General Administration of Quality Supervision, Inspection and Quarantine of the People’s Republic of China: Beijing, China, 2016.
  52. Shao, T.; Jin, H. A field investigation on the winter thermal comfort of residents in rural houses at different latitudes of northeast severe cold regions, China. J. Build. Eng. 2020, 32, 101476. [Google Scholar] [CrossRef]
  53. Mohamed, A.F. Comparative study of traditional and modern building techniques in Siwa Oasis, Egypt. Case Stud. Constr. Mater. 2020, 12, e00311. [Google Scholar] [CrossRef]
Figure 1. Flowchart of research participant recruitment and data collection.
Sustainability 17 10563 g001
Figure 2. Survey area.
Sustainability 17 10563 g002
Figure 3. Arrangement of measuring points.
Sustainability 17 10563 g003
Figure 4. The enclosure structure of a stone cave dwelling and an ordinary brick house: (a) Construction diagram of a stone cave dwelling wall; (b) Construction diagram of an ordinary brick house wall; (c) Construction diagram of a stone cave dwelling roof; (d) Construction diagram of an ordinary brick house roof.
Sustainability 17 10563 g004
Figure 5. Test results for the indoor thermal environment in stone cave dwellings: (a) Indoor and outdoor humidity in stone cave dwellings; (b) Indoor and outdoor temperature in stone cave dwellings.
Sustainability 17 10563 g005
Figure 6. Test results for the indoor air pollution in stone cave dwellings: (a) The concentration of PM2.5 within the stone cave dwellings throughout the winter and summer; (b) The concentration of PM10 within the stone cave dwellings throughout the winter and summer; (c) The concentration of CO2 within the stone cave dwellings throughout the winter and summer; (d) The concentration of TVOC within the stone cave dwellings throughout the winter and summer.
Sustainability 17 10563 g006
Figure 7. Relationships between the TSV and PMV and operating temperature.
Sustainability 17 10563 g007
Figure 8. Relationships between thermal preference temperature and operating temperature.
Sustainability 17 10563 g008
Figure 9. Indoor air quality questionnaire results.
Sustainability 17 10563 g009
Table 1. Measurement instruments.
InstrumentCalibration CycleParameter NameSensor NameBasic ParametersIllustrations
TH42W-E Temperature and Humidity RecorderThree monthsAir temperatureTest range−20 °C–70 °CSustainability 17 10563 i001
Measurement accuracy±0.1 °C of reading
Relative humidityTest range0–100% rh
Measurement accuracy±1.5%rh of reading
JT-IAQ Indoor Thermal Environment and Air Quality TesterThree monthsPM2.5Test range0–0.99 mg/m3Sustainability 17 10563 i002
Measurement accuracy±10%
PM10Test range0–0.99 mg/m3
Measurement accuracy±10%
CO2Test range0–5000 ppm
Measurement accuracy±30 ppm
TVOCTest range0.125–0.6 mg/m3
Table 2. Summary of participants in the field survey.
Subjects Details%
Age7~17 (Junior)21.40%
18~40 (Youth)64.20%
41~65 (Middle age)3222.38%
≥66 (elder)10372.02%
Table 3. Reliability and validity test.
DimensionClone Bach AlphaKMO Sampling Suitability QuantitySignificance (p)
Indoor thermal environment0.8000.7480.000
Indoor air quality0.8280.6680.000
Table 4. Composite index grading and description.
GradeFeature
CleanSuitable for human life
No-pollutionAll pollutant indexes within standard limits; human life is normal
Light pollutionAt least one excessive pollutant; except for sensitive people, usually no acute and chronic poisoning occurs
Medium pollutionUsually 2–3 excessive pollutants; the health of the population suffers, and sensitive persons suffer even more
Heavy pollutionUsually 3–4 excessive pollutants; the health of the population is severely damaged, and sensitive persons may be at risk of death
Table 5. Comparison of the thermal performance of external enclosure structures.
Building ConstructionTotal Thermal Resistance R0/[(m2·K)/W]Total Thermal Inertia Index ΣDHeat Transfer Coefficient K/[W/m2·K]Standard Limits for Heat Transfer Coefficient K/[W/m2·K] (GB50176)
Stone walls0.526.431.920.65
Solid brick walls0.473.302.13
Stone cave roof1.4815.660.680.50
Ordinary brick house roof0.291.873.45
Table 6. Exceedance rates of indoor pollutants.
ParametersPM2.5PM10CO2TVOC
Winter92.4%83.9%88.4%38.3%
Summer71.5%47.5%0%11.8%
Table 7. Regression models of TSV and PMV.
Regression ModelsTemperature Criterion (℃)
TSV = 1TSV = 0.5TSV = 0TSV = −0.5TSV = −1
TSV = 0.6964x − 7.630212.4011.6810.9610.249.52
PMV = 0.221x − 4.712825.8523.5921.3219.0616.80
Table 8. Evaluation criteria for indoor air quality.
GradeCleanNo-PollutionLight PollutionMedium PollutionHeavy Pollution
PM2.5/(mg/m3)0.010.0250.050.100.20
PM10/(mg/m3)0.040.0650.100.200.40
CO2/ppm400650100018003600
TVOC/(mg/m3)0.060.240.61.83.6
Table 9. Measured values of indoor air quality.
ParametersPM2.5/(mg/m3)PM10/(mg/m3)CO2/ppmTVOC/(mg/m3)
Winter0.540.589391.48
Summer0.260.285750.94
Table 10. Dimensionless indoor air quality evaluation criteria.
GradeCleanNo-PollutionLight PollutionMedium PollutionHeavy Pollution
PM2.50.001.142.002.863.72
PM100.001.062.003.515.03
CO20.001.062.003.284.80
TVOC0.001.202.002.953.56
Table 11. Dimensionless indoor pollutant measured values.
ParametersPM2.5PM10CO2TVOC/(mg/m3)
Winter4.965.841.862.78
Summer4.054.250.792.39
Table 12. Dimensionless indoor pollutant measured values.
ParametersCleanNo-PollutionLight PollutionMedium PollutionHeavy PollutionGrade
Winter0.001.142.002.863.72Heavy pollution
Summer0.001.062.003.515.03Medium pollution
Disclaimer/Publisher’s Note: The statements, opinions and data contained in all publications are solely those of the individual author(s) and contributor(s) and not of MDPI and/or the editor(s). MDPI and/or the editor(s) disclaim responsibility for any injury to people or property resulting from any ideas, methods, instructions or products referred to in the content.