Article

Experimental Investigation of the Hydraulic Performance of a Permeable Block Pavement System Using a Multi-Scale Testing Apparatus

1
Department of Transportation Engineering, Myongji University, Yongin 17058, Republic of Korea
2
Land and Housing, Research Institute, Deajeon 34047, Republic of Korea
*
Author to whom correspondence should be addressed.
Sustainability 2025, 17(23), 10535; https://doi.org/10.3390/su172310535
Submission received: 10 October 2025 / Revised: 16 November 2025 / Accepted: 18 November 2025 / Published: 24 November 2025

Abstract

Recent urbanization and climate change have altered the hydrologic characteristics of road surfaces, intensifying urban flooding and associated damage. This study focuses on permeable block pavements, a key LID technology for sustainable urban development, particularly with respect to their application for sidewalks. To quantitatively evaluate the permeability performance of the pavement system and clarify the infiltration mechanisms associated with different combinations of upper and lower aggregates, an integrated permeability testing apparatus was developed. Based on small-scale testing, the coefficient of permeability was quantitatively evaluated according to the gradation characteristics of the base aggregates. The results indicated that as the fine content increased and the coefficient of uniformity (Cu) decreased, the permeability coefficient also decreased. Furthermore, when blocks were added above the base layer, the permeability coefficient showed a decreasing trend, suggesting that even if the upper layers have higher intrinsic permeability, the hydraulic conductivity of the lower layers predominantly governs the overall permeability of the system. Using large-scale rainfall simulation, the permeability was evaluated under a rainfall intensity of 88.2 mm/h. The base-only configuration exhibited the highest storage capacity (approximately 36%), while adding the bedding layer and block pavement reduced the initial outflow time by up to 33 s.

1. Introduction

Rapid urbanization has expanded road networks; however, it has also altered the hydrologic characteristics of road surfaces by increasing impervious areas and lowering groundwater levels. Impervious surfaces restrict stormwater infiltration into the subgrade, leading to surface runoff-related damage and shortening the time of concentration, which causes drainage systems to exceed their designed capacities. Furthermore, the increased frequency and magnitude of extreme weather events driven by global climate change have intensified flooding, particularly in areas with extensive impervious coverage or low-lying topography, emphasizing the urgent need for effective risk management measures. Many countries recognize the importance of sustainable development and are promoting strategies that minimize the environmental impacts of human activities while fostering ecological balance and biodiversity [1].
An impervious surface is generally defined as any surface that prevents water from infiltrating into the soil, such as roads, parking lots, and rooftops [2]. Paved structures occupy approximately 30% of urban land and inevitably disrupt natural drainage and hydrologic circulation systems [3,4]. Consequently, innovative pavement structures have gained attention as effective means of mitigating the negative impacts of pavement construction on sustainable development. Representative systems include Sustainable Drainage Systems (SUDs), Stormwater Best Management Practices (BMPs), and Low-Impact Development (LID) approaches [5,6,7]. SUDs are a collection of water management practices that aim to align modern drainage systems with natural water processes and are part of a larger green infrastructure strategy [8]. BMPs are control measures taken to mitigate changes in both the quantity and quality of urban runoff caused by changes to land use. Generally, BMPs focus on water quality problems caused by an increase in impervious surfaces due to land development [9]. LID is an urban development approach designed to minimize the adverse impacts of urbanization by promoting infiltration and storage at the source of the runoff, thereby restoring hydrologic conditions as close as possible to pre-development states. It reduces stormwater runoff by decreasing impervious surface areas in urban environments [10]. These approaches are sustainable methods for urban stormwater management, which are primarily applied for flood control, water quality improvement, and ecological restoration. While their fundamental concepts are similar, they differ in scope of application, with detailed information presented in Table 1.
Because surface water films generated during heavy rainfall can negatively affect driving safety, it is essential to evaluate the surface water retention, infiltration, and runoff abatement capacities of pavement structures [11]. The growing need for such capabilities has expanded the application of permeable pavement technologies, which have been extensively investigated by various researchers.
Permeable pavements effectively reduce runoff and remove pollutants, but the overall pavement structure—including the surface materials, base course, and subgrade—must be appropriately designed [5]. The runoff reduction effect of porous pavements was verified through SWMM (Storm Water Management Model) simulations and trend analysis, showing that peak runoff could be reduced by approximately 33.4% [6]. The hydrologic performance of a 1 m × 1 m laboratory-scale permeable pavement sample was experimentally evaluated, confirming that the adopted porous structure could retain up to 50% of the total rainfall volume [12]. Most previous studies focused on vehicular pavements with relatively high convertible (permeable) area ratios. However, since permeable pavements typically consist of open-graded aggregates with large voids, clogging and void reduction over time can degrade durability and long-term performance, limiting their broader applicability. In contrast, sidewalk pavements are subject to lower structural loads, providing greater design flexibility and potential for maintaining permeability. Nevertheless, research on sidewalk-type permeable pavements remains insufficient. Accordingly, domestic efforts have been made to explore the feasibility of applying permeable block pavements to sidewalks.
At present, the evaluation of permeability performance in sidewalk-type permeable block pavements mainly relies on relative surface infiltration tests, which assess the infiltration rate at the surface either for individual blocks or after installation. Most existing studies are simulation-based and evaluate the hydrologic efficiency of LID technologies rather than experimentally assessing actual infiltration behavior under rainfall conditions, with experimental investigations and measurement methods capable of reproducing real rainfall conditions and evaluating the overall hydraulic response of the pavement system remaining limited. Therefore, this study aims to develop an experimental apparatus and establish a measurement methodology capable of assessing the integrated hydraulic performance of sidewalk-type permeable block pavement systems rather than focusing on individual layers. Through this approach, we seek to experimentally quantify the influence of rainfall on pavement performance and provide an engineering basis for improving the field applicability of permeable block pavements in urban environments.

2. Literature Review

Permeable pavement, as one of the representative LID facilities, is considered the most effective technique to apply in urban areas, where major impervious surfaces are typically pedestrian pavements. Unlike conventional impervious pavements, permeable pavements must provide sufficient pore connectivity within the surface and underlying base layers to enable stormwater infiltration and temporary storage. Consequently, they exhibit distinct structural and hydraulic characteristics compared with conventional bases that utilize dense-graded aggregates. However, design standards and specifications for permeable pavements vary across institutions and regions. Therefore, this study aims to review and analyze domestic and international standards for permeable pavements to establish their fundamental characteristics and design considerations.

2.1. Review of Permeable Pavement Standards

In Korea, the Ministry of Environment published the LID Manual and Design Guidelines for LID Practices to promote the use of LID techniques that maintain natural hydrologic cycles and facilitate stormwater storage, infiltration, and evaporation [13,14]. These documents include general criteria for permeable pavements. However, explicit specifications for base layer materials have not been established. For sidewalks, the “Guidelines for Sidewalk Installation and Management” are referenced instead [15]. In addition, the permeable base layer may use crushed stone aggregates for road construction conforming to KS F 2523 (Crushed Stone for Road Construction) [16,17]. In the United States, the Interlocking Concrete Pavement Institute (ICPI) and the American Society of Civil Engineers (ASCE) recommend using aggregates with a gradation range corresponding to ASTM No. 57 for permeable bases [18,19]. The United Kingdom follows the Interpave standard, where the aggregate gradation and physical quality requirements are specified in BS EN 13242 [20]; aggregate size distributions differ depending on the pavement type and the layer (base or subbase) [21]. In Australia, Permeable Interlocking Concrete Pavement (PICP) systems are regulated under AS/NZS 4456 and the Concrete Masonry Association of Australia (CMAA) guidelines, which define gradation standards for base aggregates according to the proportion of heavy vehicle loading [22].
Overall, the characteristics and specifications of aggregates used for permeable pavements differ by country depending on climatic, regulatory, and construction conditions.
Since this study focuses on sidewalk-type permeable block pavements, domestic sidewalk standards were prioritized to establish the representative characteristics of the aggregates used for the base layer.

2.2. Characteristics and Permeability Evaluation Methods of Aggregates for Permeable Bases

Unlike conventional base layers constructed with dense-graded aggregates, permeable bases are composed of open-graded aggregates [23], in porous media such as open-graded aggregates, particle size distribution (PSD) plays a dominant role in determining hydraulic performance. These aggregates consist primarily of coarse particles of similar size with fines content, resulting in high porosity. The PSD of the base aggregate influences the size and connectivity of voids, where the pore throat structure governs hydraulic resistance [24]. A smaller coefficient of uniformity (Cu) indicates a more uniform gradation and, consequently, a more consistent pore pathway, which can lead to higher hydraulic conductivity [25]. Similarly, as the fines content decreases, interparticle voids become enlarged, providing greater permeability [26]. Thus, the hydraulic performance of the permeable base must be ensured through an appropriately designed gradation. Even when the surface layer (e.g., permeable blocks) exhibits high permeability, the overall system performance can be significantly reduced if a hydraulic bottleneck occurs within the lower structural layers.
Permeability evaluations of permeable block pavements are primarily conducted on surface materials rather than on the entire pavement system. Field test methods such as ASTM C1701 and ASTM C1781 [27,28] are commonly applied to measure surface infiltration rates. However, standardized testing methods to evaluate the permeability performance of permeable block pavement systems have not yet been established. For open-graded materials, ASTM D2434 [29] specifies the constant-head permeability test for determining the coefficient of permeability [30]. For permeable block pavements, tests that simulate field conditions—such as falling-head or in situ infiltration tests—are often adopted [31]. In Korea, permeability tests are performed in accordance with KS F 2322 (Test Method for Permeability of Soils) [32]. For highly permeable sandy soils, the constant-head method is used due to high discharge rates, whereas for fine-grained cohesive soils, the falling-head method is applied to determine the permeability coefficient [33,34]. It was found that no laboratory testing apparatus or procedure has been established to evaluate the integrated permeability performance of a composite pavement system consisting of permeable blocks, bedding, and base layers. This highlights the need to develop a system-level hydraulic performance evaluation method for permeable block pavements.

2.3. Research Distinctiveness and Summary

A review of previous studies indicates that most permeability evaluation research considering the substructure of permeable block pavements has primarily focused on vehicular pavements. Such studies typically examined the mechanical behavior and stiffness variation in open-graded aggregates according to gradation and compaction level or assessed the structural bearing capacity of the base layer using deflection-based testing devices. In contrast, permeability studies on permeable block pavements mainly focus on post-construction evaluations, such as investigating clogging mechanisms, surface infiltration degradation, and long-term sustainability. However, studies that integrate the substructure and analyze the overall hydraulic conductivity of the pavement system are notably lacking. The hydraulic performance of permeable pavements is strongly influenced by the uniformity of aggregate gradation and the size and distribution of pore voids. When large, well-connected pores are continuously distributed from the surface layer through the base layer, a consistent infiltration pathway is formed, thereby enhancing the overall hydraulic conductivity of the system.
Therefore, it is necessary to evaluate the permeability of the entire pavement system rather than assessing only the surface block or individual base aggregates. Although domestic and international standards for permeable block pavements provide general guidelines for the gradation of base aggregates, they lack detailed evaluation methods directly linking aggregate gradation characteristics to permeability performance. Accordingly, considering that sidewalk pavements prioritize hydraulic functionality over structural durability, this study distinguishes itself by developing a new experimental apparatus capable of evaluating the hydraulic conductivity of permeable base aggregates with varying gradations [35]. Thus, this study aims to quantitatively assess the relationship between aggregate gradation and permeability and to present empirical hydraulic data as a foundation for system-level design and performance evaluation of permeable block pavement structures.

3. Materials and Methods

3.1. Test Material

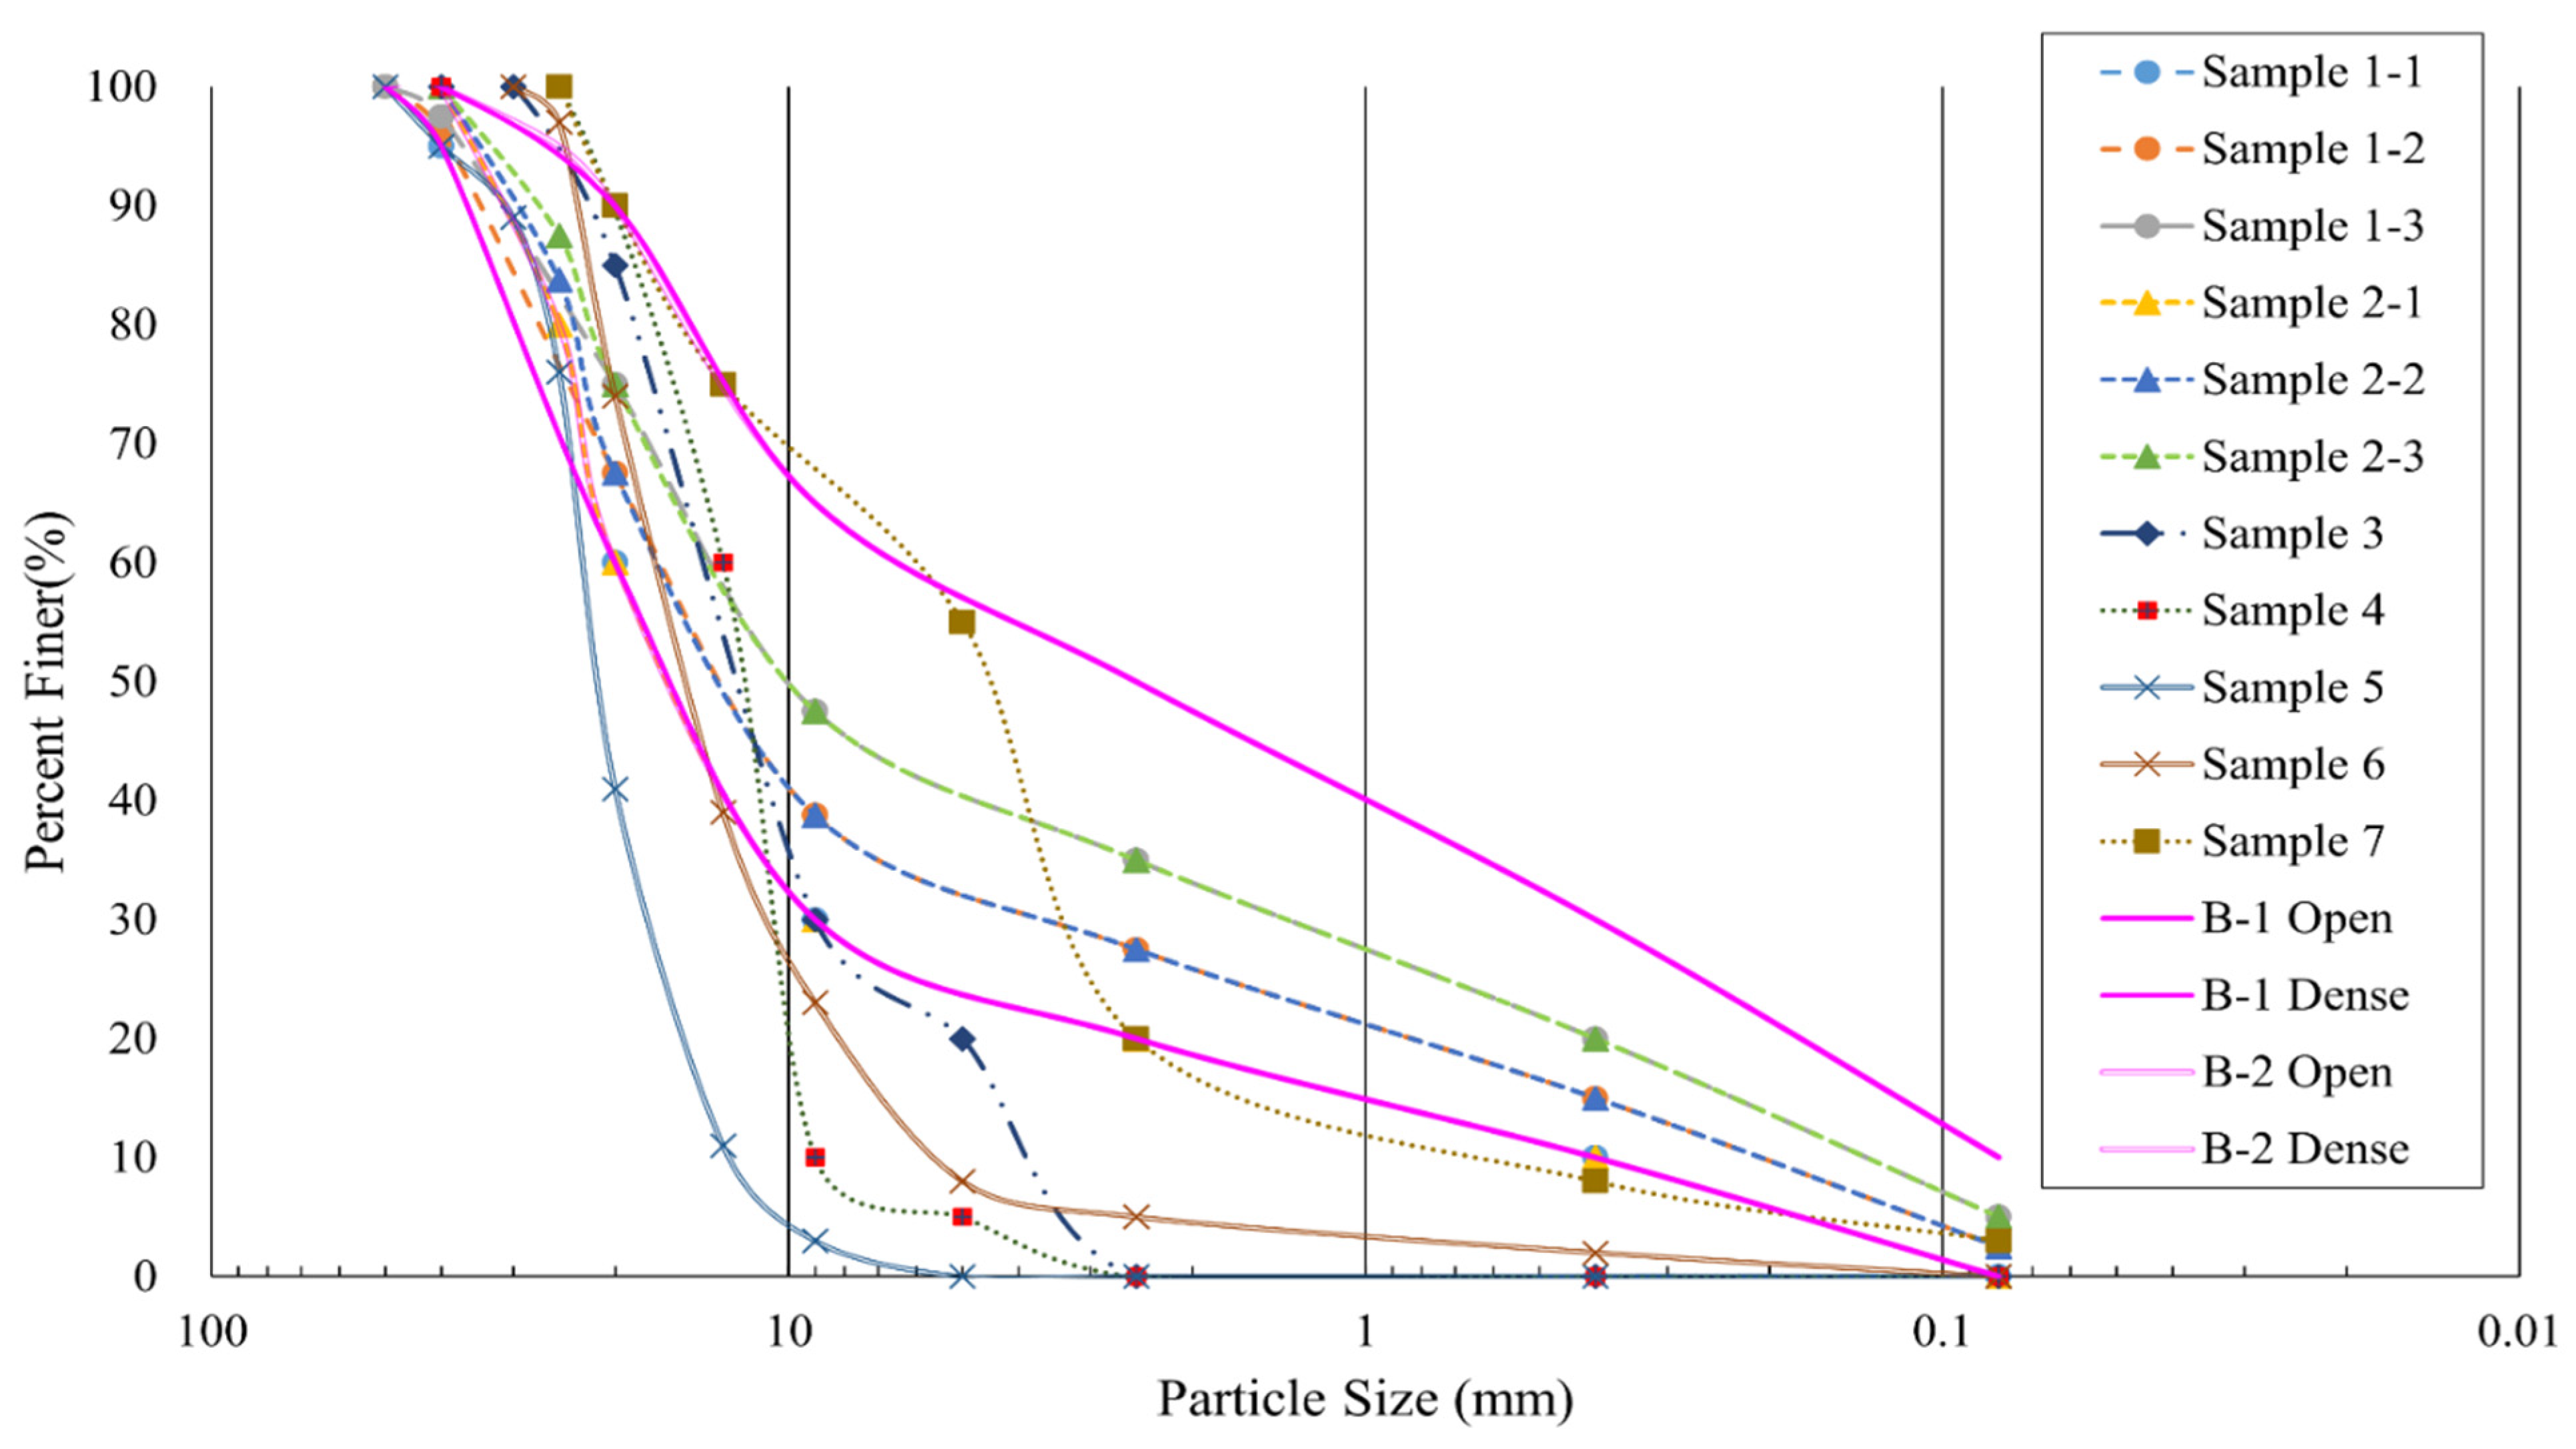
This study used crushed stone aggregates with a maximum particle size of 40 mm; their basic physical properties are summarized in Table 2. Prior to testing, the stockpiled aggregates were washed to remove impurities and fine dust, after which they were sieved using the gradation equipment shown in Figure 1 and classified by particle size, as illustrated in Figure 2. Subsequently, the aggregates were blended according to the gradation standards for permeable base materials adopted in domestic and international specifications, producing test samples with controlled particle size distributions. The PSDs of the test specimens are presented in Figure 3.
A comparative analysis of the gradation between conventional subbase aggregates (used for sidewalks) and permeable base aggregates revealed that, although the proportion of coarse aggregates was similar, the content of fine aggregates differed considerably. For the conventional subbase, 65% of fine aggregates passed a 4.75 mm sieve, indicating a relatively high proportion. Moreover, the gradation criteria for the fine fraction were subdivided into more detailed sieve size ranges. In contrast, the permeable base aggregates only contained up to 30% of fine aggregates, approximately half the fines content of the conventional subbase, and particles smaller than 2.36 mm were not further classified. These differences indicate that permeable base materials are intentionally designed with a limited fines content and an open-graded structure, which enhances pore connectivity and hydraulic conductivity, distinguishing them from dense-graded subbase materials used in conventional sidewalk pavements.

3.2. Permeability Evaluation Equipment

3.2.1. Small-Scale Measurement Equipment and Methods

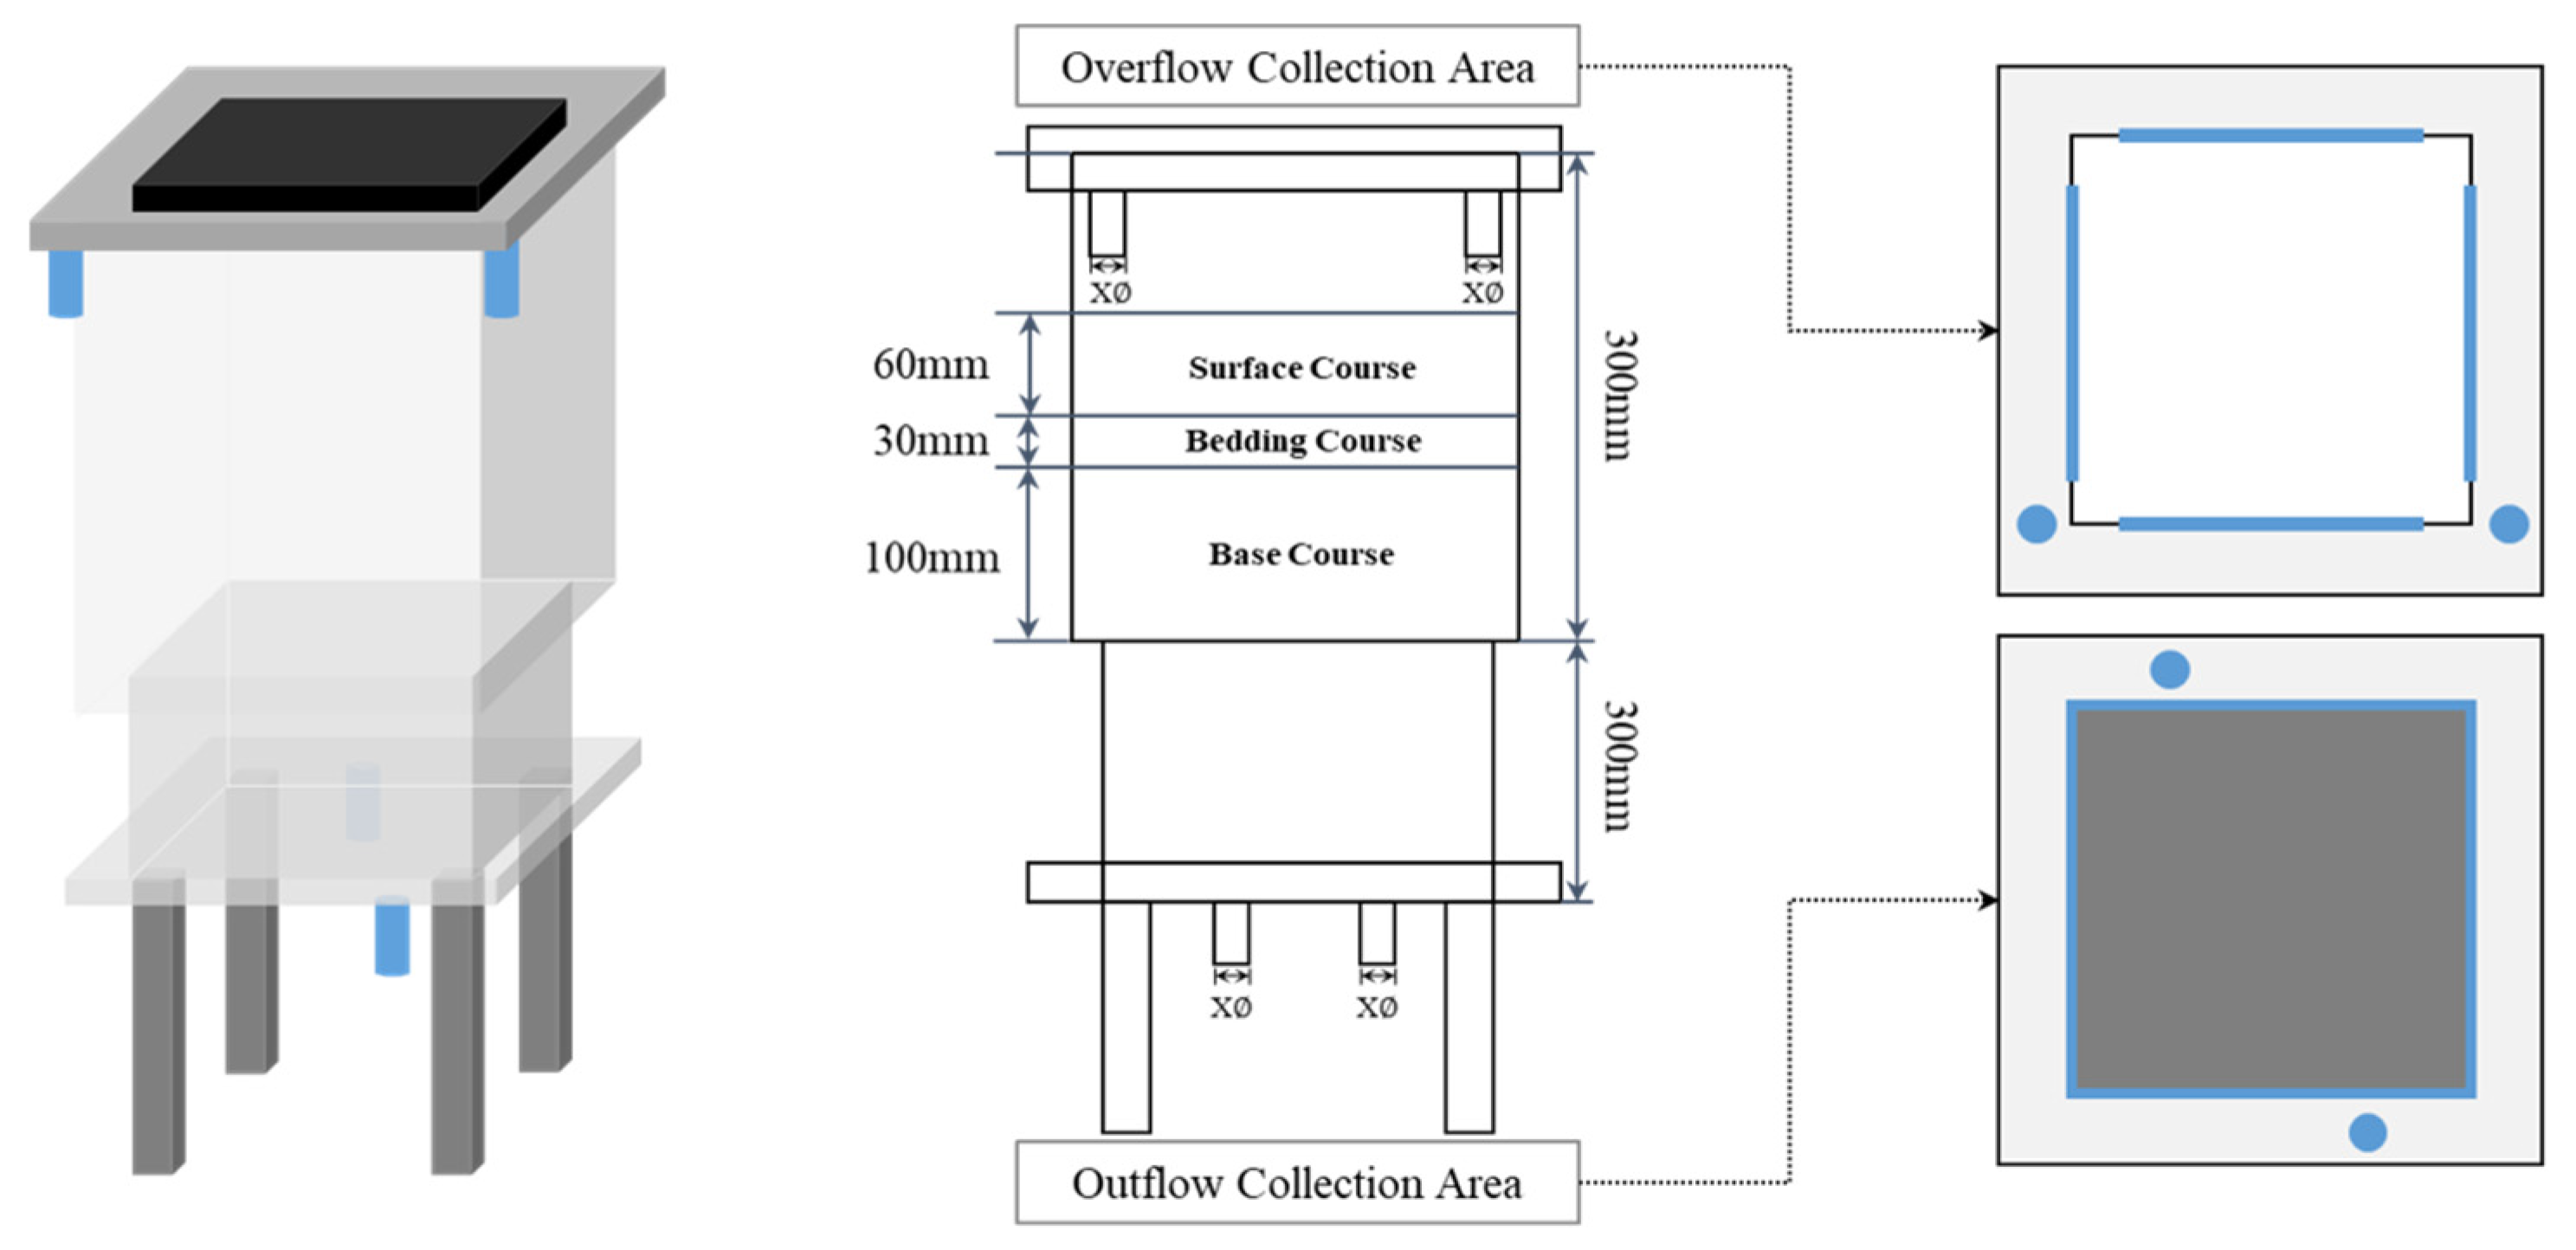
In this study, a permeability testing apparatus capable of evaluating the hydraulic performance of a permeable block pavement system was developed based on the principles of KS F 4419 and ASTM C1701 test methods; it is shown in Figure 4 [27,36]. The apparatus consists of two main components: (1) a specimen mold and (2) an outflow collection unit. They were designed to allow the installation of permeable blocks, as well as the underlying bedding and base layers. The subgrade was assumed to be impervious, and to replicate field compaction conditions, the apparatus was fabricated to permit manual compaction.
The mold dimensions were determined considering the gradation of aggregates used in the permeable base layer beneath the blocks. The apparatus has a plan dimension of 200 mm × 200 mm, and the height can be adjusted to 190 mm, 240 mm, or 290 mm depending on the base layer thickness, reflecting the actual thickness of sidewalk pavement structures. Water infiltrating through the specimen is collected at the bottom through an outflow collection chamber, allowing for the measurement of the volume of drained water that is not retained within the pavement system.
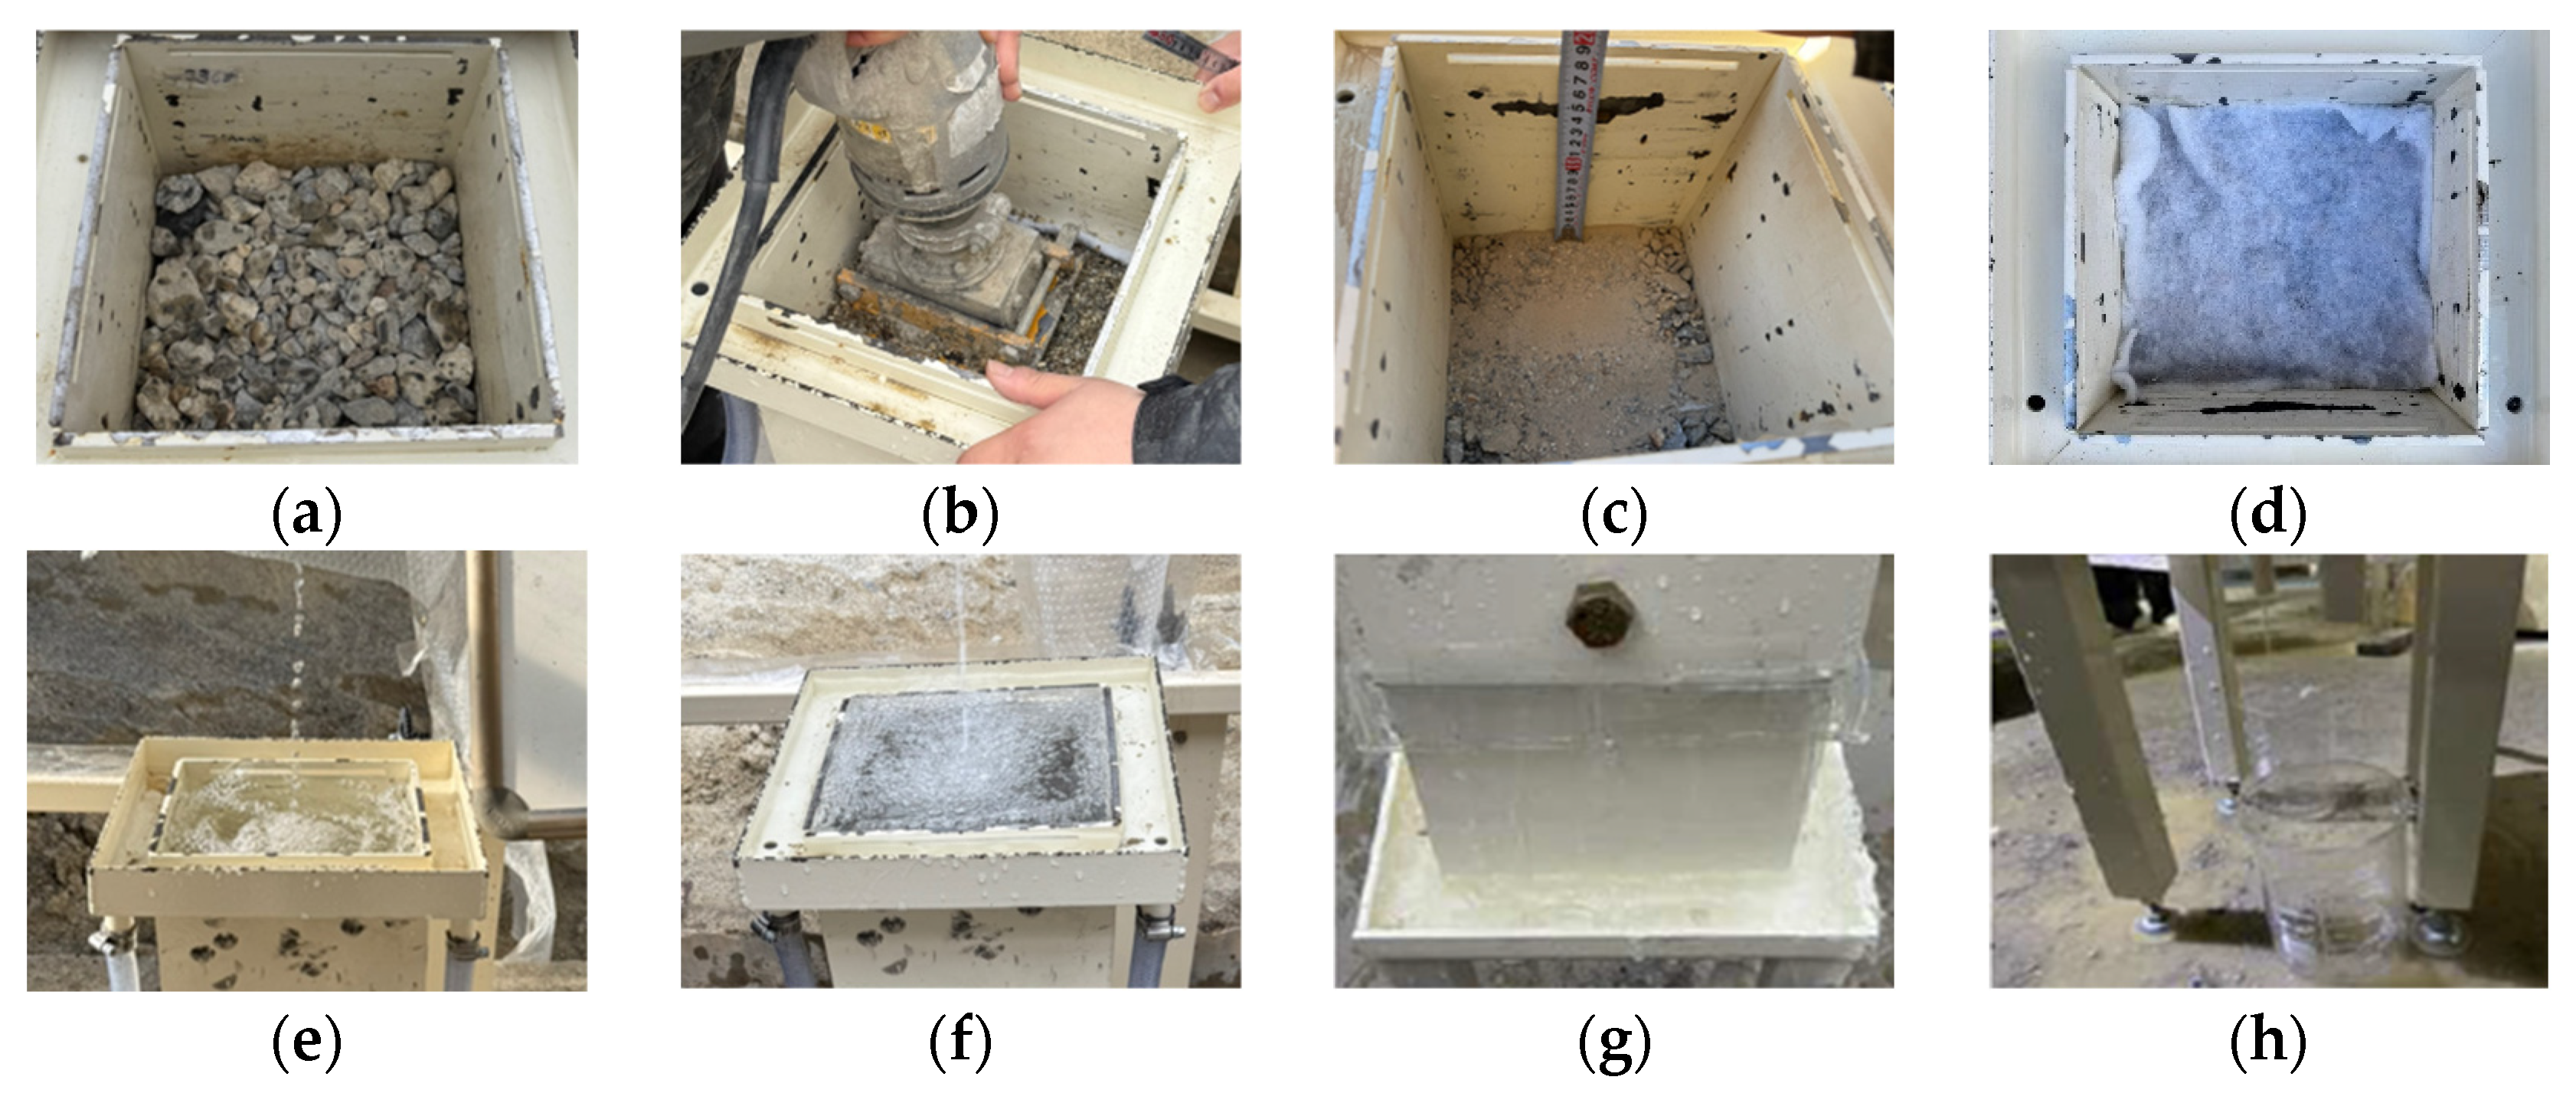
The test was designed with reference to the constant-head permeability test. Specimens were prepared by mixing coarse and fine aggregates according to their gradation characteristics, and the mixture was spread uniformly inside the test chamber. To ensure consistent and representative compaction across all specimens, a mass-based and volume-controlled compaction method was adopted. The specific gravity and bulk density of each aggregate size fraction were first measured. Then, based on the known internal volume of the mold and the target gradation, the required mass of each aggregate fraction was calculated and added accordingly. Compaction was performed manually using a steel hand tamper with a flat circular base, as shown in Figure 5. The material was compressed layer by layer to achieve the maximum practical packing density. After compaction, the specimen height was measured to verify consistency. The variation in the relative compaction ratio among all specimens was controlled within ±5%, ensuring uniform pore structure across different gradations.
Subsequently, using a rainfall simulation device, water was continuously sprayed onto the compacted specimen within the mold until steady-state saturation was achieved. Once the water level remained constant, the volume of outflow water was measured for 30 s. Measurements began only after the initial collection flow stabilized, ensuring that the specimen was in a fully saturated condition. After completing the test for the base layer, the same procedure was repeated for the bedding layer and the permeable block surface, allowing for a layer-by-layer evaluation of the overall system permeability. The testing procedure is illustrated in detail in Figure 5.

3.2.2. Large-Scale Measurement Equipment and Methods

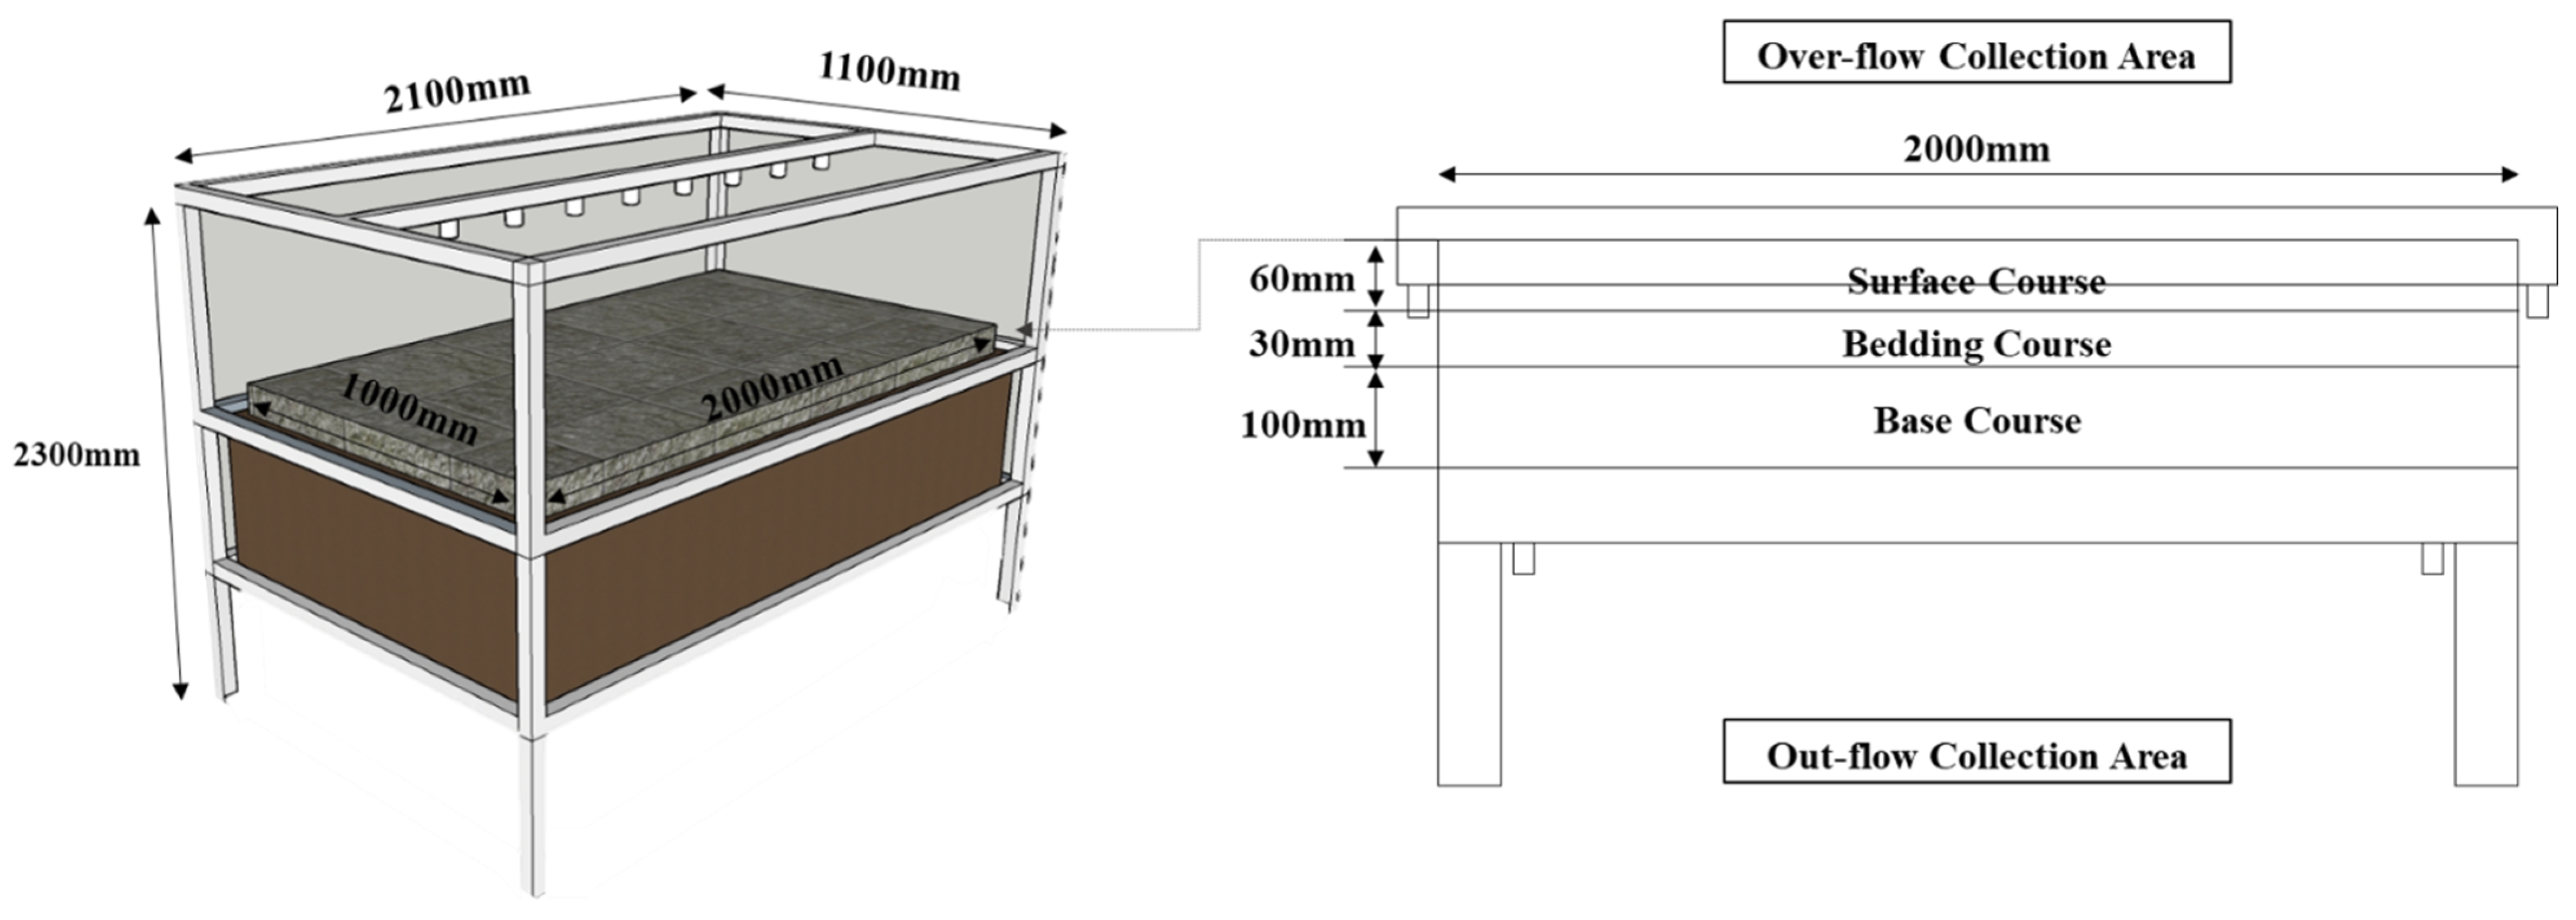
The permeable block pavement system exhibits not only infiltration through the surface layer but also retention and movement of stormwater within the underlying base layers. Therefore, to reproduce rainfall conditions similar to those experienced in the field at a laboratory scale, a rainfall simulation apparatus was employed to evaluate the system’s runoff characteristics according to the application of the permeable base, bedding layer, and block pavement. The experimental setup is illustrated in Figure 6. The equipment utilizes the same outflow evaluation mechanism as the small-scale permeability testing apparatus, but its dimensions were enlarged to more accurately replicate field-scale hydrologic behavior. The rainfall simulation system has dimensions of 2100 mm (length) × 1100 mm (width) × 1900 mm (height) and was fabricated using a welded steel frame to enable compaction after aggregate placement. To precisely measure both surface runoff (overflow from the pavement surface) and subsurface drainage (outflow through the base layer), the system was designed with four independent outflow collection outlets, with one on each side.
The rainfall simulator consists of a frame, nozzles, oscillators, and a piping system. Rainwater is supplied through a pump and discharged from overhead nozzles, allowing for free fall to water droplets to replicate natural rainfall conditions. The rainfall intensity was determined considering Korean precipitation characteristics and future climate change scenarios. Based on the 30-year return period rainfall intensity (88.2 mm/h), the discharge rate of the rainfall simulator was set to 2.94 L/min.
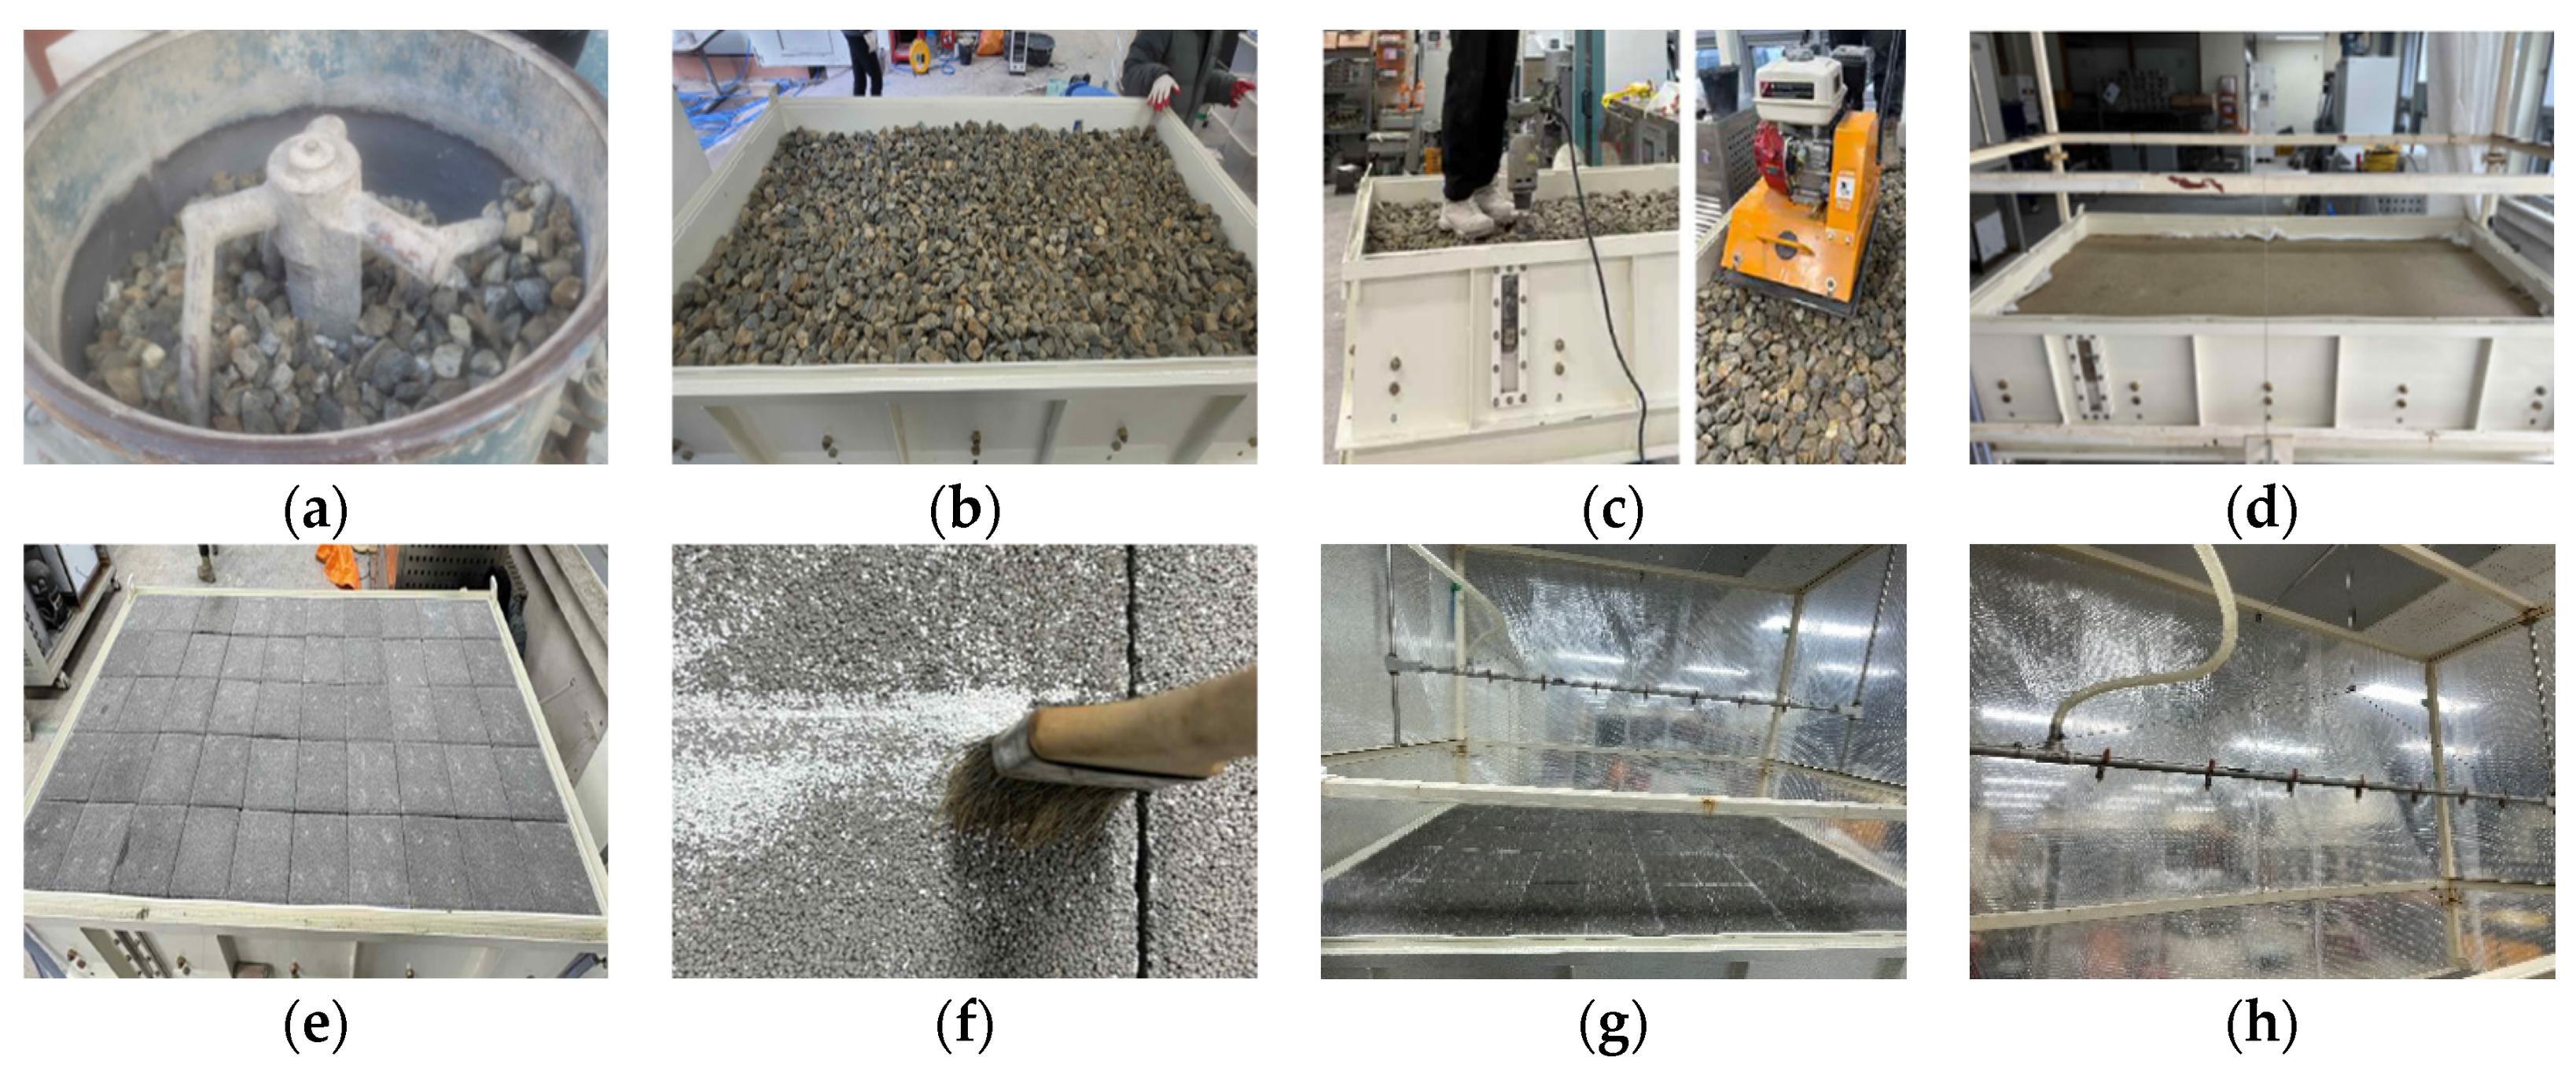
The experimental procedure for evaluating the permeability of the permeable block pavement system is presented in Figure 7. Specimens were constructed sequentially by installing the base layer, bedding layer, and permeable blocks, allowing for measurement of the drainage outflow at each structural stage. To simulate realistic field compaction conditions, the base layer was compacted using a vibratory compactor, rammer, or hand tamper, ensuring that the structural integrity and hydraulic response of the system closely resembled those of actual field pavements.

4. Results

4.1. Permeability Test Results Using the Small-Scale Apparatus

Permeability Test Results

The permeability performance of the specimens was evaluated using a laboratory-scale permeability testing apparatus specifically designed to replicate field conditions of permeable block pavement systems. For each specimen, the constant-head permeability test was conducted three times, and the coefficient of permeability (K) was calculated based on Equation (1). During the test, the outflow volume (Q) was measured after the water level in the specimen mold had reached a constant head. Considering the specimen thickness (d) corresponding to the combined pavement structure and the head difference (h = 30 cm), the permeability coefficient was obtained by dividing the volume of infiltrated water per unit time (30 s) by the cross-sectional area (A) of the specimen, as expressed below:
K = d h × Q A × 30 s ,
where K is the coefficient of permeability (mm/s), Q is the outflow volume (mm3), d is the specimen thickness (cm), h is the head difference (mm), and A is the specimen cross-sectional area (mm2).
According to the test results, Specimen 1-1 exhibited the highest coefficient of permeability, while Specimen 2-3 showed no measurable outflow during the testing period, making it impossible to determine its permeability coefficient. For Specimens 4–6, the applied base gradations caused rapid infiltration such that the water level did not reach the overflow section, resulting in an inability to achieve and maintain a constant head condition; thus, permeability measurements could not be obtained. The measured permeability behavior according to the aggregate gradation of the base layer and the corresponding constant-head permeability coefficients are summarized in Table 3 and Table 4. The permeable blocks used in this study exhibited a permeability coefficient greater than 1.8 mm/s, which satisfies the Grade 1 performance requirement specified for permeable block pavements.

4.2. Permeability Test Results Using the Large-Scale Apparatus

Measurement of Subsurface Runoff and Hydrograph Analysis by Pavement Structure

Using the large-scale rainfall simulation apparatus, stormwater runoff beneath the permeable block pavement system was measured under a rainfall intensity of 88.2 mm/h continuously applied for 30 min. The hydrograph of subsurface outflow was then analyzed to examine the runoff response characteristics according to different pavement structural configurations.
Rainfall was uniformly applied through the spray frame, and the outflow volume discharged from the bottom of the pavement system was measured at 5 min intervals.
The following parameters were recorded for each test: time to initiation (T1), time to peak (Tp), lag time, base time, and peak discharge (Qp). The time to initiation and time to peak reflect the initial infiltration and saturation characteristics of the pavement system, providing an indication of its early-stage permeability response. The period during which the outflow remains stable represents the steady-state permeability performance, reflecting the sustained infiltration capacity of the pavement structure. Conversely, the lag time and base time indicate the pavement’s capacity to retain stormwater within internal voids, signifying enhanced temporary storage and delayed drainage behavior.
The key hydrologic parameters used to develop the outflow hydrograph, and their definitions are as follows:
  • Time to initiation (T1): The elapsed time from the onset of rainfall to the first occurrence of subsurface outflow.
  • Time to peak (Tp): The elapsed time from the onset of rainfall to the occurrence of the maximum discharge.
  • Lag time: The time interval between the peak inflow and the corresponding peak outflow (under constant rainfall conditions.
  • Base time: The total duration from the beginning of outflow to its complete cessation.
  • Peak discharge (Qp): The maximum outflow rate that can be transmitted through the pavement structure, representing the effective infiltration capacity.
In addition, the stormwater storage capacity (S) of the pavement system was evaluated using Equation (2). The total rainfall input was calculated based on the rainfall intensity and duration, and the retained volume—the portion of stormwater that remained within the pavement system rather than being discharged—was computed using the measured total subsurface outflow.
S = ( T o t a l   R a i n f a l l   I n f l o w T o t a l   S u b s u r f a c e   O u t f l o w ) T o t a l   R a i n f a l l   I n f l o w × 100 ,
where S is the storage capacity (%) of the pavement system.
This evaluation allows for a quantitative assessment of the temporary stormwater retention capability of permeable block pavements, providing insights into their mitigation effectiveness under simulated rainfall conditions. The results of the underflow discharge measurement obtained through rainfall simulation are presented in Table 5, and the hydrograph parameters and the storage volume calculated based on them are shown in Table 6.

5. Discussion

5.1. Comparison of Permeability Performance According to Base Layer Gradation Characteristics

In this study, the test specimens were prepared based on the standard gradations for general sidewalk base layers (B-1 and B-2) specified by the Korean Ministry of Land, Infrastructure and Transport (MOLIT) [15]. The percentage of fine aggregates passing the 0.075 mm sieve was adjusted to 0%, 2.5%, and 5%, respectively, and the proportion of fine aggregates passing the 4.75 mm sieve was varied accordingly (Samples 1-1 to 2-3). In addition, Sample 3 was prepared using the permeable base aggregate gradation specified by MOLIT and the Seoul Metropolitan Government, while Sample 4 followed the ASTM No. 57 gradation, which is commonly used for permeable base layers in international standards [37]. To reflect field constructability, Samples 5, 6, and 7 were randomly prepared from crushed aggregates with a maximum particle size of 40 mm, representing practical gradation conditions encountered in field compaction. The measured coefficients of permeability (K) for each base material according to gradation type are summarized in Table 7. For both B-1 and B-2 gradations, an increase in the fine particle content resulted in a decrease in the coefficient of permeability, consistent with previous findings that higher coarse aggregate ratios and lower contents of particles finer than 5 mm enhance permeability [38]. However, for B-2 gradation with 5% of fine aggregates, overflow occurred within the mold before outflow was observed from the bottom, making permeability measurement impossible. This behavior is attributed to the higher proportion of coarse aggregates (25–40 mm) in B-2 compared to B-1 and its lower coefficient of uniformity (Cu), indicating a more uniform gradation and reduced fine interlocking [39].
Sample 3, corresponding to the permeable base aggregate currently used in domestic applications, showed a permeability coefficient of 0.19 mm/s, which was comparable to that of Samples 2-2 (B-2 gradation with 2.5% fines) and 7, a field-optimized mixture with a maximum aggregate size of 25 mm and 3% fines. This similarity likely results from the fact that Sample 3, although classified as a permeable base aggregate, was mixed using the upper limits of the gradation range, leading to a fine content similar to that of Sample 2-2. Sample 4, prepared according to ASTM No. 57, exhibited extremely high permeability such that maintaining a constant head condition during testing was impossible. The aggregate particles were distributed predominantly between 4.75 mm and 13.2 mm, forming a narrow, nearly single-sized gradation, which is known to produce higher hydraulic conductivity [40]. Sample 5, composed of crushed aggregates smaller than 40 mm, displayed a single-sized gradation with almost no particles below 10 mm, forming a highly porous structure with large, interconnected voids. Sample 6, consisting of aggregates smaller than 25 mm, had a gradation similar to Sample 4 with a comparable fine content. Since materials with a coefficient of uniformity (Cu) < 2 are classified as uniformly graded (single-sized) aggregates, Samples 4, 5, and 6 exhibited very high permeability, resulting in rapid drainage and overflow in the collection period, making precise flow measurement infeasible.
In summary, the coefficient of permeability of the base layer specimens increased with a higher gravel content and larger characteristic particle diameters (D10, D30, D50, and D60), while it decreased with increasing fine particle content and coefficient of uniformity (Cu). These trends are consistent with the findings reported by Oh, H. et al. (2021), which state that the gradation and textural characteristics of gravel and sand in base materials significantly influence hydraulic conductivity [41]. Accordingly, it can be concluded that the physical characteristics of aggregates directly affect the subsurface drainage performance of the base layer in permeable pavement systems. For sand and gravels with wide grain size distributions (high Cu values), the fines tend to fill the void spaces between the large sand particles, resulting in lower porosity values [42]. For the relatively uniformly graded material (Cu < 3), the porosity values are higher than 0.33. The porosity is reduced for granular material samples with wider grain size distributions (Cu > 6), resulting in porosity values lower than 0.27 [43].
Consequently, hydraulic conductivity measurements could not be performed on samples exhibiting either excessively low or high permeability. For samples with low permeability—characterized by high fine content and reduced void ratio due to compaction, resulting in slow water passage—the constant head permeability test is deemed inadequate. Instead, the falling head permeability test is recommended, which enables calculation of hydraulic conductivity by measuring discharge rate and volume as a function of the hydraulic gradient. Conversely, for samples with excessively high permeability, where maintaining a constant head is infeasible due to rapid drainage, the constant head method is inapplicable. In such cases, an in situ infiltration test adapted from ASTM C1701 is proposed: a known volume of water is applied to the surface, and the rate of percolation through the sample is measured by quantifying outflow at the base, thereby enabling estimation of hydraulic conductivity.

5.2. Evaluation of Particle Size Characteristics and Permeability Coefficient Based on Statistical Analysis

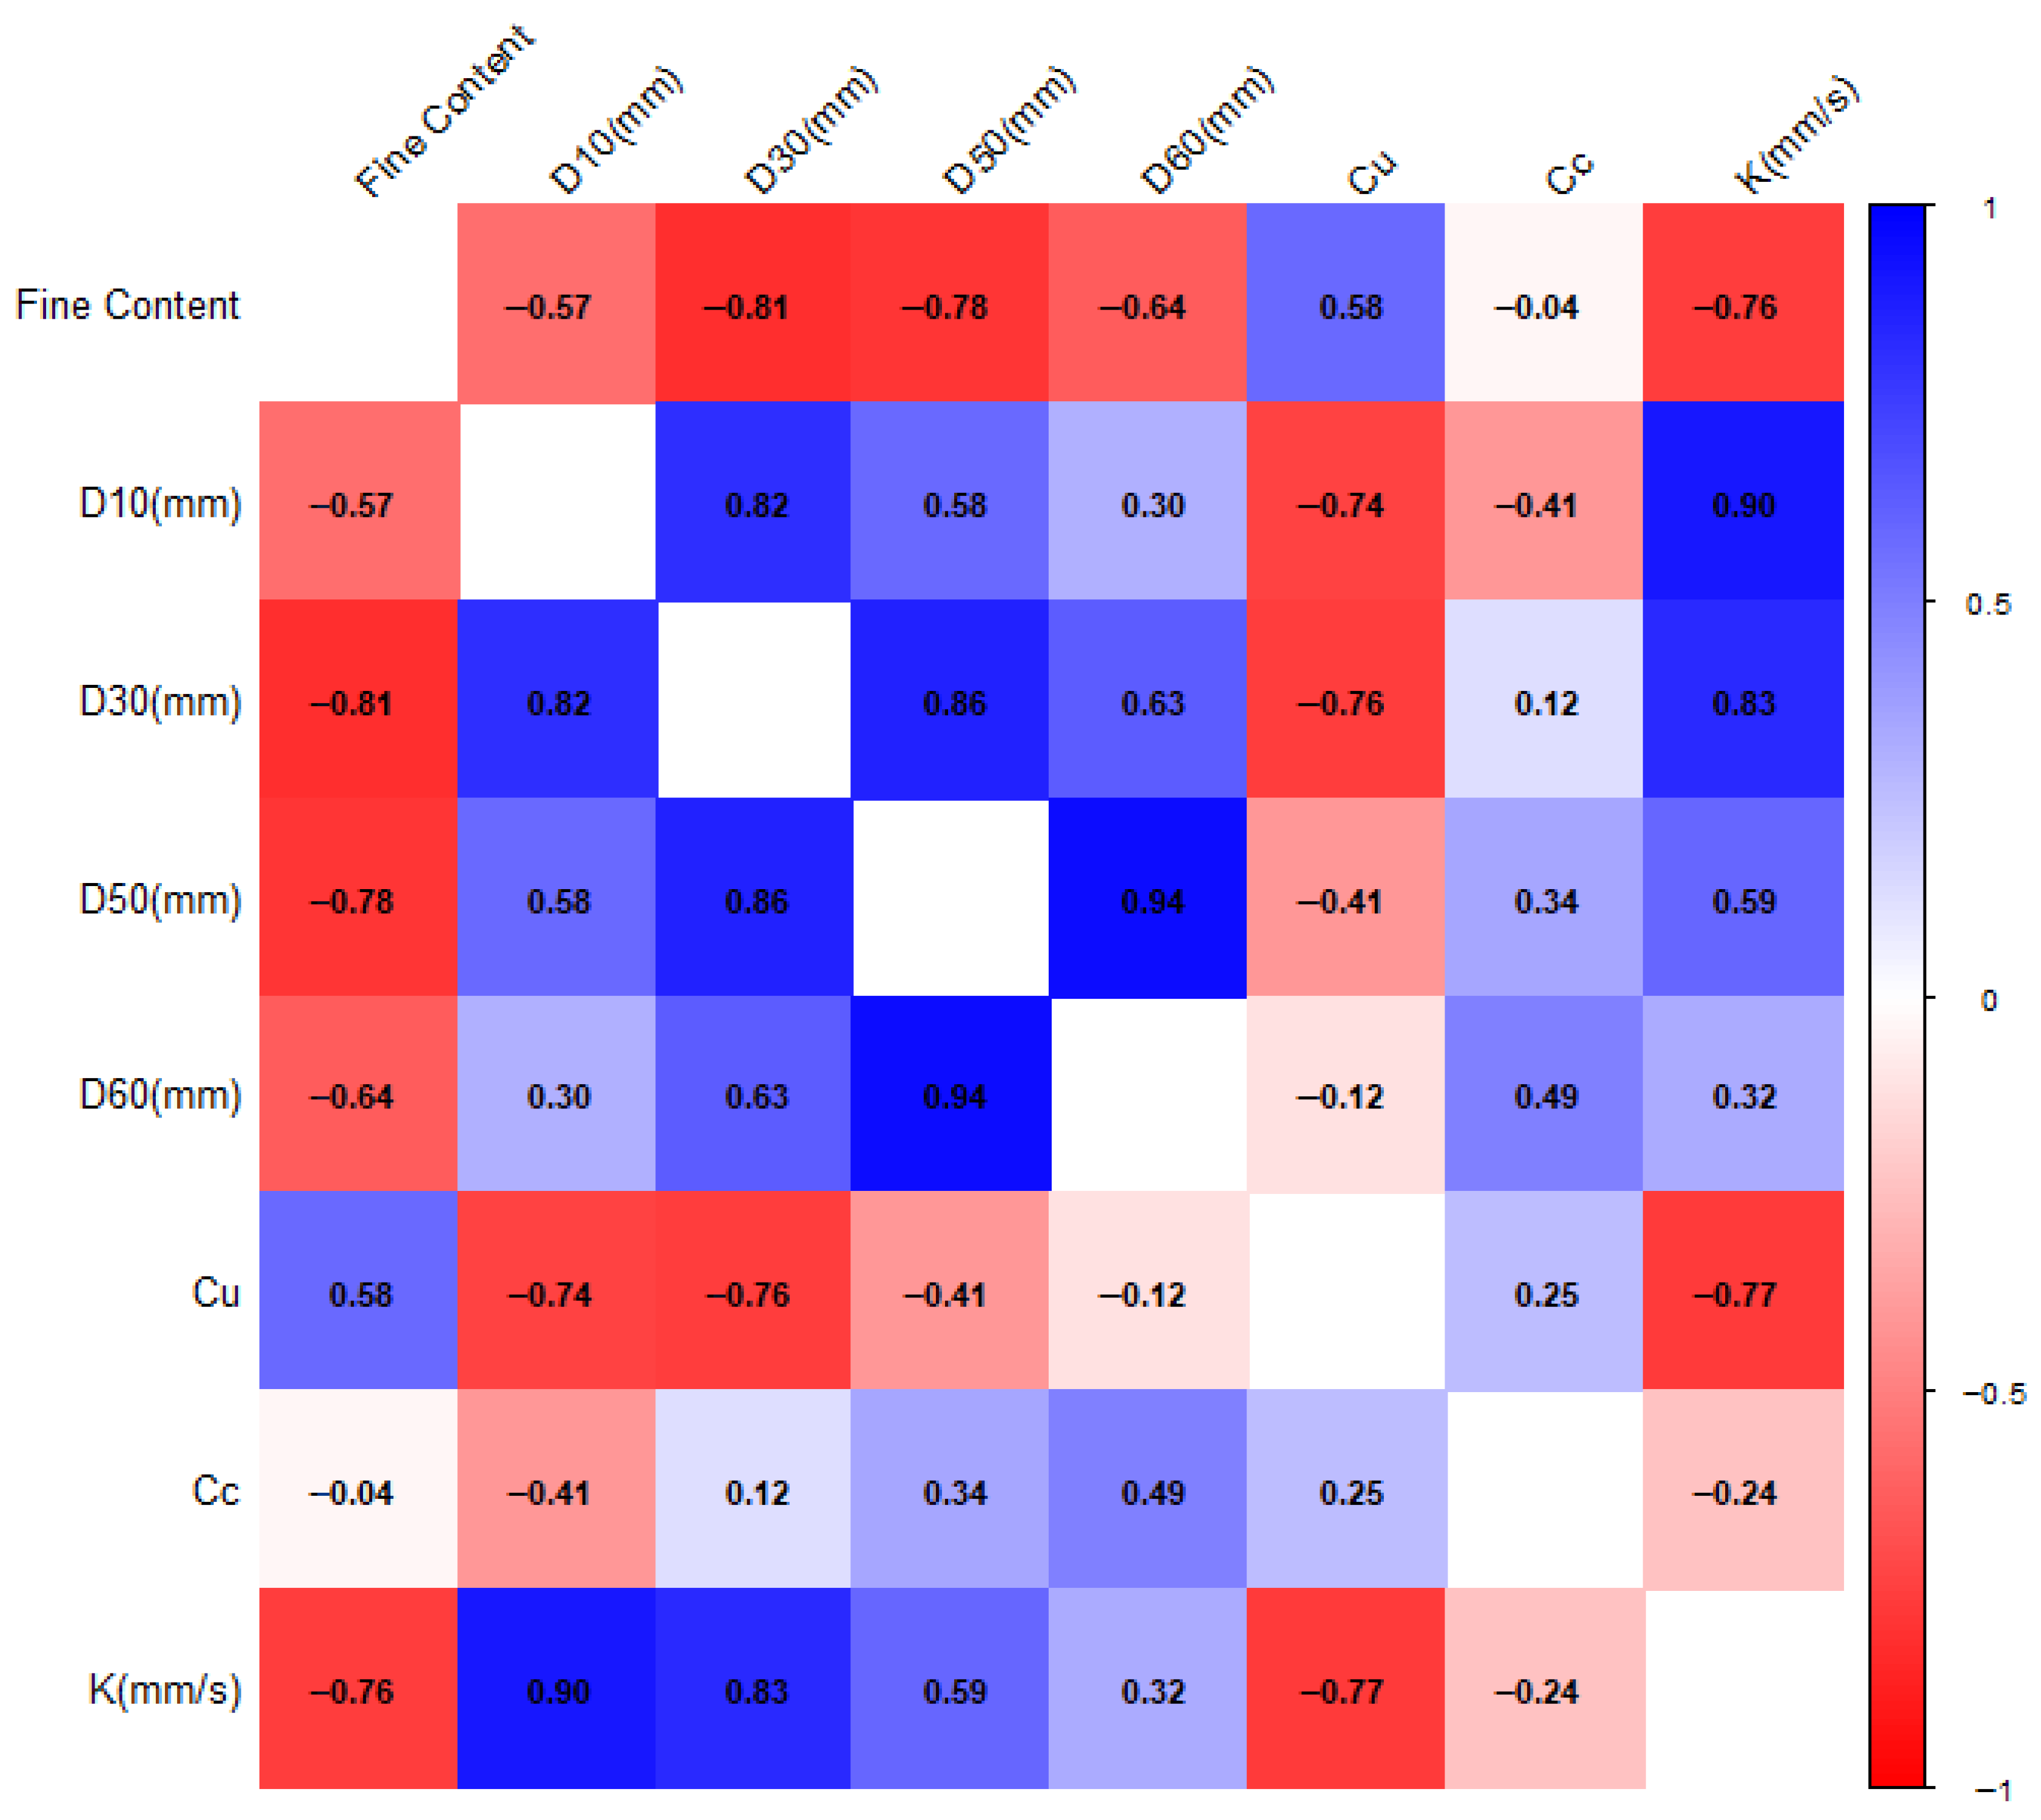
In this study, to quantitatively evaluate the relationship between fine content, particle size parameters (D10, D30, D50, D60), gradation indices (Cu, Cc), and the permeability coefficient (k), a correlation analysis was conducted among key variables using laboratory test data, and a multiple linear regression model was subsequently established and evaluated. In this experiment, the permeability of some samples was too high, making the calculation of the permeability coefficient impossible. Consequently, for the purpose of this analysis, these samples were assumed to have the minimum permeability coefficient of the permeable block (k = 1 mm/s). As shown in the Figure 8, the Pearson correlation analysis results indicated a significant negative correlation between fine content and Cu with k (R = −0.76, R = −0.77, respectively), while D10 and D30 showed a strong positive correlation (R = 0.90, R = 0.83). This suggests that as the fine particle content increases and the particle size non-uniformity (heterogeneity) increases, the pores become clogged or the porosity decreases, leading to a reduction in permeability. Conversely, larger effective particle sizes (D10) and medium particle sizes (D30) can be interpreted as facilitating water flow due to increased porosity. These findings imply that the fine content and particle size distribution characteristics have a complex influence on the permeation properties, and the accumulation of fines and non-uniform gradation can be major factors contributing to the deterioration of permeability performance.
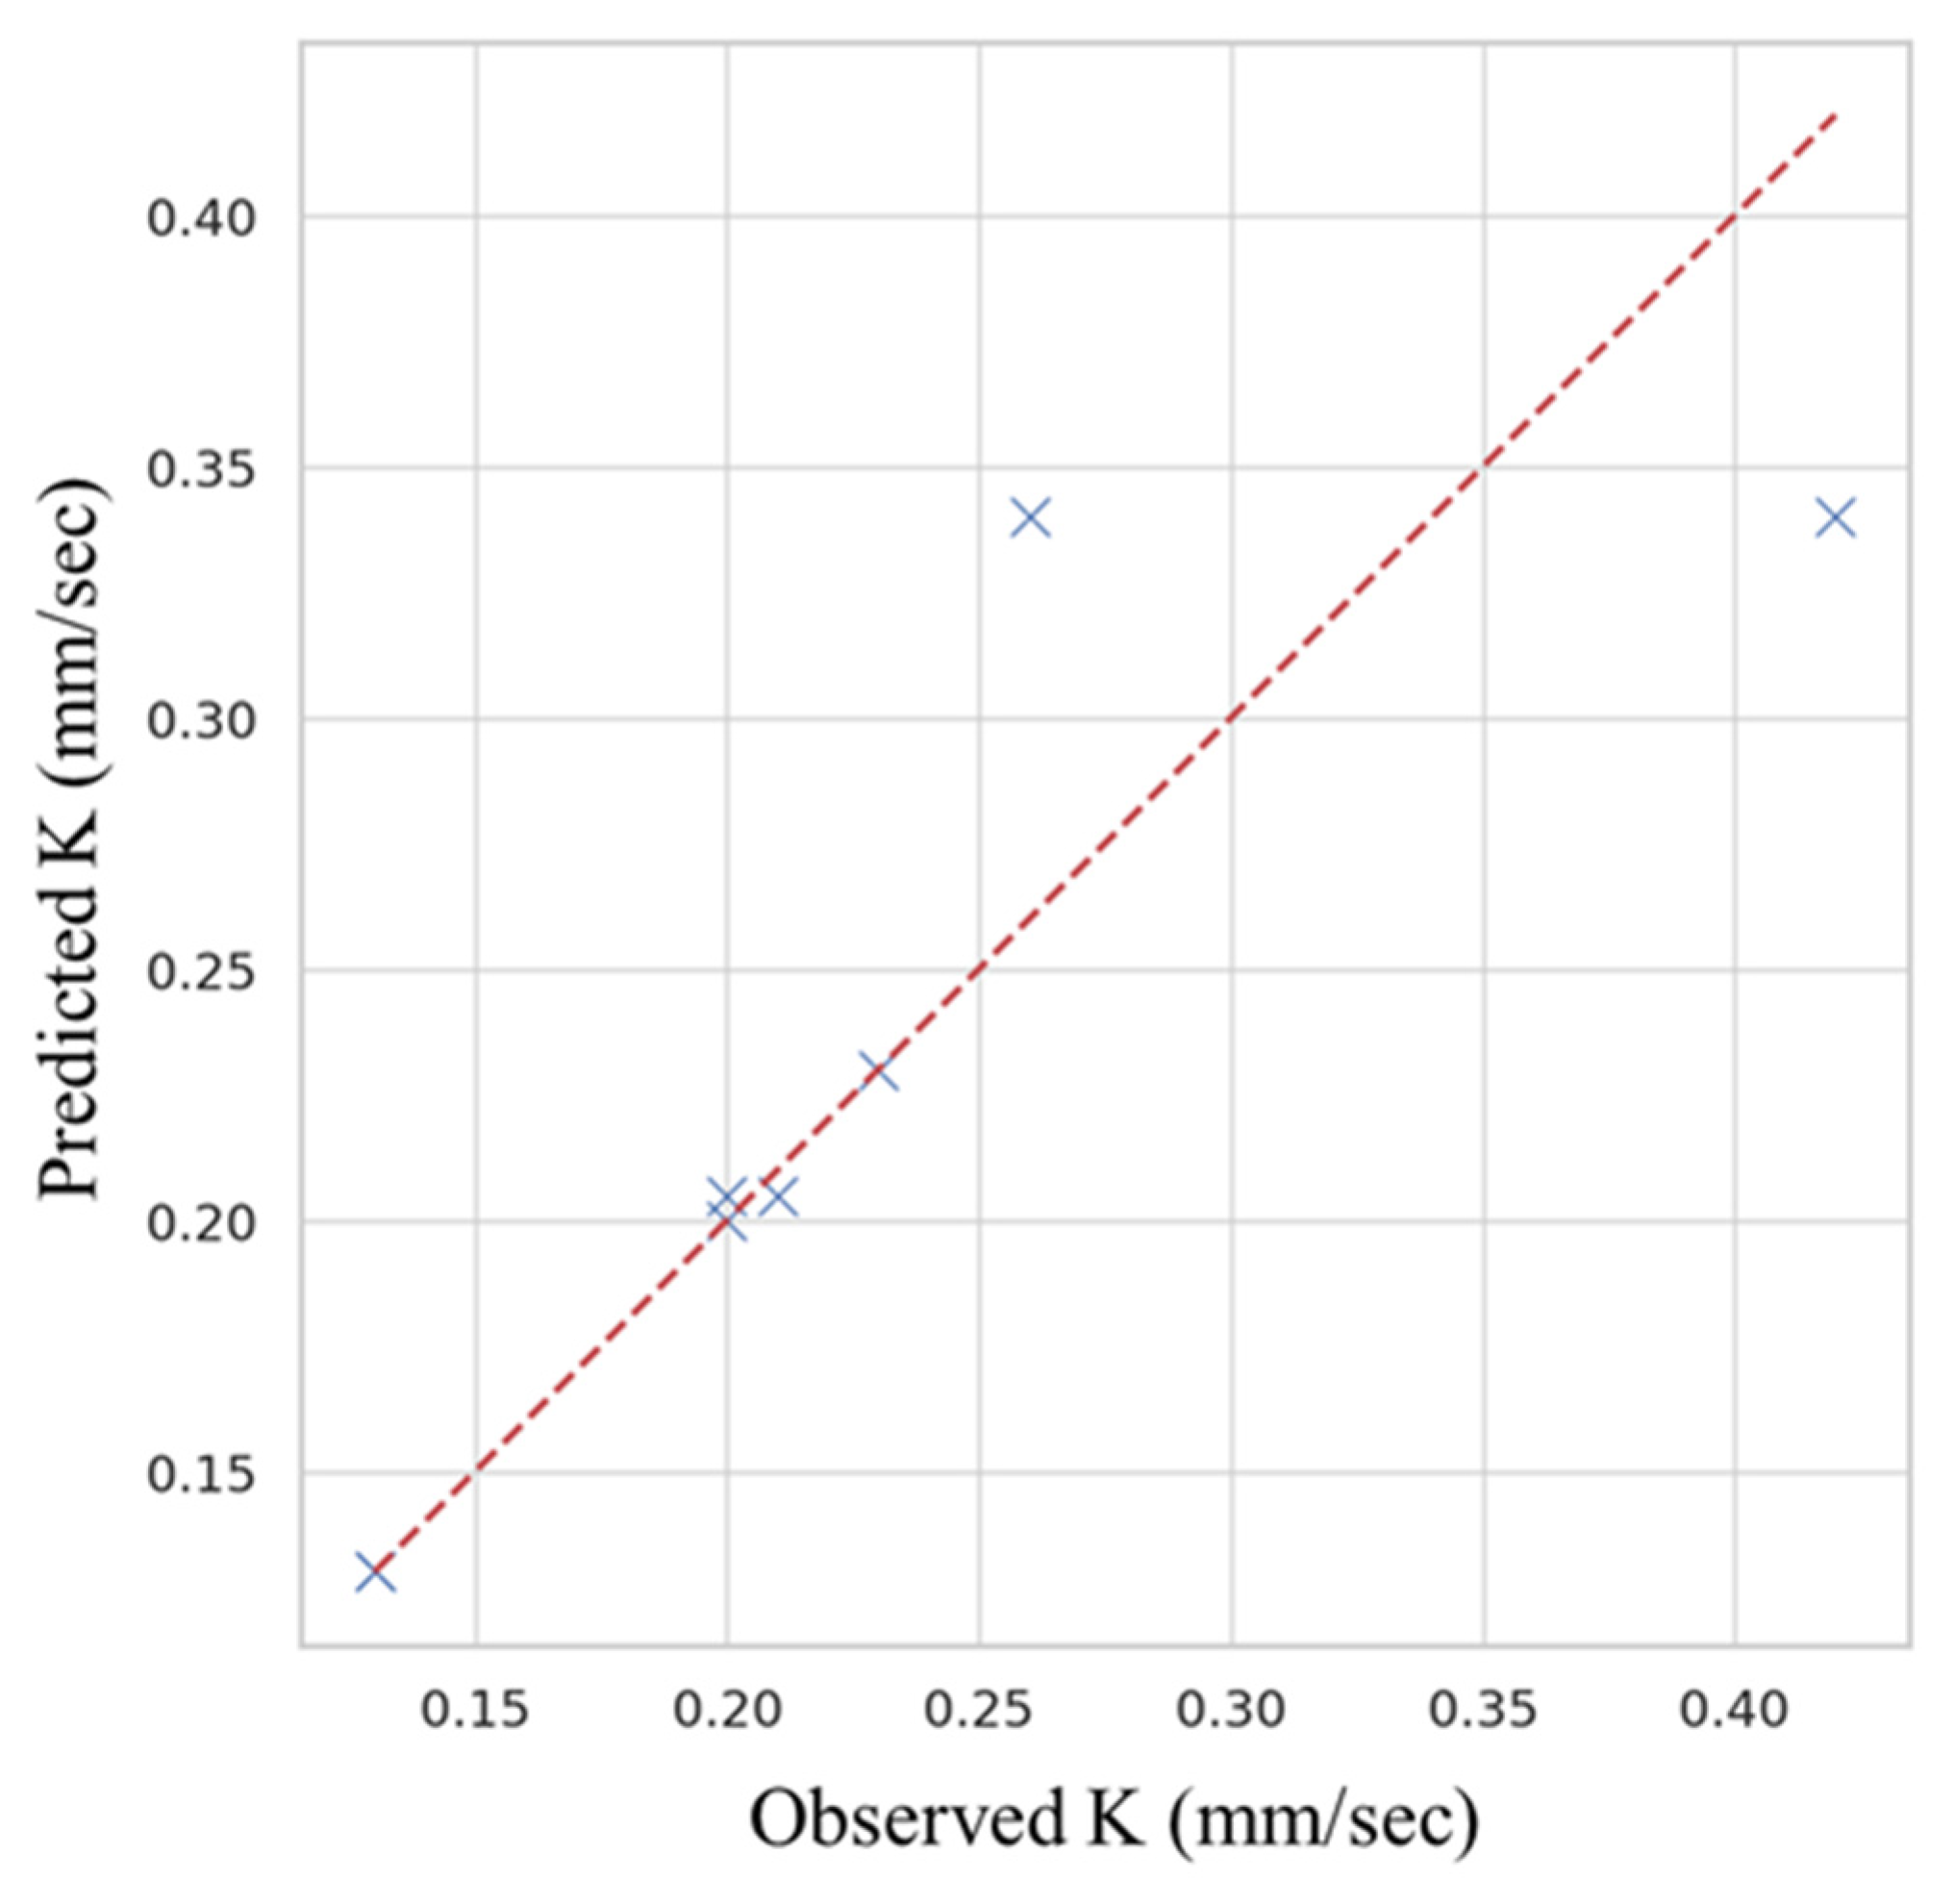
In the multiple linear regression analysis, fine content, Cu, D10, and D30 were included as independent variables, and a model incorporating second-order interaction terms among them was established. Within the regression model encompassing all variables and interaction terms, the interaction term between D10 and D30 (D10 × D30) demonstrated a statistically significant positive effect (p < 0.01). This signifies that the combination of effective particle size and medium particle size exerts a stronger influence on the permeability coefficient than the individual variables alone, suggesting a synergistic effect in which permeability is further enhanced when both variables increase concurrently. In contrast, the individual variables, such as fine content, Cu, D10, and D30, were not statistically significant within this specific model, but the directionality of their regression coefficients aligned with the correlation analysis results and theoretical interpretations. To compare performance among all possible multiple linear regression models, considering various variable combinations and interactions, the Adjusted Coefficient of Determination (Adjusted R2) and the AICc (Akaike Information Criterion) corrected for small sample size (N < 40) were utilized as evaluation metrics. As shown in the Table 8, the model that included all terms—fine content, Cu, D10, D30, and D10 × D30—exhibited a very high explanatory power (Adjusted R2 = 0.93) and yet showed the highest complexity (AICc = 6.91). Based on this, the residual analysis results, which compare the predicted permeability coefficients with the observed values, are shown in Figure 9, where data points closer to the diagonal line indicate a better agreement between the model prediction and the observation.
In conclusion, these results suggest that the interaction between fine particle content and particle size variables may play a critical role in determining the permeability coefficient. However, considering the trade-off between model explanatory power and complexity, and the low significance observed for some variables, further analysis with a larger sample size is required to clearly define these tendencies.

5.3. Comparison of Permeability Performance According to Structural Configuration of the Permeable Block Pavement System

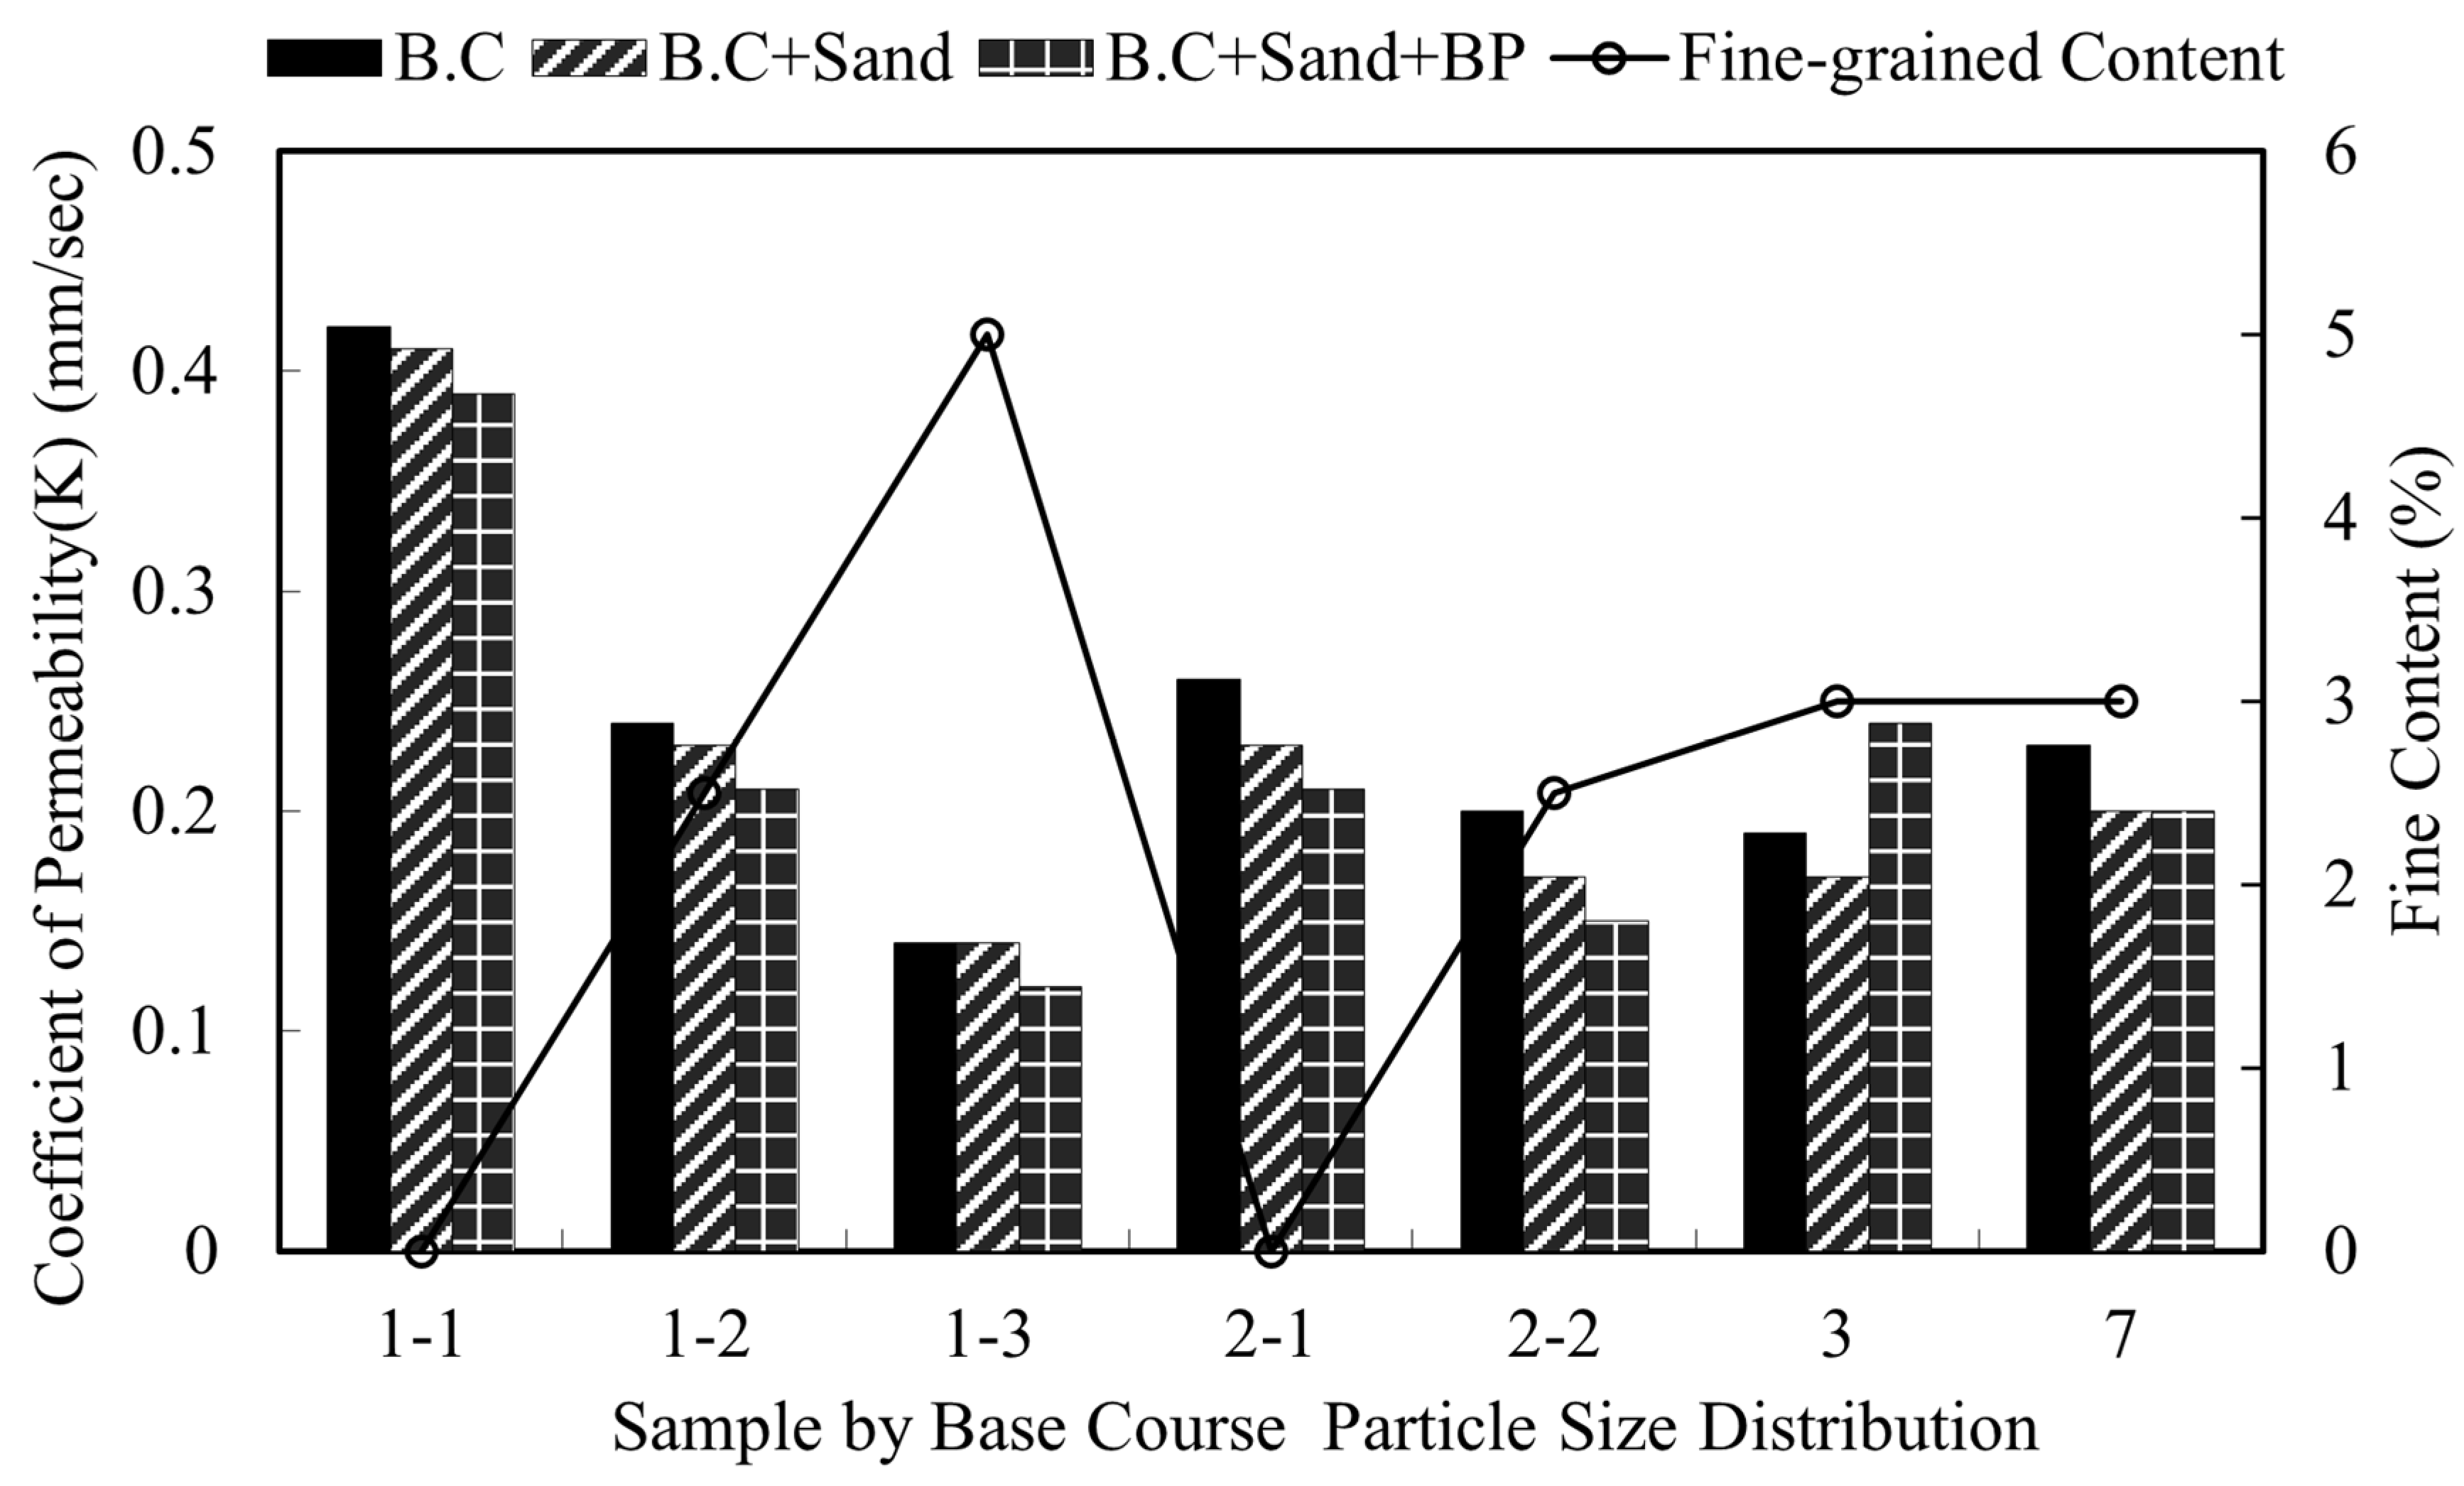
Based on the results of permeability measurements for different base layer gradations, Samples 4, 5, and 6—which exhibited extremely high permeability beyond measurable limits—were excluded from the analysis. The remaining samples were used to compare variations in the coefficient of permeability (K) according to the structural configuration of the permeable block pavement system, and the results are presented in Figure 10. The results revealed a consistent decrease in permeability as additional layers—namely the bedding layer and permeable blocks—were installed above the base layer. Although the upper layers exhibited relatively higher intrinsic permeability than the base layer, the overall hydraulic performance of the pavement system was found to be primarily governed by the hydraulic conductivity of the lower layers. Both the vertical and horizontal saturated hydraulic conductivity of the base and bedding layers play a critical role in determining the infiltration rate within permeable block pavements [44]. If a hydraulic bottleneck occurs in either layer, the overall drainage performance of the system can be significantly constrained. Therefore, for sustained gravity-driven percolation from the surface block through the bedding and base layers, the permeability of the lower layers must be sufficiently high. If the hydraulic conductivity of the base layer is low, percolation resistance develops at the interface, potentially causing surface runoff or delayed drainage.
In the case of Samples 2-1 and 2-2, the permeability coefficient decreased after the bedding layer was placed over the base layer, but increased again when the permeable blocks were installed. This behavior is likely attributed to particle intrusion from the bedding layer into the base layer under hydraulic pressure, which altered the pore structure and connectivity between layers. As highlighted by Liu et al. (2021), the combined porosity characteristics and gradation compatibility between pavement layers critically determine the overall permeability performance of the system and must therefore be carefully considered during design [45].

5.4. Analysis of Runoff Hydrographs by Pavement Structure

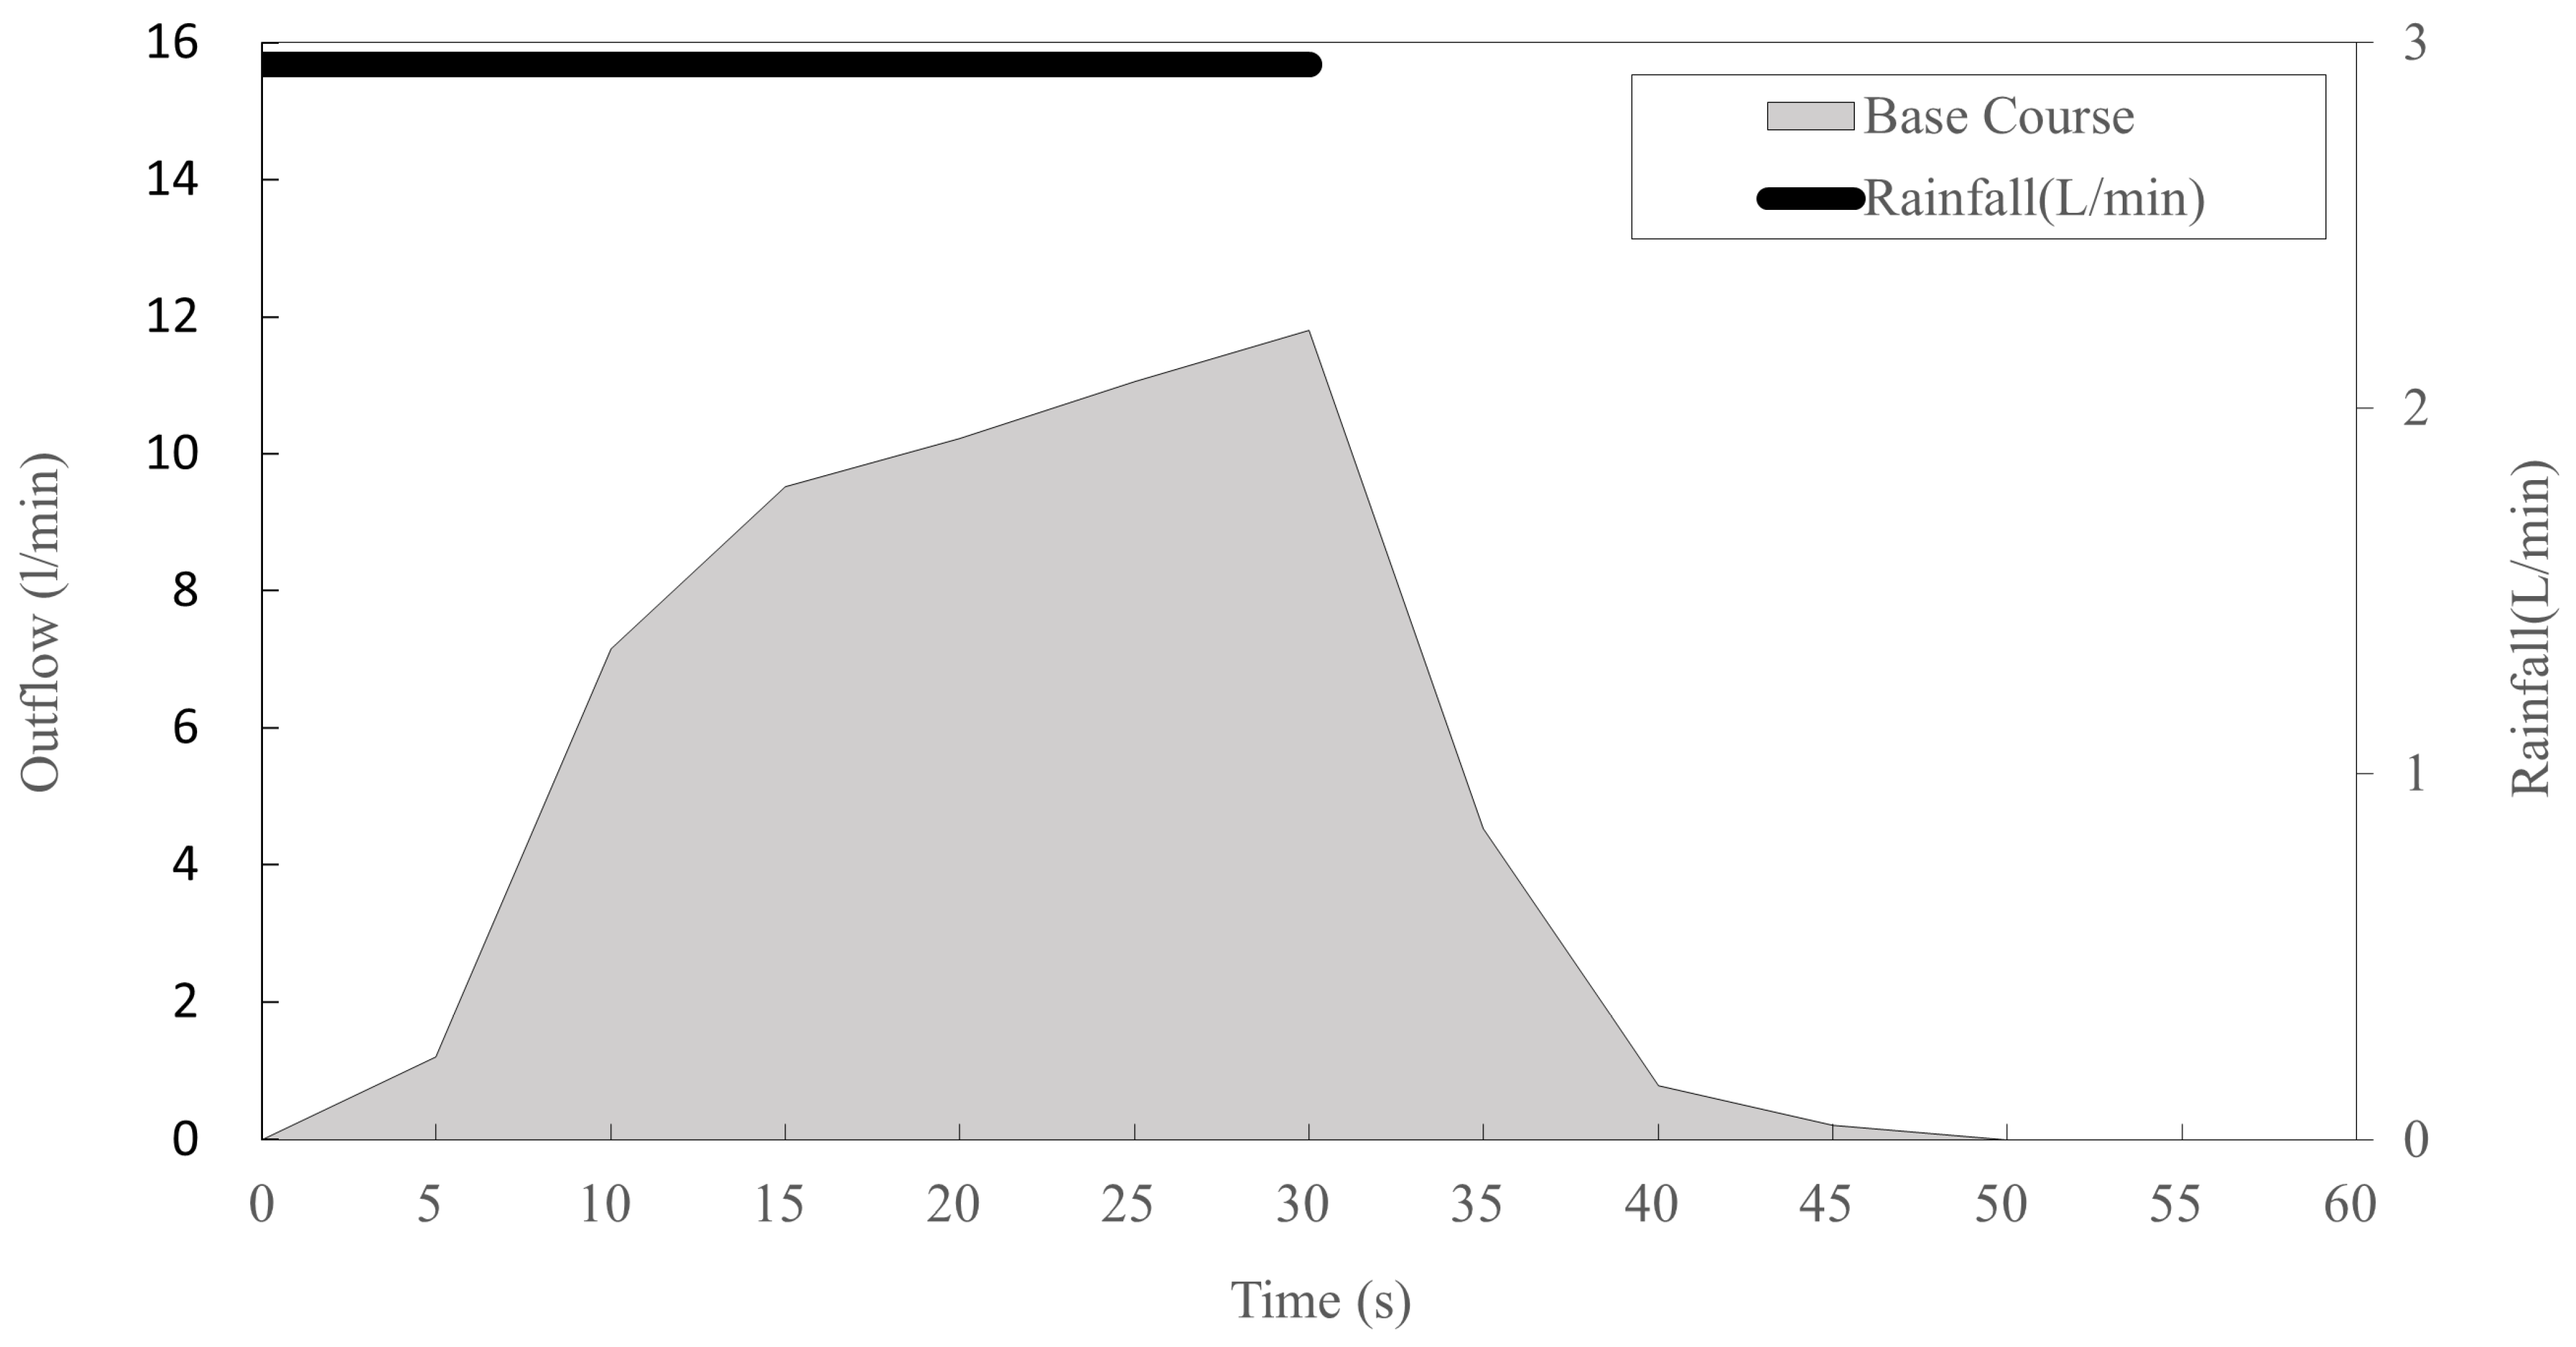
The runoff hydrographs under a rainfall intensity of 88.2 mm/h were analyzed using the large-scale rainfall simulation apparatus, and the results for each pavement structure are presented in Figure 11, Figure 12 and Figure 13. When only the base layer was installed, the infiltrated stormwater percolated through the surface and reached the bottom outflow after approximately 2 min and 29 s, indicating a delay in initial outflow and a short-term rainfall retention capability. After approximately 25 min, the outflow rate stabilized, suggesting that the storage voids within the base layer had become saturated. The peak discharge (Qp) occurred at 30 min, reaching 2.36 L/min. Even after the rainfall simulation (30 min continuous rainfall) was stopped, base flow persisted for an additional 20 min, showing a gradual drainage response. This behavior indicates that the permeable base layer can delay peak discharge and reduce the load on the drainage system during storm events. For a total rainfall input of 88.2 L (corresponding to 88.2 mm/h rainfall for 30 min), the total outflow volume was 56.47 L over a 50 min period, meaning that approximately 35.98% of the total inflow was retained within the base layer aggregates, serving as temporary storage within the pavement structure.
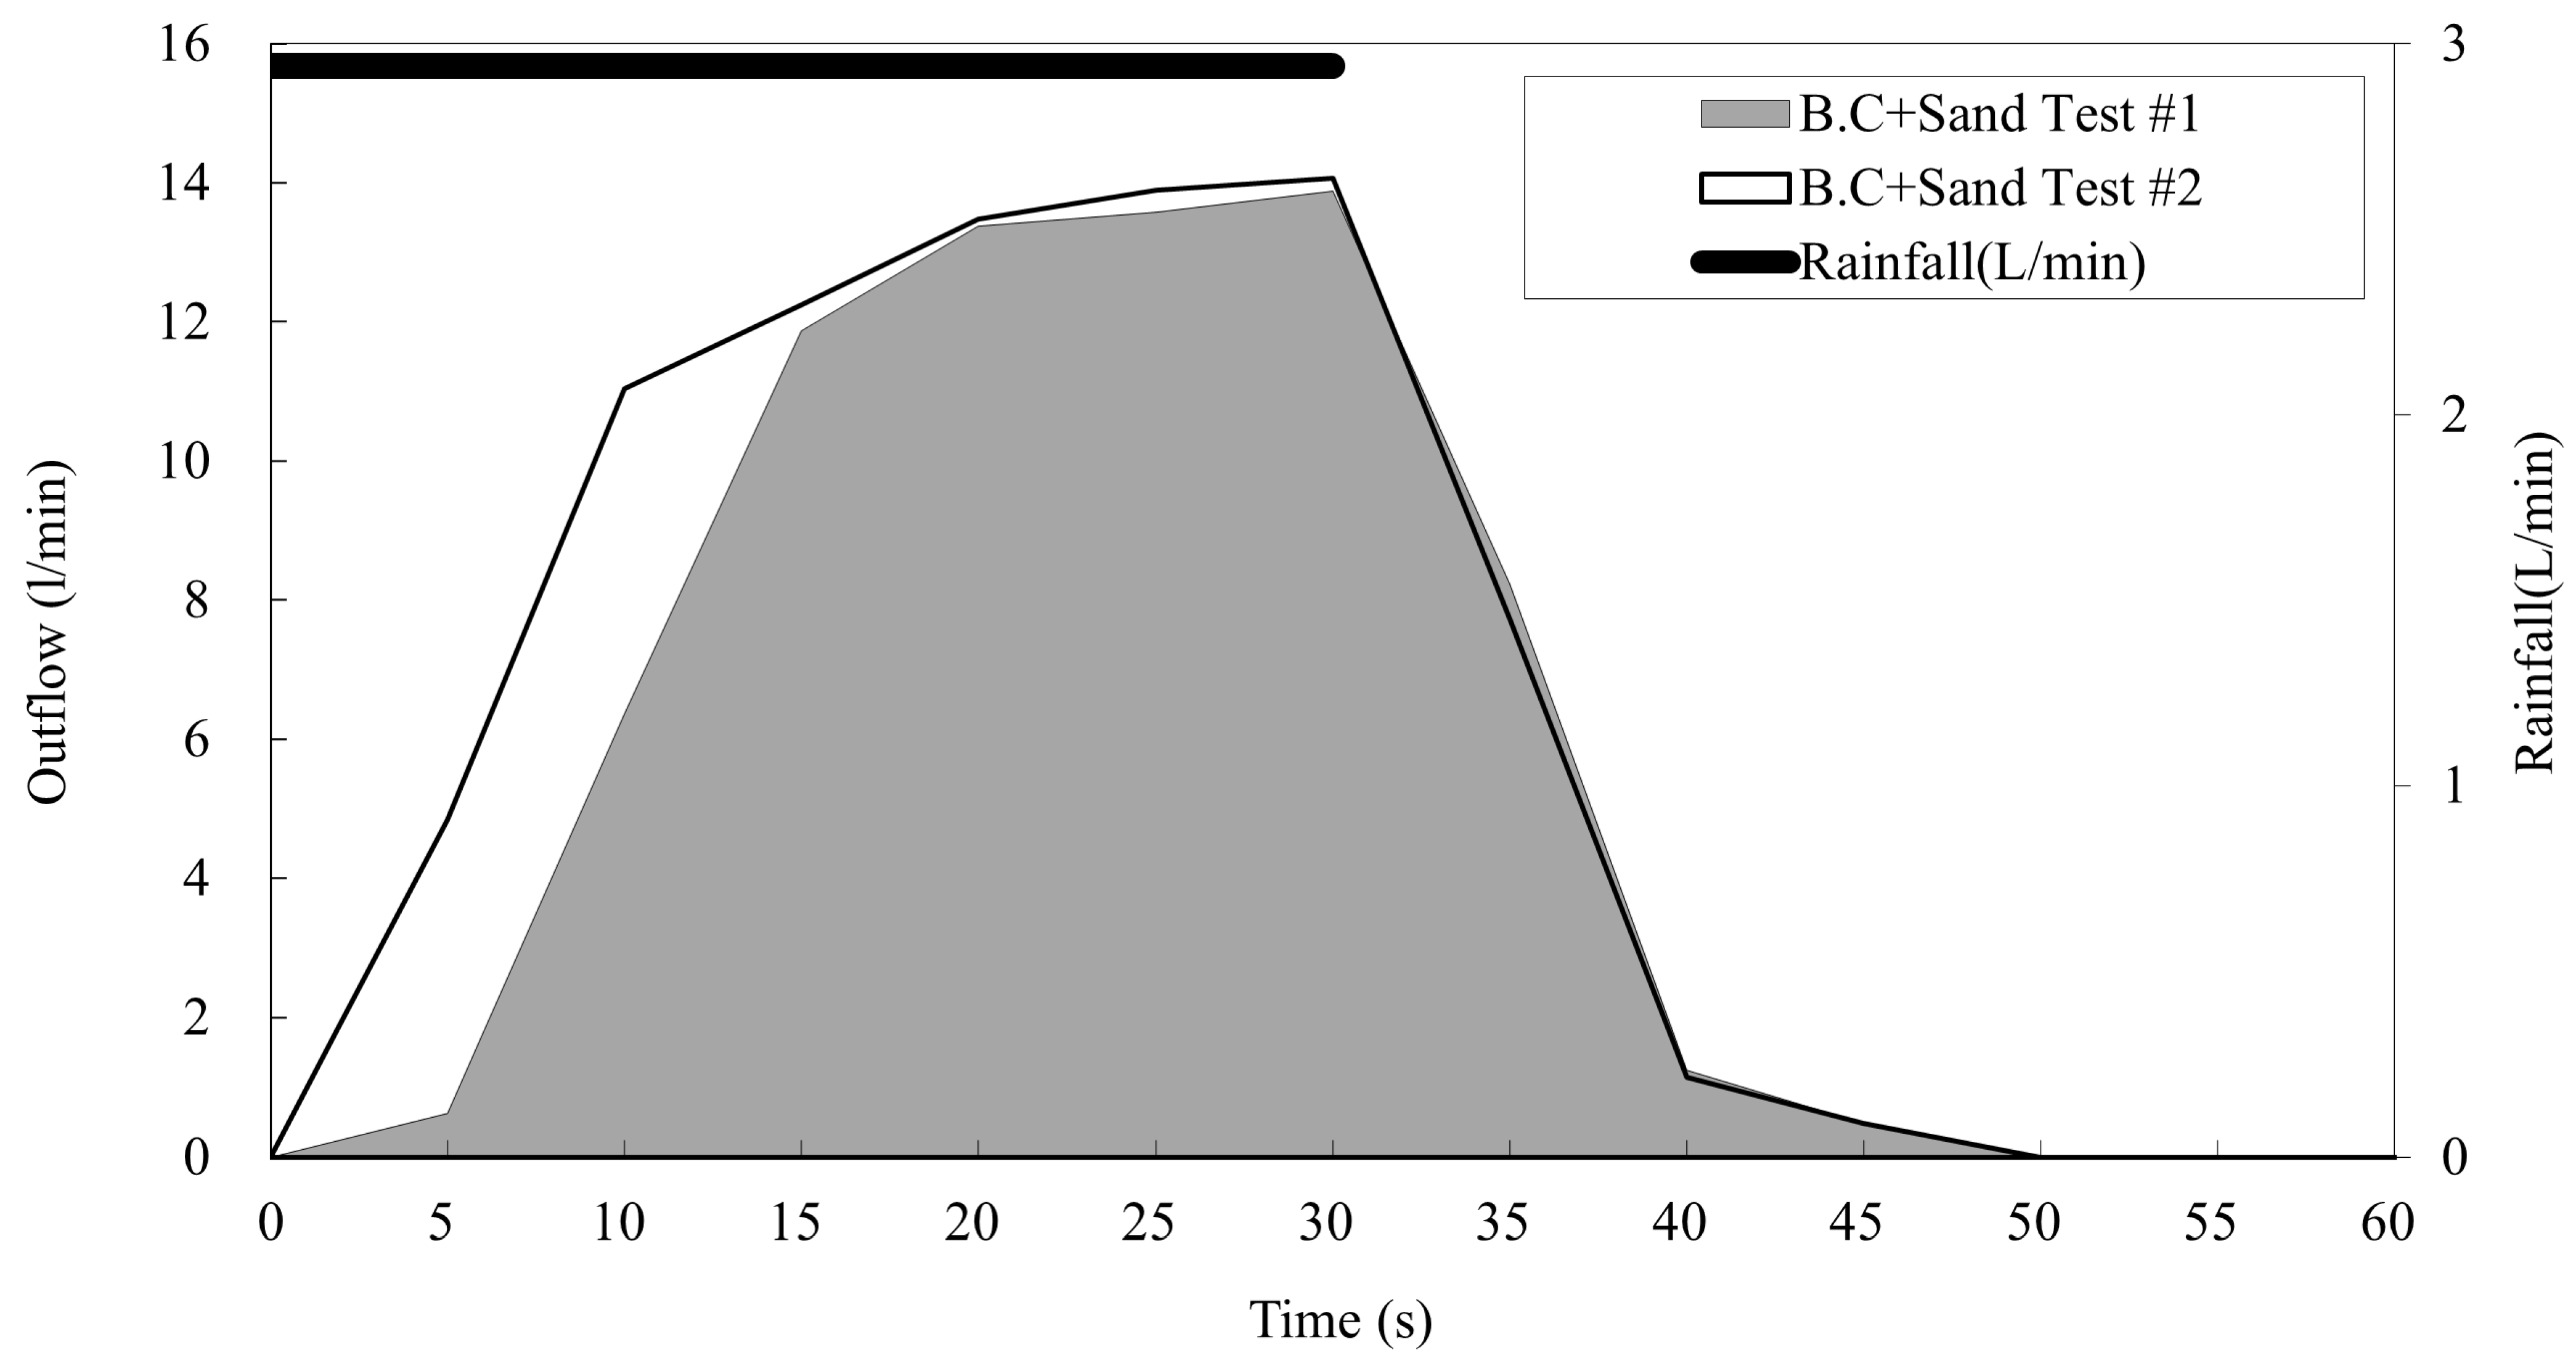
When the bedding layer was installed above the base layer, the same test was repeated. The initial outflow occurred at around 40 s, indicating a significant increase in the discharge rate compared to the base layer alone. This was likely due to residual saturation effects from previous rainfall simulations despite a 60 min drying interval, which led to earlier saturation within the layer. Subsequently, the outflow remained relatively constant after 15 min, and the peak discharge occurred again at 30 min, consistent with the base layer test. Outflow continued until 50 min, and the total discharge was 67.12 L, corresponding to a storage capacity of 23.9%. Compared to the base-only structure, the storage capacity decreased, indicating that although the bedding layer provided enhanced permeability and improved subsurface drainage, its ability to retain stormwater within the pavement system was reduced.
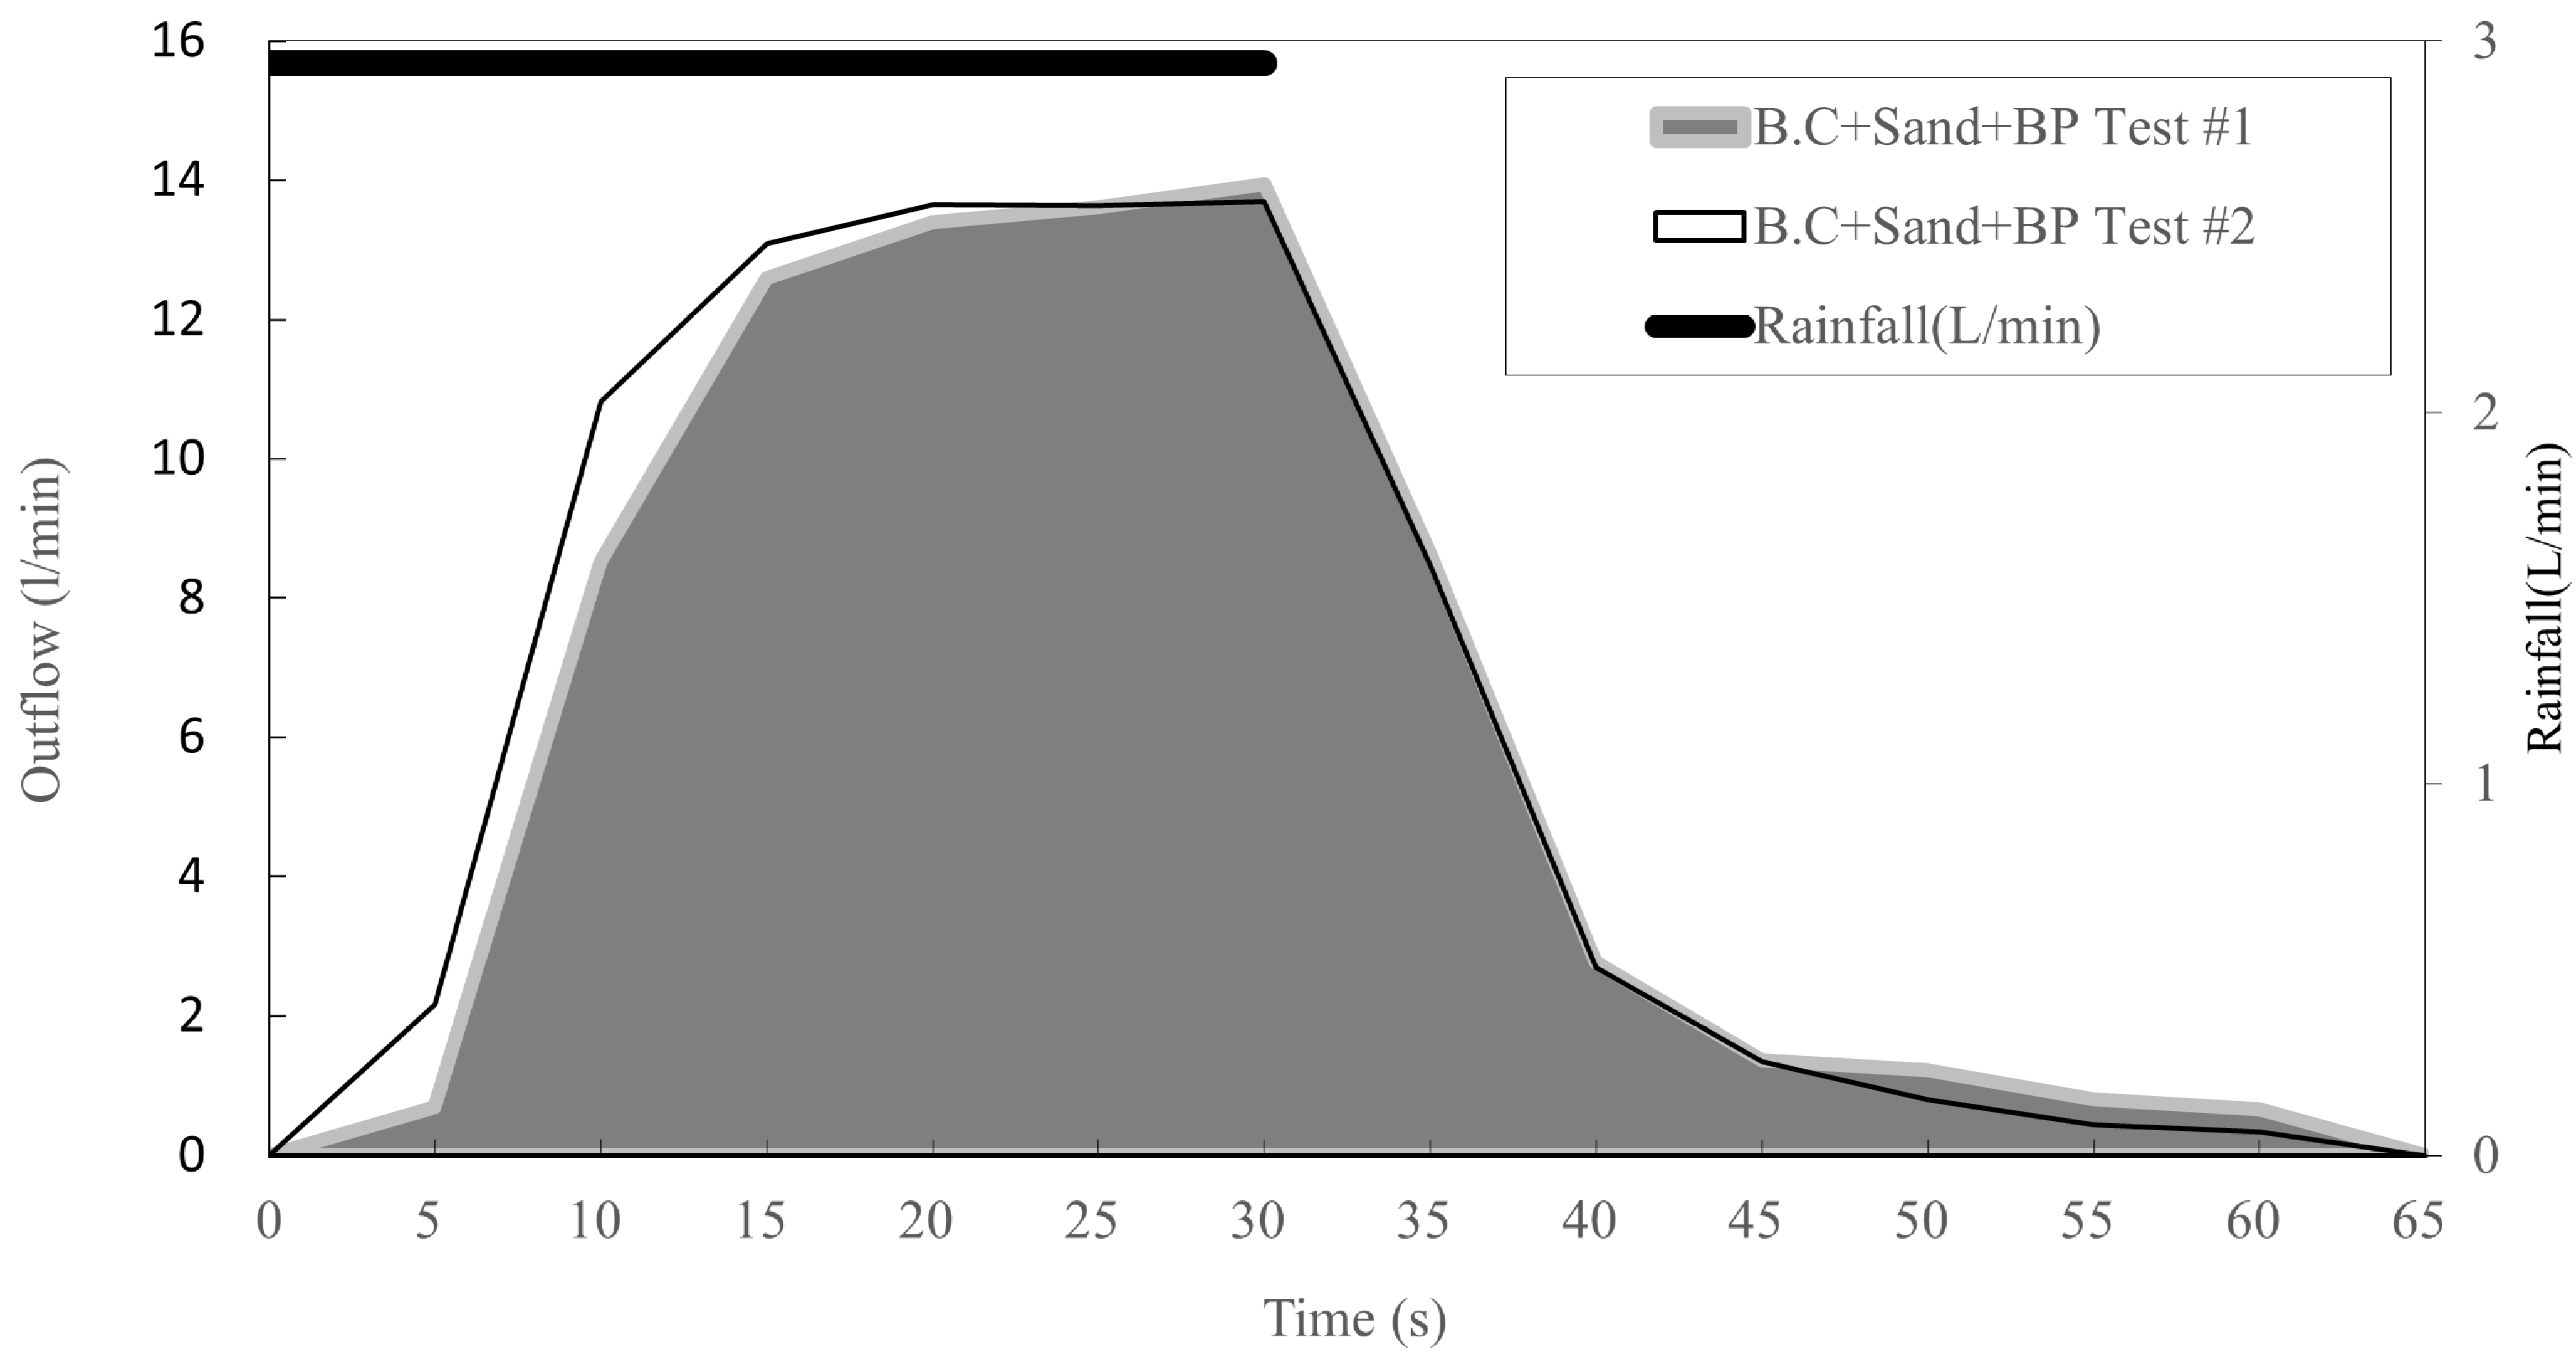
When the permeable block surface was added as the top layer, the runoff pattern showed notable differences. The outflow stabilized after approximately 15 min, and the maximum discharge occurred at 25 min, slightly earlier than in the base-only structure, as the internal storage voids reached saturation. After the 30 min rainfall event, outflow continued until approximately 60 min, gradually decreasing over time. This indicates that the permeable block surface may contribute to flow attenuation and hydraulic stabilization, moderating the rate of discharge. The average storage capacity for this configuration was calculated as 25.3%, reflecting a slight improvement in surface infiltration and temporary storage, which led to a reduction in total runoff volume. In summary, the inclusion of the permeable block layer slightly reduced total discharge and extended the outflow duration, suggesting a balanced interaction between drainage efficiency and water retention within the pavement system.

6. Conclusions

Permeability in permeable block pavements refers to the infiltration of stormwater through interconnected voids, which percolates into underlying aggregate layers and ultimately reaches downstream drainage facilities. To ensure hydraulic functionality, aggregates in the upper layers—including bedding and block layers—must exhibit permeability compatible with the base layers. This study evaluated the permeability performance of permeable block pavements by developing laboratory and field-scale test apparatuses simulating integrated pavement structures. Permeability coefficients were quantified based on aggregate gradation, and runoff behavior was analyzed under realistic rainfall conditions. The small-scale apparatus provided permeability data under constant-head conditions, while the large-scale simulator captured runoff hydrographs to assess drainage and storage capacity.
The main findings of this study are summarized as follows:
  • As expected, the coefficient of permeability decreased with an increase in the fines content in the base aggregates. For every 2.5% increase in particles smaller than 0.075 mm, the permeability coefficient decreased by up to 0.21 mm/s. Aggregates with a lower coefficient of uniformity (Cu) exhibited a marked reduction in permeability, indicating that uniform gradations are less hydraulically conductive.
  • When applying the gradation corresponding to ASTM No. 57, permeability was so high that maintaining a constant head condition during testing was not possible. Most particles were distributed between 4.75 mm and 13.2 mm, and the results are consistent with prior research showing that single-sized gradations provide higher hydraulic conductivity due to uniform pore pathways.
  • When the fines content exceeded 5%, the volume of water infiltrating into the sublayer decreased, and surface runoff became more dominant, leading to a significant reduction in infiltration performance.
  • The permeability coefficient tended to decrease as the bedding layer and permeable block layer were added above the base layer, with a maximum reduction of 0.07 mm/s. Even though the upper layers exhibited higher intrinsic permeability than the base, the hydraulic conductivity of the lower layers was found to be the primary governing factor for the overall permeability of the pavement system.
  • Analysis of runoff behavior under a rainfall intensity of 88.2 mm/h using the large-scale rainfall simulator revealed that the time to initial outflow decreased by up to 33 s when the bedding and block layers were added above the base layer. The permeable block surface contributed to flow attenuation and hydraulic stabilization, gradually reducing discharge velocity. The storage capacity was the highest in the base-only configuration, reaching approximately 36%.
  • The constant-head tests conducted using the small-scale apparatus indicated that permeable base materials with a permeability coefficient greater than 0.2 mm/s can sufficiently accommodate the designated rainfall intensity. However, since the peak discharge measured in the large-scale system was comparable to the applied rainfall intensity, further research is required to evaluate the integration and capacity compatibility between the pavement drainage system and the connected stormwater management infrastructure.

Author Contributions

Conceptualization, J.C. and I.K.; methodology, S.H. and J.J.; investigation, J.C.; data curation, S.H.; writing—original draft preparation, J.C.; writing—review and editing, J.J.; visualization, J.C.; supervision, I.K.; funding acquisition, I.K. All authors have read and agreed to the published version of the manuscript.

Funding

This research was funded by Land and Housing, Research Institute (grant number 2402372-00).

Institutional Review Board Statement

Not applicable.

Informed Consent Statement

Not applicable.

Data Availability Statement

The original contributions presented in this study are included in the article. Further inquiries can be directed to the corresponding author.

Acknowledgments

The authors would like to thank the members of the research team and Land and Housing Research Institute for their support throughout this project.

Conflicts of Interest

Author Jongseok Jung was employed by the company Land and Housing, Research Institute. The remaining authors declare that the research was conducted in the absence of any commercial or financial relationships that could be construed as a potential conflict of interest.

References

  1. Yu, H.; Zhu, Z.; Zhang, Z.; Yu, J.; Oeser, M.; Wang, D. Recycling Waste Packaging Tape into Bituminous Mixtures towards Enhanced Mechanical Properties and Environmental Benefits. J. Clean. Prod. 2019, 229, 22–31. [Google Scholar] [CrossRef]
  2. Chester, L.; Arnold, C.J.; Gibbons, C.J. Impervious Surface Coverage: The Emergence of a Key Environmental Indicator. J. Am. Plan. Assoc. 1996, 62, 243–258. [Google Scholar] [CrossRef]
  3. Lepeska, T. The Impact of Impervious Surfaces on Ecohydrology and Health in Urban Ecosystems of Banska Bystrica (Slovakia). Soil Water Res. 2016, 11, 29–36. [Google Scholar] [CrossRef]
  4. Yu, H.; Zhu, Z.; Leng, Z.; Wu, C.; Zhang, Z.; Wang, D.; Oeser, M. Effect of mixing sequence on asphalt mixtures containing waste tire rubber and warm mix surfactants. J. Clean. Prod. 2020, 246, 119008. [Google Scholar] [CrossRef]
  5. Marchioni, M.L.; Becciu, G. Permeable Pavement Used in Sustainable Drainage Systems (SUDs): A Synthetic Review of Recent Literature. WIT Trans. Built Environ. 2014, 183–194. [Google Scholar]
  6. Kim, H.; Jung, M.; Mallari, K.J.B.; Pak, G.; Kim, S.; Kim, S.; Yoon, J. Assessment of Porous Pavement Effectiveness on Runoff Reduction under Climate Change Scenarios. Desalination Water Treat. 2015, 53, 3142–3147. [Google Scholar] [CrossRef]
  7. Baek, S.S.; Choi, D.H.; Jung, J.W.; Lee, H.J.; Lee, H.; Yoon, K.S.; Cho, K.H. Optimizing Low Impact Development (LID) for Stormwater Runoff Treatment in Urban Areas, Korea: Experimental and Modeling Approach. Water Res. 2015, 86, 122–131. [Google Scholar] [CrossRef]
  8. Woods Ballard, B.; Wilson, S.; Udale-Clarke, H.; Illman, S.; Scott, T.; Ashley, R.; Kellagher, R. The SuDS Manual; CIRIA C753; Construction Industry Research and Information Association: London, UK, 2015; Available online: https://www.ciria.org/ItemDetail?iProductCode=C753F&Category=FREEPUBS (accessed on 9 October 2025).
  9. National Research Council, Division on Earth, Water Science, Technology Board; Committee on Reducing Stormwater Discharge Contributions to Water Pollution. Urban stormwater management in the United States; National Academies Press: Washington, DC, USA, 2009. [Google Scholar]
  10. Kim, J.C.; Jung, K.S. A Study on the Analysis of Reduction Effects and Comparison of Economic Feasibility by Applying the LID Technique. J. Korean Soc. Hazard Mitig. 2024, 24, 39–47. [Google Scholar] [CrossRef]
  11. Hein, D.K.; Schaus, L. Permeable Pavement Design and Construction: What Have We Learned Recently? In Green Streets, Highways, and Development 2013: Advancing the Practice; American Society of Civil Engineers: Reston, VA, USA, 2013; pp. 31–44. [Google Scholar] [CrossRef]
  12. Alsubih, M.; Arthur, S.; Wright, G.; Deonie, A. Experimental study on hydrological performance of a permeable pavement. Urban Water J. 2017, 14, 427–434. [Google Scholar] [CrossRef]
  13. Ministry of Environment. Manual for Applying Low Impact Development (LID) Techniques in Environmental Impact Assessment; Ministry of Environment: Sejong, Republic of Korea, 2013.
  14. Ministry of Environment. Low Impact Development (LID) Design Guidelines; Ministry of Environment: Sejong, Republic of Korea, 2016.
  15. Ministry of Land, Infrastructure, and Transport (MOLIT). Guidelines for Sidewalk Installation and Management; MOLIT: Sejong, Republic of Korea, 2021.
  16. KS F 2523; Standard Terminology for Aggregates. Korean Industrial Standards. Korean Standards Association: Seoul, Republic of Korea, 2024.
  17. Han, S.I.; Chung, Y.W.; Ahn, J.Y.; Lee, K.G.; Kim, K.Y. Busan National University Korea Low Impact Development Technology Manual for Road and Transportation System; National Library of Korea: Seoul, Republic of Korea, 2019.
  18. Smith, D.R. Permeable Interlocking Concrete Pavements: Design, Specifications, Construction, Maintenance; Interlocking Concrete Pavement Institute (ICPI): Herndon, VA, USA, 2011. [Google Scholar]
  19. Brattebo, B.O.; Booth, D.B. Long-Term Stormwater Quantity and Quality Performance of Permeable Pavement Systems. Water Res. 2003, 37, 4369–4376. [Google Scholar] [CrossRef]
  20. BS EN 13242:2013; Aggregates for unbound and hydraulically bound materials for use in civil engineering work and road construction. British Standards Institution(BSI): Lundon, UK, 2013.
  21. Wilson, S.; Maclntosh-Watson, M.; Morrell, D.; Urding, T.; Gorst, N. Design & Construction of Concrete Block Permeable Pavements, 7th ed.; Interpave: Leicester, UK, 2018. [Google Scholar]
  22. AS/NZS 4456:2003; Masonry Units and Segmental Pavers—Methods of Test. Standards Australia: Sydney, Australia; Standards New Zealand: Wellington, New Zealand, 2003.
  23. Choi, Y.J.; Ahn, D.; Nguyen, T.H.; Ahn, J. Assessment of Field Compaction of Aggregate Base Materials for Permeable Pavements Based on Plate Load Tests. Sustainability 2018, 10, 3817. [Google Scholar] [CrossRef]
  24. Indraratna, B.; Nguyen, V.T.; Rujikiatkamjorn, C. Hydraulic conductivity of saturated granular soils determined using a constriction-based technique. Can. Geotech. J. 2012, 49, 607–613. [Google Scholar] [CrossRef]
  25. Taylor, S.A.; Zettler, D.; Radcliffe, D.E. Effect of grain size distribution and compaction on permeability. J. Hydrol. Eng. 2012, 17, 378–383. [Google Scholar]
  26. Choi, Y.; Ahn, D.; Lee, Y.; Ahn, J. Compaction quality monitoring of open-graded aggregates by light weight deflectometer and soil stiffness gauge. Sustainability 2020, 12, 2521. [Google Scholar] [CrossRef]
  27. ASTM C-1701; Standard Test Method for Density and Void Content of Hardened Pervious Concrete. American Society for Testing and Materials (ASTM): West Conshohocken, PA, USA, 2017.
  28. ASTM C-1781; Standard Test Method for Surface Infiltration Rate of Permeable Unit Pavement Systems. American Society for Testing and Materials (ASTM): West Conshohocken, PA, USA, 2017.
  29. ASTM D-2434; Standard Test Methods for Measurement of Hydraulic Conductivity of Coarse-Grained Soils. American Society for Testing and Materials (ASTM): West Conshohocken, PA, USA, 2022.
  30. Koohmishi, M. Hydraulic conductivity and water level in the reservoir layer of porous pavement considering gradation of aggregate and compaction level. Constr. Build. Mater. 2019, 203, 27–44. [Google Scholar] [CrossRef]
  31. Chen, S.; Adhikari, S.; You, Z. Relationship of coefficient of permeability, porosity, and air voids in fine-graded HMA. J. Mater. Civ. Engineering 2019, 31, 04018359. [Google Scholar] [CrossRef]
  32. KS F 2322; Standard Test Method for Permeability of Saturated Soils. Korean Industrial Standards. Korean Standards Association: Seoul, Republic of Korea, 2017.
  33. Jang, K.W. The Research Regarding the Coef. of Permeability of the Compacted Fine-Grained Soil. Doctoral Dissertation, Jeju National Unversity, Jeju, Republic of Korea, 2005. [Google Scholar]
  34. Choi, S.W.; Bae, W.H.; Lee, K.M.; Shin, K.J. Correlation between Crack Width and Water Flow of Cracked Mortar Specimens Measured by Constant Water Head Permeability Test. J. Korea Concr. Inst. 2017, 29, 267–273. [Google Scholar] [CrossRef]
  35. Schaus, L.; Hein, D. Use of Permeable Pavements [Tech Brief] (No. FHWA-HIF-23-076); Department of Transportation, Federal Highway Administration: Washington, DC, USA, 2023.
  36. KS F 4419; Concrete Interlocking Block for Sidewalk and Road. Korean Industrial Standards. Korean Standards Association: Seoul, Republic of Korea, 2021.
  37. Seoul Metropolitan Government. Sidewalk Construction Design and Implementation Manual Ver2.0; Seoul Metropolitan Government: Seoul, Republic of Korea, 2021.
  38. Chea, C.W.; Lee, H.J.; Lee, J.H.; Lee, M.G.; Song, C.S. Characteristics of Frost Heaving to Grain Size and Permeability of Aggregate Materials. Proc. Korean Geotechical Soc. Conf. 2010, 2010, 1103–1109. [Google Scholar]
  39. Koohmishi, M.; Azarhoosh, A. Assessment of permeability of granular drainage layer considering particle size and air void distribution. Constr. Build. Mater. 2021, 270, 121373. [Google Scholar] [CrossRef]
  40. Ghabchi, R.; Zaman, M.; Khoury, N.; Kazmee, H.; Solanki, P. Effect of gradation and source properties on stability and drainability of aggregate bases: A laboratory and field study. Int. J. Pavement Eng. 2013, 14, 274–290. [Google Scholar] [CrossRef]
  41. Oh, H.; Likos, W.J.; Edil, T.B. Drainability of Base Aggregate and Sand (No. NRRA202107); Minnesota, Department of Transportation: Saint Paul, MN, USA, 2021.
  42. Das, B.M. Advanced Soil Mechanics; CRC Press: Boca Raton, FL, USA, 2019. [Google Scholar] [CrossRef]
  43. Van Lopik, J.H.; Zazai, L.; Hartog, N.; Schotting, R.J. Nonlinear flow behavior in packed beds of natural an and variably graded granular materials. Transp. Porous Media 2020, 131, 957–983. [Google Scholar] [CrossRef]
  44. James, W.; von Langsdorff, H.; McIntyre, M. Permeable pavers designed for rapid renewal by considering sweeper mechanics: Initial field tests. J. Water Manag. Model. 2018, 26, C450. [Google Scholar] [CrossRef]
  45. Liu, Q.; Liu, S.; Hu, G.; Yang, T.; Du, C.; Oeser, M. Infiltration capacity and structural analysis of permeable pavements for sustainable urban: Afull-scale case study. J. Clean. Prod. 2021, 288, 125111. [Google Scholar] [CrossRef]
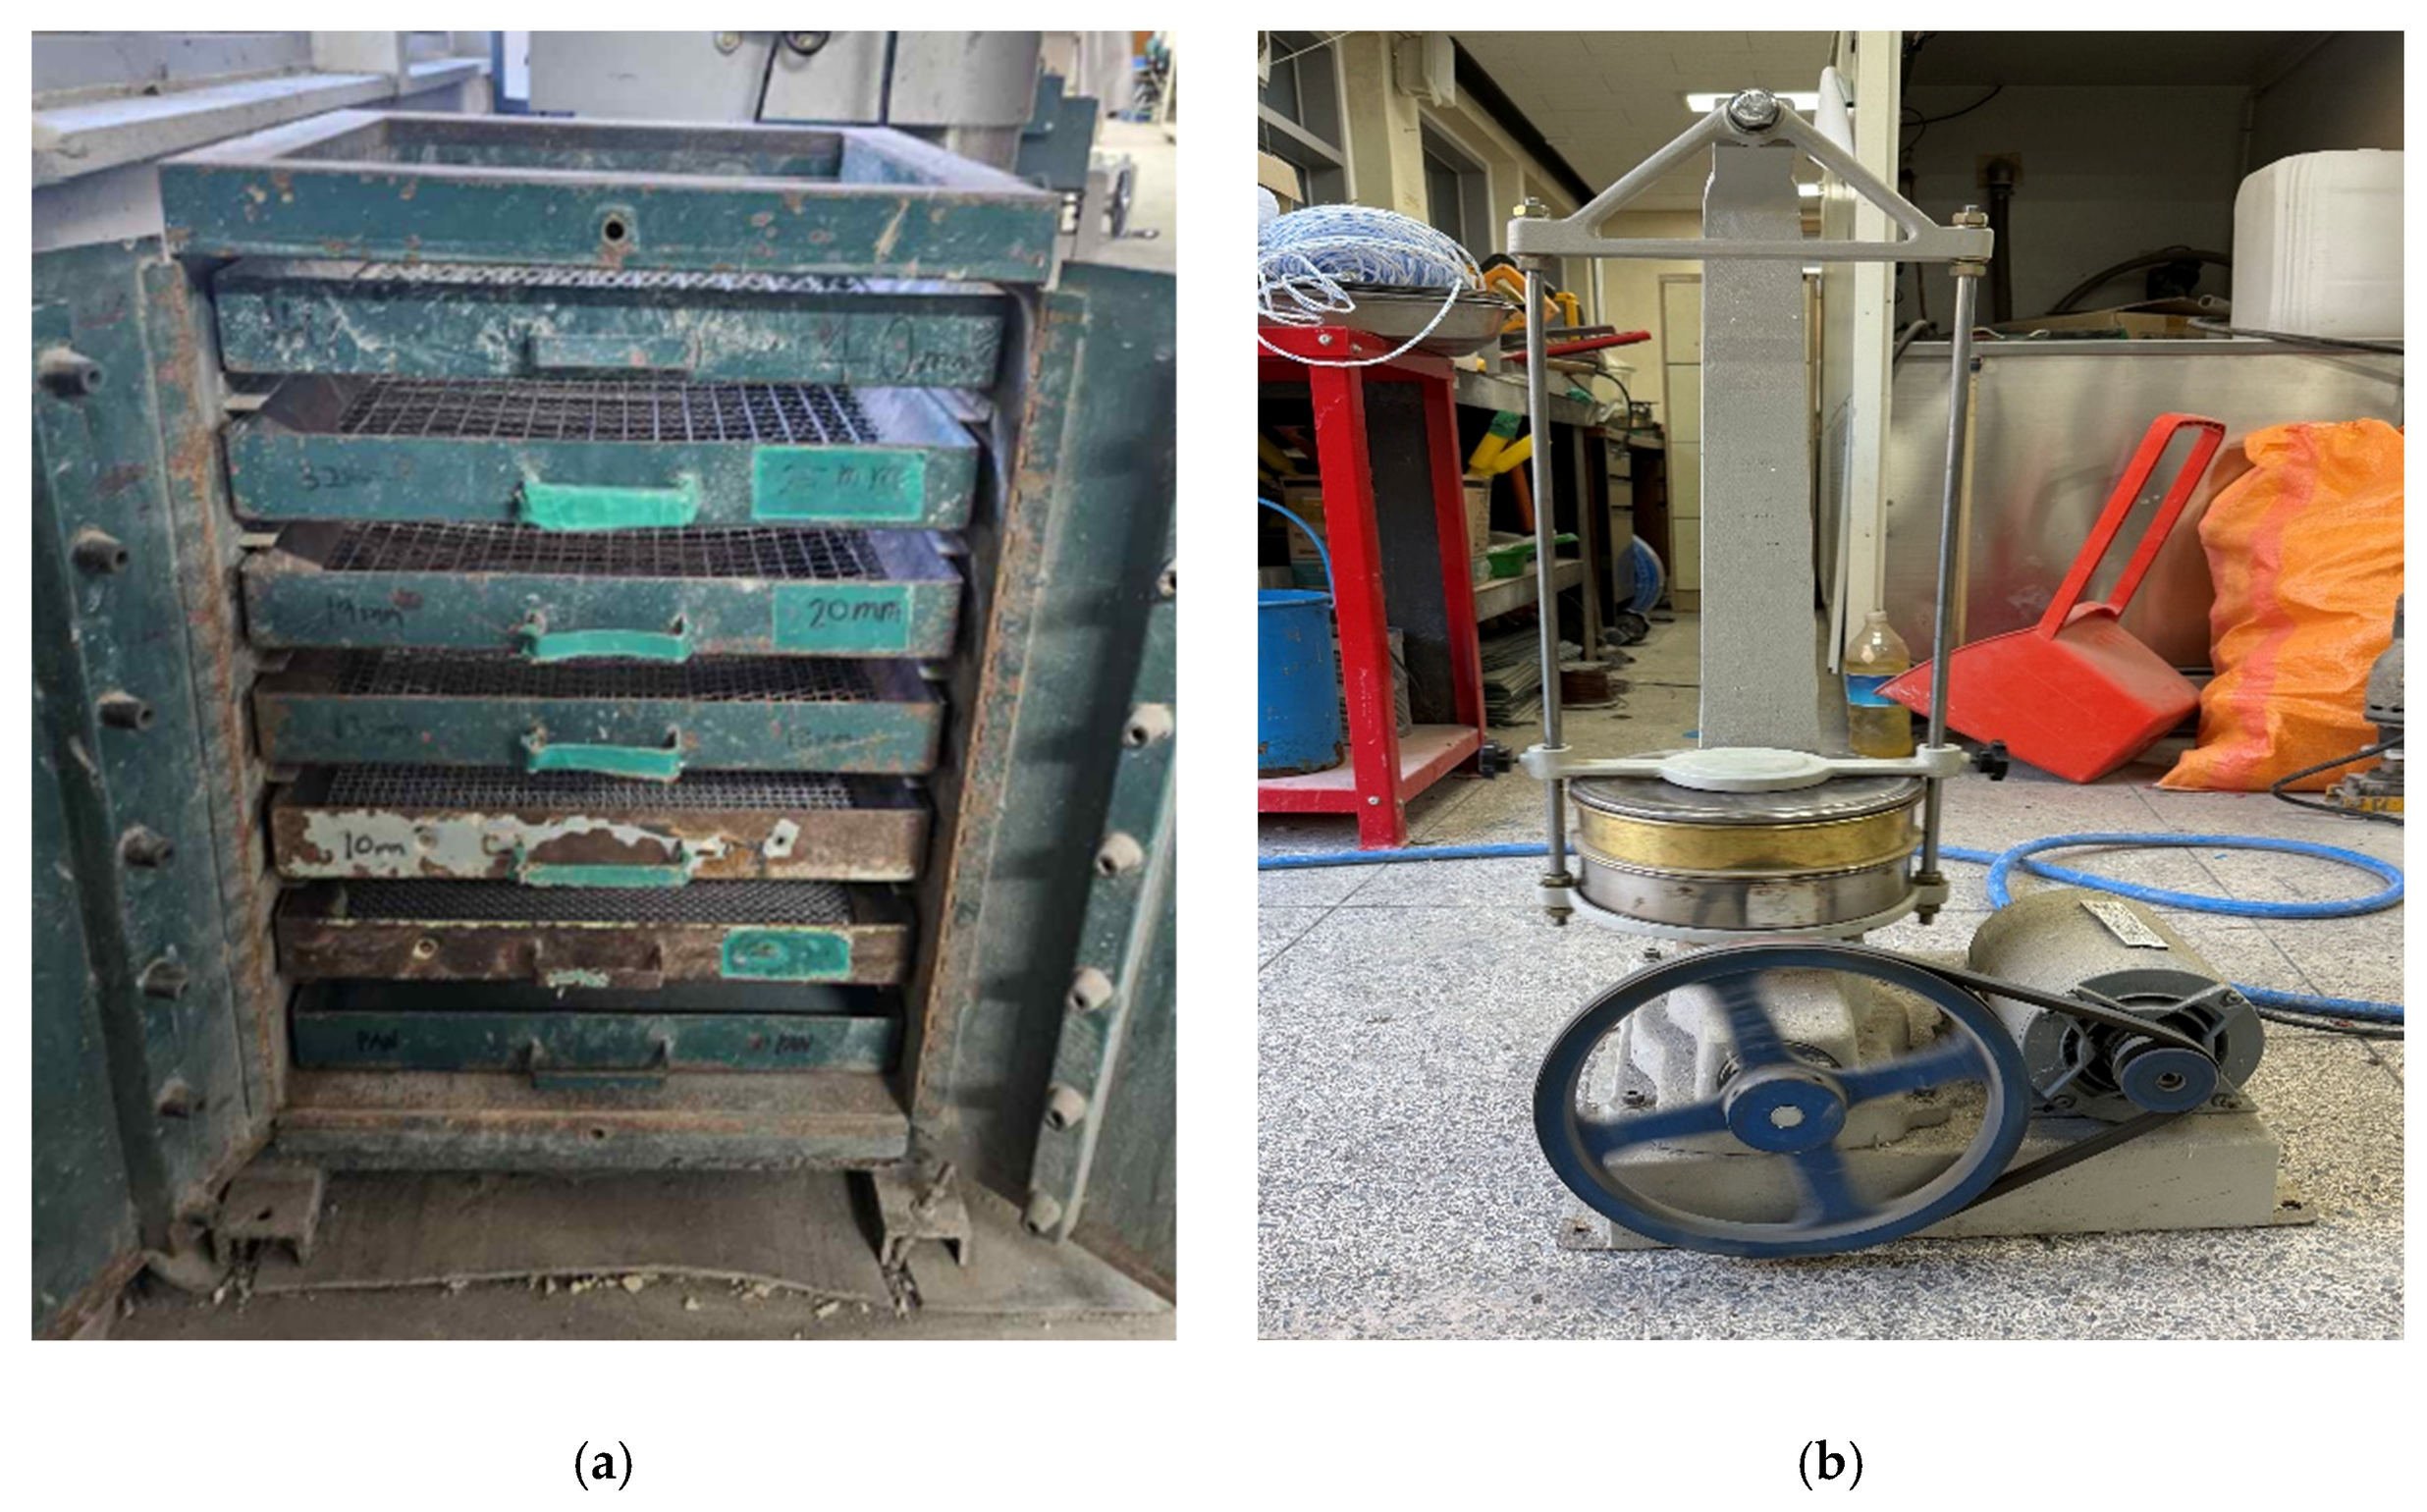
Figure 1. The mechanical sieve shaker used to conduct a particle size analysis of the aggregates: (a) coarse aggregate equipment; (b) fine aggregate equipment.
Sustainability 17 10535 g001
Figure 2. The sieve analysis procedure used to classify aggregates into different size fractions: (a) coarse aggregate; (b) fine aggregate.
Sustainability 17 10535 g002
Figure 3. Gradation of coarse specimens used for permeability evaluation of permeable block pavement.
Sustainability 17 10535 g003
Figure 4. Schematic diagram of small-scale permeability test apparatus for evaluating permeable block pavement performance.
Sustainability 17 10535 g004
Figure 5. Test procedure for evaluating the permeability performance of permeable block pavement: (a) placement of base course aggregates; (b) compaction using a small hand compactor; (c) measurement of specimen height; (d) placement of a permeable geo-textile sheet; (e) rainfall simulation; (f) water collection and maintenance of constant water level; (g) subsurface runoff collection Section; (h) measurement of runoff volume.
Sustainability 17 10535 g005
Figure 6. Schematic diagram of the large-scale rainfall simulation and permeable block pavement permeability evaluation system.
Sustainability 17 10535 g006
Figure 7. Construction Process of the Permeable Block Pavement System for Rainfall Simulation Experiments: (a) Aggregate Mixing using a Mechanical Mixer; (b) Placement of Aggregates for Well-graded Subbase; (c) Base Layer Compaction using a Vibratory Compactor; (d) Construction of the Bedding Layer; (e) Installation of Permeable Block Pavement; (f) Application of Jointing Sand; (g) Complete Permeable Block Pavement System; and (h) Rainfall Simulator.
Sustainability 17 10535 g007
Figure 8. Correlation between permeability and input variables.
Sustainability 17 10535 g008
Figure 9. Permeability prediction from model A of MLR (excluding K = 1.0 mm/s).
Sustainability 17 10535 g009
Figure 10. Permeability coefficient (K) results for structural variations in the permeable block pavement system.
Sustainability 17 10535 g010
Figure 11. Runoff hydrographs at a rainfall intensity of 88.2 mm/h by base course.
Sustainability 17 10535 g011
Figure 12. Runoff hydrographs at a rainfall intensity of 88.2 mm/h by base course with sand (bedding layer). The ‘#’ simply represents the test number.
Sustainability 17 10535 g012
Figure 13. Runoff hydrographs at a rainfall intensity of 88.2 mm/h by base course with sand (bedding layer), BP (block pavement). The ‘#’ simply represents the test number.
Sustainability 17 10535 g013
Table 1. Comparison of sustainable technologies for urban stormwater management.
SystemDefinitionBenefitsDifferences
SUDs
(Sustainable Urban Drainage Systems)
Manage runoff on-site through distributed structure that mimic natural processes
(UK-centric)
Flood risk reduction
Removes pollutants removal from water
Ecosystem restoration
Urban amenity enhancement
Long-term cost savings
Comprehensive systems approach integrating BMPs or LID
Emphasis on social and environmental sustainability
BMPs
(Best Management Practices)
Structural and non-structural techniques for runoff quantity management and pollutant removal
(North America-centric)
Effective pollutant removal
Peak flow attenuation
Ease of installation
Regulatory compliance
Broadest term, encompassing conventional and large-scale structures
Performance-oriented rather than nature-centric
LID
(Low Impact
Development)
Small-scale, distributed techniques to maintain pre-development hydrologic conditions
On-site infiltration and evapotranspiration promotion
Minimized development costs
Ecological and hydrologic balance
Climate change adaptation
Small-scale, source-control-focused method
Natural mimicry integrated from the development design stage
Table 2. Basic information on the test materials.
Test MaterialAbrasion
Resistance
Plastic
Index
StabilityPorositySpecific
Gravity
Crushed
Aggregate
20.9%1.908.6%38.8%2.65
Table 3. Measurement of Permeability according to Base Course Particle Size Distribution.
SampleBottom Out-Flow (g)
Base CourseBase Course + SandBase Course + Sand + BP
Test 1Test 2Test 3Test 1Test 2Test 3Test 1Test 2Test 3
1-1148613401304966960968692696694
1-2680670670500510530290300290
1-3420400410320330320210210190
2-1810770780460430470390380380
2-2670670670380390410310310320
2-3000000000
3640640630500490500350290330
4- *--500510500660680670
5---------
6---------
7780770780500510530370350360
* - : Data not collected.
Table 4. Coefficient of Permeability (mm/s) for Base course Particle Size Distribution.
Type1-11-21-32-12-2347
Base Course0.420.210.130.260.200.20-0.23
Base Course + Sand0.400.210.130.190.150.200.270.20
Base Course + Sand + BP0.400.170.120.210.170.190.420.20
Table 5. Rainfall Simulation Test Results Using the Large-Scale Apparatus.
Time (s)Bottom Out-Flow (L)
Base CourseBase Course + SandBase Course + Sand + BP
Test 1Test 1Test 2Test 1Test 2
000000
51.200.624.840.692.16
107.166.3611.048.5210.82
159.5211.8712.2512.6013.09
2010.2213.3813.4813.4013.65
2511.0513.5813.8913.6113.63
3011.8013.8814.0613.9513.70
354.538.237.738.638.47
400.781.241.142.772.69
450.210.480.491.371.34
500001.220.80
550000.810.44
600000.670.34
Total Outflow56.4769.6778.9278.2481.13
Table 6. Results of Hydrograph Parameters and Estimation of Storage Capacity.
ParameterBase CourseBase Course + SandBase Course + Sand + BP
Test 1Test 1Test 2Test 1Test 2
Q2.36 L/min2.80 L/min2.82 L/min2.74 L/min2.79 L/min
T1 (s)14946335867
T (s)18001800180012001800
Lag Time (s)1500900900900900
Base Time (s)12001200120018001800
S35.98%21.01%10.52%26.28%24.23%
Table 7. Physical Properties and Coefficient of Permeability based on Aggregate Particle Size Distribution.
SampleFine Contene (%)D10 (mm)D30 (mm)D50 (mm)D60 (mm)CuCcK (mm/s)
1-10.00.409.0016.3320.0050.0010.130.42
1-22.50.273.6813.1716.9763.623.000.21
1-35.00.191.809.8113.8974.401.250.13
2-10.00.409.0016.3320.0050.0010.130.26
2-22.50.273.6813.1716.9763.623.000.20
2-35.00.191.809.8113.8974.41.250.00
33.01.169.0013.0015.0012.894.640.20
40.19.0010.6012.2013.001.440.96Too High
50.012.517.4321.2922.711.821.07Too High
60.05.5310.7515.2017.203.111.21Too High
73.01.294.3111.0014.7511.430.970.23
Table 8. Comparison of regression models for permeability prediction.
ModelVariablesAdjusted R2AICc
AFine Content, Cu, D10, D30, D10 × D300.9136.91
BD10, D10 × D300.896−9.51
CCu, D10, D10 × D300.892−5.33
DFine Content, D10, D10 × D300.888−5.00
EFine Content, D10, D30, D10 × D300.8870.79
Disclaimer/Publisher’s Note: The statements, opinions and data contained in all publications are solely those of the individual author(s) and contributor(s) and not of MDPI and/or the editor(s). MDPI and/or the editor(s) disclaim responsibility for any injury to people or property resulting from any ideas, methods, instructions or products referred to in the content.