Article

Evaluation of the Structural Resilience of Multi-Mode Transportation Networks in Metropolitan Areas: A Case Study of the Jinan Metropolitan Area, China

1
School of Management Engineering, Qingdao University of Technology, Qingdao 266520, China
2
Department of Management Engineering, Qingdao University of Technology (Linyi), Linyi 273400, China
*
Author to whom correspondence should be addressed.
Sustainability 2025, 17(23), 10528; https://doi.org/10.3390/su172310528
Submission received: 16 September 2025 / Revised: 17 November 2025 / Accepted: 21 November 2025 / Published: 24 November 2025

Abstract

As a core factor in advancing urban agglomeration development and new urbanization, the structural resilience of multi-modal transportation networks in metropolitan areas directly determines their disturbance resistance during emergencies and their sustainable development. To address the prevalent “core–peripheral” connectivity imbalance in medium-sized metropolitan areas, this study takes the Jinan Metropolitan Area as an empirical case to systematically explore its multi-modal transportation network’s structural resilience. A three-dimensional evaluation framework of “absorbing capacity–buffering capacity–recovery capacity” was built based on complex network theory. Network efficiency was used to measure absorbing capacity, the average number of independent paths was used to characterize buffering capacity, and structural entropy was used to determine recovery capacity. The entropy weight method was used to calculate integrated multi-dimensional resilience values, and a sequential node failure simulation was used to analyze network invulnerability. The main findings are as follows: (1) The Jinan Metropolitan Area’s multi-modal transportation network has “small-world characteristics” but low density, with trunk line coverage gaps. (2) Sub-networks differ significantly. The railway sub-network performs best, the highway sub-network is the weakest, and the composite network achieves resilience balance through multi-modal collaboration. (3) Node failure analysis reveals that “core hubs are resilience pillars, while secondary highway nodes are weaknesses.” The proposed “three-dimensional evaluation framework” provides a methodological reference for resilience quantification in similar metropolitan areas, and the “trunk line densification + peripheral connection” strategy supports the implementation of metropolitan planning policies to promote modern metropolitan transportation systems with efficient commuting and robust disturbance resistance.

1. Introduction

As a key factor in the spatial distribution of urban populations, metropolitan areas are an important part of the formation and development of urban agglomerations and the process of new urbanization. At the same time, they can promote coordinated development of the region, the integration of urban and rural development, and rural revitalization. They also have important functions in supporting the construction of a modern economic system and economic development [1]. Transportation infrastructure can shorten space–time distances, break up the relatively static and hierarchical regional center systems, change the direction and intensity of interregional interactions, and shape the evolution of regional spatial structures and economic ties [2,3]. It also influences the formation and development of metropolitan areas and economic axes by promoting population flow, commercial exchange, cultural transmission, the balance of regional spatial structures, and coordinated development within urban agglomerations [4,5]. Therefore, the development of regional transportation infrastructure is crucial to the construction of metropolitan areas. However, current multi-mode transportation networks in metropolitan areas are not perfect, and the transportation links between some cities in metropolitan areas are relatively weak and lack a mutual connection. Multi-mode transportation networks in metropolitan areas cover a wide range, involve many stations, and are interconnected and complex. Their operation will inevitably encounter interference from external environmental factors and disasters, posing a major challenge to stable operation and leading to a high risk of emergencies. Therefore, it is necessary to accurately evaluate and enhance the structural resilience of multi-mode transportation networks in the metropolitan areas under emergencies.
When the word “resilience” first appeared in ecosystem research [6], it originally meant to “restore to the original state.” After continuous development, resilience is now defined as the ability of an object or system to resist and absorb external interference and its ability to restore its original state or adapt to a new state after interference [7,8,9,10]. In the early stages, research primarily focused on structural robustness, i.e., the ability of physical networks to resist static failures. Albert et al. [11] pioneered the application of complex network theory to assess the vulnerability of scale-free transportation networks; however, this framework only considered topological connectivity while neglecting functional continuity. Subsequently, the scope of the research expanded to include recovery capacity and adaptability. Chalkiadakis et al. [12] proposed a dual-indicator system of “network efficiency—criticality” to quantify resilience, defining resilience as “the ability of the system to maintain its performance to acceptable levels despite disruptive events, including natural and man-made hazards.” Wang et al. [13] further distinguished between structural resilience and functional resilience, laying the foundation for multi-dimensional assessment. Emerging studies have emphasized synergistic resilience between subsystems and long-term adaptability. The Urban Circle Transportation Resilience Collaborative Improvement study identified four core dimensions of metropolitan resilience—risk resistance, recovery capacity, adaptability, and synergy—highlighting the necessity of integrating infrastructure, operational systems, and social systems. However, there remains a lack of theoretical consensus on how to quantify the “synergistic effects between highway and railway sub-networks,” a key gap addressed in this study.
Currently, domestic and international research on resilience focuses on three main areas: domain classification, resilience assessment, and resilience improvement strategies [14,15,16,17,18,19,20]. Network structural resilience is used to measure a region’s ability to withstand shocks and recover, maintain, or enhance its original system and critical functions when facing external disturbances. This approach focuses on spatial manifestations of regional resilience, including assessments of network structural resilience to explore regional spatial characteristics [21].
Contemporary research exhibits distinct interdisciplinary features, drawing on findings from complex system theory and network science to investigate transportation network resilience. Complex system theory is applied to model cascading failures in multi-modal networks. Song et al. [22] developed a cascading failure model for complex networks that integrates node betweenness centrality with the power-law distribution of node degrees. This model can simulate how extreme load fluctuations trigger the propagation of failures across network layers. Validated through extensive comparative experiments, the model effectively captures the inter-layer failure propagation process; however, as its original parameters were calibrated for networks with high topological density, adaptations are required for medium-sized urban regions with sparser connectivity. Topological indicators are also widely used but have inherent limitations. Fan et al. [23] found that traditional static topological indicators exhibit significant biases when assessing resilience risks in highway networks covering mountainous areas. This bias arises because such indicators ignore dynamic changes in traffic flow findings that further confirm the need to adjust assessment indicators for geographically complex regions. Methodologically, approaches have evolved from static assessments to dynamic simulations, with the “absorbing-buffering-recovery” framework becoming the mainstream method for structural resilience evaluation. Ma et al. [24] assessed the structural resilience of multi-modal transportation networks in urban agglomerations based on three dimensions—absorbing capacity, buffering capacity, and recovery ability—and calculated the network structural resilience index.
Based on existing studies, three key gaps have been identified in current research on transportation networks’ structural resilience.
Scholars have predominantly focused on the resilience of single-mode transportation networks, concentrating solely on resilience changes within individual highway or railway networks. In contrast, research on the structural resilience of multi-modal transportation networks within a specific region remains limited.
Most studies have centered on the structural resilience of the overall transportation network, failing to quantify differences between distinct sub-networks (i.e., highways and railways). This lack of quantitative analysis hinders a precise understanding of the relative performance and vulnerability of each sub-network.
Existing research has largely been confined to the scales of “urban agglomerations” or “inter-regional corridors,” with insufficient attention devoted to the “1-h commuting circle” scale of metropolitan areas. In particular, there is a dearth of targeted research on multi-modal transportation resilience in medium-sized metropolitan areas.
As a crucial component of urban agglomerations, metropolitan areas must promote the diffusion of central urban functions to areas within the 1-h transportation circle and foster the development of efficient and integrated regional commuting systems. Consequently, the structural resilience of transportation networks within metropolitan areas deserves significant attention.
The Jinan Metropolitan Area is a typical medium-sized metropolitan area. The commuting time between its core city (Jinan) and peripheral counties generally ranges from 30 to 60 min, which is typical of “1-h commuting circle” metropolitan areas. Within this area, highways and railways serve as the primary commuting modes.
The Jinan Metropolitan Area’s multi-modal transportation network comprises two major sub-networks, the highway and the railway, with significant differences in resilience between the two. Therefore, this study examines Jinan Metropolitan Area’s multi-modal transportation network. From three dimensions—absorbing capacity, buffering capacity, and recovery capacity—this study evaluates the structural resilience of the metropolitan multi-modal transportation network under node failure scenarios. The aim is to identify the network’s advantages and shortcomings, thereby providing a theoretical basis for further optimization.
Section 2 defines the concept of structural resilience in metropolitan multi-modal transportation networks, constructs a three-dimensional evaluation framework (absorbing capacity, buffering capacity, recovery capacity) based on complex network theory, and clarifies the calculation methods for core indicators (network efficiency, average number of independent paths, structural entropy) and the entropy weight method for objective weighting.
Section 3 builds the Jinan Metropolitan Area’s multi-modal transportation network. Taking 23 highway passenger stations and 22 railway stations (Grade II and above) as nodes and direct connections or passenger transfers between stations as edges, it constructs an undirected and unweighted network topology. It also analyzes the network’s topological attributes (average degree, network density, average clustering coefficient, etc.) using ArcMap 10.8 and MATLAB R2018b.
Section 4 evaluates the network’s structural resilience under node failure scenarios. By simulating sequential failures of all 45 nodes, it calculates the absorbing capacity, buffering capacity, and recovery capacity of the composite network and its sub-networks (highway, railway), identifies core hubs and weak links, and quantifies the differential impact of node failures on overall resilience.
Section 5 takes the theory of collaborative learning as the core analytical perspective, aiming to clarify the historical evolution of the formation of key “nodes” in Jinan Metropolitan Area’s multi-mode transportation network and the non-optimal status of transportation route density and provide an explanation for its resilience. This section focuses on the formation mechanism of key nodes, the causes of non-optimal route density, and the collaborative interpretation of evolution paths.
Section 6 proposes targeted resilience improvement strategies. From the perspectives of network topology optimization and multi-modal collaboration, it puts forward actionable measures to address the “core-peripheral imbalance” and “weak secondary nodes” identified in the study.
Section 7 summarizes the main research conclusions, clarifies the academic contributions of this study, and points out limitations and directions for future research.

2. Characteristics of Structural Resilience of Multi-Modal Transportation Network in Metropolitan Area

According to the scope defined in the Jinan Metropolitan Area Development Plan (2024–2030), the Jinan Metropolitan Area encompasses the entire administrative region of Jinan City, four districts of Zibo City (Zhangdian, Zichuan, Zhoucun, and Linzi), three administrative units of Tai’an City (Taishan District, Daiyue District, and Feicheng City), three counties/cities of Dezhou City (Linyi County, Qihe County, and Yucheng City), two administrative units of Liaocheng City (Chiping District and Dong’e County), and Zouping City of Binzhou City, totaling 25 county-level administrative divisions.
As of 2025, three high-speed railways are in operation within the metropolitan area: the Qingdao–Jinan–Zhengzhou High-Speed Railway, the Jinan–Qingdao Intercity Railway, and the Beijing–Shanghai High-Speed Railway. Additionally, three high-speed railways are under planning or construction: the Northern Shandong High-Speed Railway, the Central Shandong High-Speed Railway, and the Binzhou–Linyi High-Speed Railway.
Metropolitan multi-mode transportation networks comprise multiple sub-networks, such as railways, highways, and aviation, and each sub-network is composed of nodes at different levels and links between points [25]. This study combines multi-modal transportation networks with elasticity based on the actual transportation network in the Jinan Metropolitan Area. A metropolitan multi-mode transportation network’s structural resilience refers to its ability to resist external interference, adapt, and maintain its original functions, attributes, and structures after network performance is affected by the failure of one or more nodes or lines in the composite network.
A network’s structural resilience is an embodiment of regional spatial attributes. When a transportation network is attacked, the process of coping with the attack (before the attack, during the attack, and after the attack) varies by stage. To explore changes in different stages, this study will evaluate the transportation network’s structural resilience across three dimensions: absorbing capacity, buffering capacity, and recovery capacity. Changes in the metropolitan multi-mode transportation network’s structural resilience are shown in Figure 1. Before the fault occurs, the network’s performance is normal, and structural resilience is stable and reliable until time t(0), which is w(0). When the node or line is attacked, the network’s performance is affected, and its structural resilience drops sharply from the original state. However, the network also has anti-interference capacities. When the node or line fails, the network’s structural resilience value drops to the lowest point w(1) at time t(1), and the t(0)–t(1) stage is defined as the absorption stage to external interference. After the attack, the network enters the self-buffering phase (t(1)–t(2)) because there are other paths available for travel to maintain transportation. With the implementation of recovery measures, the network’s performance gradually returns to normal, and structural resilience returns to its original level w(0). This stage (t(2)–t(3)) is the network recovery stage.

2.1. Measuring the Structural Resilience of Multi-Modal Transportation Networks in Urban Agglomerations

When facing node failures, the Jinan Metropolitan Area’s transportation network exhibits distinct “phased response characteristics.” In the early failure stage (t0–t1), this manifests as a decline in network efficiency (absorbing disturbances); in the middle stage (t1–t2), it relies on alternative paths to maintain functions (buffering adjustment); and in the later stage, it returns to stability through recovery measures (recovery and reconstruction). This phased process corresponds to the “absorbing-buffering-recovery” three-dimensional framework.
Therefore, this study measures the structural resilience of the transportation network across three dimensions: absorbing capacity, buffering capacity, and recovery capacity. Compared with single-dimensional frameworks, this three-dimensional framework can fully capture whole-process resilience changes in the metropolitan area, from failure response to functional recovery, avoiding underestimation of network invulnerability caused by missing dimensions.

2.1.1. Absorbing Capacity

Absorbing capacity refers to the ability of a network to resist interference when under attack [26]. Network efficiency, by quantifying the average accessibility of the shortest paths between nodes, can directly reflect absorbing capacity. Greater network efficiency indicates that when a specific node or link is attacked, the network can still maintain the connectivity function between core nodes through remaining paths. In such cases, the network responds more quickly to external stimuli, exhibits stronger resistance, and achieves better connectivity. This is highly consistent with the core objective of absorbing capacity, which is to “resist initial impacts and minimize functional losses.” The formula is as follows [27]:
E = 1 N ( N 1 ) i j 1 d i j
where E is the network’s efficiency, N is the number of nodes, and d i j is the length of all shortest paths from node i to node j .
A = E ( i ) E ( 0 )
where A is the absorbing capacity of the network after a fault, E ( i ) is the network efficiency after node i fails, and E ( 0 ) is the network’s efficiency without any faults.

2.1.2. Buffering Capacity

Buffering capacity refers to the ability of a network to self-adjust or respond to faults by changing after an attack [28,29]. In the metropolitan multi-modal transportation network, buffering capacity refers to the network’s response to failures. Specifically, it denotes the ability of the network to select alternative paths for transportation tasks, adapt to the new environment, and recover its operational level when nodes or lines in the network are attacked. In multi-modal transportation networks, there are usually multiple alternative transportation paths between different node pairs. When a node or path fails due to a fault, rendering an independent path unreachable, the remaining independent paths can quickly undertake transportation demands, ensuring the normal operation of the network’s core functions. The average number of independent paths can be used to quantify the scale of alternative non-overlapping paths between node pairs. A larger average number of independent paths indicates that after the failure of a single node or line, the network has more alternative transportation channels to switch to. This can effectively avoid continuous performance degradation and reflects stronger network redundancy, which is consistent with the core requirement of buffering capacity, “redundant support and adaptation to fault impacts.” Therefore, this study uses the average number of independent paths to characterize the network’s buffering capacity. The formula is as follows [30]:
L = 1 N ( N 1 ) i j n i j
where L is the average number of independent paths, N is the number of nodes, and n i j is the number of independent paths between node i and node j in the network.
B = L ( i ) L ( 0 )
where B is the buffering capacity of the network after failure, L ( i ) is the average number of independent paths after node i failure, and L ( 0 ) is the average number of independent paths without any failure. A B value closer to 1 indicates that more redundant paths are retained in the network after failure, corresponding to stronger buffering capacity; when B < 1, the buffering capacity is impaired, and a smaller value implies more severe impairment.
In this study, the average number of independent paths refers to “the scale of alternative ‘non-backbone edge-disjoint’ paths between node pairs.” “Non-backbone edge-disjoint” means that paths do not share non-backbone edges. Non-backbone edges are defined as branch edges connecting county/suburban nodes to the backbone network; backbone edges (defined as those corresponding to national/provincial highways and national railway trunk lines) can be shared. This aligns with the actual operational characteristics of transportation networks; backbone edges have high transportation capacity, and sharing them will not lead to path redundancy failure. Instead, it reflects the network’s anti-interference capability against branch edge failures.

2.1.3. Recovery Capacity

Recovery capacity refers to the ability of a system to quickly recover to its initial state or another stable state [31]. When a metropolitan multi-mode transportation network is attacked, it should be adjusted according to current environmental conditions and gradually recover from a low operation level to normal levels. Structural entropy reflects the stability of the network structure by measuring the uniformity of node degree distribution. A higher structural entropy value indicates smaller differences in node connectivity; the network does not overly rely on specific core nodes, and, during recovery, it can quickly restart its functions through distributed reconstruction rather than being constrained by the repair progress of a single node. This translates to higher structural stability and a greater ability to recover to its normal state. This is consistent with recovery capacity, which emphasizes “rapid reconstruction and return to stability.” A multi-modal transportation network with high structural entropy can leverage the stability of its network structure to quickly restore its initial performance. Therefore, this study uses structural entropy to measure the network’s recovery capacity. The formula is as follows [32]:
S = 1 ln N i N I i ln I i
I i = k i i N k i
where S is the normalized structural entropy (with a value range of [0, 1]). ln N serves as the normalization coefficient, which ensures the comparability of entropy values across networks with different node scales. k i is the node degree of node i , and I i is the ratio of the node degree of node i to the total node degree of the network.
R = S ( i ) S ( 0 )
where R is the recovery capacity of the network after failure, S ( i ) is the structural entropy of node i after failure, and S ( 0 ) is the structural entropy without any failure.

2.2. Global Structural Resilience Assessment

Absorbing capacity A , buffering capacity B , and recovery capacity R are positive indicators used to measure the structural resilience of multi-modal transportation networks in urban areas. The larger the value, the better the structural resilience of the transportation network. When a node fails, the formula for calculating the structural resilience value of a multi-modal transportation network is as follows:
W = μ 1 A + μ 2 B + μ 3 R
μ 1 + μ 2 + μ 3 = 1
where μ 1 , μ 2 , and μ 3 represent the weights of absorbing capacity, buffering capacity, and recovery capacity.
The entropy weight method [33] measures the degree of dispersion of indicators through indicator information entropy; the smaller the information entropy, the greater the difference in indicator values and the higher the weight of the indicator in decision making. Conversely, the larger the information entropy, the more convergent the indicator values and the lower the weight. It is an objective weighting method.
Compared with the analytic hierarchy process (AHP), which relies on expert scoring, the entropy weight method is free from subjective bias and can adapt to differences between sub-networks. Therefore, this study adopts the entropy weight method to assign weights to absorbing capacity ( A ), buffering capacity ( B ), and recovery capacity ( R ). For specific operations, the post-fault resilience indicators ( A i , B i , R i ) of 45 nodes are used as input, and the weights of each indicator are derived through information entropy. Finally, the weights are obtained as w A = 0.1855, w B = 0.4966, and w R = 0.3179.
Because the core input indicators of the entropy weight method (especially absorbing capacity A and recovery capacity R ) depend on network efficiency and the shortest path length, it is necessary to clearly define the processing rules for isolated components (sub-components disconnected from the main network) after node failure. This ensures the accuracy of network efficiency and the shortest path length, thereby guaranteeing the reliability of the input data for the entropy weight method.
Shortest path length ( d i j ): The shortest path lengths between isolated components and main network node pairs, as well as between node pairs within isolated components, are all set to infinity (∞). The former has no effective connected path, while the latter cannot participate in inter-regional transportation; neither has practical functionality.
Network efficiency ( E ): When substituting into Formula (1), d i j = ∞ corresponds to 1 d i j = 0, and only the path contributions of connectable node pairs within the main network are counted. This not only adheres to the basic rule of “removing the failed node and its connected edges” but also avoids interference of isolated components in calculating E and d i j . It also ensures that indicators, such as A and R , reflect the inter-regional transportation function status of the network, providing reliable data for weight assignment via the entropy weight method.
Compared with single-dimensional structural resilience models, the research model adopted in this study can address the “dimension missing” issue. Single-dimensional models only focus on structural connectivity (e.g., node degree) and fail to capture the “buffering-recovery” process of the network; in contrast, the three-dimensional model covers the entire process of failure response, avoiding underestimation of network resilience. Furthermore, the proposed model is adaptable to multi-modal collaboration scenarios. Single-dimensional models are designed for single-mode networks and cannot compare resilience differences between sub-networks. The three-dimensional indicators are used to calculate the resilience values of each sub-network separately, providing a basis for “multi-modal collaboration optimization.” This study uses the entropy weight method for weighting to avoid bias.
Before applying the entropy weight method to calculate the weights of absorbing capacity, buffering capacity, and recovery capacity, two preprocessing steps were completed. (1) All three resilience indicators were converted into relative ratios of “post-failure value/initial value” to eliminate differences in indicator dimensions. (2) Min–Max normalization was adopted to unify the relative ratios into the interval [0, 1], which avoids the interference of numerical scale deviations on entropy weight calculation and ensures the objectivity and comparability of the weight results.

3. Construction of Metropolitan Multi-Modal Transportation Networks

3.1. Building a Multi-Modal Transportation Network in the Jinan Metropolitan Area

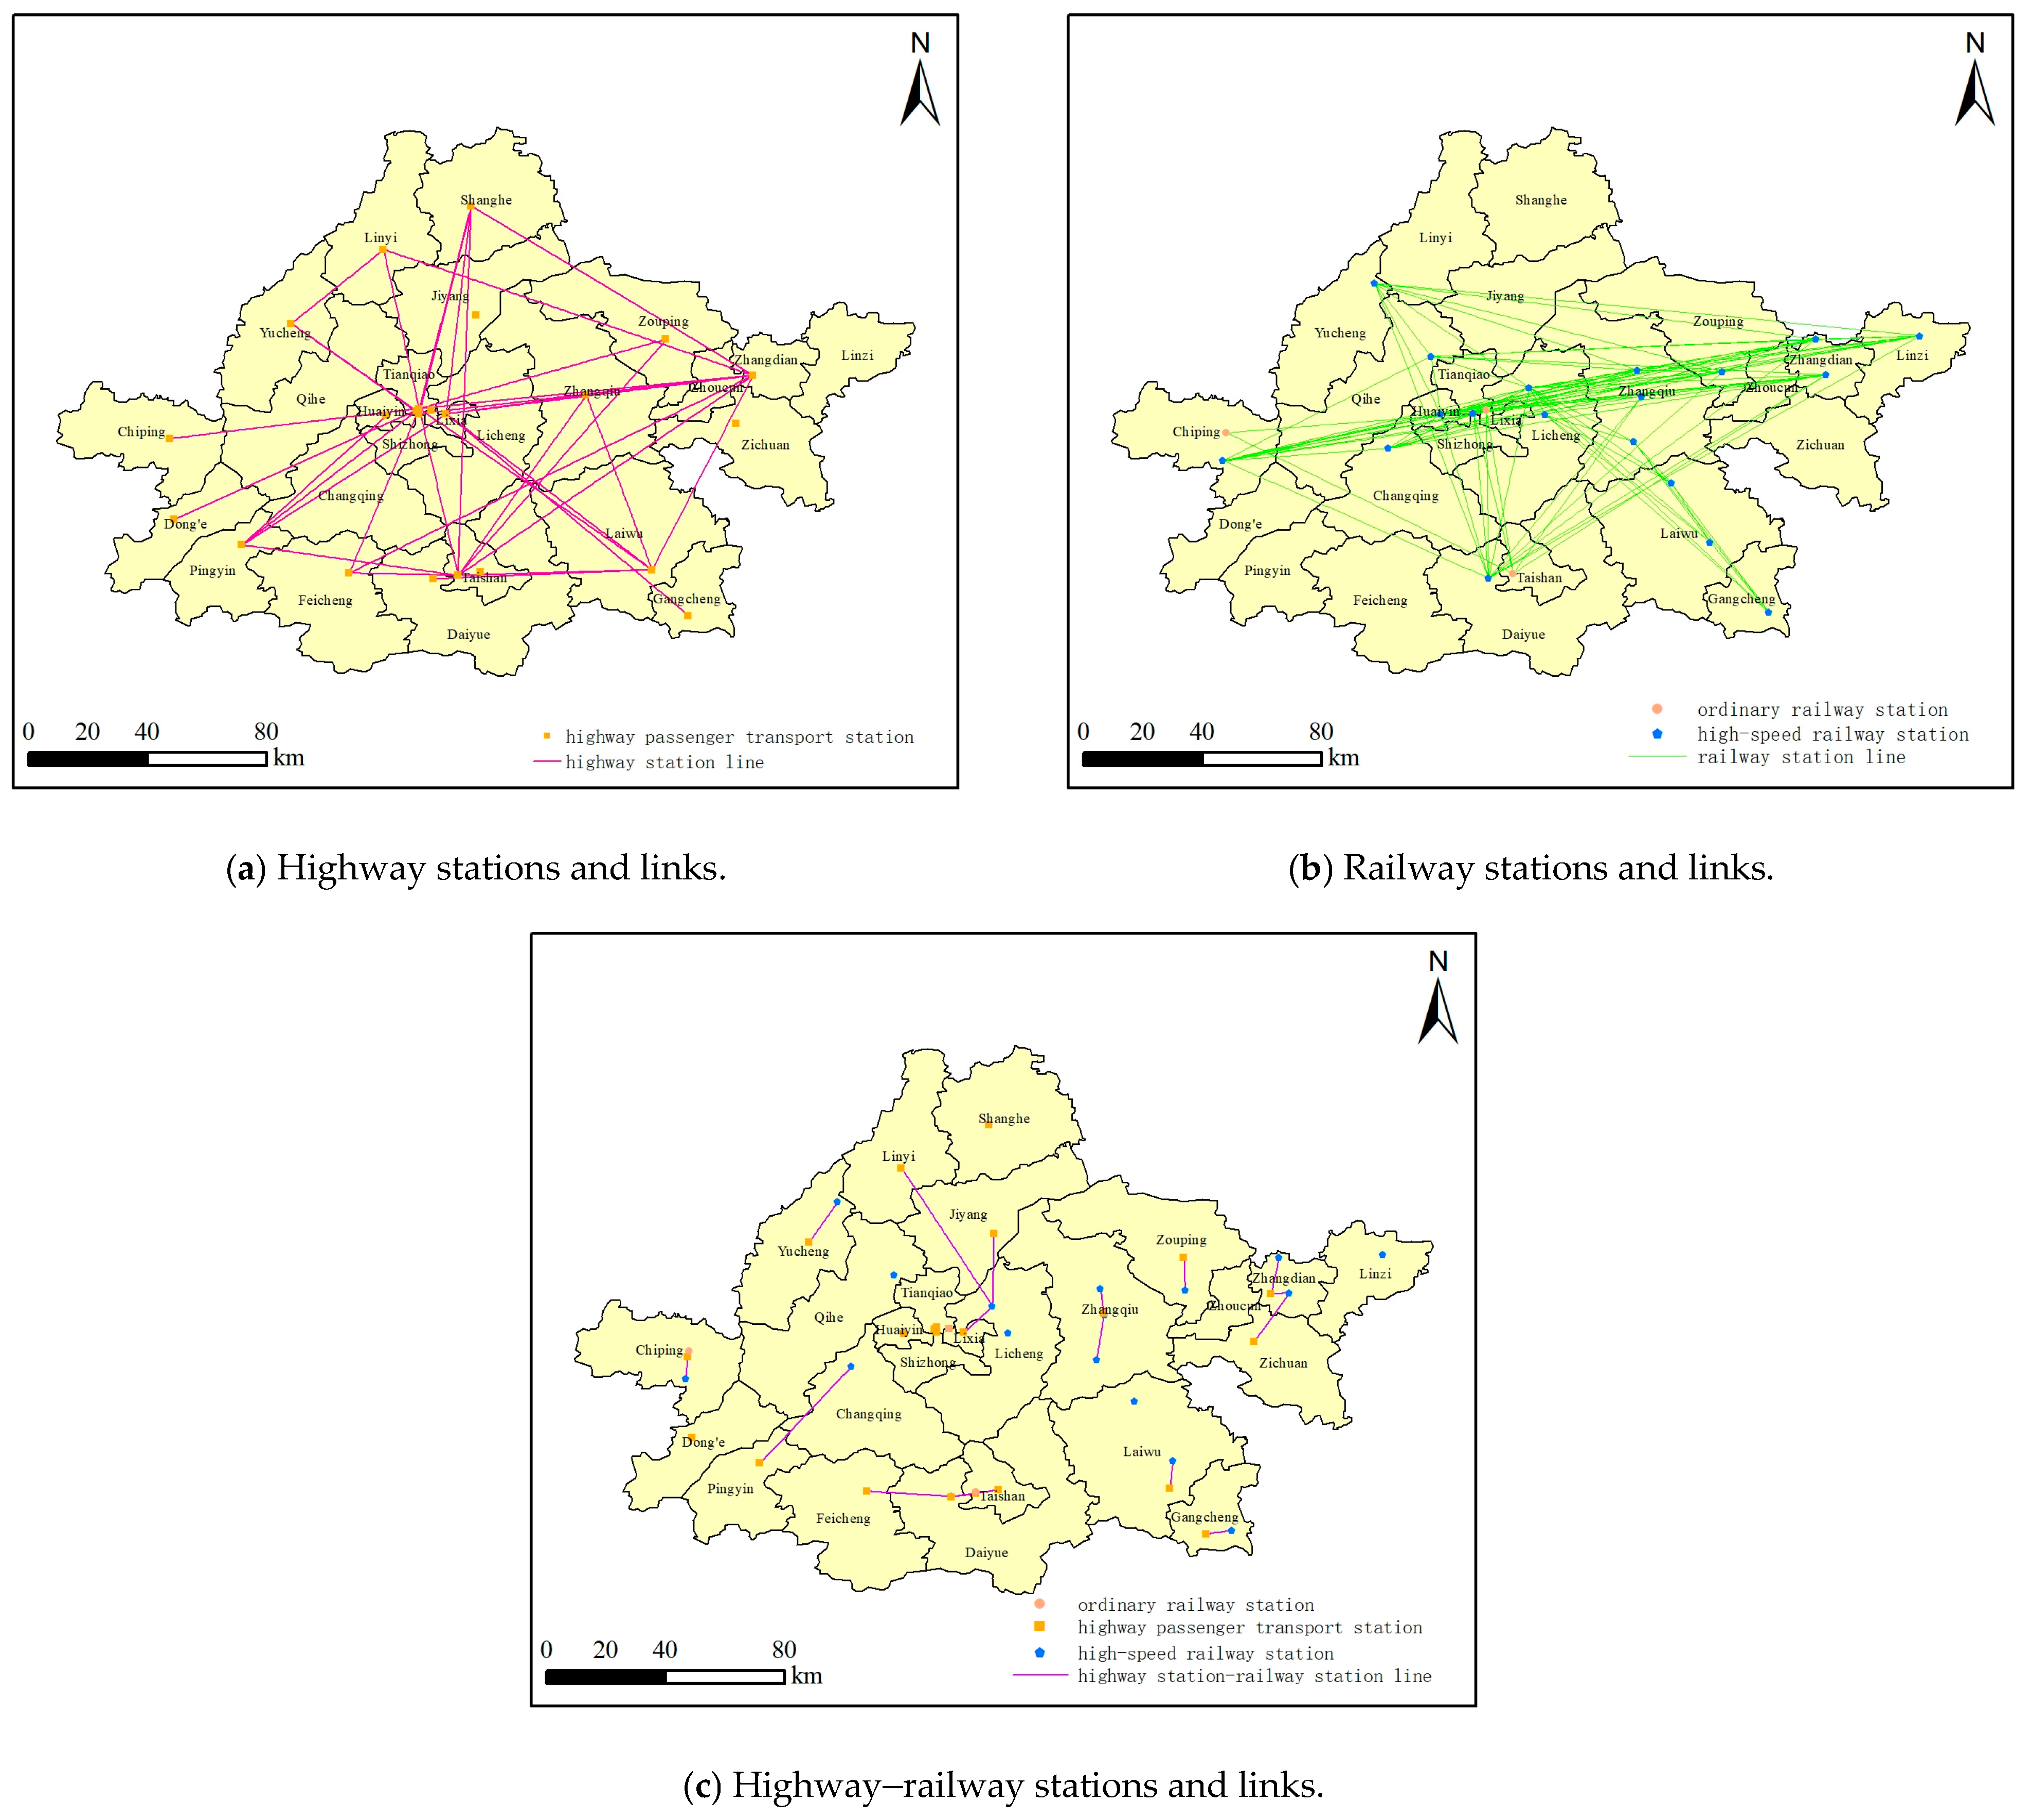
Due to the dominant position of highways and railways in the transportation network of the Jinan Metropolitan Area and their importance for intercity travel, this study analyzes a multi-modal transportation network composed of highways and railways within the metropolitan area. The highway network includes highways, primary roads, and secondary roads, while the railway network includes high-speed railways and ordinary railways. This study covers 23 highway passenger stations and 22 railway stations within the metropolitan area, all of which are Grade II or above. Grade III to Grade V stations are excluded because they serve as short-distance transfer hubs within county-level administrative regions; additionally, they face issues such as unstable service frequencies, fragmented routes, and the absence of publicly available unified operational data. An undirected and unweighted multi-modal transportation network topology G(N, E) was constructed based on whether there are direct flights between stations of the same mode and whether there are passenger connections between stations of different modes. The highway and railway stations were abstracted as nodes N, and the routes between each station were abstracted as edges E. The topological map of Jinan Metropolitan Area’s multi-modal transportation network was plotted using ArcMap10.8, with GCS_WGS_1984 used as the coordinate system, as shown in Figure 2. The longitude and latitude information for each station was obtained from Amap (Gaode Map), provided by Gaode Software Co., Ltd. (Beijing, China). For the travel schedules between highway and railway stations, the data were collected from China Railway 12306 (the official railway ticketing platform in China, operated by China State Railway Group Co., Ltd., Beijing, China) and Ctrip (a major online travel service platform operated by Ctrip.com International, Ltd., Shanghai, China). All data were acquired in September 2025.
The station links in the Jinan Metropolitan Area are provided in Appendix A. Edges were defined based on independent direct operation services, which is essentially an edge-disjoint model adapted to the actual scenarios of transportation networks. The concept of “edge-disjoint” in standard graph theory is that “any two paths do not share any edges.” The “direct train services/bus services” examined in this study through ticketing platforms (12306, Ctrip) constitute “independent and non-shared edges” in the network, satisfying the constraints of the edge-disjoint model.

3.2. Structural Attributes of Jinan Metropolitan Area’s Multi-Mode Transportation Network

Topological attributes, such as average degree, network density, average node betweenness centrality, average clustering coefficient, and average shortest path length, were used to analyze the structural characteristics of Jinan Metropolitan Area’s multi-modal transportation network. The results are shown in Table 1. The average degree is 6.6667, indicating that the average number of connections between nodes is 6–7. This suggests that the network has basic connectivity guarantees and can effectively maintain network integrity in the event of random node failures. The network density is 0.1515, which falls within the sparse network range (<0.2), indicating that the overall network is not very dense and has characteristics that are not fully connected. The average node betweenness centrality is 0.0298, which is at a relatively low level, indicating that there are no dominant hub nodes in the network (i.e., no nodes are necessary for most shortest paths). This can significantly reduce the risk of intentional attacks, and even if a few high betweenness centrality nodes are removed, most nodes can still maintain connectivity through alternative paths.

3.3. Structural Resilience Analysis of Jinan Metropolitan Area’s Multi-Mode Transportation Network

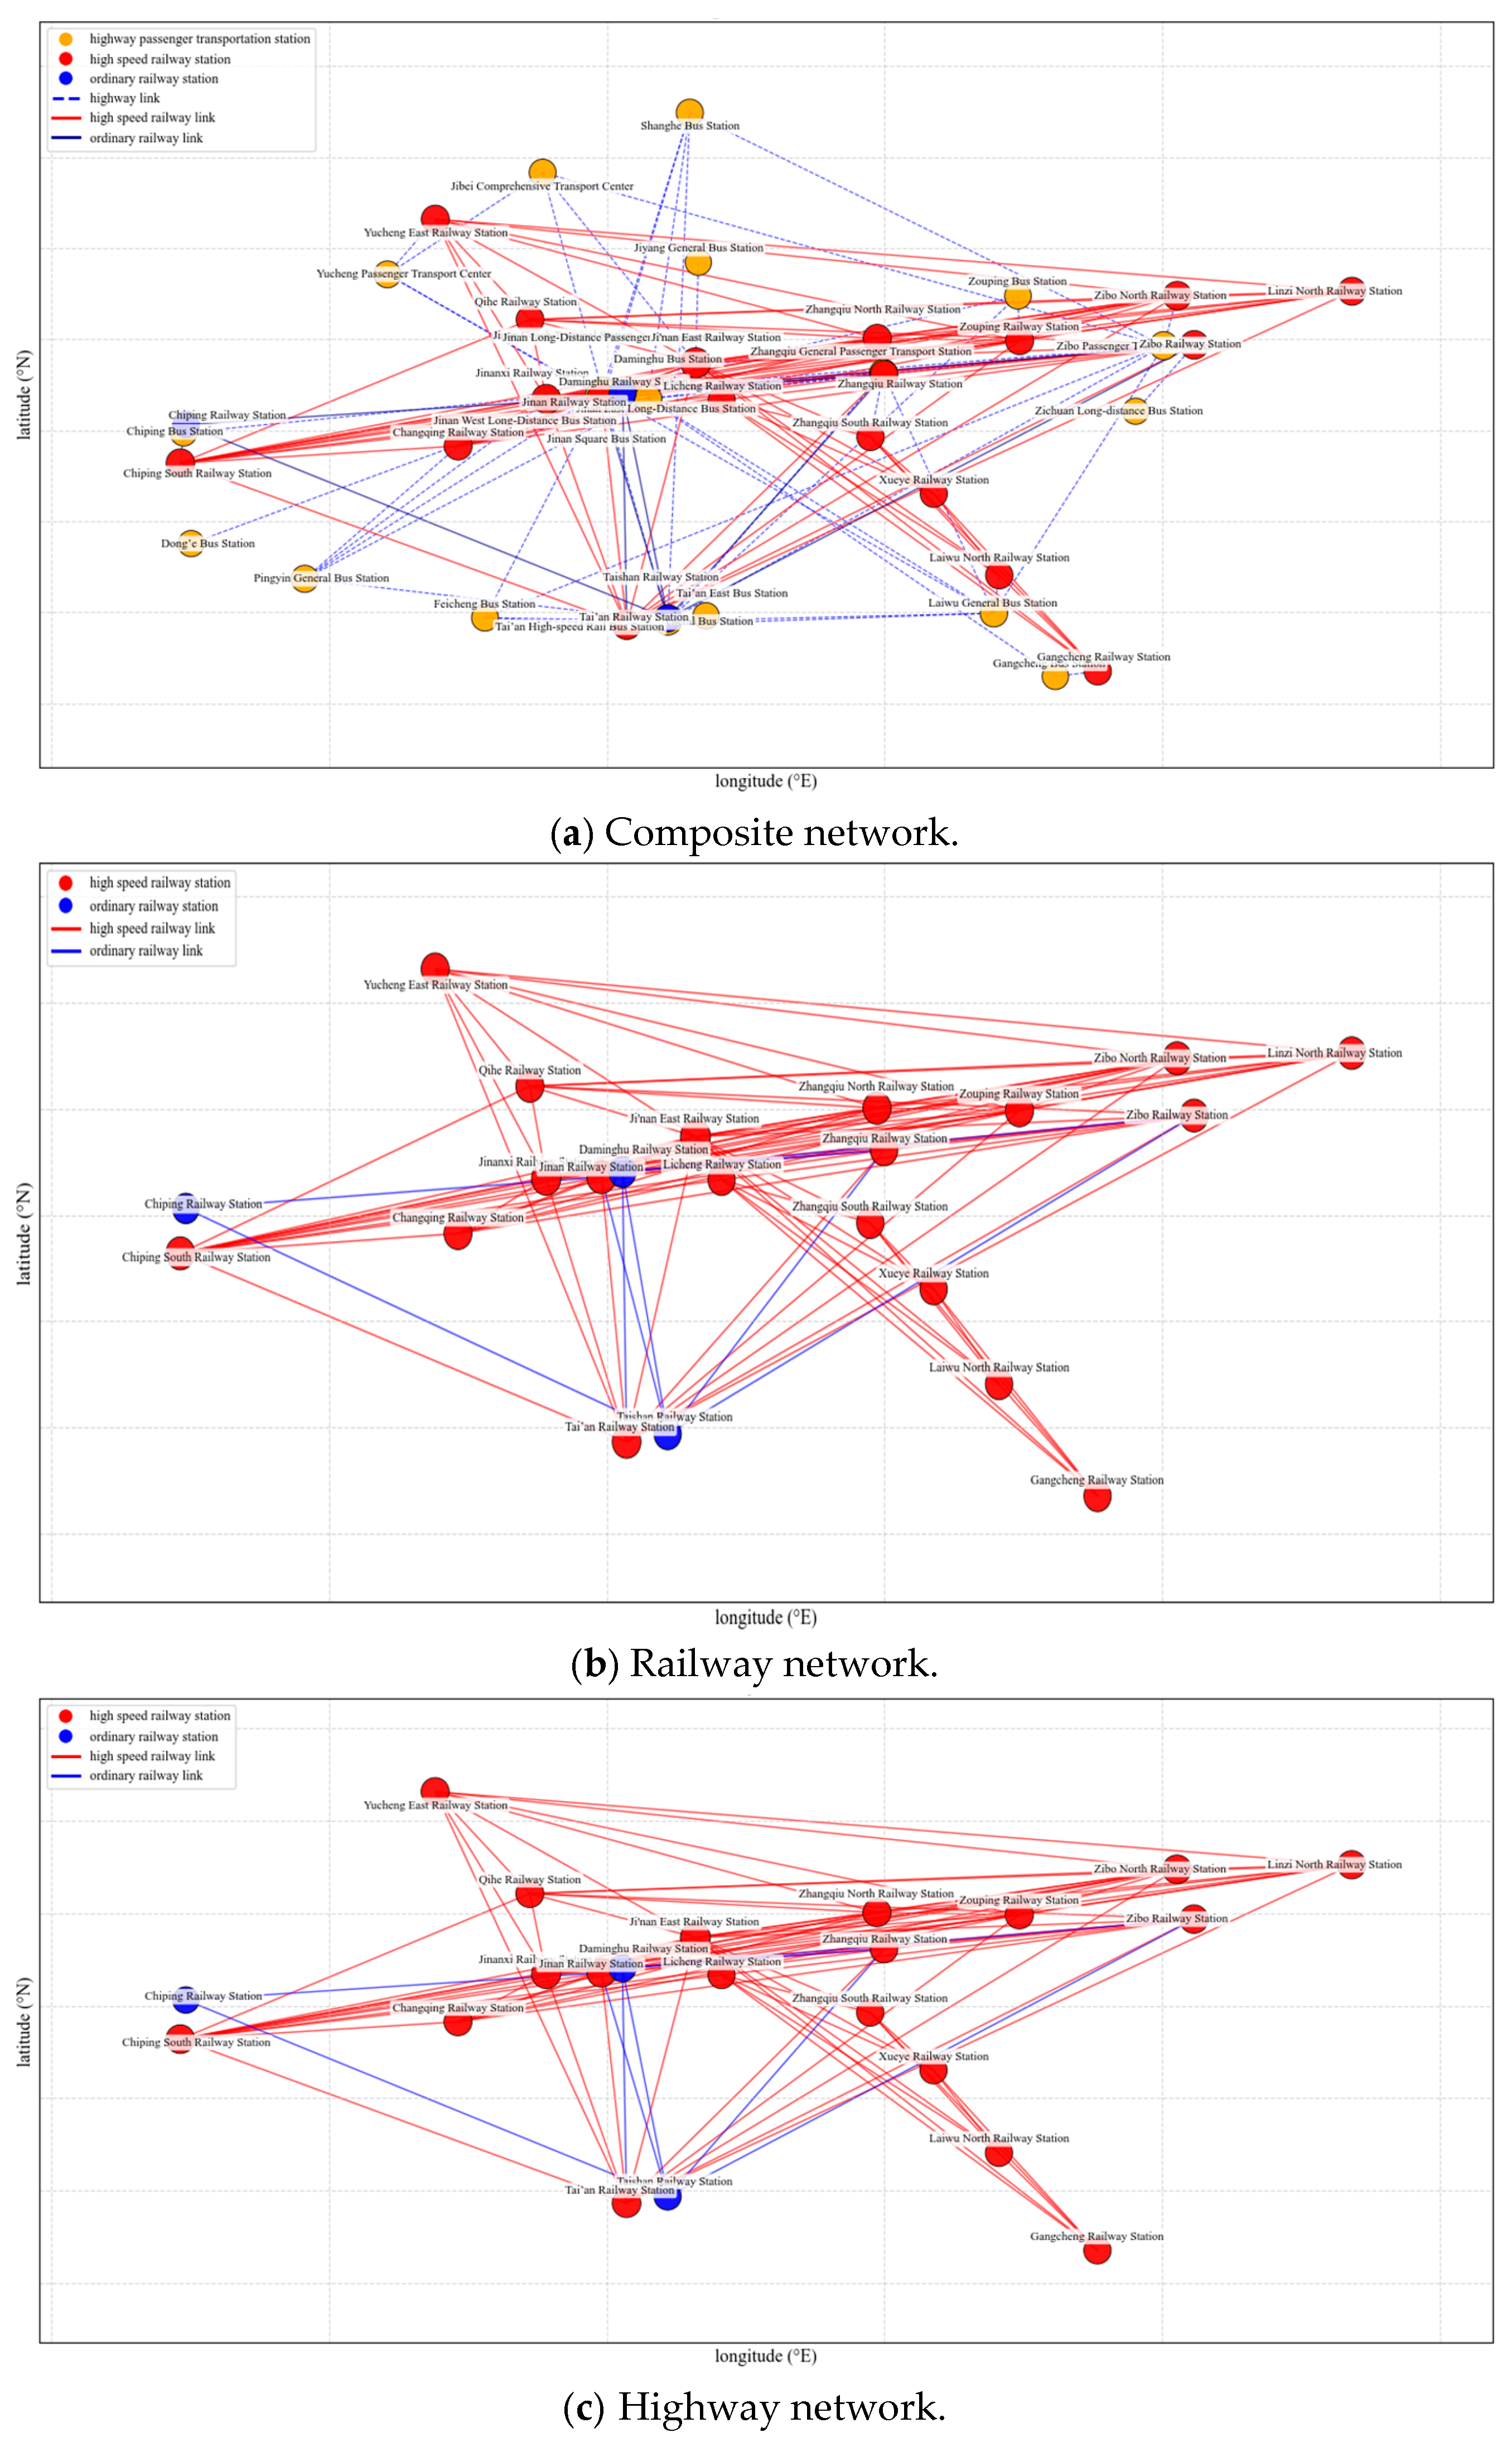
After data processing, MATLAB R2018b software was used to draw the spatial network diagram of the composite network and the sub-network and display the distribution of each station and the connectivity between stations, as shown in Figure 3. Formulas (1)–(7) were used to calculate network efficiency, the average number of independent paths, and the structural entropy of the multi-mode transportation network in Jinan Metropolitan Area. The results are shown in Table 2.
The railway network has the highest network efficiency, which indicates that transportation between nodes in the railway network is more convenient, and the shortest path between stations is relatively short, which can realize the connection between nodes more quickly. The network efficiency of the composite network is at a medium level, indicating that the composite network has achieved balance in transmission efficiency by integrating the connection advantages of various network types. This not only reduces the inefficiency of the highway network but also makes up for the limitations of the railway network’s coverage. The highway network’s efficiency is the lowest, which reflects the decentralized nature of highway networks. It can be seen from Figure 3c that the highway network’s nodes are widely distributed, and some nodes must be connected through multi-level transit, resulting in long average shortest paths and limited transportation efficiency.
The average number of independent paths in the railway network is 4.4848, indicating that there are more independent paths between node pairs in the railway network. This shows that the railway network has good redundancy. When some nodes or lines fail, there are more alternative paths to choose, which improves the network’s reliability and anti-interference ability. The average number of independent paths in the composite network is between those of the railway and highway networks, which reflects the multi-mode redundancy mechanism of the composite network. The connections of different types of networks are complementary. When the path of one mode fails, the connection can be maintained through the path of another mode. As such, redundancy is significantly higher than that of a single highway network. The average number of independent paths in the highway network is significantly lower than that in the other two types of networks. It can be seen from Figure 3 that the highway network is mostly organized in a “radial” or “tree” layout. Branch nodes are highly dependent on trunk connections, and there are few alternative paths between node pairs, so redundancy is weak, and the ability to resist local failures is limited.
The railway network exhibits the highest normalized structural entropy. This reflects the topological characteristic of highly balanced distribution of connection resources among railway stations, which is attributed to the linear constraints of railway line planning and the connectivity of trunk lines. A high entropy value close to 1 indicates that the railway network does not form excessive dependence on a single node. When a single hub fails, alternative paths can be quickly activated through the connectivity of trunk lines, resulting in minimal disturbance to the overall structure. Thus, the railway network demonstrates optimal structural resilience among the three types of networks. The composite network has the second-highest normalized structural entropy. After integrating railway and highway nodes, the “core-periphery” differentiation of the highway sub-network is partially offset by the balance of railway nodes. Railway hubs, such as Jinan East Railway Station, form intensive connections with surrounding highway stations, enabling highway nodes with originally low connectivity to obtain additional cross-modal connections and narrowing the gap with core nodes.
However, compared with the railway network, the connectivity of peripheral highway nodes in the composite network is still significantly lower than that of core hubs, leading to a slightly lower normalized entropy value than that of the railway network. Nevertheless, the composite network still maintains strong resilience. The highway sub-network has the lowest normalized structural entropy, which reveals its inherent issue of “core-periphery” differentiation. A low entropy value indicates that the highway network is highly dependent on core nodes. Once a core node fails, the surrounding areas are prone to connectivity interruptions due to the lack of cross-modal alternative paths, which may further trigger regional network paralysis. Consequently, the highway sub-network shows the weakest structural resilience among the three types of networks.

4. Analysis of Jinan Metropolitan Area’s Transportation Network Structure’s Resilience After Node Failure

Sequential attacks were conducted on each node in Jinan Metropolitan Area’s multi-modal transportation network. It is assumed that a node immediately fails once attacked. Specifically, the node and all of its directly connected edges are removed. If isolated components (completely disconnected from the main network) are generated in the network, the following rules apply to the calculation of network efficiency and the shortest path length for such components.
For node pairs consisting of one node from an isolated component and one from the main network, due to the absence of effective connected paths, their shortest path length is set to infinity (∞), and the corresponding path contribution is counted as 0.
For node pairs within an isolated component, although local connections exist, these pairs lack practical transportation functionality because they cannot access the metropolitan area’s main inter-regional transportation network. Thus, their shortest path length is also set to infinity (∞), and the corresponding path contribution is counted as 0.
Only node pairs that can be normally connected within the main network are included in the statistics for calculating network efficiency.
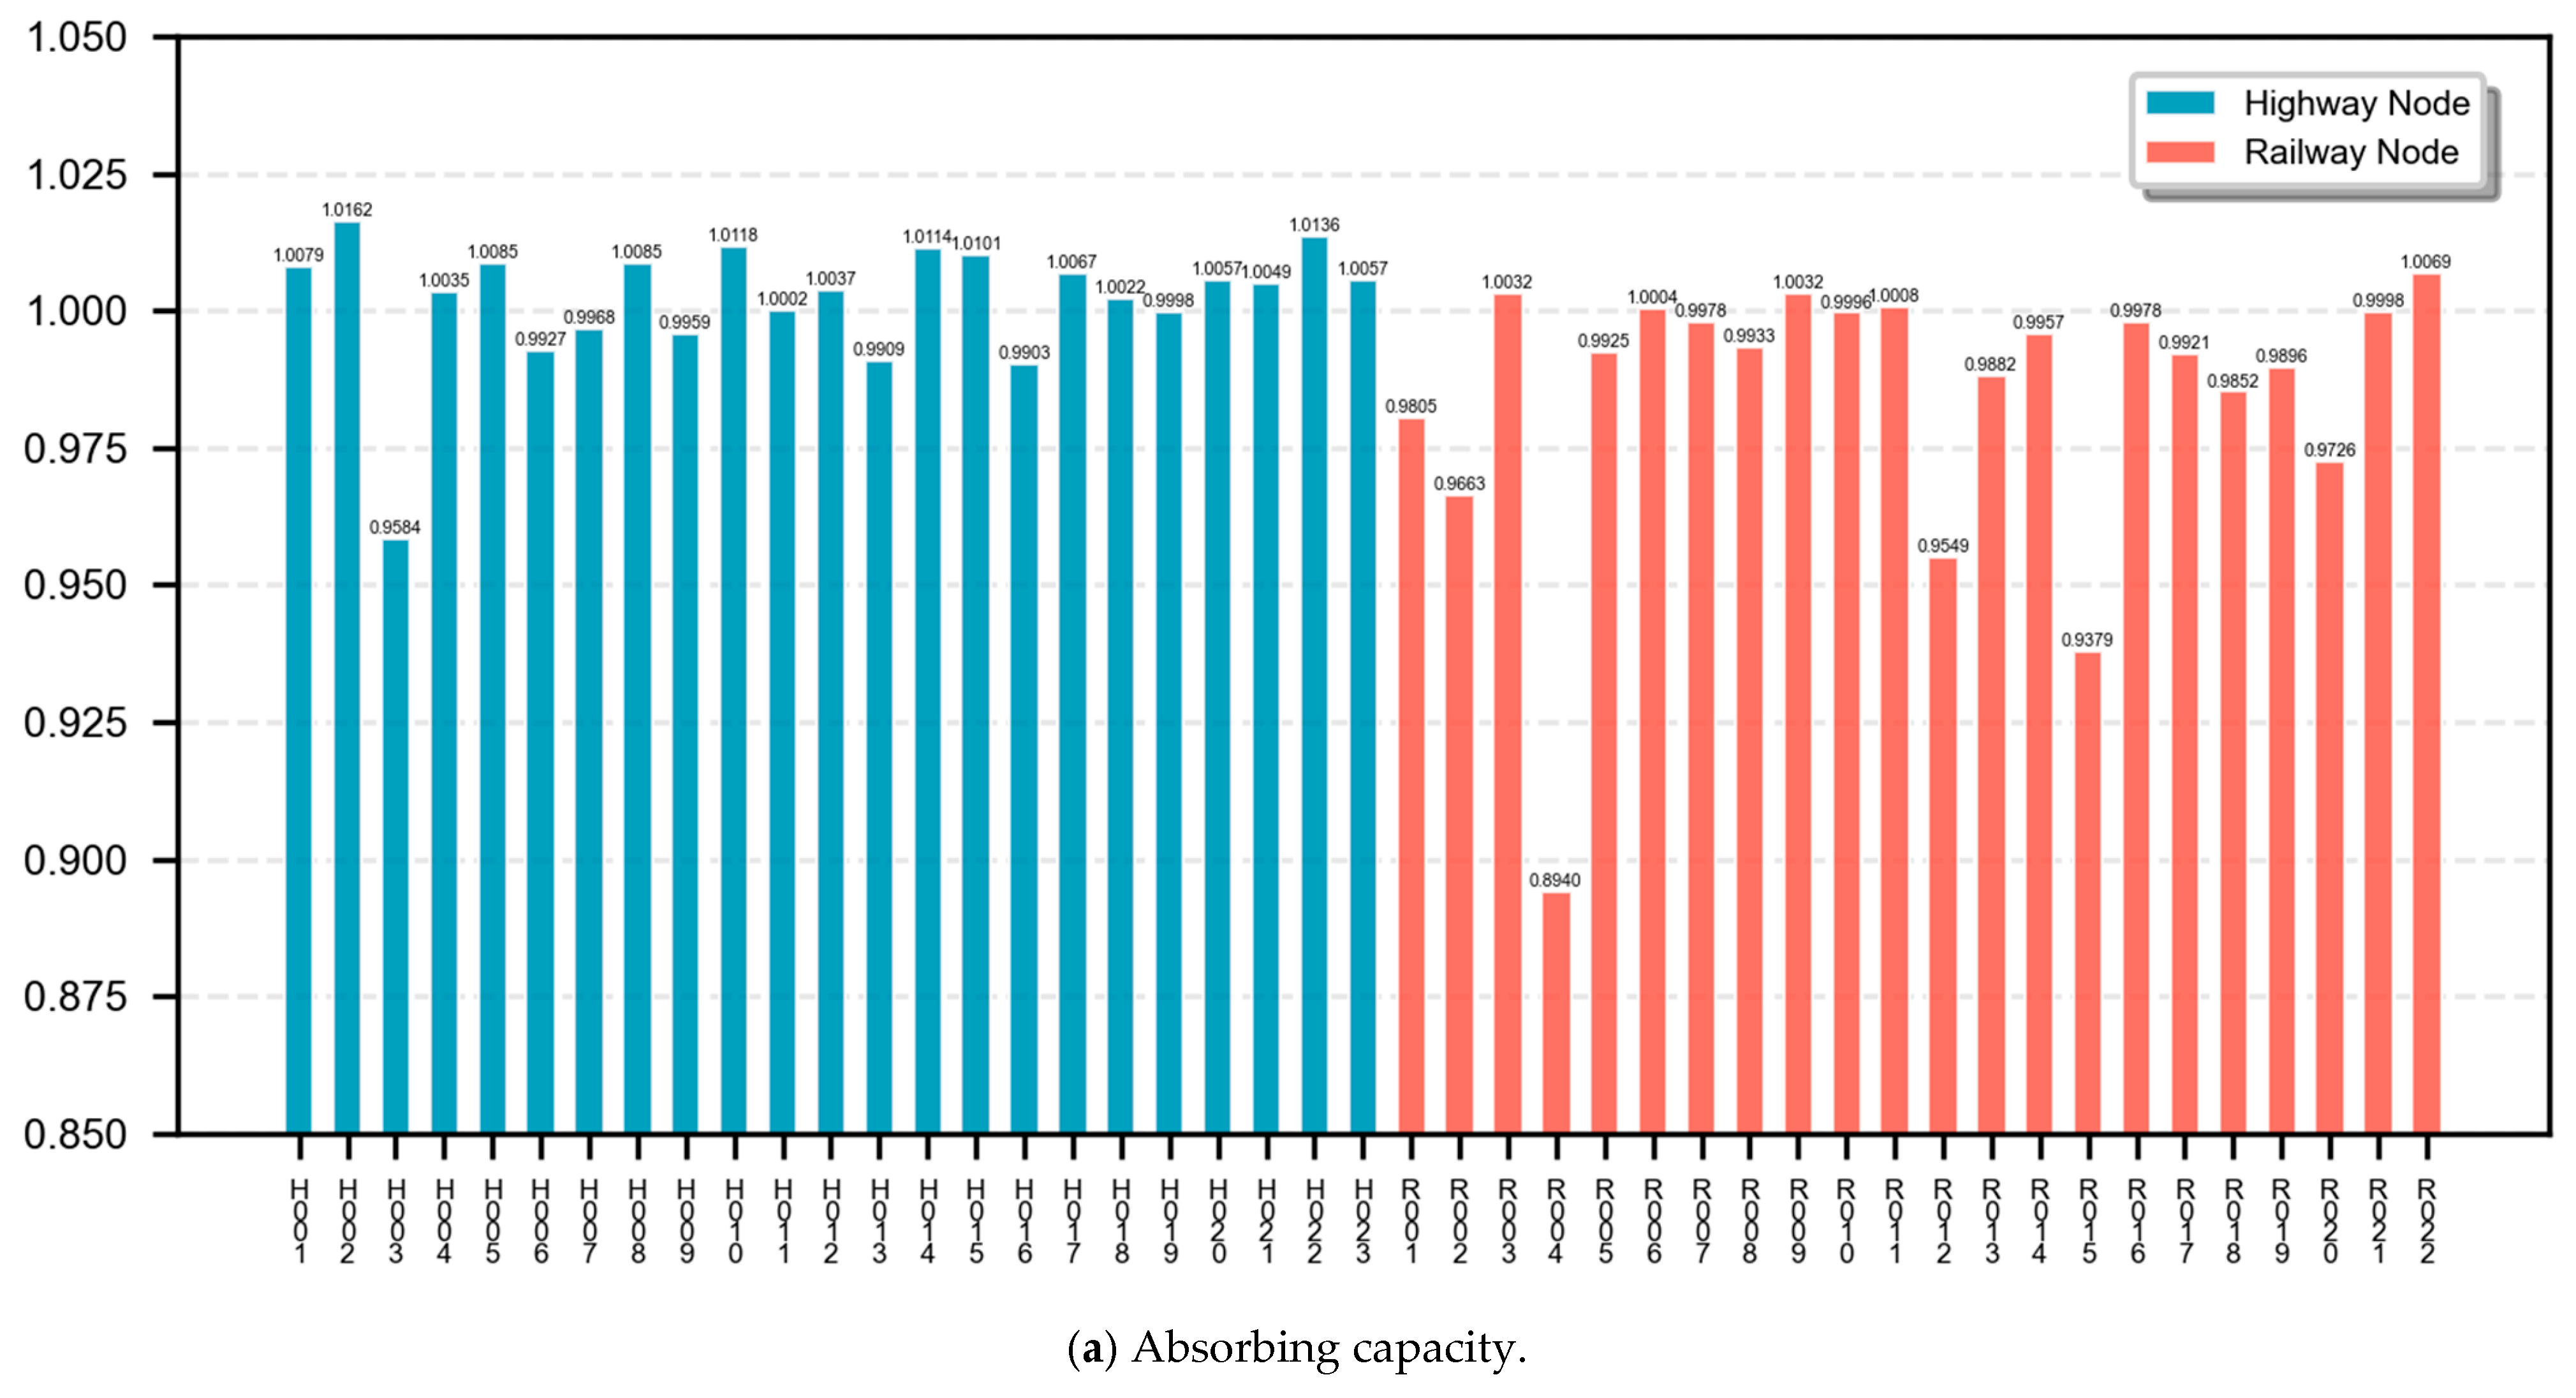
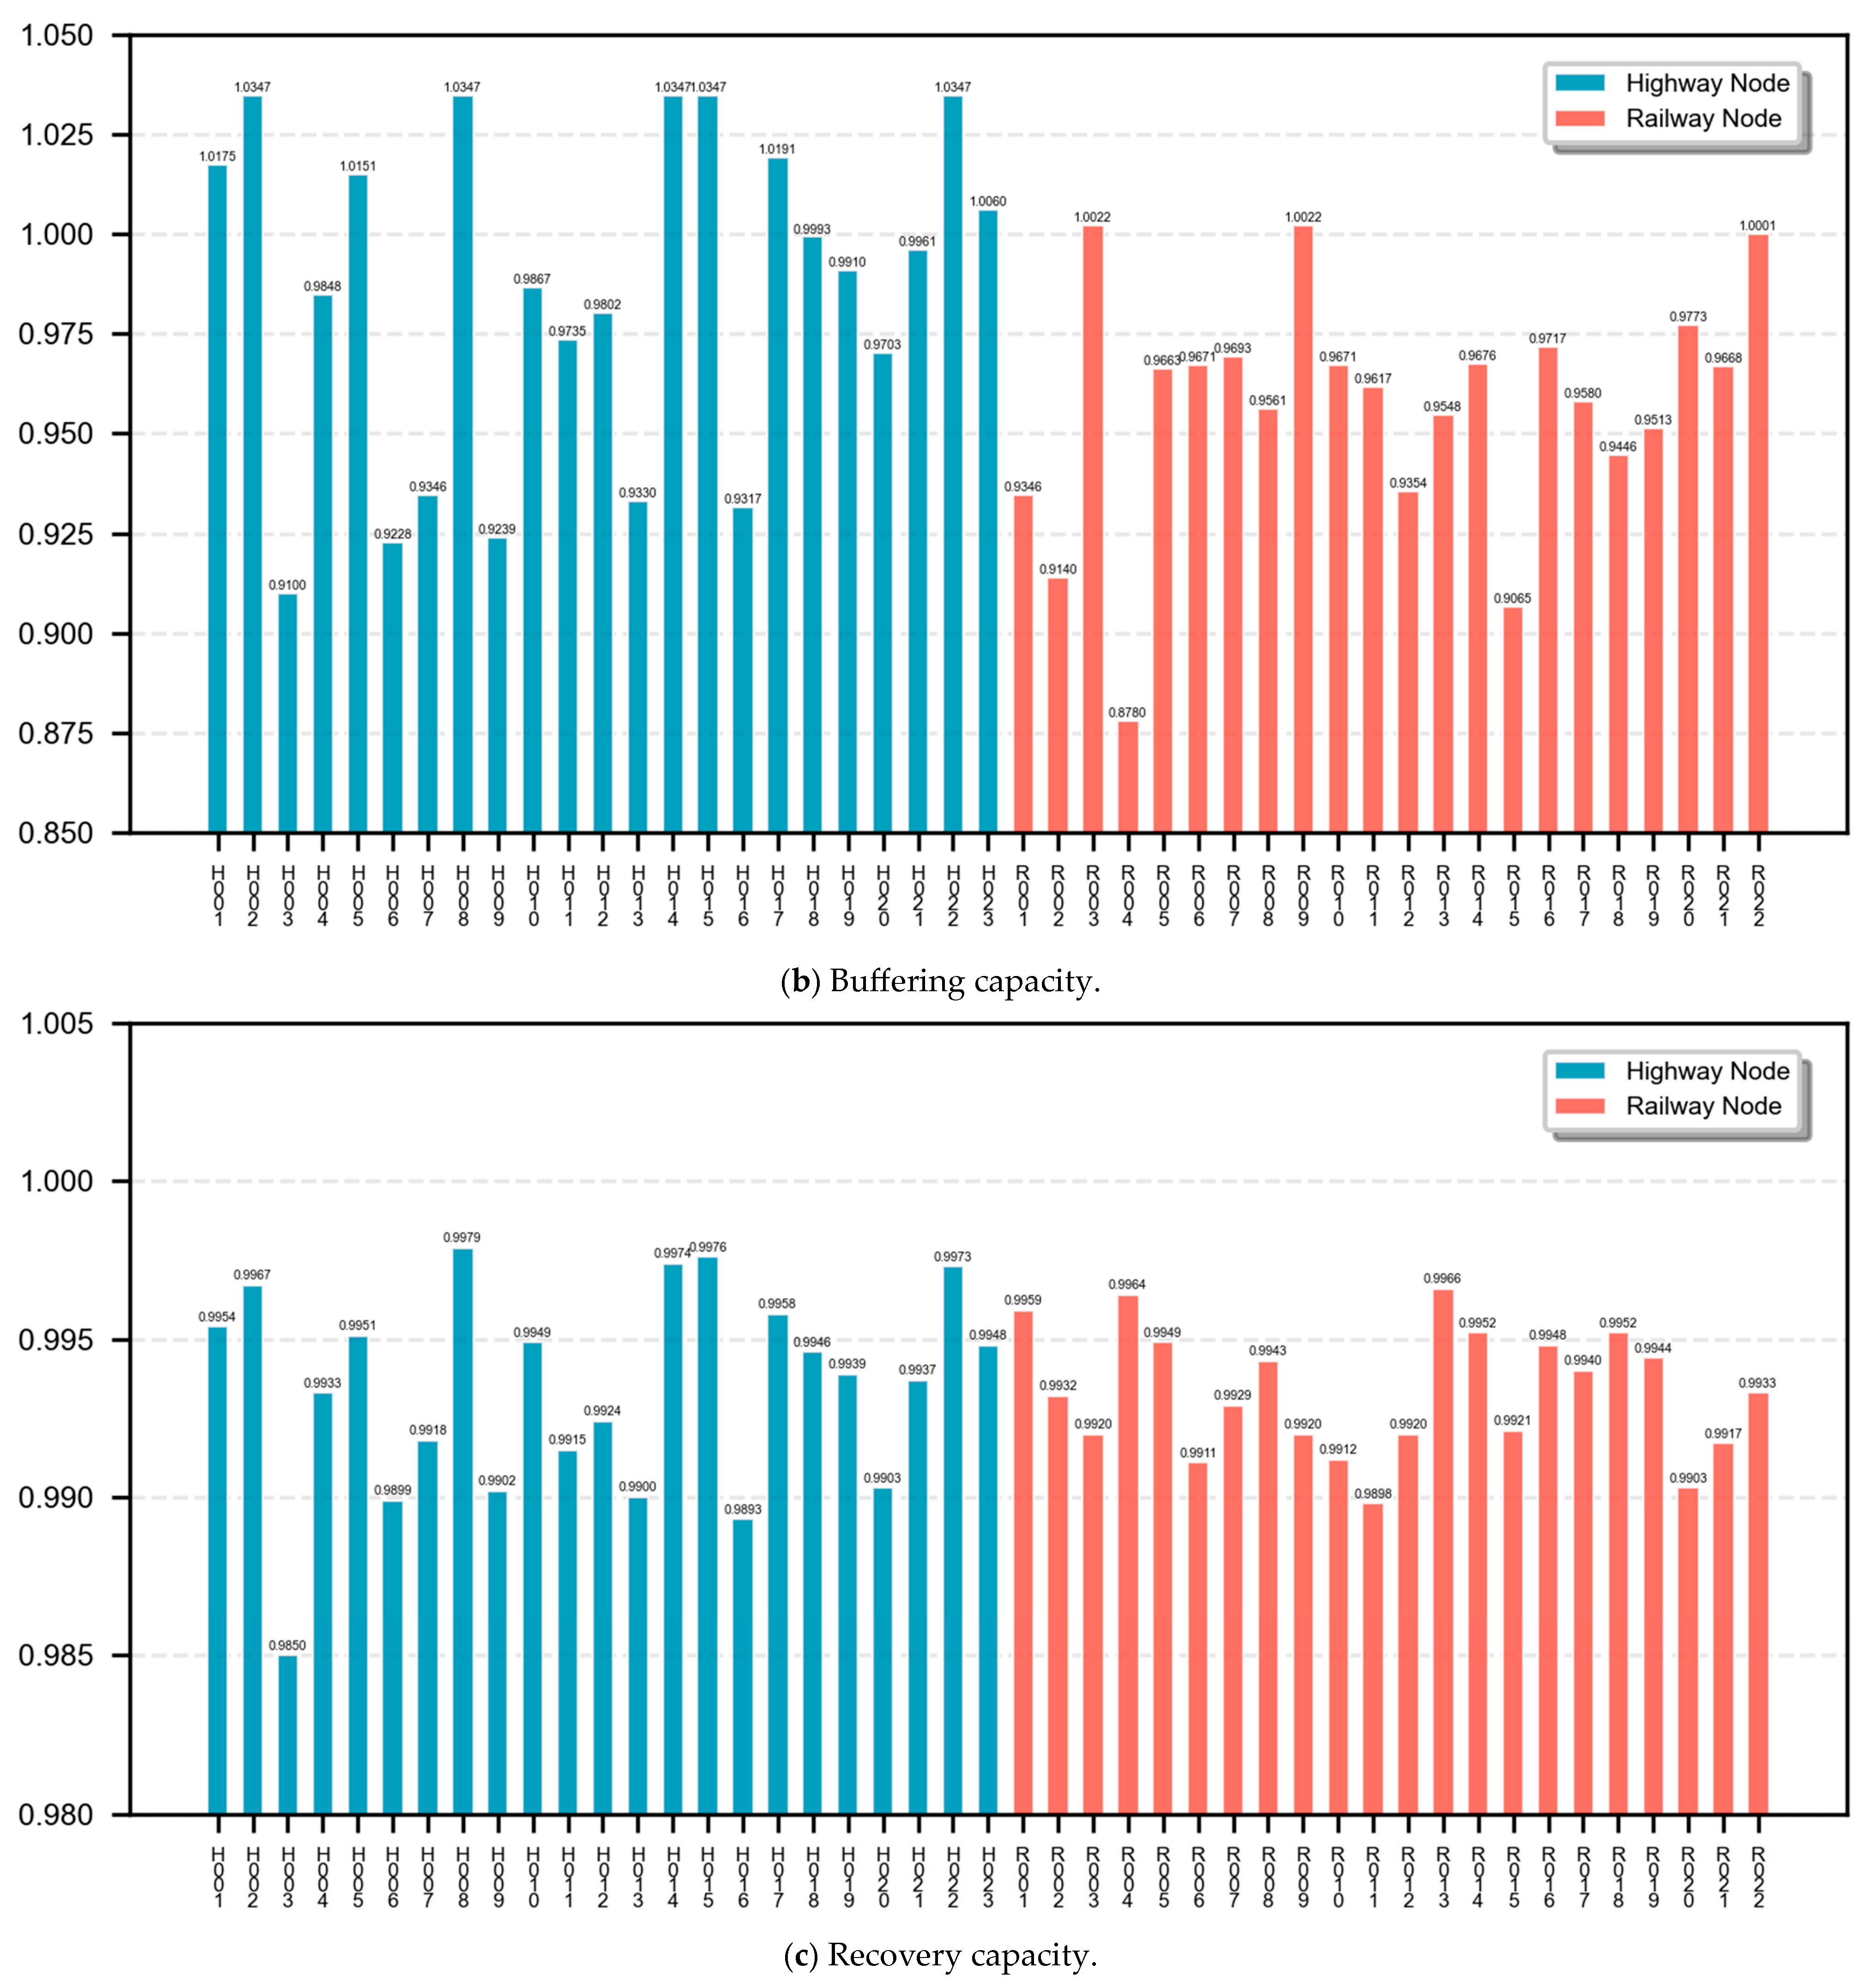
The absorbing capacity, buffering capacity, and recovery capacity of the transportation network are calculated after node failure. The results are shown in Table 3, and a bar chart to visualize the results is shown in Figure 4.
After node failure, the smaller the absorbing capacity of the system, the greater the impact of the node on the absorbing capacity of the multi-mode transportation network. This study uses network efficiency to measure the absorbing capacity of the transportation network. The five stations that have the greatest impact on the absorbing capacity are Jinan East Railway Station, Tai’an Railway Station, Zibo Railway Station, Jinan Coach Terminal Station, and Jinan Railway Station, four of which are railway stations, with values ranging from 0.8940 to 0.9663, and all of which are railway trunk hubs in the region. This shows that the railway network can be shunted through other railway stations or cross modes when a single node fails, which has a significant buffer effect on the overall efficiency of the composite network. The five stations that have the least impact on the absorbing capacity are Tai’an East Bus Station, Zichuan Long-Distance Bus Station, Gangcheng Bus Station, Dong’e Bus Station, and Daminghu Bus Station, which are all highway stations, with values ranging from 1.0101 to 1.0162, and mostly county or suburban bus stations. These five stations are mostly in the “twig end” of the highway network, relying on a single line connection, and the transfer connection with the railway network is weak. When it fails, it is difficult to shunt through the cross mode, becoming the tough short board of the composite network.
It is important to note that the absorbing capacity of some nodes in Table 3 is greater than 1. This is because these nodes are single-connection redundant terminal nodes, which are connected to only one core node via a single branch edge and are not located on any inter-regional main paths. When such nodes exist, the shortest path length for some node pairs includes detour links. As such, these pairs must transfer via the terminal node instead of taking the direct main path. This increases the shortest path length, resulting in relatively low network efficiency before node failure. After node failure, the detour links are eliminated. Node pairs that previously required transfer via the failed terminal node automatically switch to shorter core main paths, which reduces the shortest path length. Consequently, network efficiency after failure is higher than before the failure, leading to an absorbing capacity greater than 1 for these nodes. As a highway station, Jinan Coach Terminal Station has more impact on the absorbing capacity of the composite network than many railway stations. As the largest highway hub in the central urban area of Jinan, it can connect four railway stations, such as Jinan Railway Station and Daminghu Railway Station, within three kilometers, and there are many bus lines to realize transfer in a short time. This shows that when the space–time distance between highway stations and railway stations and the line connection density reach the threshold, highway stations can improve their absorbing capacity by virtue of the redundancy of the railway network, even close to the level of railway hubs.
After a node fails, the magnitude of change in the system’s buffering capacity directly reflects the structural importance of that node in the multi-modal transportation network. A more significant decline in buffering capacity (i.e., smaller post-failure buffering capacity) indicates a stronger supporting role of the node in maintaining the network’s redundant paths and thus a greater impact of its failure on buffering capacity. The five stations with the most significant impact on buffering capacity are Jinan East Railway Station, Tai’an Railway Station, Jinan Coach Terminal Station, Jinan Railway Station, and Jinan East Long-Distance Bus Station, all of which are structural cores of the composite network. Their failure leads to a marked decline in the system’s buffering capacity due to the irreplaceability of these nodes in the “railway-highway” collaborative network. As trunk railway hubs, Jinan East Railway Station and Jinan Railway Station connect to national trunk railways, such as the Beijing–Shanghai High-Speed Railway and Jinan–Qingdao High-Speed Railway, respectively. Jinan Coach Terminal Station and Jinan East Long-Distance Bus Station, on the other hand, are core distribution points of the highway trunk network. These nodes spatially form a “1-km radius connection circle,” constructing a densely connected network characterized by “railway trunks + highway branches” and undertaking most of the cross-modal transfer volume within the metropolitan area. This dual-network intersection feature makes them the core source of redundant path generation. As the only high-speed railway hub in the southern wing of the Jinan Metropolitan Area, Tai’an Railway Station connects the Beijing–Shanghai High-Speed Railway with Tai’an’s urban highway network and serves as a transportation transfer node between central and southern Shandong. If Tai’an Railway Station fails, there are no other high-speed railway stations within a 20 km radius, and highway branches can only cover Tai’an’s urban area, making it impossible to form cross-modal alternative paths. Consequently, its impact on buffering capacity is far greater than that of a single highway node.
The five stations with the least impact on buffering capacity are Daminghu Bus Station, Jiyang General Bus Station, Zichuan Long-Distance Bus Station, Tai’an East Bus Station, and Dong’e Bus Station, all of which are peripheral nodes of the highway sub-network. The impact of their failure on the system’s buffering capacity is negligible, primarily due to the structural marginality and functional singularity of these nodes. Located in peripheral counties or suburbs of the metropolitan area, these nodes generally have low degrees and only maintain direct connections with 1–2 regional central nodes, forming a topological structure of single-link dependence. Lacking support from railway nodes, their connection paths rely solely on the highway mode; upon failure, only terminal branch paths are lost, and the network can quickly compensate through other paths, resulting in minimal impact on buffering capacity. Furthermore, the service radius of these nodes is mostly limited to counties’ administrative boundaries, and their function is only to provide short-distance connections between counties and regional centers, without transfer hubs. When a highway route is interrupted, the nodes themselves have extremely weak buffering capacity due to the lack of alternative modes, such as railways or intercity buses. However, their extremely low path proportion in the network means their impact on the overall buffering capacity is negligible.
After node failure, the smaller the system’s recovery capacity, the greater the impact of the node on the multi-mode transportation network’s recovery capacity. This study uses structural entropy to measure the transportation network’s recovery capacity. The five stations that have the greatest impact on recovery capacity are Jinan Coach Terminal Station, Tai’an General Bus Station, Gangcheng Railway Station, Jinan East Long-Distance Bus Station, and Zibo Passenger Transport Center. These stations are key transfer nodes between roads and railways in the region, forming a “Road Railway” multi-mode connection. This “highway railway” deep coupling makes the structural entropy low and the network order high. When a link is interrupted, it can quickly restore transportation through an alternative path, reflecting strong recovery capacity. The five stations that have the least impact on recovery capacity are Daminghu Bus Station, Dong’e Bus Station, Zichuan Long-Distance Bus Station, Tai’an East Bus Station, and Jiyang General Bus Station. These stations are all highway stations that have a weak connection with the railway network. Connection relies solely on the highway, resulting in high structural entropy. Once the highway trunk line is blocked and there is no alternative railway path, it is difficult to quickly resume traffic. From the perspective of spatial distribution, these stations are mostly located at the edges of cities or counties, and the connected highway lines are mostly point-to-point short-haul lines, lacking the support of cross-regional trunk lines. The composite network’s resilience is also characteristic of a “core edge,” as overall network resilience depends on the structural rationality of key nodes while exposing the short board of edge nodes.
The normalized structural entropy of the Jinan Metropolitan Area’s multi-modal transportation network falls within the “high-sensitivity range” (i.e., above 0.8). The core characteristic of this range is the “entropy change amplification effect.” Even a minor, thousandth-level fluctuation in the normalized entropy value significantly widens the disparity in the distribution of connection resources among nodes. This amplified disparity further impacts recovery time through three mechanisms. First, high-entropy networks contain more core nodes with high connectivity; during recovery, a single core node can quickly activate a large number of routes. Second, edge nodes in high-entropy networks can connect to multiple core nodes, which avoids cascading delays caused by the lag of a single core node. In contrast, edge nodes in low-entropy networks mostly rely on a single core, making them prone to recovery lags. Third, high-entropy networks have a more abundant supply of alternative recovery paths. Due to limited path redundancy in low-entropy networks, longer waiting times for repairs are required once key routes are blocked.
To verify the effectiveness of structural entropy in characterizing the dynamic recovery process, this study designed a natural recovery simulation after node failure based on the topological data of the Jinan Metropolitan Area’s multi-modal transportation network. By quantifying the correlation law between “structural entropy and recovery efficiency,” this simulation provides supplementary support for the dynamic rationality of the structural entropy indicator.
  • Simulation Design
Simulation Objects: Three types of typical failure nodes were selected to cover core–peripheral and transfer–non-transfer scenarios, ensuring the representativeness of results:
(1)
Core transfer node: Jinan East Railway Station (core of the composite network);
(2)
Ordinary core node: Tai’an Railway Station (core of the railway sub-network);
(3)
Peripheral node: Dong’e Bus Station (peripheral node of the highway sub-network).
Recovery Rules: Following the actual repair priority of transportation networks (prioritizing the recovery of nodes with high connectivity), “natural recovery without external resource intervention after failure” was simulated. Connections among failed nodes were restored in descending order of node degree. The network connectivity rate was recorded every 0.5 h until it reached 90% of the initial state, which was defined as basic recovery.
Simulation Tool: The simulation was implemented using the Network Toolbox in MATLAB R2023a. Existing node degree and topological connection data were utilized, and the simulation was repeated 5 times, with the average value taken to reduce random errors.
2.
Simulation Results and Correlation Analysis
Dynamic recovery simulations can be used to preliminarily observe the correlation between structural entropy and recovery efficiency, with the results shown in Table 4.
Core transfer nodes (integrated network, structural entropy = 0.9436) have the shortest time to recovery to 90% connectivity rate (4.2 h), the fastest recovery rate (21.4% per hour), and the highest post-failure recovery capacity R (0.96).
General core nodes (railway sub-network, structural entropy = 0.9720) have medium levels of recovery time (6.5 h), recovery rate (13.8% per hour), and recovery capacity R (0.89).
Edge nodes (highway sub-network, structural entropy = 0.8572) have the longest recovery time (7.8 h), the slowest recovery rate (11.5% per hour), and the lowest recovery capacity R (0.82).
It can be seen that structural entropy and recovery efficiency (recovery time, recovery rate) show a negative correlation trend; nodes with higher structural entropy have faster recovery speed and stronger recovery capacity. This is consistent with the theoretical logic that “the higher the structural entropy, the more balanced the node connection distribution, and the more quickly functions can be restarted relying on multiple paths during recovery,” which can preliminarily reflect structural entropy for recovery efficiency.
It should be noted that because only three data points were selected in this simulation, the sample size is limited, and statistical significance was not determined. Future studies can expand the number of nodes (e.g., adding nodes of different levels and different modes) to further verify the robustness of this correlation.
According to the entropy weight method, the weights of absorbing capacity, buffering capacity, and recovery capacity are calculated as 0.1855, 0.4966, and 0.3179, respectively, according to Formulas (8) and (9), indicating that buffering capacity has the greatest impact on structural resilience. Using Formulas (8) and (9), the resilience of Jinan Metropolitan Area’s multi-mode transportation network is evaluated. Structural resilience after the failure of each node is shown in Table 5.
When the node fails, the composite network’s structural resilience changes in two directions, positive and negative, as shown in Figure 5. The five stations with the greatest negative changes are Jinan East Railway Station (−0.0814), Tai’an Railway Station (−0.0605), Jinan Coach Terminal Station (−0.0572), Jinan Railway Station (−0.0511), and Zibo Railway Station (−0.0430), indicating that the network’s structural resilience decreases significantly after these node failures. It can be seen from Figure 3 that these nodes are at the intersection of multi-mode connections in the transportation network and undertake a large number of cross-regional and cross-mode transportation transfer tasks. Their failure directly interrupts multiple critical paths, and redundant paths in the network are significantly compressed. The impact on the network’s structural resilience is significant. Jinan East Railway Station is the node with the largest change range. As the core hub of the high-speed railway in the east of Jinan, Jinan East Railway Station connects the Beijing–Shanghai high-speed railway, the Jinan–Qingdao High-Speed Railway, and other trunk lines, and it connects with the Jinan East Long-Distance Bus Station and other highway nodes. It is the key conversion point of cross-regional, long-distance transportation in the composite network, and its failure has the most serious impact on the network’s overall connectivity. As an important high-speed railway node in central Shandong, Tai’an Railway Station connects Tai’an General Bus Station and other key highway stations. It is an intermediate hub connecting Jinan and southern Shandong. Its failure cuts off the coordinated channel of the “railway highway” in the region. The more lines a node connects in the composite network, the stronger its cross-mode coordination, and the greater the impact of its failure on overall resilience.
The five stations with significant positive changes are Jiyang General Bus Station (0.0181), Tai’an East Bus Station (0.0183), Zichuan Long-Distance Bus Station (0.0185), Dong’e Bus Station (0.0189), and Daminghu Bus Station (0.0192), which indicates that overall network structural resilience is slightly improved after failure of these nodes. These nodes have low absorbing capacity, buffering capacity, and recovery capacity. As a single highway station, the connection between the abovethese nodes and the railway network is weak, and the radiation range is limited. Most of the connecting lines are county-level or suburban short-distance lines, and the connecting objects are concentrated (for example, Zichuan Long-Distance Bus Station is mainly connected to the Zibo urban area, and Dong’e Bus Station is mainly a township line), with low structural resilience. When the node is operating normally, it may cause a chain reaction due to local congestion or failure, affect surrounding highway trunk lines, or disconnect from the railway. Furthermore, it cannot be diverted through the railway. When a node fails, transportation will automatically be allocated to the more robust surrounding core nodes. The network’s load distribution is more concentrated in high-resilience nodes, and overall structural resilience is slightly improved.
On the one hand, the nodes’ single-dimensional structural resilience indicators are significantly weaker than those of core nodes. Moreover, these nodes are all highway stations without railway inter-modal connection functions, distinguishing them from core nodes. On the other hand, their topological connections exhibit characteristics of “single-connection terminals.” As shown in Figure 3, such nodes are only connected to regional core nodes via one branch line and have no other inter-regional main paths. As such, they cause local detours, while path redundancy is eliminated after their failure. Furthermore, after they fail, their absorbing capacity becomes greater than 1 due to the disappearance of detour paths and optimized network efficiency. Their buffering capacity is improved due to the removal of invalid branch paths and the manifestation of effective independent paths, and their recovery capacity remains stable because they do not affect the main network’s connectivity framework. In contrast, for the high-performance core nodes listed in the table, both absorption and buffering capacities decrease simultaneously after failure, and their structural resilience values decline significantly as a result. This rules out the possibility of data randomness.
After the failure of the core stations with negative changes, such as Jinan East Railway Station, the decline in structural resilience is much greater than that of Jiyang General Bus Station and other nodes with positive changes, indicating that the composite network’s overall structural resilience is highly dependent on the core hub’s normal operation. Once the core node fails, it is difficult for the network to be completely replaced by other nodes, and resilience drops significantly. The resilience of some secondary road nodes increases slightly after failure, indicating defects in the composite network’s functional integration of “core secondary” nodes. The secondary nodes do not form effective linkage with the railway network, and their resilience is low, so they cannot share the pressure of the core nodes. Therefore, resilience optimization of the network should not only focus on the core hub but also solve the problem of inefficient connections of secondary nodes.
From Table 3 and Table 4, it can be observed that after some nodes fail, the absorbing capacity, buffering capacity, and structural resilience of the Jinan Metropolitan Area’s multi-modal transportation network are improved. This is jointly determined by the core structural attributes and network functional positioning of these nodes. The validity of these findings can be verified through the logical correlation between structural characteristics and existing indicator data, as detailed below:
  • Almost all of the aforementioned nodes are low-performance highway nodes, characterized by core structural attributes of “single-connection redundant terminal nodes.” They have only one connecting edge; each node links to one regional core node via a single branch edge with no alternative backup connection paths, making them “single-point access nodes.” Furthermore, these nodes do not undertake inter-regional transfer functions. After their failure, the inter-regional transportation paths within the main network remain unbroken, and network efficiency increases. This indicates that no inter-regional paths require transfer via these nodes, and they are therefore not part of the main network’s core connectivity paths.
As such, these nodes are redundant terminal components in the network. During normal operation, they only add local branch connections and do not contribute to the main network’s inter-regional connectivity framework. After failure, they do not disrupt connectivity between core nodes, providing a structural basis for optimizing network functions.
2.
Combined with the calculated changes in core indicators, after the nodes fail, the multi-modal transportation network’s efficiency is slightly improved. This validates the logic that “after the failure of redundant nodes, the disappearance of detour paths leads to an increase in the total path contribution of node pairs within the main network,” consistent with the calculated results of absorbing capacity. Additionally, the average shortest path length is optimized, indicating more direct commute paths between nodes in the main network and a substantial improvement in inter-regional transportation efficiency. The global structural resilience values are also enhanced; after redundant terminals fail, the network’s anti-interference capability, functional stability, and recovery efficiency are simultaneously optimized.

5. Reflections on the Historical Evolution of Network Structures from a Synergetics Perspective

To further clarify the formation mechanism of the current network structure (critical “nodes” and suboptimal transport line density) of the Jinan Metropolitan Area’s multi-modal transportation network, this section analyzes the historical evolution logic of the network from the perspective of synergetics. Synergetics holds that the development of complex systems (such as transportation networks) is a self-organization process driven by internal and external factors and that the final structure is the result of the coordination and adaptation of multiple subsystems to the “sustainability variants” of the regional development environment [34]. For the Jinan Metropolitan Area, the formation of critical nodes and sparse line density is the result of the joint action of three driving mechanisms: administrative resource agglomeration, economic demand orientation, and geographical constraint adaptation.

5.1. Formation of Critical Nodes: Path Dependence of Administrative–Economic Synergy

From the perspective of synergetics, critical nodes (such as Jinan East Railway Station, Jinan Coach Terminal Station, and Tai’an Railway Station) are the “order parameters” in the network evolution process. Their formation is not random but rather the result of the self-organization of transportation subsystems under the guidance of administrative and economic subsystems.
In the early stage of metropolitan development (2000–2010), Jinan, as the core city in Shandong Province, concentrated administrative resources (such as provincial transportation planning headquarters and intercity passenger flow scheduling centers) and economic elements (such as business districts and high-tech industrial parks) in the central urban area. This led to the initial agglomeration of transportation infrastructure. Jinan Railway Station and Jinan Coach Terminal Station were first built as “comprehensive hubs” to match the spatial layout of administrative and economic resources. With the opening of the Beijing–Shanghai High-Speed Railway (2011) and Jinan–Qingdao High-Speed Railway (2018), Jinan East Railway Station was further upgraded to a high-speed rail core hub. This expansion was not only driven by the growth of intercity passenger flow but also by the administrative demand to strengthen Jinan’s “radiation capacity” in the Shandong Peninsula Urban Agglomeration.
For peripheral critical nodes (such as Tai’an Railway Station and Zibo Railway Station), their formation followed “secondary synergy” logic. As sub-core cities of the metropolitan area, Tai’an and Zibo connect Jinan with southern and eastern Shandong, respectively. Their railway hubs were initially built to meet the demand for coal transportation (a traditional economic pillar of western Shandong) and later transformed into passenger transport hubs with the adjustment of regional industrial structure. This “administrative positioning + economic demand” dual-driven model makes critical nodes the “core of synergy” between transportation, administrative, and economic subsystems, and their stability is continuously strengthened through subsequent infrastructure investment, forming path dependence in network evolution.

5.2. Suboptimal Transport Line Density: Restriction of Geographical-Economic Synergy

The Jinan Metropolitan Area’s low network density (0.152, Table 1) and the uneven distribution of lines are the results of the transportation subsystem adapting to geographical constraints and unbalanced economic development, reflecting the “sustainability variant” of network evolution under limited resource conditions.
Geographically, the metropolitan area spans two major topographic units: the northern plain (Jinan, Dezhou) and the southern mountainous area (Tai’an, Laiwu). The construction cost of transportation lines in mountainous areas is 2–3 times that of plain areas (e.g., the per-kilometer cost of high-speed railways in southern Tai’an is approximately CNY 180 million, while that in northern Jinan is approximately CNY 80 million). This geographical constraint led to the early formation of a “plain-first” line layout; trunk lines, such as the Beijing–Shanghai High-Speed Railway and the Jinan–Qingdao Expressway, are mainly distributed in the northern plain, while the southern mountainous area only has sparse ordinary highways and low-speed railways. From the perspective of synergetics, this layout is a “cost-saving sustainability variant.” The transportation subsystem prioritizes connecting regions with low construction costs and high economic returns to maximize resource utilization efficiency.
Economically, unbalanced development of counties in the metropolitan area further exacerbates suboptimal line density. In 2024, the per capita GDP of core counties (e.g., Zhangdian District of Zibo, Taishan District of Tai’an) was approximately CNY 85,000, while that of peripheral counties (e.g., Dong’e County of Liaocheng, Linyi County of Dezhou) was only CNY 42,000. The low economic level of peripheral counties leads to insufficient passenger and cargo flow, making it difficult to support the construction of high-density trunk lines. For example, the “Jinan-Liaocheng” intercity railway has been in the planning stage for a long time. Due to the limited passenger flow between Jinan and Liaocheng’s peripheral counties, the investment return cycle is more than 20 years, which is much longer than the average 12-year cycle of plain lines. This economic constraint makes the transportation subsystem tend towards “strengthen existing lines” rather than “expand new lines,” resulting in the current situation of “dense core, sparse periphery” and overall low density.

5.3. Synergetic Interpretation of Evolution Path: Adaptation to Sustainability Variants

From the perspective of synergetics, the historical evolution of the Jinan Metropolitan Area’s multi-modal transportation network has not deviated from the “sustainability variant.” On the contrary, it is a rational choice to adapt to external constraints (geography, economy) and internal demands (administrative positioning, passenger flow).
In the early stage of evolution (2000–2010), the network was in a “disordered state,” with scattered nodes and few lines. With the promotion of administrative policies (such as “Jinan Metropolitan Area Planning” in 2013) and the growth of intercity economic exchanges, the transportation subsystem gradually transitioned to an “ordered state.” Critical nodes were formed through the agglomeration of administrative and economic resources, and trunk lines were laid out in areas with low geographical constraints and high economic returns. This evolution process conforms to the “minimum energy principle” of synergetics; the system uses limited resources to prioritize the construction of key links (critical nodes, plain trunk lines) to maintain the basic operation of the metropolitan area.
However, the current network structure also exposes the “inertia” of synergetic evolution, as the path dependence of critical nodes and the cost constraints of line expansion make it difficult for the network to automatically adjust to the new demands of “balanced core-peripheral development.” For example, the rapid growth of passenger flow in southern mountainous areas (e.g., the annual growth rate of tourism passenger flow in Feicheng City is about 15%) has not yet driven the expansion of trunk lines because the existing network structure is locked by early investment and geographical constraints. This inertia is the fundamental reason why the network still maintains suboptimal line density despite the increasing demand for balanced development, and it also explains why the “trunk line densification + peripheral connection” strategy proposed in the following section is necessary. External policy intervention is needed to break the existing synergetic balance and encourage the network to evolve towards a more resilient structure.

6. Strategies for Improving the Structural Resilience of Jinan Metropolitan Area’s Multi-Mode Transportation Network

Two debates persist in research on transportation network resilience. First is the priority debate between “single-mode optimization” and “multi-modal collaboration.” Some studies argue that enhancing a single high-resilience sub-network (e.g., railway) is sufficient to improve the system’s overall performance, while another perspective emphasizes that multi-modal collaboration is critical to addressing the shortcomings of individual sub-networks. Second is the debate between “core hub strengthening” and “peripheral node upgrading.” Traditional research has mostly focused on redundant construction of core nodes, but recent studies have indicated that the disconnect between peripheral nodes and the core network significantly reduces system invulnerability.
Based on the Jinan Metropolitan Area’s composite network, which exhibits optimal resilience, whereas peripheral highway nodes are the main weaknesses, this study proposes a strategic framework of “collaboration first, hierarchical optimization.” This framework not only responds to the aforementioned debates but also specifically addresses issues in the Jinan Metropolitan Area, such as unbalanced “core-peripheral” connectivity and insufficient highway–railway collaboration. The specific strategies are divided into two parts: network topology optimization and multi-dimensional resilience enhancement.
From the perspective of the network’s structure, the network’s topology should be optimized to improve overall connectivity. Jinan Metropolitan Area’s multi-mode transportation network is sparse, with insufficient trunk lines and scattered node connections. It is necessary to enhance the overall resilience of the network through topology optimization. Network density can be improved by encrypting cross-regional trunk lines, and highway–railway parallel trunk lines, including “Jinan→Liaocheng” and “Zibo→Tai’an,” can be added to reduce multi-level transit between nodes (the current average shortest path is 2.281, and the highway sub-network’s efficiency is lower due to transit). The main line connections in central Shandong (Zibo, Tai’an) and Western Shandong (Liaocheng, Dezhou) should be intensified to narrow the connectivity difference between “core and edge,” and a “local dense highway railway network” should be built around core cities, such as Jinan, Zibo, and Tai’an. The average clustering coefficient should be improved, and the number of independent paths in the region should be increased. Finally, local fault resistance and the local agglomeration effect should be enhanced, and small-world networks should be strengthened.
Across the three dimensions of structural resilience, according to the correlation analysis of absorbing capacity, the bus station high-speed railway station feeder line should be opened for weak highway stations to shorten transfer times. For the railway hub, it is necessary to expand the radiation range of its cross mode, and direct express transportation from the railway station to the highway station within 50 km should be added to improve the supporting capacity of the railway to the highway network. The buffering capacity of the composite node of “railway + highway” is significantly higher than that of the pure highway node, indicating that highway–railway cooperation can effectively increase the number of independent paths. Therefore, it is necessary to plan intercity railway or city railway in the railway-free areas of Jiyang and Dong’e and promote the connection between highway stations and adjacent railway stations in areas like Zichuan and Tai’an East Bus Station to expand beyond single highways. In addition, the composite network’s buffering capacity has a hierarchical structure of “strong core and weak edge,” so it is also necessary to strengthen the radiation-driving role of the core hub. Jinan’s core hub’s high buffering capacity has not been effectively radiated to the surrounding districts and counties. By densifying Jinan’s parallel lines and suburban roads and planning an urban railway, the core hub’s multi-path advantage can be transferred to the edge area. In view of the problems exposed by the resilience analysis, this could strengthen the connection between the edge bus stations and the railway network, reduce its dependence on a single highway, and balance the connection distribution to reduce structural entropy. For sites with weak recovery capacity, peripheral branch connections and the number of redundant paths should be increased, and the structural order should be optimized. Links between the core hub and edge nodes should be strengthened to drive the functional reorganization of edge nodes through the core hub’s recovery capacity and improve the overall network’s resilience.
Based on an empirical study of the Jinan Metropolitan Area, this research demonstrates that multi-modal collaboration can simultaneously improve the inefficiency of the highway sub-network and the insufficient coverage of the railway sub-network. Its resilience improvement is significantly superior to that of a single sub-network, providing new support for the “multi-modal collaboration priority” perspective. A balanced strategy of “trunk line densification + peripheral connection” is proposed. This strategy not only avoids system vulnerability caused by “prioritizing core nodes while neglecting peripheral nodes” but also prevents resource waste resulting from “balanced investment in all nodes.” The “core radiation-peripheral linkage” model derived from this strategy can serve as a universal framework for resilience optimization in medium-sized metropolitan areas.

7. Conclusions

This study examines Jinan Metropolitan Area’s multi-mode transportation network. Based on complex network theory across the three dimensions of absorbing capacity (network efficiency), buffering capacity (average number of independent paths), and recovery capacity (structural entropy), and combined with anthe analysis of network topology attributes, a comparison of sub-network resilience, and node failure simulation, the network’s structural resilience is evaluated. The main findings are as follows:
(1)
The network topology attributes are characterized by basic connectivity, sparse dispersion, and a small world. The nodes connect 6–7 lines on average, with a sufficient guarantee of basic connectivity. As such, it can cope with random node failure and maintain the network’s basic integrity. The network’s density is low, the overall network is sparse, and the nodes are not fully connected, indicating that there is still a gap in trunk line coverage in the region. Furthermore, some nodes need to be connected through multi-level transit. The average node betweenness centrality is only 0.0298, and no core hubs can reduce the risk of a deliberate attack on core nodes. The network has the attributes of a small world, taking into account the advantages of local agglomeration and global connectivity.
(2)
The sub-networks’ resilience differs significantly, and the composite network embodies the advantages of collaborative balance. By comparing the resilience indexes (network efficiency, average number of independent paths, and structural entropy) of highway, railway, and composite networks, it is found that the three networks present significant hierarchical characteristics. The railway sub-network has the best resilience, the shortest path between nodes, the most convenient transportation, a sufficient alternative path in case of failure, relatively balanced node degree distribution, and outstanding anti-interference ability. The road sub-network has the weakest resilience. Due to the scattered nodes and multi-level transit, transportation is inefficient. The “tree” layout requires the edge nodes to rely on a single trunk line, and there is a lack of alternative paths. The “core edge” differentiation is obvious, and failure of core nodes can easily cause regional paralysis. The composite network achieves the optimal compromise; its network efficiency and average number of independent paths are between those of the two sub-networks. The composite network not only avoids the inefficiency of the highway sub-network but also compensates for the lack of coverage of the railway sub-network. The node degree distribution is the most uniform. The failure of a single node has little impact on the overall situation, and the overall resilience is best. This verifies the core assumption that multi-mode collaboration can improve resilience.
(3)
The structural resilience analysis of node failure shows that the core hub is the pillar of structural resilience and that the secondary highway node is a weak point. The intersection of highway and railway multi-mode connections is also a pillar of resilience. These nodes are used for transregional transfer. Failure will directly lead to critical path interruption and redundancy compression. Among nodes, Jinan East Railway Station has the greatest impact on resilience, as it has the most connecting lines and the strongest cross-regional function. The terminal highway node is a weak point for resilience. This node relies on a single mode; it has weak connections and insufficient redundancy, and it is prone to chain reactions of congestion during normal operation. After failure, the flow transferred to the core node optimizes load distribution, but its exposed highway–railway disconnection problem limits network structure resilience.
(4)
Strengthening highway–railway coordination can significantly mitigate the problems of the single mode, which is key to improving the network’s structural resilience. Because Jinan Coach Terminal Station connects multiple railway stations and lines, its absorbing and buffering capacities are close to those of the railway hub, far exceeding those of other single highway nodes. Secondary highway stations that lack highway railway coordination, such as Dong’e Bus Station, rank at the end of the three indicators of absorbing capacity, buffering capacity, and recovery capacity, which proves that when the cross-mode connection density and space–time distance reach the threshold, node resilience can be significantly improved.
This study focuses on medium-sized metropolitan areas with unbalanced core–peripheral connectivity, taking the Jinan Metropolitan Area as a case study. It identifies the resilience advantages and core weaknesses of the multi-modal transportation network in the Jinan Metropolitan Area and proposes a three-dimensional “absorbing–buffering–recovery” evaluation model based on the entropy weight method, as well as a strategic framework of “trunk line densification + peripheral connection”. These contributions can provide a quantitative basis for transportation planning in similar metropolitan areas and offer guidance for transportation infrastructure investment. Meanwhile, given the conclusion that “transportation resilience improvement promotes regional coordination,” these strategies could enhance the efficiency of cross-regional GDP flow within metropolitan areas and facilitate urban–rural integration. This study provides a theoretical basis for optimizing the resilience of metropolitan transportation networks and holds practical significance for advancing the construction of modern metropolitan transportation systems characterized by efficient commuting and robust disturbance resistance.
This study also has limitations. In terms of the evaluation model, although the entropy weight method achieves objective weighting, it does not consider the coupling effects between indicators (e.g., the interaction between buffering capacity and recovery capacity), and so it may underestimate the role of multi-dimensional collaboration in improving resilience. In terms of simulation accuracy, the node failure simulation adopts a simplified method of “sequential node deletion” and does not account for extreme scenarios of “simultaneous failure of multiple nodes” in real-world situations, leading to deviation in the evaluation of system invulnerability.
In future research, structural equation modeling (SEM) or system dynamics (SD) methods will be considered to improve the evaluation model and enhance the accuracy of resilience measurement. Additionally, extreme scenarios, such as “simultaneous failure of multiple nodes” and “cross-regional cascading failures,” will be simulated to assess the invulnerability of the Jinan Metropolitan Area’s transportation network, thereby providing more precise decision support for emergency management.

Author Contributions

Conceptualization, A.W. and Z.S.; methodology, A.W.; software, A.W.; validation, A.W., Z.L. and Z.S.; formal analysis, A.W.; investigation, A.W.; resources, A.W. and K.L.; data curation, A.W.; writing—original draft preparation, A.W.; writing—review and editing, A.W. and Z.S.; visualization, A.W.; supervision, Z.S. and C.L.; project administration, A.W. and Z.S.; funding acquisition, Z.S. and C.L. All authors have read and agreed to the published version of the manuscript.

Funding

This research was funded by the National Natural Science Foundation of China (Grant 72304161), the Natural Science Foundation of Shandong Province, China (Grant ZR2022QG029 and ZR2024QG020), and the Key Project of Undergraduate Teaching Reform Research in Shandong Province (Z2023145).

Institutional Review Board Statement

Not applicable.

Informed Consent Statement

Not applicable.

Data Availability Statement

The original contributions presented in this study are included in the article. Further inquiries can be directed to the corresponding author.

Acknowledgments

The authors would like to thank the editor and the anonymous reviewers for their helpful comments and suggestions, which helped improve the manuscript.

Conflicts of Interest

The authors declare no conflicts of interest.

Appendix A. Station Link Table of the Jinan Metropolitan Area

Connection TypeStation Connection Status
High-speedJinanxi Railway Station–Jinan Railway Station, Jinanxi Railway Station–Changqing Railway Station, Jinanxi Railway Station–Zhangqiu South Railway Station, Jinanxi Railway Station-Zhangqiu North Railway Station, Jinanxi Railway Station–Xueye Railway Station, Jinanxi Railway Station–Zibo North Railway Station, Jinanxi Railway Station–Linzi North Railway Station, Jinanxi Railway Station–Tai’an Railway Station, Jinanxi Railway Station–Yucheng East Railway Station, Jinanxi Railway Station–Chiping South Railway Station, Jinanxi Railway Station–Zouping Railway Station, Jinanxi Railway Station–Daminghu Railway Station, Jinanxi Railway Station–Chiping Railway Station, Jinan Railway Station–Changqing Railway Station, Jinan Railway Station–Zhangqiu South Railway Station, Jinan Railway Station–Zibo North Railway Station, Jinan Railway Station–Linzi North Railway Station, Jinan Railway Station–Yucheng East Railway Station, Jinan Railway Station–Daminghu Railway Station, Jinan Railway Station–Chiping Railway Station, Jinan East Railway Station–Changqing Railway Station, Jinan East Railway Station–Zhangqiu Railway Station, Jinan East Railway Station–Laiwu North Railway Station, Jinan East Railway Station–Gangcheng Railway Station, Jinan East Railway Station–Zibo Railway Station, Changqing Railway Station–Zhangqiu South Railway Station, Changqing Railway Station–Zhangqiu Railway Station, Changqing Railway Station–Xueye Railway Station, Changqing Railway Station–Laiwu North Railway Station, Changqing Railway Station–Gangcheng Railway Station, Changqing Railway Station–Zibo Railway Station, Changqing Railway Station–Zibo North Railway Station, Changqing Railway Station–Linzi North Railway Station, Changqing Railway Station–Tai’an Railway Station, Changqing Railway Station–Yucheng East Railway Station, Changqing Railway Station–Chiping South Railway Station, Changqing Railway Station–Zouping Railway Station, Changqing Railway Station–Daminghu Railway Station, Changqing Railway Station–Chiping Railway Station, Zhangqiu South Railway Station–Xueye Railway Station, Zhangqiu South Railway Station–Zibo North Railway Station, Zhangqiu South Railway Station–Linzi North Railway Station, Zhangqiu South Railway Station–Daminghu Railway Station, Zhangqiu South Railway Station–Chiping Railway Station, Zhangqiu Railway Station–Laiwu North Railway Station, Zhangqiu Railway Station–Gangcheng Railway Station, Zhangqiu Railway Station–Zibo Railway Station, Zhangqiu North Railway Station–Zibo North Railway Station, Zhangqiu North Railway Station–Yucheng East Railway Station, Zhangqiu North Railway Station–Daminghu Railway Station, Xueye Railway Station–Linzi North Railway Station, Xueye Railway Station–Tai’an Railway Station, Xueye Railway Station–Chiping South Railway Station, Xueye Railway Station–Zouping Railway Station, Xueye Railway Station–Daminghu Railway Station, Xueye Railway Station–Chiping Railway Station, Laiwu North Railway Station–Gangcheng Railway Station, Laiwu North Railway Station–Zibo Railway Station, Gangcheng Railway Station–Zibo Railway Station, Zibo North Railway Station–Yucheng East Railway Station, Zibo North Railway Station–Chiping South Railway Station, Zibo North Railway Station–Daminghu Railway Station, Linzi North Railway Station–Tai’an Railway Station, Linzi North Railway Station–Yucheng East Railway Station, Linzi North Railway Station–Chiping South Railway Station, Linzi North Railway Station–Zouping Railway Station, Linzi North Railway Station–Daminghu Railway Station, Linzi North Railway Station–Chiping Railway Station, Tai’an Railway Station–Yucheng East Railway Station, Tai’an Railway Station–Chiping South Railway Station, Tai’an Railway Station–Zouping Railway Station, Tai’an Railway Station–Daminghu Railway Station, Tai’an Railway Station–Chiping Railway Station, Yucheng East Railway Station–Zouping Railway Station, Yucheng East Railway Station–Daminghu Railway Station, Yucheng East Railway Station–Chiping Railway Station, Chiping South Railway Station–Zouping Railway Station, Chiping South Railway Station–Daminghu Railway Station, Zouping Railway Station–Chiping Railway Station
RailJinan Railway Station–Licheng Railway Station, Jinan Railway Station–Qihe Railway Station, Jinan Railway Station–Taishan Railway Station, Zhangqiu North Railway Station–Qihe Railway Station, Zibo North Railway Station–Qihe Railway Station, Licheng Railway Station–Zhangqiu North Railway Station, Licheng Railway Station–Zibo North Railway Station, Licheng Railway Station–Yucheng East Railway Station, Licheng Railway Station–Jinan Railway Station, Qihe Railway Station–Licheng Railway Station, Qihe Railway Station–Taishan Railway Station
RoadJinan Coach Terminal Station–Laiwu General Bus Station, Jinan Coach Terminal Station–Pingyin General Bus Station, Jinan Coach Terminal Station–Shanghe Bus Station, Jinan Coach Terminal Station–Zibo Passenger Transport Center, Jinan Coach Terminal Station–Tai’an General Bus Station, Jinan Coach Terminal Station–Feicheng Bus Station, Jinan Coach Terminal Station–Jibei Comprehensive Transport Center, Jinan Coach Terminal Station–Chiping Bus Station, Jinan Coach Terminal Station–Dong’e Bus Station, Jinan Coach Terminal Station–Zouping Bus Station, Jinan Square Bus Station–Shanghe Bus Station, Jinan Square Bus Station–Zibo Passenger Transport Center, Jinan Square Bus Station–Yucheng Passenger Transport Center, Jinan Long-Distance Passenger Transport Center–Yucheng Passenger Transport Center, Jinan East Long-Distance Bus Station–Zhangqiu General Passenger Transport Station, Jinan East Long-Distance Bus Station–Laiwu General Bus Station, Jinan East Long-Distance Bus Station–Gangcheng Bus Station, Jinan East Long-Distance Bus Station–Pingyin General Bus Station, Jinan East Long-Distance Bus Station–Shanghe Bus Station, Jinan East Long-Distance Bus Station–Zibo Passenger Transport Center, Zhangqiu General Passenger Transport Station–Laiwu General Bus Station, Zhangqiu General Passenger Transport Station–Tai’an General Bus Station, Laiwu General Bus Station–Zibo Passenger Transport Center, Laiwu General Bus Station–Tai’an General Bus Station, Laiwu General Bus Station–Tai’an High-speed Rail Bus Station, Pingyin General Bus Station–Jinan West Long-Distance Bus Station, Pingyin General Bus Station–Tai’an General Bus Station, Shanghe Bus Station–Tai’an General Bus Station, Zibo Passenger Transport Center–Shanghe Bus Station, Zibo Passenger Transport Center–Tai’an General Bus Station, Zibo Passenger Transport Center–Feicheng Bus Station, Zibo Passenger Transport Center–Jibei Comprehensive Transport Center, Tai’an General Bus Station–Feicheng Bus Station, Tai’an General Bus Station–Zouping Bus Station, Yucheng Passenger Transport Center–Jibei Comprehensive Transport Center, Jinan West Long-Distance Bus Station–Jinanxi Railway Station, Daminghu Bus Station–Licheng Railway Station, Jinan Coach Terminal Station–Jinan Railway Station, Jinan Square Bus Station–Jinan Railway Station, Jinan Long-Distance Passenger Transport Center–Jinan Railway Station, Jinan East Long-Distance Bus Station–Changqing Railway Station, Zhangqiu General Passenger Transport Station–Zhangqiu Railway Station, Zhangqiu General Passenger Transport Station–Zhangqiu North Railway Station, Zhangqiu General Passenger Transport Station–Xueye Railway Station, Laiwu General Bus Station–Gangcheng Railway Station, Gangcheng Bus Station–Zibo Railway Station, Zibo Passenger Transport Center–Linzi North Railway Station, Zibo Passenger Transport Center–Zibo North Railway Station, Tai’an East Bus Station–Yucheng East Railway Station, Tai’an General Bus Station–Qihe Railway Station, Tai’an General Bus Station–Yucheng East Railway Station, Tai’an High-speed Rail Bus Station–Yucheng East Railway Station, Jibe Comprehensive Transport Center–Changqing Railway Station, Yucheng Passenger Transport Center–Zouping Railway Station, Chiping Bus Station–Taishan Railway Station, Chiping Bus Station–Daminghu Railway Station, Zouping Bus Station–Chiping Railway Station, Jiyang General Bus Station–Changqing Railway Station, General Bus Station–Zhangqiu South Railway Station, Long-distance Bus Station–Zibo North Railway Station, Feicheng Bus Station–Yucheng East Railway Station

References

  1. Ma, Y.; Xiao, J. Definition and comparative analysis of metropolitan areas, metropolitan circles and urban agglomerations. Econ. Manag. 2020, 34, 18–26. [Google Scholar]
  2. Li, T.; Yang, X.; Zhao, X.; Liang, J. High-speed rail’s influence on urban and regional spatial development: A review. Urban Dev. Stud. 2013, 20, 71–79. [Google Scholar]
  3. Zong, H.; Huang, Y. The Impact of High-speed Rail on Regional Accessibility and Regional Spatial Interactions: A Case Study of Chengdu-Chongqing Urban Agglomeration. Hum. Geogr. 2019, 34, 99–107. [Google Scholar]
  4. Zhao, D.; Zhang, J.X. Research into spatial pattern changes of Yangtze River Delta’s accessibility under the impact of high-speed railway. Resour. Environ. Yangtze Basin 2012, 21, 391–398. [Google Scholar]
  5. Tian, M.; Wang, Y.; Wang, Y. High-speed rail network and urban agglomeration economies: Research from the perspective of urban network externalities. Socio-Econ. Plan. Sci. 2023, 85, 101442. [Google Scholar] [CrossRef]
  6. Holling, C.S. Resilience and stability of ecological systems. Annu. Rev. Ecol. Syst. 1973, 4, 1. [Google Scholar] [CrossRef]
  7. Alexander, D.E. Resilience and disaster risk reduction: An etymological journey. Nat. Hazards Earth Syst. Sci. 2013, 13, 2707. [Google Scholar] [CrossRef]
  8. Bo, J.; Zhang, Y.; Bo, T.; Wang, Y.; Zhao, X.; Chen, Y. Concept of site resilience and discussion on relevant issues. World Earthq. Eng. 2022, 38, 1–9. [Google Scholar]
  9. Grygorenko, Z.; Naydonova, G. The concept of “resilience”: History of formation and approaches to definition. Public Adm. Law Rev. 2023, 14, 76–88. [Google Scholar] [CrossRef]
  10. Bi, X.L. Thinking and Practice of Urban Rail Transit Safety Resilience. Urban Mass Transit 2024, 27, 1–5. [Google Scholar]
  11. Albert, R.; Jeong, H.; Barabási, A.L. Error and attack tolerance of complex networks. Nature 2000, 406, 378–382. [Google Scholar] [CrossRef] [PubMed]
  12. ISO 5133:2021; Road Traffic Management-Traffic Resilience-Guidelines for Planning and Implementing Measures to Enhance Resilience. International Organization for Standardization: Geneva, Switzerland, 2021.
  13. Wang, W.; Gao, Z.; Jia, B. Distinguishing structural and functional resilience in urban transportation networks. Transp. Res. Part B Methodol. 2022, 161, 312–330. [Google Scholar] [CrossRef]
  14. Zheng, Z.; Zhu, Y.; Pei, Y.; Wang, L. Spatial–temporal heterogeneity and influencing factors of the coupling between industrial agglomeration and regional economic resilience in China. Environ. Dev. Sustain. 2023, 25, 12735–12759. [Google Scholar] [CrossRef] [PubMed]
  15. Feng, Y.; Lee, C.C.; Peng, D. Does regional integration improve economic resilience? Evidence from urban agglomerations in China. Sustain. Cities Soc. 2023, 88, 104273. [Google Scholar] [CrossRef]
  16. He, Z.; Huang, H.; Choi, H.; Bilgihan, A. Building organizational resilience with digital transformation. J. Serv. Manag. 2023, 34, 147–171. [Google Scholar] [CrossRef]
  17. Amirzadeh, M.; Sobhaninia, S.; Buckman, S.T.; Sharifi, A. Towards building resilient cities to pandemics: A review of COVID-19 literature. Sustain. Cities Soc. 2023, 89, 104326. [Google Scholar] [CrossRef]
  18. Datola, G. Implementing urban resilience in urban planning: A comprehensive framework for urban resilience evaluation. Sustain. Cities Soc. 2023, 98, 104821. [Google Scholar] [CrossRef]
  19. Wang, X.; Mazumder, R.K.; Salarieh, B.; Salman, A.M.; Shafieezadeh, A.; Li, Y. Machine learning for risk and resilience assessment in structural engineering: Progress and future trends. J. Struct. Eng. 2022, 148, 03122003. [Google Scholar] [CrossRef]
  20. Zidane, T.E.K.; Ab Muis, Z.; Ho, W.S.; Zahraoui, Y.; Aziz, A.S.; Su, C.-L.; Mekhilef, S.; Campana, P.E. Power systems and microgrids resilience enhancement strategies: A review. Renew. Sustain. Energy Rev. 2025, 207, 114953. [Google Scholar] [CrossRef]
  21. Peng, C.; Lin, Y.Z.; Gu, C.L. Evaluation and optimization strategy of city network structural resilience in the middle reaches of Yangtze River. Geogr. Res. 2018, 37, 1193–1207. [Google Scholar]
  22. Song, X.; Zhao, P.; Yin, R.; Zu, Y.; Zhang, Y. Cascading failure model and resilience-based sequential recovery strategy for complex networks. Reliab. Eng. Syst. Saf. 2025, 253, 110488. [Google Scholar] [CrossRef]
  23. Fan, Y.F.; Hu, R.Z.; Li, R.J.; Jia, Z.X. Resilience assessment of expressway networks in Shanxi, Shandong, Henan and Hebei provinces integrating dynamic indicators. Sci. Technol. Eng. 2025, 25, 1–10. [Google Scholar]
  24. Ma, S.H.; Wu, Y.J.; Chen, X.F. Structural resilience of multimodal transportation networks in urban agglomerations: A case study of the Guanzhong Plain urban agglomeration network. J. Tsinghua Univ. (Sci. Technol.) 2022, 62, 1228–1235. [Google Scholar]
  25. Ma, S.H.; Yang, L.; Chen, X.F. Resilience evolution of multi-mode transportation network in urban agglomeration based on risk diffusion. J. South China Univ. Technol. (Nat. Sci. Ed.) 2023, 51, 42–51. [Google Scholar]
  26. Nan, C.; Sansavini, G. A quantitative method for assessing resilience of interdependent infrastructures. Reliab. Eng. Syst. Saf. 2017, 157, 35–53. [Google Scholar] [CrossRef]
  27. Latora, V.; Marchiori, M. Efficient behavior of small-world networks. Phys. Rev. Lett. 2001, 87, 198701. [Google Scholar] [CrossRef]
  28. Stubbs-Richardson, M.S.; Cosby, A.K.; Bergene, K.D.; Cosby, A.G. Searching for safety: Crime prevention in the era of Google. Crime Sci. 2018, 7, 21. [Google Scholar] [CrossRef]
  29. Francis, R.; Bekera, B. A metric and frameworks for resilience analysis of engineered and infrastructure systems. Reliab. Eng. Syst. Saf. 2014, 121, 90–103. [Google Scholar] [CrossRef]
  30. Newman, M.E.J. The structure and function of complex networks. SIAM Rev. 2003, 45, 167–256. [Google Scholar] [CrossRef]
  31. Shinozuka, M. Resilience of integrated power and water systems, Seismic Evaluation and Retrofit of Lifeline Systems. Artic. MCEER’s Res. Prog. Accompl. 2004, 65–86. [Google Scholar]
  32. Li, A.; Pan, Y. Structural information and dynamical complexity of networks. IEEE Trans. Inf. Theory 2016, 62, 3290–3339. [Google Scholar] [CrossRef]
  33. Shannon, C.E. A mathematical theory of communication. Bell Syst. Tech. J. 1948, 27, 379–423. [Google Scholar] [CrossRef]
  34. Haken, H. Introduction to synergetics. In Synergetics: Cooperative Phenomena in Multi-Component Systems; Vieweg + Teubner Verlag: Wiesbaden, Germany, 1973; pp. 9–19. [Google Scholar] [CrossRef]
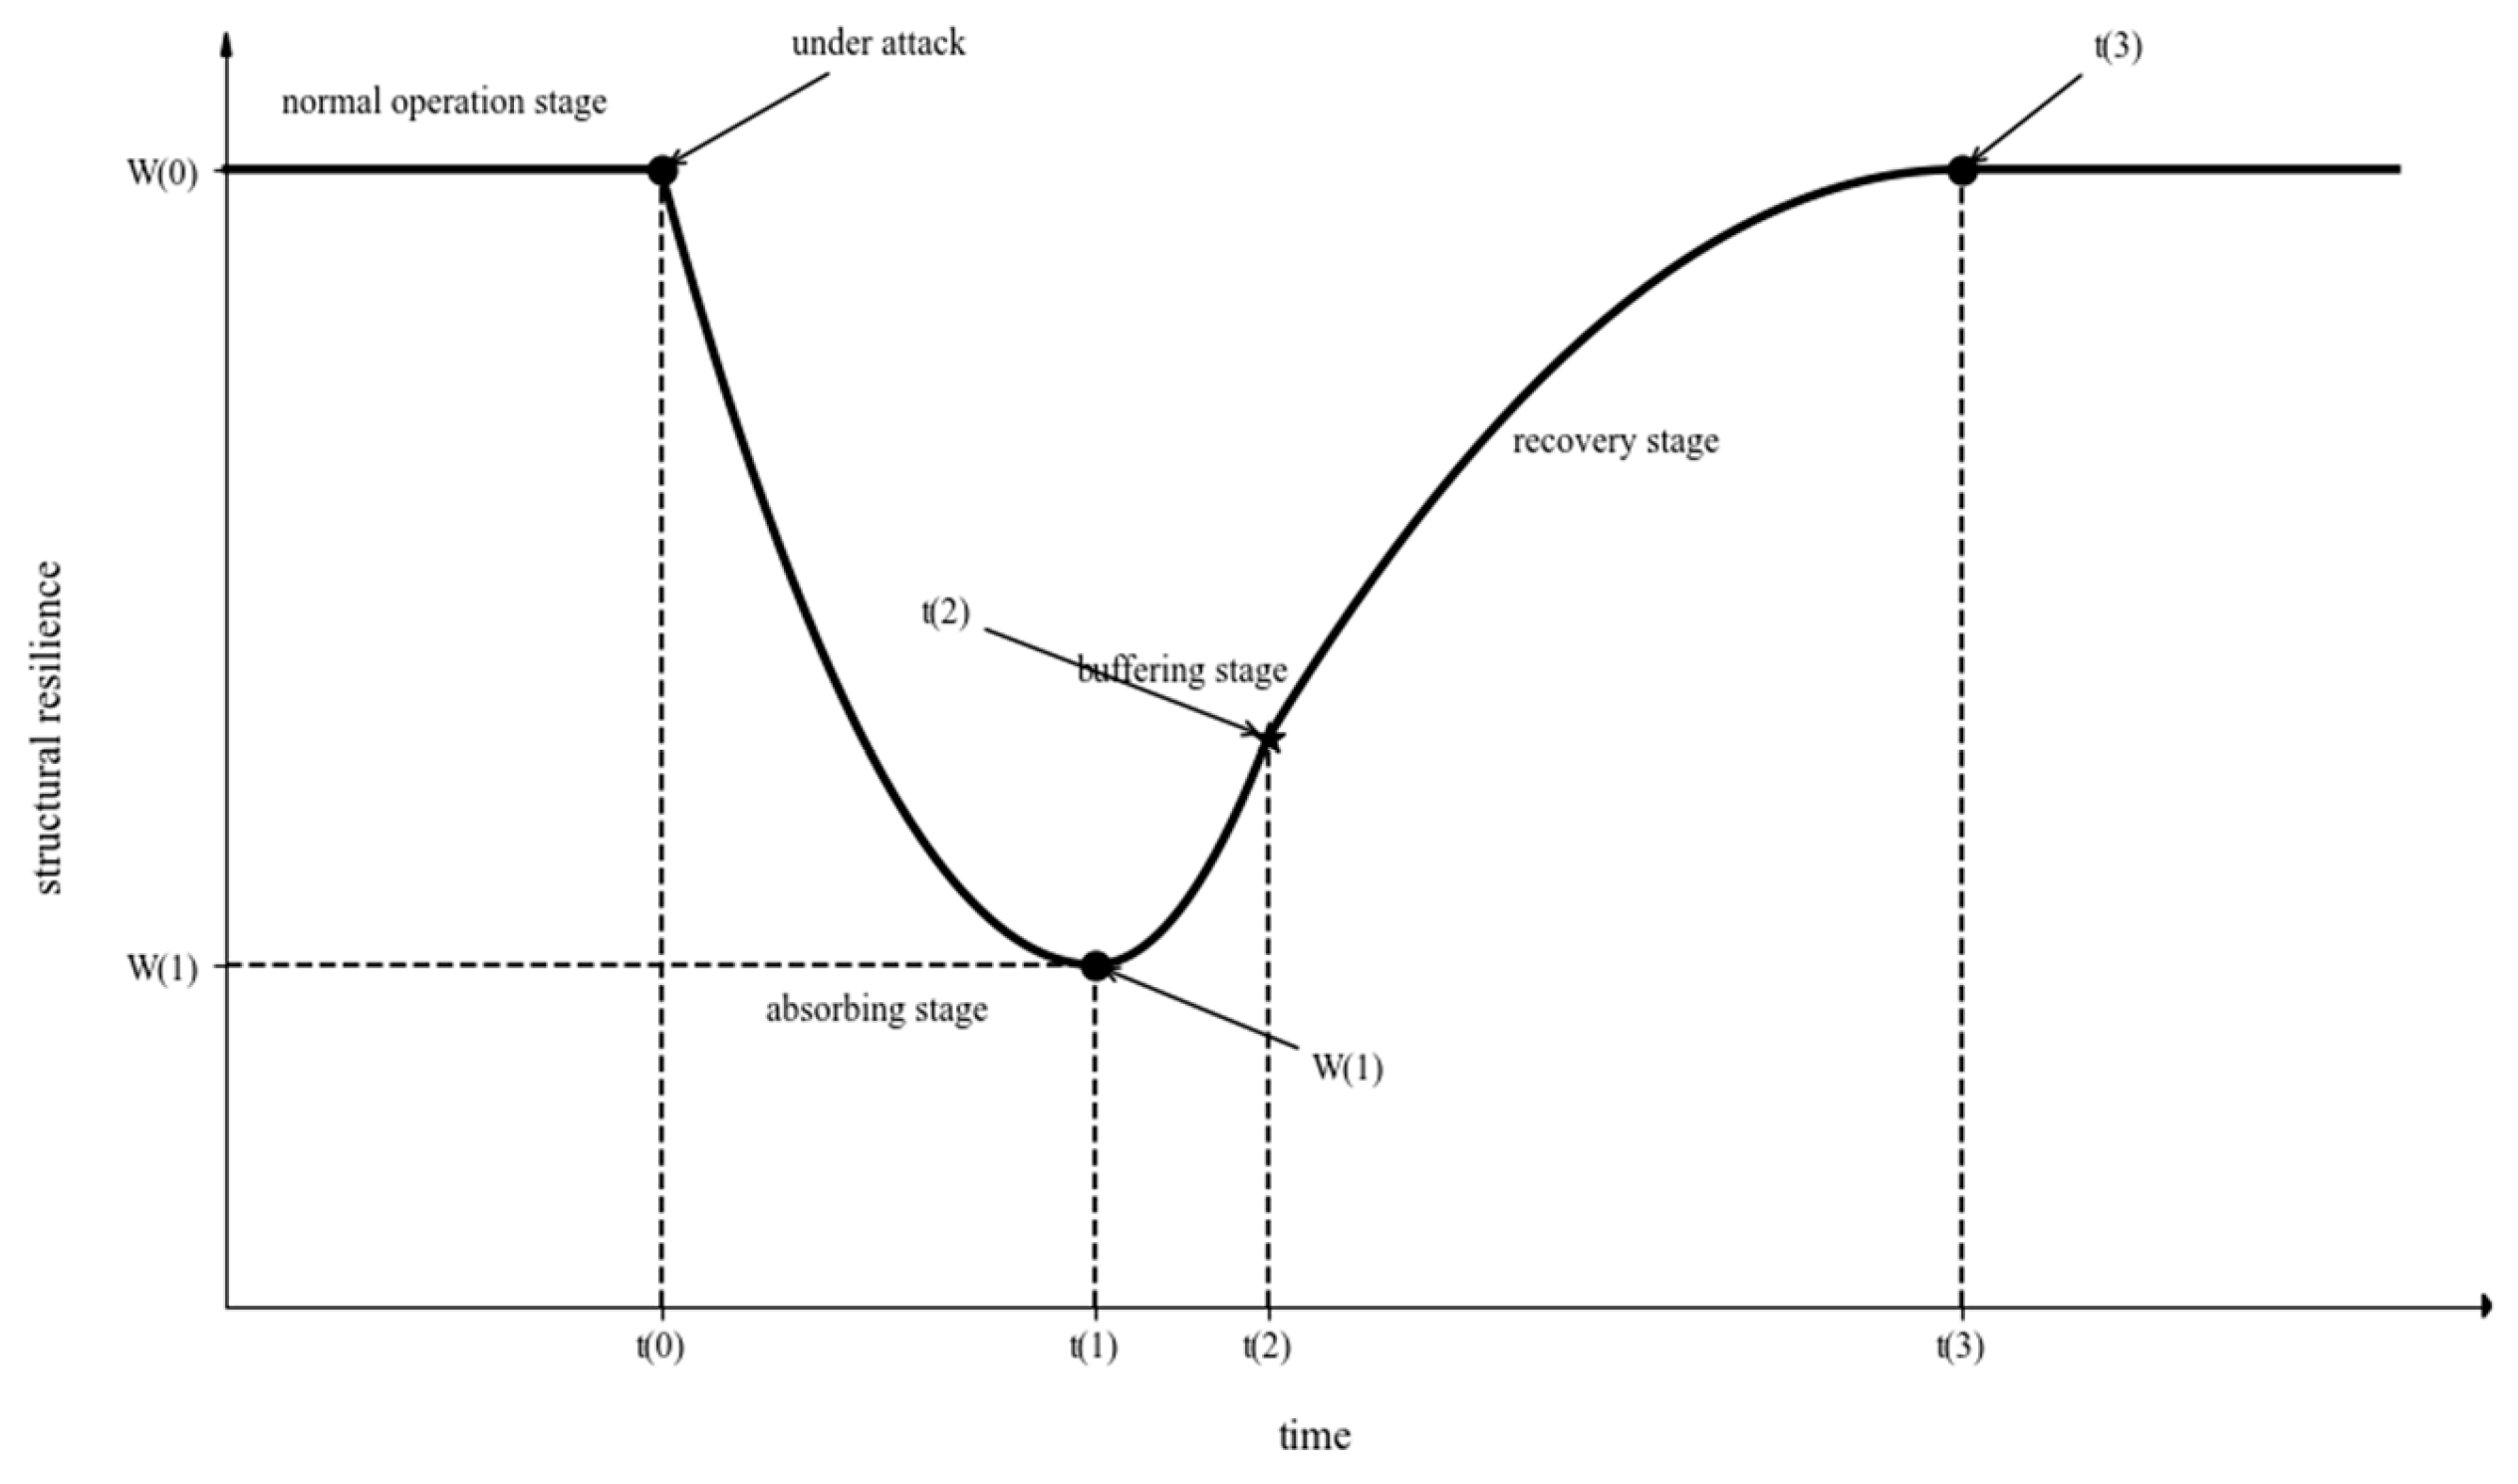
Figure 1. Structural resilience of a multi-modal transportation network.
Sustainability 17 10528 g001
Figure 2. Topology structure of multi-mode transportation network in Jinan Metropolitan Area.
Sustainability 17 10528 g002
Figure 3. Multi-mode transportation spatial network in Jinan Metropolitan Area.
Sustainability 17 10528 g003
Figure 4. Absorbing capacity, buffering capacity, and recovery capacity of the network after failure of each node.
Sustainability 17 10528 g004aSustainability 17 10528 g004b
Figure 5. Changes in network structural resilience after each node failure.
Sustainability 17 10528 g005
Table 1. Topological properties and calculation results of Jinan Metropolitan Area’s multi-mode transportation network.
Research IndexesIndex FormulasIndex MeaningCalculation Results
Average degree K = i = 1 n k i / n Represents the average number of edges each node has in the network, which is the degree of the node.6.6667
Network density ρ = 2 M N ( N 1 ) M is the number of edges in the network and N is the number of nodes in the network. The greater the network density, the denser the node distribution.0.1515
Average node betweenness centrality C g = j 1 k 1 n 1 g j k ( n i ) g j k / ( n 2 3 n + 2 ) 2 The greater the C g value, the stronger the accessibility of the node and the more prominent the traffic status. g j k is the number of shortcuts between node j and node k , and g j k ( n i ) is the total number of paths from node j to node k through node i .0.0298
Average clustering coefficient C = i = 1 n 2 E i K i ( K i 1 ) / n E i is the actual number of edges connected to node i ; K i ( K i 1 ) is the maximum number of edges con-nected to node i . The higher the clustering coefficient of node i , the greater the possibility of forming a “small world” with surrounding nodes, and the greater the network clustering coefficient, the more obvious the network agglomeration effect.0.3632
Average shortest path length L = 2 N ( N 1 ) i j d i j Reflects the average accessibility be-tween nodes. d i j is the shortest path length between two nodes in the network.2.2808
Table 2. Calculation of structural characteristics of multi-mode transportation network in Jinan Metropolitan Area.
Network CategoryNetwork EfficiencyAverage Number of Independent PathsStructural Entropy
Composite network0.50743.94040.9436
Highway network0.35531.32020.8572
Railway network0.67244.48480.9720
Table 3. Structural resilience characteristics of multi-mode transportation network in Jinan Metropolitan Area after node failure.
Station IdFault NodeAbsorbing CapacityBuffering CapacityRecovery CapacityStation IdFault NodeAbsorbing CapacityBuffering CapacityRecovery Capacity
H001Jinan West Long-Distance Bus Station1.00791.01750.9954R001Jinanxi Railway Station0.98050.93460.9959
H002Daminghu Bus Station1.01621.03470.9967R002Jinan Railway Station0.96630.91400.9932
H003Jinan Coach Terminal Station0.95840.91000.9850R003Licheng Railway Station1.00321.00220.9920
H004Jinan Square Bus Station1.00350.98480.9933R004Jinan East Railway Station0.89400.87800.9964
H005Jinan Long-Distance Passenger Transport Center1.00851.01510.9951R005Changqing Railway Station0.99250.96630.9949
H006Jinan East Long-Distance Bus Station0.99270.92280.9899R006Zhangqiu South Railway Station1.00040.96710.9911
H007Zhangqiu General Passenger Transport Station0.99680.93460.9918R007Zhangqiu Railway Station0.99780.96930.9929
H008Jiyang General Bus Station1.00851.03470.9979R008Zhangqiu North Railway Station0.99330.95610.9943
H009Laiwu General Bus Station0.99590.92390.9902R009Xueye Railway Station1.00321.00220.9920
H010Gangcheng Bus Station1.01180.98670.9949R010Laiwu North Railway Station0.99960.96710.9912
H011Pingyin General Bus Station1.00020.97350.9915R011Gangcheng Railway Station1.00080.96170.9898
H012Shanghe Bus Station1.00370.98020.9924R012Zibo Railway Station0.95490.93540.9920
H013Zibo Passenger Transport Center0.99090.93300.9900R013Zibo North Railway Station0.98820.95480.9966
H014Zichuan Long-Distance Bus Station1.01141.03470.9974R014Linzi North Railway Station0.99570.96760.9952
H015Tai’an East Bus Station1.01011.03470.9976R015Tai’an Railway Station0.93790.90650.9921
H016Tai’an General Bus Station0.99030.93170.9893R016Qihe Railway Station0.99780.97170.9948
H017Tai’an High-Speed Rail Bus Station1.00671.01910.9958R017Yucheng East Railway Station0.99210.95800.9940
H018Feicheng Bus Station1.00220.99930.9946R018Chiping South Railway Station0.98520.94460.9952
H019Jibei Comprehensive Transport Center0.99980.99100.9939R019Zouping Railway Station0.98960.95130.9944
H020Yucheng Passenger Transport Center1.00570.97030.9903R020Daminghu Railway Station0.97260.97730.9903
H021Chiping Bus Station1.00490.99610.9937R021Taishan Railway Station0.99980.96680.9917
H022Dong’e Bus Station1.01361.03470.9973R022Chiping Railway Station1.00691.00010.9933
H023Zouping Bus Station1.00571.00600.9948
Table 4. Corresponding relationship between structural entropy and dynamic recovery efficiency of Jinan Metropolitan Area’s multi-modal transportation network.
Type of Failed NodeAffiliated NetworkStructural EntropyTime to Recover to 90% Connectivity (Hours)Recovery Rate (%/Hour)Post-Failure Recovery Capacity R
Core transfer nodeComposite network0.94364.221.40.96
Ordinary core nodeRailway sub-network0.97206.513.80.89
Peripheral nodeHighway sub-network0.85727.811.50.82
Note: Recovery rate = (90%-initial connectivity rate after failure)/recovery time; R is calculated based on Formula (7), rounded to 2 decimal places.
Table 5. Structural resilience of multi-mode transportation network in Jinan Metropolitan Area after node failure.
Station IdFault NodeStructural ResilienceStation IdFault NodeStructural Resilience
H001Jinan West Long-Distance Bus Station1.0087R001Jinanxi Railway Station0.9626
H002Daminghu Bus Station1.0192R002Jinan Railway Station0.9489
H003Jinan Coach Terminal Station0.9428R003Licheng Railway Station0.9992
H004Jinan Square Bus Station0.9910R004Jinan East Railway Station0.9186
H005Jinan Long-Distance Passenger Transport Center1.0075R005Changqing Railway Station0.9803
H006Jinan East Long-Distance Bus Station0.9571R006Zhangqiu South Railway Station0.9809
H007Zhangqiu General Passenger Transport Station0.9643R007Zhangqiu Railway Station0.9821
H008Jiyang General Bus Station1.0181R008Zhangqiu North Railway Station0.9752
H009Laiwu General Bus Station0.9583R009Xueye Railway Station0.9992
H010Gangcheng Bus Station0.9940R010Laiwu North Railway Station0.9808
H011Pingyin General Bus Station0.9842R011Gangcheng Railway Station0.9779
H012Shanghe Bus Station0.9885R012Zibo Railway Station0.9570
H013Zibo Passenger Transport Center0.9619R013Zibo North Railway Station0.9743
H014Zichuan Long-Distance Bus Station1.0185R014Linzi North Railway Station0.9816
H015Tai’an East Bus Station1.0183R015Tai’an Railway Station0.9395
H016Tai’an General Bus Station0.9609R016Qihe Railway Station0.9839
H017Tai’an High-Speed Rail Bus Station1.0094R017Yucheng East Railway Station0.9758
H018Feicheng Bus Station0.9983R018Chiping South Railway Station0.9682
H019Jibei Comprehensive Transport Center0.9935R019Zouping Railway Station0.9721
H020Yucheng Passenger Transport Center0.9832R020Daminghu Railway Station0.9806
H021Chiping Bus Station0.9970R021Taishan Railway Station0.9809
H022Dong’e Bus Station1.0189R022Chiping Railway Station0.9992
H023Zouping Bus Station1.0024
Disclaimer/Publisher’s Note: The statements, opinions and data contained in all publications are solely those of the individual author(s) and contributor(s) and not of MDPI and/or the editor(s). MDPI and/or the editor(s) disclaim responsibility for any injury to people or property resulting from any ideas, methods, instructions or products referred to in the content.