Article

Sustainable Ecological Restoration Planning Strategies Based on Watershed Scenario Simulation: A Case Study of the Wuhan Metropolitan Area

1
School of Architecture and Urban Planning, Huazhong University of Science and Technology, Wuhan 430074, China
2
Hubei Engineering and Technology Research Center of Urbanization, Wuhan 430074, China
3
The Key Laboratory of Urban Simulation for Ministry of Natural Resources, Wuhan 430074, China
*
Author to whom correspondence should be addressed.
Sustainability 2025, 17(23), 10524; https://doi.org/10.3390/su172310524
Submission received: 16 October 2025 / Revised: 14 November 2025 / Accepted: 20 November 2025 / Published: 24 November 2025

Abstract

Climate change is profoundly reshaping watershed hydrological regimes and threatening the sustainability of regional ecosystems, rendering traditional ecological restoration planning—primarily reliant on static baselines—insufficient to support long-term resilience under future environmental conditions. To enhance the sustainability of metropolitan ecological restoration, this study develops a climate-adaptive restoration framework for the Wuhan Metropolitan Area, structured around “climate scenario—hydrological simulation—zoning delineation—strategy formulation.” The framework aims to elucidate how projected hydrological shifts constrain the spatial configuration of ecological restoration. Under the RCP4.5 (Representative Concentration Pathway 4.5) scenario, the WEP-L (Water and Energy transfer Processes in Large river basins) distributed hydrological model was calibrated and validated using observed hydrological data from 2016–2020 and subsequently applied to simulate the spatiotemporal evolution of precipitation, evapotranspiration, runoff, and total water resources in 2035. Hydrological trend analyses were further conducted at the secondary watershed scale to assess the differentiated impacts of future hydrological changes across planning units. Based on these simulations, ecological sensitivity and ecosystem service assessments were integrated to identify priority restoration areas, forming a “five-zone × three-tier” sustainable restoration zoning system encompassing farmland restoration, forest ecological restoration, soil and water conservation restoration, river and lake wetland ecological restoration, and urban habitat improvement restoration, classified into general, important, and extremely important levels. A comprehensive “four-water” management scheme—addressing water security, water resources, water environment, and water landscape—was subsequently proposed to strengthen the sustainable supply capacity and overall resilience of metropolitan ecosystems. Results indicate that by 2035, hydrological processes in the Wuhan Metropolitan Area will exhibit pronounced spatial heterogeneity, with uneven changes in precipitation and runoff further intensifying disparities in regional water availability. These findings highlight the necessity of incorporating scenario-based hydrological constraints into sustainable ecological restoration planning. The proposed technical framework provides a transferable pathway for enhancing watershed ecosystem sustainability and resilience under climate change.

1. Introduction

The rapid expansion of the global economy and continuous population growth have markedly intensified the consumption of natural resources and imposed escalating pressures on the sustainability of ecological systems [1]. In China, the accelerated expansion of metropolitan areas—characterized by intensive land development, water pollution, and ecological degradation—has exerted profound impacts on the sustainability of regional ecosystems [2,3]. This human-induced ecological degradation has been further amplified under accelerating global climate change, evolving into a widespread environmental challenge that demands urgent attention.
Climate change not only alters the structure and function of urban ecosystems but also directly perturbs watershed hydrological processes. Water resources are a key element for urban sustainable development, while rivers serve as the lifeline that sustains ecosystem health [4]. Within metropolitan areas, water resources function as both fundamental support for human activities and as vital linkages for ecosystem operation [5]. The watershed, defined as a natural hydrological unit bounded by divides, integrates social, economic, and ecological attributes and exhibits remarkable geographical integrity [6]. Therefore, ecological restoration from a watershed perspective should emphasize the driving effects of climate change on hydrological processes [7].
Against this background, extensive research has been conducted on watershed hydrological simulation and ecological restoration under climate change conditions. Some studies have focused on improving model structure and calibration accuracy, emphasizing the spatiotemporal patterns of key variables such as precipitation, evapotranspiration, and runoff [8,9]. Others have explored the long-term impacts of climate change on watershed ecological functions and hydrological patterns from the perspectives of water resource regulation and ecosystem service assessment [10,11]. Among these models, the WEP-L (Water and Energy transfer Processes in Large river basins model) has been widely applied in representative watersheds across diverse climatic and geographical settings, owing to its ability to integrate natural hydrological cycles with anthropogenic water use processes, thereby revealing hydrological responses to climate forcing [12,13]. Relevant studies have demonstrated that the WEP-L model performs well across humid, arid, and cold climatic regions, effectively simulating the integrated impacts of climate change on hydrological processes. For instance, Jia et al. achieved an integrated simulation of large-scale hydrological and water-use processes in the Yellow River Basin [8]; Abebe et al. validated the model’s reliability under data-scarce and climatically uncertain conditions in the Upper Blue Nile Basin of Ethiopia [14]; and Dorjsuren et al. incorporated a freeze–thaw module in the Great Lakes Depression of Mongolia, improving runoff simulation accuracy in cold regions [15]. Collectively, these studies confirm the robustness and transferability of the WEP-L model across diverse climatic zones, providing a solid technical foundation for watershed hydrological process simulation and ecological restoration planning.
Nevertheless, existing studies on watershed ecological restoration still exhibit two major limitations: (1) most studies remain confined to static analyses of current conditions, lacking dynamic predictions based on scenario simulations, which makes it difficult to capture hydrological response processes under future climate change [16]; and (2) the delineation of restoration zones and the formulation of strategies often fail to adequately account for the feedback effects of runoff variation on ecosystem services, thereby constraining the scientific robustness of restoration planning [17]. In fact, the spatiotemporal variations of hydrological elements such as precipitation, evapotranspiration, and runoff derived from scenario simulations can intuitively reflect the response characteristics of ecosystems to climate forcing [18,19,20]. Therefore, incorporating predictive models under climate scenarios to elucidate the evolutionary trends of future ecological patterns from a hydrological process perspective represents an effective approach to enhancing the scientific basis of ecological restoration.
In this context, this study takes the Wuhan Metropolitan Area as a case study and constructs a watershed scenario simulation framework based on the WEP-L model. Following the research logic of “climate scenario—hydrological simulation—zoning delineation—strategy formulation,” it addresses the following scientific questions:
(1)
What are the hydrological characteristics of secondary watersheds in the Wuhan Metropolitan Area during 2016–2020, and can the WEP-L model accurately reproduce the historical hydrological processes?
(2)
Under the RCP4.5 climate scenario, how will the key hydrological components—precipitation, evapotranspiration, runoff, and water resources—change by 2035?
(3)
How can the restoration zoning system derived from the simulation results support ecological restoration planning for the metropolitan area and facilitate the development of restoration strategies adaptive to multiple climate scenarios?
By addressing the above questions, this study aims to establish a watershed-based scenario simulation framework for metropolitan ecological restoration planning. It seeks to elucidate the response mechanisms of ecosystems to climate change from a hydrological process perspective, thereby providing scientific support for climate-adaptive and sustainability-oriented ecological spatial governance.

2. Materials and Methods

2.1. Study Area

The Wuhan Metropolitan Area is located in the central-eastern part of Hubei Province, within the middle reaches of the Yangtze River (112°33′–115°30′ E, 29°39′–31°50′ N), covering a total area of approximately 25,300 km2 [21]. The topography generally slopes from west to east, with low mountains and hills in the west at elevations of around 100 m, and plains and lake areas in the east mostly below 30 m. The metropolitan area encompasses Wuhan, Ezhou, the urban districts of Huangshi, parts of Huanggang, Xiaogan, Xianning, and surrounding counties, forming a networked metropolitan structure centered on Wuhan as the core city with multiple secondary centers. Wuhan lies at the confluence of the Yangtze and Han Rivers, serving as the hydrological and transportation hub of the region. The region exhibits a distinct “two rivers and one plain” natural pattern: the Yangtze River and Han River constitute the two major waterways, while the Jianghan Plain forms the extensive alluvial lowland. The area is characterized by dense lakes and well-developed river networks, creating a typical riverine plain landscape (Figure 1) [22].
The Wuhan Metropolitan Area experiences a subtropical monsoon climate characterized by four distinct seasons. Influenced by the East Asian monsoon, the region experiences hot and rainy summers and cold, dry winters. Precipitation is mainly concentrated between May and September, with a pronounced plum-rain season. The mean annual temperature ranges from 17 °C to 19 °C, with extremes reaching up to 43 °C and as low as −10 °C. The region is endowed with abundant water resources, featuring numerous rivers and lakes. In Wuhan alone, the water area covers 2189.89 km2, including 165 rivers longer than 5 km and 166 officially designated blue-line lakes [23]. The complex hydrological network and high climatic sensitivity make the Wuhan Metropolitan Area a representative case for studying runoff dynamics and ecological restoration planning under climate change scenarios.

2.2. Data and Processing

The datasets used in this study are categorized into four types: geographic information data, meteorological data, hydrological data, and water-use data. The geographic information data include elements such as watershed boundaries, administrative divisions, digital elevation model (DEM), flow station locations, river system data, reservoir distribution, land use, leaf area index (LAI), vegetation coverage, and soil types. These datasets were primarily obtained from the National Geospatial Information Resource Catalog Service System [24] and the Resource and Environmental Science Data Center of the Chinese Academy of Sciences [25]. The meteorological data, including station information, precipitation, wind speed, sunshine duration, and relative humidity, were sourced from the National Meteorological Information Center [26]. The hydrological data consist of observed flow records extracted from the China Hydrological Yearbook [27]. The water-use data include agricultural and industrial and domestic water use data, derived from regional Water Resources Bulletins [28]. Detailed data sources are listed in Table 1.
The observation period (2016–2020) was strategically selected based on several considerations. First, it aligns with China’s 13th Five-Year Plan period, ensuring consistency in policy context and enhancing the comparability of the research findings. Second, daily meteorological records from 21 stations during this timeframe exhibit the highest data quality, with temporal continuity exceeding 95%, thereby providing robust support for the calibration and validation of the WEP-L model. Third, this interval encompasses several representative extreme hydroclimatic events that occurred in the past three decades—most notably, the severe flooding in 2016 and the pronounced drought in 2020—capturing the primary modes of regional climate variability. To mitigate the potential climatic bias associated with a relatively short observation window, the representativeness of the 2016–2020 dataset was evaluated against the long-term statistical characteristics of the 1990–2020 meteorological series, including climatological means and extreme-value ranges, and further supported with findings from relevant literature [32]. This assessment ensured the reliability and applicability of the model’s input data.
The data files are categorized into GIS data and other data. All GIS data must be projected using the Krasovsky_1940_Albers projection; other data files should be in CSV format. Before importing into the WEP-L software (version 1.0.5), the relevant data need to undergo basic processing to meet the precision and requirements of WEP-L. The obtained GIS data were processed using ArcGIS 10.5 software [33], including projection conversion, clipping, and reclassification tools. Other data were formatted and adjusted according to the requirements of the WEP-L software. The main processing steps are as follows:
(1)
DEM Resampling
To ensure consistency with the spatial scale of the model’s computational units, the original DEM data with a 30 m × 30 m resolution were resampled to a uniform grid of 250 m × 250 m.
(2)
Soil Type Data Processing
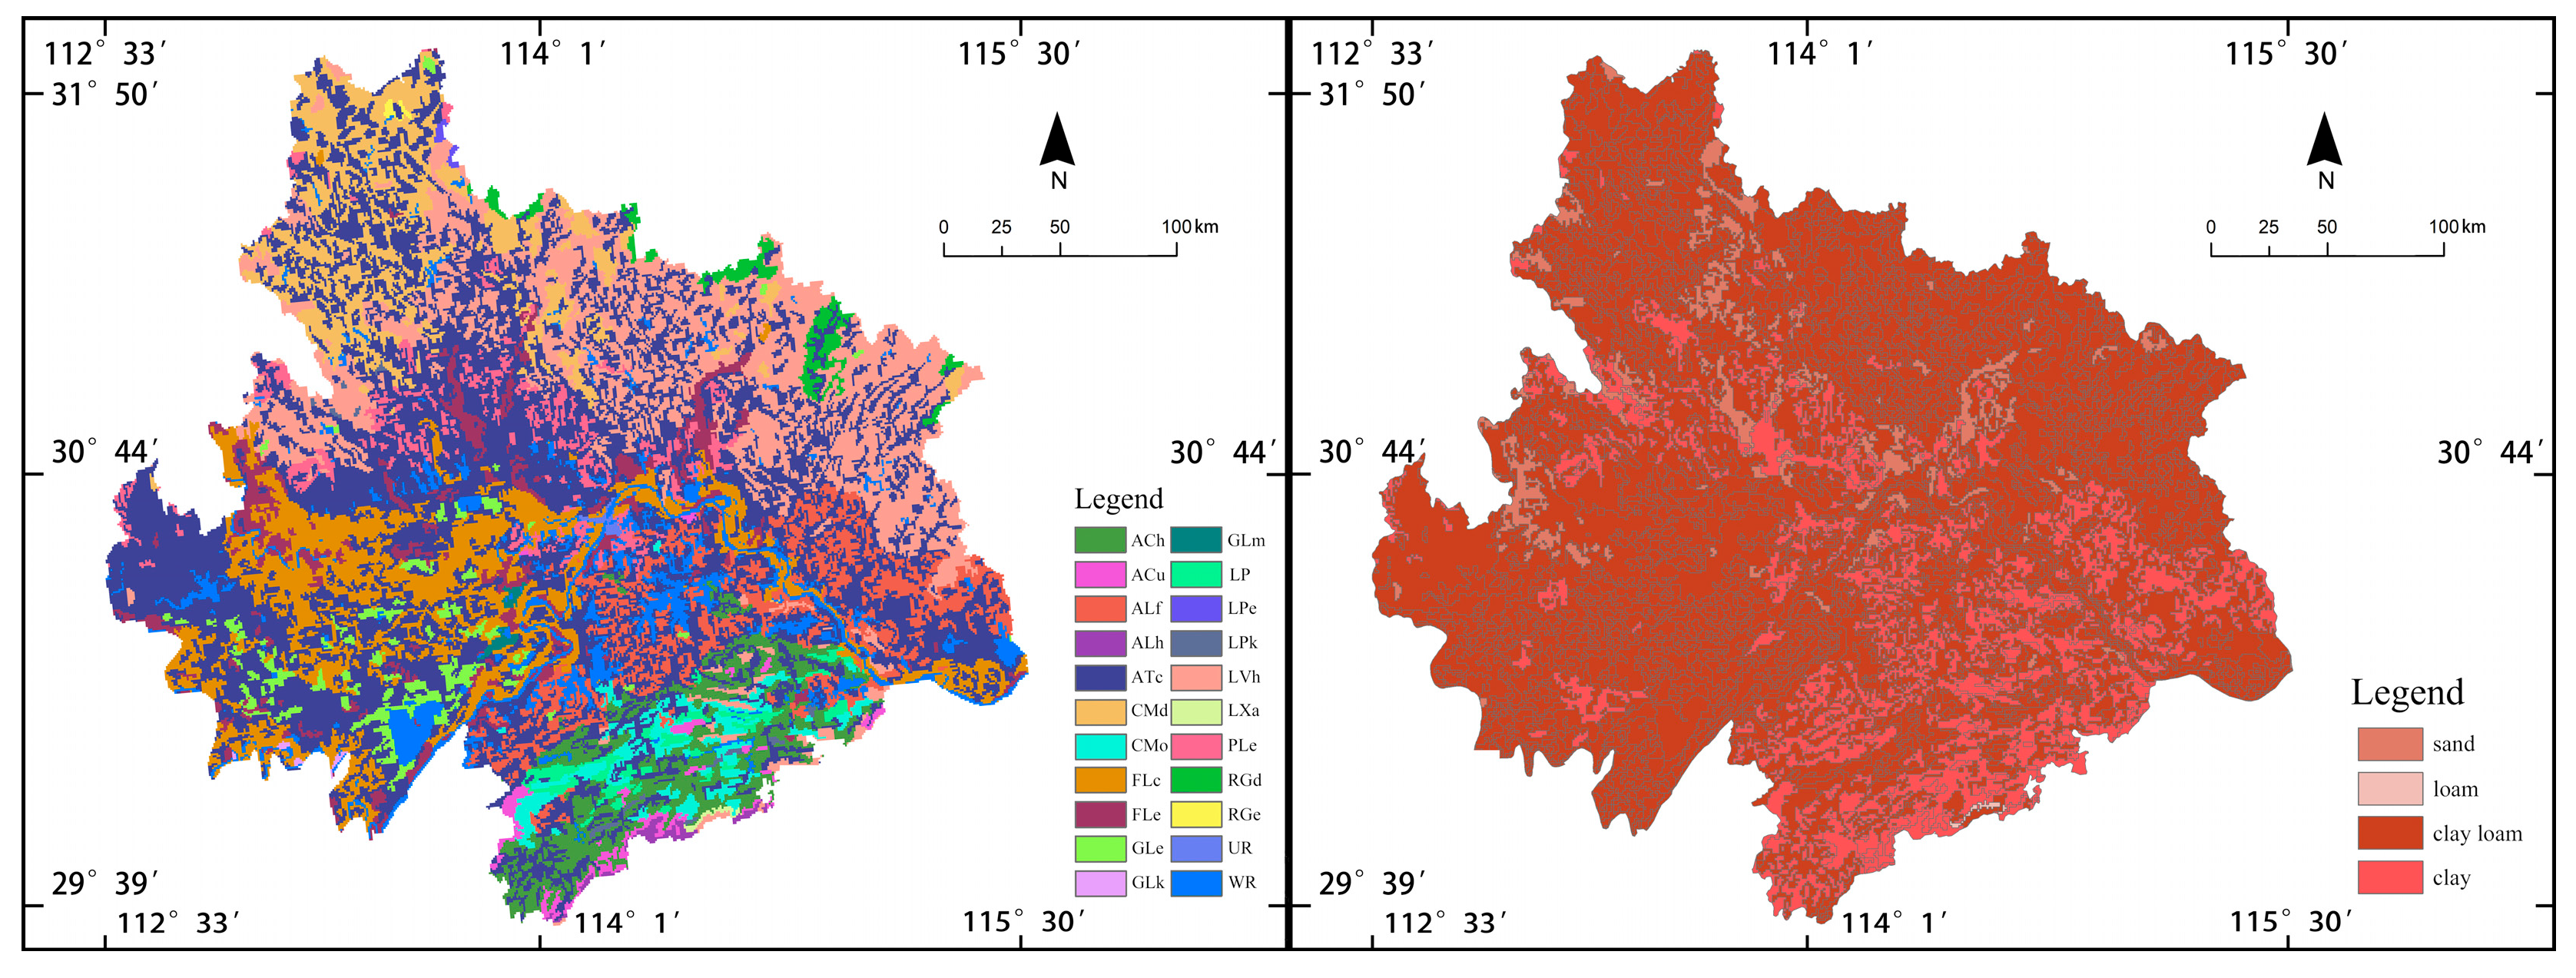
The soil data used in this study were sourced from the Resource and Environmental Science Data Center of the Chinese Academy of Sciences [25]. In the WEP-L model, the soil was categorized into four types based on texture: sand, loam, clay loam, and clay, each assigned a specific code. The data were reclassified, and the attribute table was modified to correspond to the respective codes. As shown in Figure 2, codes 11, 21, 31, and 41 correspond to sand, loam, clay loam, and clay, respectively. The main soil types in the study area are clay loam and clay.
(3)
Land Use Data Processing
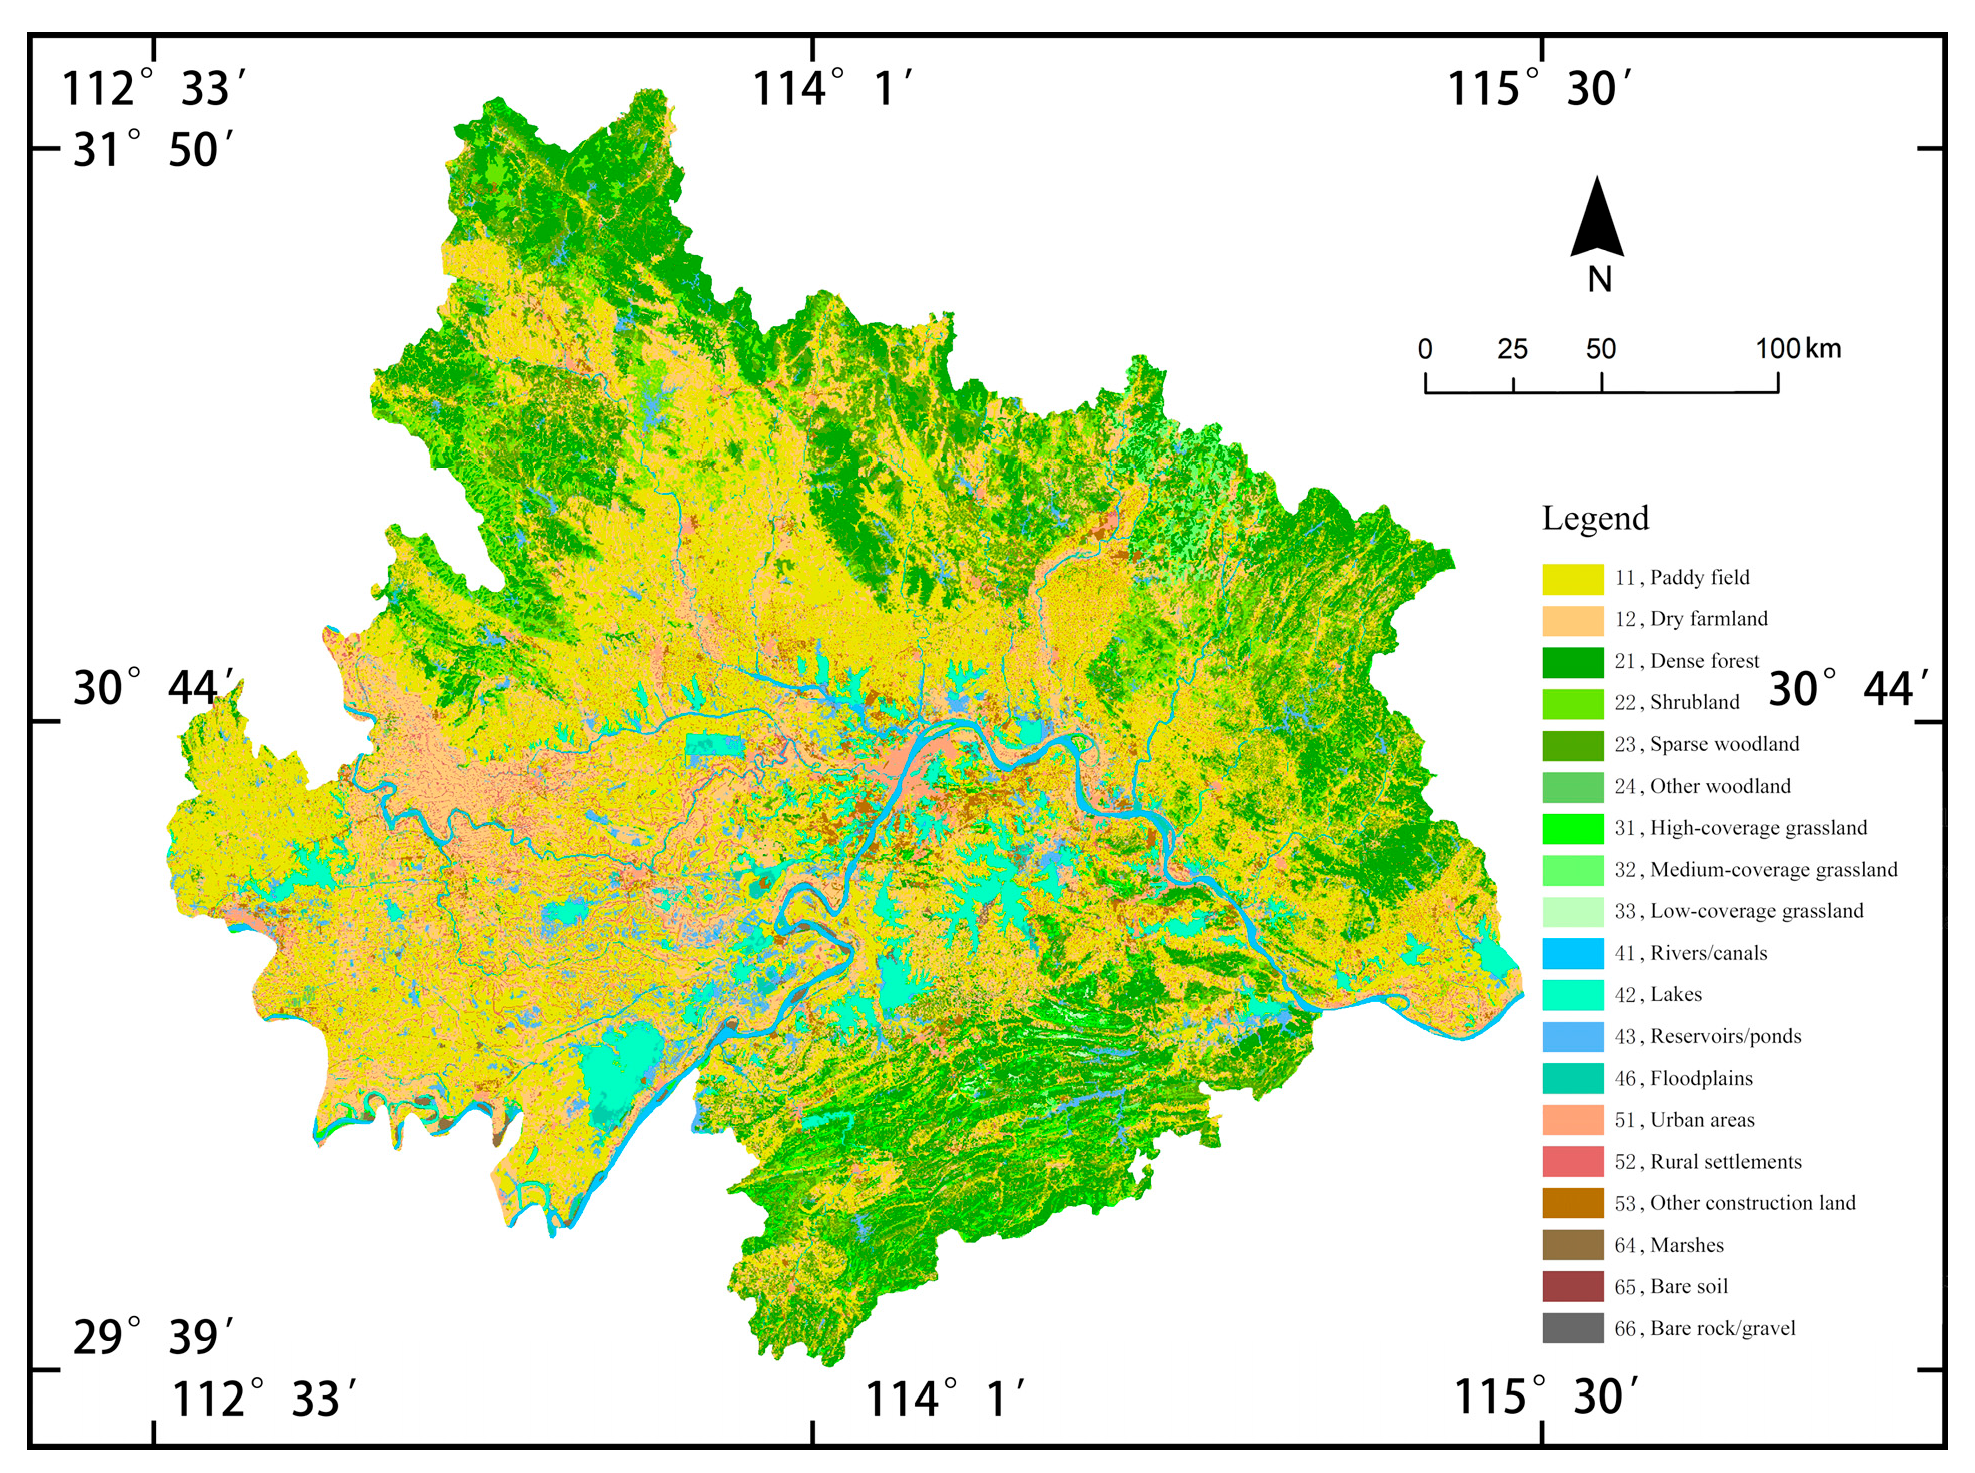
This study used land use data from 2020 [25] and converted the original classification codes into the lucc fields recognizable by the WEP-L model, as shown in Figure 3.
(4)
Vegetation Coverage and Leaf Area Index Data Processing
The study used 2020 MODIS NDVI and LAI remote sensing data [31]. Based on the original data, the monthly average for each watershed unit was calculated individually. The values range between 0 and 1, representing the vegetation coverage and leaf area index for each of the 12 months.
(5)
Meteorological and Hydrological Data Processing
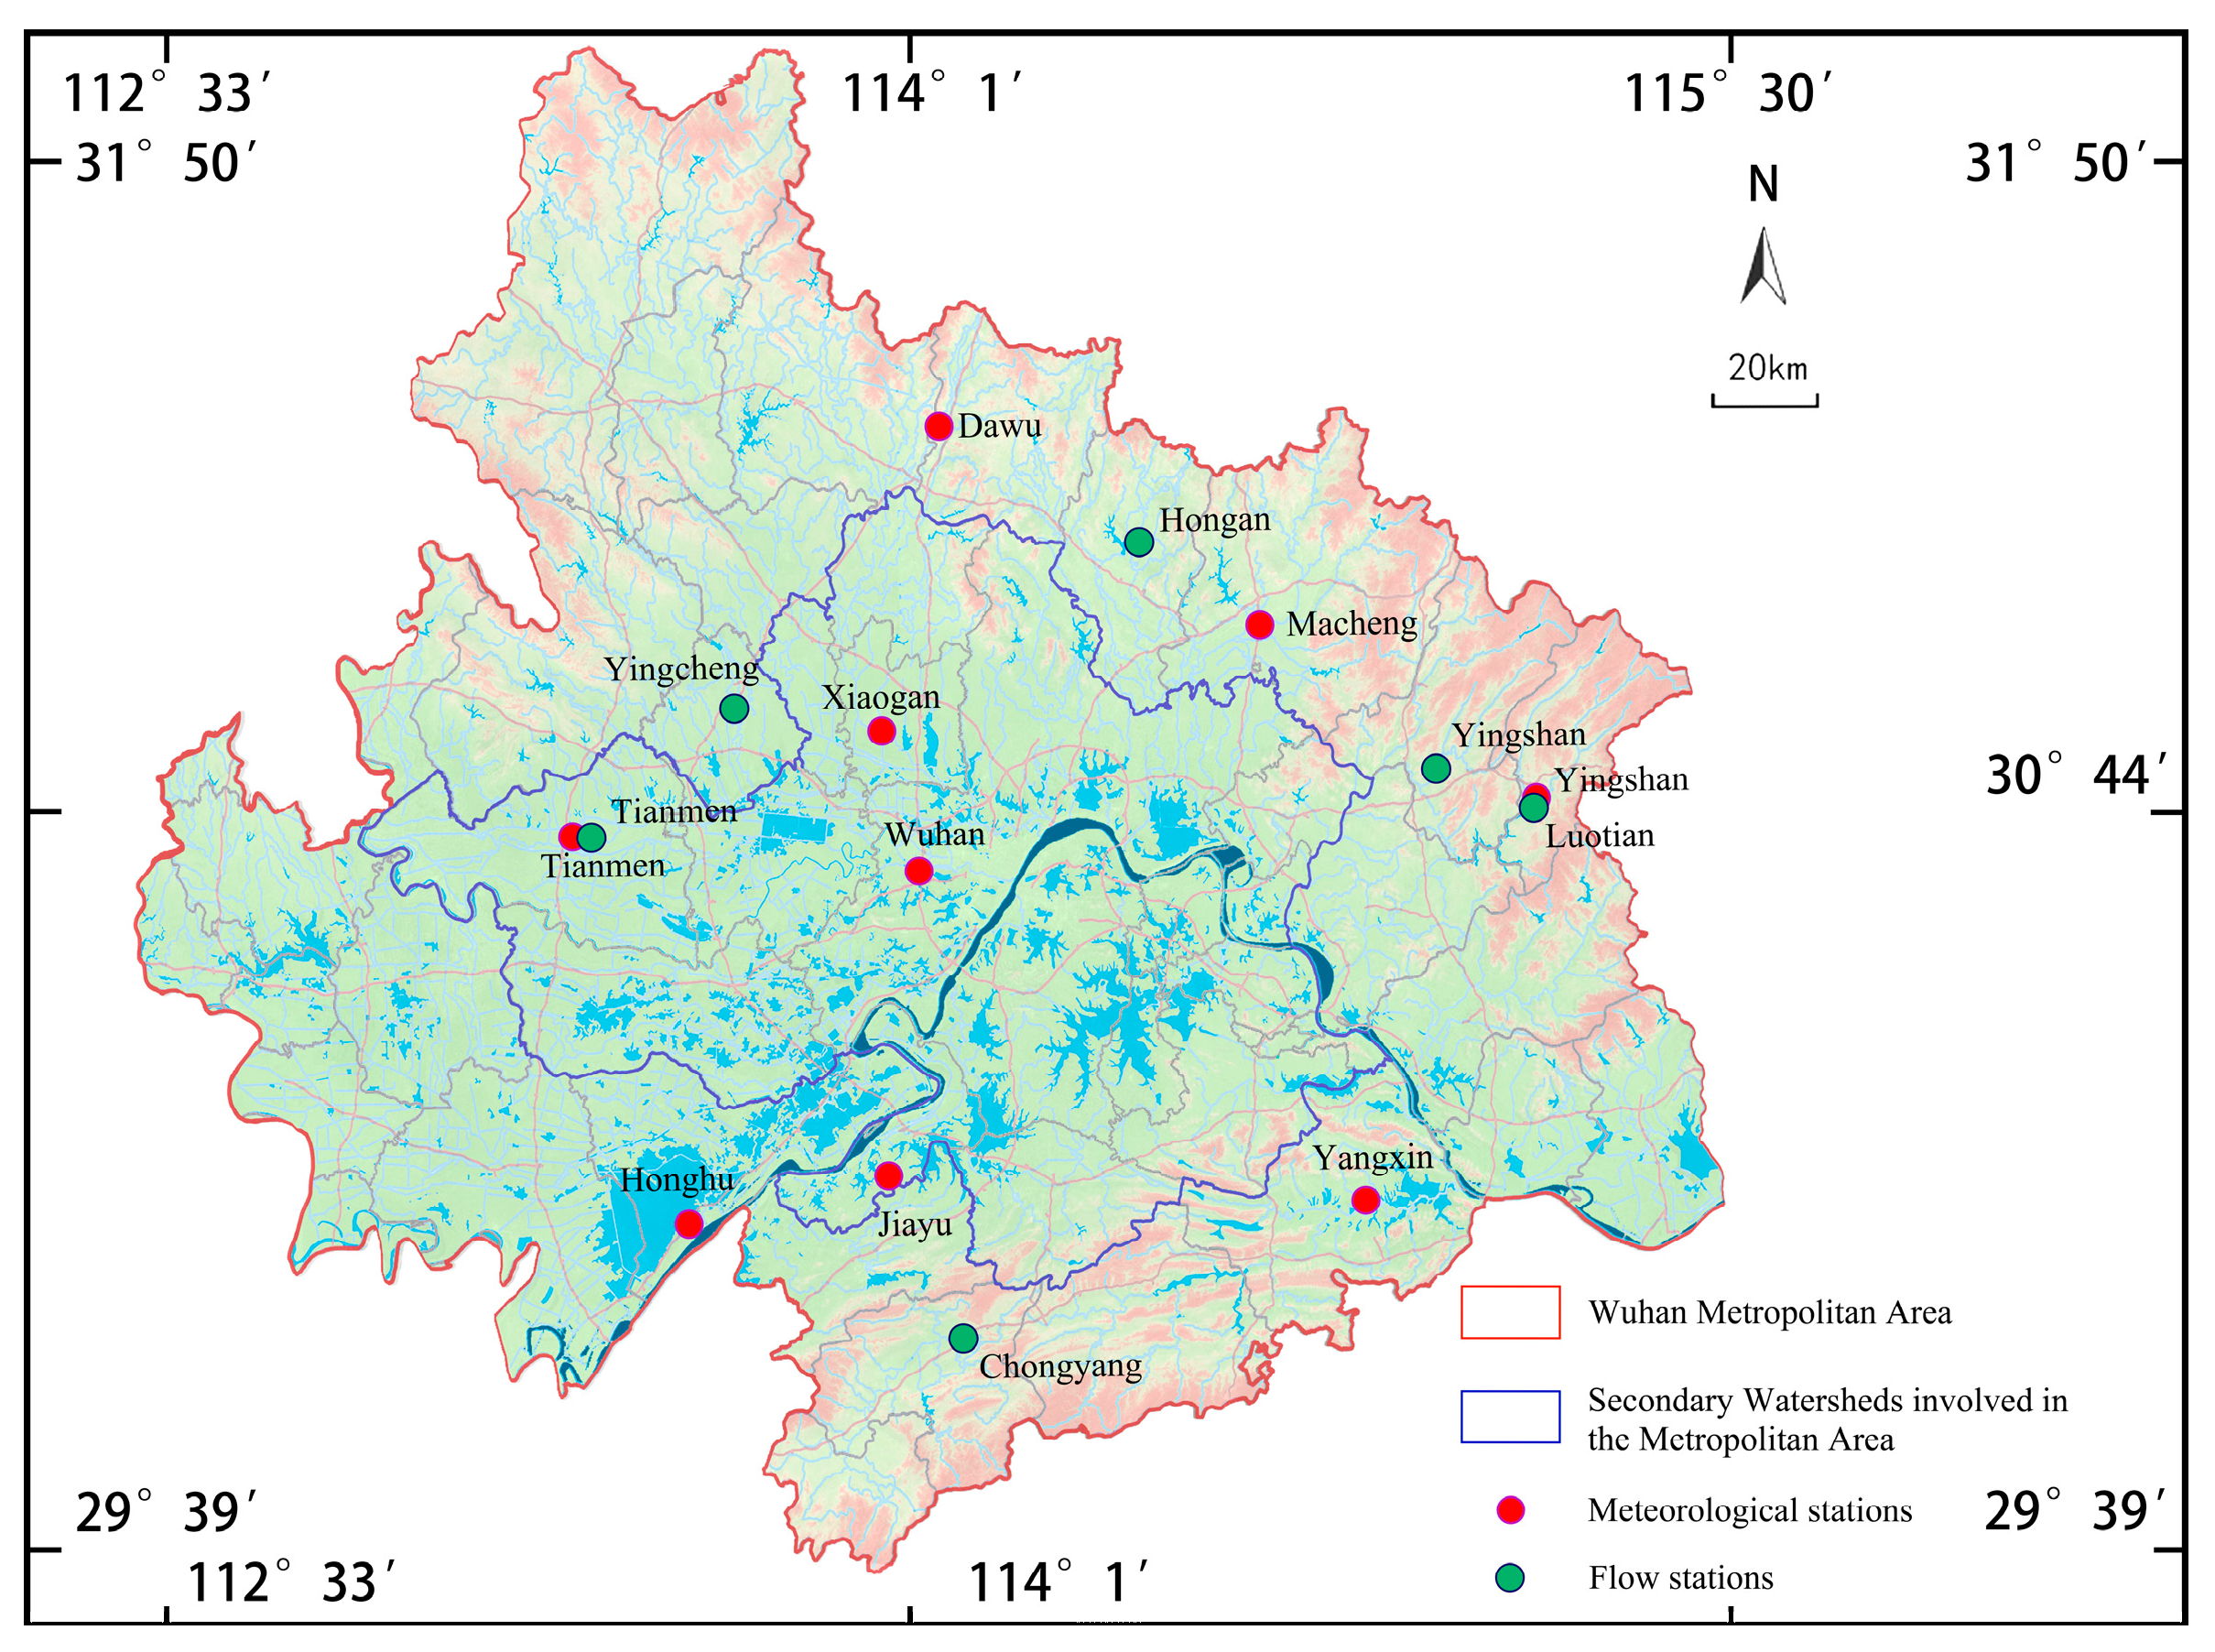
This study collected daily meteorological data for precipitation, temperature, relative humidity, sunshine duration, and wind speed from nine meteorological stations (Table 2, Figure 4) within the study area for the years 2016–2020 [26]. Additionally, daily flow data from six flow stations were collected for the same period (Table 3, Figure 4) [27].
(6)
Water Use Data Processing
Agricultural water use primarily includes information on irrigation areas and water usage [28], with surface and groundwater usage categorized as “paddy fields,” “irrigated land,” “forest land,” “grassland,” and “fish ponds.” Industrial and domestic water use includes water consumption for industry and living, with surface, groundwater, and transferred water categorized as “industrial,” “urban domestic,” and “rural domestic.” The area unit is km2, and the water usage unit is 10,000 m3.

2.3. Methodology

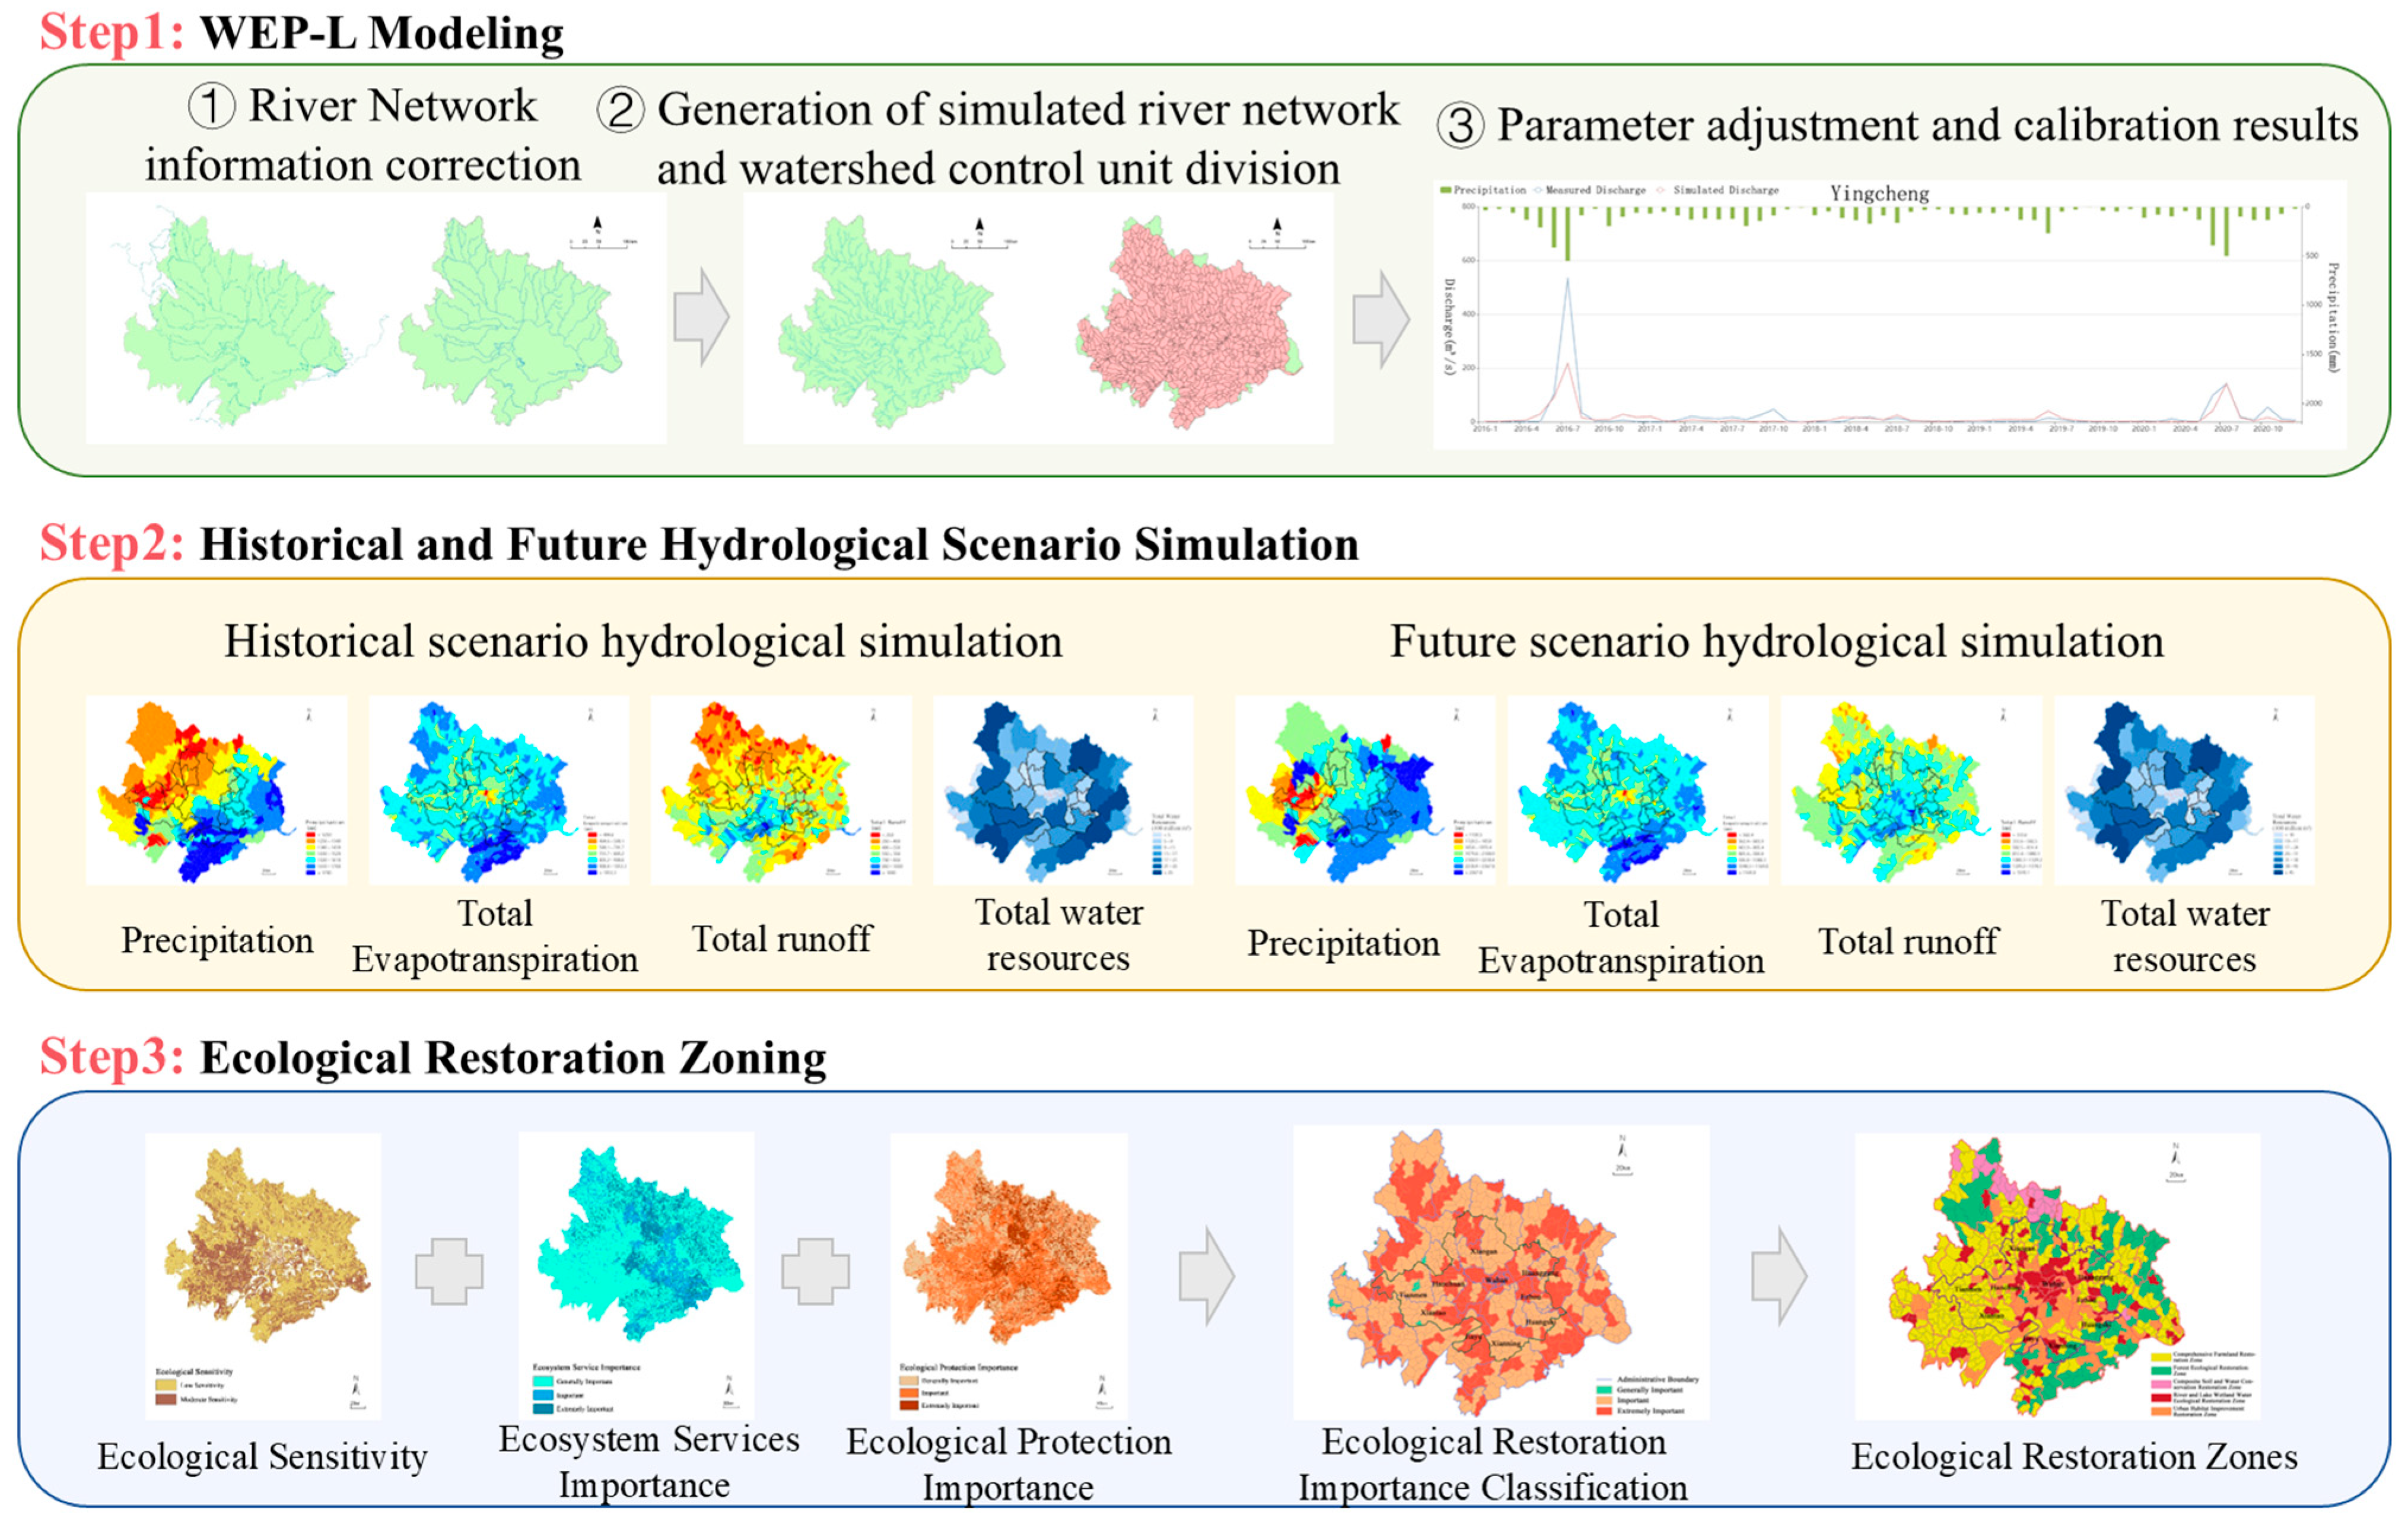
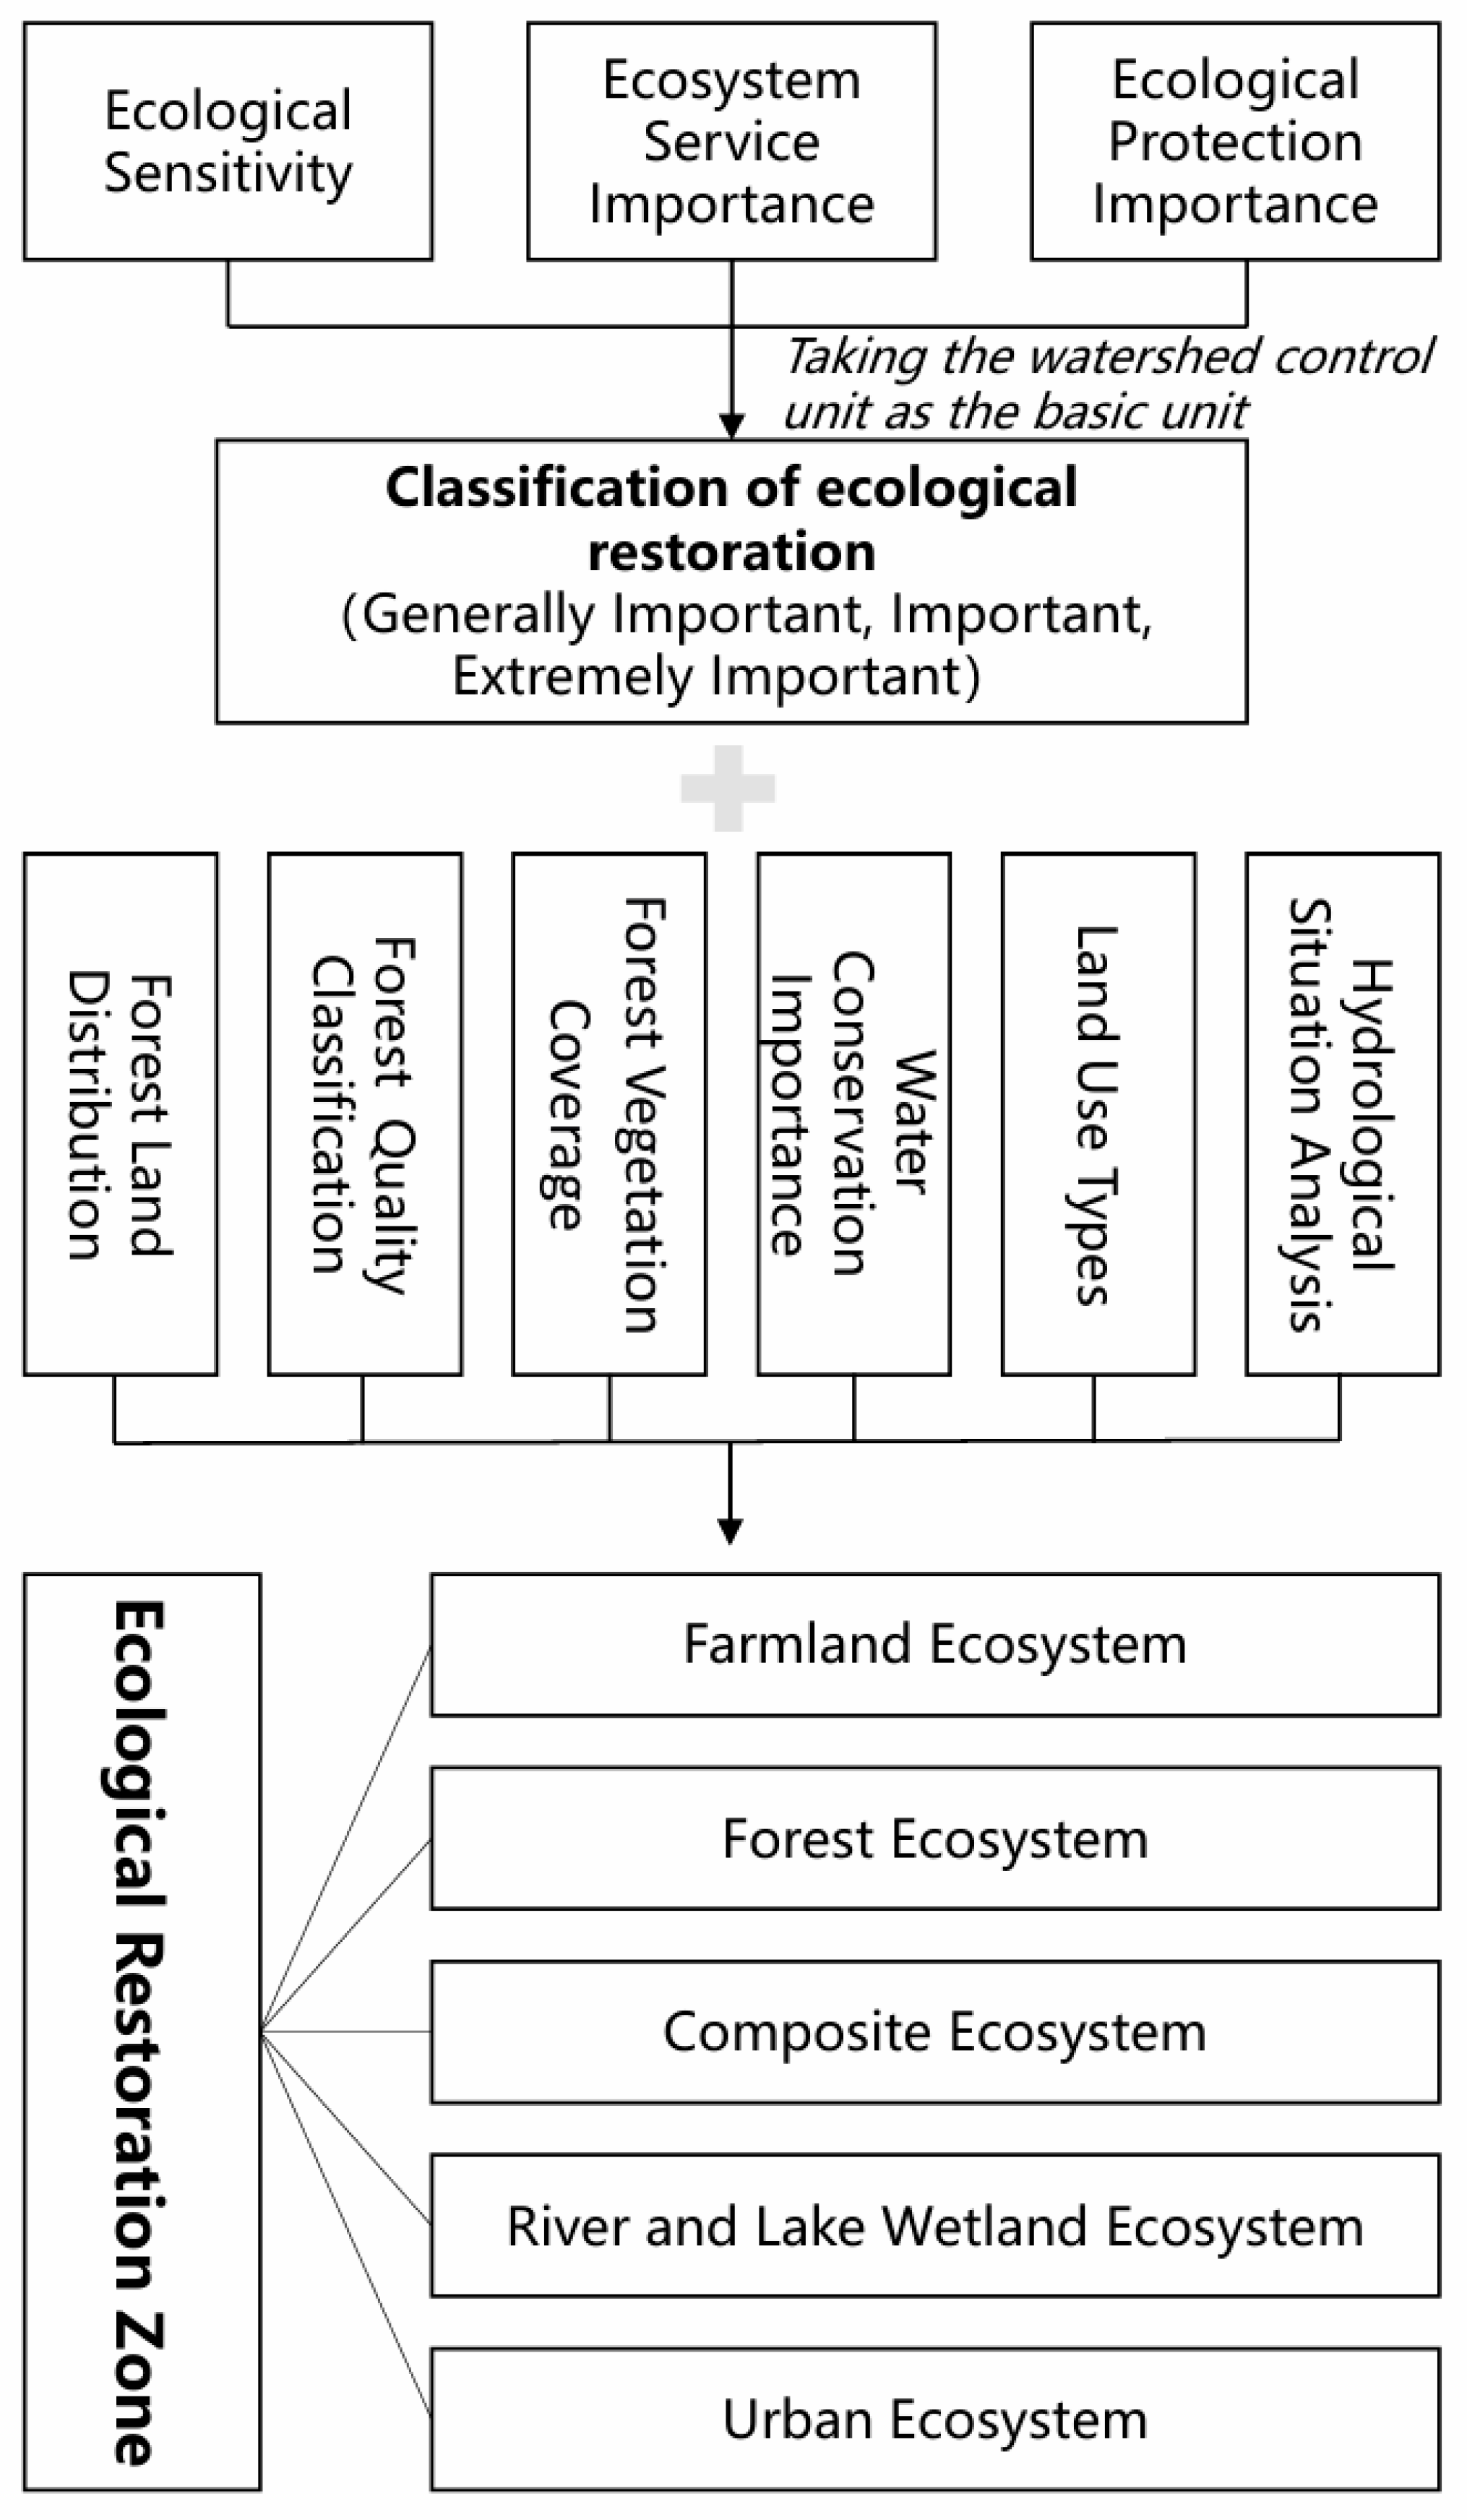
The figure below illustrates the overall workflow of the ecological restoration planning framework developed using the WEP-L model (Figure 5). The study consists of three major stages. First, the WEP-L model was constructed by correcting river network information, generating the simulated river network, delineating watershed control units, and calibrating and validating model parameters using observed runoff data. Second, historical and future hydrological scenarios were simulated using the calibrated model to characterize spatial variations in precipitation, evapotranspiration, runoff, and water resources under different climate conditions, thereby revealing the impacts of climate change on hydrological processes. Third, hydrological outputs were integrated with indicators of ecological sensitivity, ecosystem service importance, and ecological conservation priority to classify ecological restoration importance and delineate restoration zones. This process established a hydrology-driven methodological system for ecological restoration planning.

2.3.1. WEP-L Model

In previous large-scale ecological restoration studies, analyses were typically grounded in landscape ecology frameworks or ecological factor-based assessments, frequently employing models such as the minimum cumulative resistance model, gravity model, and the Pressure–State–Response (PSR) framework [34]. These approaches primarily produce spatial zonation or restoration pattern maps to inform macro-level strategies. However, they provide limited support for planning across administrative boundaries and cannot simulate future water-cycle scenarios, making them insufficient for ecological restoration at the watershed scale of metropolitan areas.
This study employed the distributed hydrological model WEP-L to simulate runoff, delineate control units, estimate available water resources, and assess flood-related water security within the study area, thereby providing quantitative support for integrated watershed management. WEP-L (Water and Energy transfer Processes in Large River Basins) was originally developed under a national key basic research program and has become one of the most widely used distributed hydrological models for large river basins [35]. It integrates meteorological drivers, land-surface conditions, human activities, and hydraulic engineering interventions, enabling coupled simulation of the “natural–social” dual water-cycle processes and quantitative characterization of the spatiotemporal dynamics of key hydrological components [36]. Since its initial development in 1995, the model has been continuously refined, now incorporating functions such as inter-regional water-resource allocation, water-quality and ecohydrological simulation, and future scenario analysis. Its performance has been validated across multiple regions in China [37,38].
The WEP-L model’s simulation methods involve simulating various elements of the water cycle system, energy cycle processes, and aerodynamic resistance and vegetation community resistance [39].
The Penman formula is used to calculate the evaporation over water surfaces in the basin ( E w ) [40]:
E w = R N G + ρ a C p δ e / r a λ + γ
γ = C p P 0.622 λ
where R N is the net radiation; G is the heat flux into the water; ∆ is the slope of the saturation vapor pressure curve; ρ a is air density; C p is specific heat of air at constant pressure; δ e is the difference between vapor pressure and saturation vapor pressure; r a is aerodynamic resistance of the evaporative surface; λ is the latent heat of vaporization; P is atmospheric pressure; γ is the psychrometric constant.
The Noihan-Planton ISBA model is used to calculate the interception evaporation from vegetation ( E i ) [41]:
E i = V e g δ E p
W r t = V e g P E i R r
R r = 0 ,     W r W r m a x W r W r m a x ,     W r > W r m a x
δ = W r / W r m a x 2 / 3
W r m a x = 0.2 V e g L A I
where V e g is the vegetation cover fraction; δ is the fraction of wet leaf area to total leaf area; E p is the potential evaporation; W r is the intercepted water by vegetation; P is precipitation; R r is the runoff from vegetation; W r m a x is the maximum interception storage; L A I is the leaf area index.
The Penman–Monteith formula is used to calculate the evapotranspiration from vegetation [42]:
E t r = V e g 1 δ E P M
E P M = R N G + ρ a C p δ e / r a λ + γ 1 + r c / r a
where G is the heat flux into the vegetation; r c is the canopy resistance.
The multi-layer Green-Ampt model is used to calculate rainfall infiltration.
According to rainfall intensity, Horton’s infiltration excess runoff ( R 1 i e ) is used [43]:
H s v t = P E s v f s v R 1 i e
R 1 i e = 0 ,     H s v H s v m a x H s v H s v m a x ,     H s v > H s v m a x
where P is precipitation; H s v is the depression storage in bare land-vegetation area; H s v m a x is the maximum depression storage depth; E s v is evapotranspiration; f s v is the soil infiltration capacity calculated by the general Green-Ampt model.
Saturation excess runoff is calculated in layers for surface runoff [44]:
  • Surface depression storage layer
    H s t = P 1 V e g 1 V e g 2 + V e g 1 R r 1 + V e g 2 R r 2 E 0 Q 0 R 1 s e
    R 1 s e = 0 ,     H s H s v m a x H s v H s v m a x ,     H s > H s v m a x
  • Surface soil layer
    θ 1 t = 1 d 1 Q 0 + Q D 12 Q 1 R 21 E s E t r 11 E t r 12
  • Middle soil layer
    θ 2 t = 1 d 2 Q 1 + Q D 23 Q D 12 Q 2 R 22 E s E t r 12 E t r 22
  • Bottom soil layer
    θ 3 t = 1 d 3 Q 2 Q D 23 Q 3 E t r 13
    Q i = k j θ j j : 1 3
    Q 0 = min k 1 θ S , Q 0 m a x
    Q 0 m a x = W 1 m a x W 10 Q 1
    Q D j , j + 1 = k ¯ j , j + 1 φ j θ j φ j + 1 θ j + 1 d j + d j + 1 / 2 j : 1 ,   2
    k ¯ j , j + 1 = d j × k j θ j + d j + 1 × k j + 1 θ j + 1 d j + d j + 1 j : 1 , 2
    where H s is the depression storage; H s v m a x is the maximum depression storage; V e g 1 and V e g 2 are the area ratios of high and low vegetation in the bare land-vegetation area; R r 1 and R r 2 are the water amounts from the high and low vegetation leaves to the surface; Q is gravitational drainage; Q D j , j + 1 is the water diffusion between the j -th and ( j + 1 )-th soil layers due to capillary pressure; E 0 is the evaporation from depression storage; E s is the surface soil evaporation; E t r is the vegetation transpiration (the first subscript 1 indicates high vegetation, 2 indicates low vegetation; the second subscript indicates soil layer number); R 2 is the interflow; k θ is the hydraulic conductivity corresponding to the volumetric water content θ ; φ θ is the capillary pressure corresponding to the volumetric water content θ ; d is the soil layer thickness; W is the soil water storage; W 10 is the initial soil water storage in the surface layer. Subscripts 0, 1, 2, and 3 represent the depression storage layer, surface soil layer, second soil layer, and third soil layer, respectively. For detailed simulation process, see reference.
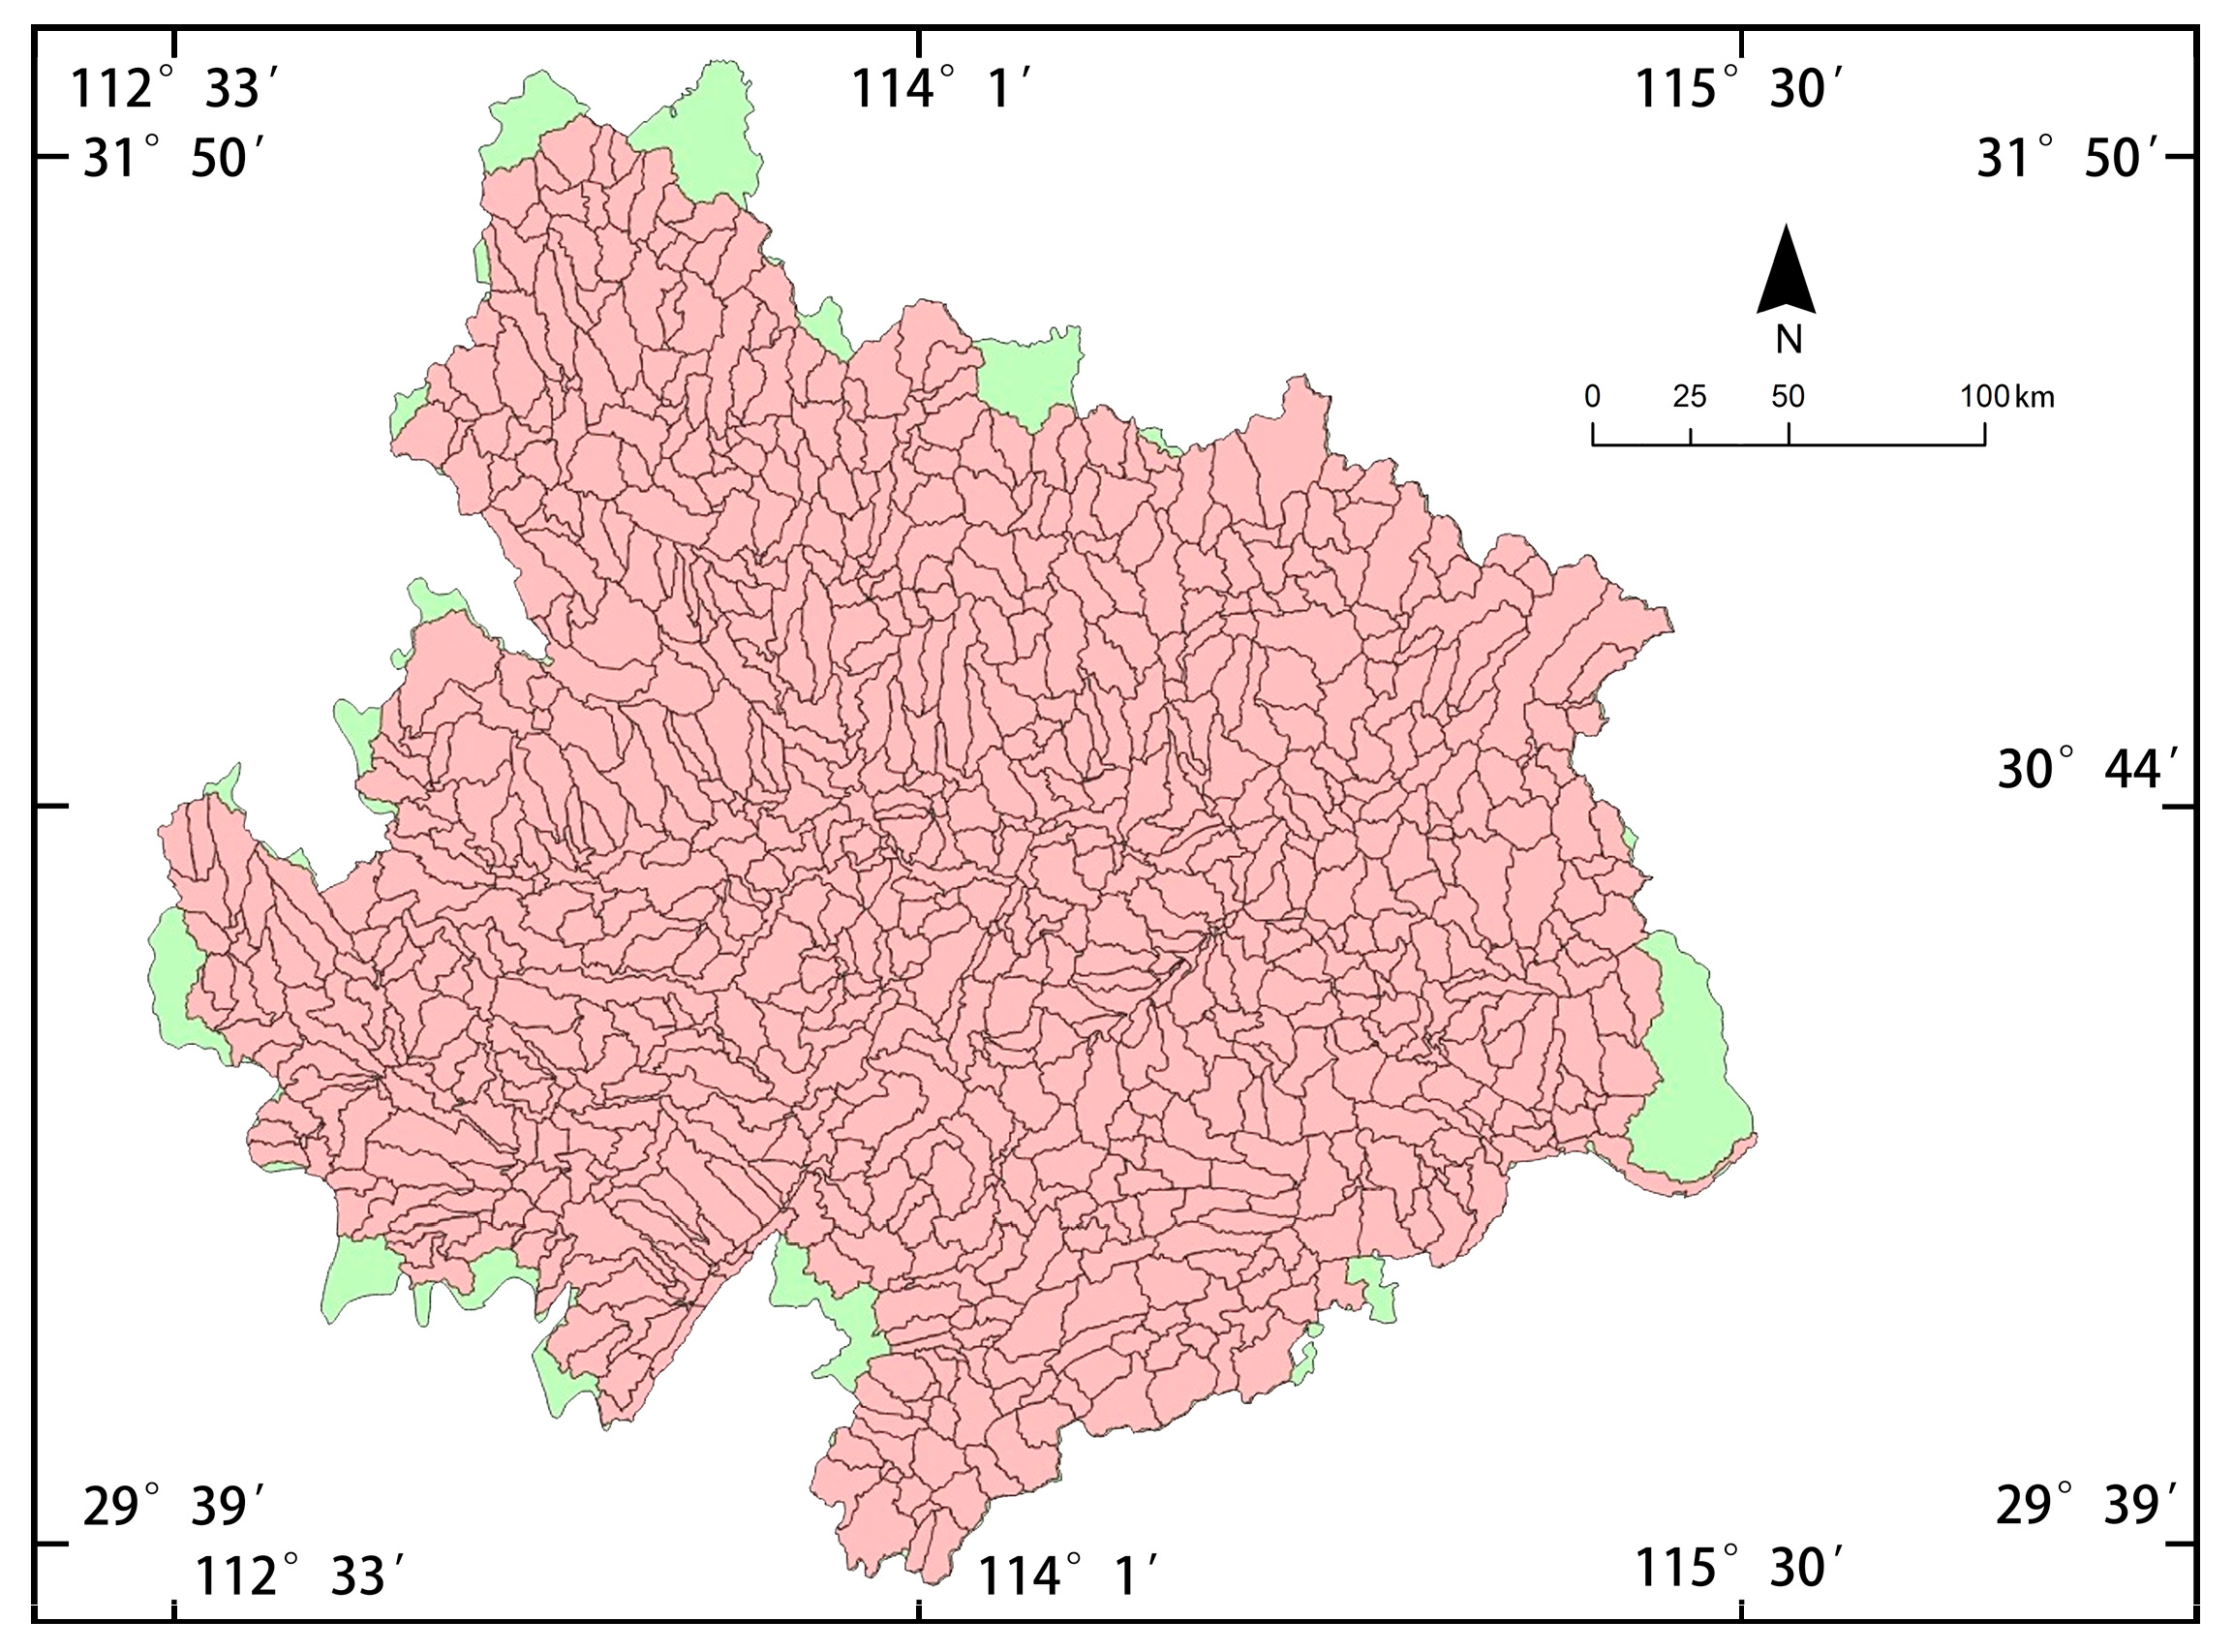
To enhance simulation accuracy, this study adopted a “stepwise modeling” approach in the WEP-L framework, involving river-network correction, simulated river-network generation, and the delineation of watershed control units. Using DEM data, the actual river network was corrected to generate a model-compliant dendritic structure. Elevation bands were then used as the basic computational units to partition the watershed into 874 control units (Figure 6).
The WEP-L model was subsequently calibrated and validated using monthly runoff observations from the Yingcheng Hydrological Station for 2016–2020. The calibration was performed under a dual water-cycle setting that incorporates both agricultural and industrial–domestic water use. Because of the strong coupling among model parameters and limited observational constraints for some variables, automated optimization algorithms are prone to local minima. Therefore, a manual “trial-and-adjust” procedure was adopted, a method widely used in WEP-L and other distributed hydrological models [35,36]. The key calibrated parameters included aquifer thickness, evapotranspiration coefficients, channel roughness, soil hydraulic conductivity, and the critical rainfall threshold for storm runoff generation. These parameters were adjusted within ±10–20% of documented or observed ranges. The optimization targeted minimizing relative error (RE) and maximizing the coefficient of determination (R2), resulting in a physically consistent and robust calibration scheme.
(1)
Relative Error
D v = F F 0 / F 0
In the formula: D v is the relative error; F 0 is the simulated average runoff; F is the observed average runoff.
(2)
Correlation Coefficient
ρ x y = C o v x , y D x D y
In the formula: ρ x y is the correlation coefficient; C o v x , y is the covariance between x and y; D x and D y are the variances of x and y, respectively.
These evaluation metrics ensured that the model realistically reproduced the runoff dynamics of the study area during the calibration stage, thereby establishing a reliable foundation for subsequent climate-scenario simulations.

2.3.2. Scenario Setting

In recent years, global climate change and rapid urbanization have led to various water security issues, such as water scarcity, water pollution, flooding, and droughts, threatening human daily life. On the other hand, climate warming also directly affects the spatial and temporal distribution characteristics of the water cycle processes and elements [45,46]. In 2013, the Intergovernmental Panel on Climate Change (IPCC) released its Fifth Assessment Report, indicating that future climate change predictions mainly rely on the results of the Fifth Phase of the Coupled Model Intercomparison Project (CMIP5) [47]. CMIP5 proposed four “Representative Concentration Pathways” (RCPs) scenarios: RCP 2.6 (low greenhouse gas emission scenario), RCP 4.5 (medium emission scenario), RCP 6.0 (medium-high emission scenario), and RCP 8.5 (high emission scenario) [47,48]. The RCP 4.5 scenario describes a situation where governments implement policies to intervene in climate change, with the global population peaking at 9 billion and then gradually decreasing, continued economic growth, and appropriate attention to ecological protection. This scenario assumes that the growth of global greenhouse gas emissions will slow down over the next few decades, peak around the middle of this century, and then gradually decrease [49]. This scenario aligns well with China’s current policies and socio-economic development aimed at addressing climate change. Therefore, this study selects the RCP 4.5 scenario for simulation to realistically present the hydrological scenario of the study area in 2035.
Due to differences in geographical location and topographical features, the temperature and precipitation in the study area may be affected in varying degrees. Based on the monthly temperature and precipitation data from 104 meteorological stations in central China from 1961 to 2020, Cheng et al. studied the spatial and temporal variation characteristics of temperature and precipitation in central China using methods such as linear regression, cumulative anomaly, Mann–Kendall mutation test, Morlet wavelet analysis, and inverse distance weighting (IDW) interpolation [50]. The results showed that the annual average temperature in central China exhibited an upward trend during the study period, with an increase rate of 0.23 °C/10 years. The annual precipitation showed a fluctuating upward trend at a rate of 1.24 mm/10 years. Spatially, the annual average temperature generally increased from south to north. The regional distribution of annual precipitation was uneven, showing an increasing trend from northwest to southeast. Combining the research of Cheng et al. [50] with the RCP 4.5 medium emission scenario, the climate change scenario for 2035 is set as follows:
The future temperature rise rate is 0.19 °C per decade, resulting in a total increase of 0.285 °C by 2035; the precipitation increase rate is 1.26 mm per decade, resulting in a total increase of 1.86 mm by 2035.

2.3.3. Ecological Restoration Zoning

Based on hydrological scenario simulations, this study uses ArcGIS to perform spatial identification of land ecological elements, evaluation of ecosystem service importance, and ecological sensitivity assessment in the study area. By overlaying comprehensive analyses and incorporating key water systems and green corridors, the ecological restoration zones of the Wuhan Metropolitan Area were delineated.
The spatial pattern of ecological restoration is derived from the overlay of comprehensive analyses of ecological sensitivity and ecological importance [33]. Ecological sensitivity refers to the ability of ecosystems to respond to the combined effects of internal and external factors, and is used to assess the adaptability and stability of ecosystems in response to environmental change, thus reflecting the extent to which ecological imbalances and environmental problems may occur [51,52]. Ecological value assessment involves analyzing the core attributes of ecosystem elements to evaluate their capacity to provide services and maintain ecological processes. This helps to reveal the spatial distribution and differences of ecosystem services, and to identify key areas for ecological services for protection and management [53,54].
Based on the division of watershed control units, spatial overlay is performed by integrating the evaluations of ecological sensitivity, ecosystem service importance, and ecological protection importance, resulting in the grading of ecological restoration importance in the study area. Subsequently, the spatial distribution of land ecological elements (including forest land distribution, forest quality classification, forest vegetation coverage, and water conservation importance) is further identified. The study area is then divided into ecological restoration zones covering the entire metropolitan area, ultimately forming a zoning system. The specific process is shown in Figure 7.

3. Results

3.1. Calibration Results

After calibration and validation for the 2016–2020 period, the model achieved a Nash–Sutcliffe efficiency (NSE) of 0.64, a relative error of −7.68%, and a correlation coefficient (R2) of 0.91 (Figure 8). These results indicate that the model provides satisfactory accuracy in simulating runoff, meets the predefined performance criteria, and is suitable for runoff prediction under different climate scenarios.

3.2. Overall Simulation

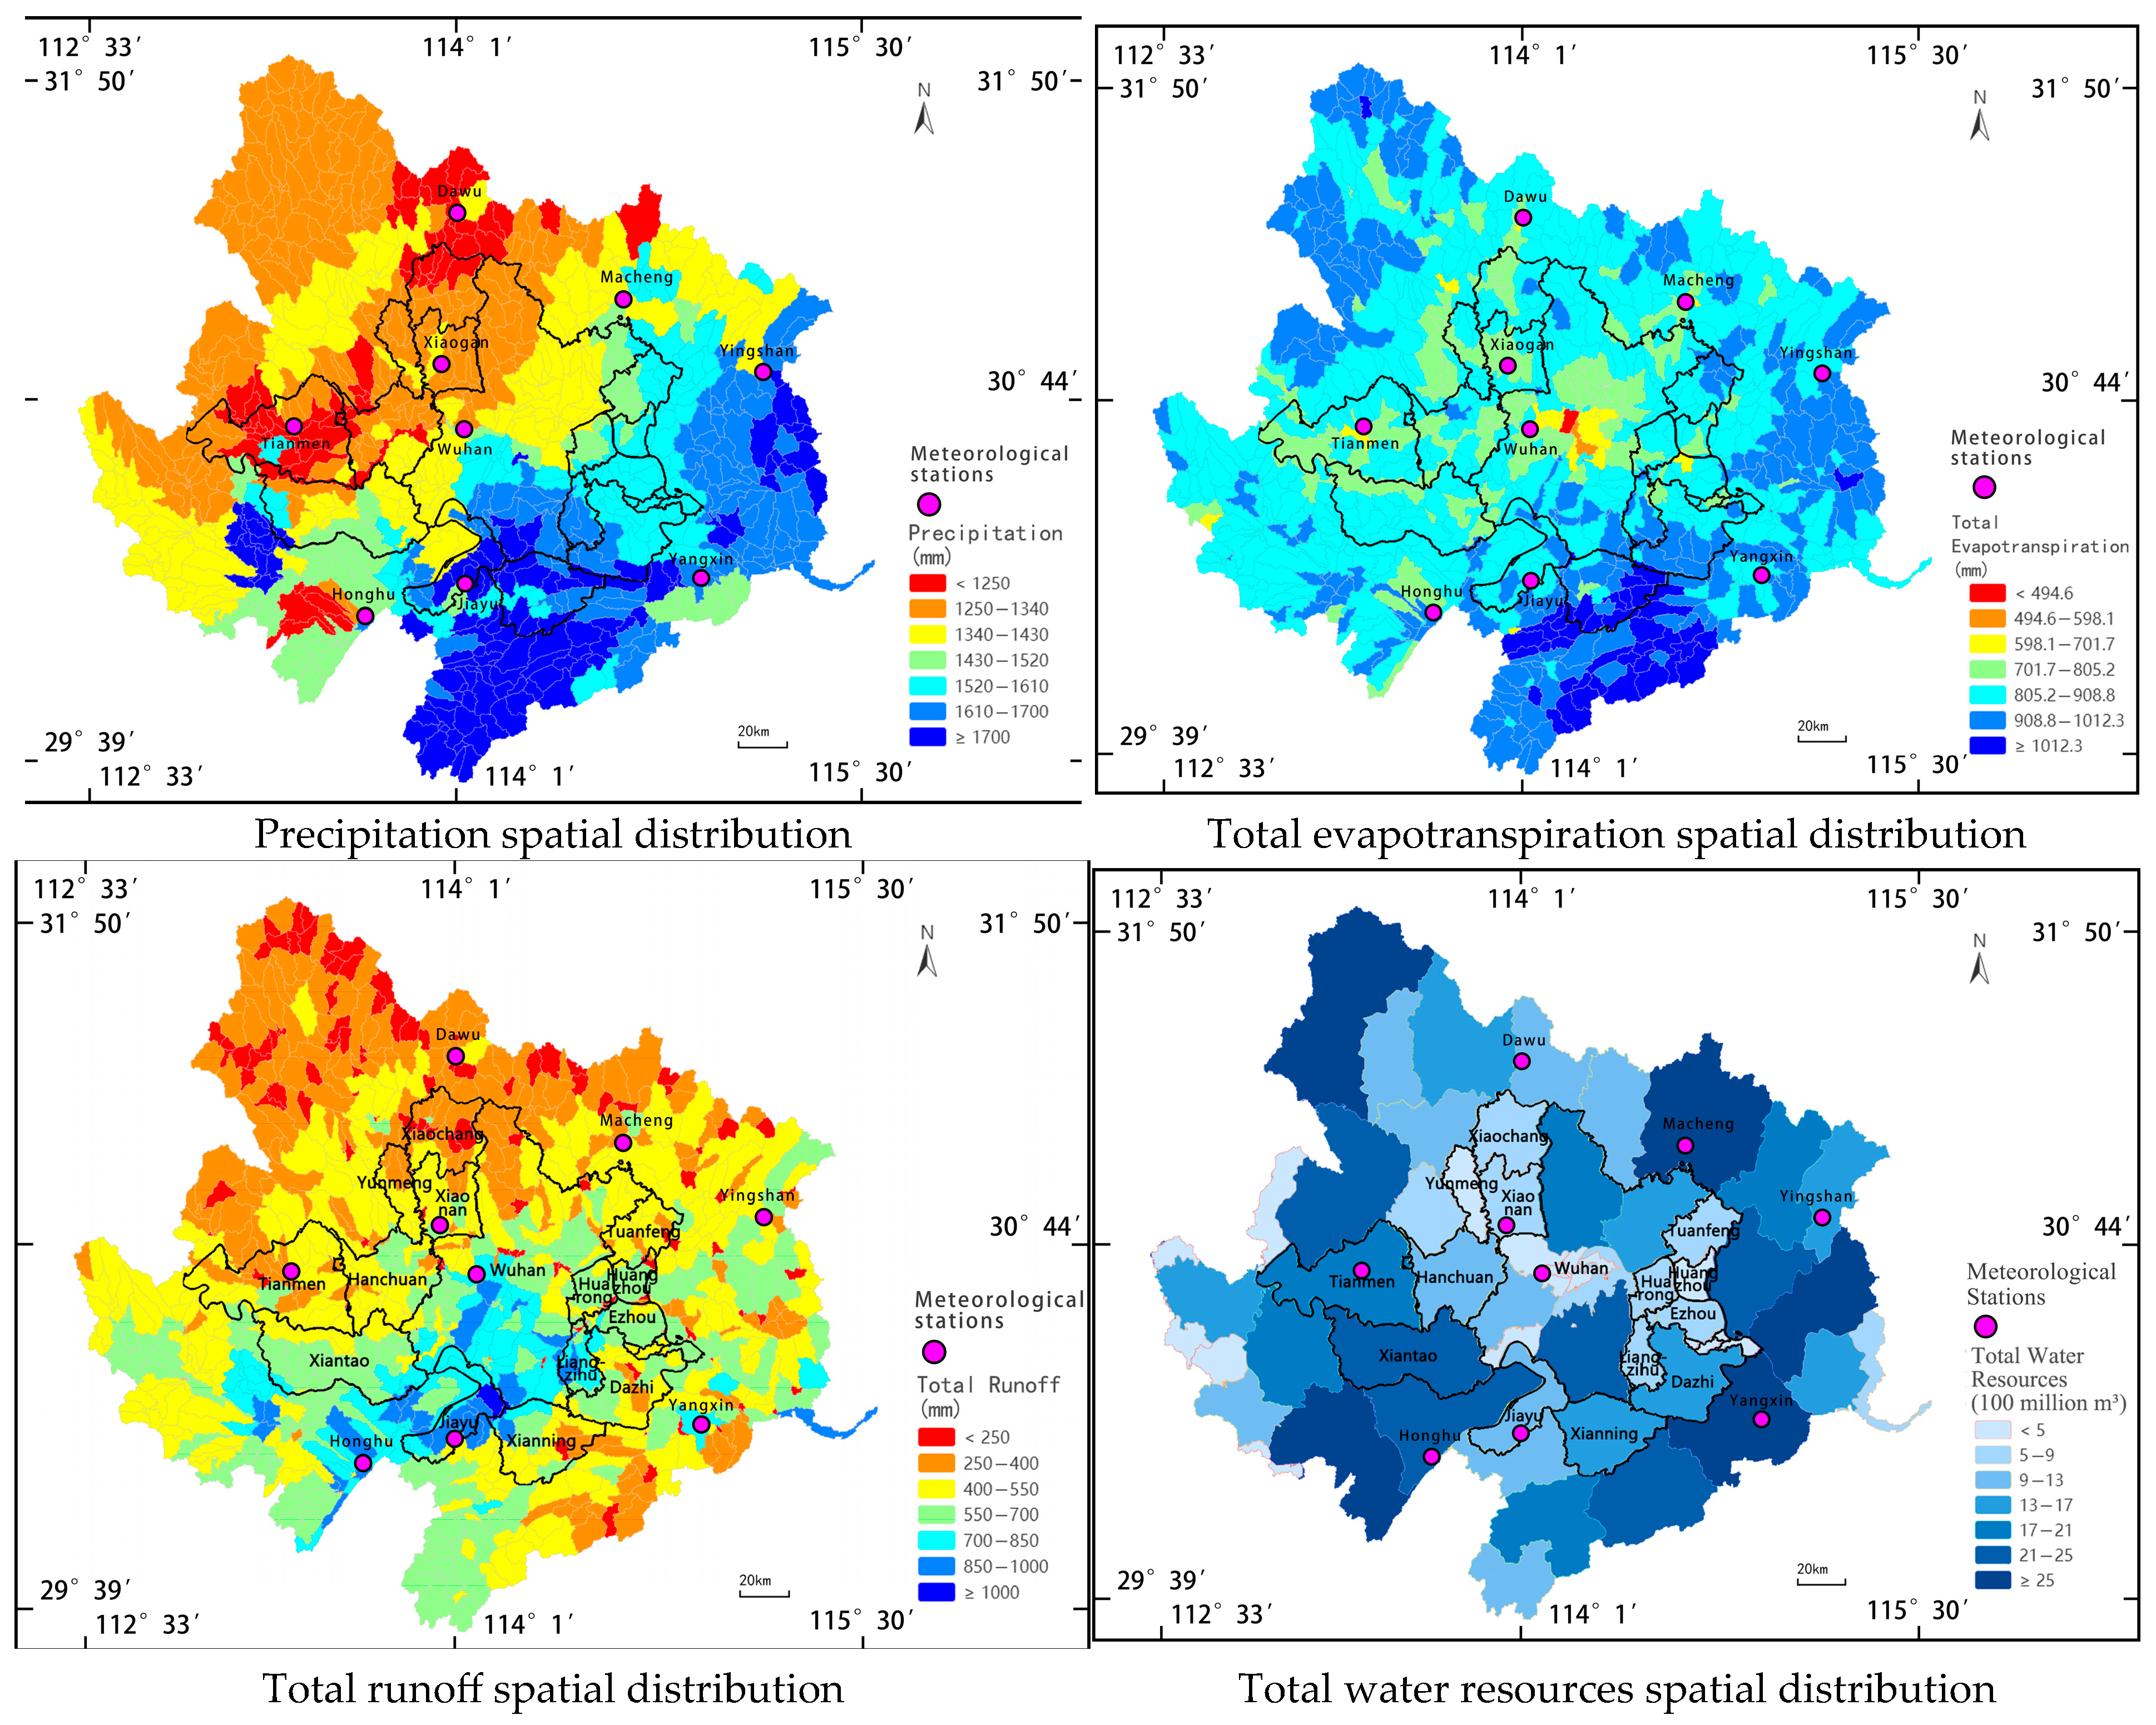
The simulation outputs—including precipitation, total evapotranspiration, total runoff, and total water resources—were visualized in ArcGIS to analyze the hydrological conditions of the study area, thereby providing a scientific basis for ecological restoration and ecological resilience construction in the Wuhan Metropolitan Area.

3.2.1. Hydrological Pattern During the Historical Period (2016–2020)

According to Figure 9 and Table 4, the study area exhibited a typical spatial pattern of “humid in the southeast and drier toward the center” during the historical period (2016–2020). Precipitation showed a general gradient of “higher in the southeast and lower in the northwest,” with annual rainfall exceeding 1700 mm in southern areas such as Xianning and Honghu, while the northern hilly regions received substantially less. This pattern is jointly influenced by East Asian monsoon moisture transport and orographic lifting. Total evapotranspiration displayed relatively small variations but a clear spatial gradient, with pronouncedly higher values in the southeastern sector and lower values in the central urban area and northern regions, reflecting the combined regulation of vegetation conditions, soil moisture availability, and urbanization intensity on evapotranspiration processes. Total runoff exhibited a fan-shaped pattern increasing from the outer areas toward the central part of the metropolitan region, exceeding 1000 mm in the junction area of Wuhan–Honghu–Xianning. This distribution is closely associated with concentrated precipitation, the dense lake system, and the low-lying terrain. The total water resources displayed a contrasting pattern of “low in the center and high in the periphery,” with less than 0.5 billion m3 in the central urban districts, while areas such as Huangpi, Jiangxia, and Honghu generally exceeded 2 billion m3. This indicates diminished water-storage capacity in highly urbanized zones, whereas lake–farmland composite landscapes retain substantially higher water-holding potential.
Overall, the hydrological pattern during the historical period can be summarized as “humid in the southeast and comparatively dry in the center,” providing a baseline for assessing future scenario changes.

3.2.2. Hydrological Simulation Results Under the 2035 Climate Scenario

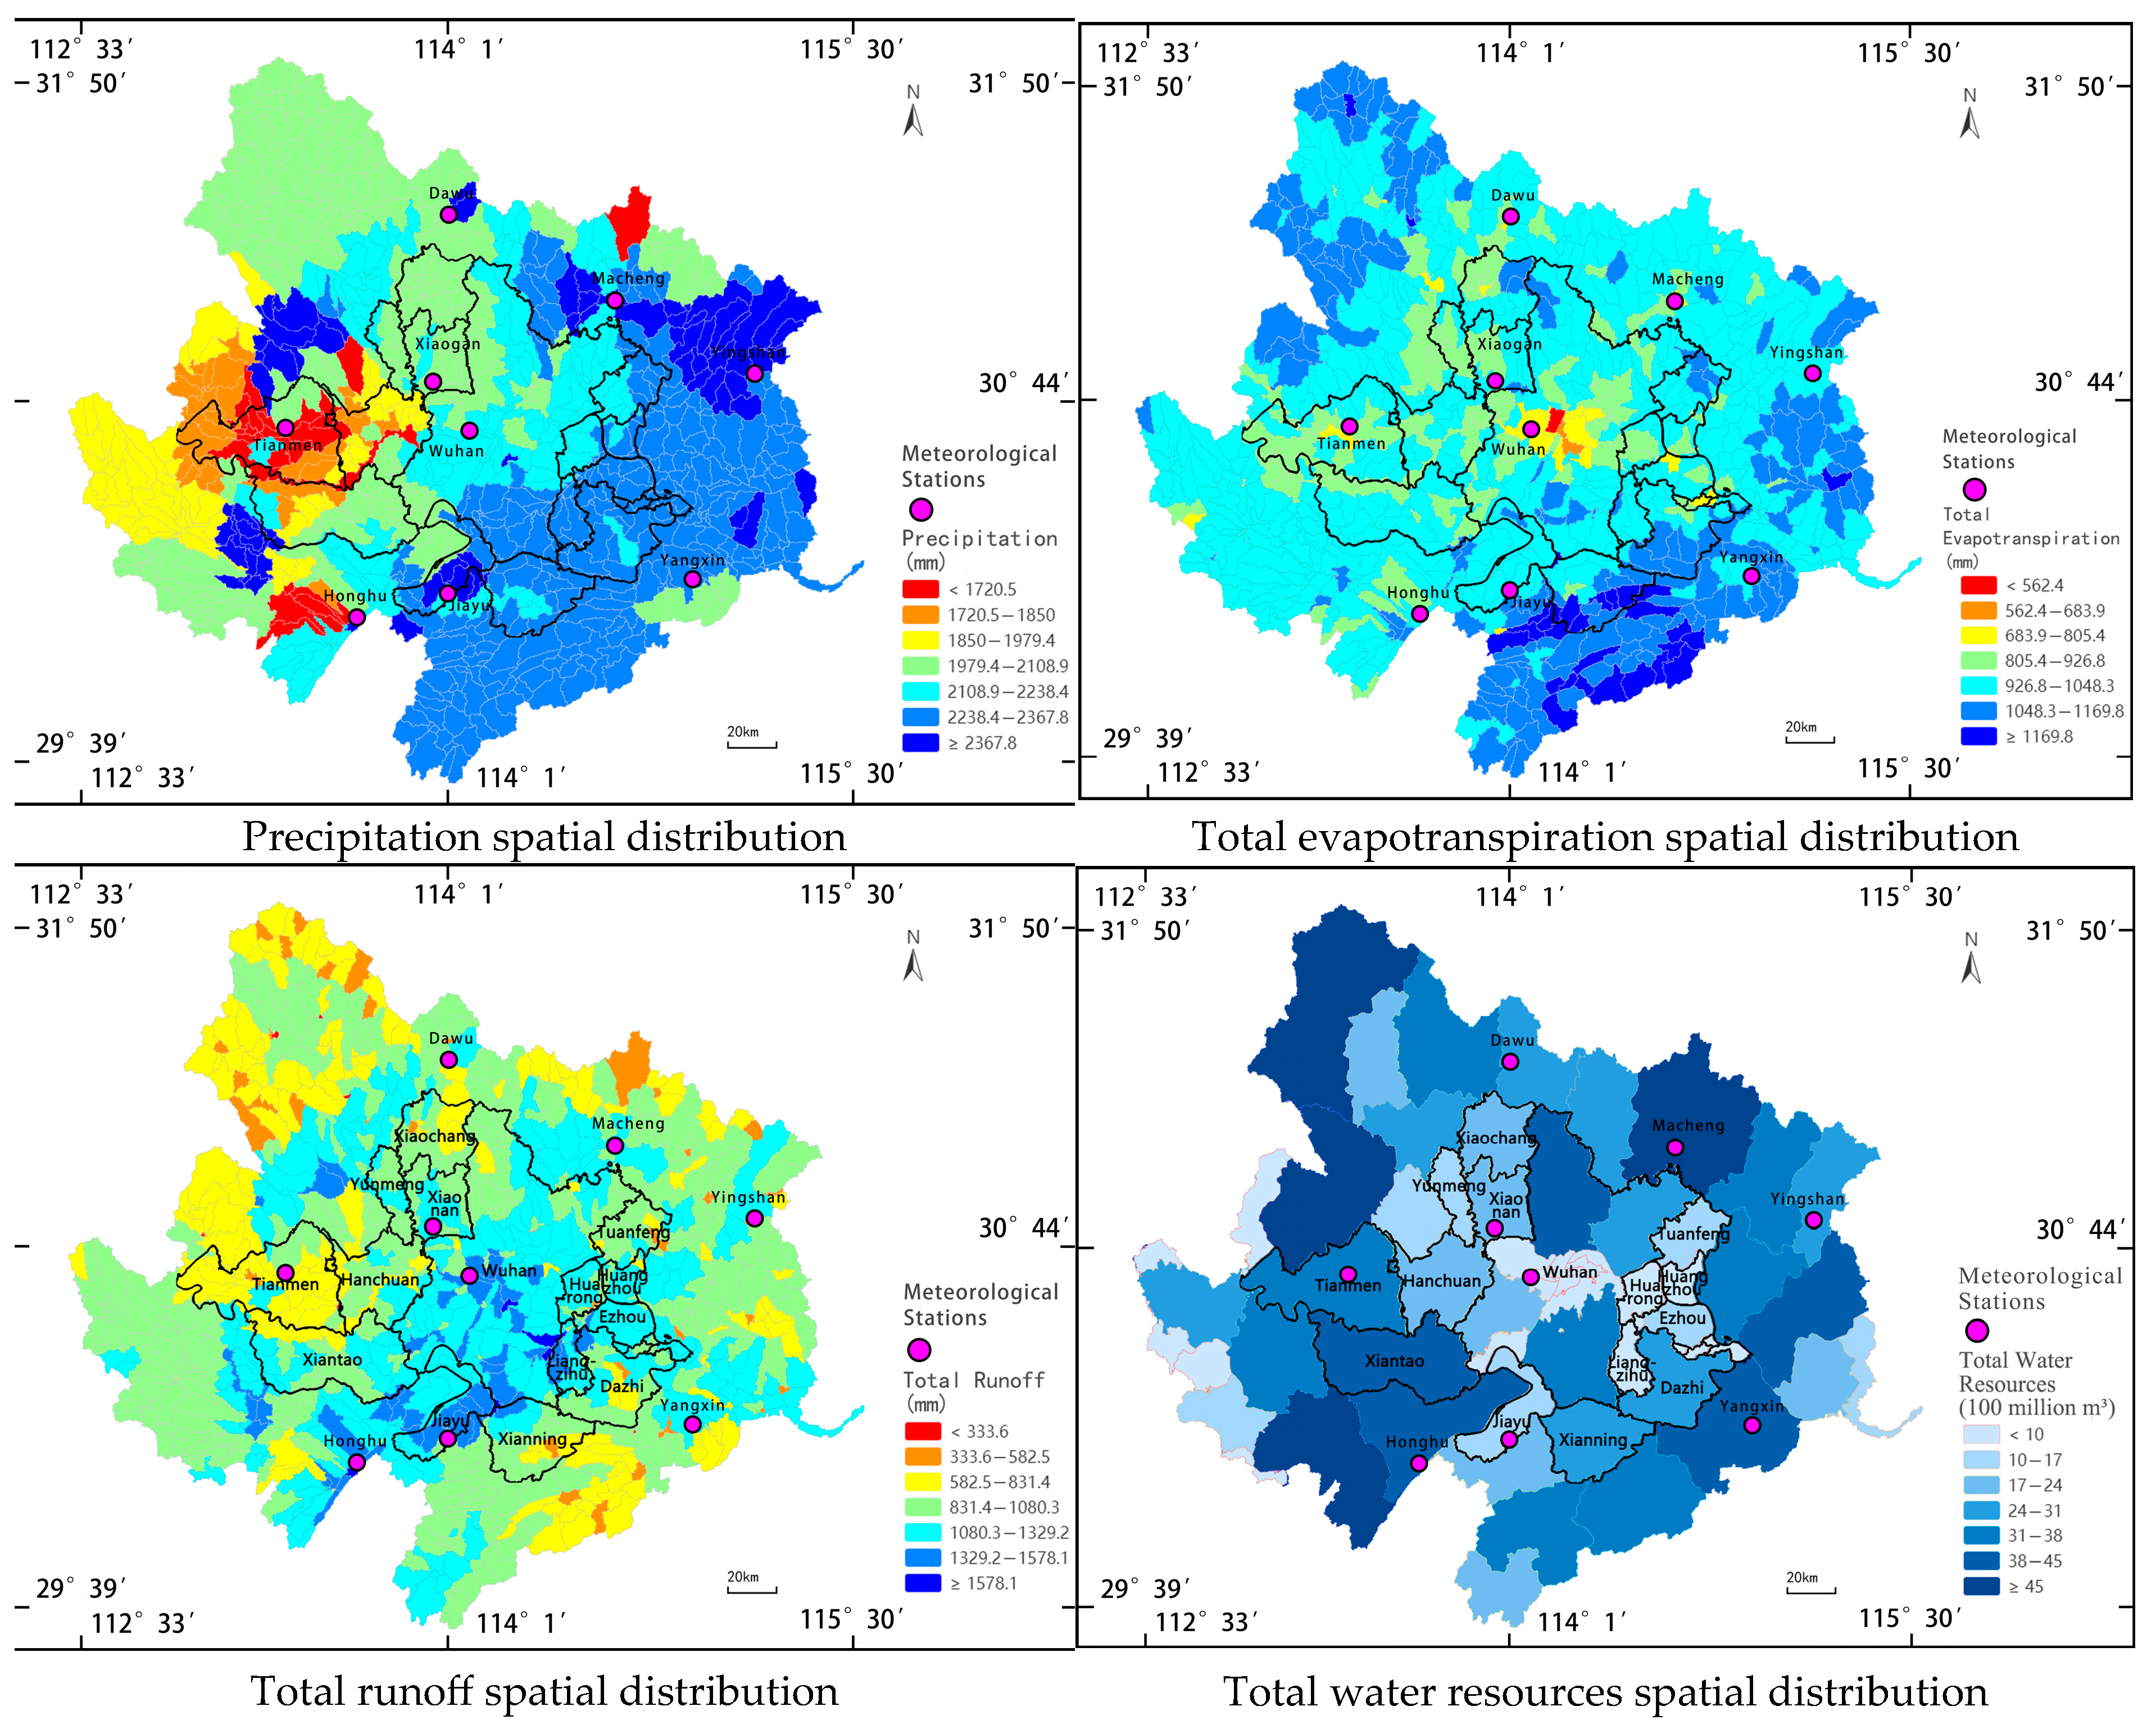
According to the 2035 climate scenario simulations (Figure 10 and Table 5), the major hydrological components of the Wuhan Metropolitan Area are projected to exhibit a pronounced overall increase.
(1)
Overall increase in precipitation and reduced spatial disparity
Future precipitation maintains the general spatial pattern of “higher in the east and lower in the west,” but with an overall increase of approximately 20%. This enhancement indicates strengthened regional moisture transport driven by rising temperatures and higher atmospheric water vapor content. The high-precipitation zone expands from Xianning–Honghu toward Guangshui, Dawu, and eastern Huanggang, resulting in a noticeable reduction in spatial disparity. In the western plain areas (e.g., Tianmen and Qianjiang), the minimum annual precipitation rises to around 1700 mm, suggesting a more spatially uniform precipitation distribution under the future climate scenario.
(2)
Widespread increase in evapotranspiration with a largely stable spatial pattern
Total evapotranspiration increases by approximately 10% compared with the historical period, while the overall spatial pattern of “higher in the southeast and lower in the central urban area” remains unchanged. Areas such as Jiangxia and Jiayu experience more pronounced increases due to favorable vegetation conditions and ample soil moisture. Although the central urban districts continue to exhibit relatively low values because of surface imperviousness, evapotranspiration shows a slight rise in response to higher temperatures.
(3)
Significant increase in runoff and a more moderate spatial gradient
Future total runoff increases markedly under the joint influence of enhanced precipitation and intensified surface runoff generation. Although the overall spatial pattern of “lower in the northwest and higher in the southeast” remains, the spatial gradient becomes noticeably smoother compared with the historical period. High-runoff zones in the southern areas—such as Jiangxia, Honghu, Jiayu, and Tongshan—continue to expand, while previously low-value regions including Tianmen and northern Xiaogan exhibit a clear upward shift.
(4)
Comprehensive increase in water resources and optimized spatial distribution
Total water resources show a substantial overall increase, accompanied by an expansion of high-value areas. Regions such as Honghu, Jiangxia, Huanggang, and Macheng experience particularly notable growth, while northern Suizhou and southern Jingzhou also show clear improvement. Although the central districts of Wuhan remain relatively low-value areas, surrounding counties exhibit markedly enhanced water-resource conditions due to the combined effects of increased precipitation and strengthened runoff generation.
Overall, compared with the 2016–2020 historical baseline, all major hydrological components show varying degrees of increase under the 2035 climate scenario. The total water availability rises, spatial disparities become less pronounced, and several historically low-value areas—such as the northwestern hilly belt and the western plain region—exhibit noticeable improvement. These trends collectively indicate a significant strengthening of regional water-cycle processes driven by climate warming and enhanced precipitation.

3.2.3. Hydrological Trend Analysis Across Secondary Watershed Units

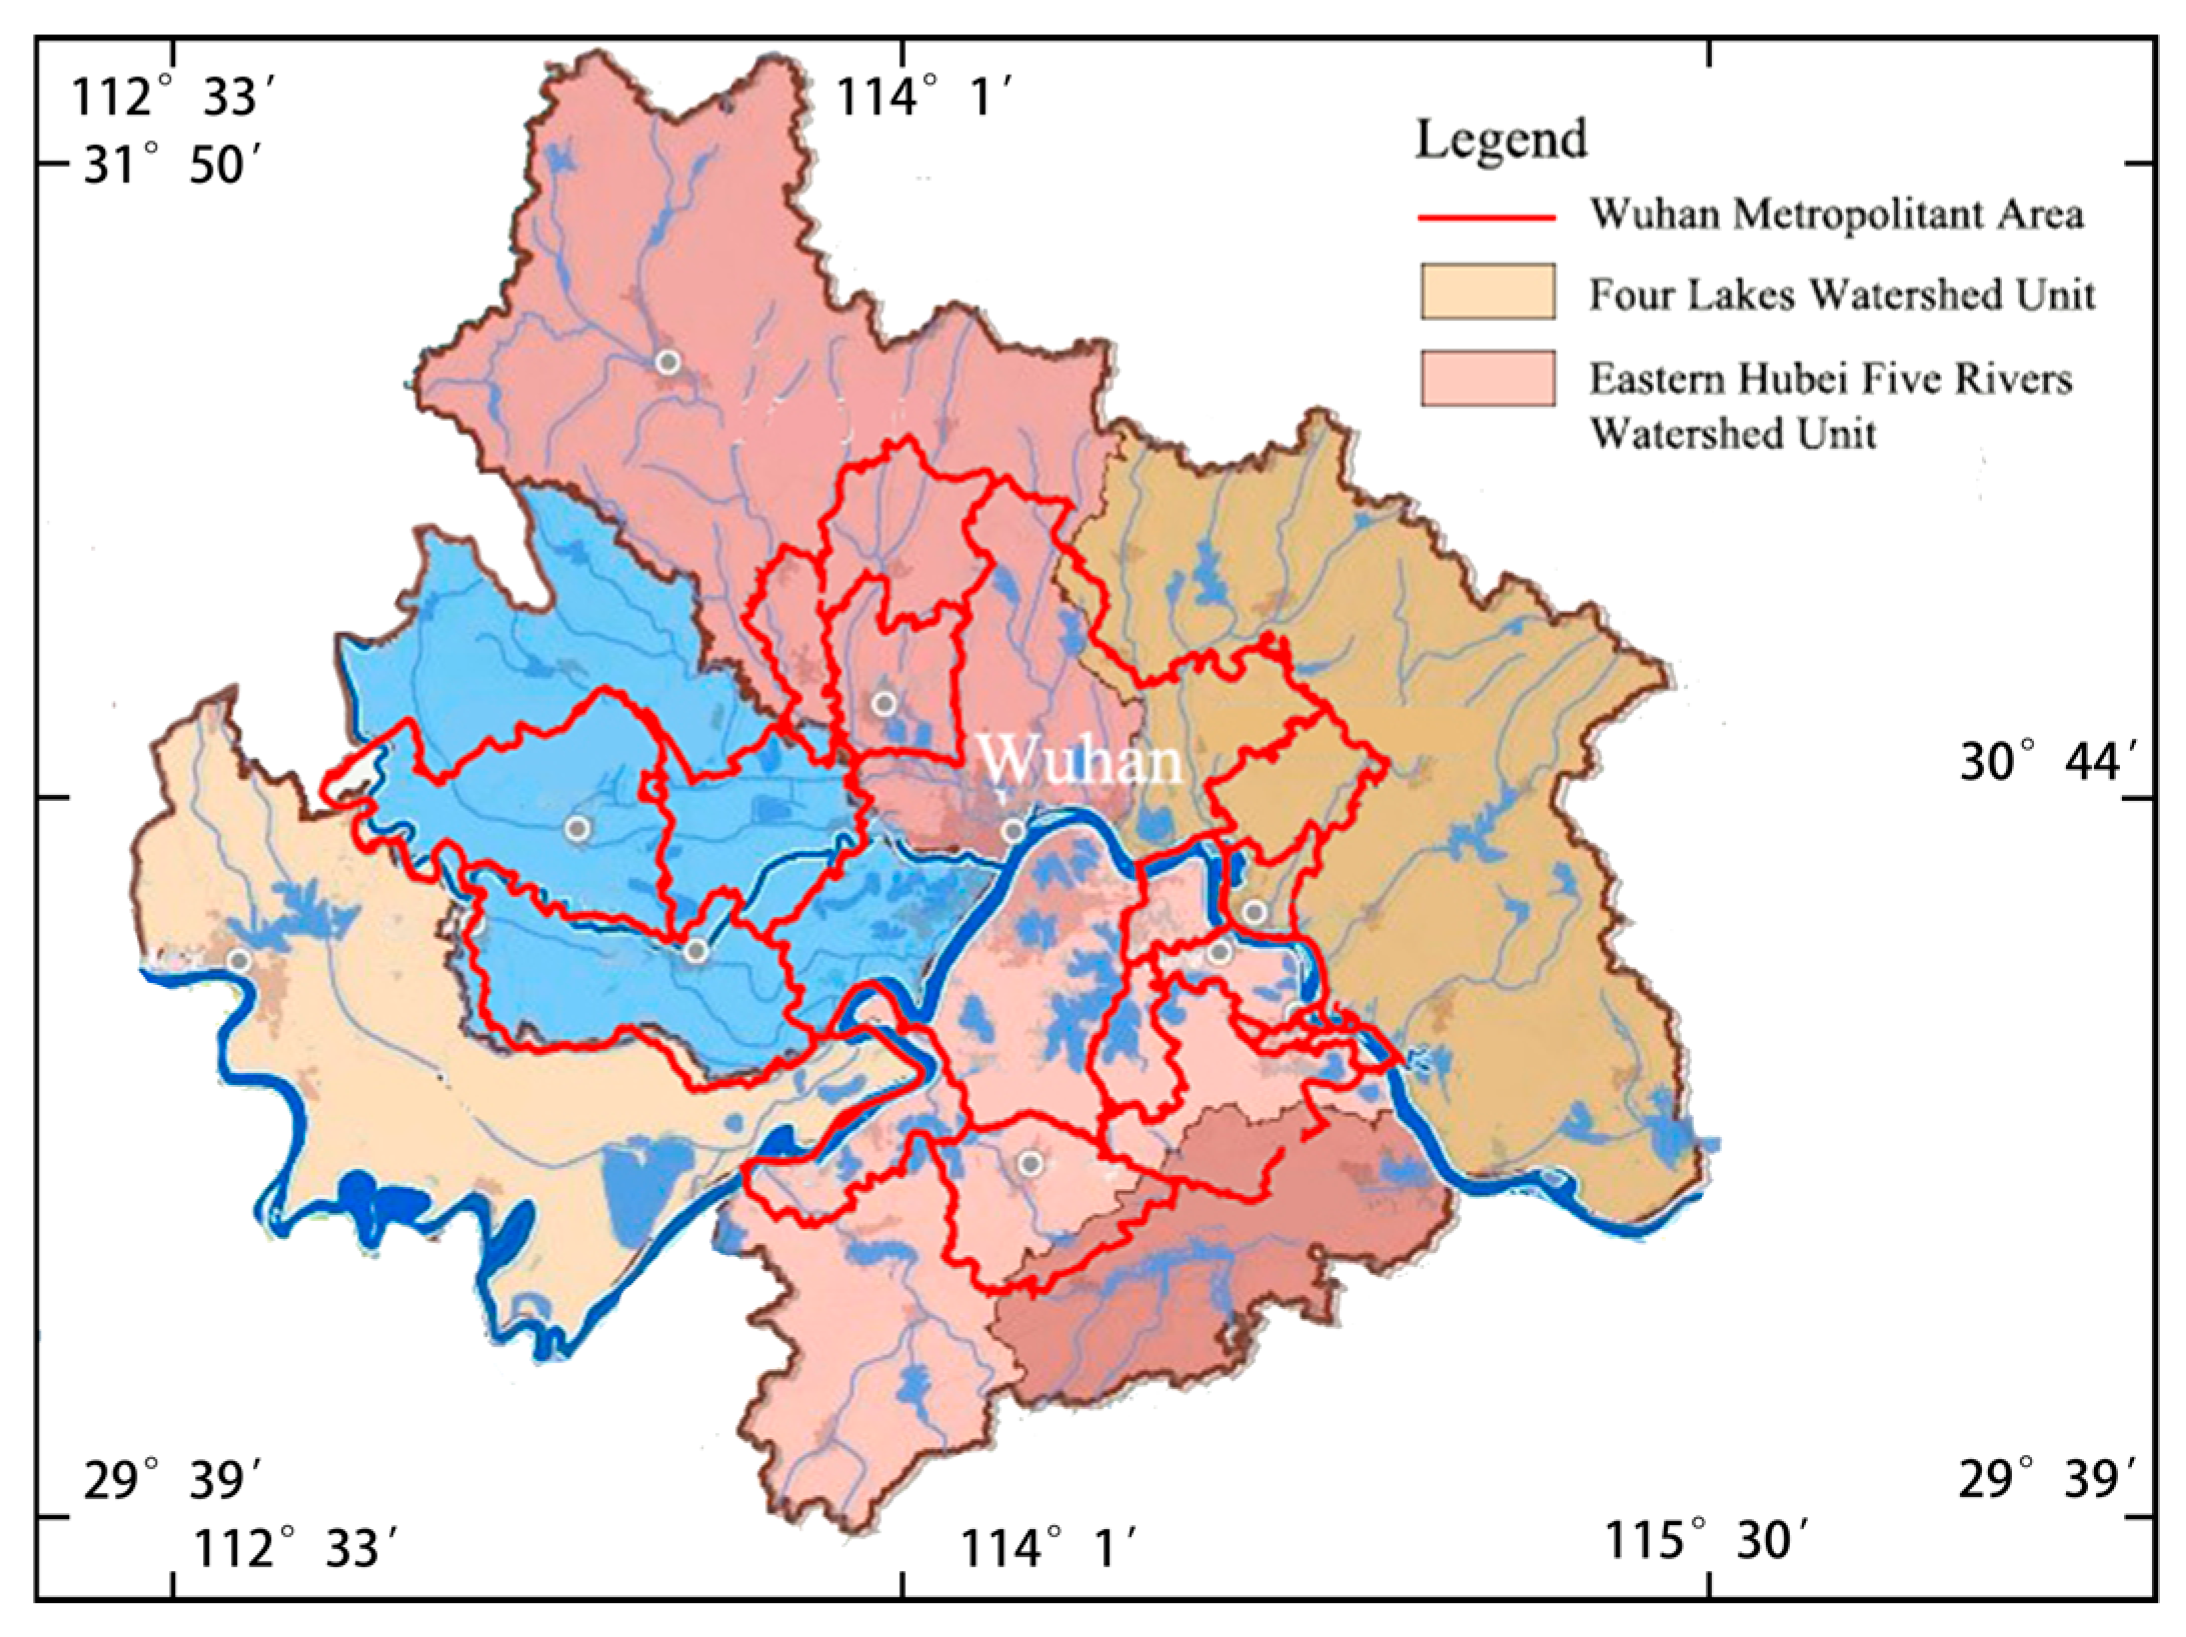
Based on the overall hydrological simulation, hydrological trends were further analyzed for each secondary watershed unit (Figure 11). Particular emphasis was placed on the typical mountainous river areas within the Eastern Hubei Five Rivers water-shed unit and the typical plain river network areas within the Four Lakes watershed unit, providing a scientific basis for formulating subsequent “Four-Water Joint Management” strategies.
The Eastern Hubei Five Rivers Watershed Unit (18,600 km2) lies northeast of the study area, covering parts of Wuhan, Ezhou, and Huanggang. According to Figure 12, runoff generally increases from north to south, peaking near the Yangtze River, with the highest values in Tuanfeng and Wuxue. Total water resources are largest in Macheng (6.417 billion m3) and Qichun (5.549 billion m3), while Xinzhou in Wuhan has 3.277 billion m3. Peak flow occurs in June–August, exceeding 140 m3/s and reaching 180.53 m3/s in July. In contrast, the Four Lakes Watershed Unit (10,700 km2) in the Jianghan Plain mainly includes Honghu and Jingzhou. Runoff is higher in the east, especially in Honghu, which has extensive flood storage and 5.789 billion m3 of water resources. Flood season is distinct from June to September, with peak flow up to 284.7 m3/s in July (Figure 13).
Overall, the spatial distribution of total runoff in each basin unit shows a clear spatial differentiation pattern, mainly characterized by elevation and distance from river and lake systems. The total runoff increases with decreasing elevation and decreasing distance from river and lake systems. In terms of total water resources, the spatial differentiation is relatively weak, and the changes are presumed to be mainly related to the dominant industries [55] and land use [56,57] of the administrative regions. For example, administrative regions dominated by agriculture have larger total water resources, while those dominated by the tertiary industry have smaller total water resources. Additionally, from the monthly variation of simulated flow during the planning period in each basin unit, it can be seen that the flow peaks occur mostly in the summer, coinciding with the rainy season in this region. During this period, flood control and water safety issues in areas with high total runoff should be given special attention.

3.3. Ecological Restoration Zoning in the Wuhan Metropolitan Area

Based on the previous hydrological simulation of the study area and using ArcGIS for spatial identification of land ecological elements, evaluation of ecosystem service importance, and ecological sensitivity assessment, the ecological restoration zoning of the Wuhan Metropolitan Area was delineated through comprehensive overlay analysis on important water systems and green corridors.
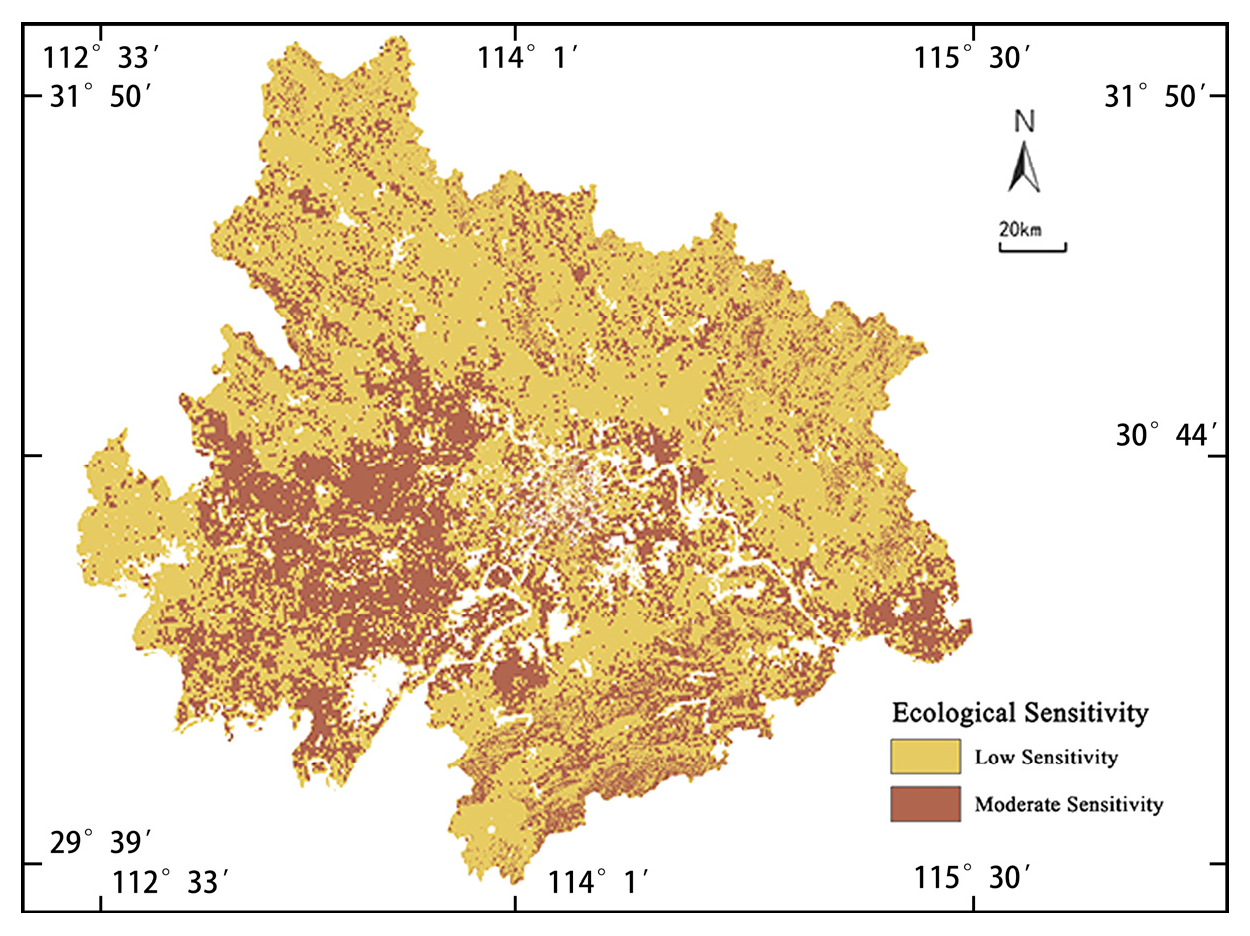
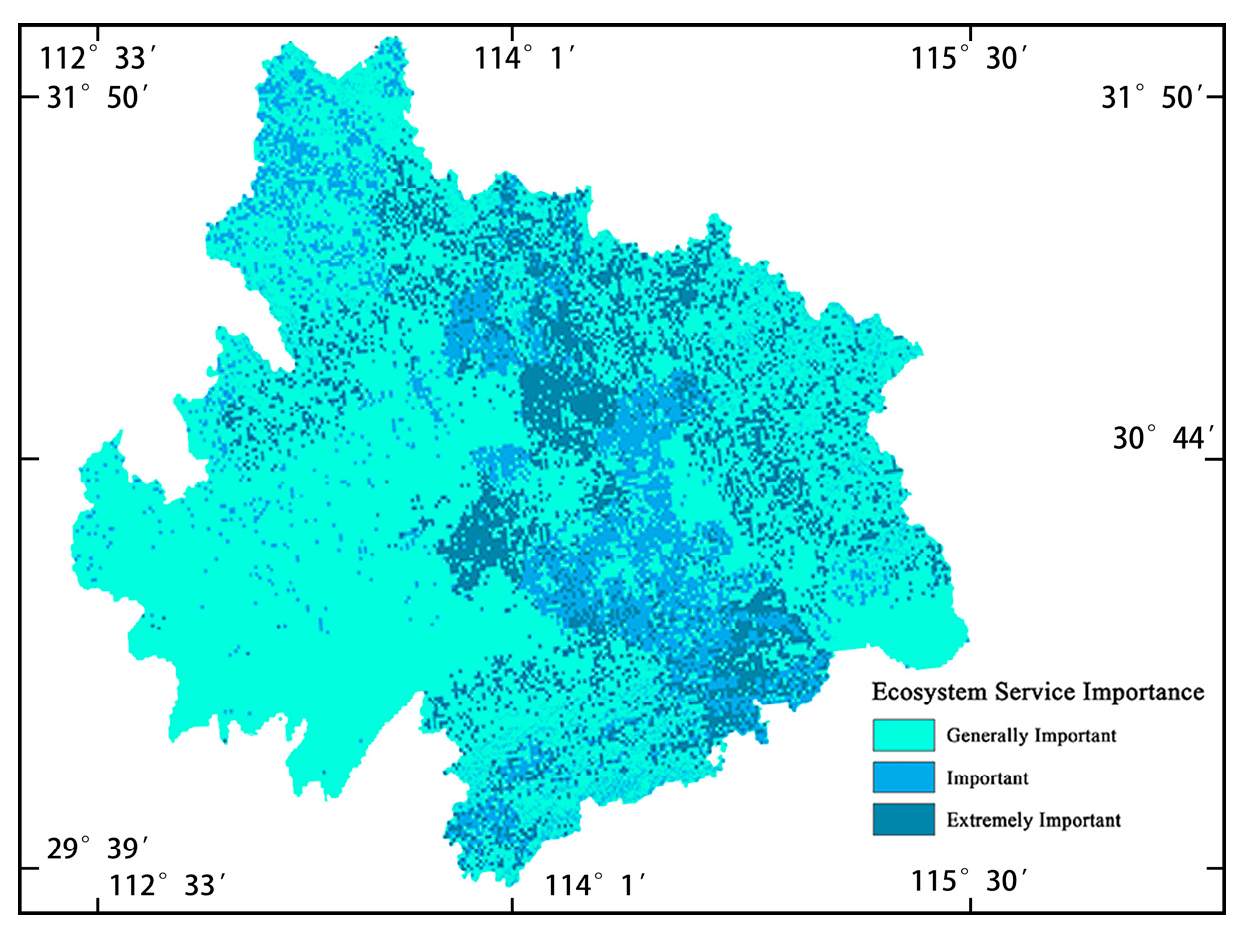
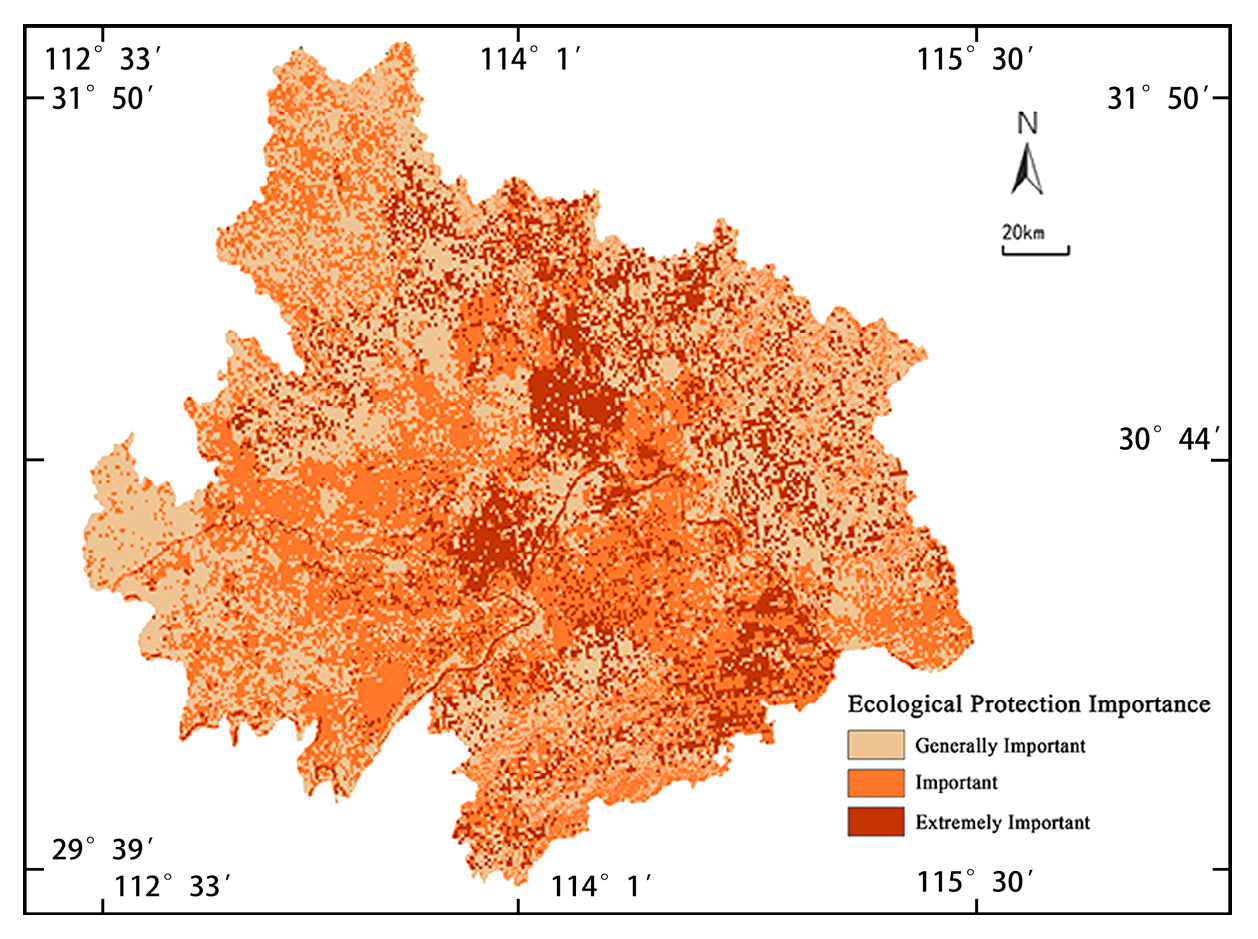
The specific analysis operations include spatial overlay, buffer analysis, and spatial intersection. Subsequently, supervised classification of remote sensing imagery data is used to extract information on land cover types and vegetation classification. The spatial distribution characteristics of different land ecological elements within the area are then identified, and the spatial distribution of ecological elements is divided. This results in the classification of regional ecological sensitivity (Figure 14), ecosystem services importance (Figure 15), and ecological protection importance (Figure 16).
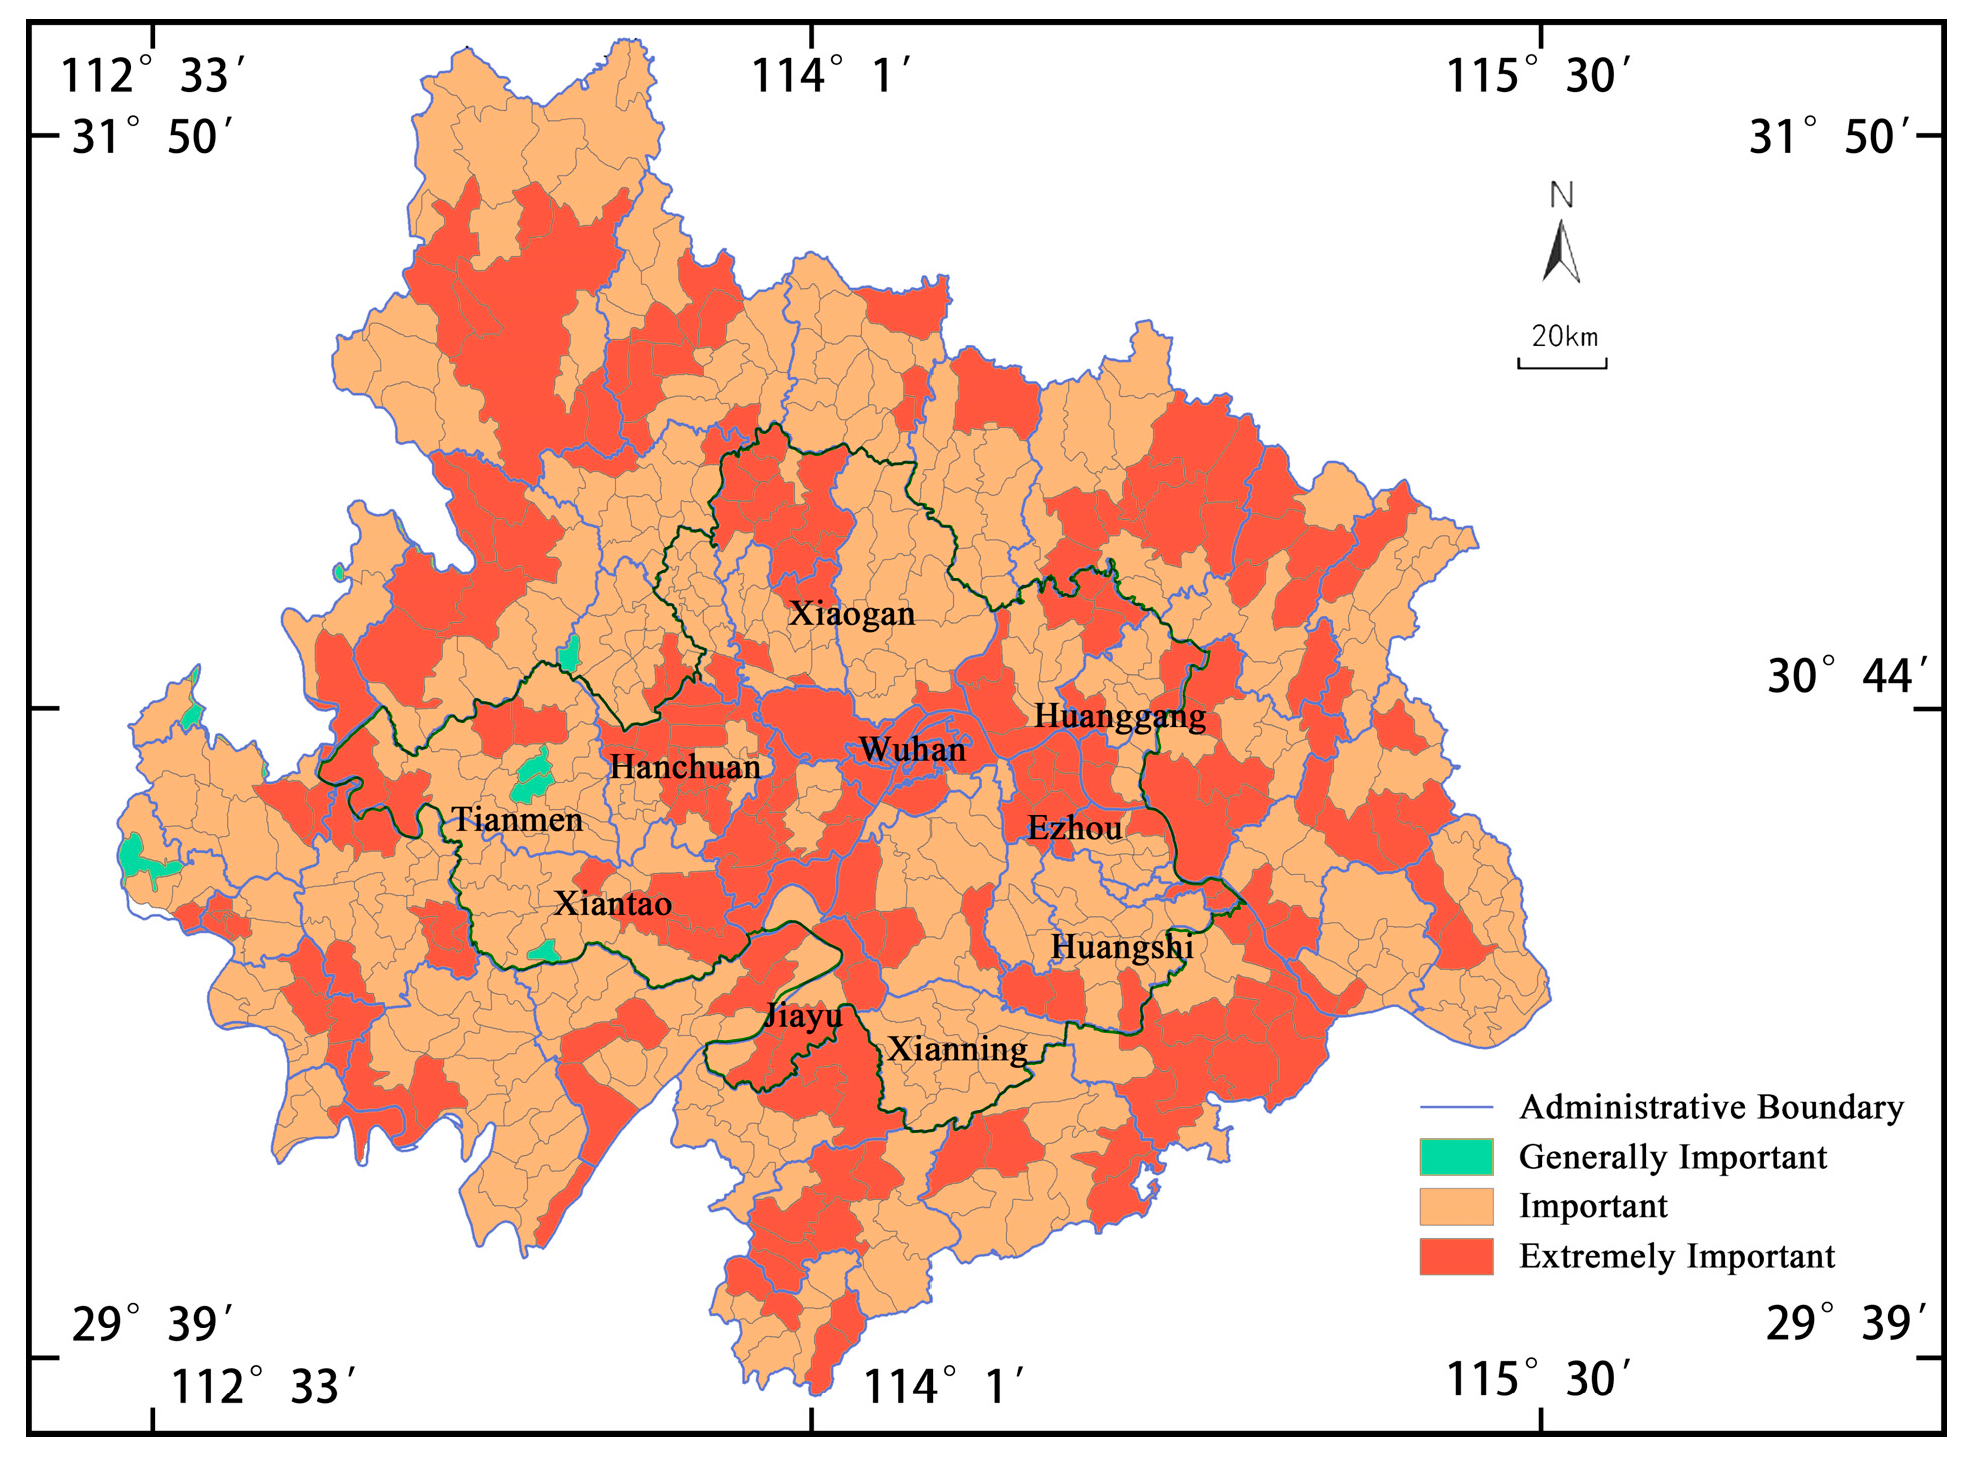
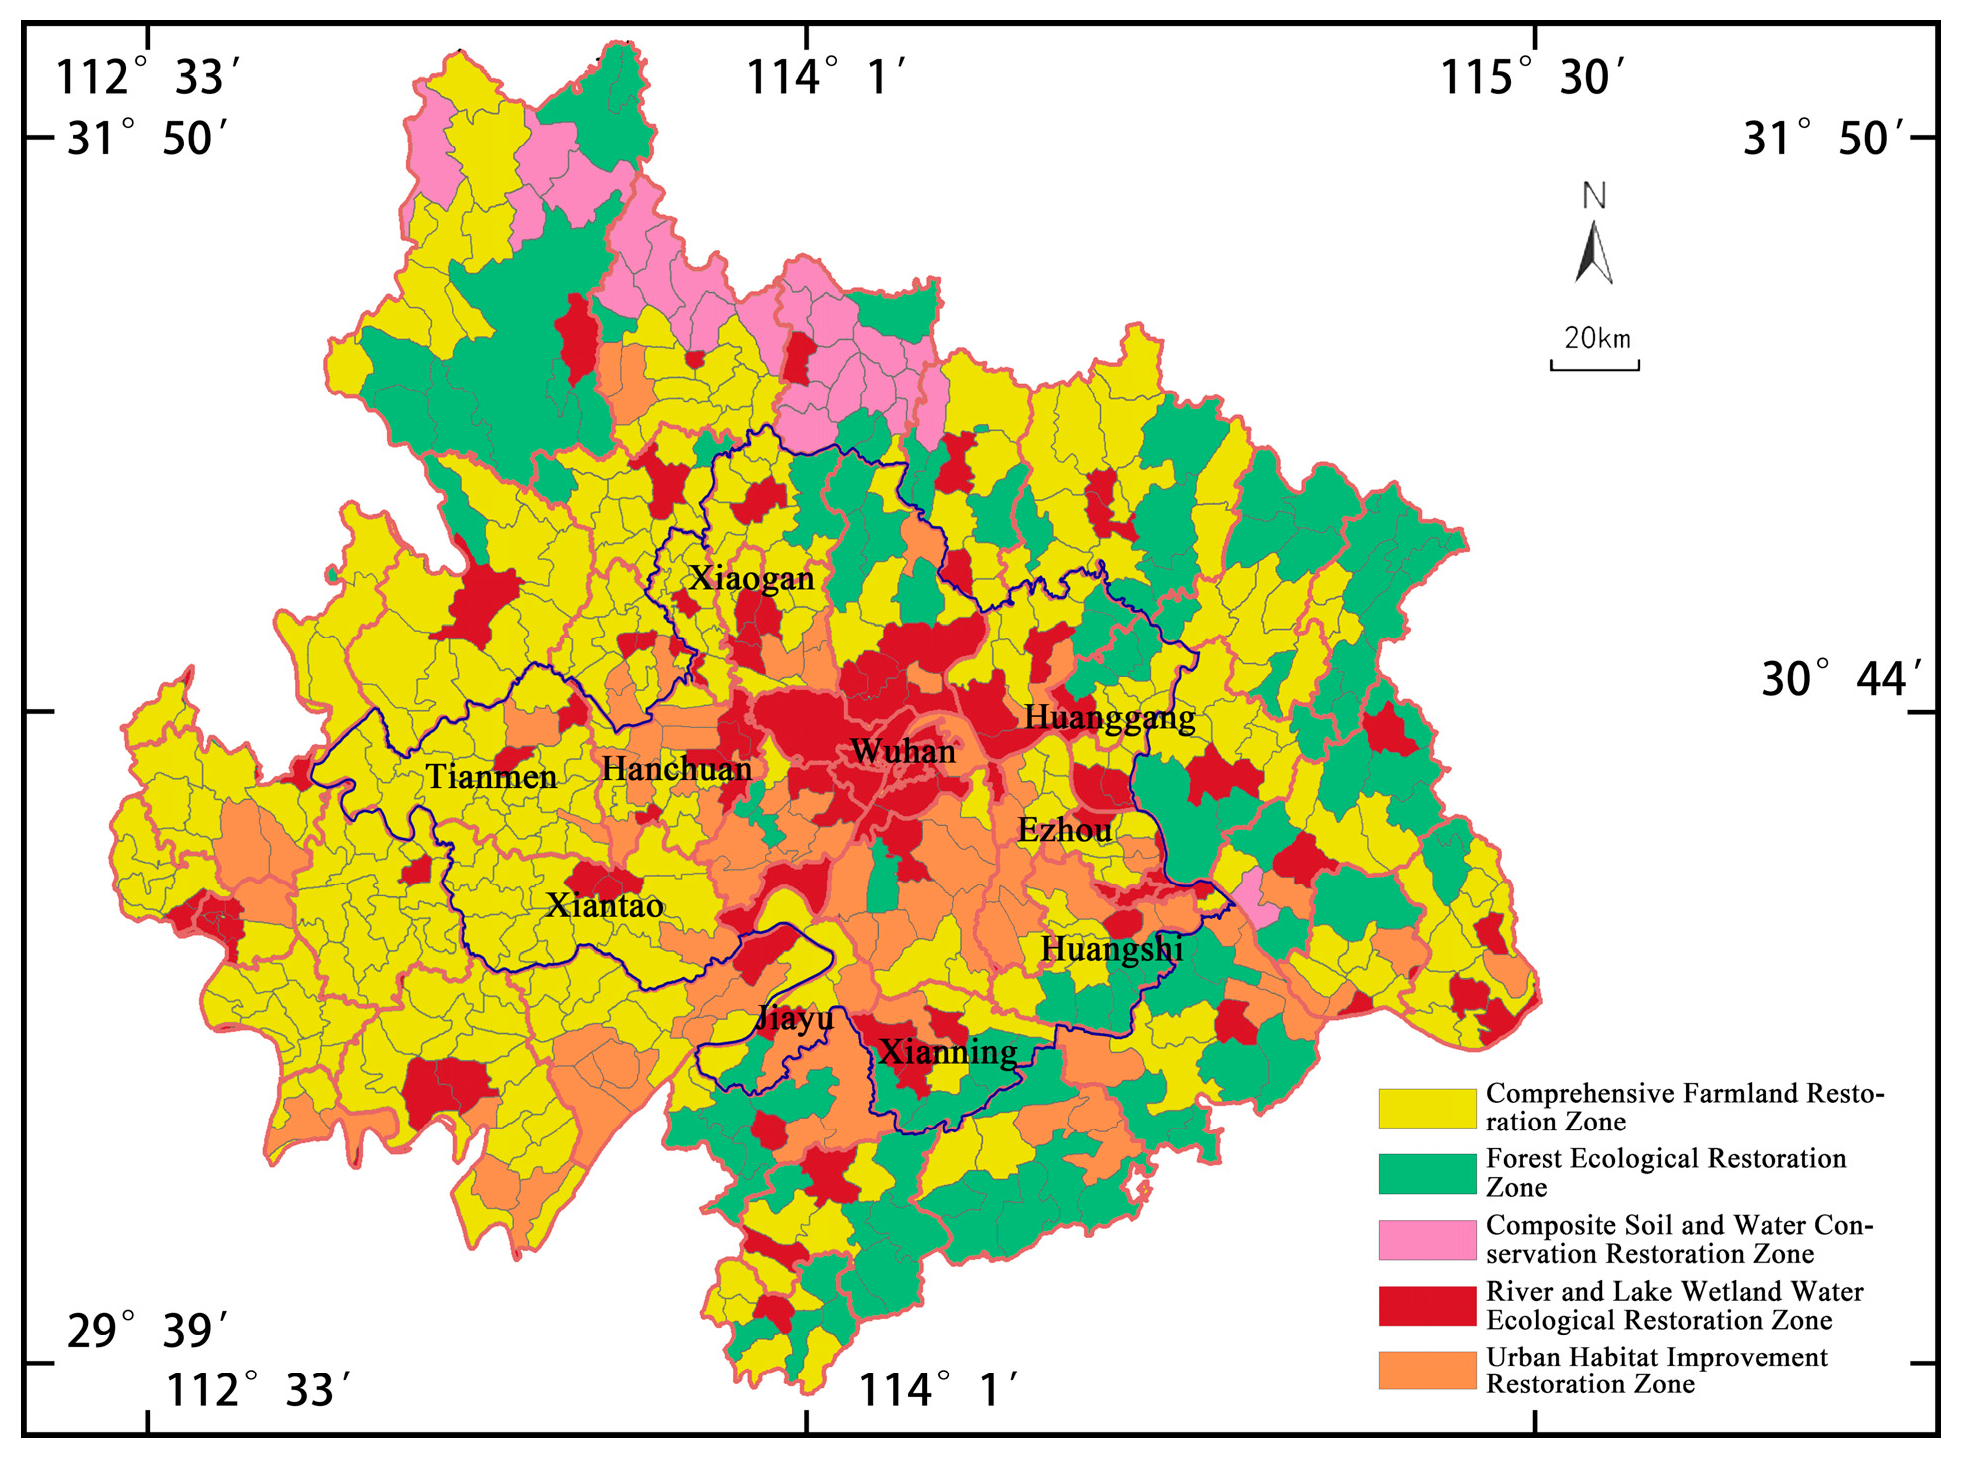
Based on the delineation of watershed control units, spatial overlay analysis was conducted by combining evaluations of ecological sensitivity, the importance of ecosystem services, and the importance of ecological protection, resulting in the classification of the study area’s ecological restoration importance (Figure 17). Subsequently, the spatial distribution of land ecological elements (including forest distribution, forest quality classification, forest vegetation cover, water conservation importance, etc.) was identified. The study area was then divided into ecological restoration zones covering the entire metropolitan area (Figure 18), ultimately forming a “five-zone × three-tier” zoning system.
Based on the ecological background and considering the spatial heterogeneity, functional complexity, and main complexities of the study area, five types of ecological restoration zones were identified: comprehensive farmland restoration zone, forest ecological restoration zone, composite soil and water conservation restoration zone, river and lake wetland water ecological restoration zone, and urban habitat improvement comprehensive restoration zone. For these five types of ecological restoration zones, corresponding management and control requirements were proposed from the watershed dimension (Table 6).
After quantitative analysis, the layout of the comprehensive watershed unit management plan is carried out. Subsequently, based on this layout, a comprehensive watershed unit management planning scheme is formulated from the “four waters co-governance” dimension.
First is the comprehensive management plan for watershed water security, mainly based on the analysis of total runoff and monthly flow data of each watershed unit to identify potential spatial and temporal disasters such as inundation and floods, and proposing coping strategies considering the distribution and scale of flood storage and detention areas and reservoirs. Secondly, the watershed water resource allocation and scheduling plan visualizes the water usage of various types of water in the study area, drought simulation evaluation, and reservoir distribution. It provides a comprehensive analysis of the utilization of total water resources in each unit and makes an overall judgment and formulates water resource allocation plans for each unit considering seasonal water quantity changes. Then comes the water environment emission reduction and blocking plan, which focuses on analyzing the sectional level distribution of each watershed unit, clarifying the water quality control and improvement requirements for each unit, and proposing corresponding strategies and measures based on the distribution and scale of drinking water sources. Finally, the watershed water landscape system construction plan aims to create differentiated landscape development for different sections, forming segmented landscape control strategies for three zones (main city, new city, and rural area). Combining the results of water security and water environment analysis, it proposes specific construction and renovation plans for banks, river channels, and other areas from a landscape perspective. The comprehensive management plans for the “four waters” and “eastern Hubei five river” watershed unit are shown in Table 7.

4. Discussion

4.1. Summary of Key Findings

In response to the scientific need for metropolitan ecological restoration under climate change, this study proposes a watershed-based ecological restoration planning method driven by hydrological process prediction. Using the WEP-L distributed hydrological model, we simulated future climate-scenario variations in precipitation, evapotranspiration, runoff, and water resources. These outputs were then integrated with indicators of ecological sensitivity, ecosystem service importance, and ecological conservation priority to construct a planning pathway defined by the sequence: “climate scenario—hydrological prediction—zoning delineation—strategy formulation.”
The simulation results reveal pronounced spatial heterogeneity in the hydrological elements of the Wuhan Metropolitan Area: precipitation decreases from the southeast to the northwest; runoff is concentrated in lake-dense regions; and evapotranspiration shows relatively limited variation but remains generally higher in the southeastern portion of the basin. These spatial patterns underscore the constraining influence of hydrological differences on the spatial configuration of ecological restoration. By integrating ecological sensitivity, ecosystem service importance, and ecological conservation priority, a three-level classification of restoration importance—moderately important, important, and highly important—was developed. Based on this classification and the characteristics of land-ecological elements, five categories of restoration zones were delineated, namely farmland, forest, composite, river and lake wetland, and urban ecosystem, thereby establishing a “five zone × three tier” spatial framework for ecological restoration.
Compared with international findings, the impacts of climate change on watershed hydrological processes show strong generality, yet the mechanisms differ markedly across climatic regimes and degrees of urbanization. Studies have shown that in humid regions—such as the Han River Basin in South Korea—runoff variability is more sensitive to urban expansion and land-cover change [58]. In contrast, in relatively arid regions such as the Blue Nile Basin in Africa, precipitation fluctuations are the primary driver of runoff changes [59]. Multi-basin global comparative studies further corroborate the widespread patterns of runoff responses under climate-change scenarios and highlight the synergistic influences of climate and land-use change as a key direction for enhancing watershed ecological restoration and water-resource management effectiveness [60]. In contrast, this study integrates hydrological simulation outputs under climate scenarios with ecological spatial analysis at a coupled watershed–metropolitan scale, establishing a systematic pathway that connects hydrological response identification with ecological restoration zoning. This approach deepens the analytical scope of climate-adaptive ecological restoration planning and provides a transferable framework for integrated governance of metropolitan regions across diverse climatic contexts.

4.2. Research Innovations and Policy Implications

The innovations of this study are reflected in both methodological advances and strategic contributions. Methodologically, it integrates hydrological process simulation with evaluations of ecological sensitivity, ecosystem service importance, and ecological conservation priority, establishing an integrated pathway that links climate scenarios, hydrological responses, and ecological restoration. This approach shifts ecological restoration planning from static suitability assessment to dynamic scenario-based analysis. Strategically, the study proposes a watershed-based “five-zone × three-tier” ecological restoration framework, which guides differentiated restoration actions according to hydrological and ecological characteristics. This framework expands ecological restoration planning into an integrated “hydrology–ecology–spatial” system, providing systematic support for enhancing metropolitan ecological resilience.
At the policy level, the findings of this study provide important insights into climate-adaptive urban planning and water-resource management. The hydrological simulation results support the development of metropolitan ecological security patterns and the identification of flood-risk areas, facilitating coordinated arrangements between disaster prevention–mitigation and ecological restoration. The ecological restoration zoning framework can further contribute to “multi-plan integration” in territorial spatial planning, strengthening the alignment among ecological restoration, water-resource regulation, and urban growth boundaries, and promoting the integrated development of watershed governance and urban spatial management.

4.3. Research Limitations and Future Research Directions

Several limitations should be acknowledged in this study. First, uncertainties remain in the model assumptions and parameterization, as human interventions—including reservoir regulation, water-diversion projects, and groundwater recharge—were not fully incorporated, potentially introducing localized biases in runoff simulation. Second, the spatial resolution of geographic and meteorological data is limited, particularly in highly urbanized areas where strong surface heterogeneity may hinder the model’s capacity to represent hydrological processes at finer scales. Third, this study only adopted the RCP4.5 climate scenario; hence, the representativeness and applicability of the findings could be strengthened by incorporating multiple climate pathways. Moreover, the proposed ecological restoration strategies have not yet been validated in practical engineering contexts, and long-term monitoring and quantitative evaluation of their effectiveness are still lacking.
Future research can be advanced in several directions. First, higher-resolution geographic, meteorological, and human-activity datasets should be incorporated, along with explicit consideration of reservoir operations, drainage systems, and irrigation scheduling, to improve the model’s physical realism and spatial accuracy. Second, simulations under multiple climate scenarios (e.g., RCP2.6, RCP8.5), combined with cross-validation using other distributed hydrological models such as SWAT, MIKE SHE, TOPMODEL, WEAP, and VIC, would enhance the robustness and general applicability of the modeling framework. Third, developing representative pilot areas and long-term monitoring systems would enable dynamic evaluation of the ecological and social outcomes of the proposed restoration strategies.

5. Conclusions

With the continuous expansion of metropolitan areas, ecological degradation has increasingly intensified, making watershed-based ecological restoration a critical pathway for addressing climate change and ecological unsustainability. This study proposes a hydrological-prediction-driven ecological restoration approach based on the WEP-L model and develops a technical framework integrating “climate scenario—hydrological simulation—zoning delineation—strategy formulation.” Under the RCP4.5 climate scenario, we simulated the spatiotemporal dynamics of precipitation, evapotranspiration, runoff, and total water resources, and conducted hydrological trend analyses at the secondary watershed scale. By integrating ecological sensitivity and ecosystem importance assessments, we established a “five zone × three tier” ecological restoration zoning system and proposed corresponding restoration strategies. On this basis, a comprehensive “four-water” management scheme—covering water security, water resources, water environment, and waterscape—was further developed. The results reveal pronounced spatial heterogeneity in the hydrological components of the Wuhan Metropolitan Area: precipitation and runoff are highly concentrated in the humid southeastern zone, whereas the central urban area suffers from water scarcity and insufficient ecosystem service provision. This spatial imbalance in hydrological processes has become a key constraint on the spatial configuration of ecological restoration. The technical pathway proposed in this study advances ecological restoration from static pattern-based planning toward scenario-driven dynamic planning, thereby providing methodological support for climate-adaptive and sustainable ecological restoration at the urban scale.
The findings of this study can inform climate-adaptive urban planning. The hydrological simulations support the construction of ecological security patterns and the identification of flood-prone areas, while the ecological restoration zoning framework can assist the implementation of integrated territorial spatial planning by promoting coordinated management of ecological restoration and urban growth boundaries. Future research may incorporate higher-resolution datasets, explore additional climate scenarios, and conduct comparative analyses with other hydrological models such as SWAT, WEAP, and VIC to further enhance model robustness and applicability.

Author Contributions

Conceptualization, Y.L. and X.Y.; methodology, Y.L. and X.Z.; software, X.Z. and K.L.; validation, Y.L., X.Z. and X.Y.; formal analysis, Y.L., X.Z. and K.L.; investigation, Y.L., X.Z. and K.L.; resources, X.Y.; data curation, X.Z. and X.Y.; writing—original draft preparation, Y.L., X.Z. and K.L.; writing—review and editing, X.Z. and X.Y.; visualization, X.Z.; supervision, X.Y.; project administration, X.Y.; funding acquisition, Y.L. All authors have read and agreed to the published version of the manuscript.

Funding

This research was funded by National Natural Science Foundation of China Project (No.52578074), Humanities and Social Science Project of Ministry of Education (No.24YJAZH083).

Institutional Review Board Statement

Not applicable.

Informed Consent Statement

Not applicable.

Data Availability Statement

The original contributions presented in this study are included in the article. Further inquiries can be directed to the corresponding author.

Acknowledgments

Thank you to Liu Qizhi, Yao Chengjie, Wan Neng, Xu Xiayan, Chen Leihui, and Ning Jian for their support on this research from the Wuhan Natural Resources and Urban-Rural Construction Bureau.

Conflicts of Interest

The authors declare no conflict of interest.

References

  1. Li, D.; Yang, W.; Huang, R. The Multidimensional Differences and Driving Forces of Ecological Environment Resilience in China. Environ. Impact Assess. Rev. 2023, 98, 106954. [Google Scholar] [CrossRef]
  2. Xiao, R.; Lin, M.; Fei, X.; Li, Y.; Zhang, Z.; Meng, Q. Exploring the Interactive Coercing Relationship between Urbanization and Ecosystem Service Value in the Shanghai-Hangzhou Bay Metropolitan Region. J. Clean Prod. 2020, 253, 119803. [Google Scholar] [CrossRef]
  3. Chen, S.; Liu, X.; Yang, L.; Zhu, Z. Variations in Ecosystem Service Value and Its Driving Factors in the Nanjing Metropolitan Area of China. Forests 2023, 14, 113. [Google Scholar] [CrossRef]
  4. McGrane, S.J. Impacts of Urbanisation on Hydrological and Water Quality Dynamics, and Urban Water Management: A Review. Hydrol. Sci. J. 2016, 61, 2295–2311. [Google Scholar] [CrossRef]
  5. Zhou, Q.; Leng, G.; Su, J.; Ren, Y. Comparison of Urbanization and Climate Change Impacts on Urban Flood Volumes: Importance of Urban Planning and Drainage Adaptation. Sci. Total Environ. 2019, 658, 24–33. [Google Scholar] [CrossRef]
  6. Jefferson, A.J.; Bhaskar, A.S.; Hopkins, K.G.; Fanelli, R.; Avellaneda, P.M.; McMillan, S.K. Stormwater Management Network Effectiveness and Implications for Urban Watershed Function: A Critical Review. Hydrol. Process. 2017, 31, 4056–4080. [Google Scholar] [CrossRef]
  7. Qiu, J.; Shen, Z.; Leng, G.; Xie, H.; Hou, X.; Wei, G. Impacts of climate change on watershed systems and potential adaptation through BMPs in a drinking water source area. J. Hydrol. 2019, 573, 123–135. [Google Scholar] [CrossRef]
  8. Jia, Y.; Wang, H.; Zhou, Z.; Qiu, Y.; Luo, X.; Wang, J.; Qin, D. Development of the WEP-L Distributed Hydrological Model and Dynamic Assessment of Water Resources in the Yellow River Basin. J. Hydrol. 2006, 331, 606–629. [Google Scholar] [CrossRef]
  9. Khaki, M.; Ait-El-Fquih, B.; Hoteit, I. Calibrating Land Hydrological Models and Enhancing Their Forecasting Skills Using an Ensemble Kalman Filter with One-Step-Ahead Smoothing. J. Hydrol. 2020, 584, 124708. [Google Scholar] [CrossRef]
  10. Aznarez, C.; Jimeno-Sáez, P.; López-Ballesteros, A.; Pacheco, J.P.; Senent-Aparicio, J. Analysing the Impact of Climate Change on Hydrological Ecosystem Services in Laguna del Sauce (Uruguay) Using the SWAT Model and Remote Sensing Data. Remote Sens. 2021, 13, 2014. [Google Scholar] [CrossRef]
  11. Liang, W.; Bai, D.; Wang, F.; Fu, B.; Yan, J.; Wang, S.; Feng, M. Quantifying the Impacts of Climate Change and Ecological Restoration on Streamflow Changes Based on a Budyko Hydrological Model in China’s Loess Plateau. Water Resour. Res. 2015, 51, 6500–6519. [Google Scholar] [CrossRef]
  12. Xu, F.; Zhao, L.; Jia, Y.; Niu, C.; Liu, X.; Liu, H. Evaluation of Water Conservation Function of Beijiang River Basin in Nanling Mountains, China, Based on WEP-L Model. Ecol. Indic. 2022, 134, 108383. [Google Scholar] [CrossRef]
  13. Wang, X.; Dai, C.; Liu, G.; Yang, X.; Jing, J.; Ru, Q. Runoff Prediction in the Songhua River Basin Based on WEP Model. Hydrology 2025, 12, 266. [Google Scholar] [CrossRef]
  14. Abebe, B.K.; Zimale, F.A.; Gelaye, K.K.; Gashaw, T.; Dagnaw, E.G.; Adem, A.A. Application of Hydrological and Sediment Modeling with Limited Data in the Abbay (Upper Blue Nile) Basin, Ethiopia. Hydrology 2022, 9, 167. [Google Scholar] [CrossRef]
  15. Dorjsuren, B.; Yan, D.; Yuheng, Y.; Zemtsov, V.A.; Dong, N.; Gao, H.; Demberel, O. Advancing Hydrological Understanding in Cold Regions: Development and Application of the WEP Model for Lateral Flow Estimation in the Great Lakes Depression of Mongolia. Hydrol. Res. 2025, 56, 244–259. [Google Scholar] [CrossRef]
  16. Acosta, A.L.; d’Albertas, F.; de Souza Leite, M.; Saraiva, A.M.; Walter Metzger, J.P. Gaps and limitations in the use of restoration scenarios: A review. Restor. Ecol. 2018, 26, 1108–1119. [Google Scholar] [CrossRef]
  17. Possantti, I.; Barbedo, R.; Kronbauer, M.; Collischonn, W.; Marques, G. A comprehensive strategy for modeling watershed restoration priority areas under epistemic uncertainty: A case study in the Atlantic Forest, Brazil. J. Hydrol. 2023, 617, 129003. [Google Scholar] [CrossRef]
  18. Shen, J.; Gao, X.; He, W.; Sun, F.; Zhang, Z.; Kong, Y.; Wan, Z.; Zhang, X.; Li, Z.; Wang, J.; et al. Prospect Theory in an Evolutionary Game: Construction of Watershed Ecological Compensation System in Taihu Lake Basin. J. Clean Prod. 2021, 291, 125929. [Google Scholar] [CrossRef]
  19. Fu, Y.; Zhang, J.; Zhang, C.; Zang, W.; Guo, W.; Qian, Z.; Liu, L.; Zhao, J.; Feng, J. Payments for Ecosystem Services for Watershed Water Resource Allocations. J. Hydrol. 2018, 556, 689–700. [Google Scholar] [CrossRef]
  20. Alvarez, X.; Valero, E.; Santos, R.M.B.; Varandas, S.G.P.; Fernandes, L.F.S.; Pacheco, F.A.L. Anthropogenic Nutrients and Eutrophication in Multiple Land Use Watersheds: Best Management Practices and Policies for the Protection of Water Resources. Land Use Pol. 2017, 69, 1–11. [Google Scholar] [CrossRef]
  21. Zhang, M.; Peng, C.; Shu, J.; Lin, Y. Territorial Resilience of Metropolitan Regions: A Conceptual Framework, Recognition Methodologies and Planning Response—A Case Study of Wuhan Metropolitan Region. Int. J. Environ. Res. Public Health 2022, 19, 1914. [Google Scholar] [CrossRef]
  22. Xiao, Y.; Lan, G.; Ou, Y.; Zhang, L.; Xia, J. Impact of Urbanization on the Spatial and Temporal Evolution of the Water System Pattern: A Study of the Wuhan Metropolitan Area in China. Ecol. Indic. 2023, 153, 110408. [Google Scholar] [CrossRef]
  23. Wang, T.; Li, H.; Huang, Y. The Complex Ecological Network’s Resilience of the Wuhan Metropolitan Area. Ecol. Indic. 2021, 130, 108101. [Google Scholar] [CrossRef]
  24. National Geomatics Center of China. National Geospatial Information Resource Catalogue Service System; Ministry of Natural Resources of the People’s Republic of China: Beijing, China, 2020; Available online: http://www.ngcc.cn/ (accessed on 10 November 2025).
  25. Resource and Environment Science and Data Center, Chinese Academy of Sciences. Resource and Environmental Science Data Platform; Resource and Environment Science and Data Center, Chinese Academy of Sciences: Beijing, China, 2020; Available online: http://www.resdc.cn/ (accessed on 10 November 2025).
  26. National Meteorological Information Center, China Meteorological Administration. National Meteorological Information Center Data Service Platform; National Meteorological Information Center, China Meteorological Administration: Beijing, China, 2020; Available online: http://data.cma.cn/ (accessed on 10 November 2025).
  27. Ministry of Water Resources of the People’s Republic of China. China Hydrological Yearbook; China Water & Power Press: Beijing, China, 2020. [Google Scholar]
  28. Provincial Water Resources Departments. Local Water Resource Bulletins; Provincial Water Resources Departments: Beijing, China, 2020. [Google Scholar]
  29. Hubei Provincial Government. Extracted Based on the “Hubei Province Comprehensive Watershed Management and Coordinated Development Plan”; Hubei Provincial Government: Wuhan, China, 2020. [Google Scholar]
  30. Local Water Administration Departments at Various Levels. Reservoir Distribution Data; Local Water Administration Departments: Beijing, China, 2020. [Google Scholar]
  31. NASA. MODIS (Moderate Resolution Imaging Spectroradiometer) Data Portal; NASA Goddard Space Flight Center: Greenbelt, MD, USA, 2020. Available online: https://modis.gsfc.nasa.gov/ (accessed on 10 November 2025).
  32. Yuan, Z.; Yin, J.; Wei, M.; Yuan, Y. Spatio-Temporal Variations in the Temperature and Precipitation Extremes in the Yangtze River Basin, China during 1961–2020. Atmosphere 2021, 12, 1423. [Google Scholar] [CrossRef]
  33. Goodchild, M.F.; Longley, P.A.; Maguire, D.J.; Rhind, D.W. Geographic Information Systems and Science; John Wiley & Sons: Chichester, UK, 2005. [Google Scholar]
  34. Ding, M.; Liu, W.; Xiao, L.; Zhong, F.; Lu, N.; Zhang, J.; Wang, K. Construction and Optimization Strategy of Ecological Security Pattern in a Rapidly Urbanizing Region: A Case Study in Central-South China. Ecol. Indic. 2022, 136, 108604. [Google Scholar] [CrossRef]
  35. Yan, Z.; Zhou, Z.; Liu, J.; Han, Z.; Gao, G.; Jiang, X. Ensemble Projection of Runoff in a Large-Scale Basin: Modeling with a Global BMA Approach. Water Resour. Res. 2020, 56, e2019WR026134. [Google Scholar] [CrossRef]
  36. Qin, C.; Jia, Y.; Su, Z.; Zhou, Z.; Qiu, Y.; Suhui, S. Integrating Remote Sensing Information into a Distributed Hydrological Model for Improving Water Budget Predictions in Large-Scale Basins through Data Assimilation. Sensors 2008, 8, 4441–4465. [Google Scholar] [CrossRef]
  37. Xu, F.; Jia, Y.; Niu, C.; Sobkowiak, L.; Zhao, L. Evaluating Spatial Differences in the Contributions of Climate Variability and Human Activity to Runoff Change in the Haihe River Basin. Hydrol. Sci. J. 2021, 66, 2060–2073. [Google Scholar] [CrossRef]
  38. Du, J.; Jia, Y.; Hao, C.; Qiu, Y.; Niu, C.; Liu, H. Temporal and Spatial Changes of Blue Water and Green Water in the Taihang Mountain Region, China, in the Past 60 Years. Hydrol. Sci. J. 2019, 64, 2040–2056. [Google Scholar] [CrossRef]
  39. Zhang, Z.; Chen, Y.; Zhang, G.; Zhang, X. Simulation of Hydrological Processes in the Jing River Basin Based on the WEP Model. Water 2023, 15, 2989. [Google Scholar] [CrossRef]
  40. Qualls, R.J.; Crago, R.D. Graphical Interpretation of Wet Surface Evaporation Equations. Water Resour. Res. 2020, 56, e2019WR026766. [Google Scholar] [CrossRef]
  41. Pan, S.; Pan, N.; Tian, H.; Friedlingstein, P.; Sitch, S.; Shi, H.; Running, S.W. Evaluation of Global Terrestrial Evapotranspiration Using State-of-the-Art Approaches in Remote Sensing, Machine Learning and Land Surface Modeling. Hydrol. Earth Syst. Sci. 2020, 24, 1485–1509. [Google Scholar] [CrossRef]
  42. Song, X.; Lu, F.; Xiao, W.; Zhu, K.; Zhou, Y.; Xie, Z. Performance of 12 Reference Evapotranspiration Estimation Methods Compared with the Penman–Monteith Method and the Potential Influences in Northeast China. Meteorol. Appl. 2019, 26, 83–96. [Google Scholar] [CrossRef]
  43. Wang, J.; Chen, L. The Effect of Hillslope Geometry on Hortonian Rainfall-Infiltration-Runoff Processes. J. Hydrol. 2021, 594, 125962. [Google Scholar] [CrossRef]
  44. Singh, N.K.; Emanuel, R.E.; McGlynn, B.L.; Miniat, C.F. Soil Moisture Responses to Rainfall: Implications for Runoff Generation. Water Resour. Res. 2021, 57, e2020WR028827. [Google Scholar] [CrossRef]
  45. Pörtner, H.O.; Farrell, A.P. Physiology and climate change. Science 2008, 322, 690–692. [Google Scholar] [CrossRef] [PubMed]
  46. Grimm, N.B.; Faeth, S.H.; Golubiewski, N.E.; Redman, C.L.; Wu, J.; Bai, X.; Briggs, J.M. Global Change and the Ecology of Cities. Science 2008, 319, 756–760. [Google Scholar] [CrossRef]
  47. Intergovernmental Panel on Climate Change (IPCC). Climate Change 2014: Synthesis Report; IPCC: Geneva, Switzerland, 2014. [Google Scholar]
  48. Moss, R.H.; Edmonds, J.A.; Hibbard, K.A.; Manning, M.R.; Rose, S.K.; Al, E. The next Generation of Scenarios for Climate Change Research and Assessment. Nature 2010, 463, 747–756. [Google Scholar] [CrossRef]
  49. Thomson, A.M.; Calvin, K.V.; Smith, S.J.; Kyle, G.P.; Volke, A.; Patel, P.; Delgado-Arias, S.; Bond-Lamberty, B.; Wise, M.A.; Clarke, L.E.; et al. RCP4.5: A Pathway for Stabilization of Radiative Forcing by 2100. Clim. Change 2011, 109, 77–94. [Google Scholar] [CrossRef]
  50. Cheng, S.; Li, C.; Yue, Y. Characteristics of Temporal and Spatial Changes of Temperature and Precipitation in Central China from 1961 to 2020. Water Resour. Hydropower Technol. 2023, 54, 75–86. [Google Scholar]
  51. Cariboni, J.; Gatelli, D.; Liska, R.; Saltelli, A. The Role of Sensitivity Analysis in Ecological Modelling. Ecol. Model. 2007, 203, 167–182. [Google Scholar] [CrossRef]
  52. Hu, X.; Ma, C.; Huang, P.; Guo, X. Ecological Vulnerability Assessment Based on AHP-PSR Method and Analysis of Its Single Parameter Sensitivity and Spatial Autocorrelation for Ecological Protection? A Case of Weifang City, China. Ecol. Indic. 2021, 125, 107464. [Google Scholar] [CrossRef]
  53. Xing, L.; Hu, M.; Wang, Y. Integrating Ecosystem Services Value and Uncertainty into Regional Ecological Risk Assessment: A Case Study of Hubei Province, Central China. Sci. Total Environ. 2020, 740, 140126. [Google Scholar] [CrossRef] [PubMed]
  54. Peh, K.S.-H.; Balmford, A.; Field, R.H.; Lamb, A.; Birch, J.C.; Bradbury, R.B.; Brown, C.; Butchart, S.H.M.; Lester, M.; Morrison, R.; et al. Benefits and Costs of Ecological Restoration: Rapid Assessment of Changing Ecosystem Service Values at a UK Wetland. Ecol. Evol. 2014, 4, 3875–3886. [Google Scholar] [CrossRef] [PubMed]
  55. Yu, D.; Ding, T. Assessment on the Flow and Vulnerability of Water Footprint Network of Beijing City, China. J. Clean Prod. 2021, 293, 126126. [Google Scholar] [CrossRef]
  56. Nazar, M.S.N.; Asadolahi, Z.; Rabbani, F.; Abbaspour, K.C.C.; Sakieh, Y. Modeling the Integrated Effects of Landuse and Climate Change on the Hydrologic Response of Gorganroud Watershed in Iran. Theor. Appl. Climatol. 2023, 151, 1687–1707. [Google Scholar] [CrossRef]
  57. Fashae, O.A.; Ayorinde, H.A.; Olusola, A.O.; Obateru, R.O. Landuse and Surface Water Quality in an Emerging Urban City. Appl. Water Sci. 2019, 9, 25. [Google Scholar] [CrossRef]
  58. Ahn, S.R.; Kim, S.J. Assessment of Climate Change Impacts on the Future Hydrologic Cycle of the Han River Basin in South Korea Using a Grid-Based Distributed Model. Irrig. Drain. 2016, 65, 11–21. [Google Scholar] [CrossRef]
  59. Worku, G.; Teferi, E.; Bantider, A.; Dile, Y.T. Modelling Hydrological Processes under Climate Change Scenarios in the Jemma Sub-Basin of Upper Blue Nile Basin, Ethiopia. Clim. Risk Manag. 2021, 31, 100272. [Google Scholar] [CrossRef]
  60. Gosling, S.N.; Taylor, R.G.; Arnell, N.W.; Todd, M.C. A Comparative Analysis of Projected Impacts of Climate Change on River Runoff from Global and Catchment-Scale Hydrological Models. Hydrol. Earth Syst. Sci. 2011, 15, 279–294. [Google Scholar] [CrossRef]
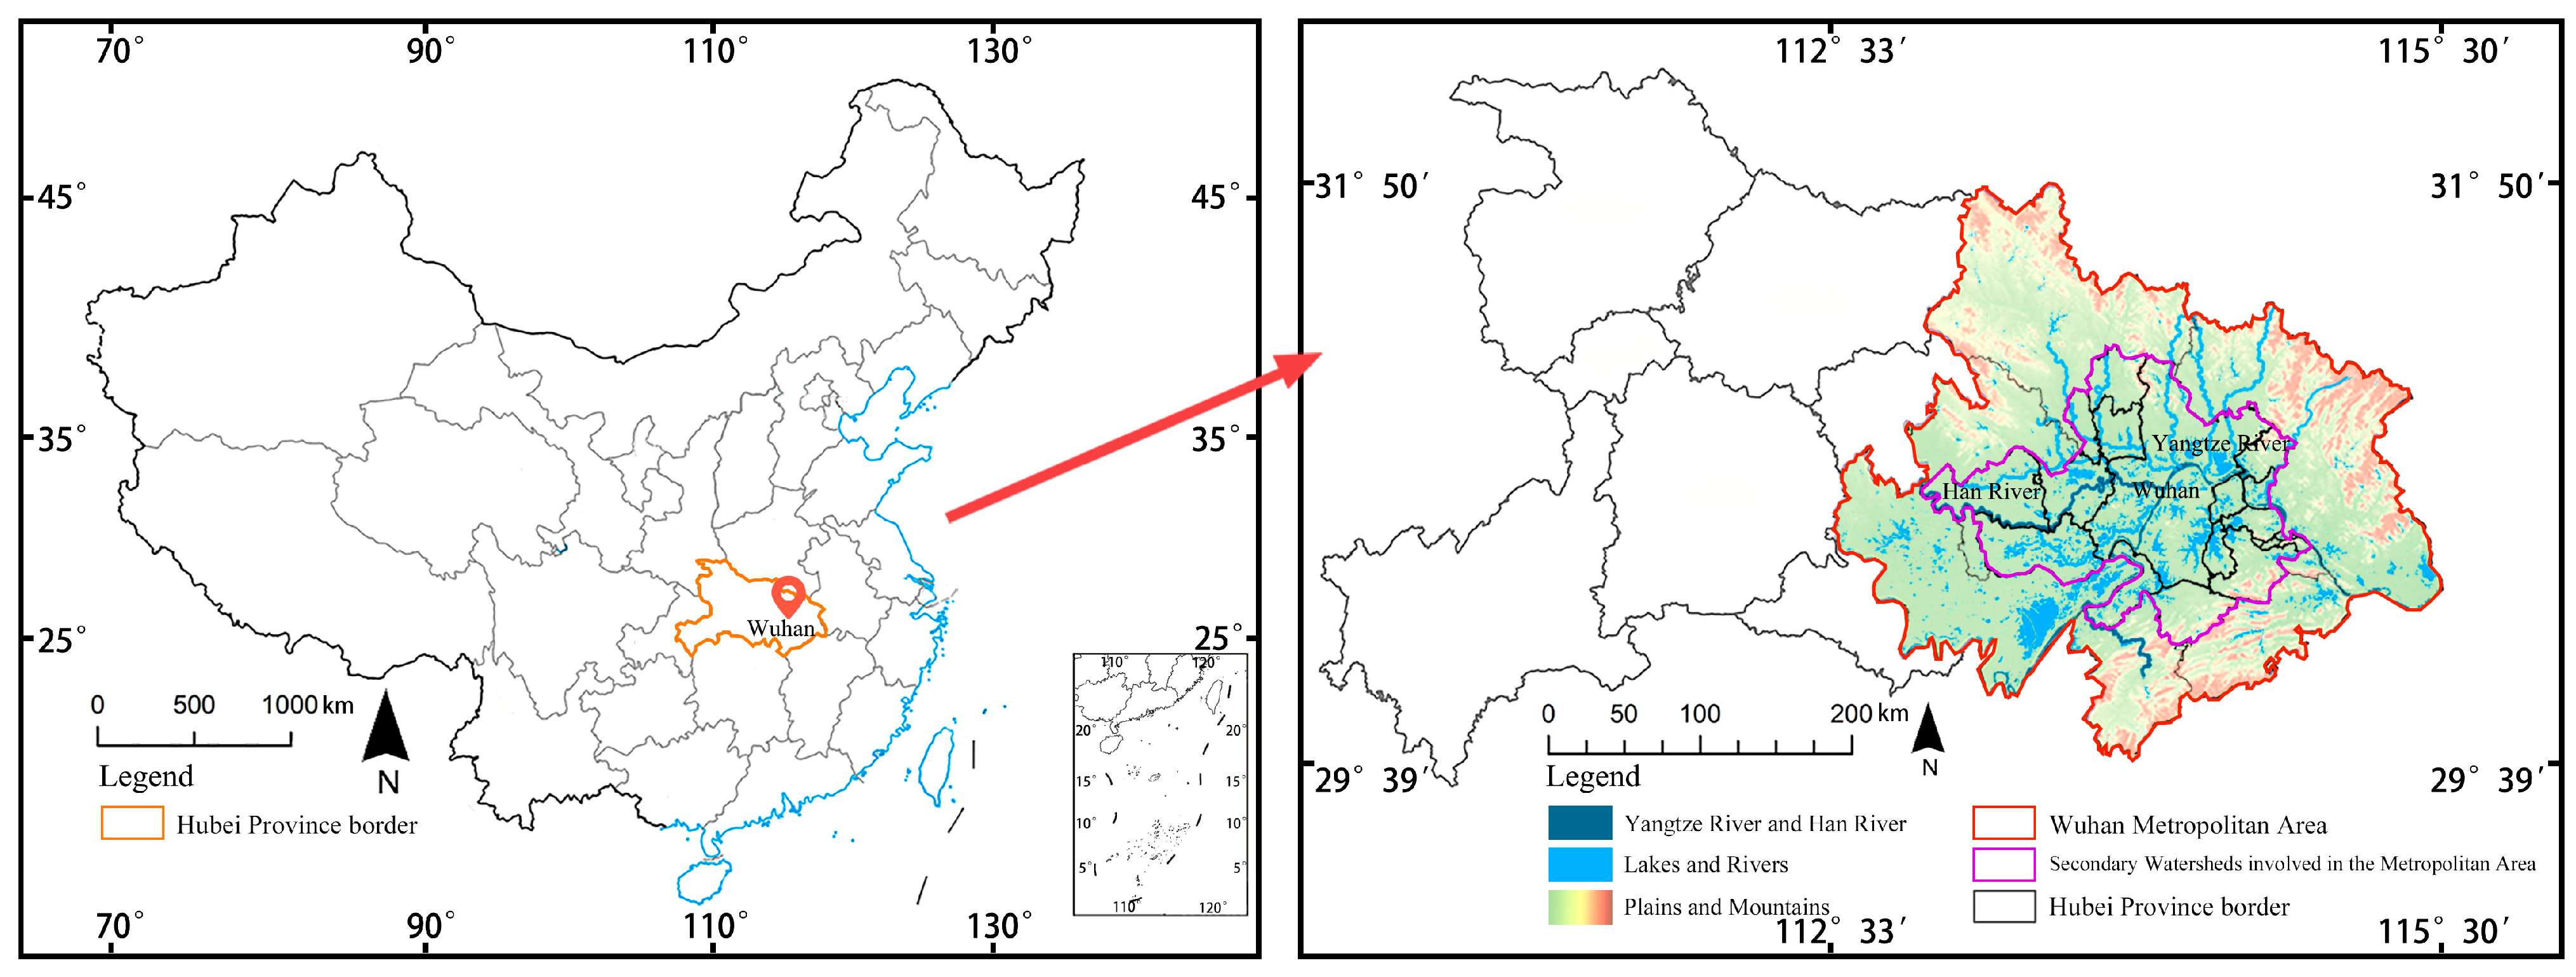
Figure 1. Study area.
Sustainability 17 10524 g001
Figure 2. Soil type data before and after processing in the study area.
Sustainability 17 10524 g002
Figure 3. Land use data after processing in the study area.
Sustainability 17 10524 g003
Figure 4. Distribution of meteorological stations and flow stations in the study area.
Sustainability 17 10524 g004
Figure 5. Research framework of the study.
Sustainability 17 10524 g005
Figure 6. The division of watershed control units in the study area.
Sustainability 17 10524 g006
Figure 7. Technical routes for ecological restoration zoning.
Sustainability 17 10524 g007
Figure 8. Calibration results after parameter adjustment.
Sustainability 17 10524 g008
Figure 9. Historical scenario simulation of precipitation, total evapotranspiration, total runoff and total water resources in the study area from 2016 to 2020.
Sustainability 17 10524 g009
Figure 10. Future scenario simulation of precipitation, total evapotranspiration, total runoff and total water resources in the study area in 2035.
Sustainability 17 10524 g010
Figure 11. The wuhan metropolitan area and the second-level watershed unit.
Sustainability 17 10524 g011
Figure 12. Monthly variation of simulated flow during the planning period in the Eastern Hubei Five Rivers Watershed Unit.
Sustainability 17 10524 g012
Figure 13. Monthly variation of simulated flow during the planning period in the Four Lakes Watershed Unit.
Sustainability 17 10524 g013
Figure 14. Ecological sensitivity of the study area.
Sustainability 17 10524 g014
Figure 15. Ecosystem services importance in the study area.
Sustainability 17 10524 g015
Figure 16. Ecological protection importance in the study area.
Sustainability 17 10524 g016
Figure 17. Ecological restoration importance classification of the study area.
Sustainability 17 10524 g017
Figure 18. Ecological restoration zones of the study area.
Sustainability 17 10524 g018
Table 1. Research data.
CategoryNameFormatTimeSource
Geographic Information DataWatershed BoundariesRaster Data
(30 m)
2020Extracted based on the “Hubei Province Comprehensive Watershed Management and Coordinated Development Plan” [29], township-level administrative boundaries, and river system data
Administrative DivisionsRaster Data
(30 m)
2020National Geospatial Information Resource Catalog Service System [24]
Digital Elevation Model (DEM)Raster Data (30 m)2020Resource and Environmental Science Data Center of the Chinese Academy of Sciences [25]
Flow Station LocationsRaster Data
(30 m)
2020“China Hydrological Yearbook” [27]
River System DataRaster Data
(30 m)
2020National Geospatial Information Resource Catalog Service System [24]
Reservoir DistributionRaster Data
(30 m)
2020Local Water Administration Departments at Various Levels [30]
Land Use DataRaster Data (30 m)2020Resource and Environmental Science Data Platform [25]
Vegetation Leaf Area IndexRaster Data
(500 m)
2020https://modis.gsfc.nasa.gov [31]
Vegetation CoverageRaster Data
(500 m)
2020https://modis.gsfc.nasa.gov [31]
Soil Type DataRaster Data
(1 km)
2020Environmental and Resource Data Center of the Chinese Academy of Sciences [25]
Meteorological DataStation InformationCSV File2020the National Meteorological Information Center [26]
Precipitation DataCSV File2016–2020the National Meteorological Information Center [26]
Temperature DataCSV File2016–2020the National Meteorological Information Center [26]
Wind Speed DataCSV File2016–2020the National Meteorological Information Center [26]
Sunshine Duration DataCSV File2016–2020the National Meteorological Information Center [26]
Relative Humidity DataCSV File2016–2020the National Meteorological Information Center [26]
Hydrological DataObserved Flow DataCSV File2016–2020“China Hydrological Yearbook” [27]
Water Use DataAgricultural Water Use DataCSV File2016–2020Local Water Resource Bulletins [28]
Industrial and Domestic Water Use DataCSV File2016–2020Local Water Resource Bulletins [28]
Table 2. Meteorological stations in the study area.
Station NameCodeLongitude (E°)Latitude (N°)Elevation (m a.s.l.)
Dawu57395114.11666731.56666774.9
Macheng57399114.9531.13333374.3
Xiaogan57482113.9530.925.5
Tianmen57483113.13333330.66666731.9
Wuhan57494114.0530.623.6
Honghu57581113.4529.81666727.4
Jiayu57583113.96666729.91666761.7
Yingshan58402115.66666730.733333123.8
Yangxin58500115.21666729.957
Table 3. Flow stations in the study area.
Station NameCodeLongitude (E°)Latitude (N°)
Hongan61610400114.6231.28
Yingcheng62209400113.5530.95
Yingshan61616000115.430.8
Luotian61617400115.730.75
Tianmen62206900113.1330.67
Chongyang61703000114.0529.53
Table 4. Average total runoff and total water resources in the Wuhan metropolitan area under historical scenarios from 2016 to 2020.
Administrative UnitTotal Runoff (mm)Total Water Resources (100 Million m3)
Wuhan14,83881.54
Xiaochang18248.78
Xiaonan22178.55
Yunmeng10234.83
Hanchuan264912.04
Tianmen268120.11
Xiantao319422.66
Jiayu33539.79
Xianning259815.61
Tuanfeng11127.77
Huangzhou8243.3
Ezhou10876.68
Huarong11425.61
Liangzihu13215.9
Dazhi247316.83
Table 5. Future scenario total runoff and total water resources in the Wuhan metropolitan area in 2035.
Administrative UnitTotal Runoff (mm)Total Water Resources
(100 Million m3)
Wuhan1826368.25
Xiaochang23725.05
Xiaonan29215.71
Yunmeng17153.14
Hanchuan33639.78
Tianmen352918.92
Xiantao415622.24
Jiayu399711.97
Xianning300214.92
Tuanfeng19535.29
Huangzhou16522.52
Ezhou19735.71
Huarong18464.14
Liangzihu21695.94
Dazhi329416.72
Table 6. Management and control requirements for ecological restoration zones in the study area.
TypeEcological
Restoration Zone
Watershed Dimension Control Requirements
Farmland EcosystemI—Comprehensive Farmland Restoration ZoneFocus on comprehensive management of watershed water resources. Implement scientific farmland water conservancy projects, including the planning, construction, and management of water conservancy facilities, to ensure the rational use and protection of farmland water resources. Simultaneously, take measures to reduce agricultural non-point source pollution, including reasonable fertilization and scientific pesticide use, to prevent negative impacts of agricultural activities on watershed water quality.
Forest EcosystemII—Forest Ecological Restoration ZoneFocus on maintaining and improving the hydrological environment. Strengthen forest protection, maintain the integrity of forest ecosystems, and ensure the functions of forests in water conservation and water quality purification. Concurrently, implement forest ecological projects, such as afforestation and protective forest construction, to promote the efficient operation of the hydrological cycle and maintain the stability of watershed water resources.
Composite EcosystemIII—Composite Soil and Water Conservation Restoration ZoneEmphasize the organic combination of soil and water conservation measures with water resource management. Implement various soil and water conservation projects, including terrace construction, vegetation restoration, and slope covering, to reduce soil erosion, improve soil conservation, and ensure the reduction of surface runoff, maintaining the stability of watershed water quality. Additionally, strengthen the coordination between soil and water conservation measures and farmland water conservancy facilities to promote the comprehensive utilization of water resources.
River and Lake Wetland EcosystemIV—River and Lake Wetland Water Ecological Restoration ZoneFocus on the restoration and protection of aquatic ecosystems. Strengthen the ecological restoration of river and lake wetlands, including planting aquatic plants, restoring and protecting wetlands, to enhance the self-purification capacity of water bodies and improve the water quality environment. At the same time, strictly control pollutant discharge to protect the integrity of wetland and aquatic ecosystems and maintain the health of watershed water ecology.
Urban EcosystemV—Urban Habitat Improvement Restoration ZoneEmphasize the comprehensive management and utilization of urban water resources. Strengthen the protection and utilization of urban water resources, including promoting the construction of a water-saving society, building rainwater utilization facilities, and improving the urban water environment, to enhance the sustainable utilization of urban water resources. At the same time, strengthen urban water environment management, reduce pollutant discharge, improve urban water quality, and enhance the quality of the urban living environment.
Table 7. The comprehensive management plans for the “four waters” of watershed unit.
Watershed
Water Security
Watershed
Water Resources
Watershed
Water Environment
Watershed
Water Landscape
Eastern Hubei Five Rivers Watershed UnitIt is recommended to create green ecological corridors in the upstream river sections to restore river ecology, serve surrounding urban development, and provide shared urban space resources and natural carriers.It is recommended to prioritize adjusting agricultural planting structures, develop water-saving disaster-resistant agriculture, and add pumping stations to supplement water shortages in the north.Strengthen comprehensive management of small watersheds, return orchards to forests around water sources, and adopt enhanced sewage interception + decentralized retention mode in the southwest.In sections of Wuhan and Ezhou, widen the river cross-sections according to flood requirements, mainly using greenways and boardwalks, combined with existing municipal roads to build a complete transportation system. Additionally, retention ponds and artificial wetlands will be added outside the flood cross-sections.
Four Lakes Watershed Unitcarry out flood control remediation while maintaining the current river course, by appropriately widening and raising embankments, revamping bank protection, dredging, and clearing obstacles to consolidate flood control goals.build new pumping stations to interconnect regional reservoirs and channels, providing emergency water sources during droughts.Strengthen the construction and management of farmland water conservancy facilities and promote water-saving irrigation techniques. Enhance source protection at water sources, manage surrounding land use, restrict non-agricultural activities and pollutant discharge to ensure the safety of drinking water sources.At important water inlets on the east side, widen the river cross-sections according to flood requirements, and combine large lakes and flood detention areas to create leisure ecological seasonal landscapes, forming a new city waterfront landscape at the upper reaches of the Yangtze River.
Disclaimer/Publisher’s Note: The statements, opinions and data contained in all publications are solely those of the individual author(s) and contributor(s) and not of MDPI and/or the editor(s). MDPI and/or the editor(s) disclaim responsibility for any injury to people or property resulting from any ideas, methods, instructions or products referred to in the content.