1. Introduction
Analysing wastewater management with a view to developing circular economy solutions necessitates the treatment and reuse of wastewater, leading to a recovery of valuable materials and reduction in waste. This strategy aims to mitigate the environmental impacts, conserve resources, and potentially derive economic benefits from waste streams. Among the most water-intensive of human activities, the textile sector can significantly contaminate water bodies [
1]. It consumes a considerable amount of water, particularly due to the dyeing methods used requiring extensive water usage. The volume of water being used varies depending on the specific techniques, substances, and technologies implemented; however, estimates suggest it can range from 30 to 150 L per kilogram of fabric during the dyeing phase [
2]. A similar issue currently affects paint production. Wastewater from paint production poses significant environmental challenges owing to its high paint residue content, which can contaminate water bodies and harm the aquatic life [
3]. Paint production facilities generate wastewater with elevated levels of chemical oxygen demand (COD), turbidity, organic materials, suspended solids, and heavy metals (HMs). The dry mass in wastewater is one of the key indicators of the quality of sewage sludge, which is often used to assess the efficiency of treatment processes. This refers to the total mass remaining after water removal, the analysis of which allows for the assessment of the percentage content of solid substances, including heavy metals accumulated in them. To meet the United Nations’ Sustainable Development Goals (SDGs), particularly Goal 6 (access to clean water and sanitation) and Goal 14 (marine life), it is essential to process wastewater before its release into natural water bodies [
4]. Dye wastewater is categorised as an industrial effluent that poses significant challenges for treatment processes. The diverse technological steps and processes involved in fabric processing and finishing preclude the establishment of standard production processes. Consequently, no typical wastewater composition or quantity is produced [
5]. A similar issue has been observed in wastewater from paint production, which typically involves a combination of physical, chemical, and biological processes. Commonly used techniques include assessment, blending, balancing, chemical separation (coagulation/flocculation), surface binding, biological processes (activated sludge and membrane bioreactors), and membrane separation (ultrafiltration, nanofiltration, and reverse osmosis) [
6]. Biological treatment is the most prevalent method of wastewater treatment whose efficiency largely depends on the averaging of wastewater and equalisation of its inflow to activated sludge chambers [
5]. Mechanical treatment methods are frequently used in conjunction with biological treatments. Among chemical methods, neutralisation and oxidation are the most widely used. Coagulation-flocculation is particularly notable as the most effective chemical method for reclaiming paint from wastewater. This process necessitates the introduction of substances, such as polyaluminium chloride or sulphate, into the wastewater, resulting in the formation of a suitable sludge that is subsequently used to recover the paint [
3]. Owing to stringent regulations, significant efforts are being directed towards the development of more effective and efficient methods for treating wastewater from the paint industry. A notable trend in recent advancements is the application of nanotechnology to enhance treatment efficiency as well as the integration of multiple treatment methodologies. For instance, Ejimofor et al. (2021) [
7] conducted a study on a sludge recovered after particle removal from emulsion paint batch wash-off (paint industrial wastewater) through a jar test experiment (PCS) utilising a natural coagulant (ZNC). Their findings suggest that this sludge can be effectively managed using anaerobic digestion [
7]. Alternatively, El-Shazly et al. (2010) proposed a different approach, advocating for a procedure involving physical or chemical treatment followed by filtration, employing palm hemp as the filtration medium [
8]. Yet another approach is to couple coagulation with an electrochemical approach or combine the use of chemical and biological processes [
9]. Viktoryova et al. [
10] identify suspended soils as the primary pollutants necessitating reduction. The latter propose the integration of physicochemical and electrochemical methods, which could effectively mitigate the challenges associated with substantial volumes of wastewater being frequently discharged directly into surface water bodies, potentially achieving significant reductions in COD and suspended solids (SS). Effective sludge management can produce beneficial outcomes when an appropriate technique is applied to a specific sludge type [
7,
11]. Following treatment, repurposing sludge can mitigate the burden of sludge disposal in existing landfills, further contributing to reducing its environmental impact [
10].
The paint industry encompasses the manufacturing of various types of paints, enamels, varnishes, lacquers, wood fillers, putties, sealants, and other related paint products, as well as paint and varnish removers and brush cleaners [
9,
12]. It has been demonstrated that the primary elements in wastewater from the paint industry emanate from the cleaning processes of machinery and activities of different units involved in the manufacturing of paint [
9,
10,
13]. By implementing a circular approach, the paint industry can significantly reduce waste generation, diminish its environmental impact, and generate economic opportunities by repurposing and recycling the treated wastewater and by-products [
9,
14].
Numerous studies and surveys have been conducted regarding the use of water and energy, waste generation, and the enhancement of resource management [
15]. The fundamental approach to minimising water usage can be realised through enhancements in relevant equipment or through the use of technological solutions. To lessen waste and lower expenses, preventing waste and then aiming for reuse, recycling, and appropriate disposal of anything that cannot be avoided should be prioritised. Important aspects comprise improving processes to reduce material consumption, limiting packaging, and establishing effective inventory control. Additionally, involving staff and customers to reduce waste and exploring waste-to-energy solutions can lead to substantial cost savings [
16]. Smol et al. (2020) have proposed a framework for a circular economy model in the water and wastewater industry, which encompasses six key actions: (i) reduction—minimising wastewater production by decreasing water consumption and reducing pollution at its source; (ii) reclamation (removal)—utilising effective technologies to eliminate pollutants from water and wastewater; (iii) reuse—employing wastewater as an alternative water supply for non-drinking purposes; (iv) recycling—extracting water from wastewater for drinking purposes; (v) recovery—retrieving resources like nutrients and energy from water-based waste; and (vi) rethink—reconsidering resource usage to establish a sustainable economy devoid of waste and emissions [
17]. Hogland and Stenis (2000) examined different approaches to waste management at the Stora Enso Hylte AB paper mill in Sweden and also proposed the planning of designated areas for waste collection and material recovery, as well as determining the timing and method for emptying containers and bins, among other factors [
18]. A different approach was presented by Hussain (2024), who suggested a framework that uses multi-agent simulation to analyse and evaluate the interactions within a smart waste management system powered by IoT (the Internet of Things) [
19].
Although physical-chemical methods are effective, they present challenges, such as problems with sludge disposal and the high costs associated with electricity, materials, and operations [
1,
20]. Research has demonstrated that the primary constituents of wastewater effluent from the paint industry emanate from the cleaning of equipment and various unit operations employed during production [
8]. Consequently, water that has been adequately treated can be effectively recycled and reused in production processes as a coolant, dilutant, or as a component of low-cost paint, thereby contributing to efficient water management [
21]. Further research is required to improve sustainable practices in the paint industry that emphasise the importance of adopting circular economy principles. The circular economy underscores the importance of water and wastewater management practices, indicating that the objectives of the circular economy, in as far as they concern the water and wastewater sector, can be achieved through a more sustainable management of water resources and a more efficient disposal and treatment of wastewater and other water-related wastes [
17].
The Monte Carlo method helps predict the effects of uncertain factors on complex systems. It is used in environmental risk assessment to predict pollution and health risks, often by running several simulations. It is also used in life cycle assessments to handle data uncertainty and in ecosystem modelling to show changes over time. By simulating different outcomes, a range of results is obtained. This provides a clearer picture of the possible risks, thereby aiding in decision-making. Student’s t-test was used to determine whether the results in one group were higher or lower than those in the other group, along with establishing whether any differences were statistically significant. The statistical distribution (or probability distribution) was also analysed, which describes how the values of a variable are distributed, showing which values occur frequently and which ones rarely do.
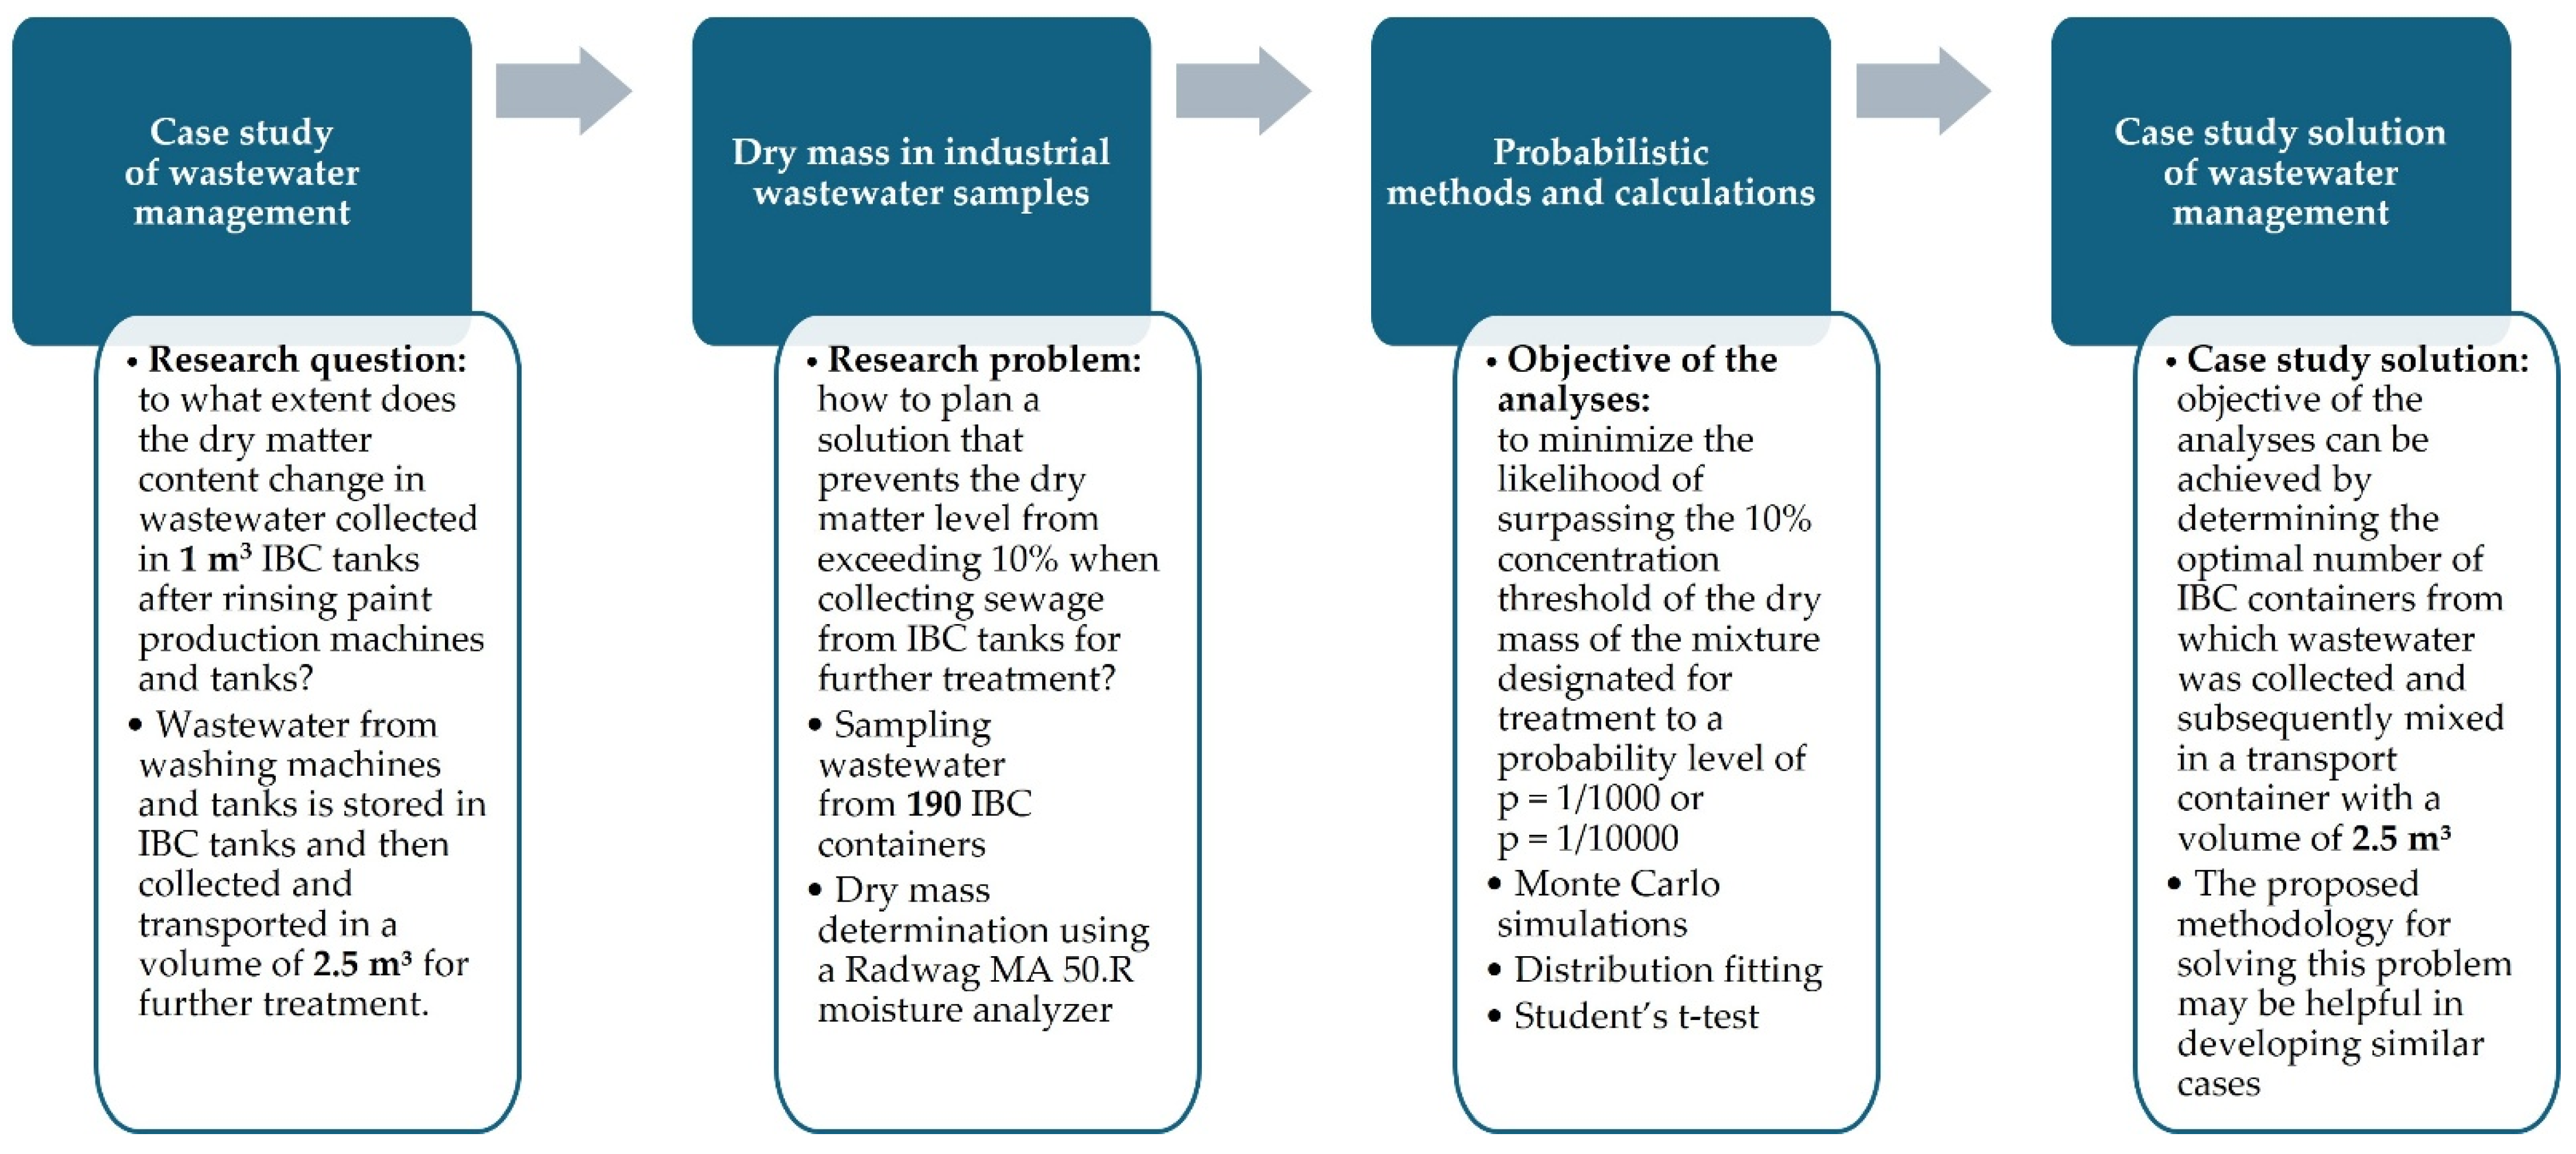
The aim of this study was to establish a methodology for collecting wastewater from rinsing machines and containers within the paint manufacturing sector and to identify best practices in raw wastewater management. The specific objective was to devise a procedure for the random sampling of 1 m3 containers of stored wastewater, ensuring that the dry mass content does not exceed 10% of the wastewater designated for treatment. In this domain, effective management can enhance the treatment of industrial wastewater and potentially contribute to the development of solutions for the reuse of rinse wastewater, in alignment with circular economy principles.
3. Results
Industrial wastewater, generated from the rinsing processes of paint production machinery and equipment, was collected in 1 m3 Intermediate Bulk Container (IBC) units. The analysed company utilises approximately 300–350 containers on a rotational basis. The rinsing of machinery produces between 0.3 and 0.5 m3 of wastewater, whereas tank cleaning results in 2 to 5 m3. Over time, sedimentation leads to the accumulation of sludge at the bottom of the IBC tanks, comprising approximately 40% of the tank’s volume. The tanks are subsequently sent to specialised waste collection companies for disposal. Wastewater is collected from filled tanks awaiting transfer to a larger tank with a capacity of 2.5 to 3 m3, which is then transported to in-house chemical or biological industrial wastewater treatment facilities. A high dry mass content in wastewater may necessitate substantial chemical usage, impede the efficiency of the treatment process, and significantly extend its treatment duration. Currently, the primary challenge is the inconsistent percentage of dry mass in industrial wastewater. Consequently, this study aimed to assess the dry mass content in samples obtained from IBCs and to propose a method for standardising the composition of industrial wastewater towards enhancing wastewater management practices.
3.1. Analysis of Dry Mass Determination Results
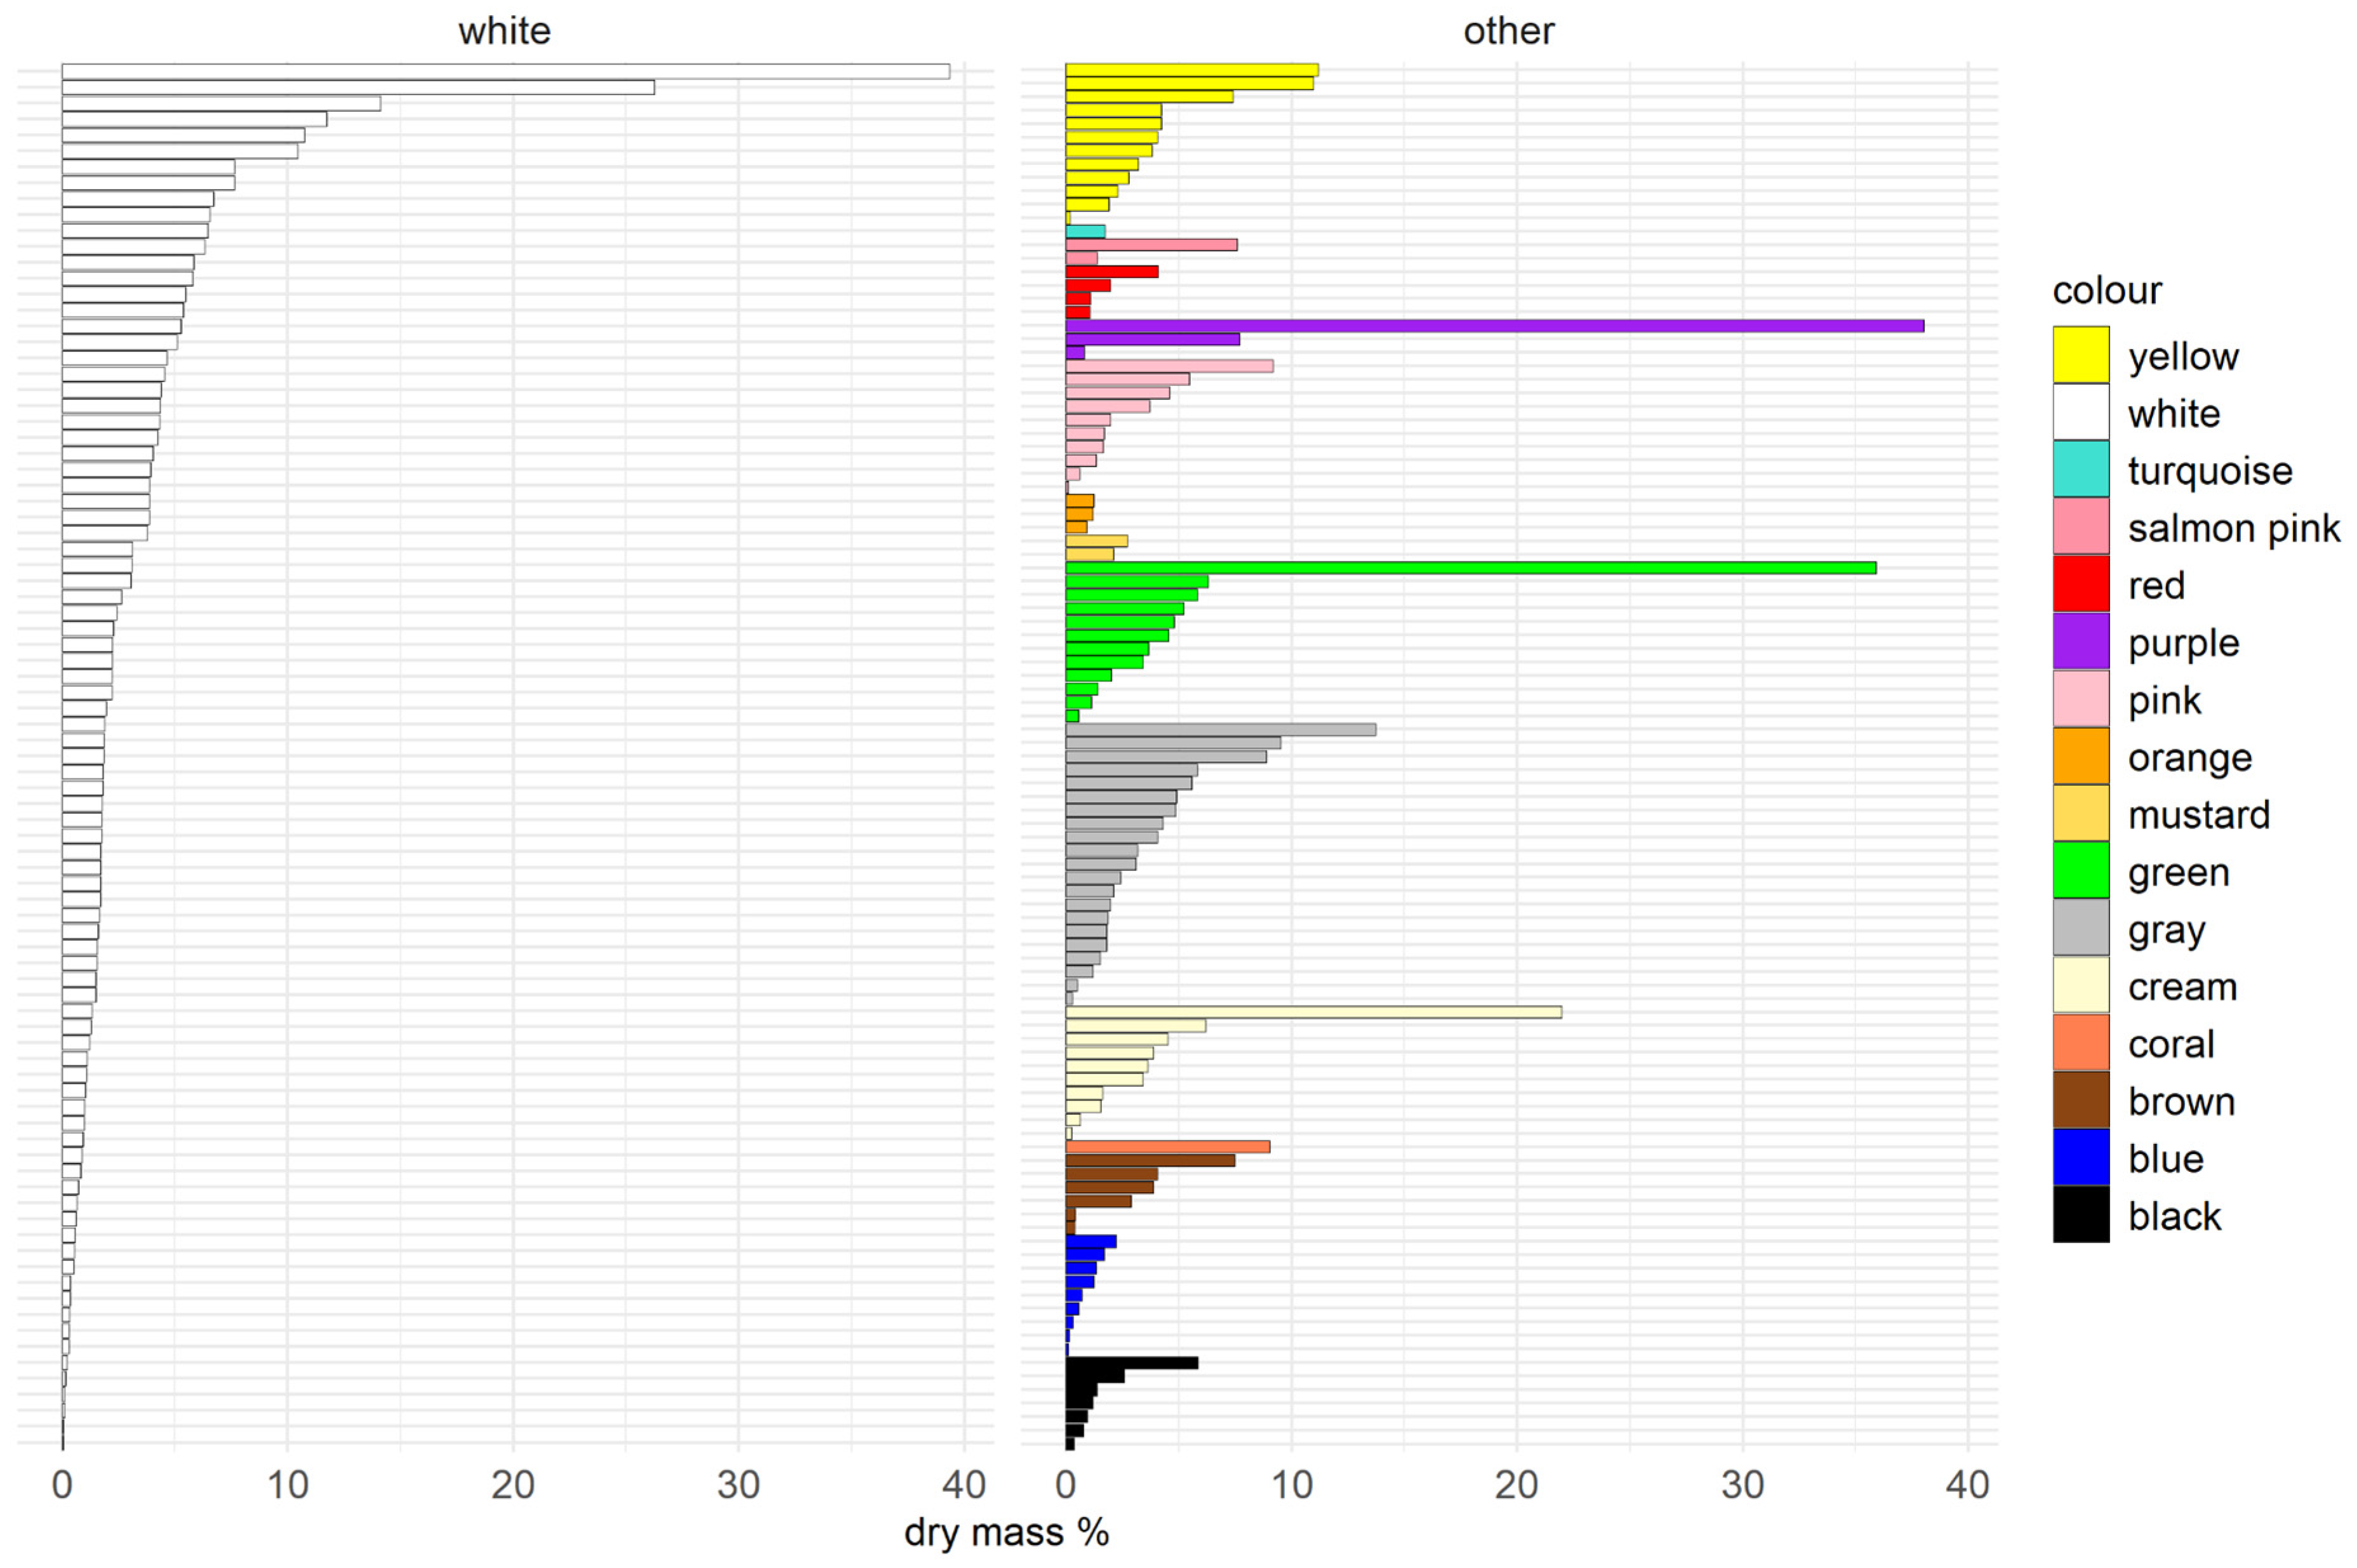
Of the 190 samples analysed, the mean dry mass content was 3.83%. The minimum recorded value was 0.05%, while the maximum was 39.35%, both of which were observed in white samples. Most samples conformed to the acceptable dry mass content criterion of less than 10%, posing no technological obstacle to the proposed chemical treatment of wastewater. However, in 12 instances, accounting for 6% of the containers tested, the threshold value of 10% was surpassed, and in five of those, the dry mass content exceeded 20%. Of the 190 samples tested, 87 were white, with the remaining samples being distributed across 15 colour categories (
Figure 2).
As mentioned, the mean dry mass content of the analysed samples was 3.83%, with a median value of 2.1%. This suggests that the average level of contamination in the tested samples was relatively low. However, the standard deviation of 5.55% indicates considerable variability in the results. The 99% confidence interval for the mean ranged from 2.78% to 4.88%, indicating with 99% certainty that the average dry mass content in the company’s wastewater was below 5% (
Table 1).
While examining the various colours of the wastewater, an analysis was conducted to assess their potential influence on the percentage of dry mass. A Student’s
t-test for the equality of means was performed, revealing that at a 5% significance level, there was insufficient evidence to assert that paint colour impacted the average dry mass content in the stored containers. On the one hand, colour is not a significant factor in terms of its impact on the dry mass content, as can be clearly seen in
Figure 2. On the other hand, the amount of dry mass in the sewage collected in containers is indirectly dependent on the amount of water used to rinse production machines after manufacturing different coloured paints. Consequently, in subsequent phases of the case study, categorisation by wastewater colour was not considered.
3.2. Calculating the Optimal Number of IBCs for Reducing Risk to an Acceptable Level
Although the average dry mass content values were low, there remained the risk of selecting one or more containers with elevated wastewater concentrations. According to the applicable procedure, contents at a maximum of 3–4 IBCs are mixed in a 2.5 m3 transport tank, thereby incurring the risk of exceeding the permissible dry mass concentration. To mitigate the costs and challenges associated with the treatment or further utilisation of wastewater that exceeded the 10% threshold, a minimum number of containers to be mixed was established. This approach ensured the production of a mixture that complied with normative requirements, i.e., maintaining a dry mass content below 10% with a probability of at least 0.999. This significantly reduces the risk of exceeding the norm to 1/1000, which is considered safe.
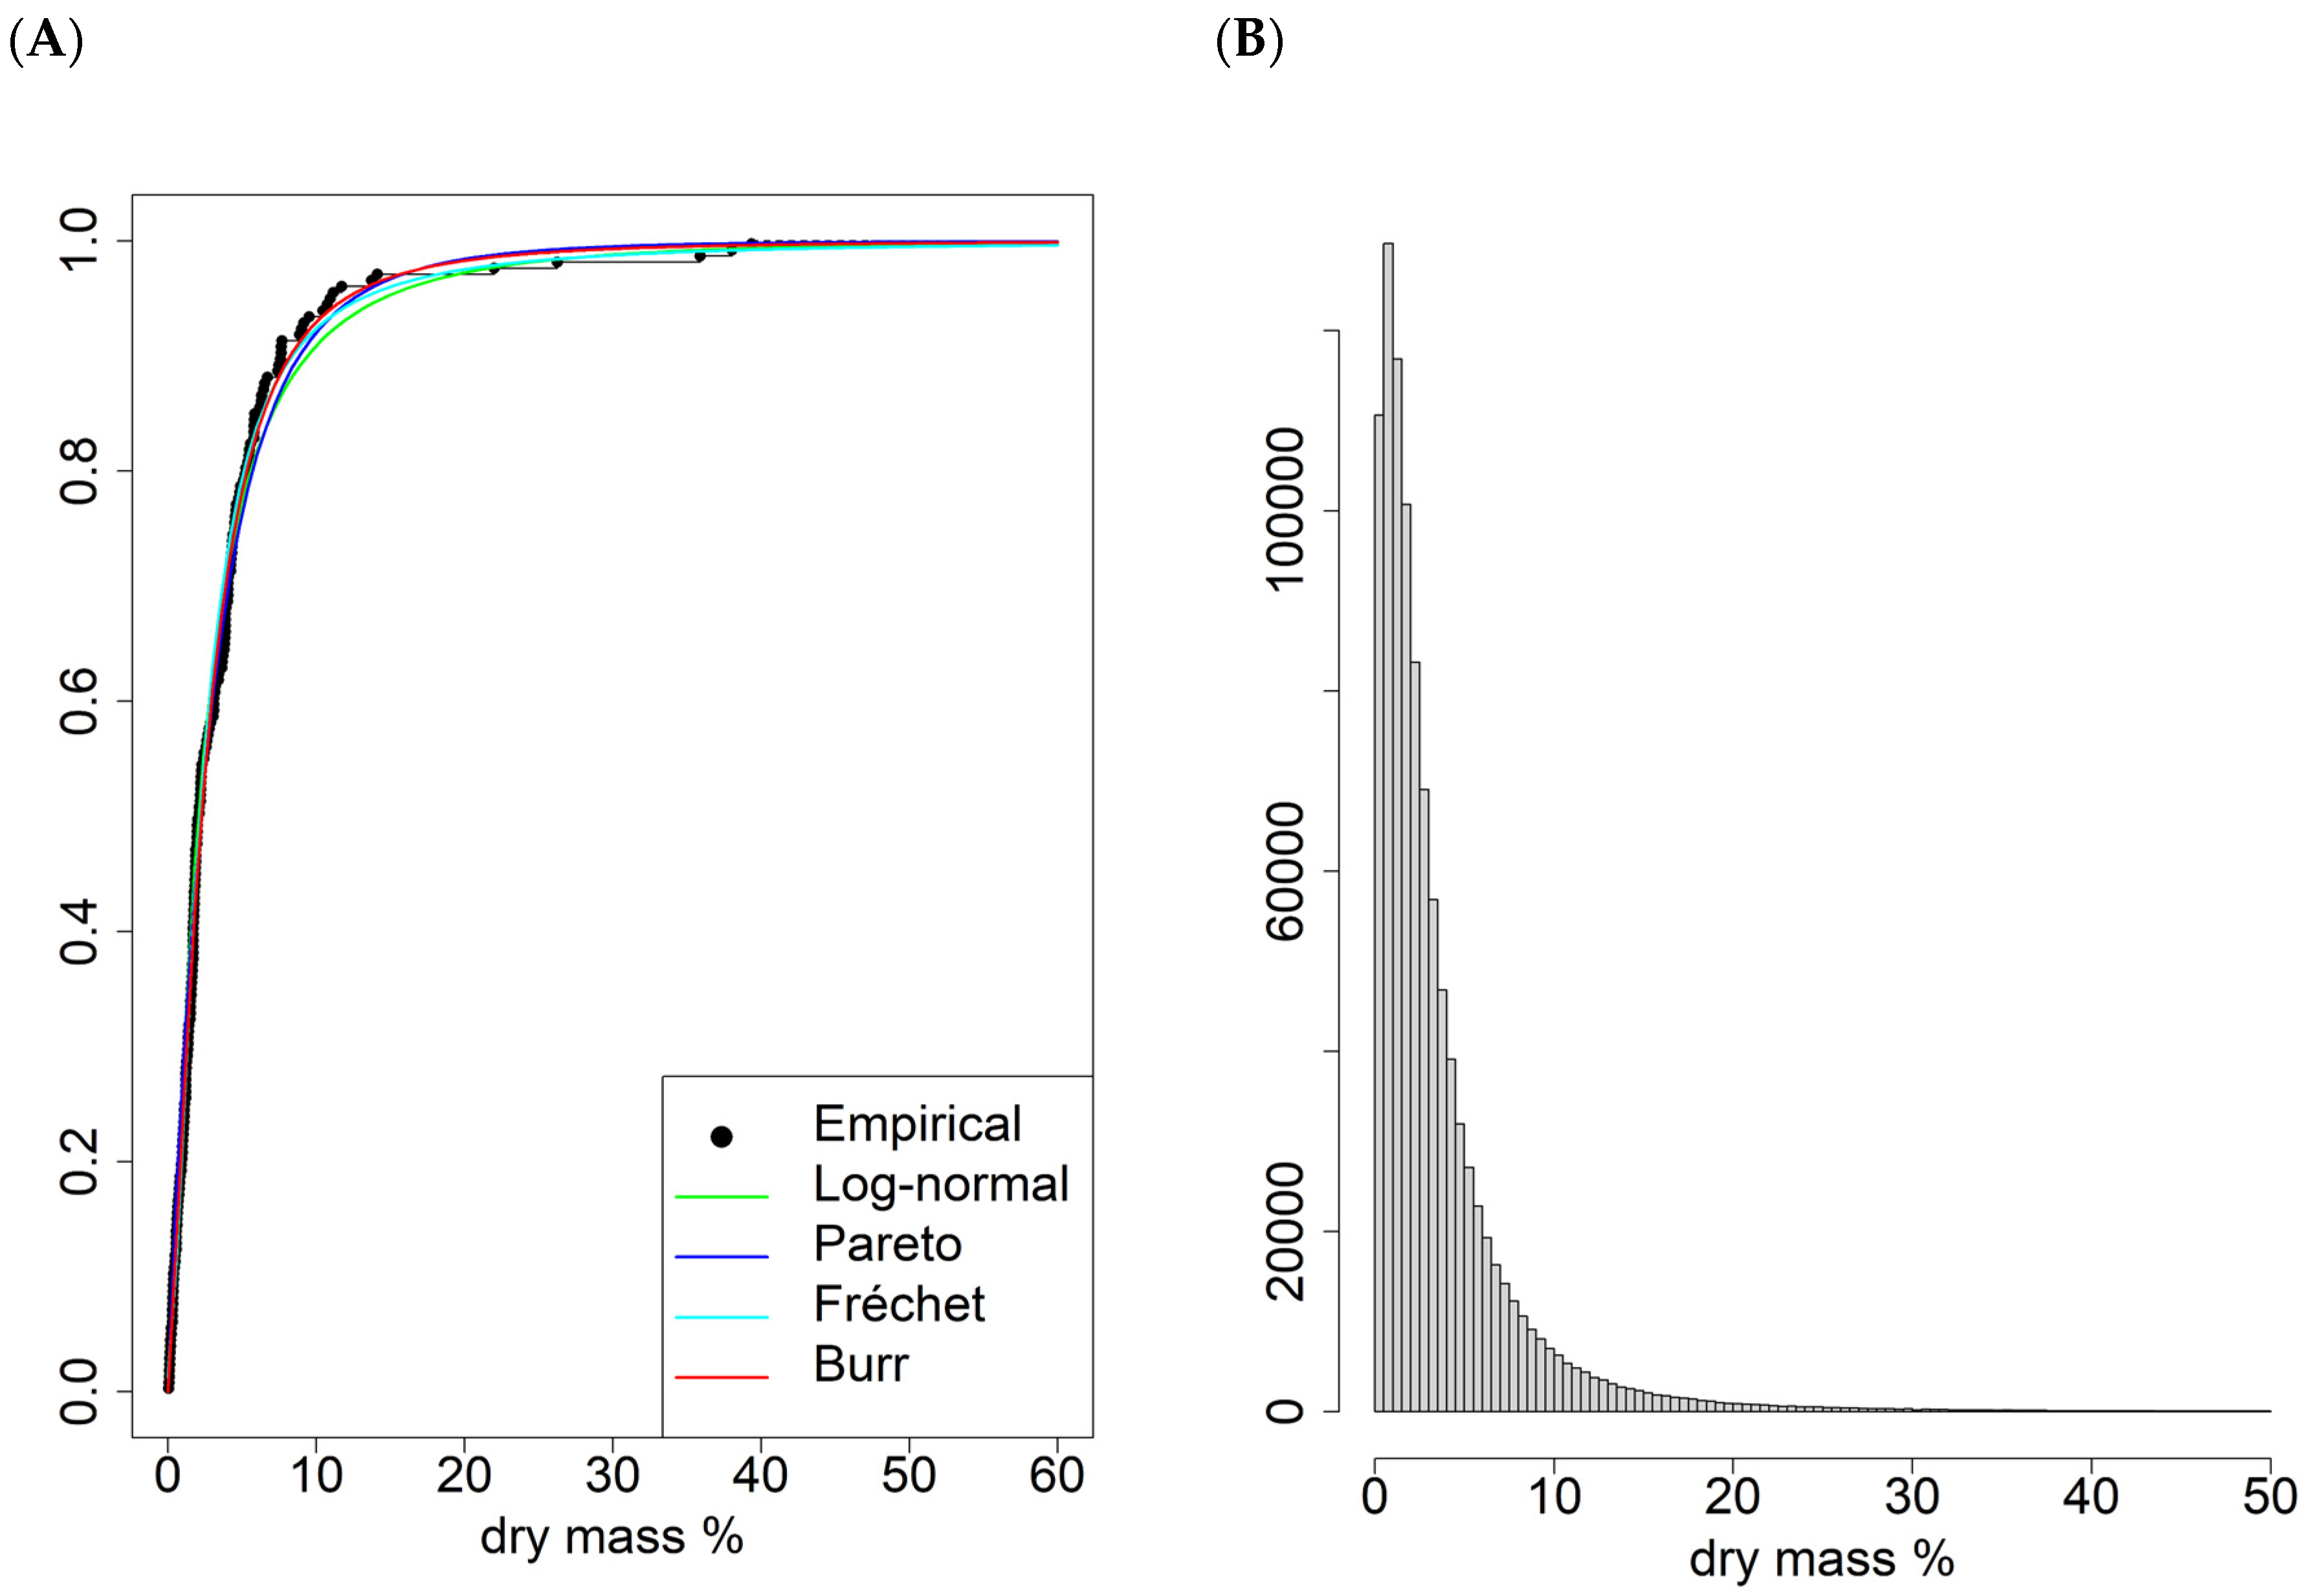
To facilitate the necessary calculations, a simulation of the distribution of all potential containers produced during the manufacturing process was conducted. For this analysis, four heavy-tailed distributions—Log-normal, Pareto, Fréchet, and Burr—were fitted to the data derived from the 190 samples, with each having its percentage of dry mass content determined (
Figure 3A). The fit of these distributions to the empirical data was evaluated based on goodness-of-fit statistics, including the Kolmogorov–Smirnov, Cramér-von Mises, and Anderson-Darling tests. The Burr distribution yielded the lowest values for these statistics, indicating its superior fit to the empirical distribution compared to the other distributions considered. Furthermore, the Burr model also exhibited the lowest values for the Akaike Information Criterion (AIC) and Bayesian Information Criterion (BIC), thereby affirming its efficacy as the most accurate representation of the variability in dry mass content within the analysed samples (
Table 2).
Consequently, the Burr distribution was selected for further analysis, accompanied by its estimated shape and scale parameters: shape1 = 1.952895, shape2 = 1.284881, and scale = 4.375212, respectively. This distribution provides a robust foundation for subsequent analyses and serves as a reasonable approximation of the potential pollution concentrations characterising full sewage tanks during the production process. However, it requires some modifications. In the theoretical Burr distribution, the right tail extends to infinity, implying that the distribution permits, albeit with minimal probability, concentration values of 70%, 80%, and even 200% or 500%. These values are physically implausible. Therefore, in the subsequent phase, the Burr distribution was constrained to more accurately reflect the achievable dry mass concentrations in the containers. Experts have established a maximum permissible concentration level of 50%.
The Burr distribution was modified using a Monte Carlo simulation. A total of one million numbers were randomly drawn from the uniform distribution U(0, 1) and subsequently scaled to the interval [0, 0.9979629], where 0.9979629 represents the cumulative distribution function value of the Burr distribution at x = 50 (i.e., P(X ≤ 50) = 0.9979629). This process resulted in one million observations from the uniform distribution U(0, 0.9979629). For each probability, the corresponding quantiles were calculated using the inverse function of the Burr distribution. Consequently, a simulation of one million potential values for the percentage of dry mass content in the tanks was generated with a maximum concentration limit of 50%. A histogram depicting the distribution of these values is presented in
Figure 3B.
In the subsequent phase, from a population of 1 million representing potential contamination levels in the stored Intermediate Bulk Containers (IBC), samples of size k (where k = 1, 2, 3, …, 20) were randomly selected. For each set of randomly selected containers, the mean concentration was computed, reflecting the contamination level of the mixture formed by combining k containers. A total of 1 million simulations were conducted for each sample size (k = 1, 2, 3, …, 20). Based on the outcomes of these simulations, the probability distributions of the concentration of contamination in the mixture were estimated, contingent upon the number k of the combined IBCs.
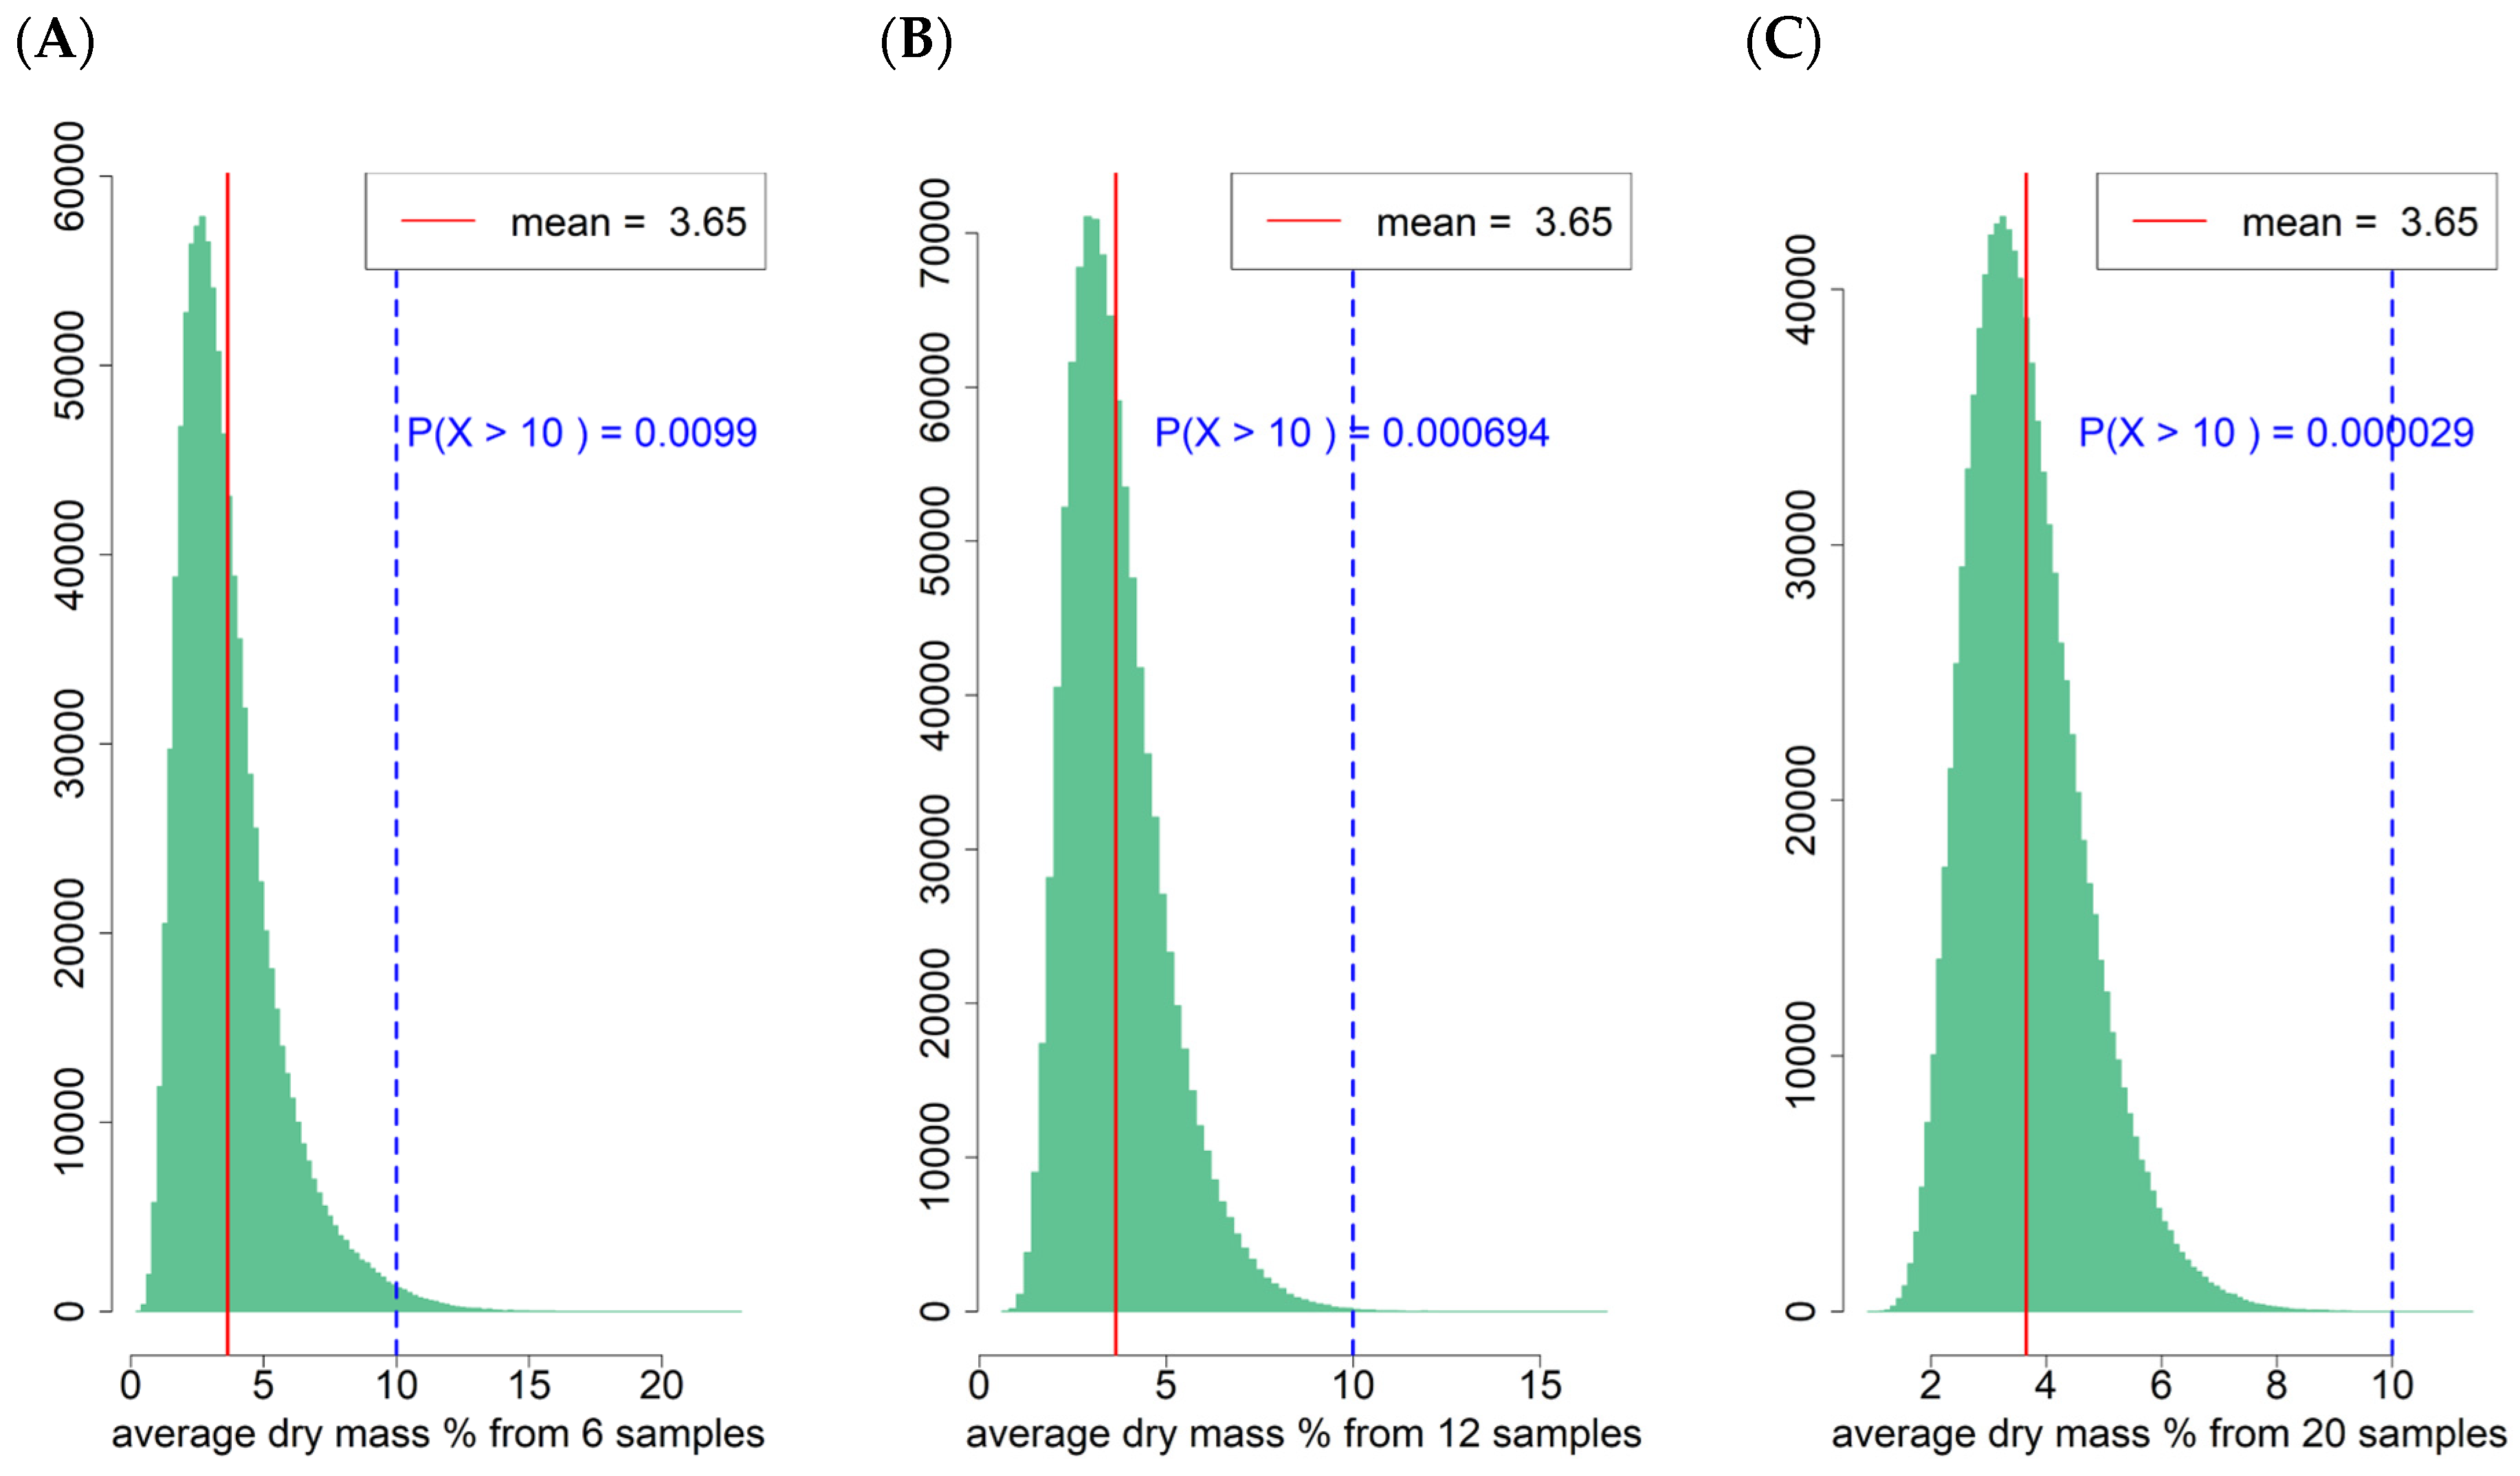
The simulation histograms for k = 6, 12, and 20 IBCs (
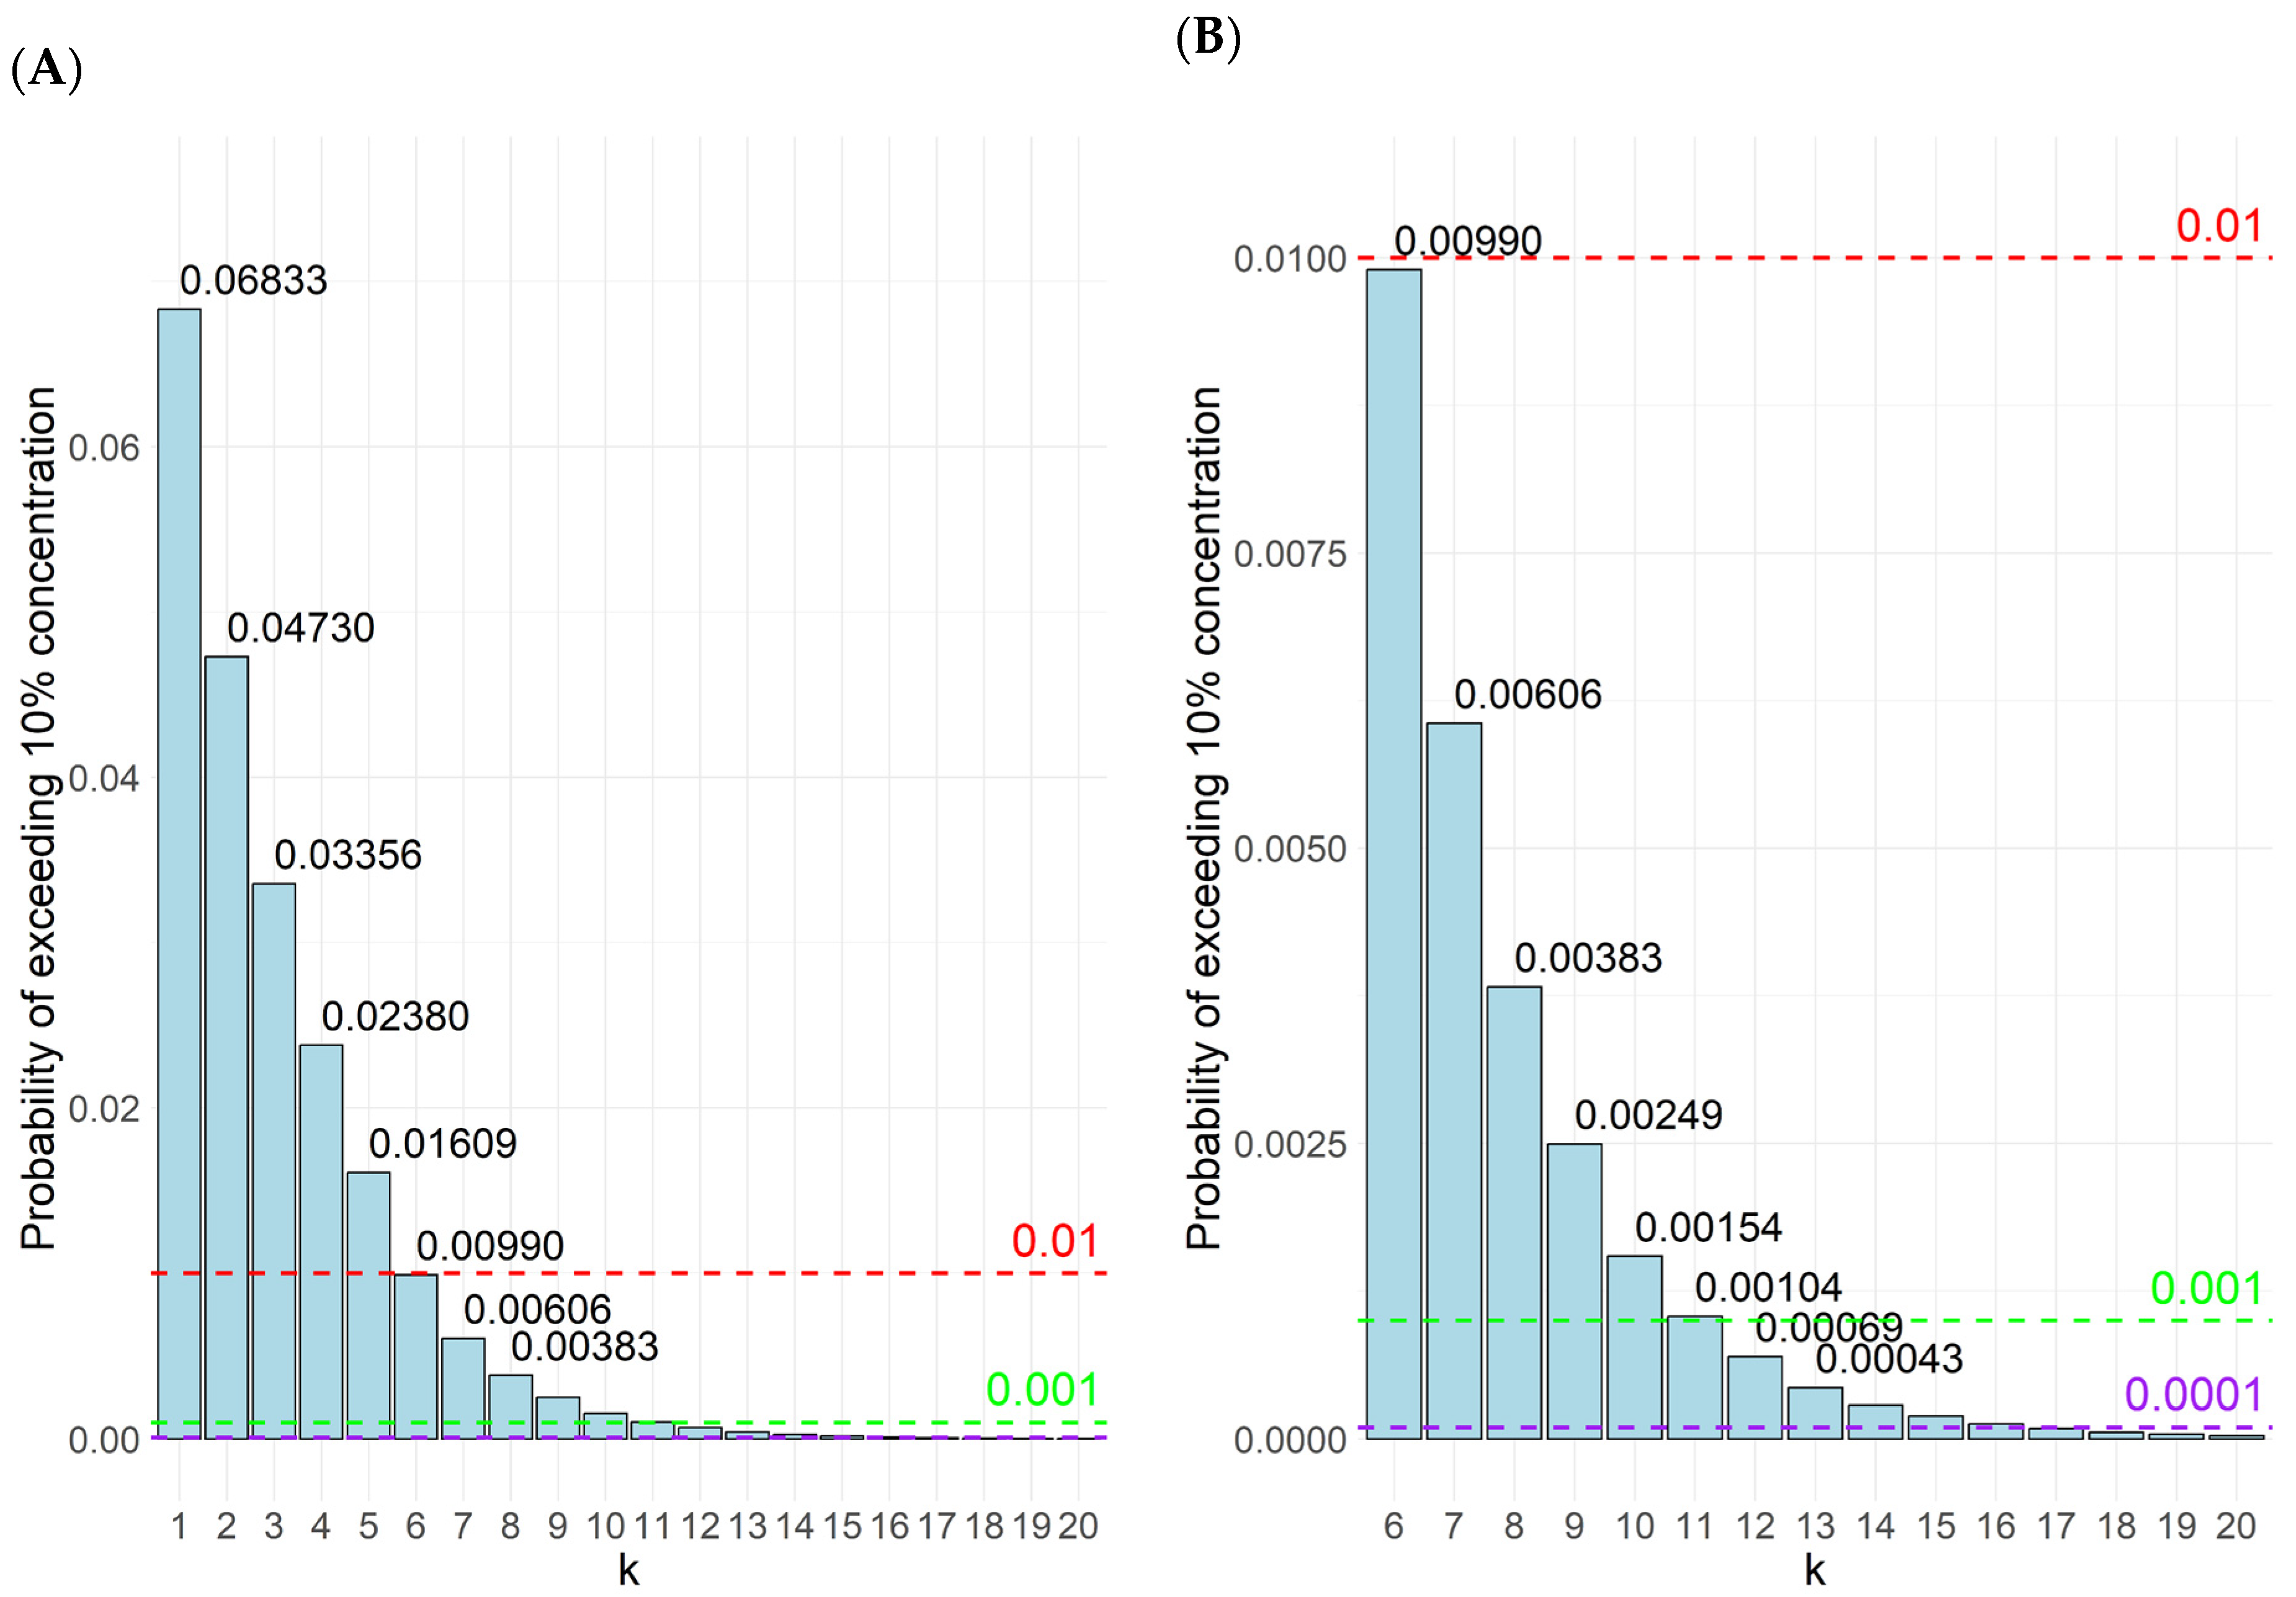
Figure 4) demonstrate that an increase in the number of containers noticeably reduces the likelihood of encountering a non-standard concentration of contamination within the mixture. Specifically, the amalgamation of contents from six IBCs reduces this probability to approximately 1/100, whereas for 20 containers, the risk of failure falls to below 3/100,000 (
Figure 4A,C). To confine the permissible concentration of contaminants in the mixture to a safe threshold, specifically below 1/1000, it was imperative to mix the contents of at least 12 containers, which corresponded to a risk of 0.000694 (
Figure 5). To further decrease the risk, that is, below 1/10,000, it was necessary to mix the contents of at least 17 IBCs, resulting in a risk of 0.000088.
It is projected that the facility can process 315 m3 of sewage (Scenario A) or 630 m3 of sewage (Scenario B) per month, resulting in a total of 37,800 m3 and 75,600 m3 of sewage over a decade, respectively. This is equivalent to 12,600–25,200 containers, each with a capacity of 3 m3, being dispatched for treatment. The current practice of combining the contents of up to four IBCs poses a significant risk of treatment process failure because of the potential for exceeding permissible pollution levels. Over a 10-year operational period, the anticipated number of failures is approximately 300 in Scenario A and 600 in Scenario B.
After implementing the recommended process of mixing the contents of the 12 IBCs, the expected number of failures is projected to decrease to approximately 9 and 18 for Scenarios A and B, respectively. In the event of an expansion of the filling stations to facilitate the mixing of the 20 IBCs’ content or an investment in larger 20 m3 containers, the expected number of failures over a 10-year period would be less than 1 for both scenarios. This reduction would substantially enhance process safety.
In the above considerations, a failure, i.e., a disruption to the purification process, is understood as an event comprising the occurrence of a container (3 m3) having a mixture with a dry matter content above 10%; while the expected value of the number of failures is the expected value of the random variable of the distribution B(p, n), where p is the probability of exceeding the normative concentration, and n being the number of transport containers sent to the purification process, hence E(X) = p·n.
As the volume of containers transported within the system increases, evaluating the risks associated with the number of containers within a supply chain framework entails a comprehensive assessment and management of these risks to ensure safety, efficiency, and regulatory compliance. This process involves identifying potential hazards, evaluating their likelihood and impact, and implementing measures to mitigate risks [
24]. This study examined the risks associated with the number of containers in a supply chain framework. It provides solutions that reduce the risk of failure, depending on the mixing method adopted and the plant’s operating intensity scenario, to between 1–18 instances of exceeding the standard dry matter concentration level in the transport tank over a 10-year period. As to the current wastewater transfer process to the treatment stage, this risk is estimated at 300 to 600 failures over 10 years of operation.
4. Industrial Wastewater Management Procedure
The current procedure for collecting wastewater from production facilities for subsequent treatment involves a transport vehicle collecting wastewater from 3 to 4 Intermediate Bulk Containers (IBCs) into a single transport container with a capacity of 2.5–3 m
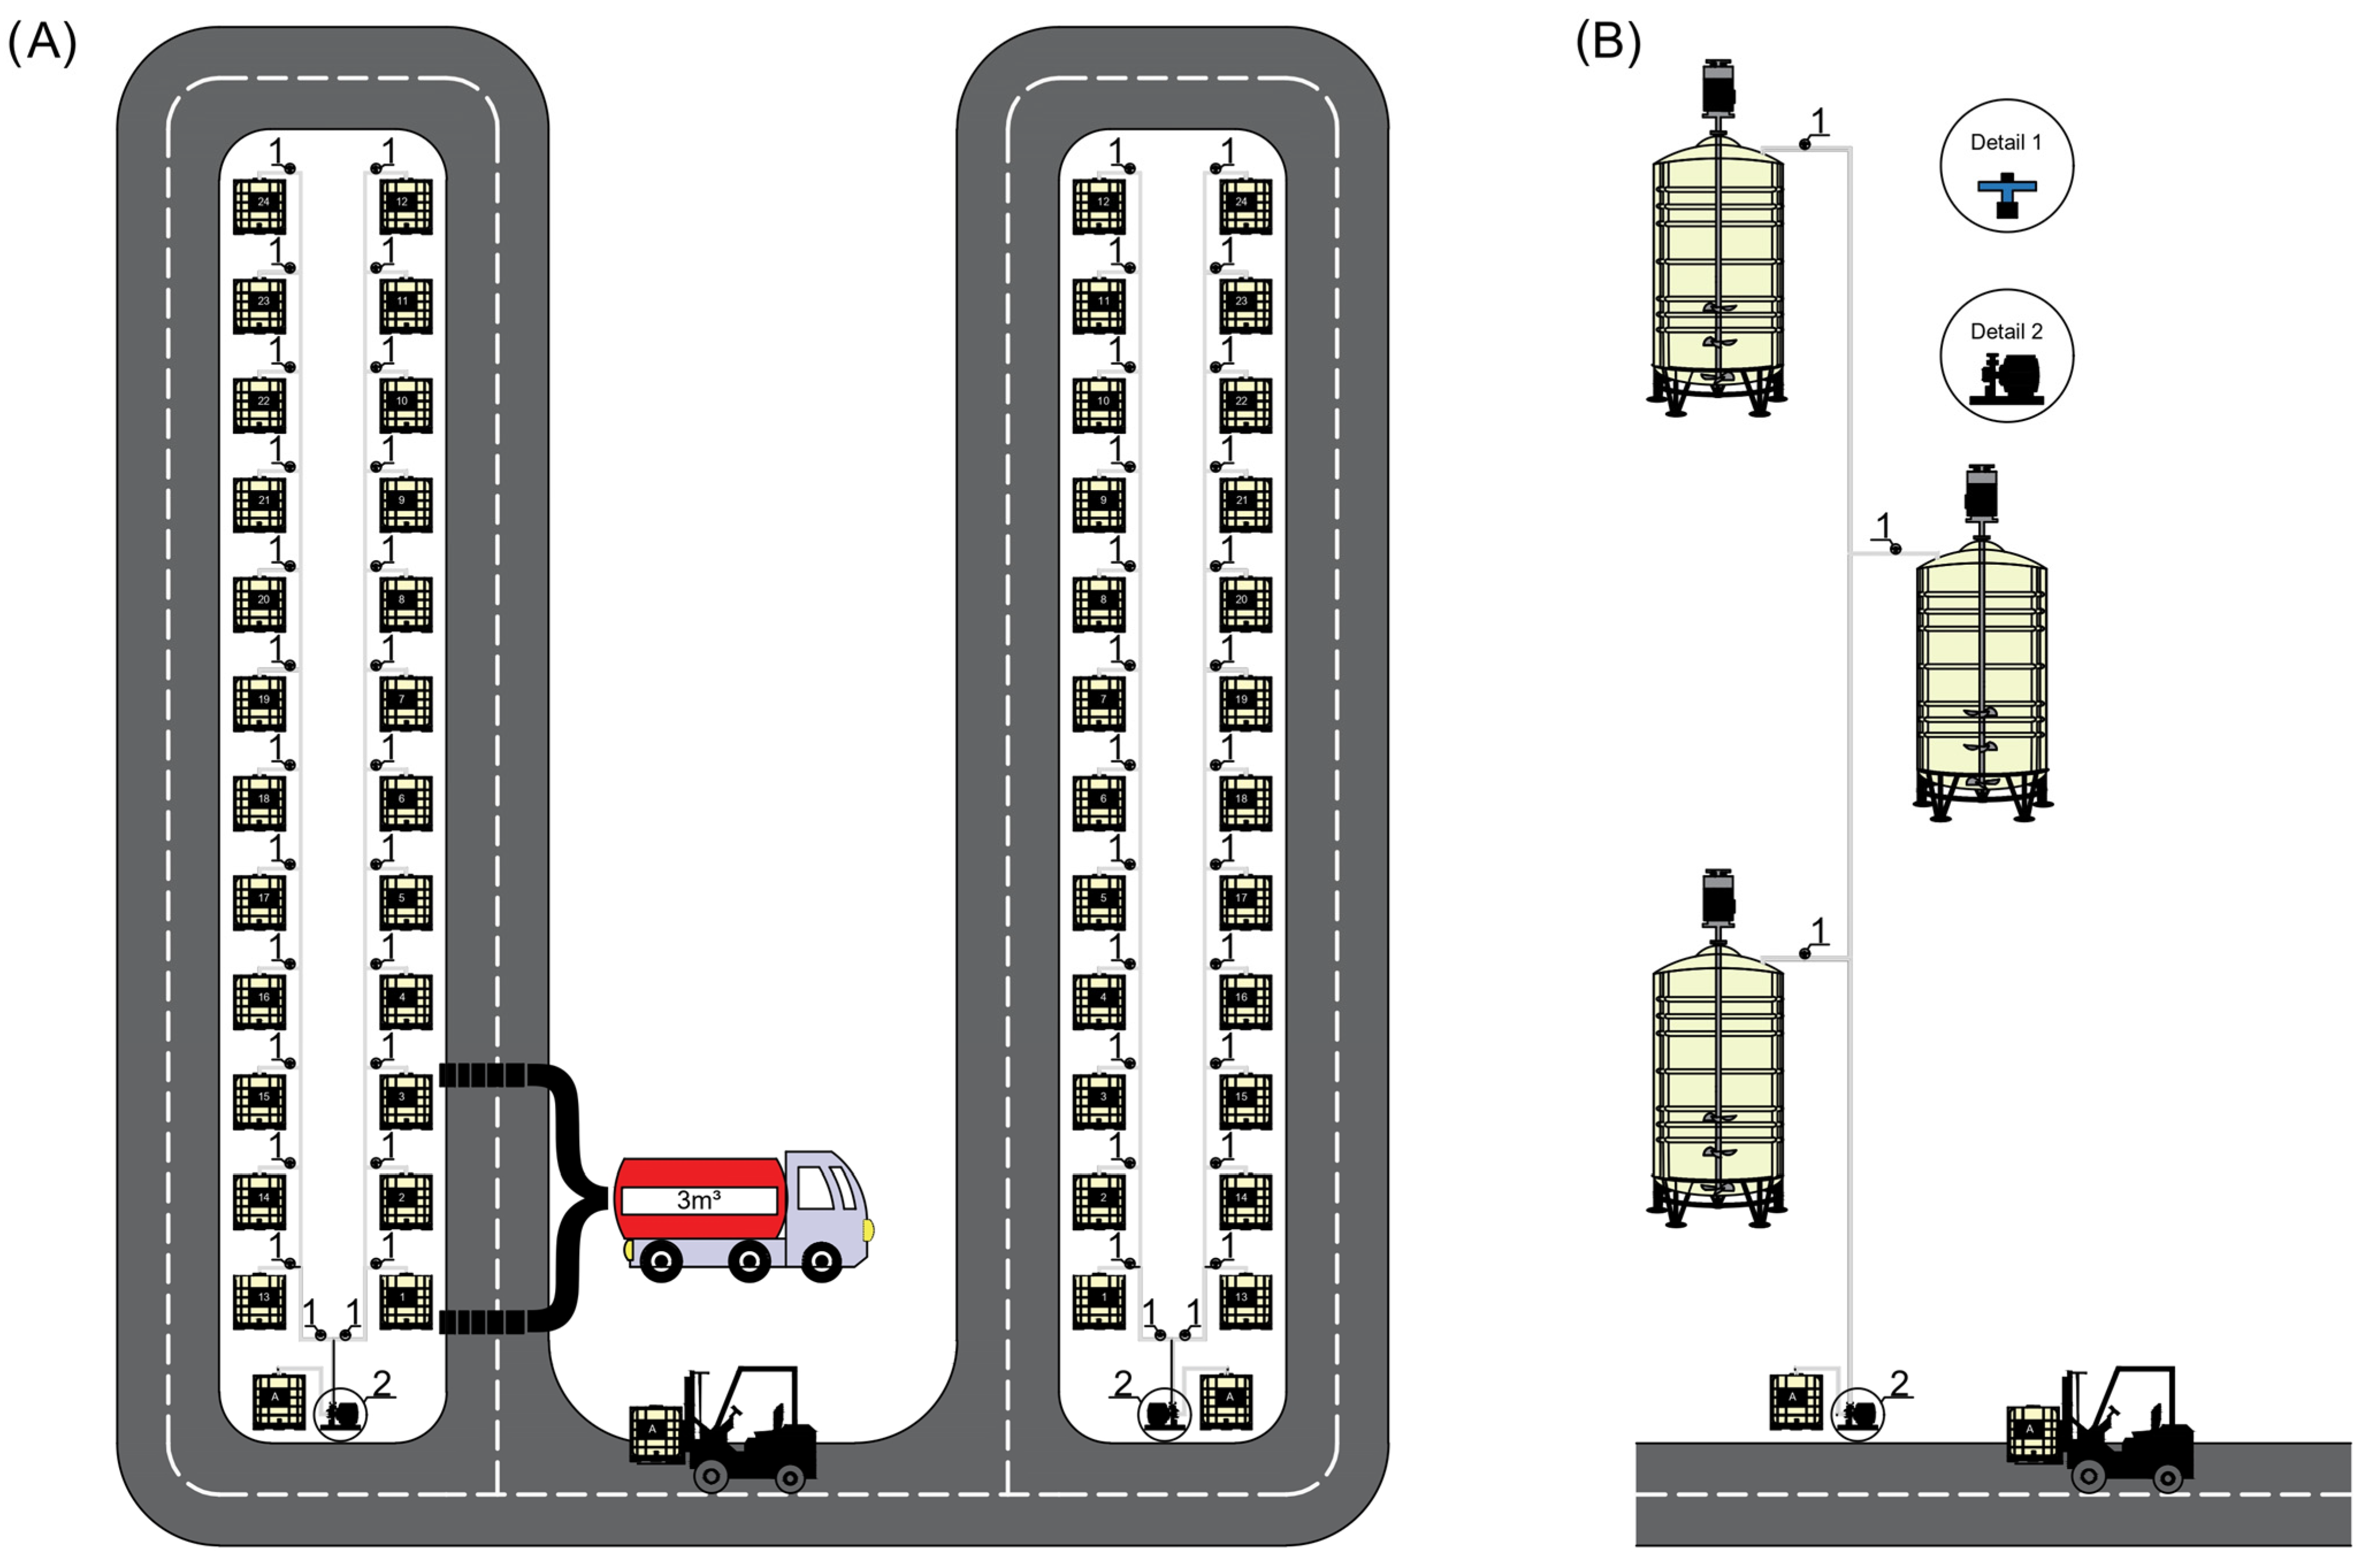
3, where they are subsequently mixed. This method poses the risk of the resulting mixture exceeding the permissible contaminant concentration by more than 2%; specifically, a dry matter content exceeding the 10% threshold. Two solutions have been proposed to keep this risk to an acceptable level of 0.1%. The first solution involves constructing a filling station that uniformly redirects the contents of 12 different IBCs from the production process to 12 other empty IBCs, where the mixing occurs. The second solution entails the construction of a few tanks with a volume of 12 to 20 m
3, where the contents of 12 to 20 IBCs can be mixed (
Figure 6).
The filling station facilitates the efficient mixing of a substantial number of containers within a short time. It is advisable to assign numbers to the Intermediate Bulk Container (IBC) tanks. When wastewater is mixed in 12 intermediate containers, the probability of surpassing the allowable concentration decreases to 7/10,000. In practice, transferring approximately 1 m
3 of production wastewater from one container to twelve may require properly setting up 12 valves to ensure that all are evenly filled. It is recommended to plan for two filling stations (
Figure 6A). Assuming that the wastewater is evenly shared among 12 IBCs, the first station would operate by filling tanks 1–12 and unloading tanks 13–24. Given that tanks 1–12 may reach full capacity before tanks 13–24 are completely emptied, a second analogous wastewater averaging station should be considered, with tanks numbered 25–36 and 37–48. All tanks within the station function sequentially in loading and unloading modes. If excessive sludge accumulates in a tank, exceeding 10%, it should be replaced with fresh sludge. If a longer duration is anticipated for the tank to accumulate sludge at up to 30–40%, it might be prudent to extend the sequence from 12 to 20 IBC tanks. An alternative solution could involve the use of high-efficiency pumps.
It would be feasible to plan for the construction of three to four tanks, each with a capacity ranging from 12 to 20 m3, and equipped with mixers for sewage pumping, thereby ensuring its homogenisation and the periodic removal of settled sludge from the bottom of the tank. However, this necessitates a substantial shift in storage practices, moving away from IBCs, along with site adaptation and investment. A further prospect conducive to economical water consumption may involve the development of procedures that specify the appropriate amount of water required for effective tank rinsing during the production process. Additional labelling of containers and their assignment to designated production areas can mitigate the risk of mixing up wastewater streams from the production of different types of paints, namely water-based and solvent-based. This approach enhances process management. Furthermore, it is important to determine the sedimentation time of the sludge in the tank and record the date of container filling as well as the planned date of wastewater collection for treatment. Positioning containers in precisely defined locations can facilitate logistics and ensure adherence to the “first in, first out” principle while maintaining division into production sections. It is recommended that the red FIFO plates be transferred, which should be affixed to the containers scheduled for unloading in the subsequent cycle.
5. Discussion
The wastewater generated by the paint industry is characterised by high levels of contamination, requiring a more focused attention on its treatment methodologies. During dye production, factories produce significant volumes of wastewater, which has occasioned the ongoing development of innovative treatment techniques [
10]. The composition of wastewater from paint manufacturing industries varies considerably [
25]. Typically, it comprises cleansing water from polymerisation and mixing tanks [
26]. The concentration of pollutants is typically elevated due to the presence of pigments, resins, and other components inherent in paint. This wastewater often contains substantial amounts of Total Dissolved Solids (TDS), suspended solids (SS), and other contaminants, thereby requiring treatment prior to discharge [
10].
Because of differences in the content of wastewaters, no universal guidelines on treatment can be consistently established [
27]. Therefore, it is imperative to develop an effective treatment method prior to the discharge of wastewater into the environment. Initially, physical methods such as sedimentation were employed; however, these methods have proven suboptimal. Alternative approaches include the use of chemical, biological, or hybrid solutions.
Unfortunately, physical and chemical methods generate significant residues, complicating their disposal, whereas biological approaches are challenging to maintain due to uncertainties associated with the chemical composition of dye wastewater [
26]. Chemical coagulation is an effective method for removing suspended solids (SS) from wastewater in the paint industry. Commonly employed techniques include coagulation, adsorption, flocculation, filtration, electrochemical processes, and advanced oxidation processes [
10,
27,
28,
29,
30,
31,
32,
33,
34]. Among the various coagulants available, FeCl
3·6H
2O is the most effective for the removal of suspended solids (SS). For instance, under optimised conditions, the treatment process demonstrated a 4% increase in efficiency compared to the non-optimised process, with removal efficiencies of the total suspended solids (TSS) reaching 95.3% [
30]. El-Shazly et al. (2010), in analysing other coagulants using psychochemical purification such as Al, reported TSS removal of 91% [
8]. Similar observations were made by Aydin and Balik, who investigated the effectiveness of various coagulants (alum, PACl, FeCl
3, and FeSO
4) and reported that, when considering both treatment efficiency and sludge quantity, the most cost-effective solution was achieved with FeSO
4 [
31]. Conversely, evaluation by Bouranene et al. of three iron-based coagulants, i.e., ferrous sulphate, ferric sulphate, and ferric chloride, demonstrates that ferrous sulphate is the most effective. It was also noted that the pH of water intended for treatment played a significant role in the coagulation and flocculation processes [
32]. Recent concerns have emerged regarding the use of inorganic coagulants because of their potential association with cancer and Alzheimer’s disease, diminished coagulation efficiency in cold water, substantial volume of sludge generated, pronounced hydrolysis of Fe
3+ that impedes the polymerisation of iron-based coagulants, and their non-biodegradable nature [
33,
34,
35,
36,
37,
38,
39,
40].
In their research, Aboulhassan et al. (2006) investigated the potential application of natural coagulants for the removal of pollutants in wastewater from paint production [
38]. They found that coagulation–biflocculation is more effective than coagulation-monoflocculation. Similarly, Ejimofor et al. (2021) [
7] reported that prior to coagulation treatment, the total suspended solids (TSS) content was 2685 mg/L and the total dissolved solids (TDS) content was 1318 mg/L. These values for effluent reuse were within the permissible limits set by the NESREA and WHO. Following the application of the Zonitoides nitidus shell as a coagulant in wastewater treatment, reductions of 92%, 96%, 86%, and 80% were observed in the total suspended solids (TSS), total solids (TS), turbidity, and total dissolved solids (TDS), respectively [
7]. Chemical methods have demonstrated significant efficacy in reducing contaminants to the levels mandated by regulatory standards. While the commonly employed biological methods also exhibit effectiveness, they may present a risk owing to the potential presence of bacteria, which could impede recycling processes at paint manufacturing industries.
An additional strategy involves the segregation of various waste categories, which facilitates the recovery of raw materials and increases the likelihood of their reuse in the manufacturing processes [
41]. In addition to the economic advantages, wastewater treatment and reuse offer ecological benefits through sustainable water management. This includes a reduction in water resource consumption and a decrease in wastewater discharges into natural water bodies [
42].
In paint manufacturing facilities that also generate substantial amounts of dry solids, it is imperative to consider the following strategies: reducing waste sources, minimising waste quantities, implementing recycling practices, and ensuring proper disposal methods.
In Poland, establishing a closed-loop water management system is crucial because the country has limited freshwater supplies and often faces water scarcity. This method, which entails the reuse of treated wastewater, is regarded as an essential strategy for ensuring a sustainable water supply while safeguarding vulnerable groundwater reserves. Noteworthy here is that Poland ranks among Europe’s lowest in terms of freshwater availability per capita [
41,
42].
Currently, approximately 69% of water resources in Poland are allocated to the industrial sector. Within this sector, water serves as a heat carrier and a cooling agent in various production processes, but with only 4% of such water consumption being attributed to water circulating in a closed circuit [
41]. The practice of water reuse within the paint industry is becoming increasingly vital for both sustainability and cost efficiency. By adopting water treatment and recycling systems, paint manufacturers can limit their dependence on fresh water, reduce the costs associated with wastewater discharge, and mitigate their environmental impact [
42]. For purposes of reuse, the quality of treated water must be comparable to that of process water utilised in paint production. One of the most crucial considerations is the presence of bacteria in water, which must be minimised to prevent bacterial proliferation in manufactured coatings [
43].
This paper investigates various strategies for minimising waste generated in the paint manufacturing industry, drawing upon the waste management practices of a specific plant. In the facility in question, the average level of contamination in the sample tested was relatively low, but the standard deviation value indicates a large spread in the results. Consequently, 190 samples were selected for the analysis. Probabilistic methods, including the Monte Carlo simulations, distribution fitting, and Student’s t-test, were employed.
Based on the results, a wastewater management strategy was formulated for the company. The objective of these analyses was to ascertain the optimal number of containers and the volume of wastewater collected from individual tanks, with the aim of minimising the probability of exceeding a concentration of 10% dry mass in a volume of 2.5 m3 across two scenarios.
The study was a valuable tool in analysing the approach of paint manufacturing facilities to water recovery and reuse. The primary issue, identified as the dry mass content’s variability within the production wastewater, was thoroughly examined. Consequently, this study first assessed the dry mass content in samples collected from IBCs, then proposed a method for standardising the composition of industrial wastewater to enhance its management. This article proposes a modification to the existing technology within the analysed facility, aimed at enhancing its operational efficiency and mitigating its environmental impact. Analysis of the results revealed significant variability in the dry mass content of wastewater generated from the rinsing processes of machines and tanks utilised in paint production. The primary challenge concerns the heterogeneity of the samples in terms of their origin. The filling station facilitated the mixing of additional containers. The key issue pertains to the emergence of dry mass with notably high concentrations within containers, reaching levels of 30% and even 40%. Therefore, it is imperative to identify such containers during the production process. In so doing, it may be feasible to intercept and manage them, thereby preventing the dispatch of two containers to a single station.
This study introduces a methodology for generating data to determine appropriate storage tank volumes for averaging the dry mass content in wastewater samples from paint production. At the initial phase, it was proposed that all tanks within the filling station operate sequentially, alternating between loading and unloading modes. If the accumulation of sludge in any tank exceeds 10%, it was recommended to replace the tank with a new one. An additional measure that could be implemented in a subsequent phase of evaluation is the designation of tanks as “washing of machines”, characterised by an elevated concentration of dry mass in the wastewater.
6. Conclusions
Statistical analyses and modelling demonstrate that adopting a systematic approach to wastewater management is highly advantageous. This approach not only ensures compliance with environmental standards, but also significantly enhances the operational reliability of the entire system while optimising and reducing operating costs. The developed procedure, which involves mixing the contents of a minimum of 12 containers, substantially mitigates the risk of exceeding the 10% dry-mass threshold, which may serve as a benchmark in industrial applications. In the presented case study, when wastewater is mixed in 12 containers, the probability of exceeding the allowed concentration drops to 0.0007. In practice, when pumping approximately 1 m3 of production wastewater from a single IBC to 12 containers at the filling station, it is necessary to properly set 12 valves to ensure that all containers are evenly filled. It is crucial to highlight that this study presents a methodology for developing data to determine the appropriate volume of storage containers for averaging the dry mass content of wastewater samples from paint production. Even when utilising a different dataset, the proposed method/algorithm can be applied for evaluation and analysis.
This study formulated a methodology for estimating and calculating the requisite number of containers based on the available data. Although the dataset in another industrial plant may vary, the application of the proposed calculation methodology will allow for determining the necessary number of containers in such a context. However, the concept of mixing the contents of IBCs is universal. This procedure averages the concentration of wastewater, thereby reducing the risk of extreme concentrations. Furthermore, a low-cost method for mixing wastewater via a filling station was proposed, while subsequent steps for determining the minimum number of IBCs, which may be used in other industrial contexts, was clearly described. For each company, samples can be collected and individual calculations made according to the methodology we propose.
Effective dry mass management can facilitate the implementation of chemical processes and, in turn, support efforts to recycle water from washing of machines and tanks following preliminary purification.
