Analysis of the Multi-Scale Spatial Heterogeneity of Factors Influencing the Electric Bike-Sharing Travel Demand in Small and Medium-Sized Cities
Abstract
1. Introduction
2. Literature Review
2.1. Characteristics of the EBS Travel Demand Based on Questionnaire Surveys
2.2. Spatial Heterogeneity Analysis of Micro-Mobility Travel Based on Multi-Source Data Sharing
3. Data
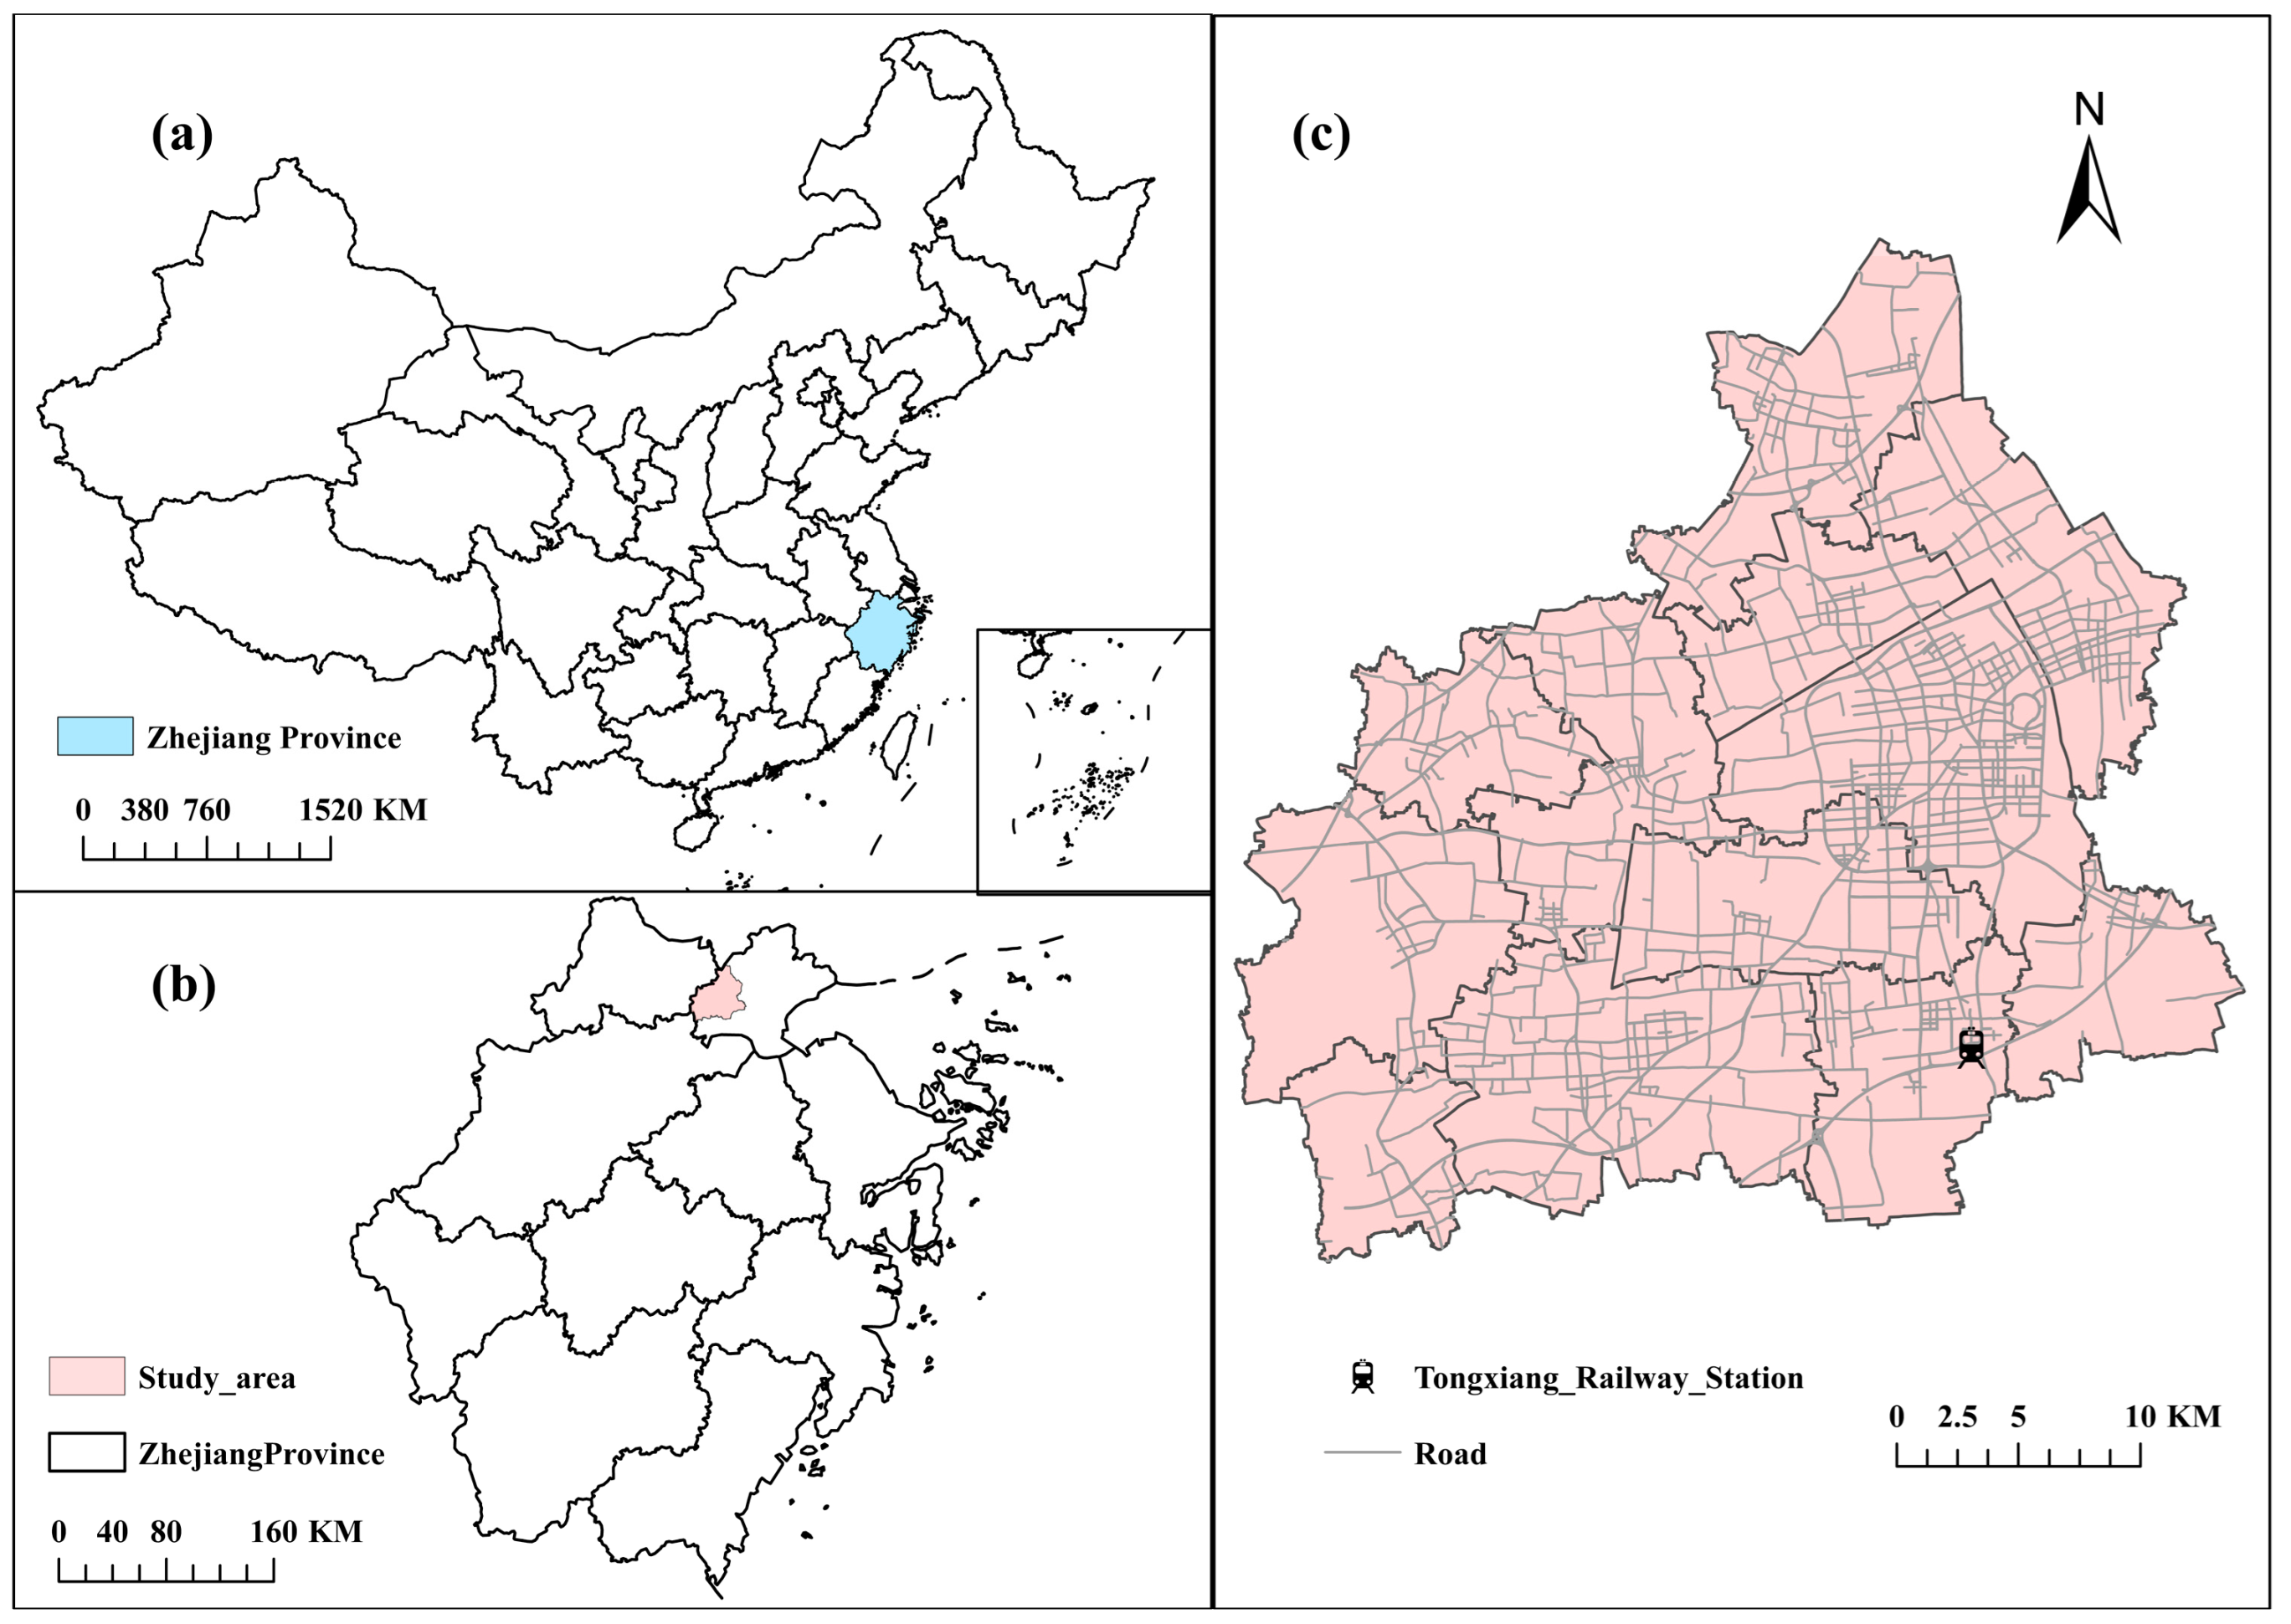
3.1. Survey Area
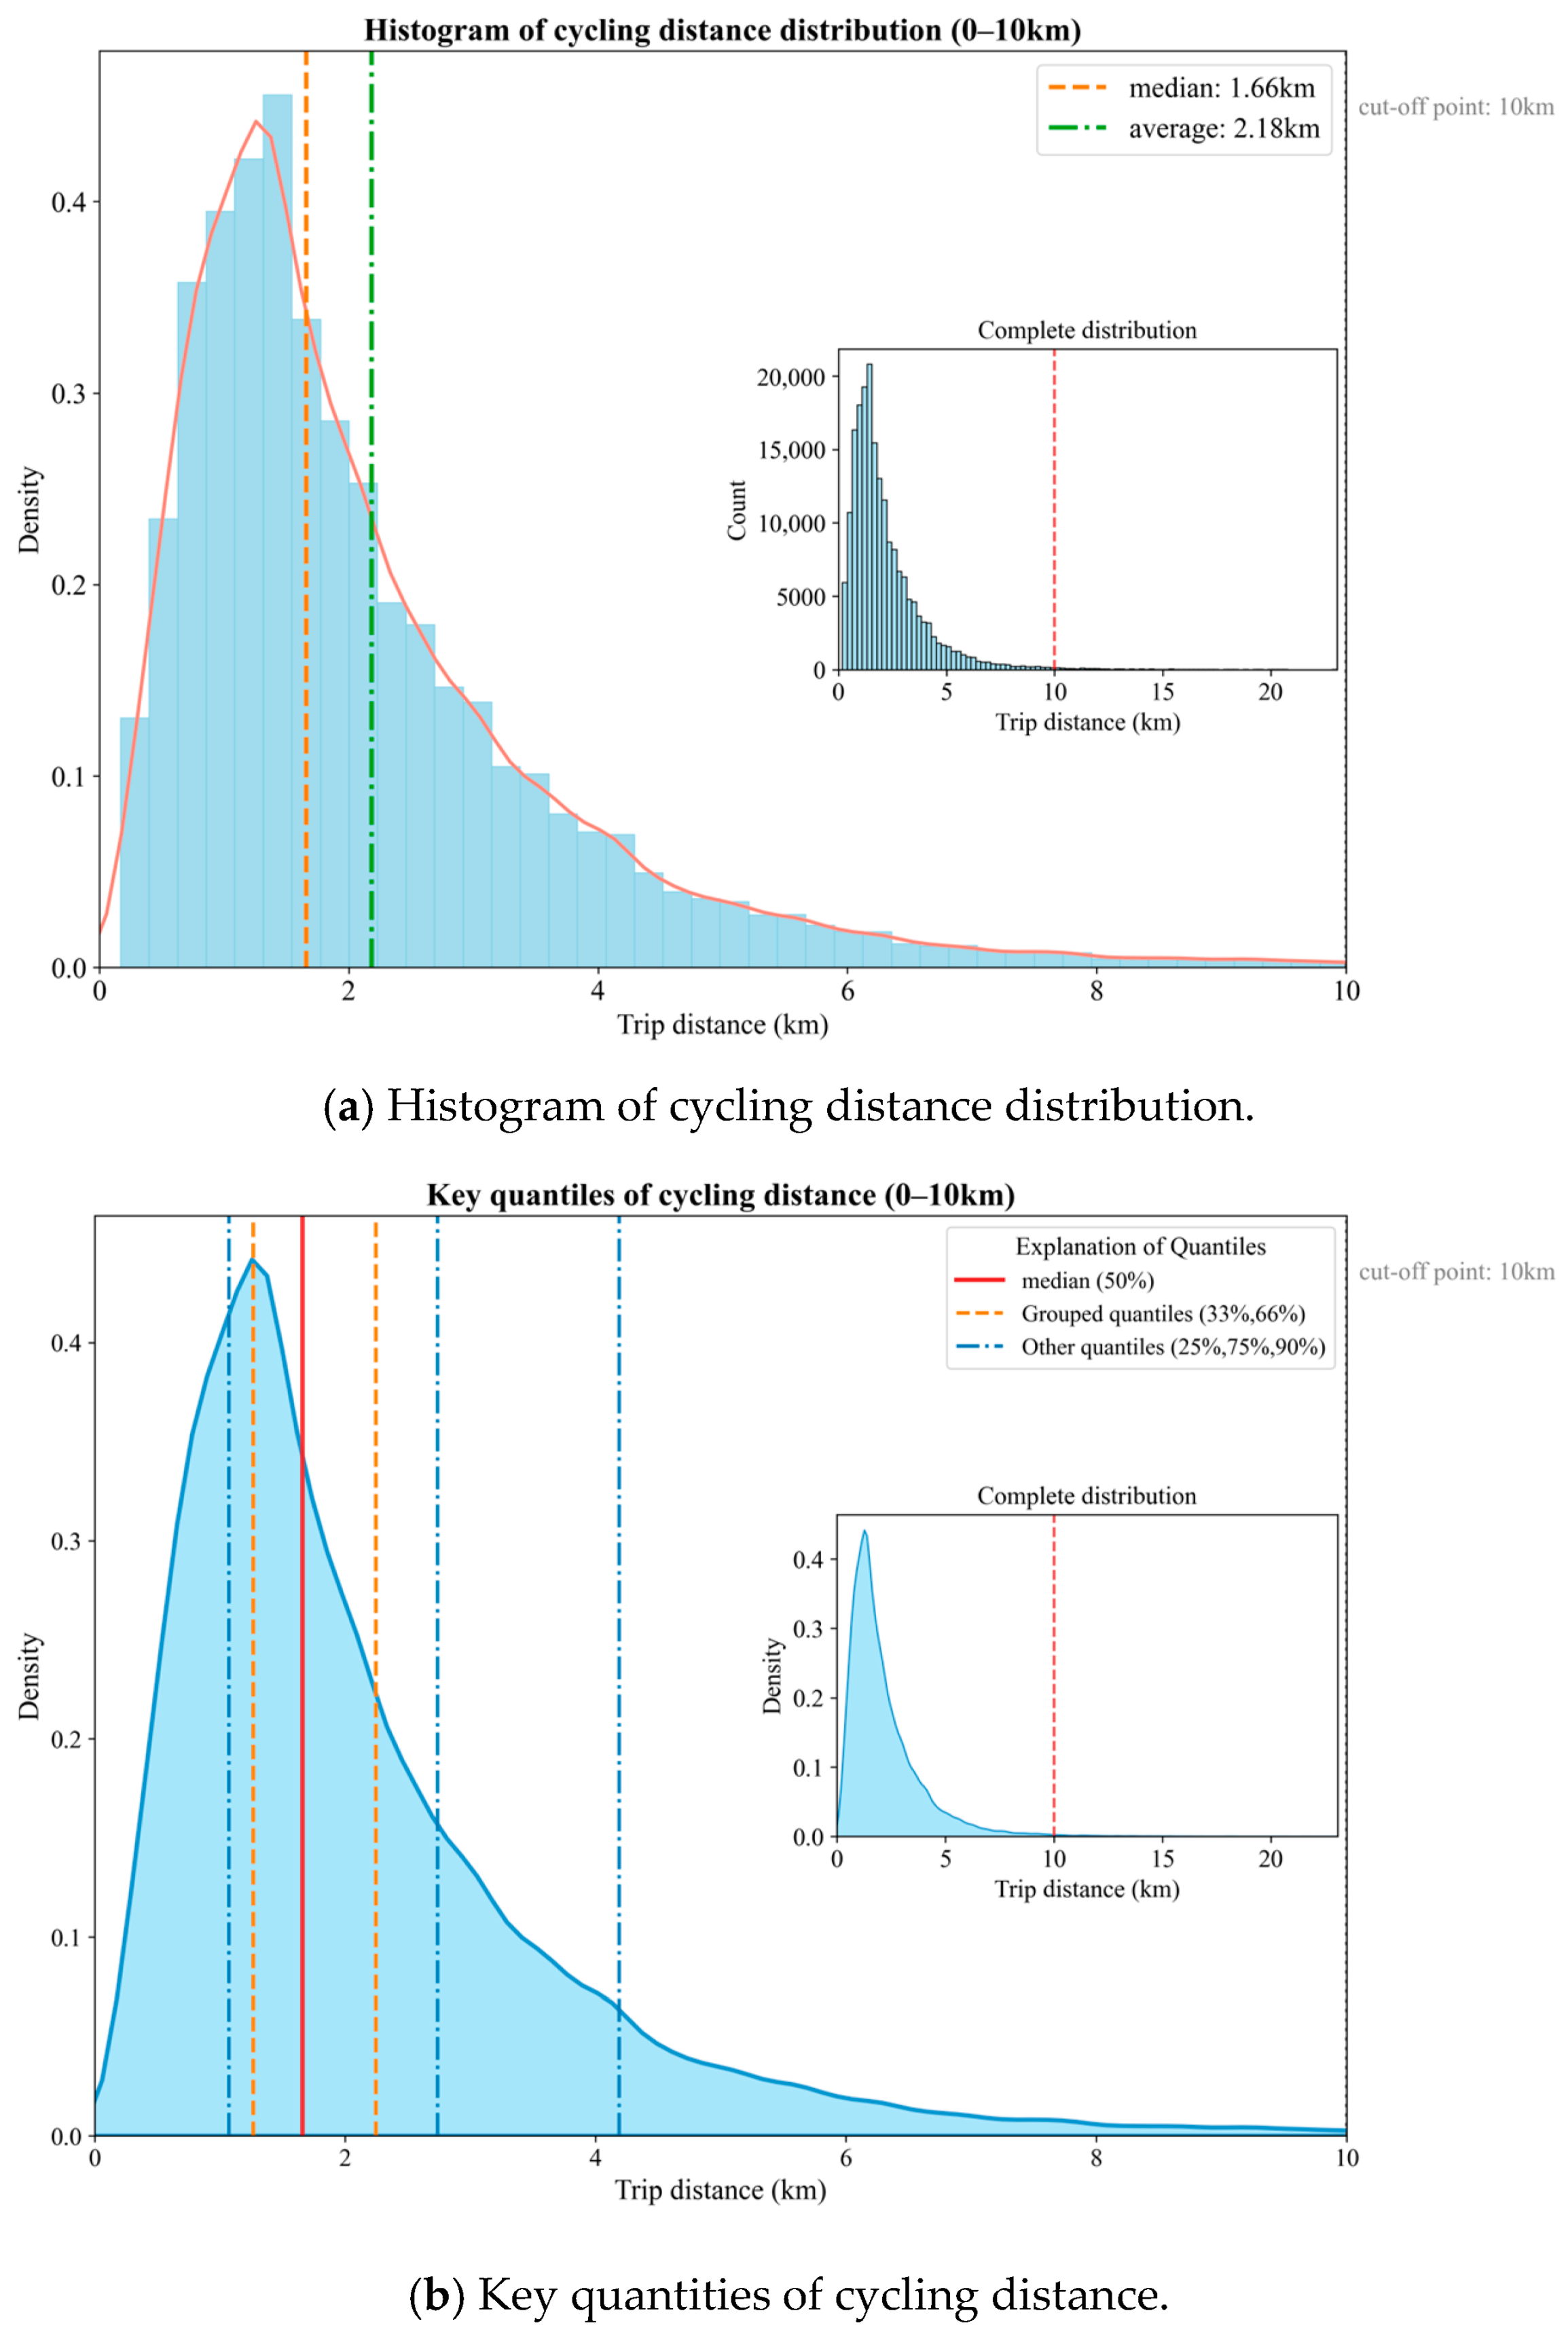
3.2. Data Processing
3.3. Variable Selection
- (1)
- Road network indicators
- (2)
- Land use indicators
- (3)
- Public transport indicators
| Variables | Description | Average | Std | Min | Max |
|---|---|---|---|---|---|
| Dependent Variables | |||||
| LDT | The number of long-distance trips | 23.92 | 114.33 | 0 | 2063 |
| SDT | The number of Short-distance trips | 23.92 | 140.01 | 0 | 3652 |
| Road Network Indicators | |||||
| Primary roads | Trunk road density (km/km2) | 0.50 | 1.46 | 0 | 14.55 |
| Secondary roads | Secondary road density (km/km2) | 0.36 | 1.11 | 0 | 12.47 |
| Tertiary roads | Branch density (km/km2) | 1.68 | 1.88 | 0 | 13.95 |
| Land Use Indicators | |||||
| Population density | Population density (people/km2) | 822.85 | 493.48 | 0 | 6416 |
| Catering services | The number of POIs of catering service facilities | 2.06 | 8.65 | 0 | 152 |
| Corporations | The number of POIs of the company enterprise | 2.34 | 5.80 | 0 | 71 |
| Shopping services | Number of shopping service facility POIs | 4.93 | 19.58 | 0 | 420 |
| Financial services | Number of POIs for financial services facilities | 0.12 | 0.72 | 0 | 11 |
| Culture and educational services | The number of POIs of educational and cultural service facilities | 0.34 | 1.27 | 0 | 24 |
| Living services | Number of POIs for life service facilities | 1.74 | 6.60 | 0 | 79 |
| Sports and leisure services | Number of POIs for leisure service facilities | 0.37 | 1.59 | 0 | 42 |
| Medical services | Number of POIs in medical facility | 0.41 | 1.73 | 0 | 22 |
| Government agency | The number of POIs of government units | 0.60 | 2.02 | 0 | 28 |
| Accommodation services | Number of POIs for hotel accommodation facilities | 0.62 | 5.61 | 0 | 148 |
| Commercial residences | The number of residential POIs in the community | 0.33 | 1.06 | 0 | 12 |
| Tourist attractions | The number of POIs of attraction service facilities | 0.12 | 1.21 | 0 | 47 |
| Public Transport Indicators | |||||
| Ground public transport | Number of bus stops | 0.30 | 0.61 | 0 | 7 |
4. Methods
4.1. Theoretical Framework
4.2. Spatial Autocorrelation
4.3. Regression Model
5. Model Results
5.1. Multicollinearity Tests and Spatial Autocorrelation Tests
5.2. Comparison of Model Results
5.3. Analysis of Model Results
6. Discussion
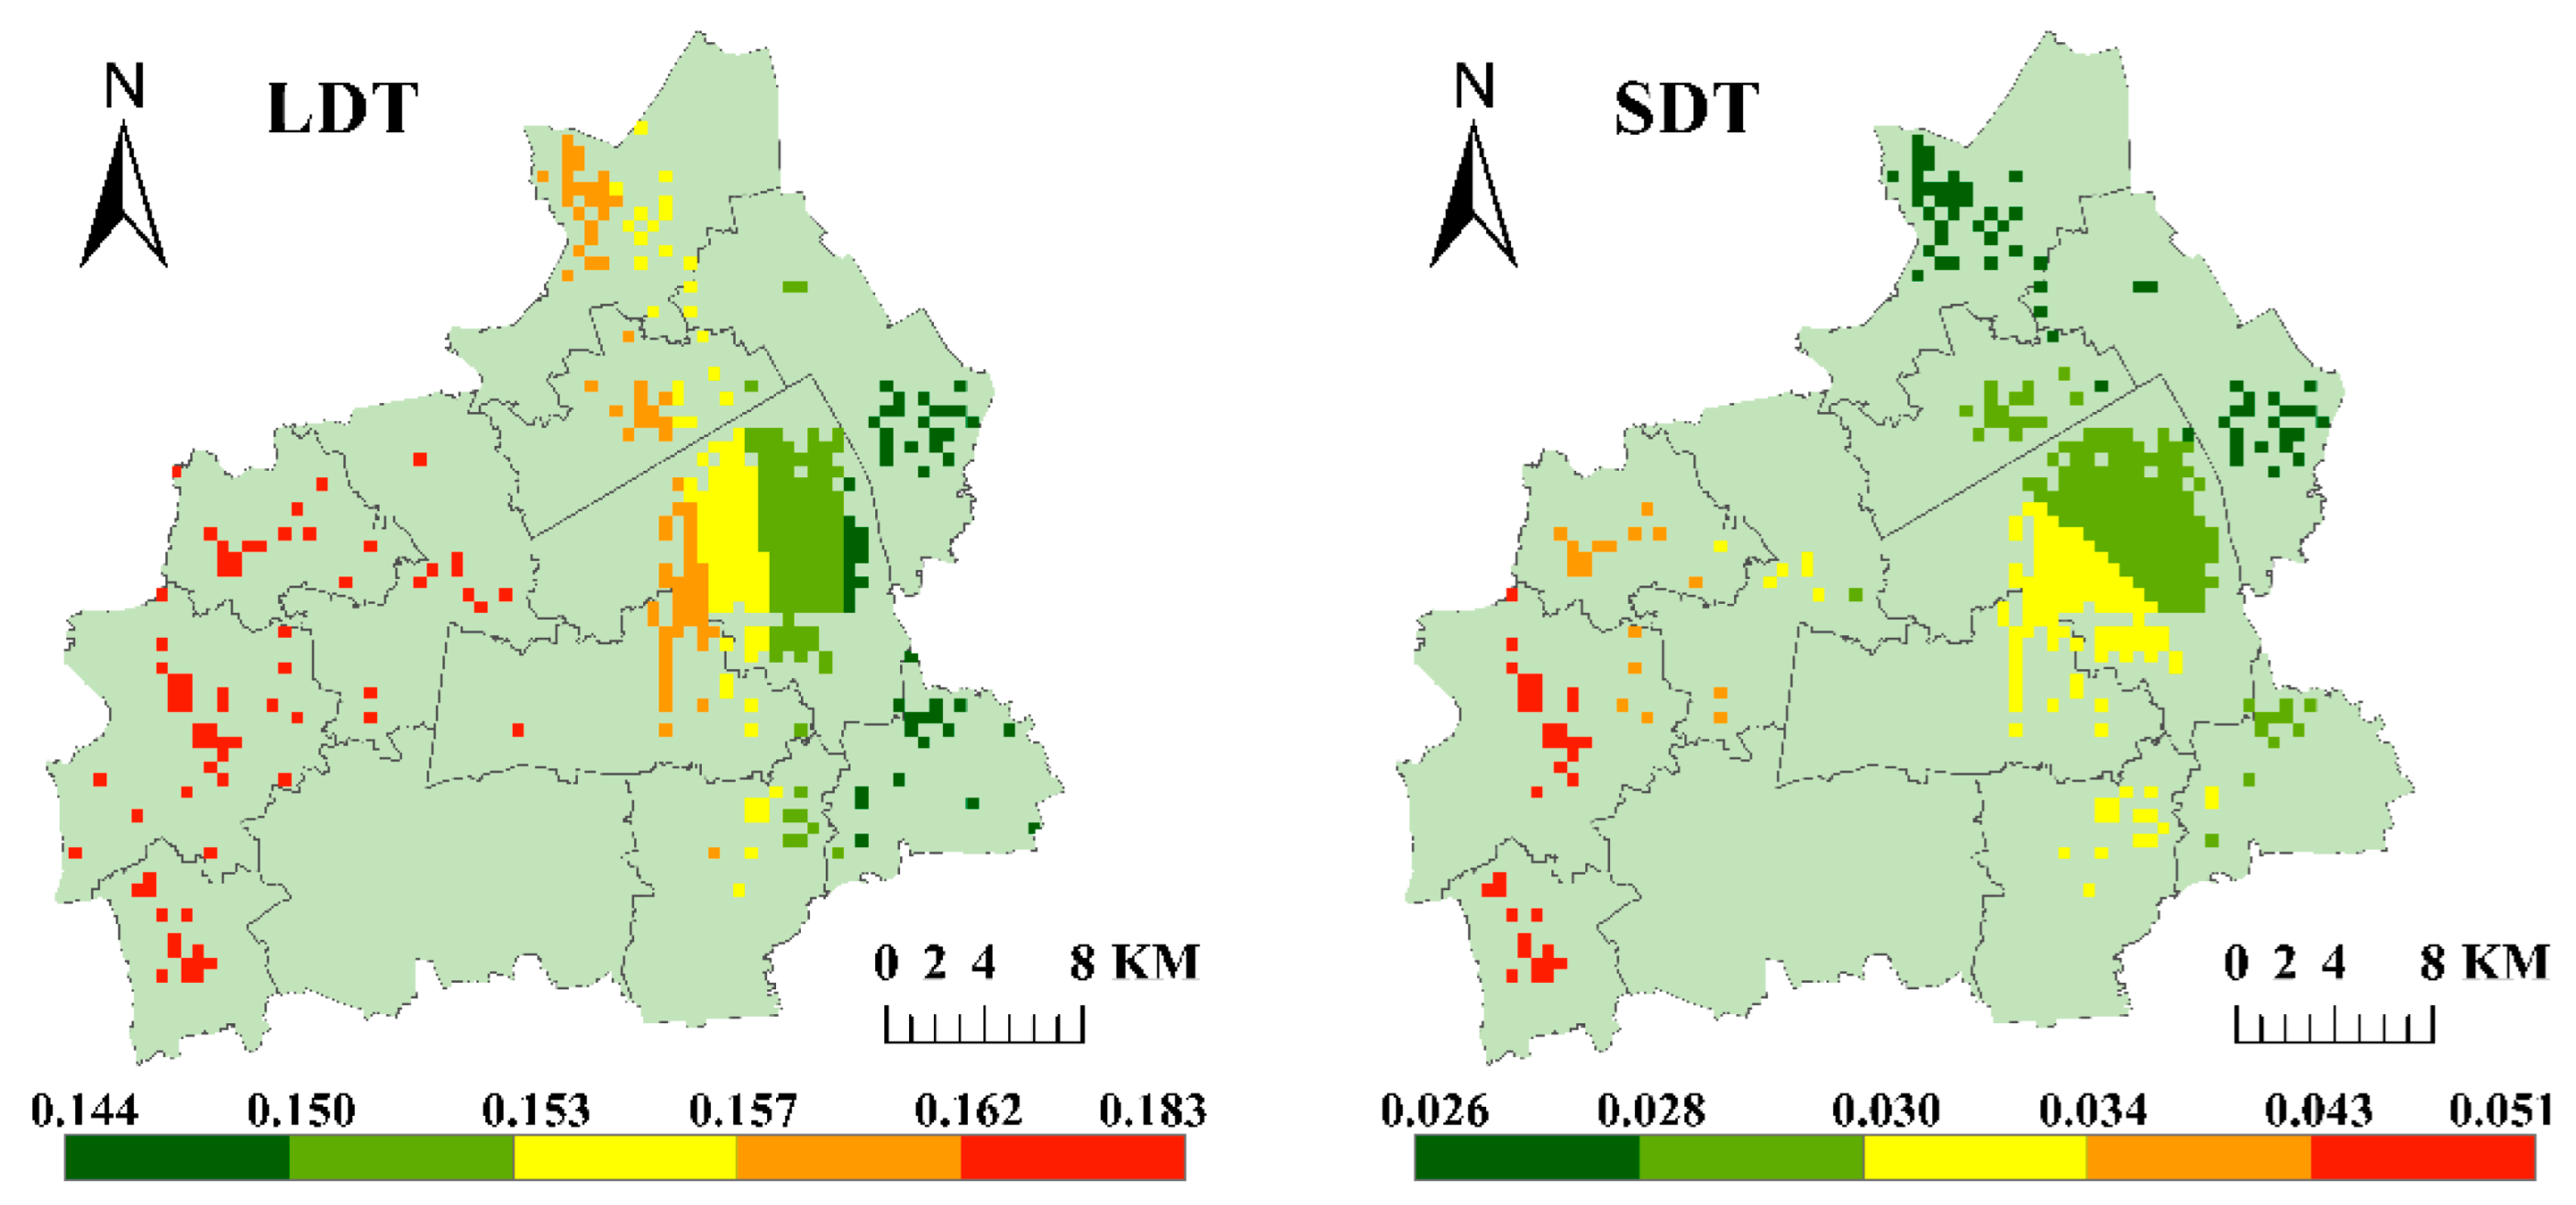
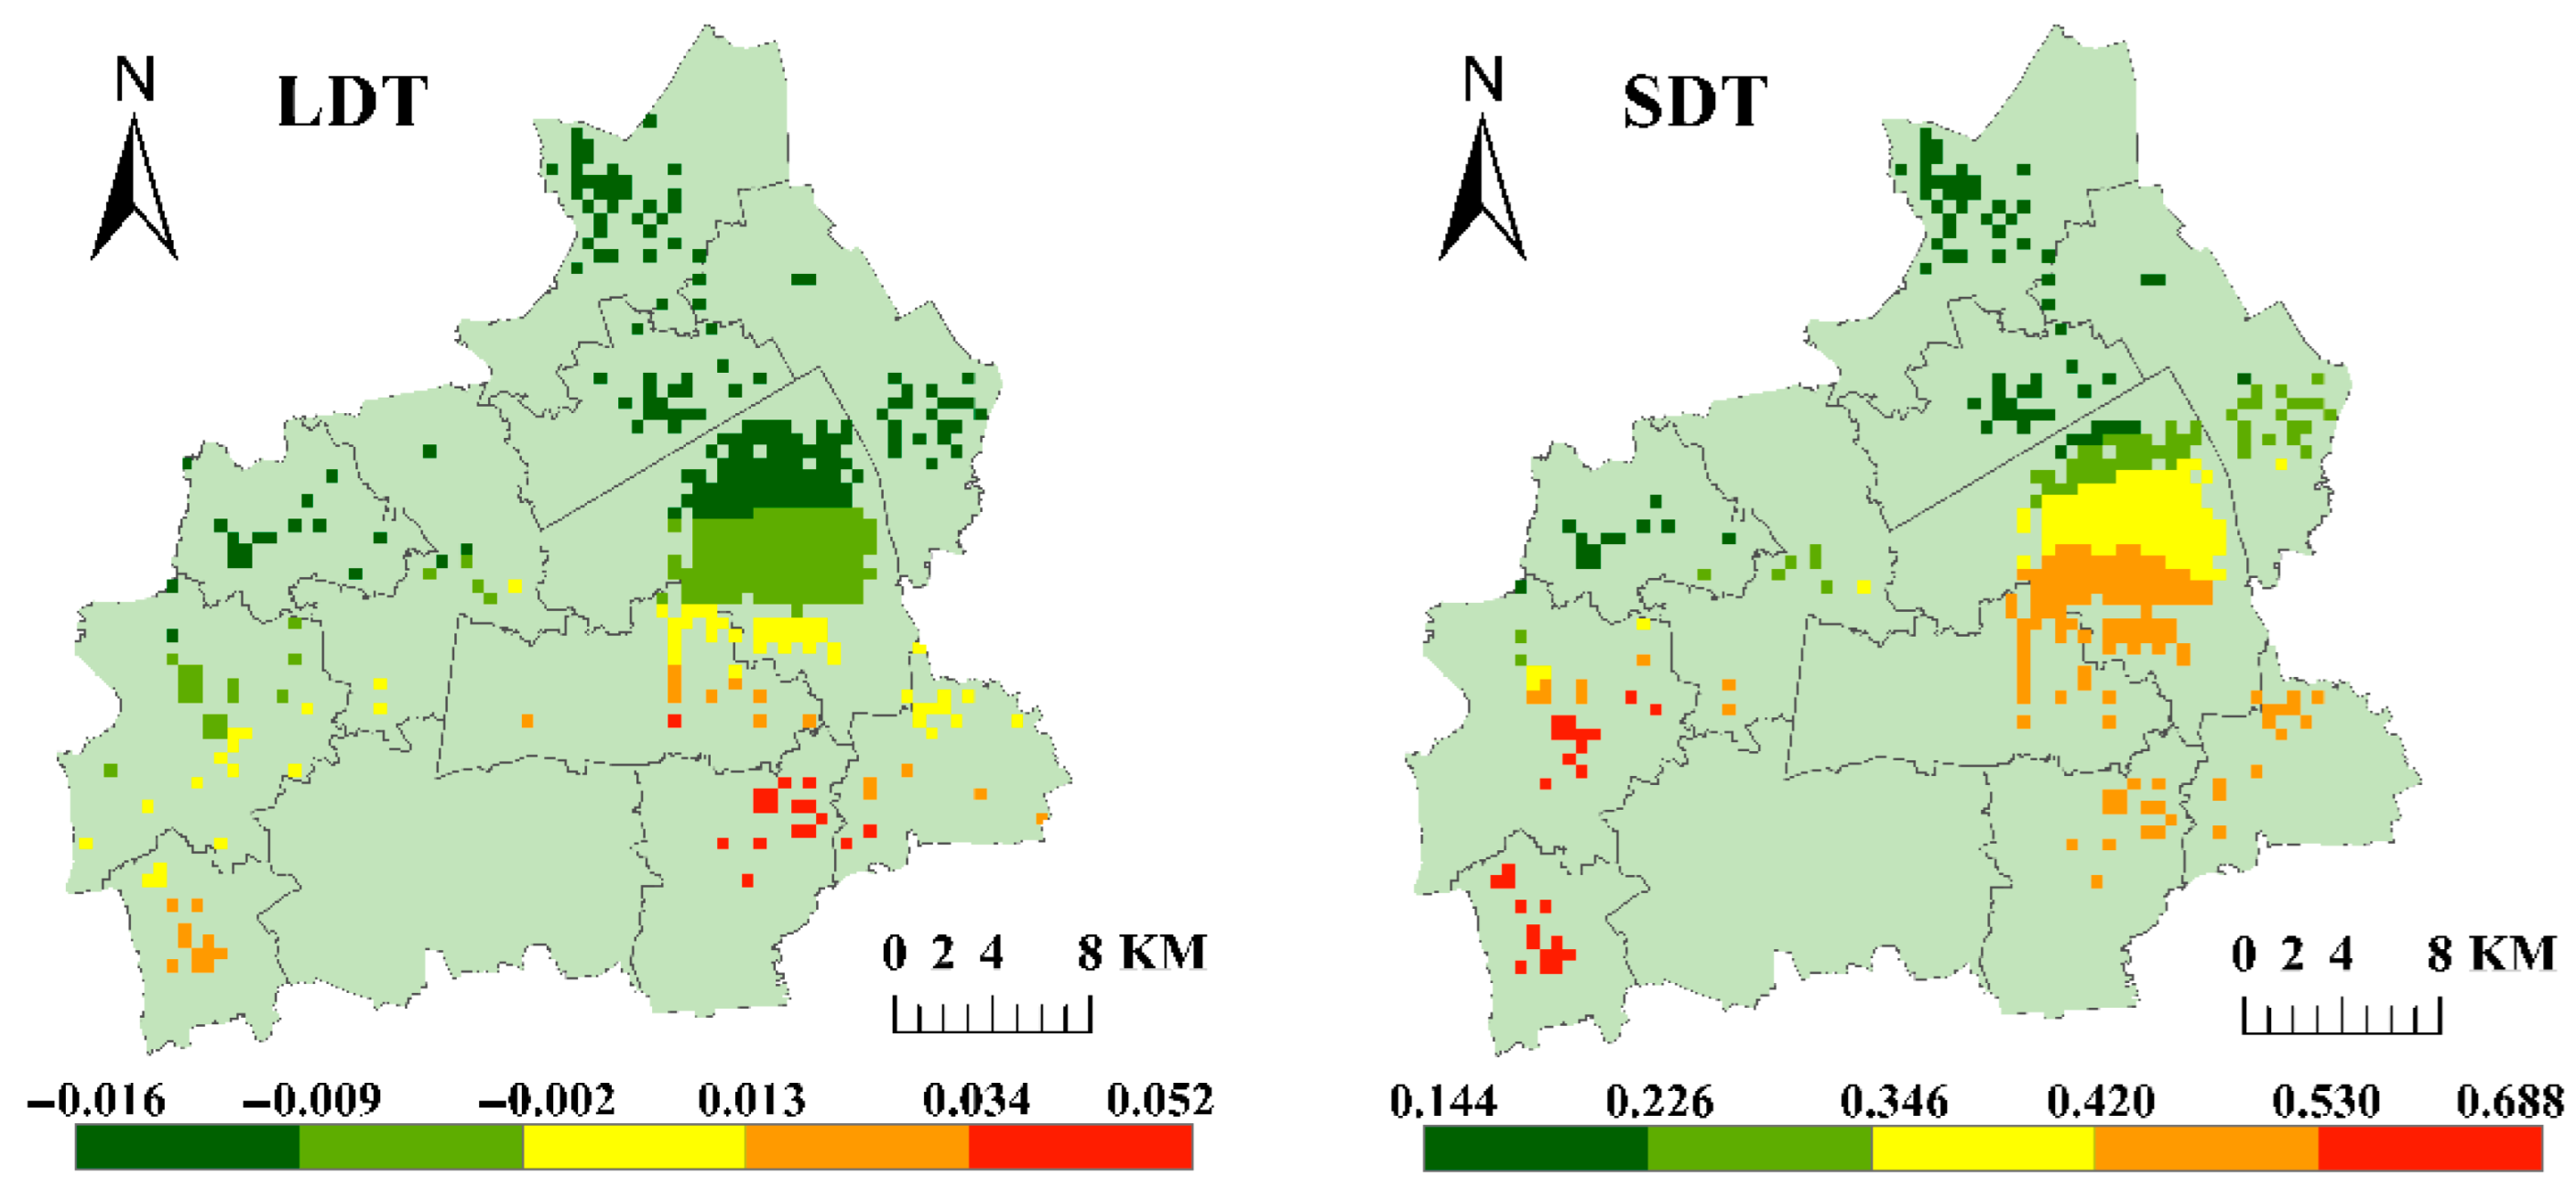
7. Policy Recommendation
- (1)
- Implementation of precise planning and management
- (2)
- Coordinated optimization of the transportation system
- (3)
- Improve the construction of road infrastructure
8. Conclusions
- (1)
- Compared to the OLS and GWR models, the MGWR model has significant advantages in revealing the spatial heterogeneity of the impact of each explanatory variable on the EBS travel demand for both long and short distances.
- (2)
- The demand for short-distance travel is prominent around scenic spots, accommodation sites, and bus stops. EBS serves the function of shuttling tourists and the “last mile” connectivity, complementing buses. However, in the main urban area with a well-developed road network, EBS competes with and substitutes buses in long-distance travel.
- (3)
- In long-distance travel, leisure services and shopping services have significant positive impacts on the EBS use in the eastern and northwestern parts of the main urban area, respectively. The eastern part of the main urban area has a denser distribution of large commercial complexes, attracting long-distance travelers. This indicates that residents are willing to travel across regions to engage in multi-purpose leisure activities, and EBS is one of the main modes of transportation for travelers heading to large leisure venues or commercial complexes.
- (4)
- The impact of the built environment on EBS use has significant context dependency. Commercial residential areas in the western job–residential separation area promote long-distance commuting, while leisure services in the eastern commercial district attract long-distance consumption travel, reflecting the structural influence of the urban functional layout on travel behavior.
Author Contributions
Funding
Institutional Review Board Statement
Informed Consent Statement
Data Availability Statement
Acknowledgments
Conflicts of Interest
References
- Zhou, Y.; Yu, Y.; Wang, Y.; He, B.; Yang, L. Mode substitution and carbon emission impacts of electric bike sharing systems. Sustain. Cities Soc. 2023, 89, 104312. [Google Scholar] [CrossRef]
- Wang, Q.; He, B.; Yan, Z. Effect of Built Environment on Activity-Travel Behavior: A Comparative Study between Kunming and Qujing. In CICTP 2019, Proceedings of the 19th COTA International Conference of Transportation Professionals, Nanjing, China, 6–8 July 2019; American Society of Civil Engineers: New York, NY, USA, 2019; pp. 6044–6056. [Google Scholar]
- Li, Q.; Qin, Y.; Xu, W. Is there a link between city characteristics and shared e-bike utilisation? Evidence from China. Sustain. Cities Soc. 2025, 120, 106008. [Google Scholar] [CrossRef]
- Li, Y.; Dai, Z.; Zhu, L.; Liu, X. Analysis of spatial and temporal characteristics of citizens’ mobility based on e-bike GPS trajectory data in Tengzhou City, China. Sustainability 2019, 11, 5003. [Google Scholar] [CrossRef]
- Yang, Y.; Li, T.; Zhang, T.; Yang, W. Understanding the utilization characteristics of bicycle-sharing systems in underdeveloped cities: A case study in Xuchang City, China. Transp. Res. Rec. 2017, 2634, 78–85. [Google Scholar] [CrossRef]
- Chen, Y.; Xu, S.; Du, M.; Ma, H.; Wang, S.; Li, F. Comparing the Spatiotemporal Travel Patterns and Influencing Factors of Bike Sharing and E-Bike Sharing Systems. Int. Arch. Photogramm. Remote Sens. Spat. Inf. Sci. 2023, 48, 339–345. [Google Scholar] [CrossRef]
- Li, A.; Zhao, P.; Huang, Y.; Gao, K.; Axhausen, K.W. An empirical analysis of dockless bike-sharing utilization and its explanatory factors: Case study from Shanghai, China. J. Transp. Geogr. 2020, 88, 102828. [Google Scholar] [CrossRef]
- Tang, T.; Guo, Y.; Zhou, X.; Labi, S.; Zhu, S. Understanding electric bike riders’ intention to violate traffic rules and accident proneness in China. Travel Behav. Soc. 2021, 23, 25–38. [Google Scholar] [CrossRef]
- Li, J.; Shen, J.; Jia, B. Exploring intention to use shared electric bicycles by the extended theory of planned behavior. Sustainability 2021, 13, 4137. [Google Scholar] [CrossRef]
- Li, W.; Yang, Y.; Cheng, L.; Meng, X.; Zhang, F.; Ji, Y. Understanding adoption intent and behavioral response to shared electric bicycles: A survey in Ningbo, China. Transp. Res. Rec. 2023, 2677, 1311–1326. [Google Scholar] [CrossRef]
- Campbell, A.A.; Cherry, C.R.; Ryerson, M.S.; Yang, X. Factors influencing the choice of shared bicycles and shared electric bikes in Beijing. Transp. Res. Part C Emerg. Technol. 2016, 67, 399–414. [Google Scholar] [CrossRef]
- Chen, J.; Zhang, Y.; Zhang, R.; Cheng, X.; Yan, F. Analyzing users’ attitudes and behavior of free-floating bike sharing: An investigating of Nanjing. Transp. Res. Procedia 2019, 39, 634–645. [Google Scholar] [CrossRef]
- Li, X.; Zhang, Y.; Sun, L.; Liu, Q. Free-floating bike sharing in jiangsu: Users’ behaviors and influencing factors. Energies 2018, 11, 1664. [Google Scholar] [CrossRef]
- Ning, J.; Chen, J.; Chen, X.; Yu, X. Traveler preference analysis between dockless bike-sharing and electric bike-sharing in last-mile metro context: Insights from Nanjing’s urban and suburban areas. Travel Behav. Soc. 2025, 40, 100999. [Google Scholar] [CrossRef]
- He, Y.; Song, Z.; Liu, Z.; Sze, N. Factors influencing electric bike share ridership: Analysis of Park City, Utah. Transp. Res. Rec. 2019, 2673, 12–22. [Google Scholar] [CrossRef]
- Guidon, S.; Becker, H.; Dediu, H.; Axhausen, K.W. Electric bicycle-sharing: A new competitor in the urban transportation market? An empirical analysis of transaction data. Transp. Res. Rec. 2019, 2673, 15–26. [Google Scholar] [CrossRef]
- Ma, X.; Ji, Y.; Yuan, Y.; Van Oort, N.; Jin, Y.; Hoogendoorn, S. A comparison in travel patterns and determinants of user demand between docked and dockless bike-sharing systems using multi-sourced data. Transp. Res. Part A Policy Pract. 2020, 139, 148–173. [Google Scholar] [CrossRef]
- Lang, H.; Zhang, S.; Fang, K.; Xing, Y.; Xue, Q. What Is the Impact of a Dockless Bike-Sharing System on Urban Public Transit Ridership: A View from Travel Distances. Sustainability 2023, 15, 10753. [Google Scholar] [CrossRef]
- Shi, Z.; Wang, J.; Liu, K.; Liu, Y.; He, M. Exploring the usage efficiency of electric bike-sharing from a spatial–temporal perspective. Transp. Res. Part D Transp. Environ. 2024, 129, 104139. [Google Scholar] [CrossRef]
- Gou, C.; Feng, C.; Tan, S.; Guo, M.; Li, R.; Zhao, F. Evaluating the impact of built environment on shared electric bicycle connectivity in kunming’s public transport system. Sci. Rep. 2025, 15, 5156. [Google Scholar] [CrossRef] [PubMed]
- Zhu, Y.; Yang, Z.; Feng, X.; Cheng, C.; Guo, Y.; Li, Q.; Wu, T.; Li, X.; Witlox, F. Comparing built environment effects on bike-sharing and electric bike-sharing usage: A spatiotemporal machine learning approach. Transp. Res. Part A Policy Pract. 2025, 200, 104642. [Google Scholar] [CrossRef]
- Tang, J.H.C.G.; Huang, Y.; Zhu, Y.; Yang, X.; Zhuge, C. The association between travel demand of docked bike-sharing and the built environment: Evidence from seven US cities. Sustain. Cities Soc. 2024, 106, 105325. [Google Scholar] [CrossRef]
- Wu, C.; Kim, I.; Chung, H. The effects of built environment spatial variation on bike-sharing usage: A case study of Suzhou, China. Cities 2021, 110, 103063. [Google Scholar] [CrossRef]
- Fukushige, T.; Fitch, D.T.; Handy, S. Factors influencing dock-less E-bike-share mode substitution: Evidence from Sacramento, California. Transp. Res. Part D Transp. Environ. 2021, 99, 102990. [Google Scholar] [CrossRef]
- Chen, J.; Liu, X.; Chen, X.; Wang, Y. Influence of e-bikeshare on transit ridership in a medium-sized Chinese city. Transp. Res. Part D Transp. Environ. 2025, 139, 104564. [Google Scholar] [CrossRef]
- Waldner, F.; Balke, G.; Rech, F.; Lellep, M. Data-driven insights into (E-) bike-sharing: Mining a large-scale dataset on usage and urban characteristics: Descriptive analysis and performance modeling. Transportation 2025, 1–41. [Google Scholar] [CrossRef]
- Gedamu, W.T.; Plank-Wiedenbeck, U.; Wodajo, B.T. A spatial autocorrelation analysis of road traffic crash by severity using Moran’s I spatial statistics: A comparative study of Addis Ababa and Berlin cities. Accid. Anal. Prev. 2024, 200, 107535. [Google Scholar] [CrossRef]
- Vandenbulcke, G.; Dujardin, C.; Thomas, I.; de Geus, B.; Degraeuwe, B.; Meeusen, R.; Panis, L.I. Cycle commuting in Belgium: Spatial determinants and ‘re-cycling’strategies. Transp. Res. Part A Policy Pract. 2011, 45, 118–137. [Google Scholar] [CrossRef]
- Pan, Y.; Chen, S.; Niu, S.; Ma, Y.; Tang, K. Investigating the impacts of built environment on traffic states incorporating spatial heterogeneity. J. Transp. Geogr. 2020, 83, 102663. [Google Scholar] [CrossRef]
- Moran, P.A. Notes on continuous stochastic phenomena. Biometrika 1950, 37, 17–23. [Google Scholar] [CrossRef]
- Brunsdon, C.; Fotheringham, A.S.; Charlton, M.E. Geographically weighted regression: A method for exploring spatial nonstationarity. Geogr. Anal. 1996, 28, 281–298. [Google Scholar] [CrossRef]
- Fotheringham, A.S.; Yang, W.; Kang, W. Multiscale geographically weighted regression (MGWR). Ann. Am. Assoc. Geogr. 2017, 107, 1247–1265. [Google Scholar] [CrossRef]
- Li, Z.; Shang, Y.; Zhao, G.; Yang, M. Exploring the multiscale relationship between the built environment and the metro-oriented dockless bike-sharing usage. Int. J. Environ. Res. Public Health 2022, 19, 2323. [Google Scholar] [CrossRef] [PubMed]
| Variables | Main References |
|---|---|
| Road Network Indicators | |
| Primary roads | Chen et al. (2025) [25] |
| Secondary roads | Chen et al. (2025) [25] |
| Tertiary roads | Chen et al. (2025) [25] |
| Land Use Indicators | |
| Population density | Felix et al. (2025) [26]; Wu et al. (2021) [23]; Chen et al. (2025) [25] |
| Catering services | Wu et al. (2021) [23]; Chen et al. (2025) [25]; Lang et al. (2023) [18]; Gou et al. (2025) [20] |
| Corporations | Wu et al. (2021) [23]; Chen et al. (2025) [25]; Li et al. (2020) [7]; Shi et al. (2024) [19] |
| Shopping services | Wu et al. (2021) [23]; Li et al. (2020) [7]; Lang et al. (2023) [18] |
| Financial services | Li et al. (2020) [7]; Tang et al. (2024) [22]; Gou et al. (2025) [20] |
| Culture and educational services | Li et al. (2020) [7]; Chen et al. (2023) [6]; Gou et al. (2025) [20] |
| Living services | Lang et al. (2023) [18]; Shi et al. (2024) [19]; Gou et al. (2025) [20] |
| Sports and leisure services | Gou et al. (2025) [20]; Ma et al. (2020) [17] |
| Medical services | Chen et al. (2025) [25]; Li et al. (2020) [7]; Tang et al. (2024) [22]; Gou et al. (2025) [20] |
| Government agency | Chen et al. (2025) [25]; Li et al. (2020) [7]; Chen et al. (2023) [6]; Tang et al. (2024) [22] |
| Accommodation services | Li et al. (2020) [7]; Lang et al. (2023) [18]; Gou et al. (2025) [20] |
| Commercial residences | Chen et al. (2023) [6]; Tang et al. (2024) [22] |
| Tourist attractions | Chen et al. (2025) [25]; Li et al. (2020) [7] |
| Public Transport Indicators | |
| Ground public transport | Wu et al. (2021) [23]; Chen et al. (2025) [25]; Chen et al. (2023) [6]; Tang et al. (2024) [22] |
| Variables | Long-Distance | Short-Distance | Spatial Autocorrelation | ||||
|---|---|---|---|---|---|---|---|
| Coef. | VIF | Coef. | VIF | Moran’s I | Z-Score | p-Value | |
| LDT | 0.540 | 49.250 | 0.000 | ||||
| SDT | 0.461 | 42.711 | 0.000 | ||||
| Shopping services | −0.546 | 2.372 | −1.473 | 2.359 | 0.616 | 56.413 | 0.000 |
| Cultural and educational services | 9.879 | 1.719 | 4.807 | 1.704 | 0.440 | 40.094 | 0.000 |
| Sports and leisure services | 10.535 | 2.450 | 8.483 | 2.447 | 0.384 | 35.357 | 0.000 |
| Commercial residences | 28.737 | 1.753 | 19.274 | 1.745 | 0.608 | 55.074 | 0.000 |
| Accommodation services | −1.921 | 1.493 | 2.578 | 1.495 | 0.574 | 53.934 | 0.000 |
| Bus stops | 29.261 | 1.242 | 42.417 | 1.246 | 0.263 | 23.777 | 0.000 |
| Trunk road density | 19.035 | 1.137 | 11.298 | 1.142 | 0.395 | 35.701 | 0.000 |
| Model | Long-Distance Demand (LDT) | Short-Distance Demand (SDT) | ||||||
|---|---|---|---|---|---|---|---|---|
| AICc | R2 | R2Adj | Bandwidth | AICc | R2 | R2Adj | Bandwidth | |
| OSL | 5755.989 | 0.468 | 0.445 | - | 5827.087 | 0.315 | 0.285 | - |
| GWR | 962.724 | 0.555 | 0.503 | 322 | 1030.915 | 0.315 | 0.285 | 335 |
| MGWR | 881.001 | 0.708 | 0.640 | [68, 423] | 949.238 | 0.579 | 0.500 | [45, 402] |
| Variables | Bandwidth | Mean | Std | Min | Median | Max | |
|---|---|---|---|---|---|---|---|
| LDT | Constant term | 68 | 0.081 | 0.298 | −0.418 | 0.129 | 0.63 |
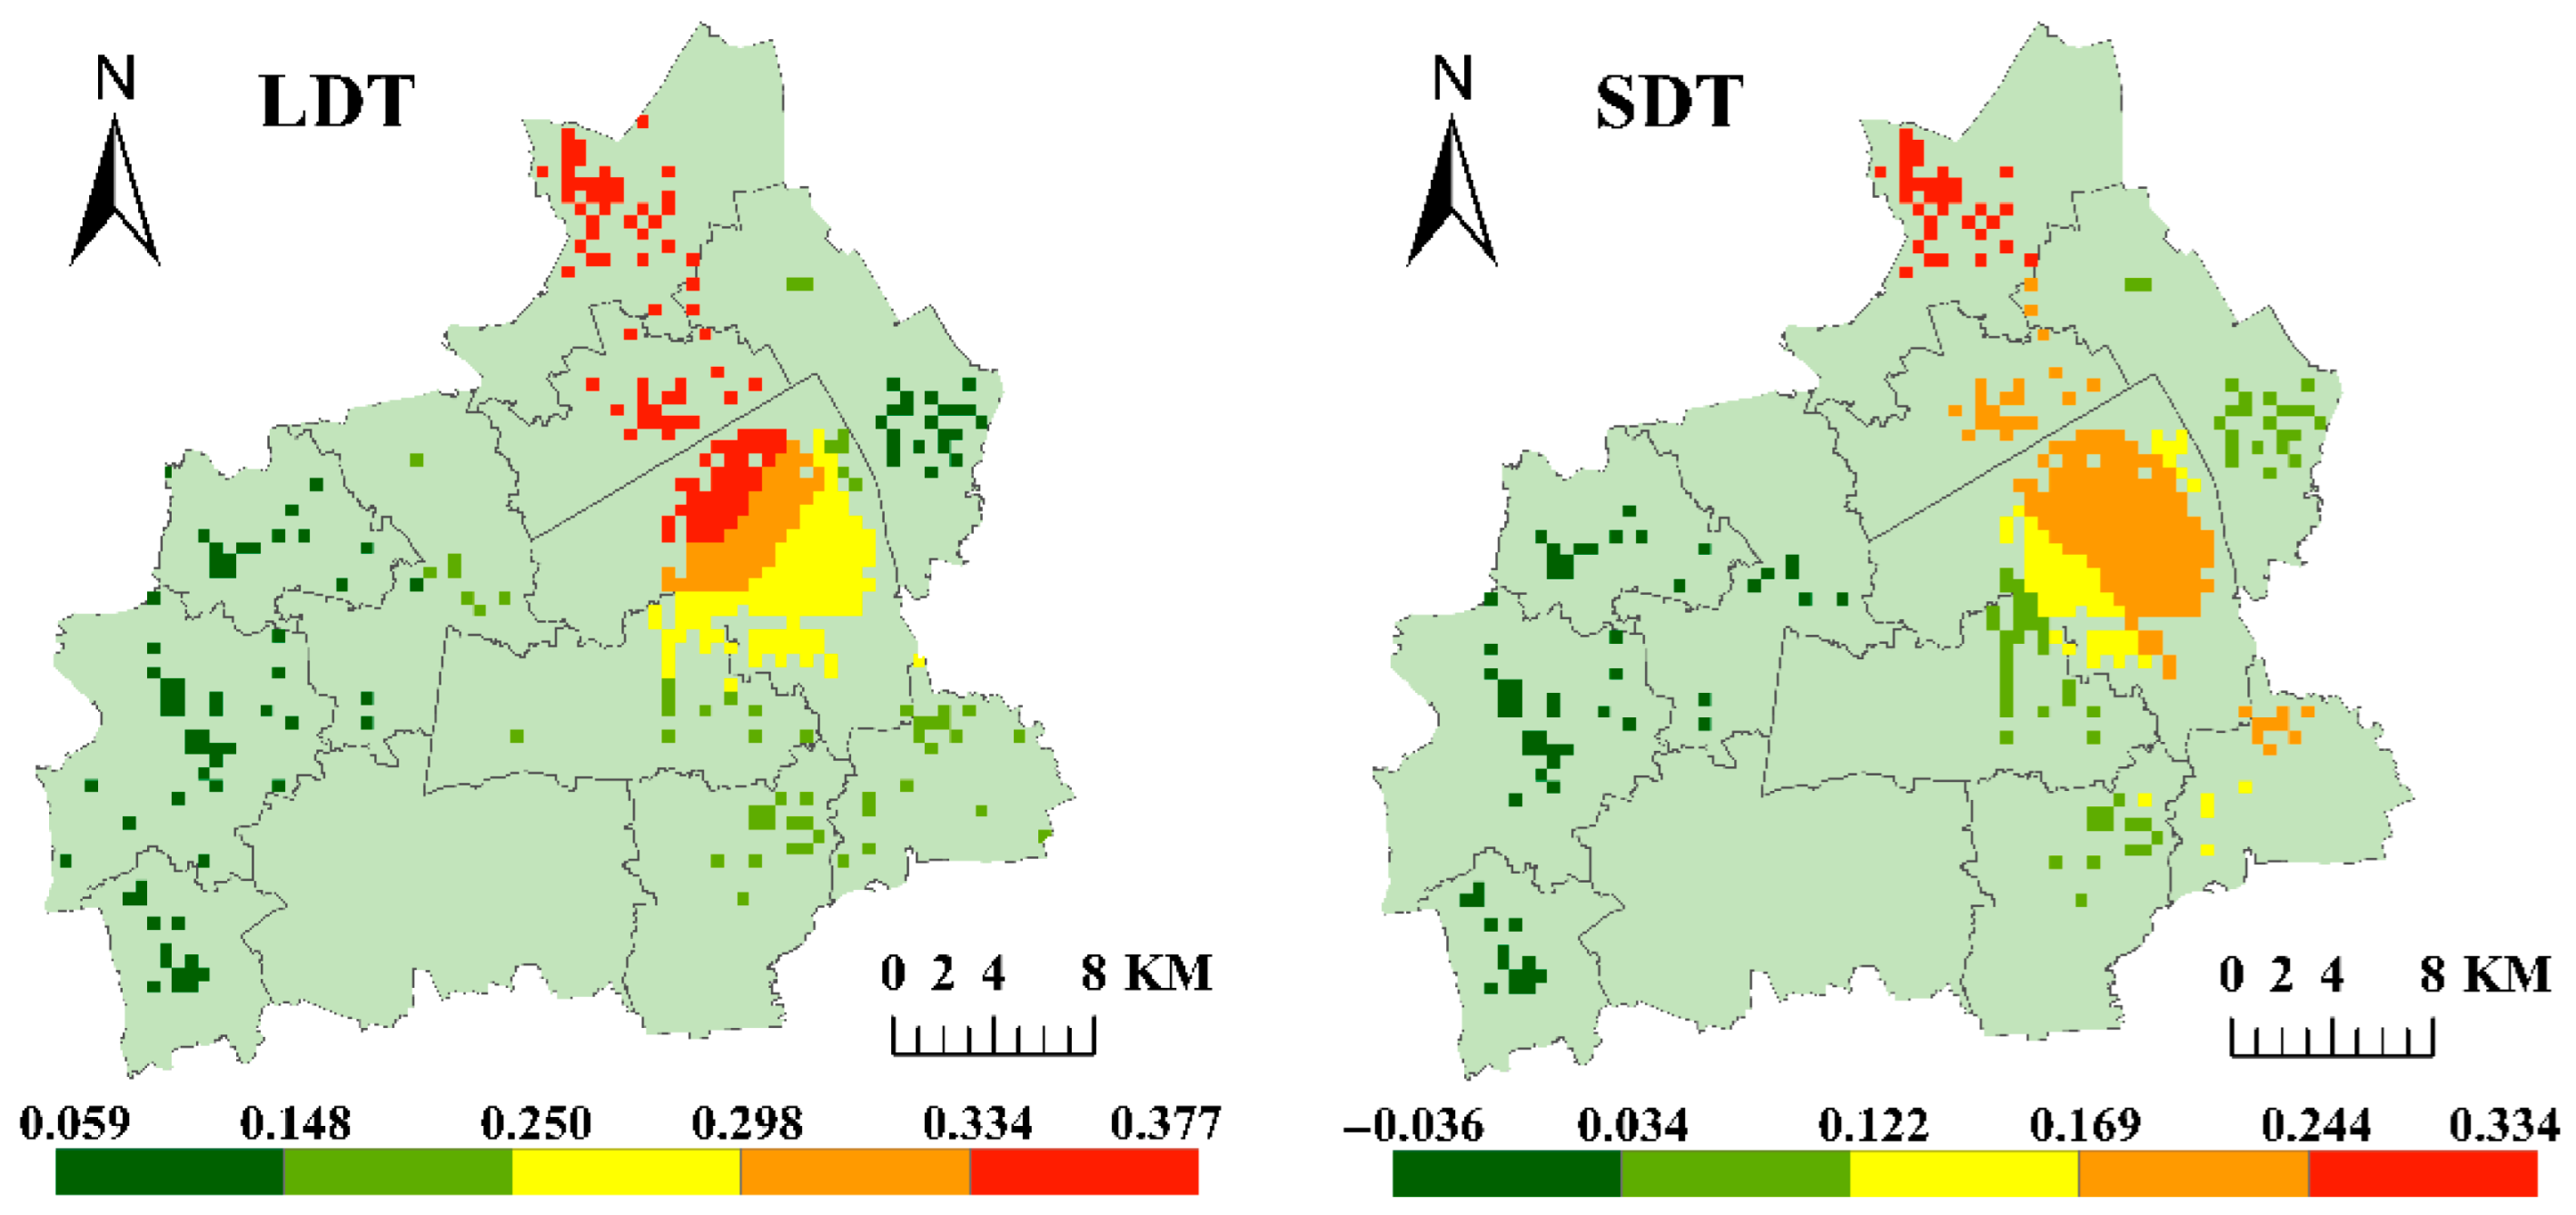
| Shopping services | 211 | 0.256 | 0.098 | 0.059 | 0.282 | 0.377 | |
| Cultural and educational services | 423 | 0.051 | 0.010 | 0.027 | 0.053 | 0.377 | |
| Commercial residences | 422 | 0.157 | 0.011 | 0.144 | 0.154 | 0.183 | |
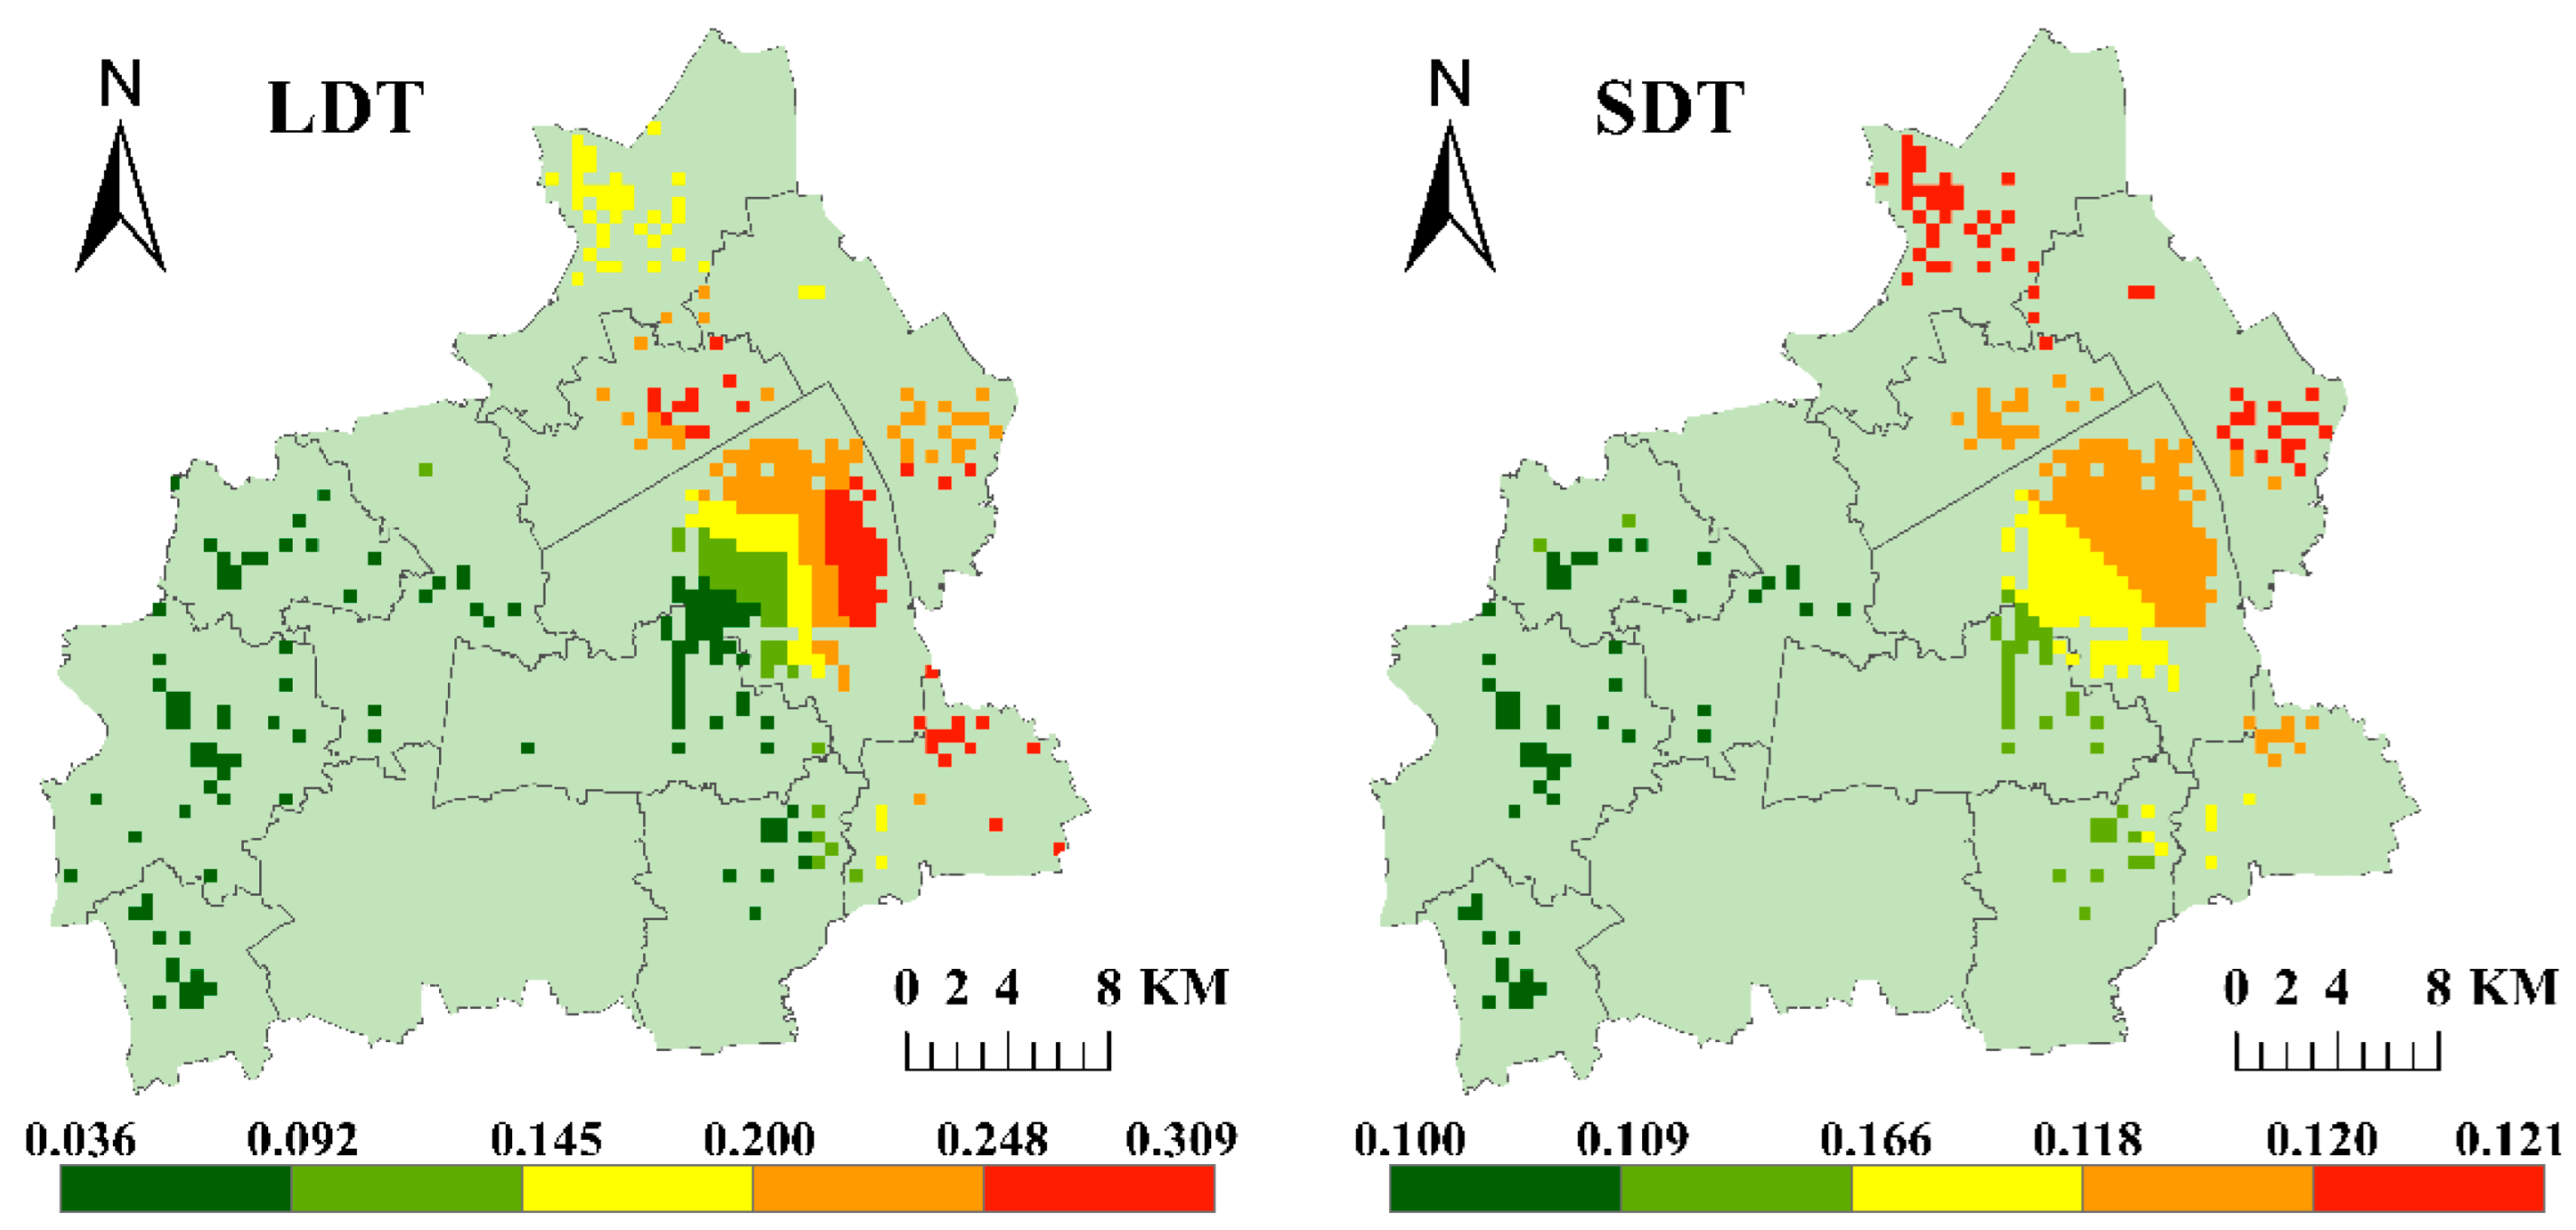
| Sports and leisure services | 176 | 0.166 | 0.077 | 0.036 | 0.174 | 0.309 | |
| Accommodation services | 423 | −0.004 | 0.014 | −0.016 | −0.009 | 0.052 | |
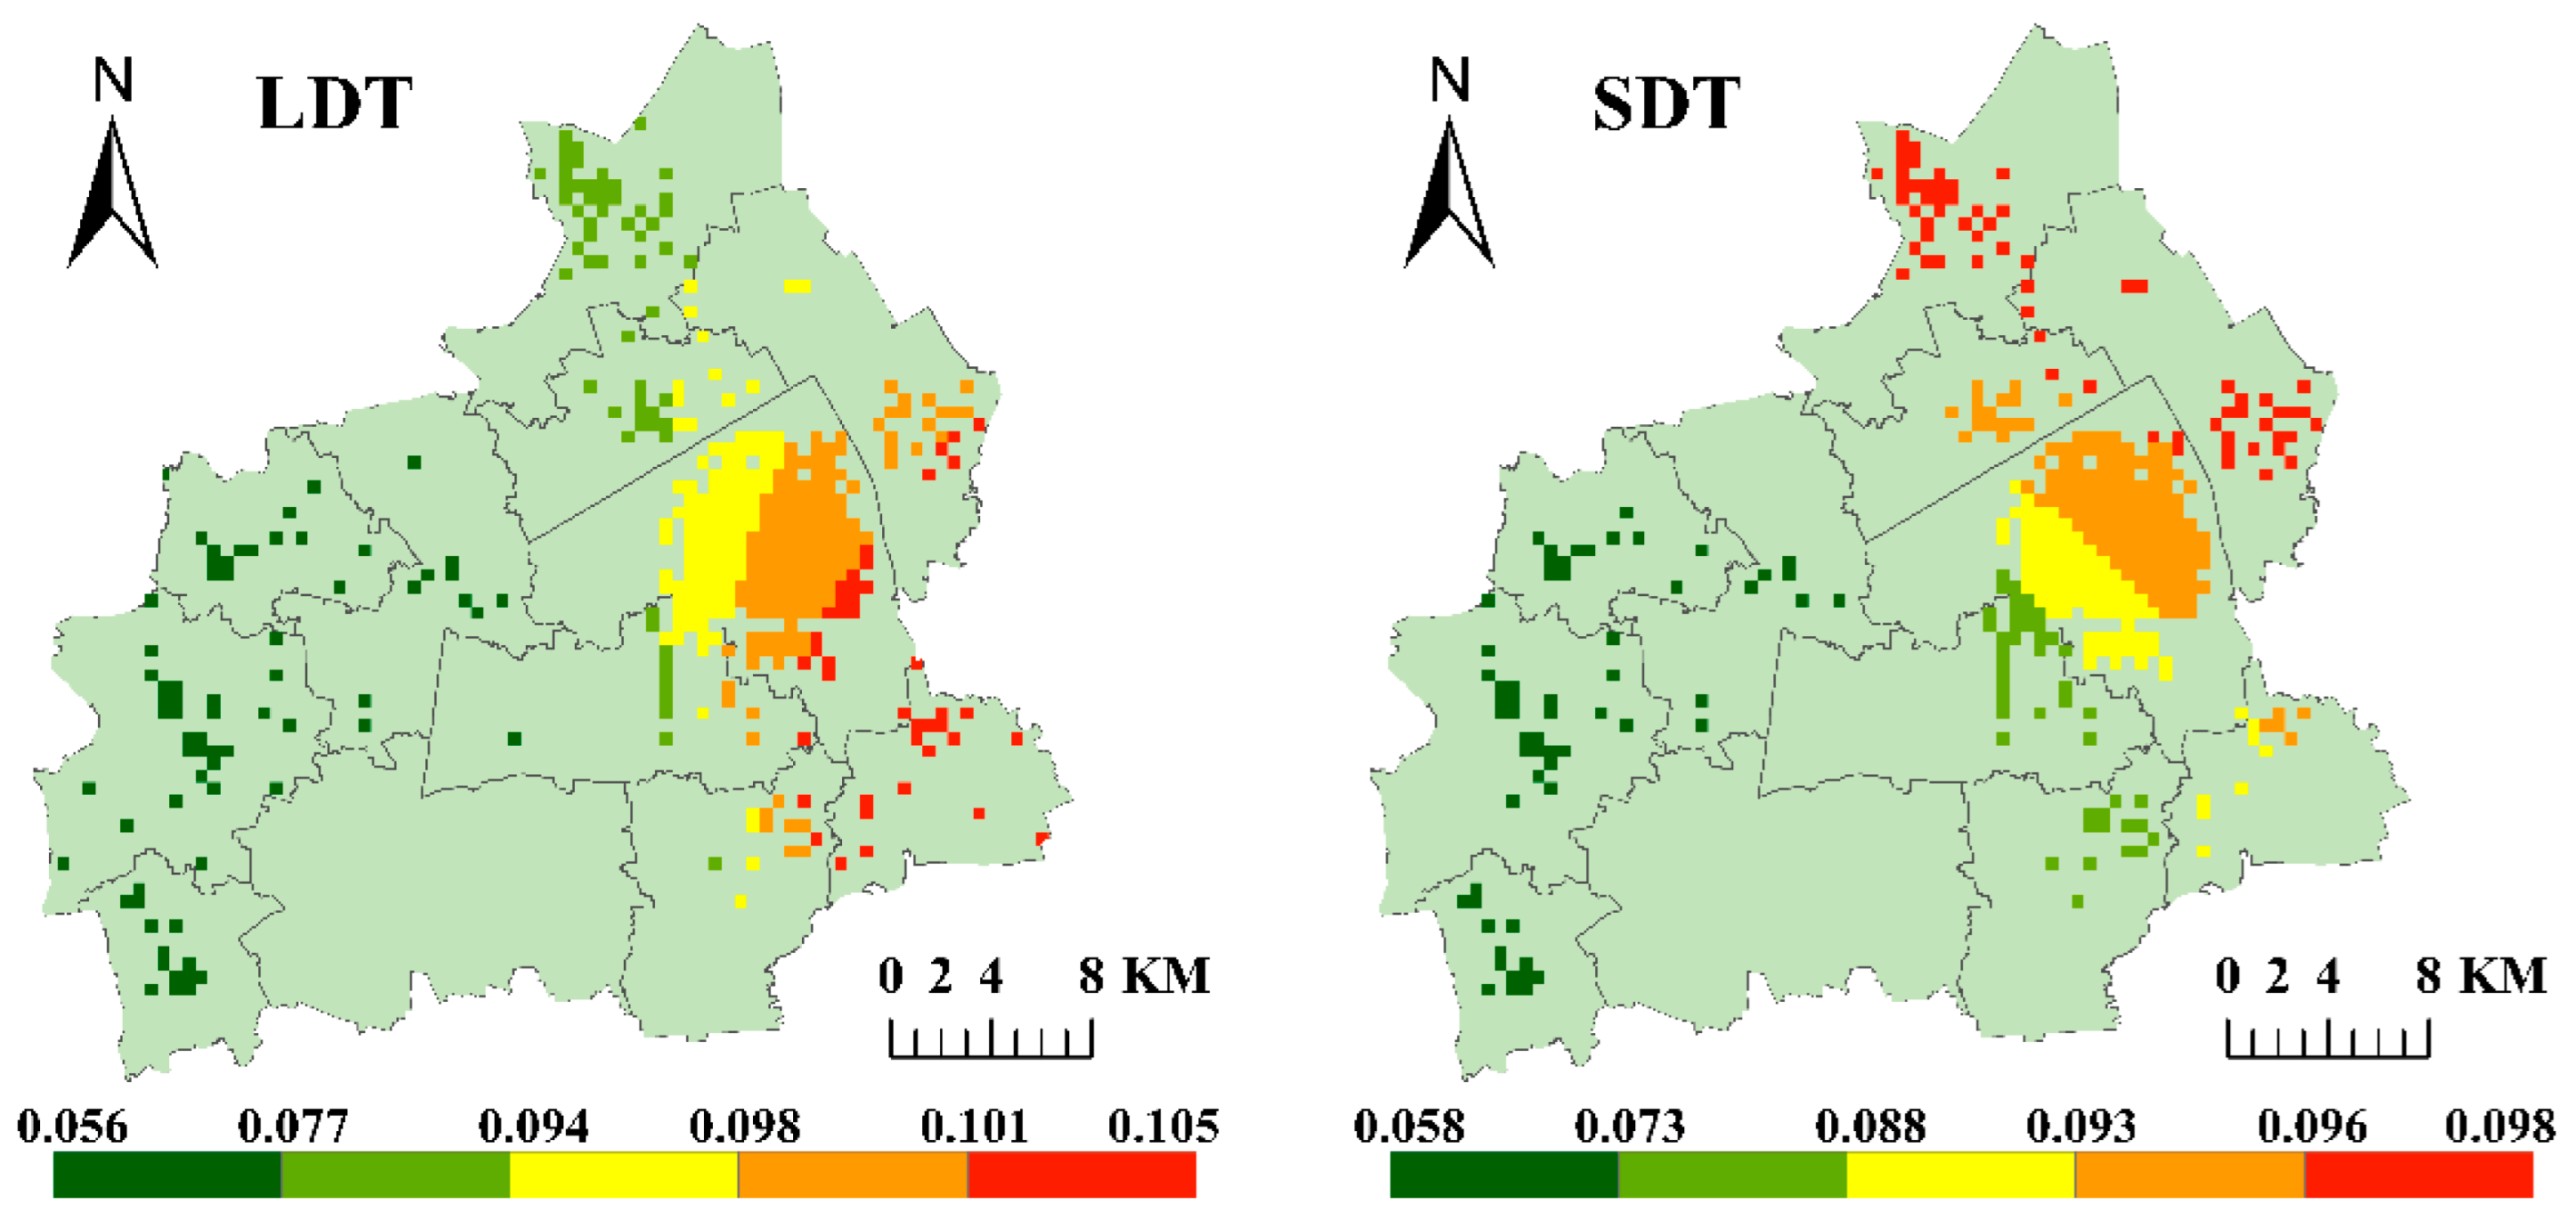
| Bus stops | 423 | 0.091 | 0.014 | 0.056 | 0.096 | 0.105 | |
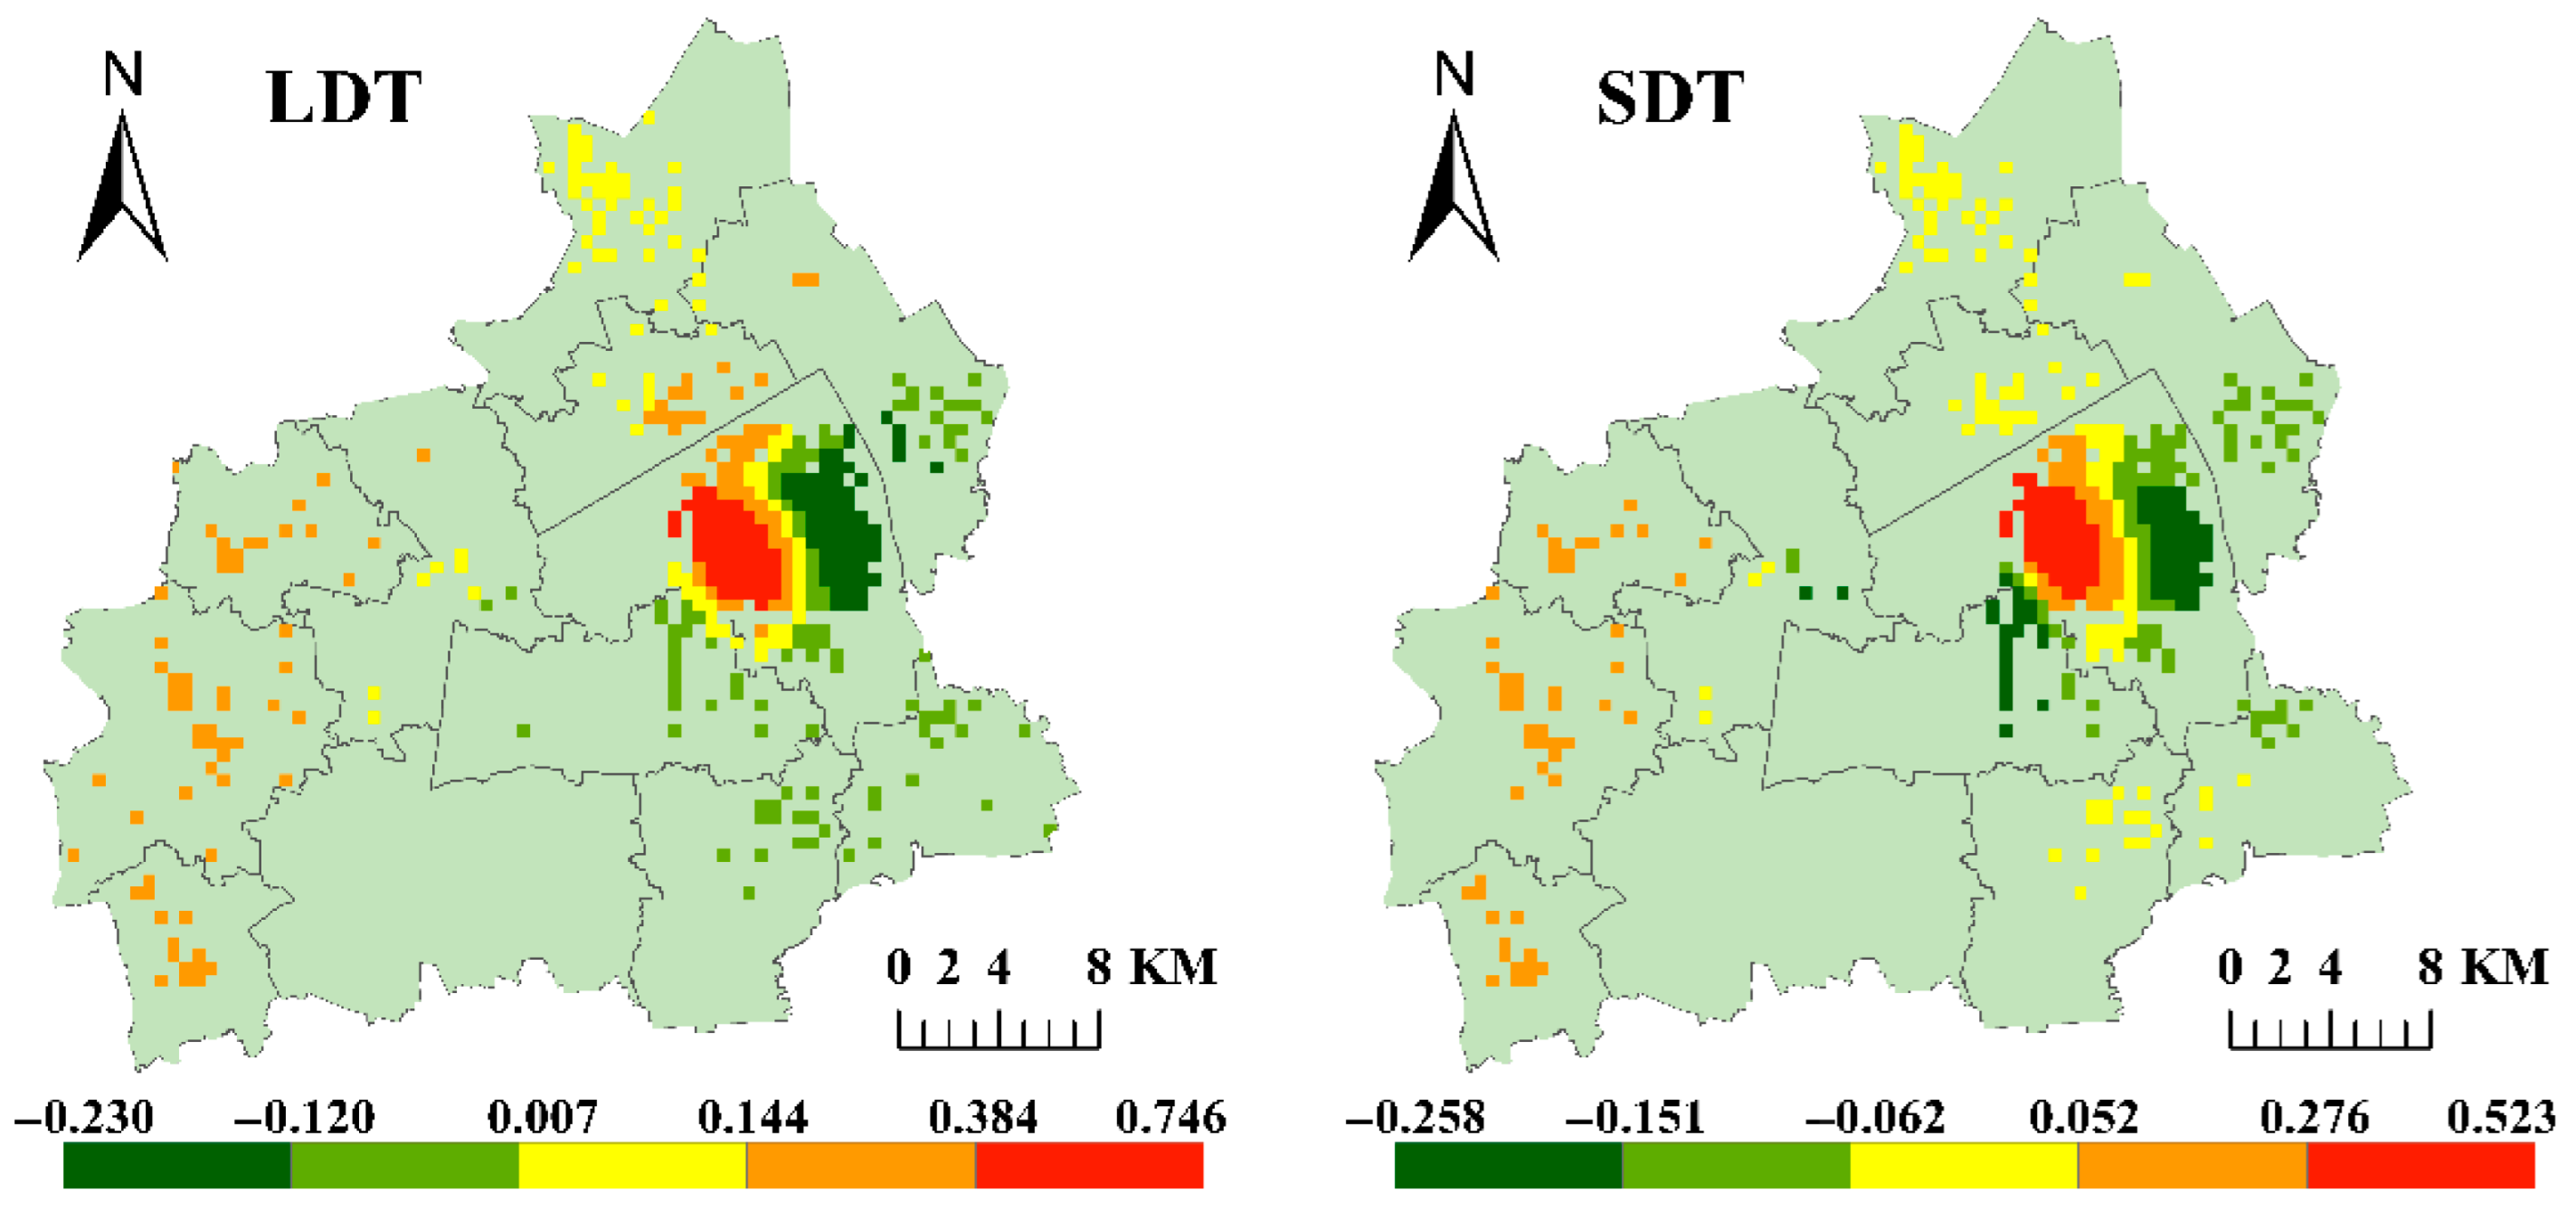
| Primary road | 85 | 0.099 | 0.225 | −0.23 | 0.074 | 0.746 | |
| SDT | Constant term | 45 | 0.104 | 0.37 | −0.52 | 0.035 | 1.233 |
| Shopping services | 237 | 0.147 | 0.085 | −0.036 | 0.173 | 0.334 | |
| Cultural and educational services | 402 | 0.033 | 0.011 | 0.002 | 0.035 | 0.053 | |
| Commercial residences | 402 | 0.03 | 0.006 | 0.026 | 0.028 | 0.051 | |
| Sports and leisure services | 402 | 0.115 | 0.005 | 0.1 | 0.117 | 0.121 | |
| Accommodation services | 338 | 0.366 | 0.127 | 0.144 | 0.41 | 0.688 | |
| Bus stops | 402 | 0.088 | 0.011 | 0.058 | 0.092 | 0.098 | |
| Primary road | 92 | 0.021 | 0.186 | −0.258 | −0.037 | 0.523 |
Disclaimer/Publisher’s Note: The statements, opinions and data contained in all publications are solely those of the individual author(s) and contributor(s) and not of MDPI and/or the editor(s). MDPI and/or the editor(s) disclaim responsibility for any injury to people or property resulting from any ideas, methods, instructions or products referred to in the content. |
© 2025 by the authors. Licensee MDPI, Basel, Switzerland. This article is an open access article distributed under the terms and conditions of the Creative Commons Attribution (CC BY) license (https://creativecommons.org/licenses/by/4.0/).
Share and Cite
Wang, X.; Peng, Z.; Li, X.; Du, M.; Lyu, F.; Kang, J.-Y.; Lee, K.; Liu, D. Analysis of the Multi-Scale Spatial Heterogeneity of Factors Influencing the Electric Bike-Sharing Travel Demand in Small and Medium-Sized Cities. Sustainability 2025, 17, 10437. https://doi.org/10.3390/su172310437
Wang X, Peng Z, Li X, Du M, Lyu F, Kang J-Y, Lee K, Liu D. Analysis of the Multi-Scale Spatial Heterogeneity of Factors Influencing the Electric Bike-Sharing Travel Demand in Small and Medium-Sized Cities. Sustainability. 2025; 17(23):10437. https://doi.org/10.3390/su172310437
Chicago/Turabian StyleWang, Xin, Zhiyuan Peng, Xuefeng Li, Mingyang Du, Fangzheng Lyu, Jeon-Young Kang, Kangjae Lee, and Dong Liu. 2025. "Analysis of the Multi-Scale Spatial Heterogeneity of Factors Influencing the Electric Bike-Sharing Travel Demand in Small and Medium-Sized Cities" Sustainability 17, no. 23: 10437. https://doi.org/10.3390/su172310437
APA StyleWang, X., Peng, Z., Li, X., Du, M., Lyu, F., Kang, J.-Y., Lee, K., & Liu, D. (2025). Analysis of the Multi-Scale Spatial Heterogeneity of Factors Influencing the Electric Bike-Sharing Travel Demand in Small and Medium-Sized Cities. Sustainability, 17(23), 10437. https://doi.org/10.3390/su172310437


