Article

Preliminary Findings of Heavy Metal Contents from Road Dust and Health Risk Assessments Towards a More Sustainable Future in Macao

by
Thomas M. T. Lei
1,*,
Yuyang Liu
1,
Wenlong Ye
1,
Wan Hee Cheng
2,
Altaf Hossain Molla
3,
L.-W. Antony Chen
4 and
Shuiping Wu
5
1
Institute of Science and Environment, University of Saint Joseph, Macau 999078, China
2
Faculty of Health and Life Sciences, INTI International University, Nilai 71800, Negeri Sembilan, Malaysia
3
Department of Mechanical and Manufacturing Engineering, Faculty of Engineering and Built Environment, Universiti Kebangsaan Malaysia (UKM), Bangi 43600, Selangor, Malaysia
4
Department of Environmental and Global Health, School of Public Health, University of Nevada, Las Vegas, NV 89154, USA
5
College of Environment and Ecology, Xiamen University, Xiamen 361102, China
*
Author to whom correspondence should be addressed.
Sustainability 2025, 17(23), 10433; https://doi.org/10.3390/su172310433
Submission received: 19 September 2025 / Revised: 24 October 2025 / Accepted: 19 November 2025 / Published: 21 November 2025
(This article belongs to the Special Issue Impact of Heavy Metals on the Sustainable Environment—2nd Edition)

Abstract

Road dust contains a variety of heavy metals and is a widely used sustainability indicator for monitoring pollution and assessing environmental and health risks in sustainable development. Heavy metals in road dust mainly originate from worn-off particles from vehicles, such as tires, brake pads, road dust, and emissions from exhaust pipes. These heavy metal particles could remain on the road surface for a long period and cause environmental pollution. In this preliminary study, road dust was collected from 8 representative areas in Macao. The heavy metal content from road dust in Macao was extracted from each of the collected samples for an assessment of the heavy metal pollution and its potential threat to human health. The results show that heavy metals primarily originate from human activities, including transportation emissions (Mn: 67.37%, Zn: 57.01%, Sb: 54.1%) and industrial activities (Al: 84.70%, Fe: 76.71%, Pb: 65.32%). The metal-specific non-carcinogenic risk ranges from 1.17 × 10⁻⁷ to 2.65 × 10⁻⁵ and the total carcinogenic risk is 6.91 × 10⁻¹⁰, showing minimum health effects from heavy metals in road dust. Furthermore, there is a significant correlation between the total vehicle counts and the heavy metal contents such as Al, Si, As, V, and Fe (r = 0.50 to 0.82). This work represents the first characterization of heavy metal contents and risks of urban road dust in Macao.

1. Introduction

In urban areas with high population density and intense human activities, heavy metals may originate from multiple sources [1,2]. Road dust is one of the main sources of heavy metal pollution in urban settings. Common heavy metals found in road dust include lead (Pb), cadmium (Cd), mercury (Hg), copper (Cu), chromium (Cr), zinc (Zn), arsenic (As), and nickel (Ni) [3,4]. The presence of heavy metals in road dust not only causes pollution to the environment but also poses a threat to human health [5,6]. Furthermore, road dust may contain organic matter, mold spores, animal dander, and pollen [6,7].
Heavy metals are released by fuel combustion and brake/tire wear during the normal driving cycle [8,9]. For example, lead was once widely applied in gasoline for enhanced performance, and it has been banned in many countries after studies showed the negative impact on health [10,11]. The wear of tires, brake pads, and road surfaces produces small particles that may contain heavy metals [12,13]. These particles travel with the wind and settle on the city’s roads and environment [14,15] and are later resuspended due to vehicle movement and wind.
Exhaust gases and wastewater from industrial facilities near roads (such as smelters, chemical plants) may also contain heavy metals, which are washed into the sewage system by rain [16]. In the process of house construction and demolition, the materials used (such as paint and concrete) may contain heavy metals, and dust generated during the construction process can also be introduced to the road environment [17,18].
Previous studies identified influencing factors such as heavy loads of traffic during rush hours, the daily commute, and special events in Macao. Since the economy of Macao depends mainly on tourism and the mass transit system is not the most sophisticated, most tourists and residents rely on buses, taxis, motorcycles, and private vehicles for transportation [19,20].
This study aims to characterize the heavy metal contents in road dust across different urban roads and their collective health risks in Macao, China. Through scientific monitoring, effective governance, and public participation, the threat to the environment and human health can be mitigated. Strengthening management and policy formulation will help improve the quality of the urban environment and protect public health.

2. Materials and Methods

2.1. Road Dust Sampling Locations

The heavy metal contents in road dust from eight sampling locations were studied. Figure 1 shows the locations across Macao: G1 is the outer harbor terminal; G2 is the south customs entry and exit port in the south of Macao (Hengqin Port); G3 is the southern city center of Macao; G4 is Macao Industrial Zone; G5 is the Macao Sai Van Bridge; G6 is the bus transportation hub of Macao; G7 is the Macao Ruins of St. Paul, a scenic attraction; G8 is the north customs entry and exit port in the north of Macao (Qingmao Port). These eight locations are representative urban functional areas of Macao. In this study, the heavy metal content values in the collected road dust were measured in these eight different locations. Since the research period was only half a year (from July to December 2024), only one sample was collected and analyzed at each location.
Different types of roads were sampled, including urban main roads (G2, G3, G5 and G6), sub-roads (G1 and G7), and industrial roads (G4 and G8). Roads close to factories and construction sites may be affected by heavy metal pollution. Transportation hub roads (G2 and G6) near the border crossing ports with a heavy traffic flow were selected to compare with roads with less traffic G7). The traffic flow information (motorcycles, private cars, buses, taxis, trucks passing by the road where each sample was collected) was recorded during a 10 min interval.

2.2. Collection Procedure

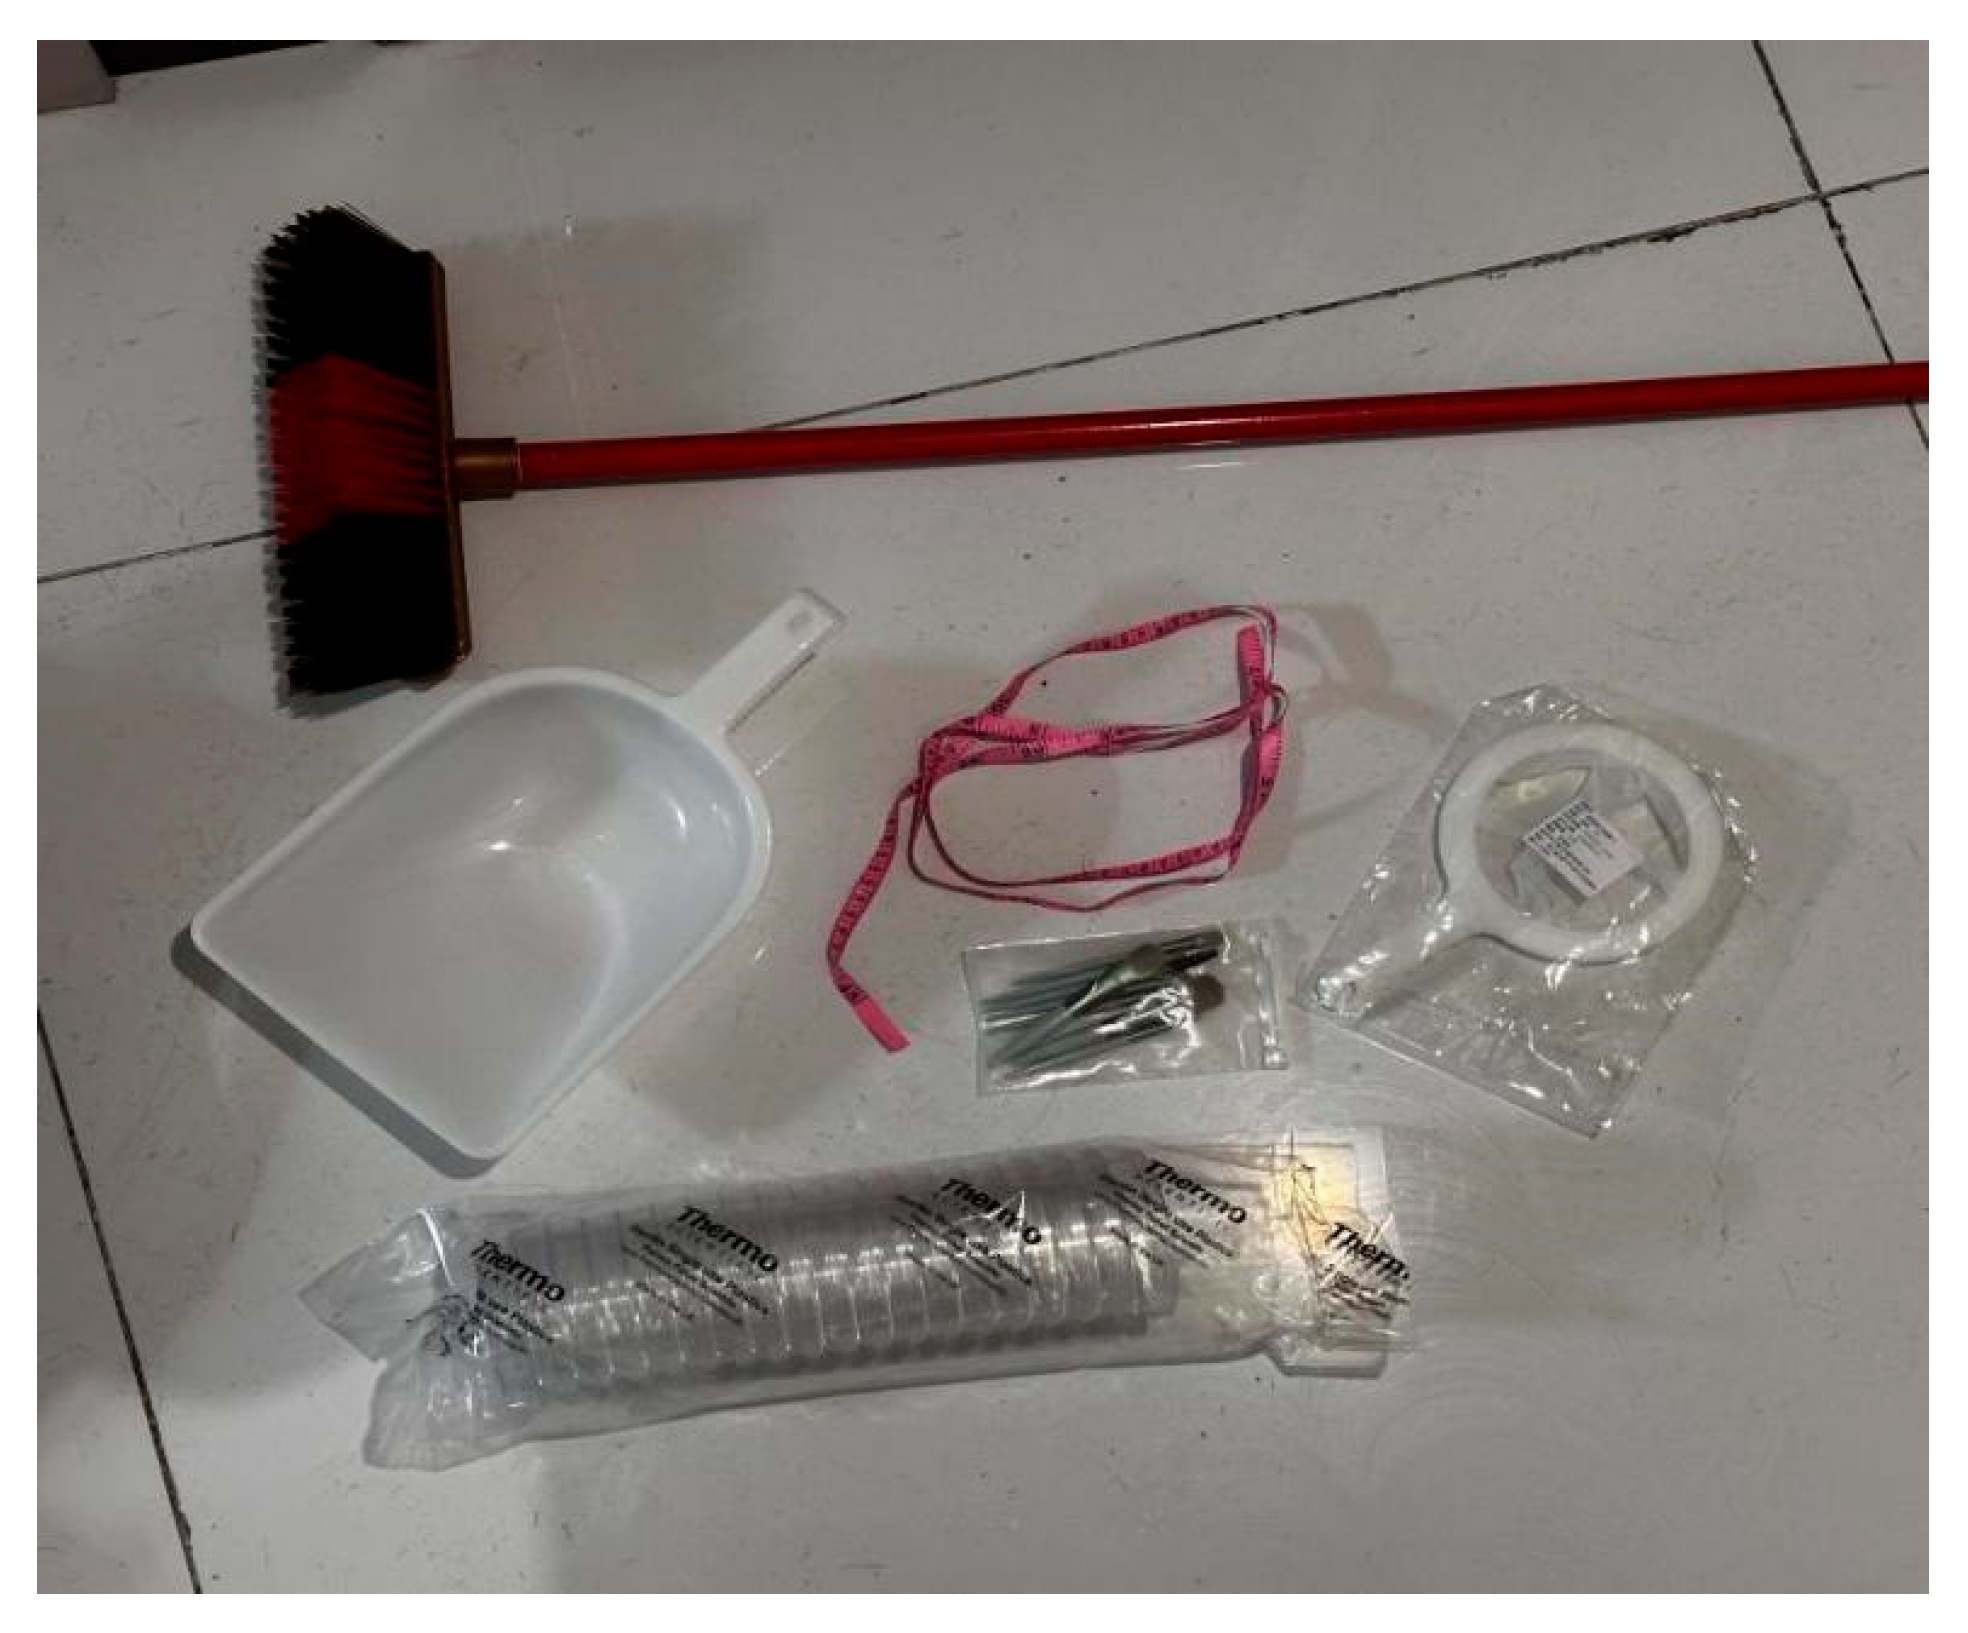
The collection tools for this study include a hard brush, a soft brush, a plastic spatula, a collection dish, a 200-mesh nylon screen, and a ruler, as shown in Figure 2. A 200-mesh screen has 200 openings per inch with a pore size of about 74 microns, commonly used in heavy metal assessments [21]. Metallic equipment was not considered to prevent the adsorption of micro-heavy metals, which could impact measurement accuracy. In addition, the samples were collected when there was no rainfall for more than seven days to ensure representativeness of community exposure scenarios.
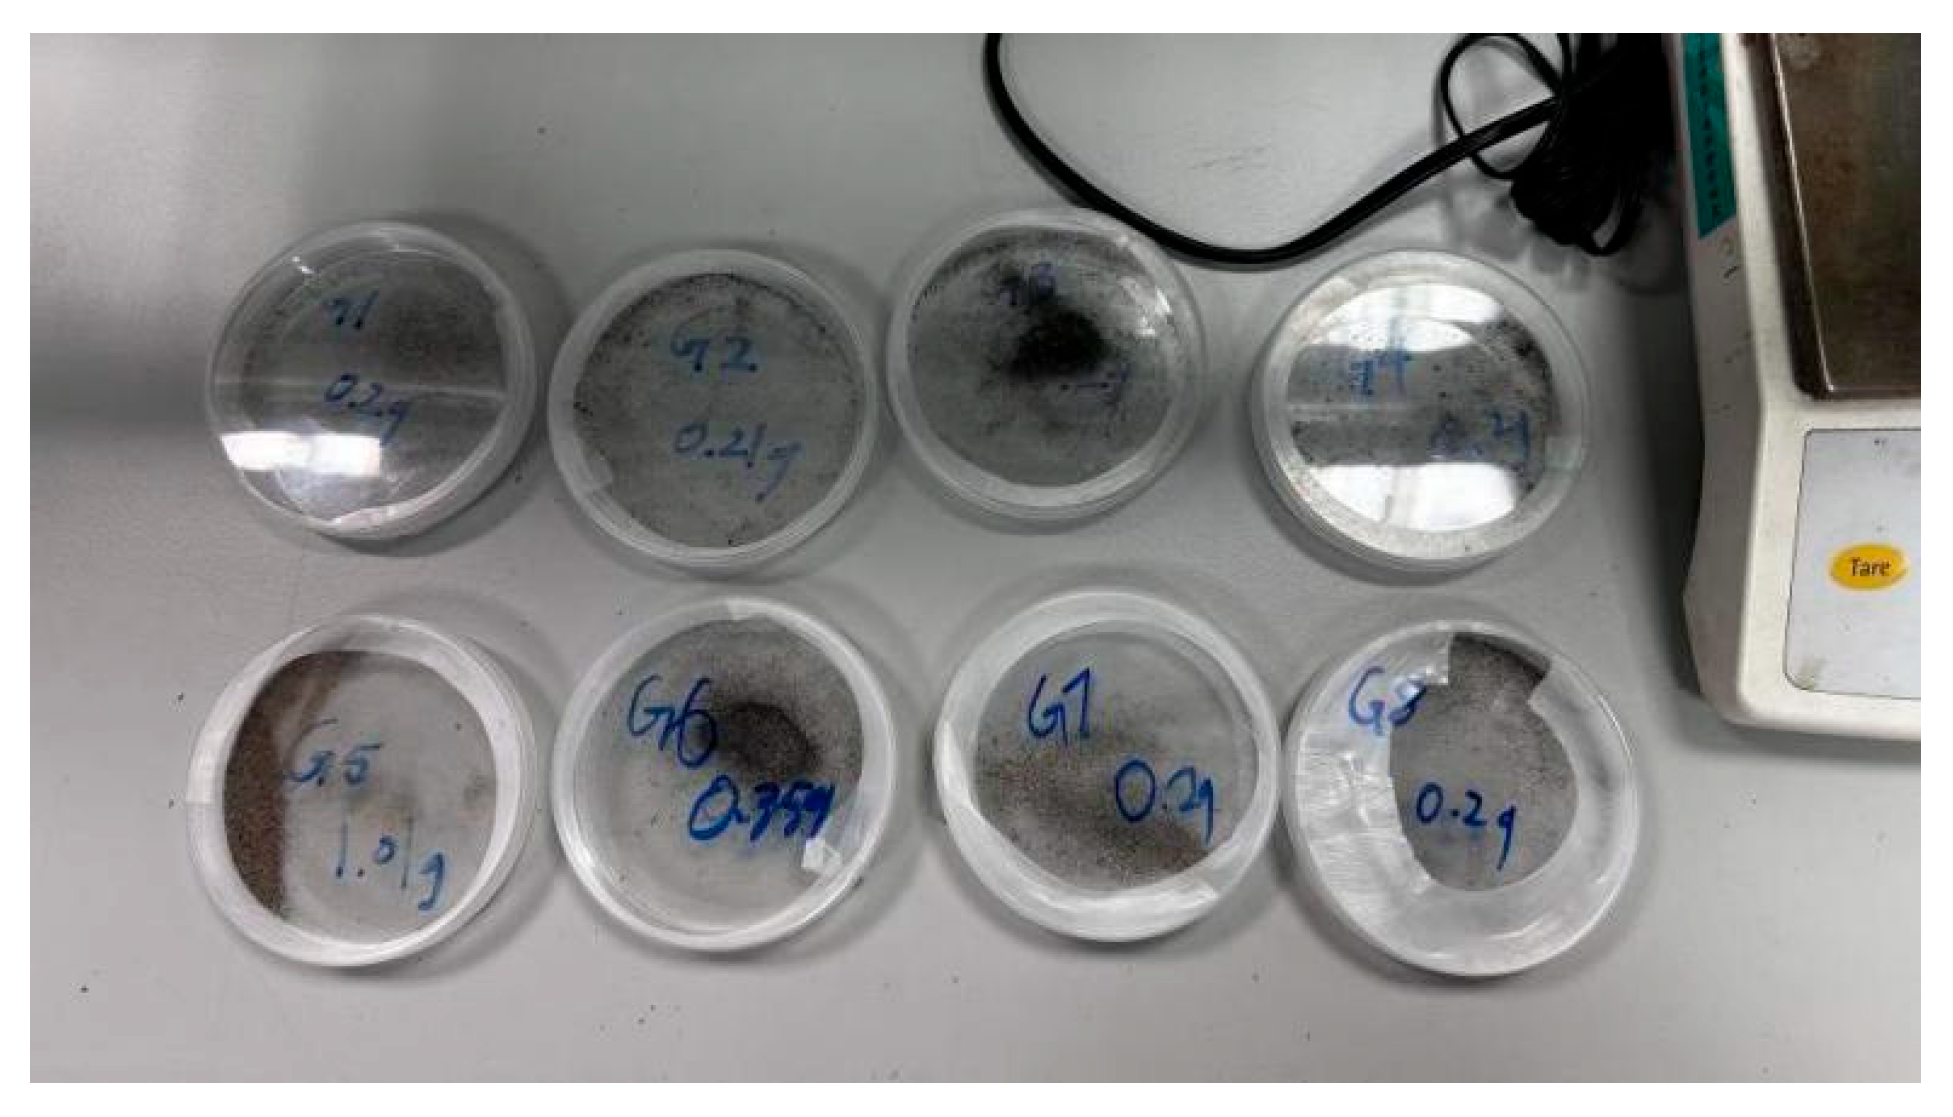
A new collection dish was used each time to hold the road dust. The different collection dishes were pre-weighed, because there is a weight difference for each collection dish. Subsequently, the weight of the collected road dust was determined by subtracting the weight of the collection dish from the total weight. The weight of the dust after screening was at least 0.20 g. Figure 3 shows the different road dust samples after processing.

2.3. Analysis Procedure

To extract heavy metals, the sample was first soaked in 5 mL of ultra-pure water, ensuring that no impurities were introduced. Next, the samples were processed using ultrasonic extraction technology for a duration of 45 min. Through the vibration of sound waves, the generation of tiny bubbles can effectively enhance the extraction efficiency of the target substance in the sample, improving the sensitivity and accuracy of extraction.
After the extraction is complete, the filtration step follows. Filtration using a 0.22-micron filter head removed solid impurities and particles from the sample, ensuring that the liquid sample for subsequent analysis is clear and free of disturbing substances. The filtered filtrate was acidified with concentrated nitric acid (HNO3). This process stabilizes the metal ions in the sample by lowering the pH value, preventing them from settling during storage and analysis.
The volume of each filtrate was then standardized to 5 mL to ensure consistency and repeatability for subsequent analysis. Finally, heavy metals were measured by Inductively Coupled Plasma Mass Spectrometry (ICP-MS). This method of analysis is known for its high sensitivity and high resolution and can accurately determine the concentration of various elements in the sample.
Through the above steps, the experiment ensures the integrity of sample processing and the accuracy of analysis results, providing a reliable basis for subsequent research and application.

2.4. Positive Matrix Factorization (PMF 5.0) Model

The US EPA Positive Matrix Factorization (PMF 5.0) model has been valuable in analyzing environmental pollution, specifically for source attribution and apportionment [16,22]. Using the chemical composition of environmental samples (such as sediments and air particles), PMF 5.0 identifies major sources, quantifies their contribution to each component of the samples, and estimates uncertainties in the source apportionment using bootstrap (BS) and/or displacement (DISP) methods. Traffic, industrial, and natural emissions are commonly identified as air pollution sources.
This study applied the PMF 5.0 and BS method to elementally speciated road dust samples. By providing clear information on pollution sources and components over road dust in Macao, the model helps policymakers develop more effective environmental management and pollution control strategies that promote sustainable development.

2.5. Non-Carcinogenic Health Risk Assessment

Heavy metals (such as cadmium, lead, arsenic, and mercury) can enter the human body through the food chain accumulation (from crop absorption to animal/human intake), direct contact (skin penetration), or inhalation (soil dust), causing acute and chronic health problems. To estimate health risk in Macao upon road dust exposure via three pathways, namely ingestion, inhalation, and dermal contact, the framework of Suvetha et al. [23,24] was followed:
D I n = M × I R × P E F × F × D W × T × 10 6
D I h = M × I h R × F × D P E F × W × T
D d = M × L × A × D A F × F × D W × T × 10 6
DIn = daily dust particles ingestion; DIh = daily dust particles inhalation; Dd = daily dermal absorption; M = metal concentration; IR = ingestion rate (100 mg/day); IhR = inhalation rate (20 m3/day); PEF = particle emission factor (1.36 × 10⁹ m3/kg); L = skin adherence factor (0.07 mg/cm2 day); A = area of skin exposure (5700 cm2); DAF = dermal absorption factor (0.001); F = frequency of exposure (180 day/year); D = duration of exposure (24 years); W = average body weight (70 kg); and T = average exposure time (8760 days).
In order to determine the overall non-cancer toxic risk, the average daily dose value of the specific pathway is divided by a metal-specific reference dose (RfD) to yield the health quotient (HQ) (Equation (4)). Hazard index (HI) is the sum of HQs due to different exposure pathways (Equation (5)). A value of HI ≤ 1 denotes no adverse health risks, while HI > 1 denotes possible occurrence of adverse health risks.
H Q = D R F d
H I = H Q   ( D I n , D I h , D d )

2.6. Carcinogenic Risk Assessment

For carcinogenic risk upon road dust exposure in Macao, the calculation formula is as follows [23,24]:
L A D D = C × E F A T × P E F × ( R   i n h   c h i l d   ×   E D   c h i l d B W   c h i l d + R   i n h   a d u l t   ×   E D   a d u l t B W   a d u l t )
C a r c i n o g e n i c   R i s k   ( C R ) = L A D D × S F
C R t = C R
In the formula, C refers to the heavy metal concentrations (average of the 8 sampling sites), EF refers to exposure frequency (180 day/year), AT refers to average exposure time (25,530 day), PEF refers to particle emission factor (1.36 × 10⁹ m3/kg), R inh child refers to rate of inhalation for child (20 m3/day), R inh adult refers to rate of inhalation for adult (7.6 m3/day), ED child refers to exposure duration for child (6 year), ED adult refers to exposure duration for adult (24 year), BW child refers to average body weight of child (15 kg), BW adult refers to average body weight of adult (70 kg), and SF refers metal-specific cancer slope factor [24].
LADD stands for carcinogenic constituents via inhalation. CR is the incremental probability of a person developing cancer over a lifetime. For example, a CR of 10−5 suggests a possibility of 1 in 100,000 individuals developing cancer.

3. Results and Discussion

3.1. Characteristics of Sampling Sites

Table 1 shows a summary of data collected from G1 to G8 sampling sites. Among them, air temperature and relative humidity are obtained from the Macao Meteorological and Geophysical Bureau (SMG). The table shows the environmental characteristics and the number of vehicles by type during sampling campaigns, supporting the analysis of the relationship between traffic patterns and environmental factors.
The sample weights range from 0.20 g to 0.37 g, reflecting different sample collection locations and pavement materials. Pavement materials mainly include asphalt, concrete, and gravel, while the choice of these materials depends on factors such as traffic flow, climatic conditions, and maintenance costs. Asphalt is the most common pavement material due to its durability and adaptability, making it widely used in urban roads.
In terms of the type of vehicles, it shows that the number of motorcycles varies significantly, ranging from 0 to 56. The frequency of motorcycles can be affected by a variety of factors, such as traffic flow and weather conditions, in different environments or time periods. The relatively high number of private cars, up to 121, indicates that in some areas, private cars are the main mode of transport, depending on urban planning and accessibility of public transport. In contrast, the number of taxis, buses, and trucks was relatively low, ranging from 0 to 46, 0 to 17, and 0 to 18, respectively.
The air temperature data shows that the temperature range of each sample is between 27.5 °C and 30.5 °C, which may affect the use of vehicles. For example, higher temperatures may lead to a greater preference for air-conditioned private cars, while the use of motorcycles and public transport may increase in cooler weather. The relative humidity level was between 45 and 80%. Changes in humidity can affect road surface conditions and subsequently the safety and efficiency of vehicles. A high-humidity environment can lead to slippery roads, increasing the risk of traffic accidents.

3.2. Heavy Metal Concentrations in Road Dust

Table 2 summarizes heavy metal components in micrograms per gram (µg/g) after performing chemical analysis on G1–G8 samples. With respect to sodium (Na) content, the G5 sample had the highest content, reaching 617.53 µg/g, while the G6 sample had the lowest content, only 114.56 µg/g. For magnesium (Mg), G5 also peaked, reaching 75.27 µg/g, showing its enrichment in this sample. The G1 sample had the lowest Mg content at 15.49 µg/g. The aluminum (Al) content is the highest for the G5 sample, at 55.22 µg/g, while the lowest is for the G6 sample, at 0.96 µg/g. The G2 sample had the highest silicon (Si) content of 99.83 µg/g, while the G7 sample had the lowest Si content of 12.27 µg/g. The concentration of potassium (K) is highest in G3, at 167.2 µg/g, while the lowest is in G6, at 34.38 µg/g. The concentration of calcium (Ca) is the highest in the G4 sample at 528.45 µg/g, and the lowest in the G7 sample at 226.74 µg/g.
The nickel (Ni) content in the G8 sample is highest at 0.417 µg/g, while the lowest is in G5 at 0.088 µg/g. Arsenic (As) concentrations are highest in G5 at 0.05 µg/g, and the lowest in G2 and G6 with 0.01 µg/g. The concentration of copper (Cu) is the highest in G4 with 1.01 µg/g, while it is the lowest in G6 with 0.35 µg/g. The concentration of lead (Pb) was the highest at G5 with 0.077 µg/g, and the lowest at G6 with 0.003 µg/g. The concentration of Vanadium (V) was the highest at G5 with 0.057 µg/g, while it was the lowest at G6 with 0.006 µg/g. The zinc (Zn) content was the highest at G8 with 4.04 µg/g, while it was the lowest at G6 with 0.66 µg/g. The manganese (Mn) content was the highest at G3 with 0.906 µg/g, while it was the lowest at G1 with 0.059 µg/g. The iron (Fe) content was the highest at G5 with 38.23 µg/g, while it was the lowest at G6 with 0.87 µg/g.
The analysis of road dust showed a high loading of Zn that could be identified as brake and tire wear, as Zn is a major component in tire manufacturing, while the high loadings of manganese (Mn) from fuel additives might be identified as tailpipe emissions, and the very high loading of sodium (Na) would likely be identified as road salt. The differences in the content of metal elements in each road dust sample reflect the complexity of its geological background, mineral composition, and environmental impact. These data provide an important basis for subsequent source assessment.

3.3. Result of PMF 5.0 Model

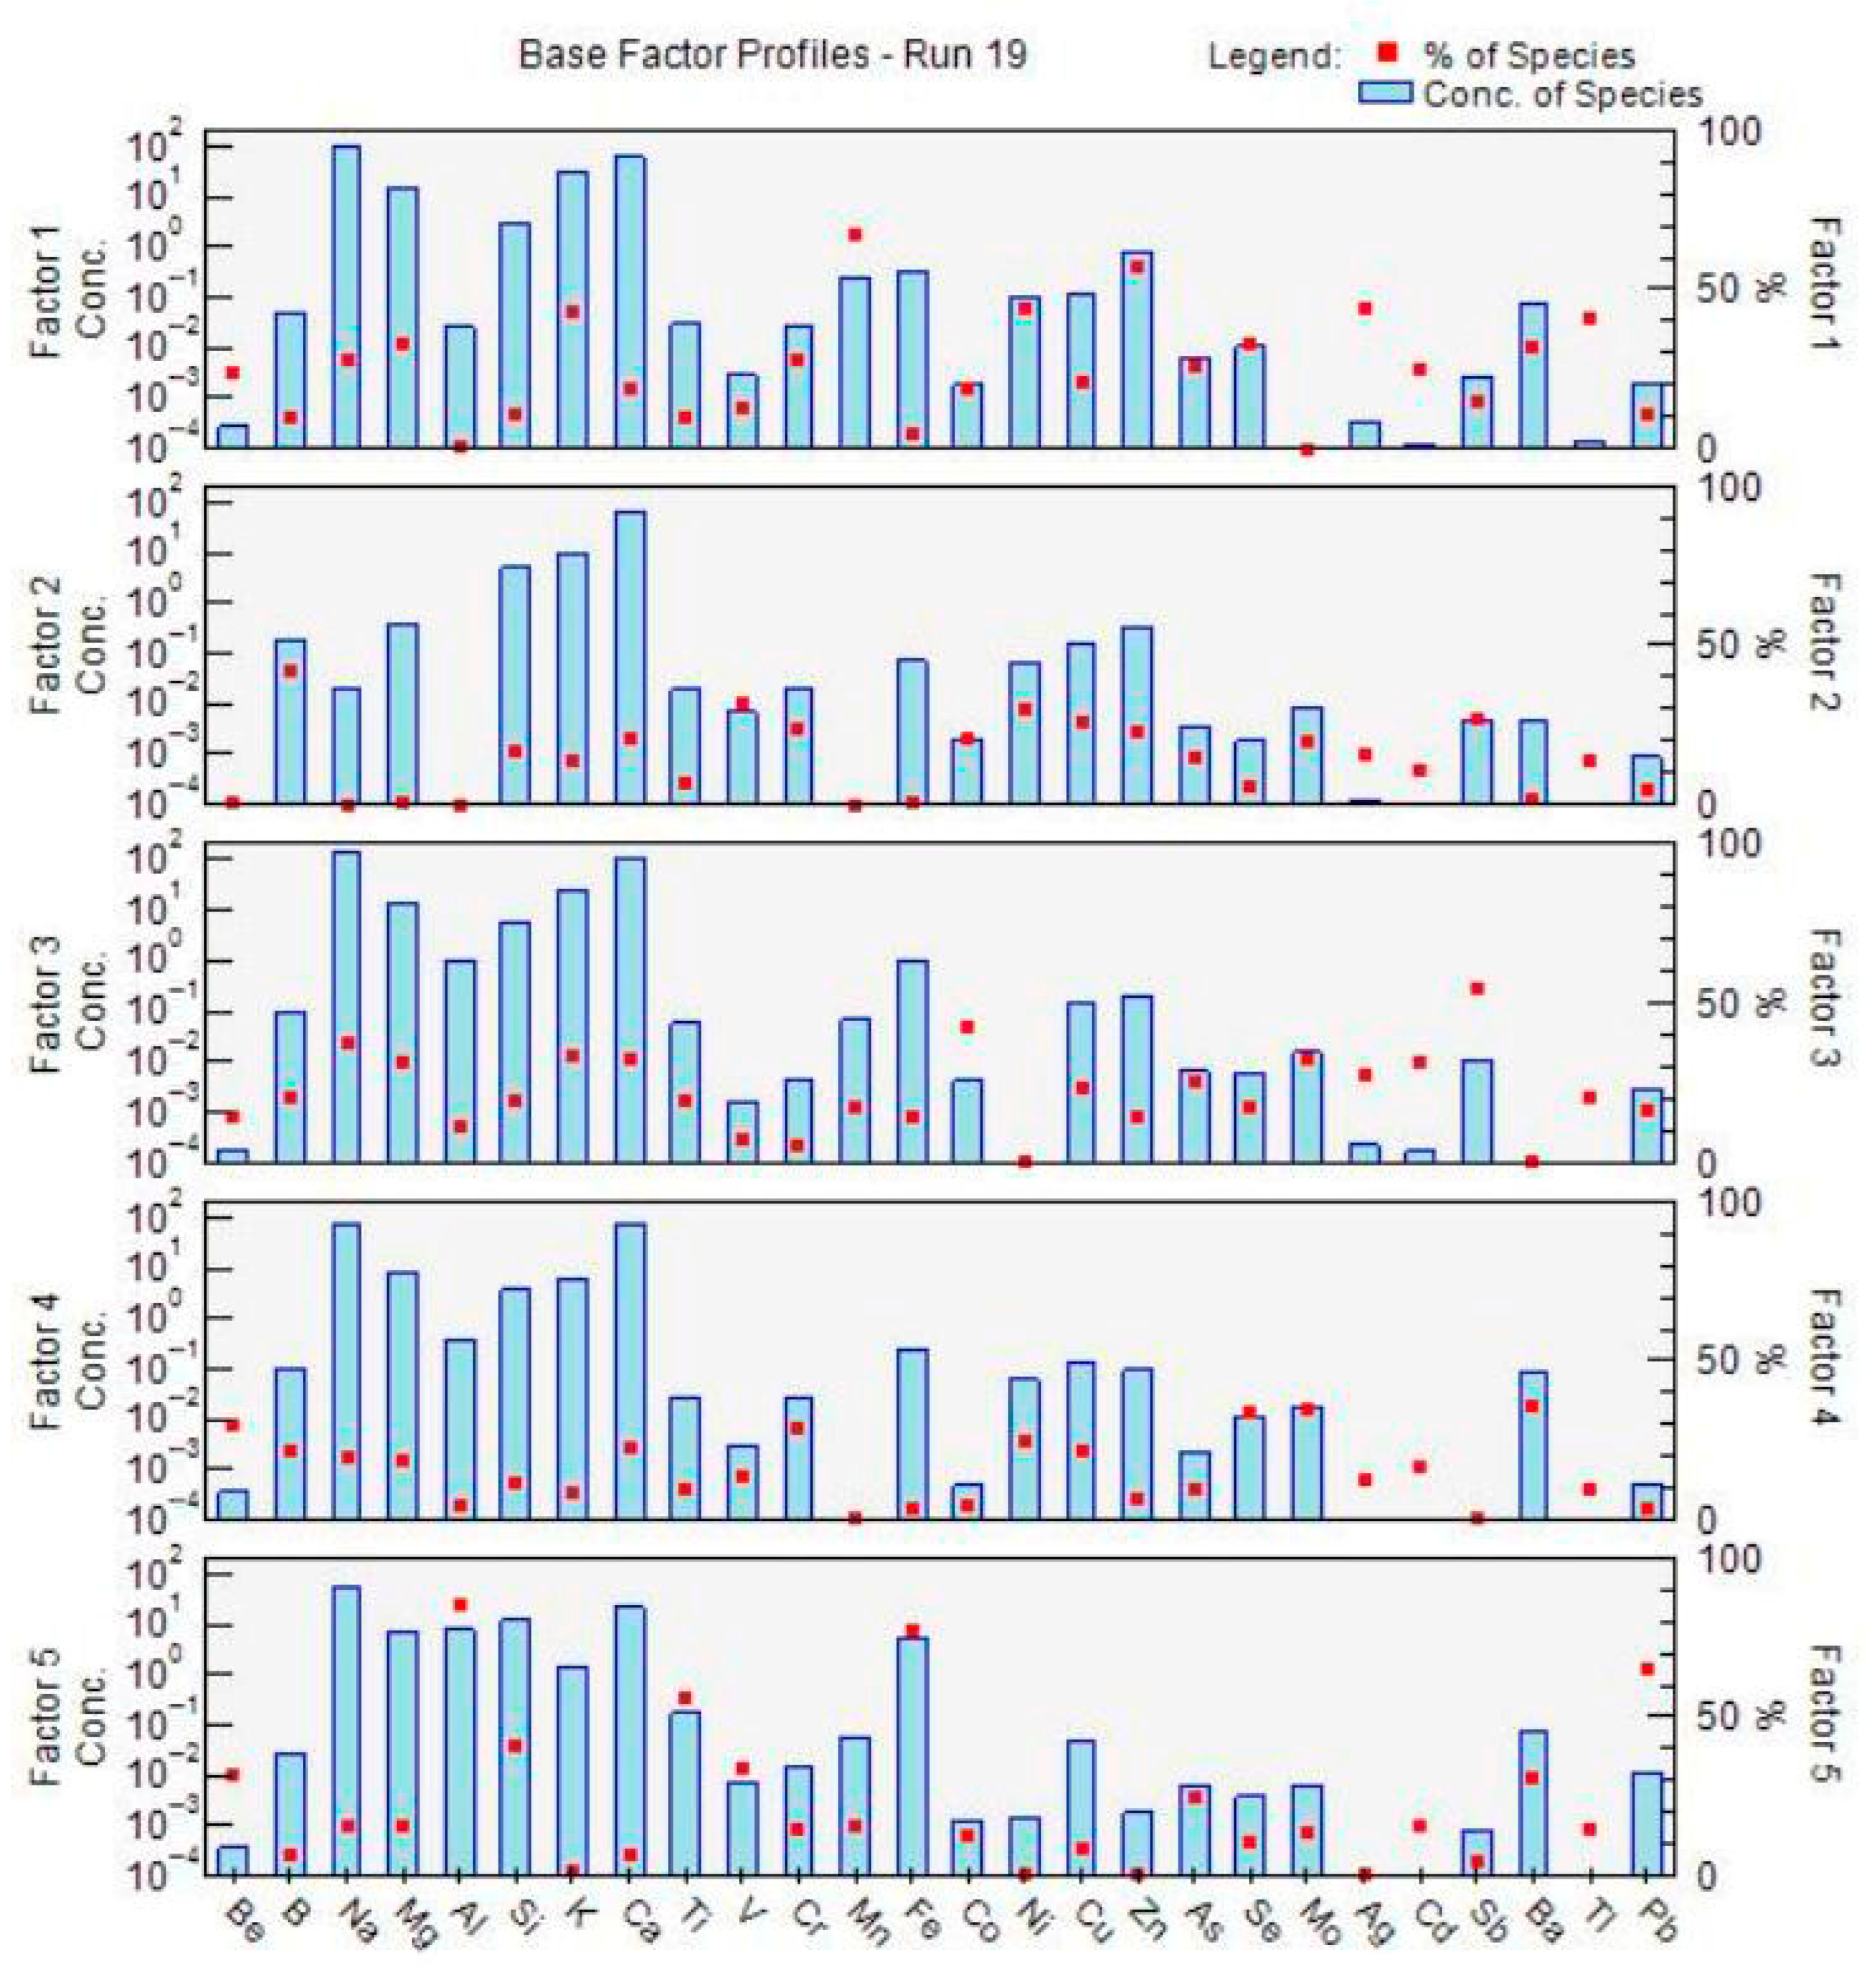
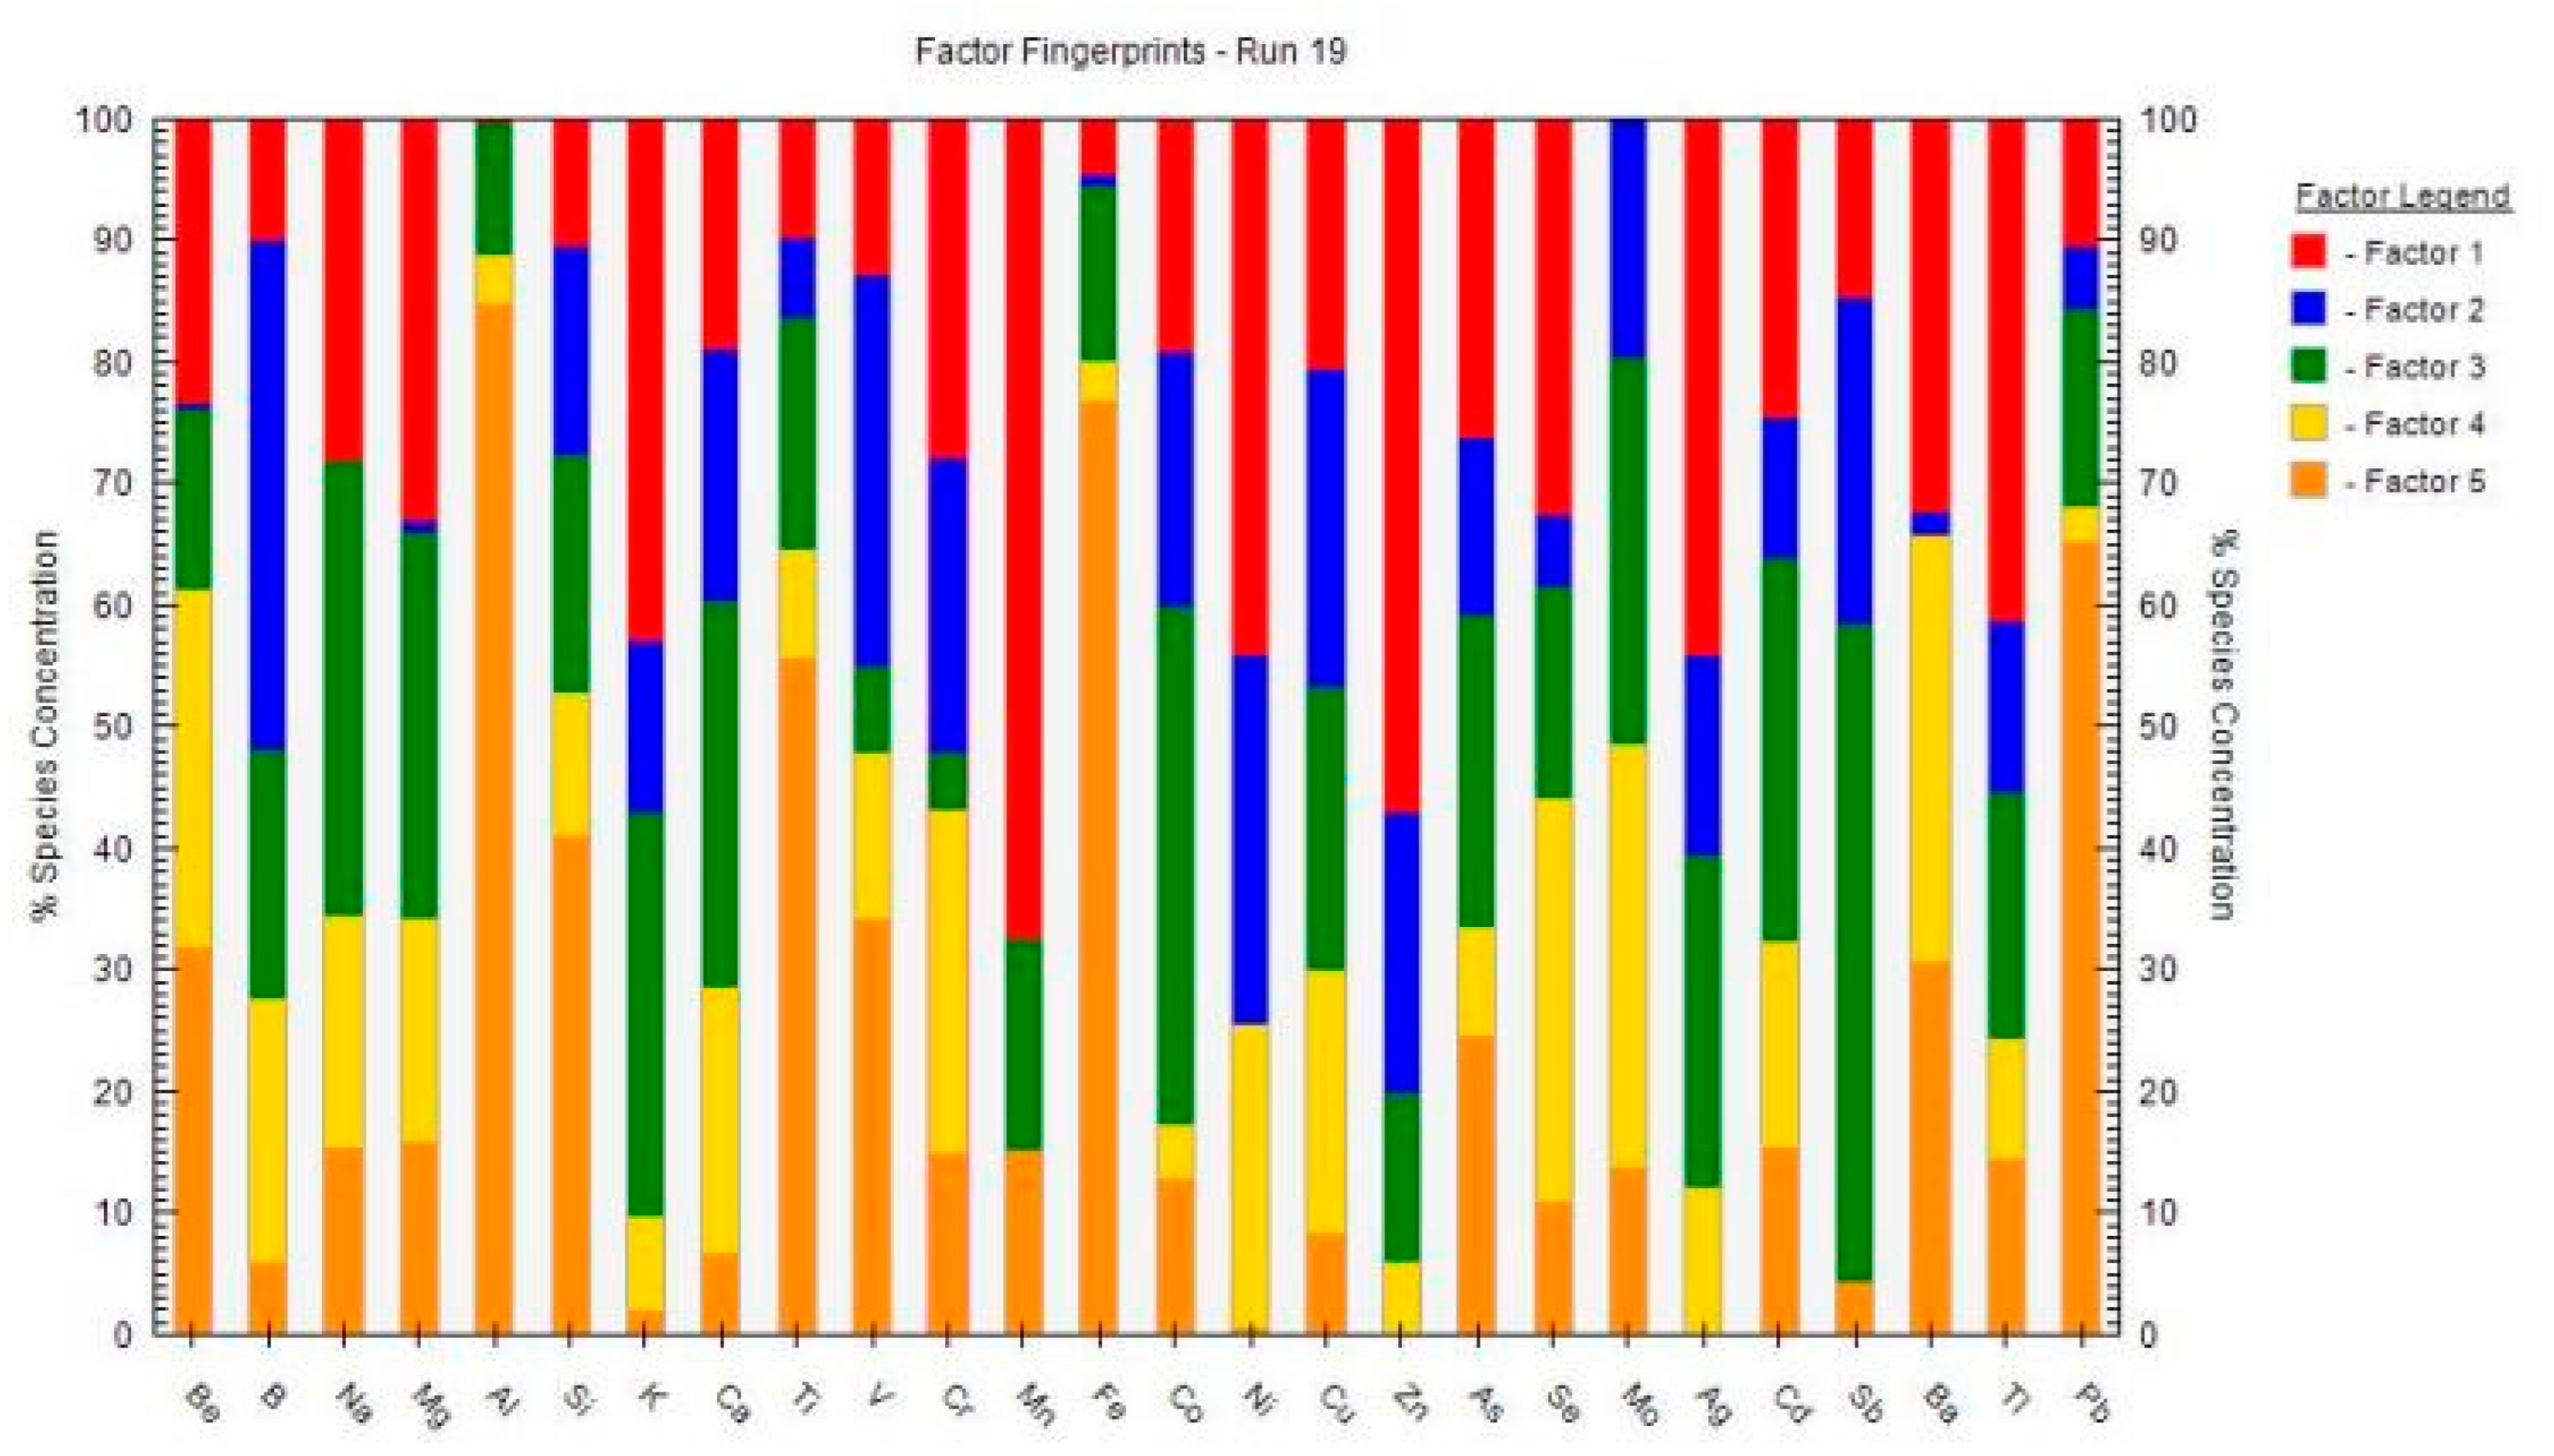
As shown in Figure 4, in factor 1, the loadings of Mn and Zn are the largest, accounting for 67.37% and 57.01%, respectively. Mn mainly comes from brake pad wear (manganese alloy materials), vehicle exhaust emissions, and waste incineration, while Zn mainly comes from tire wear (containing zinc oxide), brake pad wear, and waste incineration [25,26,27,28]. The passage of cross-border vehicles (such as cross-border private cars, buses, and trucks) at observation point G5 (Sai Van Bridge and other cross-border transportation facilities) has a heavy traffic load. The pollutants from their exhaust emissions and tire wear are transported and diffused to the local road network in Macao.
In factor 2, the load of B is the largest, with a contribution rate of 41.82%. Boron is likely linked to the industrial processes and coal combustion from the power plants, which will enter the atmosphere as dust and be transported by wind. Although Macao is a highly urbanized area, it is surrounded by factories, industries, and coal power plants from the Greater Bay Area (GBA), and the dust in the form of PM10 is a transboundary pollutant, which may travel up to 1000 km from its source [29,30,31].
In factor 3, the loadings of Sb and Co are the largest, with contribution rates of 54.11% and 42.60%, respectively. These two metal elements are widely used in the traffic emissions from brake pads, fossil fuel combustion from coal power plants, and waste incinerators. Due to the high density of vehicles at transportation hubs such as the Inner Harbor and Amizade Bridge in Macao, frequent acceleration and braking during the driving cycle may lead to increased wear of the vehicle surface coating. Studies have shown that the content of heavy metals in road dust near traffic arteries is significantly higher than in other areas, partly due to the physical degradation of vehicle materials. The coal power plants in the surrounding area in the GBA and the waste incinerator in Macao are likely to be contributors of the heavy metal [32,33,34,35].
In factor 4, the loading of Ba, Mo, and Se is the greatest, with Ba having the highest contribution rate of 35.07%. These three elements are likely related to the traffic emissions from brake pads, industrial processes, and fossil fuel combustion. Observation points G1, G2, and G8 are the Outer Harbor and the customs entry and exit ports in the south (Hengqin Port) and north of Macao (Qingmao Port) [36,37,38].
In factor 5, the loadings of Al, Fe, and Pb are relatively large, with contribution rates of 84.70%, 76.71%, and 65.32%, respectively. These three elements are likely related to coal combustion, vehicle emissions, and waste incineration. Observation point G4 is near the Macao Industrial Zone, where heavy industrial facilities (such as waste treatment and incinerator facilities) may emit dust containing heavy metals. These particles enter road dust through atmospheric deposition [36,37,38].

3.4. Result of Health Risk Assessment

Table 3 presents the health risk assessment results of eight heavy metals to Macao residents based on an average of 8 sampling sites. Cr, Cu, Zn, Cd, and Pb show a possibility of adverse health risks through ingestion, inhalation and dermal contact, while the risks of Be, Ni, and As cannot be determined due to the lack of a suitable RfD value for inhalation and dermal contact.
The cancer risk is calculated for the metals Cd, Pb, and Cr (Table 4) that pose a higher risk of causing cancer in humans. The overall cancer risk (CR) was calculated to be 6.91 × 10⁻¹⁰, which is way below the acceptable cancer risk of 1.0 × 10⁻⁶ to 1.0 × 10⁻⁴. The CR value for Macau indicates that presently there is no threat of cancer risks from road dust.

3.5. Discussion

Table 5 shows that there is a strong correlation between the total vehicle counts and the content of heavy metals such as Al, Si, As, V, and Fe (r = 0.50 to 0.82), which are heavy metals commonly found in traffic emissions and industrial sources.
In the analysis of important metal concentrations, the concentrations of sodium (Na) and magnesium (Mg) varied significantly. The concentrations of heavy metals such as arsenic (As) and lead (Pb) were relatively low, indicating that the degree of heavy metal pollution in the sample area was mild. The health risk assessment showed there is no cancer risk from heavy metals and the possible occurrence of adverse non-cancer health risks in Macao [39,40,41,42].
A comparison with the nearby region of Hong Kong revealed that many of the heavy metal contents originate from anthropogenic sources such as vehicle exhaust, marine transportation, and industrial activities, which is also aligned with the findings of this study [43,44,45,46].
This situation suggests that in environmental planning and management, it is necessary to strengthen the monitoring and control of heavy metal pollution. The study recommends that governments take measures to reduce traffic emissions and industrial pollution to reduce the concentration of heavy metals in the environment, thereby protecting the health of vulnerable populations [47,48].

4. Conclusions

This study analyzed the content of heavy metals in road dust from different locations in Macao, revealing the current situation of heavy metal pollution and its potential threat to human health. The preliminary results of this work show that heavy metals primarily originated from human activities such as transportation emissions and industrial activities, causing a degradation in air quality [49,50]. The sampling weight and environmental characteristics have a significant impact on the frequency of vehicle usage, especially the frequency of motorcycle and private car usage, which is closely related to traffic flow and climatic conditions.
The concentration differences in important metal elements reflect the complexity of sample sources, especially the changes in sodium (Na), magnesium (Mg), aluminum (Al), and zinc (Zn) elements, revealing the pollution characteristics of different areas [51,52]. The health risk assessment results showed that there is a non-carcinogenic risk through ingestion, inhalation, and dermal exposure, but no carcinogenic risks from heavy metals. The use of water trucks to clean the road surfaces may effectively remove the suspended road dust on the road as a short-term mitigation strategy, while a regional cooperation in the GBA to reduce the emission of heavy metals will be the long-term strategy to reduce road dust and improve air quality for a double-win.
The health risk assessment indicates that long-term exposure to heavy metal pollution may pose risks to human health, especially among children and the elderly. High concentrations of heavy metals are associated with respiratory diseases and neurological damage, highlighting the importance of controlling and monitoring heavy metal pollution.
The transition to electric vehicles from traditional fossil-fuel-powered vehicles may significantly reduce the emission of heavy metals and improve the ambient air quality [53,54]. Nevertheless, limitations of this work include the limited sample size and the duration of this study. Future studies will consider increasing the sampling locations and extending the sampling durations, and also include more exposure pathways of heavy metals.

Author Contributions

Conceptualization, T.M.T.L. and Y.L.; methodology, A.H.M. and S.W.; software, T.M.T.L. and Y.L.; validation, W.H.C., A.H.M. and L.-W.A.C.; formal analysis, T.M.T.L. and Y.L.; investigation, W.Y. and Y.L.; resources, T.M.T.L., W.H.C. and S.W.; data curation, T.M.T.L. and Y.L.; writing—original draft preparation, T.M.T.L., W.Y. and Y.L.; writing—review and editing, T.M.T.L., Y.L. and S.W.; visualization, Y.L.; supervision, T.M.T.L. and S.W.; project administration, W.H.C. and L.-W.A.C.; funding acquisition, T.M.T.L., W.H.C., L.-W.A.C. and S.W. All authors have read and agreed to the published version of the manuscript.

Funding

This research was funded by INTI International University, grant number 002, and the APC was funded by INTI and UNLV.

Institutional Review Board Statement

Not applicable.

Informed Consent Statement

Not applicable.

Data Availability Statement

Data are available on request due to restrictions.

Acknowledgments

This work was supported by Xiamen University for the chemical analysis of the samples.

Conflicts of Interest

The authors declare no conflicts of interest.

References

  1. Hao, Q.; Lu, X.; Yu, B.; Yang, Y.; Lei, K.; Pan, H.; Gao, Y.; Liu, P.; Wang, Z. Sources and Probabilistic Ecological-Health Risks of Heavy Metals in Road Dust from Urban Areas in a Typical Industrial City. Urban Clim. 2023, 52, 101730. [Google Scholar] [CrossRef]
  2. Lahiri, D.; Ray, I.; Ray, R.; Chanakya, I.V.S.; Tarique, M.; Misra, S.; Rahaman, W.; Tiwari, M.; Wang, X.; Das, R. Source Apportionment and Emission Projections of Heavy Metals from Traffic Sources in India: Insights from Elemental and Pb Isotopic Compositions. J. Hazard. Mater. 2024, 480, 135810. [Google Scholar] [CrossRef]
  3. Heidari, M.; Darijani, T.; Alipour, V. Heavy Metal Pollution of Road Dust in a City and Its Highly Polluted Suburb; Quantitative Source Apportionment and Source-Specific Ecological and Health Risk Assessment. Chemosphere 2021, 273, 129656. [Google Scholar] [CrossRef]
  4. Achakulwisut, P.; Anenberg, S.C.; Neumann, J.E.; Penn, S.L.; Weiss, N.; Crimmins, A.; Fann, N.; Martinich, J.; Roman, H.; Mickley, L.J. Effects of Increasing Aridity on Ambient Dust and Public Health in the U.S. Southwest Under Climate Change. Geohealth 2019, 3, 127–144. [Google Scholar] [CrossRef]
  5. Casotti Rienda, I.; Alves, C.A. Road Dust Resuspension: A Review. Atmos. Res. 2021, 261, 105740. [Google Scholar] [CrossRef]
  6. Du, X.; Zhu, Y.; Han, Q.; Yu, Z. The Influence of Traffic Density on Heavy Metals Distribution in Urban Road Runoff in Beijing, China. Environ. Sci. Pollut. Res. 2019, 26, 886–895. [Google Scholar] [CrossRef] [PubMed]
  7. Duong, T.T.T.; Lee, B.-K. Determining Contamination Level of Heavy Metals in Road Dust from Busy Traffic Areas with Different Characteristics. J. Environ. Manag. 2011, 92, 554–562. [Google Scholar] [CrossRef] [PubMed]
  8. El-Sharkawy, M.; Alotaibi, M.O.; Li, J.; Du, D.; Mahmoud, E. Heavy Metal Pollution in Coastal Environments: Ecological Implications and Management Strategies: A Review. Sustainability 2025, 17, 701. [Google Scholar] [CrossRef]
  9. Farahani, V.J.; Soleimanian, E.; Pirhadi, M.; Sioutas, C. Long-Term Trends in Concentrations and Sources of PM2.5–Bound Metals and Elements in Central Los Angeles. Atmos. Environ. 2021, 253, 118361. [Google Scholar] [CrossRef]
  10. Gietl, J.K.; Lawrence, R.; Thorpe, A.J.; Harrison, R.M. Identification of Brake Wear Particles and Derivation of a Quantitative Tracer for Brake Dust at a Major Road. Atmos. Environ. 2010, 44, 141–146. [Google Scholar] [CrossRef]
  11. He, C.-T.; Zheng, X.-B.; Yan, X.; Zheng, J.; Wang, M.-H.; Tan, X.; Qiao, L.; Chen, S.-J.; Yang, Z.-Y.; Mai, B.-X. Organic Contaminants and Heavy Metals in Indoor Dust from E-Waste Recycling, Rural, and Urban Areas in South China: Spatial Characteristics and Implications for Human Exposure. Ecotoxicology 2017, 140, 109–115. [Google Scholar] [CrossRef]
  12. Hong, N.; Guan, Y.; Yang, B.; Zhong, J.; Zhu, P.; Ok, Y.S.; Hou, D.; Tsang, D.C.W.; Guan, Y.; Liu, A. Quantitative Source Tracking of Heavy Metals Contained in Urban Road Deposited Sediments. J. Hazard. Mater. 2020, 393, 122362. [Google Scholar] [CrossRef]
  13. Hong, N.; Yang, B.; Tsang, D.C.W.; Liu, A. Comparison of Pollutant Source Tracking Approaches: Heavy Metals Deposited on Urban Road Surfaces as a Case Study. Environ. Pollut. 2020, 266, 115253. [Google Scholar] [CrossRef] [PubMed]
  14. Huang, C.; Zhang, L.; Meng, J.; Yu, Y.; Qi, J.; Shen, P.; Li, X.; Ding, P.; Chen, M.; Hu, G. Characteristics, Source Apportionment and Health Risk Assessment of Heavy Metals in Urban Road Dust of the Pearl River Delta, South China. Ecotoxicology 2022, 236, 113490. [Google Scholar] [CrossRef]
  15. Roganović, J.; Relić, D.; Zarić, M.; Aničić Urošević, M.; Zinicovscaia, I.; Ilijević, K.; Zarić, N.M. Rare Earth Elements and Health Risk Assessment of Road Dust from the Vicinity of Coal Fired Thermal Power Plants. Chemosphere 2025, 377, 144329. [Google Scholar] [CrossRef] [PubMed]
  16. Men, C.; Liu, R.; Xu, L.; Wang, Q.; Guo, L.; Miao, Y.; Shen, Z. Source-Specific Ecological Risk Analysis and Critical Source Identification of Heavy Metals in Road Dust in Beijing, China. J. Hazard. Mater. 2020, 388, 121763. [Google Scholar] [CrossRef] [PubMed]
  17. Khademi, H.; Gabarrón, M.; Abbaspour, A.; Martínez-Martínez, S.; Faz, A.; Acosta, J.A. Environmental Impact Assessment of Industrial Activities on Heavy Metals Distribution in Street Dust and Soil. Chemosphere 2019, 217, 695–705. [Google Scholar] [CrossRef]
  18. Li, P.; Lin, C.; Cheng, H.; Duan, X.; Lei, K. Contamination and Health Risks of Soil Heavy Metals around a Lead/Zinc Smelter in Southwestern China. Ecotoxicology 2015, 113, 391–399. [Google Scholar] [CrossRef]
  19. Luo, S.; Chen, R.; Han, J.; Zhang, W.; Petropoulos, E.; Liu, Y.; Feng, Y. Urban Green Space Area Mitigates the Accumulation of Heavy Metals in Urban Soils. Chemosphere 2024, 352, 141266. [Google Scholar] [CrossRef]
  20. Mahmoud, N.; Al-Shahwani, D.; Al-Thani, H.; Isaifan, R.J. Risk Assessment of the Impact of Heavy Metals in Urban Traffic Dust on Human Health. Atmosphere 2023, 14, 1049. [Google Scholar] [CrossRef]
  21. Rahman, M.S.; Sarker, M.A.M.; Hasan, M.; Akhter, S.; Jolly, Y.N.; Choudhury, T.R.; Hussain, K.M.A.; Rahman, S.M.M.; Islam, R.; Begum, B.A. Incorporating Source Apportionment and Health Risk Assessment of Heavy Metals from Indoor Dust of an Industrial Area in Dhaka, Bangladesh. Environ. Surf. Interfaces 2024, 2, 26–40. [Google Scholar] [CrossRef]
  22. Nagajyoti, P.C.; Lee, K.D.; Sreekanth, T.V.M. Heavy Metals, Occurrence and Toxicity for Plants: A Review. Environ. Chem. Lett. 2010, 8, 199–216. [Google Scholar] [CrossRef]
  23. U.S. Environmental Protection Agency. Soil Screening Guidance: Technical Background Document; U.S. Environmental Protection Agency: Washington, DC, USA, 1996.
  24. Suvetha, M.; Charles, P.E.; Vinothkannan, A.; Rajaram, R.; Paray, B.A.; Ali, S. Are we at risk because of road dust? An ecological and health risk assessment of heavy metals in a rapidly growing city in South India. Environ. Adv. 2022, 7, 100165. [Google Scholar] [CrossRef]
  25. Okechukwu Ohiagu, F.; Chikezie, P.C.; Ahaneku, C.C.; Chikezie, C.M. Human Exposure to Heavy Metals: Toxicity Mechanisms and Health Implications. Mater. Sci. Eng. Int. J. 2022, 6, 78–87. [Google Scholar] [CrossRef]
  26. Pan, H.; Lu, X.; Lei, K. A Comprehensive Analysis of Heavy Metals in Urban Road Dust of Xi’an, China: Contamination, Source Apportionment and Spatial Distribution. Sci. Total Environ. 2017, 609, 1361–1369. [Google Scholar] [CrossRef] [PubMed]
  27. Qadeer, A.; Saqib, Z.A.; Ajmal, Z.; Xing, C.; Khan Khalil, S.; Usman, M.; Huang, Y.; Bashir, S.; Ahmad, Z.; Ahmed, S.; et al. Concentrations, Pollution Indices and Health Risk Assessment of Heavy Metals in Road Dust from Two Urbanized Cities of Pakistan: Comparing Two Sampling Methods for Heavy Metals Concentration. Sustain. Cities Soc. 2020, 53, 101959. [Google Scholar] [CrossRef]
  28. Qi, M.; Wu, Y.; Zhang, S.; Li, G.; An, T. Pollution Profiles, Source Identification and Health Risk Assessment of Heavy Metals in Soil near a Non-Ferrous Metal Smelting Plant. Int. J. Environ. Res. Public Health 2023, 20, 1004. [Google Scholar] [CrossRef] [PubMed]
  29. Rabha, S.; Dhaneesh, K.V. The Impact of Heavy Metal Accumulation on Agricultural Soils and Its Mitigation. Uttar Pradesh J. Zool. 2024, 45, 77–89. [Google Scholar] [CrossRef]
  30. Rahman, Z.; Singh, V.P. The Relative Impact of Toxic Heavy Metals (THMs) (Arsenic (As), Cadmium (Cd), Chromium (Cr)(VI), Mercury (Hg), and Lead (Pb)) on the Total Environment: An Overview. Environ. Monit. Assess. 2019, 191, 419. [Google Scholar] [CrossRef]
  31. Song, H.; Li, J.; Li, L.; Dong, J.; Hou, W.; Yang, R.; Zhang, S.; Zu, S.; Ma, P.; Zhao, W. Heavy Metal Pollution Characteristics and Source Analysis in the Dust Fall on Buildings of Different Heights. Int. J. Environ. Res. Public Health 2022, 19, 11376. [Google Scholar] [CrossRef]
  32. Yang, J.; Zhao, Y.; Ruan, X.; Zhang, G. Anthropogenic Contribution and Migration of Soil Heavy Metals in the Vicinity of Typical Highways. Agronomy 2023, 13, 303. [Google Scholar] [CrossRef]
  33. Zhao, L.; Hu, G.; Yan, Y.; Yu, R.; Cui, J.; Wang, X.; Yan, Y. Source Apportionment of Heavy Metals in Urban Road Dust in a Continental City of Eastern China: Using Pb and Sr Isotopes Combined with Multivariate Statistical Analysis. Atmos. Environ. 2019, 201, 201–211. [Google Scholar] [CrossRef]
  34. Lei, T.M.T.; Cai, J.; Cheng, W.-H.; Kurniawan, T.A.; Molla, A.H.; Mohd Nadzir, M.S.; Kong, S.S.-K.; Chen, L.-W.A. Application of Deep Learning Techniques for Air Quality Prediction: A Case Study in Macau. Processes 2025, 13, 1507. [Google Scholar] [CrossRef]
  35. Khan, M.M.H.; Kurniawan, T.A.; Chandra, I.; Lei, T.M.T. Modeling PM10 Emissions in Quarry and Mining Operations: Insights from AERMOD Applications in Malaysia. Atmosphere 2025, 16, 369. [Google Scholar] [CrossRef]
  36. Biswas, P.; Rashid, A.; Habib, A.K.M.A.; Mahmud, M.; Motakabber, S.M.A.; Hossain, S.; Rokonuzzaman, M.; Molla, A.H.; Harun, Z.; Khan, M.M.H.; et al. Vehicle to Grid: Technology, Charging Station, Power Transmission, Communication Standards, Techno-Economic Analysis, Challenges, and Recommendations. World Electr. Veh. J. 2025, 16, 142. [Google Scholar] [CrossRef]
  37. Brown, R.J.C.; Van Aswegen, S.; Webb, W.R.; Goddard, S.L. UK Concentrations of Chromium and Chromium (VI), Measured as Water Soluble Chromium, in PM10. Atmos. Environ. 2014, 99, 385–391. [Google Scholar] [CrossRef]
  38. Jun, M.-J.; Gu, Y. Effects of Transboundary PM2.5 Transported from China on the Regional PM2.5 Concentrations in South Korea: A Spatial Panel-Data Analysis. PLoS ONE 2023, 18, e0281988. [Google Scholar] [CrossRef]
  39. Hulskotte, J.H.J.; Roskam, G.D.; Denier van der Gon, H.A.C. Elemental Composition of Current Automotive Braking Materials and Derived Air Emission Factors. Atmos. Environ. 2014, 99, 436–445. [Google Scholar] [CrossRef]
  40. Wang, J.M.; Jeong, C.-H.; Hilker, N.; Healy, R.M.; Sofowote, U.; Debosz, J.; Su, Y.; Munoz, A.; Evans, G.J. Quantifying Metal Emissions from Vehicular Traffic Using Real World Emission Factors. Environ. Pollut. 2021, 268, 115805. [Google Scholar] [CrossRef] [PubMed]
  41. Cundy, A.B.; Rowlands, F.M.; Lu, G.; Wang, W.-X. A Systematic Review of Emerging Contaminants in the Greater Bay Area (GBA), China: Current Baselines, Knowledge Gaps, and Research and Management Priorities. Environ. Sci. Policy 2022, 131, 196–208. [Google Scholar] [CrossRef]
  42. Zhou, Y.; Wei, T.; Chen, S.; Wang, S.; Qiu, R. Pathways to a More Efficient and Cleaner Energy System in Guangdong-Hong Kong-Macao Greater Bay Area: A System-Based Simulation During 2015–2035. Resour. Conserv. Recycl. 2021, 174, 105835. [Google Scholar] [CrossRef]
  43. Song, Q.; Sun, C.; Wang, Z.; Cai, K. Municipal Solid Waste to Electricity Development and Future Trend in China: A Special Life Cycle Assessment Case Study of Macau. In Waste-to-Energy; Ren, J., Ed.; Academic Press: Cambridge, MA, USA, 2020; pp. 177–212. [Google Scholar] [CrossRef]
  44. Huang, Z. Discussion on Road Traffic Problems and “Public Transport Priority” Policy in the Macau Peninsula. World J. Eng. Technol. 2020, 8, 631–641. [Google Scholar] [CrossRef]
  45. Kim, S.K.; Wang, J. A Dataset on Public Bus Transportation during Normal and Grand Prix Seasons in the Macao Area. Sci. Data 2025, 12, 1306. [Google Scholar] [CrossRef]
  46. Du, H.; Lu, X.; Han, X. Determination of Priority Control Factors for Risk Management of Heavy Metal(Loid)s in Park Dust in Mianyang City. Sci. Rep. 2024, 14, 27440. [Google Scholar] [CrossRef]
  47. Zhou, F.; Guo, H.; Liu, L. Quantitative Identification and Source Apportionment of Anthropogenic Heavy Metals in Marine Sediment of Hong Kong. Environ. Geol. 2007, 53, 295–305. [Google Scholar] [CrossRef]
  48. Zhou, F.; Guo, H.; Hao, Z. Spatial Distribution of Heavy Metals in Hong Kong’s Marine Sediments and Their Human Impacts: A GIS-Based Chemometric Approach. Mar. Pollut. Bull. 2007, 54, 1372–1384. [Google Scholar] [CrossRef] [PubMed]
  49. Li, X.; Poon, C.-S.; Liu, P.S. Heavy Metal Contamination of Urban Soils and Street Dusts in Hong Kong. Appl. Geochem. 2001, 16, 1361–1368. [Google Scholar] [CrossRef]
  50. EPA/600/R-14/108; EPA Positive Matrix Factorization (PMF) 5.0 Fundamentals and User Guide. U.S. Environmental Protection Agency: Washington, DC, USA, 2014.
  51. U.S. Environmental Protection Agency (EPA). Human Exposure Model (HEM); U.S. Environmental Protection Agency: Washington, DC, USA, 2023. Available online: https://www.epa.gov/fera/risk-assessment-and-modeling-human-exposure-model-hem (accessed on 1 September 2025).
  52. Kim, E.; Hopke, P.K.; Edgerton, E.S. Improving Source Identification of Atlanta Aerosol Using Temperature Resolved Carbon Fractions in Positive Matrix Factorization. Atmos. Environ. 2004, 38, 3349–3362. [Google Scholar] [CrossRef]
  53. Hopke, P.K.; Dai, Q.; Li, L.; Feng, Y. Global Review of Recent Source Apportionments for Airborne Particulate Matter. Sci. Total Environ. 2020, 740, 140091. [Google Scholar] [CrossRef]
  54. Men, C.; Liu, R.; Wang, Q.; Miao, Y.; Wang, Y.; Jiao, L.; Li, L.; Cao, L.; Shen, Z.; Li, Y.; et al. Spatial-Temporal Characteristics, Source-Specific Variation and Uncertainty Analysis of Health Risks Associated with Heavy Metals in Road Dust in Beijing, China. Environ. Pollut. 2021, 278, 116866. [Google Scholar] [CrossRef]
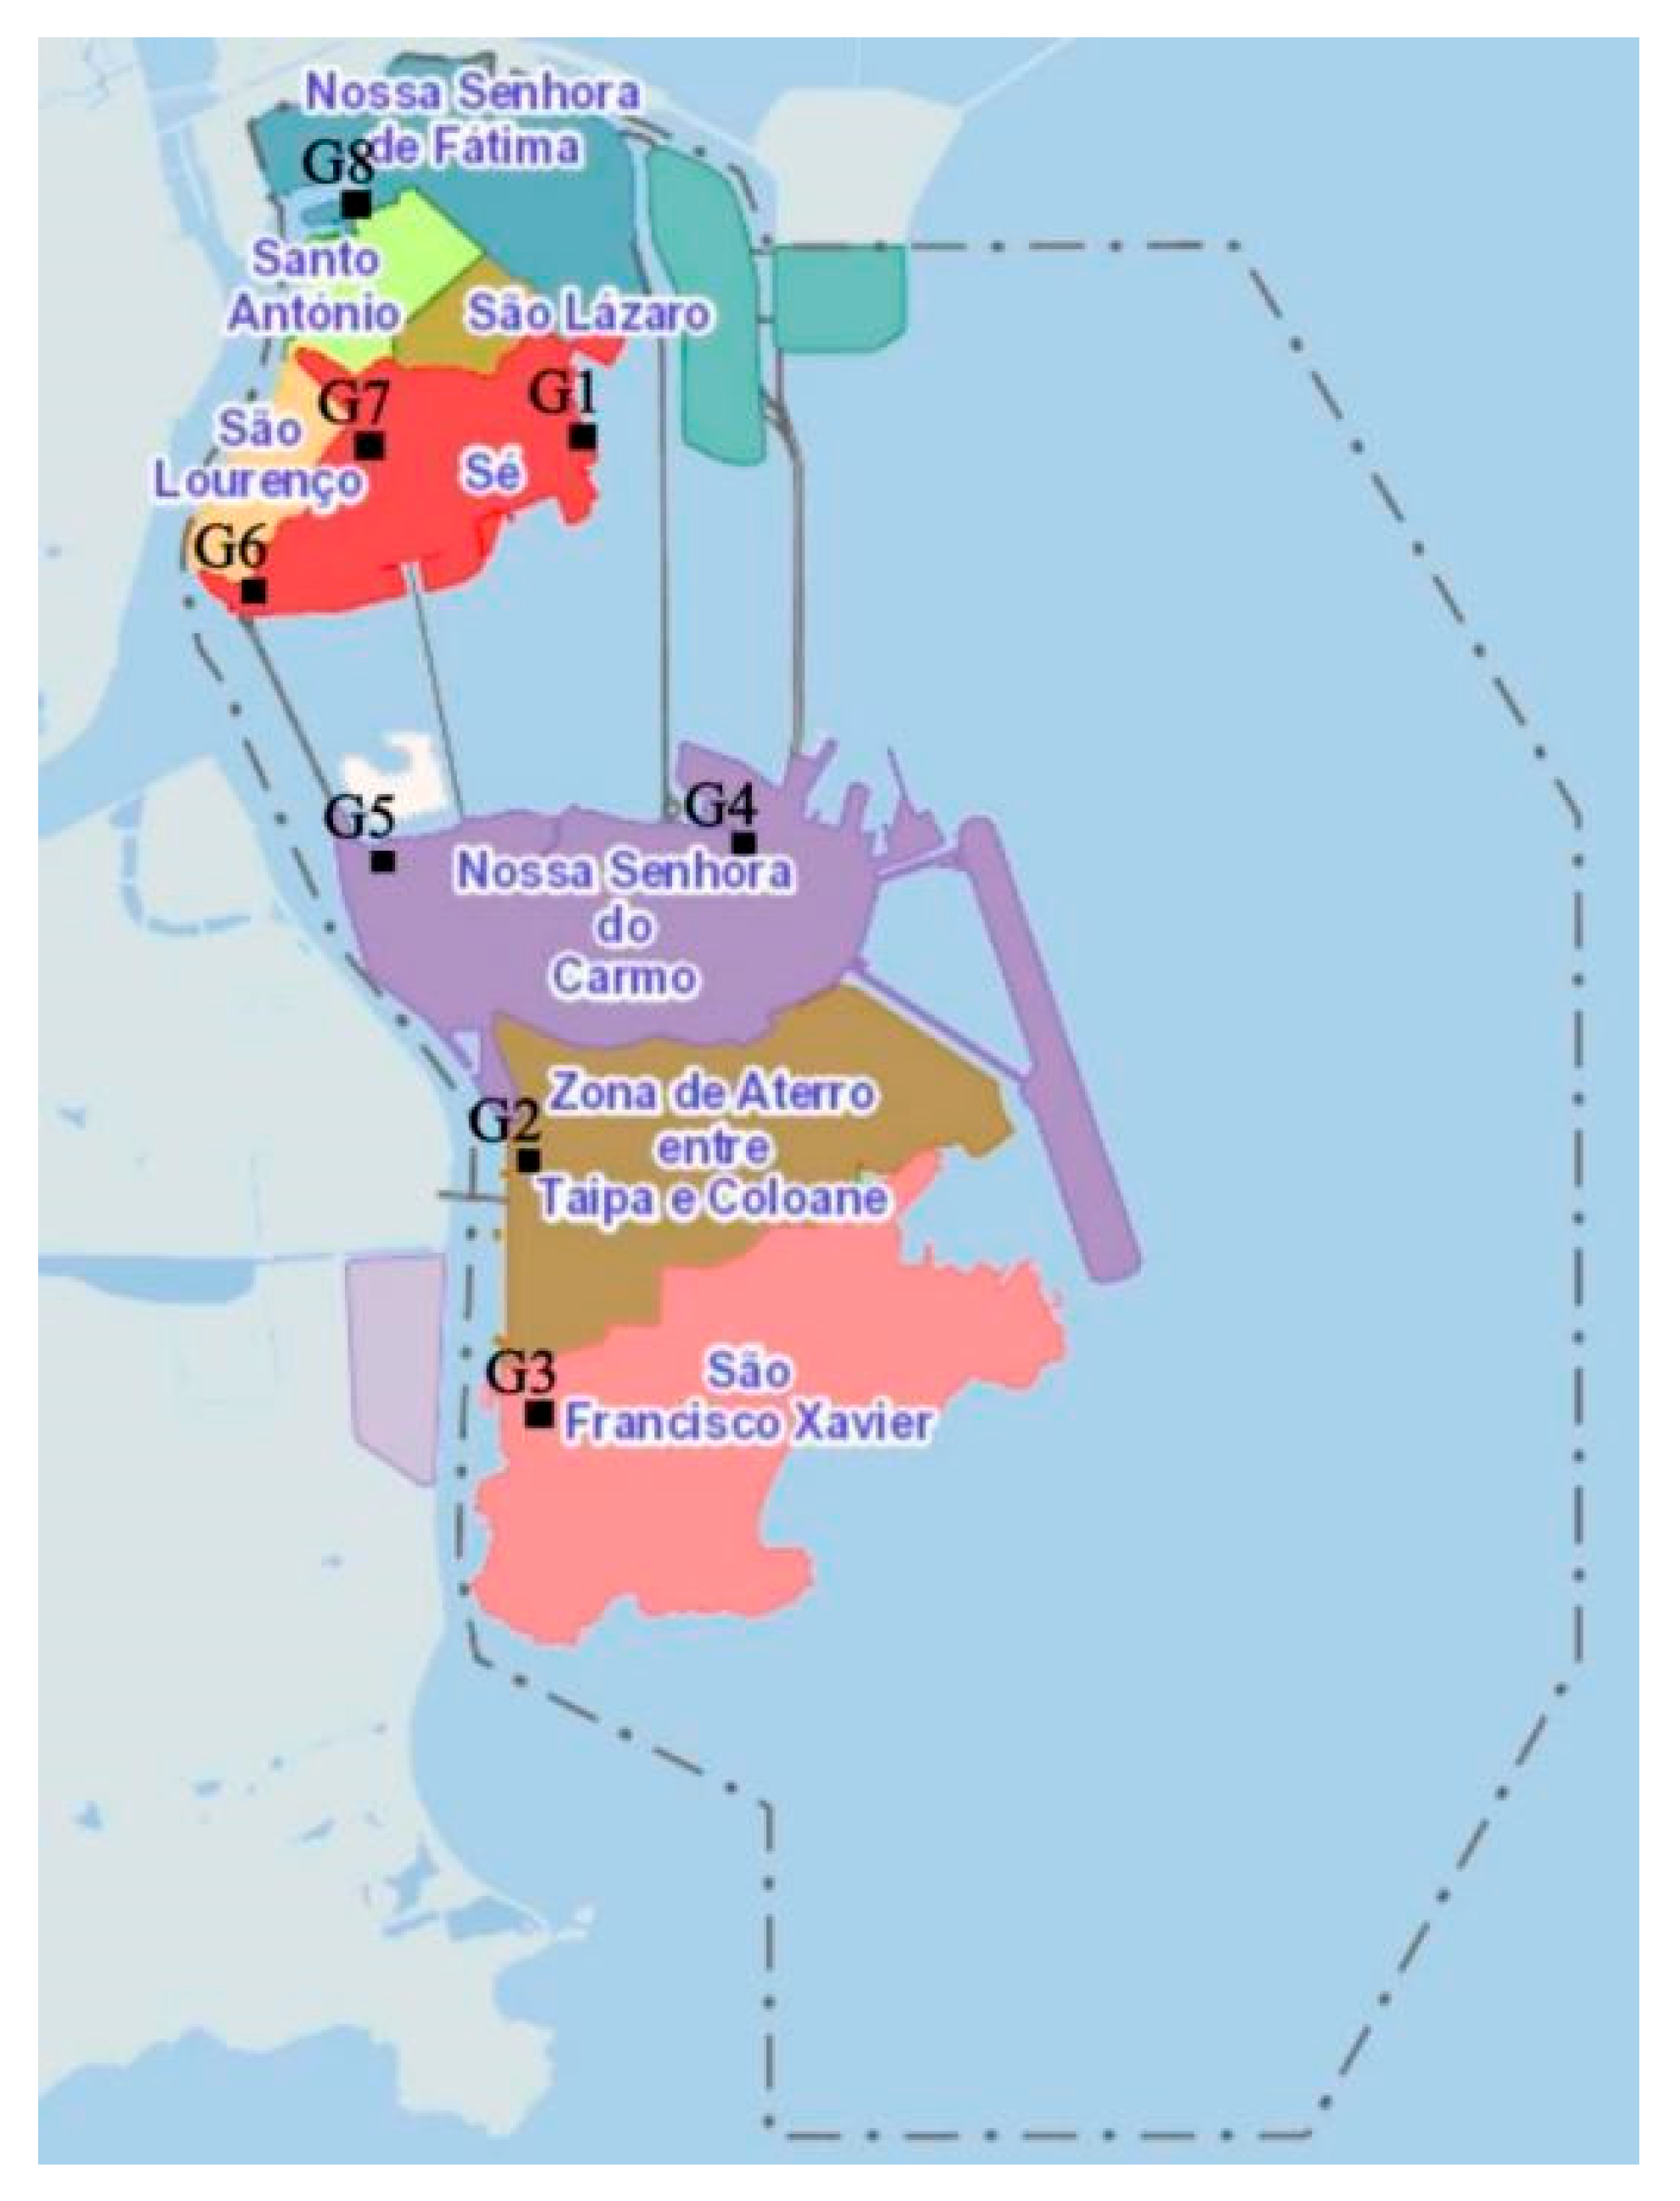
Figure 1. Location of road dust collection in Macao.
Sustainability 17 10433 g001
Figure 2. Pictures of experimental collection tools.
Sustainability 17 10433 g002
Figure 3. Samples of road dust after processing.
Sustainability 17 10433 g003
Figure 4. Road Dust Source Apportionment Diagrams of PMF 5.0 Model.
Sustainability 17 10433 g004aSustainability 17 10433 g004b
Table 1. Data collection summary chart for G1–G8 (SMG, 2024).
Sampling Weight
(g)
MotorcyclePrivate CarTaxiBusTruckTotal Number of Vehicles Pavement
Material
Temperature (°C)Relative
Humidity
(%)
G10.256121384617278Pitch28.545
G20.210163617069Pitch29.573
G30.2184888183Pitch30.568
G40.21046043797Pitch28.578
G50.2153306473618460Cement28.580
G60.371027483412230Cement28.575
G70.2101111124Gravel27.578
G80.2837240069Pitch27.578
Table 2. G1–G8 concentrations of important metals (µg/g).
9NaMgAlSiKCaNiAsCuPbVZnMnFeCrBeB
G1114.5615.492.832.3242.67341.470.3030.020.640.0070.0291.20.0591.960.1136.27 × 10−40.754
G2313.833.191.1613.2454.072333.430.2560.010.530.0050.0151.670.1951.530.0769.04 × 10−40.379
G3522.0568.661.1626.23167.2508.150.3160.030.650.0090.0152.760.9062.280.0899.54 × 10−40.424
G4462.345.422.6531.6295.46528.450.2560.031.010.0110.0271.390.1273.060.0998.25 × 10−40.903
G5617.5375.2755.2299.8358.16291.270.0880.050.540.0770.0570.940.72338.230.1162.91 × 10−30.265
G6235.0229.620.9612.5334.38237.590.1240.010.350.0030.0060.660.130.870.0577.37 × 10−40.293
G7314.5232.951.6812.2762.28226.740.170.020.390.0050.0090.710.2551.70.068.77 × 10−40.214
G8491.158.988.1127.3195.27351.950.4170.030.850.0670.0224.040.7477.710.1311.50 × 10−30.551
Table 3. Health Risk Assessment on Daily Ingestion, Inhalation, and Dermal Exposure.
CompoundDinDihDdHQinHQihHQdHI
Be8.23 × 10−101.21 × 10−133.28 × 10⁻¹²
Cr6.55 × 10−89.64 × 10−122.61 × 10−102.18 × 10−53.32 × 10−74.36 × 10−62.65 × 10−5
Ni1.70 × 10−72.50 × 10−116.77 × 10⁻¹⁰
Cu4.36 × 10−76.41 × 10−111.74 × 10−91.09 × 10−51.60 × 10−91.45 × 10−71.10 × 10⁻⁵
Zn1.17 × 10−61.73 × 10−104.69 × 10−93.92 × 10−8 7.82 × 10−81.17 × 10−7
As1.83 × 10−82.69 × 10−127.31 × 10⁻¹¹
Cd4.31 × 10−106.34 × 10−141.72 × 10−124.31 × 10⁻⁷ 1.72 × 10−76.04 × 10−7
Pb1.61 × 10−82.36 × 10−126.41 × 10−114.59 × 10−67.88 × 10−121.21 × 10−74.71 × 10−6
Table 4. Health Risk Assessment Values of Heavy Metals.
CompoundLADDCarcinogenic Risk (CR)Total CR
Be5.99 × 10−14
Cr4.75 × 10−122.00 × 10⁻¹⁰
Ni1.24 × 10−11
Cu3.17 × 10−11
Zn8.56 × 10−11
As1.32 × 10−12
Cd3.14 × 10−141.98 × 10⁻¹³
Pb1.17 × 10−124.91 × 10⁻¹⁰
Total CR 6.91 × 10⁻¹⁰
Table 5. Correlation Coefficient of Heavy Metals and Total Vehicle Counts.
Heavy Metals Total Vehicle Counts
Na0.11
Mg0.19
Al0.79
Si0.82
K−0.41
Ca−0.27
Ni−0.54
As0.50
Cu−0.21
Pb0.47
V0.77
Zn−0.41
Mn0.07
Fe0.77
Cr0.33
Disclaimer/Publisher’s Note: The statements, opinions and data contained in all publications are solely those of the individual author(s) and contributor(s) and not of MDPI and/or the editor(s). MDPI and/or the editor(s) disclaim responsibility for any injury to people or property resulting from any ideas, methods, instructions or products referred to in the content.