Article

Impact of Mining on Socioeconomic Status in Puno, Peru

by
Rene Paz Paredes
1,*,
Roberto Arpi
1,
Oliver Amadeo Vilca Huayta
2,
Roberto Chavez Flores
3,
Henry Sucari Turpo
1,
Roberto Alfaro-Alejo
4,
Alcides Huamani
1 and
Hernan Saravia
1
1
Departamento de Ingeniería Económica, Universidad Nacional del Altiplano, Puno 21001, Peru
2
Departamento de Ingeniería de Sistemas, Universidad Nacional del Altiplano, Puno 21001, Peru
3
Departamento de Ingeniería de Minas, Universidad Nacional del Altiplano, Puno 21001, Peru
4
Departamento de Ingeniería de Agrícola, Universidad Nacional del Altiplano, Puno 21001, Peru
*
Author to whom correspondence should be addressed.
Sustainability 2025, 17(22), 9951; https://doi.org/10.3390/su17229951
Submission received: 26 March 2025 / Revised: 12 June 2025 / Accepted: 13 June 2025 / Published: 7 November 2025

Abstract

This study examines the direct and indirect effects of mining activities on key socioeconomic indicators such as per capita income, the Human Development Index (HDI), and education in the Puno region of Peru, comparing short-term (2015–2019) and long-term (2003–2029) impacts. Using a random effects panel data model and incorporating spatial autocorrelation, the study analyzes data from 2003 to 2019 to assess the effects of mining on both mining and non-mining districts. The results show that in the short term, family income per capita in mining districts increased by PEN 65.03, while non-mining districts saw an indirect increase of PEN 80.59. In the long term, the direct impact on mining districts grew to PEN 239.44, with the indirect impact on non-mining districts reaching PEN 352.30. In education, mining districts experienced a 6.74 percentage point increase in secondary education for 18-year-olds in the short term, and non-mining districts had a 5.19 percentage point increase, with both showing positive impacts. Long-term effects showed a smaller increase, with mining districts at 12.27 percentage points and non-mining districts at 9.71 percentage points. Regarding the HDI, the direct impact in mining districts in the short term was an increase of 0.02 points, with a total impact of 0.03 points, while the indirect impact on non-mining districts was minimal. In the long term, the direct impact on mining districts grew to 0.09 points, with the total impact reaching 0.10 points, while non-mining districts showed an increase of 0.10 points as well. The study concludes that mining has significant short-term impacts, particularly on income and education, but the long-term effects are more pronounced, especially for income and the HDI, with substantial indirect benefits for non-mining districts, especially in terms of income. Educational improvements stabilize over time, and mining’s overall impact on the HDI increases as its economic and social effects deepen.

1. Introduction

The mining sector in Puno, Peru, plays a crucial role in the national economy, particularly in gold production, with artisanal mining significantly contributing to the region’s output [1]. However, the impacts of mining extend beyond economic benefits, affecting health, education, and overall community well-being [1,2,3]. While mining increases incomes in production districts, it also exacerbates income inequality, as non-mining areas often experience stagnation or decline [2,3]. Furthermore, mining introduces negative externalities, such as health risks and environmental degradation, with communities near mining activities reporting poorer health outcomes [4]. These socioecological trade-offs highlight the need for sustainable policies and equitable benefit-sharing. The study will use econometric techniques to analyze the socioeconomic impacts of mining at the district level, drawing insights from other global contexts [2,4].
The mining sector in Puno has seen remarkable growth, with gold production ranking fourth nationally in Peru. In 2019, the region contributed 9.13 metric tons of fine gold to the country’s total production of 140.21 metric tons. A significant portion of this output, 68%, comes from artisanal mining, highlighting the dual nature of the sector in Puno, where both large-scale and small-scale mining operations coexist, each contributing differently to the local economy [5].
Mining is a cornerstone of the Peruvian economy, particularly in regions like Puno, where its influence extends far beyond direct economic benefits. However, much of the research on mining focuses on its direct economic impact, leaving a significant gap in understanding its indirect socioeconomic effects—particularly in non-mining districts that are adjacent to mining areas. This study aims to fill that gap by examining how mining activities influence both mining and non-mining communities through the use of advanced econometric techniques and spatial analysis. According to [6], the state’s discourse around mining in Peru often prioritizes the legitimacy of extractive activities over meaningful community engagement, emphasizing the need for a deeper examination of mining’s broader socioeconomic impacts.
Puno, located in southern Peru, is rich in metallic mineral resources, with approximately 60% of its territory designated for mining (Figure 1). This region is known for producing tin, gold, silver, zinc, and lead, with gold and tin being the primary extracted commodities. The San Rafael mine, operated by MINSUR, is the only tin producer in the country, highlighting the strategic importance of mining to Puno’s economy. In 2020, mineral exports—primarily gold and tin—accounted for 99% of the region’s total exports, amounting to USD 1.807 billion. In stark contrast, the agricultural and fishing sectors combined contributed only 1% of total exports.
Despite the positive economic indicators, the benefits of mining are not equally distributed across the region. While mining-producing districts have experienced significant increases in income, some non-mining districts have seen stagnation or even declines in income, leading to a widening income gap. For example, per capita income in the region increased from 214 Peruvian soles (PEN) in 2003 to PEN 347 in 2019. At the 2025 exchange rate (1 PEN ≈ 0.273 USD), this represents an increase from approximately USD 58.5 to USD 94.8. However, this growth has not been experienced equally across all districts. This disparity raises important questions about the equitable distribution of mining revenues and the socioeconomic implications for communities that do not directly engage in mining activities.
The socioeconomic impacts of mining extend beyond income generation. While mining can create jobs and reduce poverty, it can also result in negative consequences such as higher unemployment rates, illiteracy, and health issues in some areas. Research conducted in other mining regions, such as Jordan and Ghana, has highlighted the mixed effects of mining on local communities, underscoring the need for a more nuanced understanding of how mining activities affect socioeconomic conditions [7,8].
Given these complexities, this study aims to measure the impact of mining on the socioeconomic status of Puno’s population, specifically at the district level. Through the application of rigorous econometric methodologies, the research provides a comprehensive analysis of how mining activities shape income levels, educational outcomes, and overall human development in the region. Understanding these dynamics is critical for policymakers and stakeholders who must navigate the challenges and opportunities that mining presents for Puno’s sustainable and equitable growth [9].
Mining is an activity with significant positive effects on tax income, exports, employment, investment, and population income, and negative effects on health and the environment [10,11]. The Puno region, located in southern Peru, has an enormous potential for metallic mineral resources: 60% of the territory is considered for mining activity. Metallic mining production is mainly focused on tin, gold, silver, zinc and lead. However, gold and tin are the main products with the highest extraction. Regarding tin, the San Rafael mine belonging to the MINSUR company is the only and first producer of tin in the country [12].
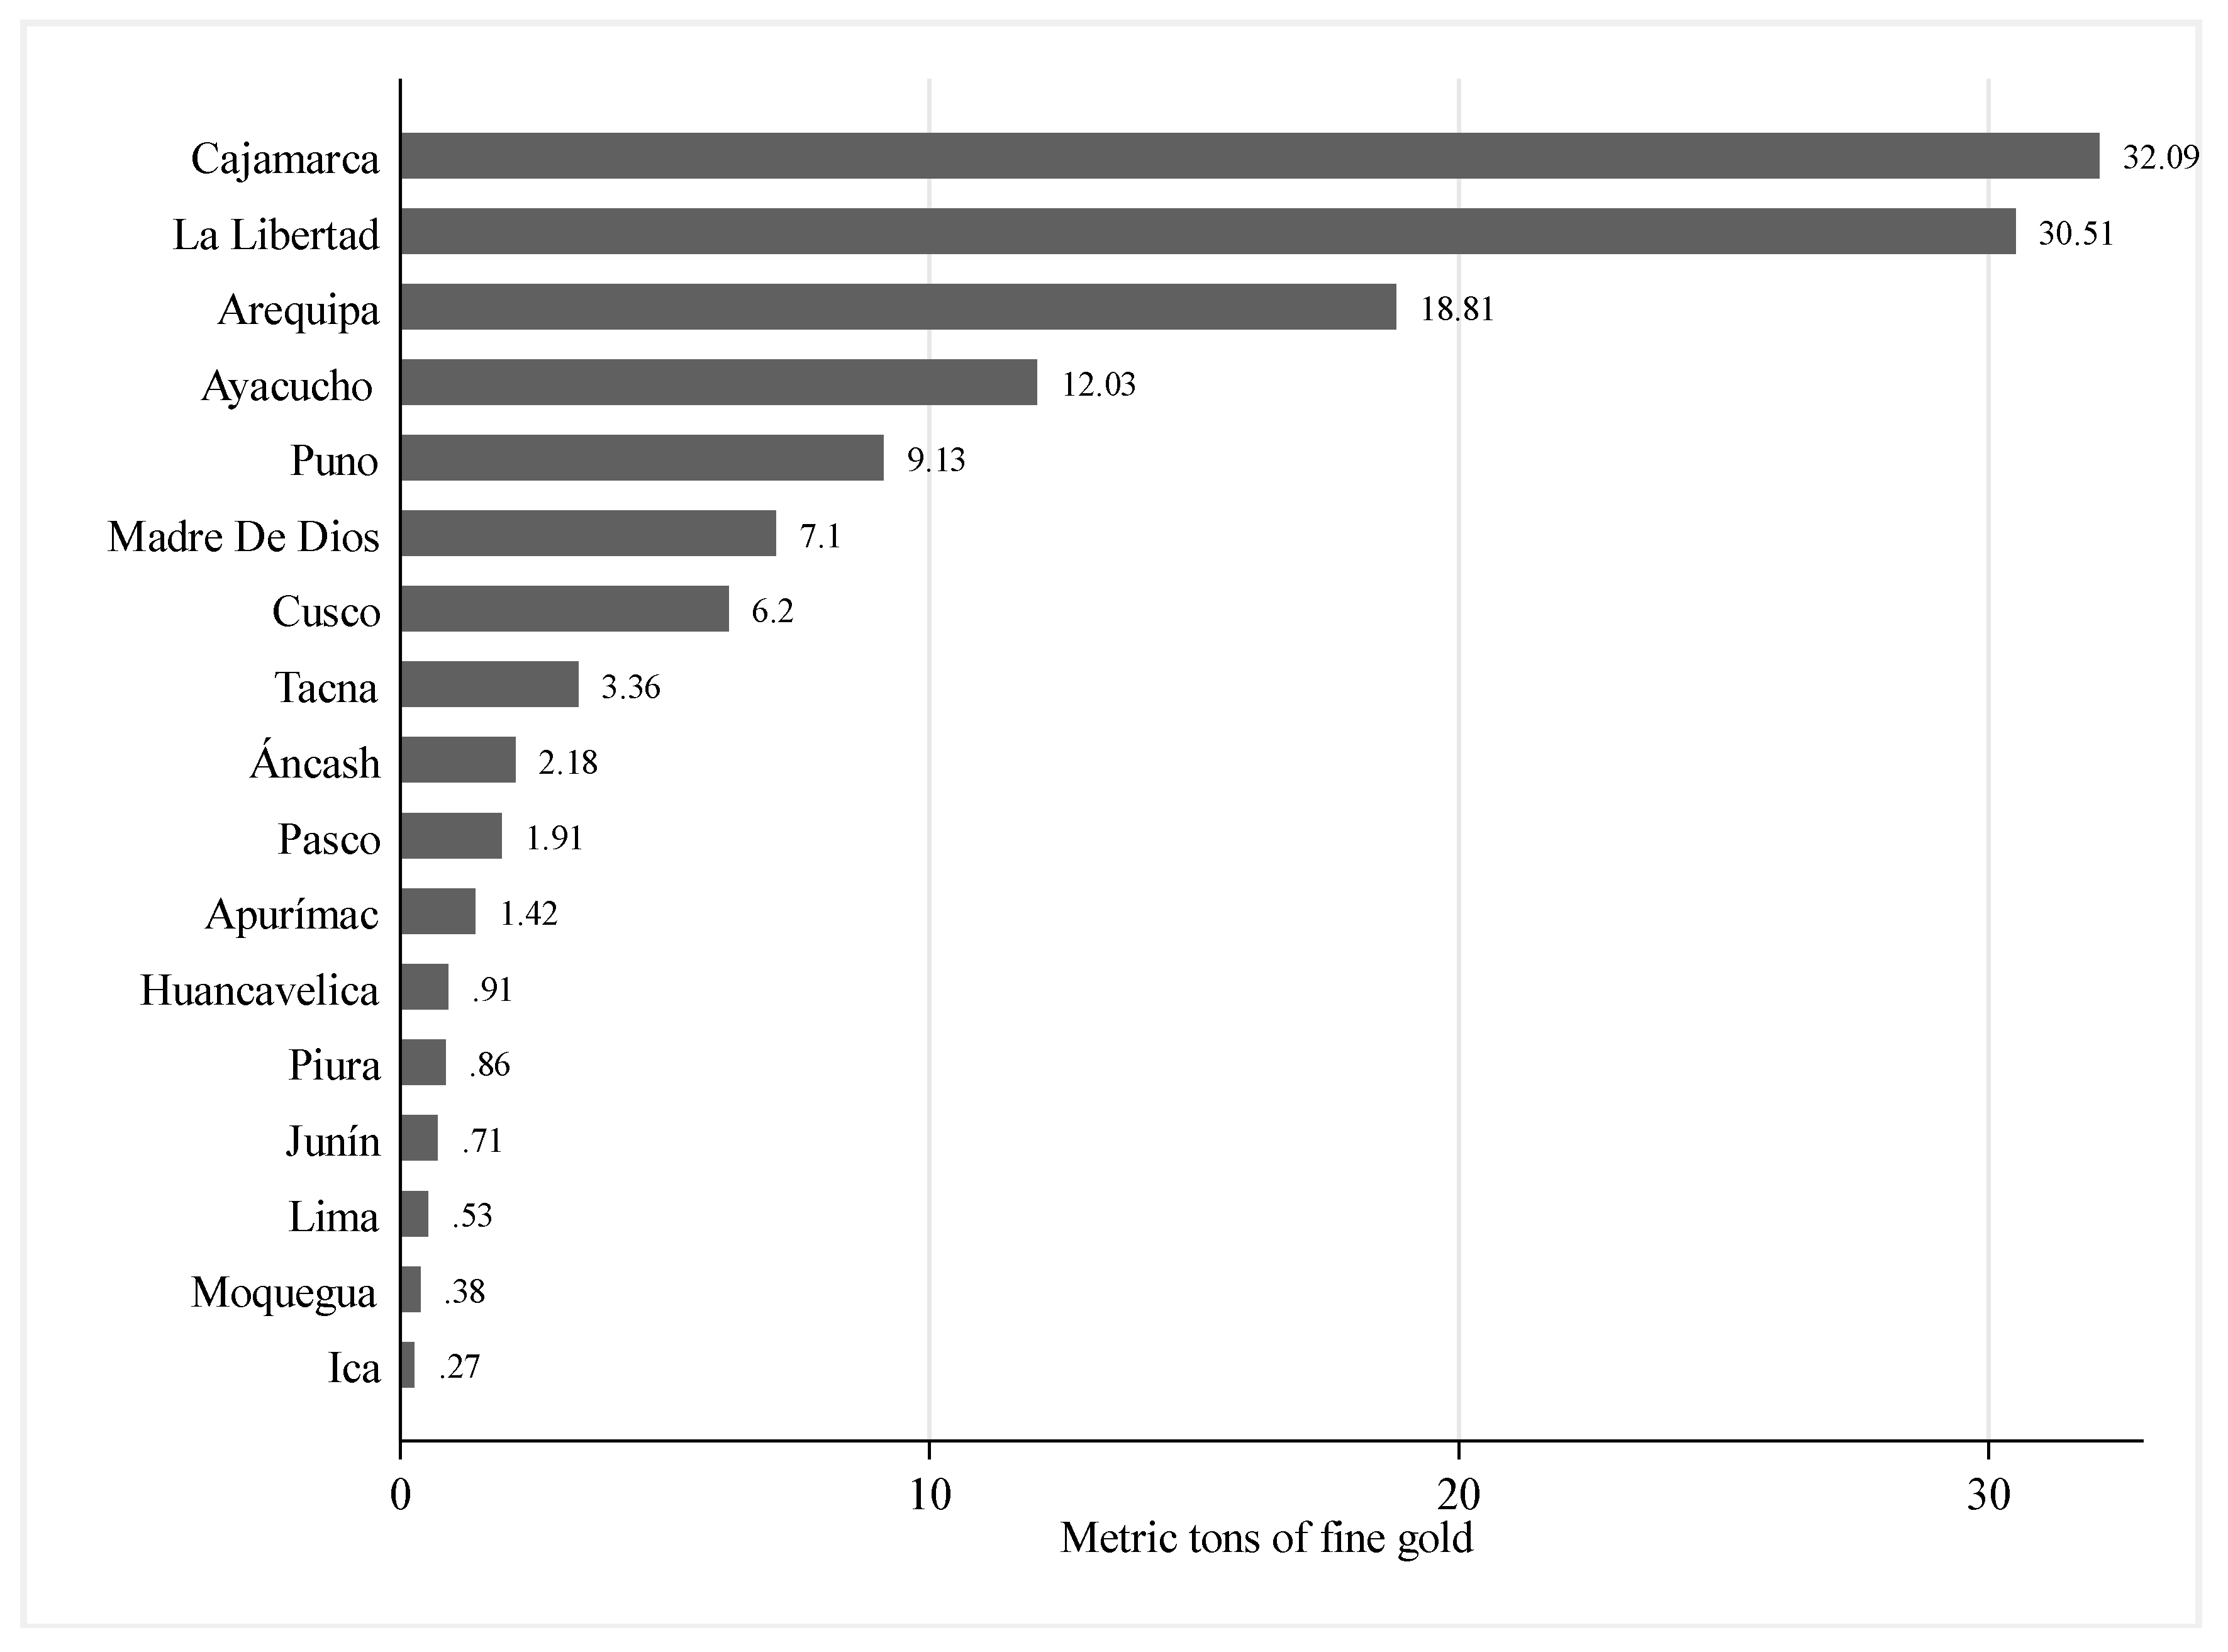
Regarding gold production, the Puno region ranks fourth at the national level, after Cajamarca, La Libertad, and Arequipa. In 2019, Peru produced 140.21 metric tons of fine gold (TMF), of which 9.13 TMF was produced in the Puno region (Figure 2).
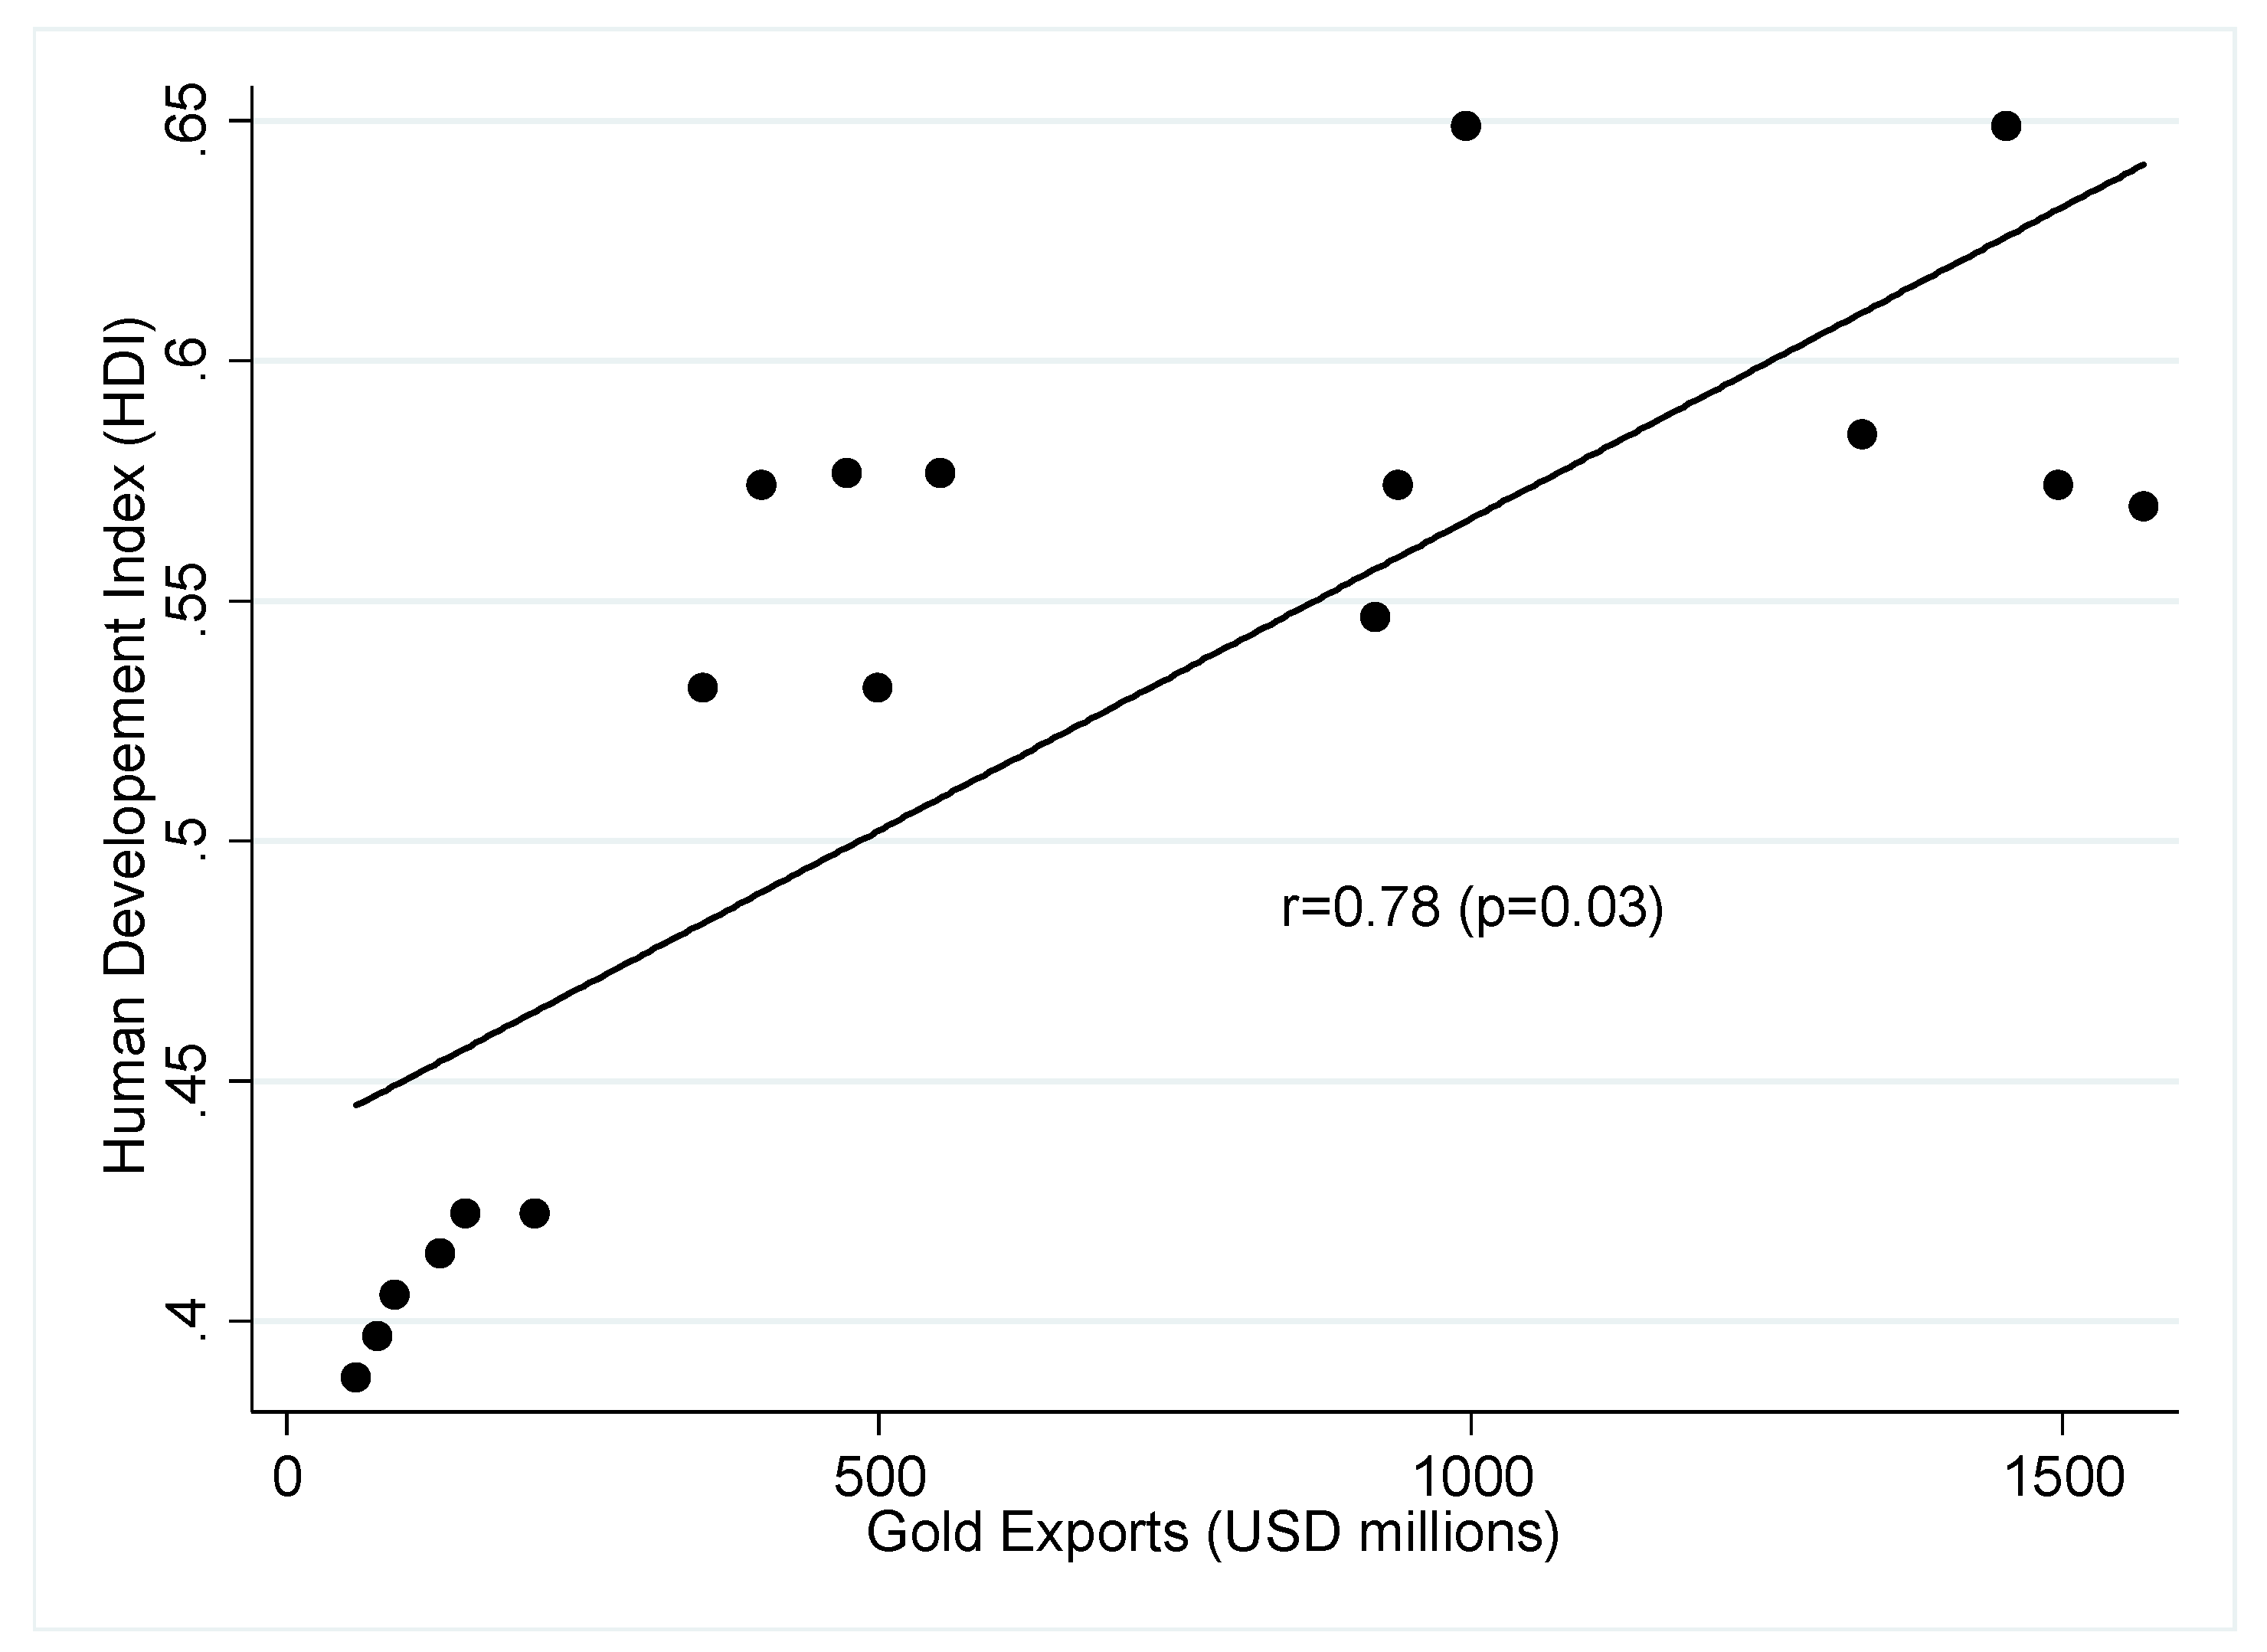
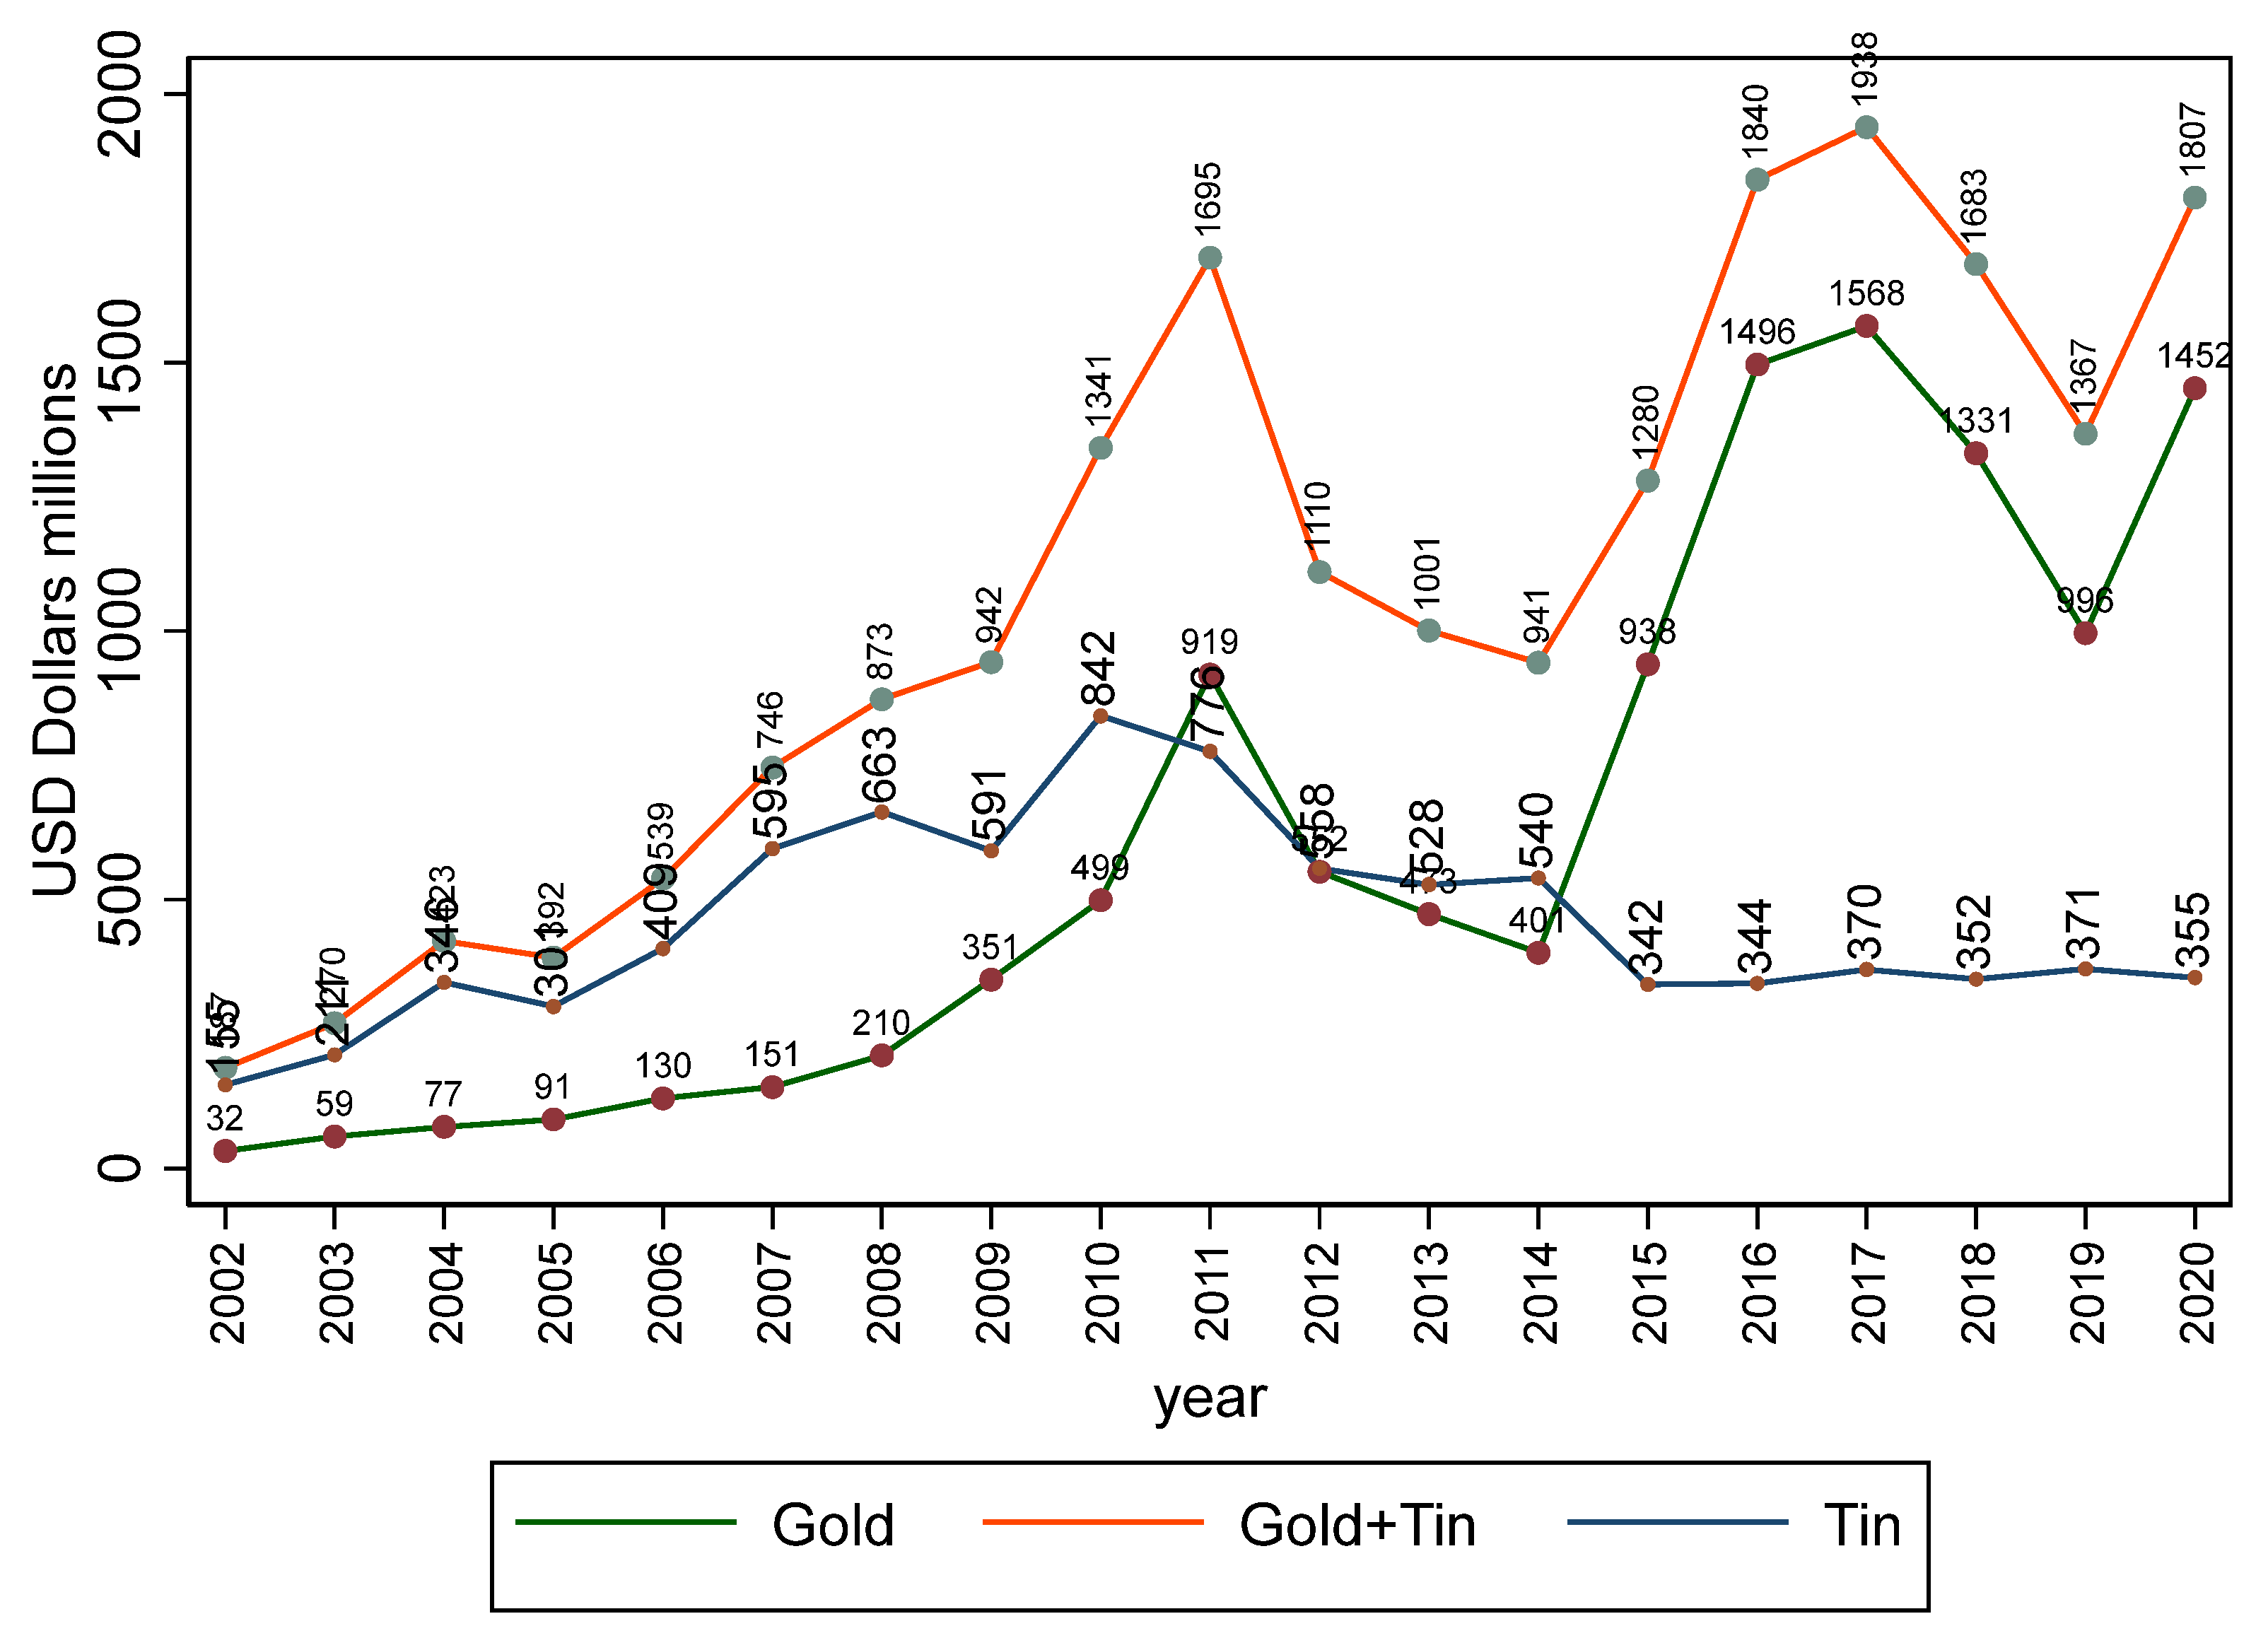
Gold production in Puno is distributed as follows: 68% (6.2 TMF) is produced by artisanal mining and 32% (2.93 TMF) is produced by large, medium, and small mining [12]. The mining sector in the Puno region is the main contributor to exports. In 2020, mineral exports (gold and tin) contributed 99% (USD 1807 million) of total exports, while the fishing and agricultural sector exported only 1% (USD 18 million). The value of gold exports increased from USD 32 million in 2002 to USD 1.452 million in 2020, while the value of tin exports increased from USD 155 million to USD 355 million, in the same period (Figure 3), which has been favored by the sustained rise in international mineral prices [13].
In the Puno region, between 2003 and 2020, a correlation of 0.74 exists between gold exports and the Human Development Index (HDI), indicating a moderate to strong positive relationship. This suggests that as gold exports increase, the HDI in the region tends to improve as well. This connection may reflect the fact that the revenues generated from gold exports contribute to improvements in key areas of human development, such as per capita income, education, and health. However, it is important to note that while a relationship exists, other factors may also influence the HDI, and further studies would be needed to fully understand the nature of this correlation in Puno.
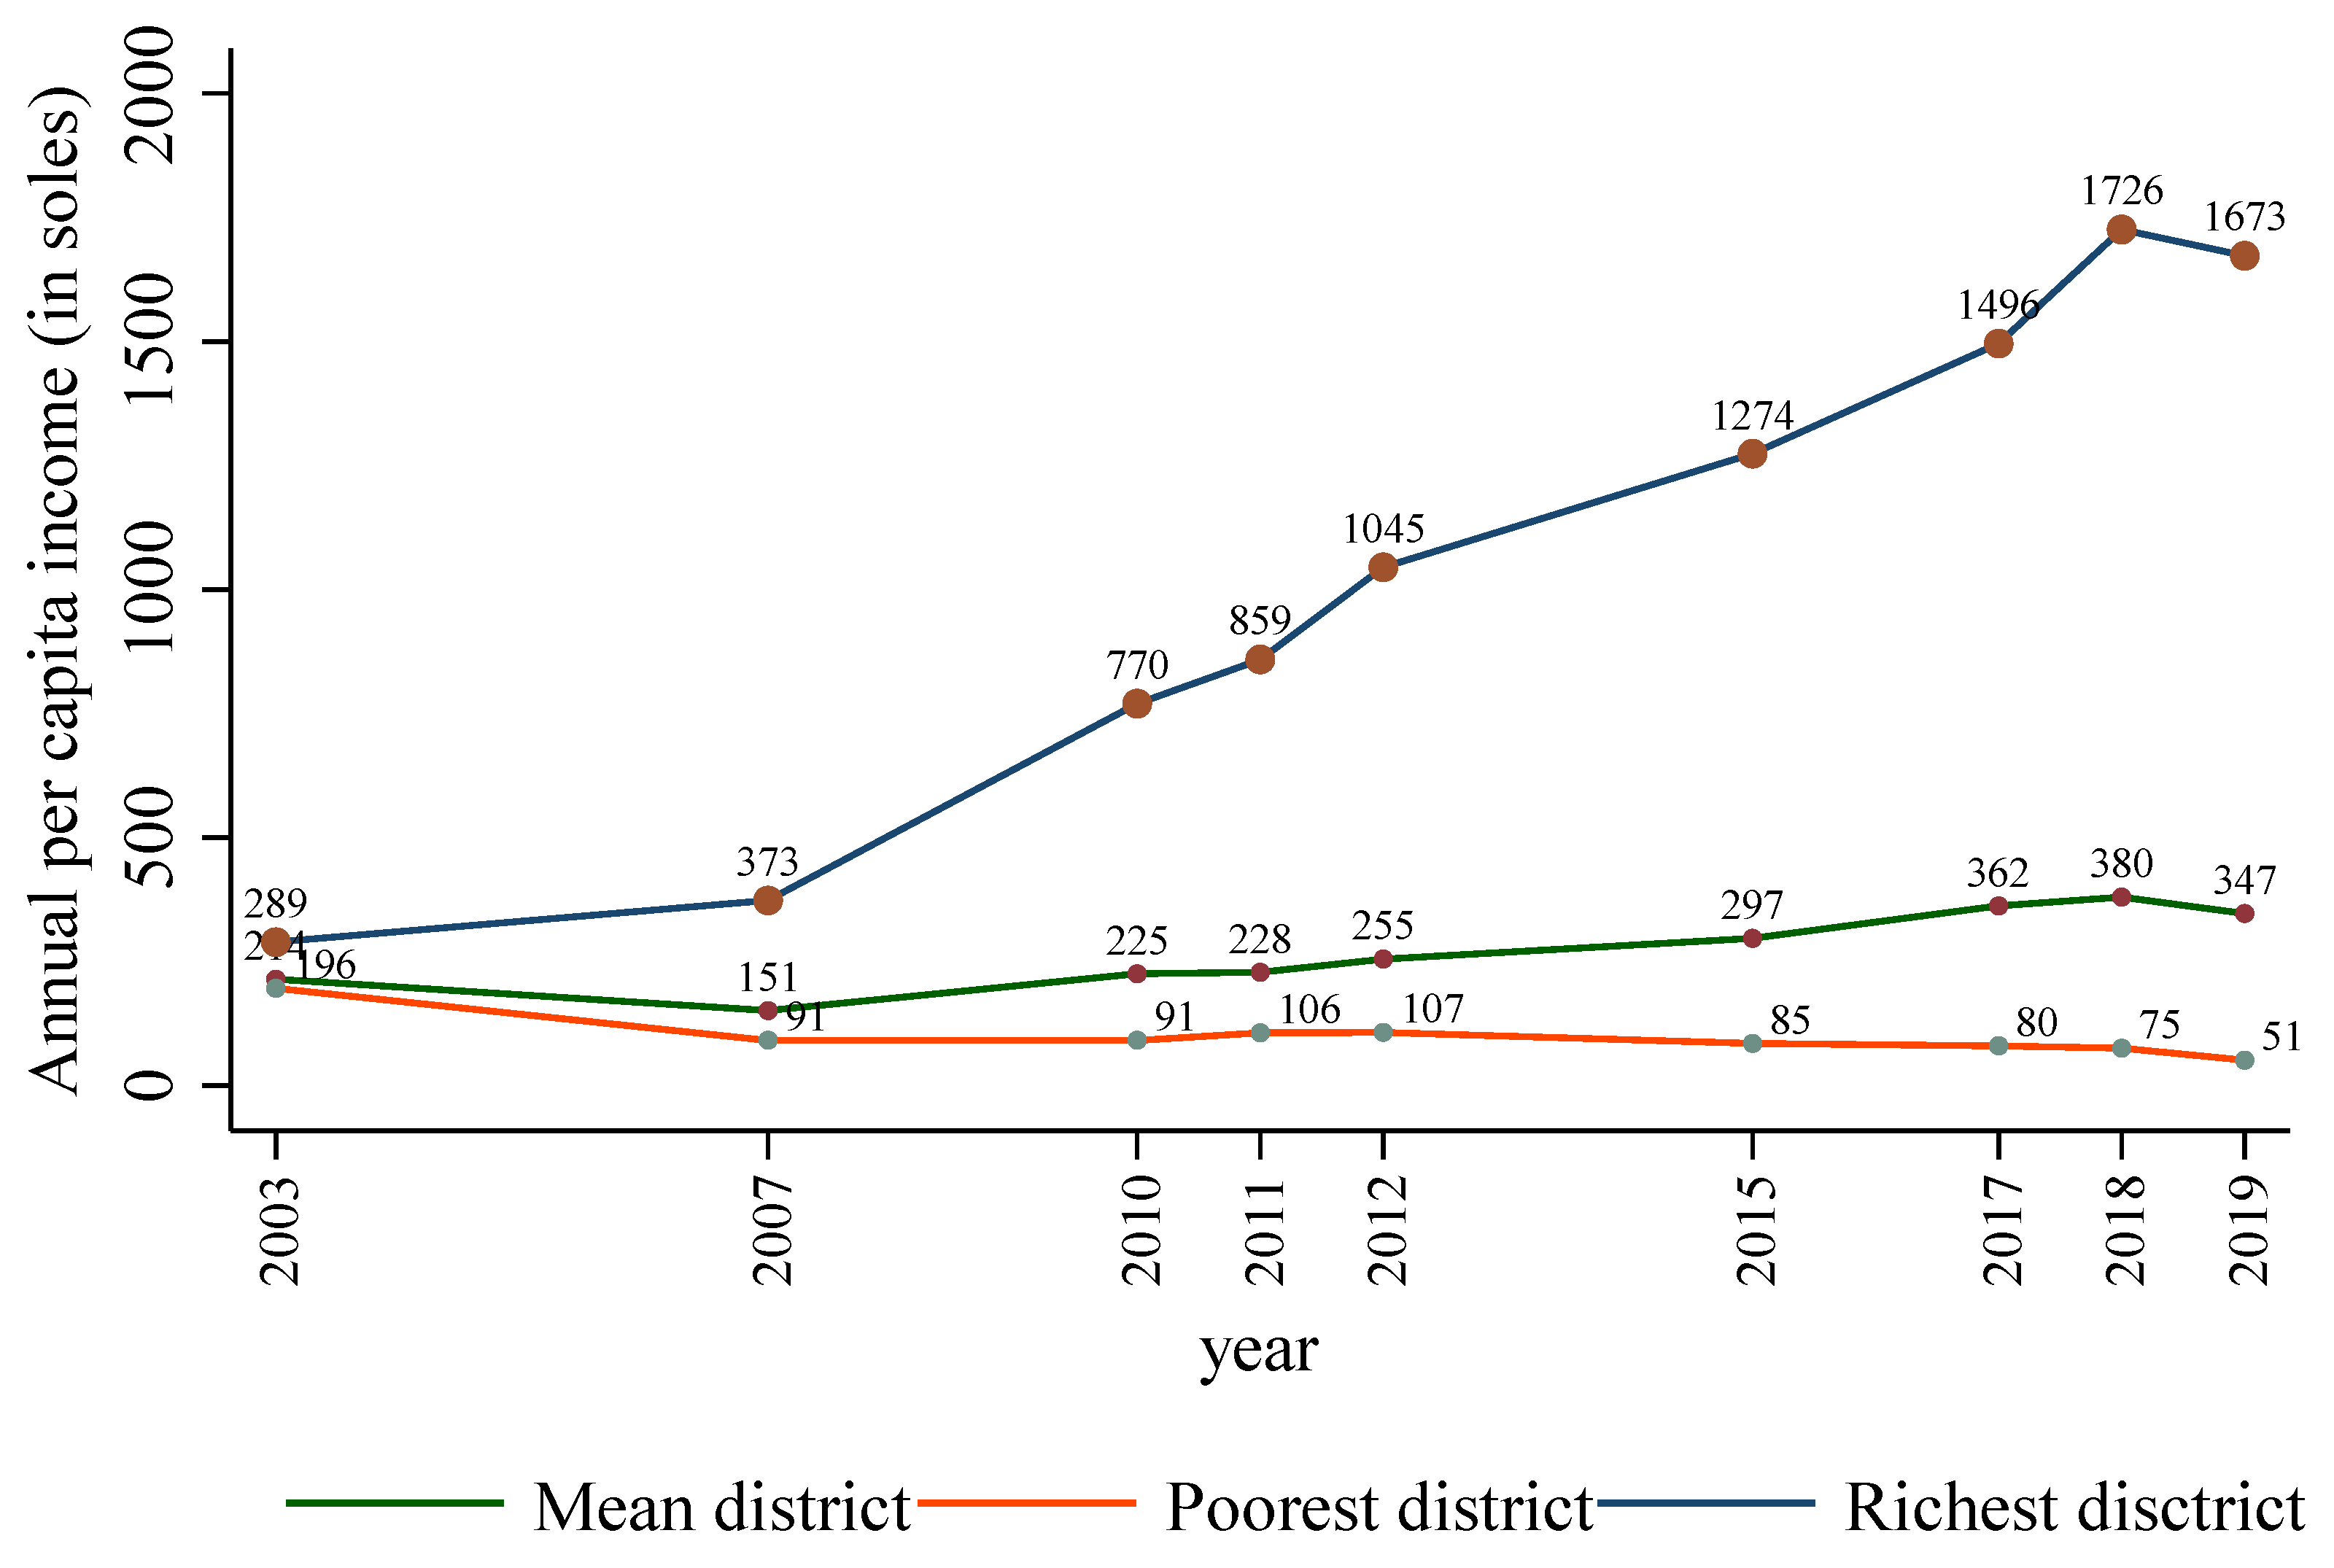
The average per capita family income in Puno increased from PEN 214 to PEN 347 between 2003 and 2019. However, not all districts saw improvement; some stagnated or decreased. In 2003, the district average was PEN 214 (approximately USD 58.5, at the 2025 exchange rate of 1 PEN ≈ USD 0.273), with the poorest district at PEN 196 (~USD 53.5) and the richest at PEN 289 (~USD 78.9). By 2019, the average was PEN 347 (~USD 94.8), with the poorest district at PEN 51 (~USD 13.9) and the richest at PEN 1673 (~USD 456.20), widening the income gap. Mining activity likely contributed to this gap, as mining-producing districts experienced greater income growth compared to non-mining districts. This income gap between the districts can be attributed to mining activity; the mining-producing districts appear to have improved their income levels more than the non-mining ones [11].
Mining can contribute positively or negatively to the socioeconomic level of households located near a mine [11,15]. Al Rawashdeh et al. [15], in the case of Jordan, show that the value of mining production in per capita terms increases the unemployment rate, illiteracy rate, poverty rate, and infant mortality rate and decreases the Human Development Index. In other words, mining activities in Jordan do not appear to benefit local communities compared to what is happening in the country as a whole.
Isung et al. [16] show that small-scale mining activities in Ghana have positive and negative effects on living standards. In particular, they show a negative effect on agriculture, children’s education, and the health status of community members. On the positive side, they show an improvement in employment and a decrease in the incidence of poverty in the communities over the years. For their part, Aragón et al. [10] show a positive effect of the Yanacocha mine (a large gold mine in northern Peru) on household income at the local level, explained by the demand for inputs by the mine.
The environmental pollution resulting from informal mining practices in the Puno region represents both a significant ecological crisis and a public health concern. Quantitative evidence gathered by Carpio & Salcedo (2020) [17] demonstrates that mercury concentrations in surface waters, such as the 7.5 µg/L measured in the Lunar de Oro stream at La Rinconada, far exceed the national safety threshold of 1 µg/L [18]. The sediment mercury levels were found to be significantly high, posing severe contamination risks, which is consistent with studies in similar regions. Ticona & Terán [19] further underscore that approximately 60% of water samples across mining-affected localities have mercury and other heavy metal concentrations above regulatory limits, with localities around Aporono and Untuca showing levels between 4 and 6 µg/L [20]. These measured contaminant levels illustrate the unregulated discharge associated with informal mining activities and highlight the urgent need for intervention [17].
The data indicate that mining practices compromise water quality and pose substantial risks to human health and ecosystem sustainability. Regarding supporting studies in southern Peru, Quiroz et al. [18] emphasize that mining-related contamination—often assessed through parameters such as the Geoaccumulation Index and Pollution Load Index—underscores the necessity for remediation efforts and environmental risk assessments in affected regions. Research focusing on high Andean artisanal mining corroborates these findings, documenting the significant impact of artisanal mining on water, soil, and overall ecosystem integrity [21]. The convergence of these findings across different regions of Peru accentuates the urgency to implement stronger regulatory frameworks that are both preventative and responsive to industrial pollution.
Beyond the strictly scientific measurement of contaminants, this crisis has induced complex socioenvironmental dynamics. Mamani [22] explored the social perspectives of local communities affected by mining-induced pollution, revealing environmental degradation and a profound sense of injustice and risk among residents. These perceptions can mobilize community engagement to support the development of targeted environmental management strategies. Additionally, studies have shown that communities’ attitudes toward environmental hazards are crucial for guiding public health interventions and policy formulations [23]. By integrating quantitative contamination data with qualitative community insights, a more comprehensive understanding of environmental and public health challenges can be achieved.
Given these findings, comprehensive environmental management strategies are essential. Innovative approaches, such as those proposed by Cacciuttolo & Pulido [24], which discuss remediation techniques including underground mine backfilling, could serve as potential models for reducing the environmental impacts of mining practices in the region. Furthermore, predictive and modeling methodologies offer promising avenues for anticipating contamination trends and optimizing remediation efforts in artisanal and small-scale mining environments [25]. These integrative strategies exemplify how scientific assessments and community perspectives can drive more sustainable policy development in heavily impacted regions.
In the context of China, mining has been a significant driver of industrialization and urbanization, contributing to foreign investment, exports, and employment—critical factors for socioeconomic development. However, this economic growth has been accompanied by environmental challenges such as ecosystem degradation and pollution, which can affect the quality of life of local communities [26]. Despite the implementation of mining regulations, issues related to occupational safety and health continue to affect workers [27]. In Australia, gold mining has proven to be a fundamental pillar of the economy, generating employment and contributing to GDP. However, the economic benefits are not always equitably distributed. Indigenous communities, in particular, have faced significant challenges, including land loss and cultural erosion [28]. Moreover, mining has been linked to public health issues, such as exposure to toxic substances and an increase in mining-related diseases [29]. Russia, as one of the top gold producers, presents a similar scenario. Mining has driven economic development in remote regions but has also caused social and environmental conflicts. The extraction of natural resources has led to environmental degradation, affecting the health of local communities and their access to natural resources [30]. Additionally, artisanal and informal mining has grown in Russia, raising additional risks in terms of safety and sustainability [31]. In Ghana, gold mining has had a dual impact. On one hand, it has contributed to GDP growth and provided employment; on the other hand, it has caused deforestation and the loss of agricultural land, eroding the livelihoods of many communities [3]. The expansion of mining has led to increased conflicts between miners and farmers, exacerbating food insecurity and poverty in some areas [32]. In this sense, the objective of the research is to measure the impact of mining on the socioeconomic level of the population of the Puno region at the district level.
Hypothesis: The long-term socioeconomic impact of mining on regions in the Puno region, Peru, is primarily positive in terms of income and education but may present challenges in human development due to environmental degradation and inequality.
Classical resource-based economic theories posit that resource extraction has the potential to drive significant economic growth within local economies. Research indicates that mining districts in Puno have observed substantial growth in family income as a direct result of mining activities, which supports the hypothesis that these activities can serve as a catalyst for economic development. This is consistent with the findings from Loayza & Rigolini [11], asserting that mining regions in Peru enjoy higher levels of per capita consumption compared to their non-mining counterparts [11].
The economic spillover theory discusses how mining activities not only benefit the local mining districts but also positively impact adjacent non-mining areas. Diogens et al. [33] emphasized that surrounding regions experience economic benefits such as increased demand for goods and services that mining activities generate, leading to unanticipated gains in family income and educational opportunities [33]. While some studies highlight positive spillover effects, other research suggests that the benefits may not be evenly distributed and can lead to regional disparities.
The link between mining activities and educational outcomes can be analyzed through the lens of Human Capital Theory, which posits that income increases, facilitated by mining, enhance educational access and attainment. As family incomes rise due to mining jobs, there is a marked increase in the rate of secondary education achieved in mining districts. However, Hilmawan & Amalia [34] present a cautionary perspective that suggests the availability of lucrative mining jobs may discourage investment in higher education over the long run. As immediate employment takes precedence, younger demographics may opt for jobs instead of pursuing further education.
The HDI is a comprehensive indicator of development, incorporating income, education, and health. While mining positively influences income and education, quality of life—as measured by the HDI—may only see modest improvements due to adverse effects associated with mining such as environmental degradation. Diogens et al. [33] underscore this complex relationship, showing that mining can exacerbate environmental issues and social inequalities that hinder overall HDI growth. Environmental pollution and the social disruptions that often accompany mining can negatively affect health outcomes, thereby diminishing the potential for sustainable human development.
The sustainability of mining practices is a critical concern when considering long-term socioeconomic impacts. Warner et al. [35] advocate for sustainable strategies to address the dual challenges of economic growth and environmental integrity [36]. Their research highlights the necessity of balancing immediate economic benefits against long-term ecological and social well-being. The study findings suggest that while mining can significantly enhance local economies, the absence of sustainable practices can lead to detrimental environmental effects, increased inequality, and regional disparities that ultimately undermine development efforts.
In summary, the theoretical framework contemplates the hypothesis that while mining carries the potential for positive economic growth and educational improvements in the Puno region, the accompanying challenges of environmental degradation and inequality warrant critical attention. Sustainable mining, alongside equitable distribution of its benefits, is essential for ensuring that the socioeconomic potential is maximized and shared across communities, thereby fostering long-term sustainable development.

2. Methodology

To measure the impact of mining on the socioeconomic indicators (income and education) of the population of the Puno region, the following econometric model is formulated for panel data [37]:
y i t = β 0 + β 1 D i t + β 2 T i t + δ D T i t + u i + e i t           i = 1 , , 110 ;           t = 1 , 2
where i denotes the district and t the time (year), is the dependent variable (income or education); D is a dichotomous variable that takes the value of 1 if the district is a producer of metallic minerals (treatment group) and 0 otherwise (control group); T takes the value 0 in the year 2003 (before) and 1 in the year 2019 (after); and DT is the interaction variable between D and T, and they are the random error terms. Finally, β 0 , β 1 , β 2 and δ are the parameters to be estimated.
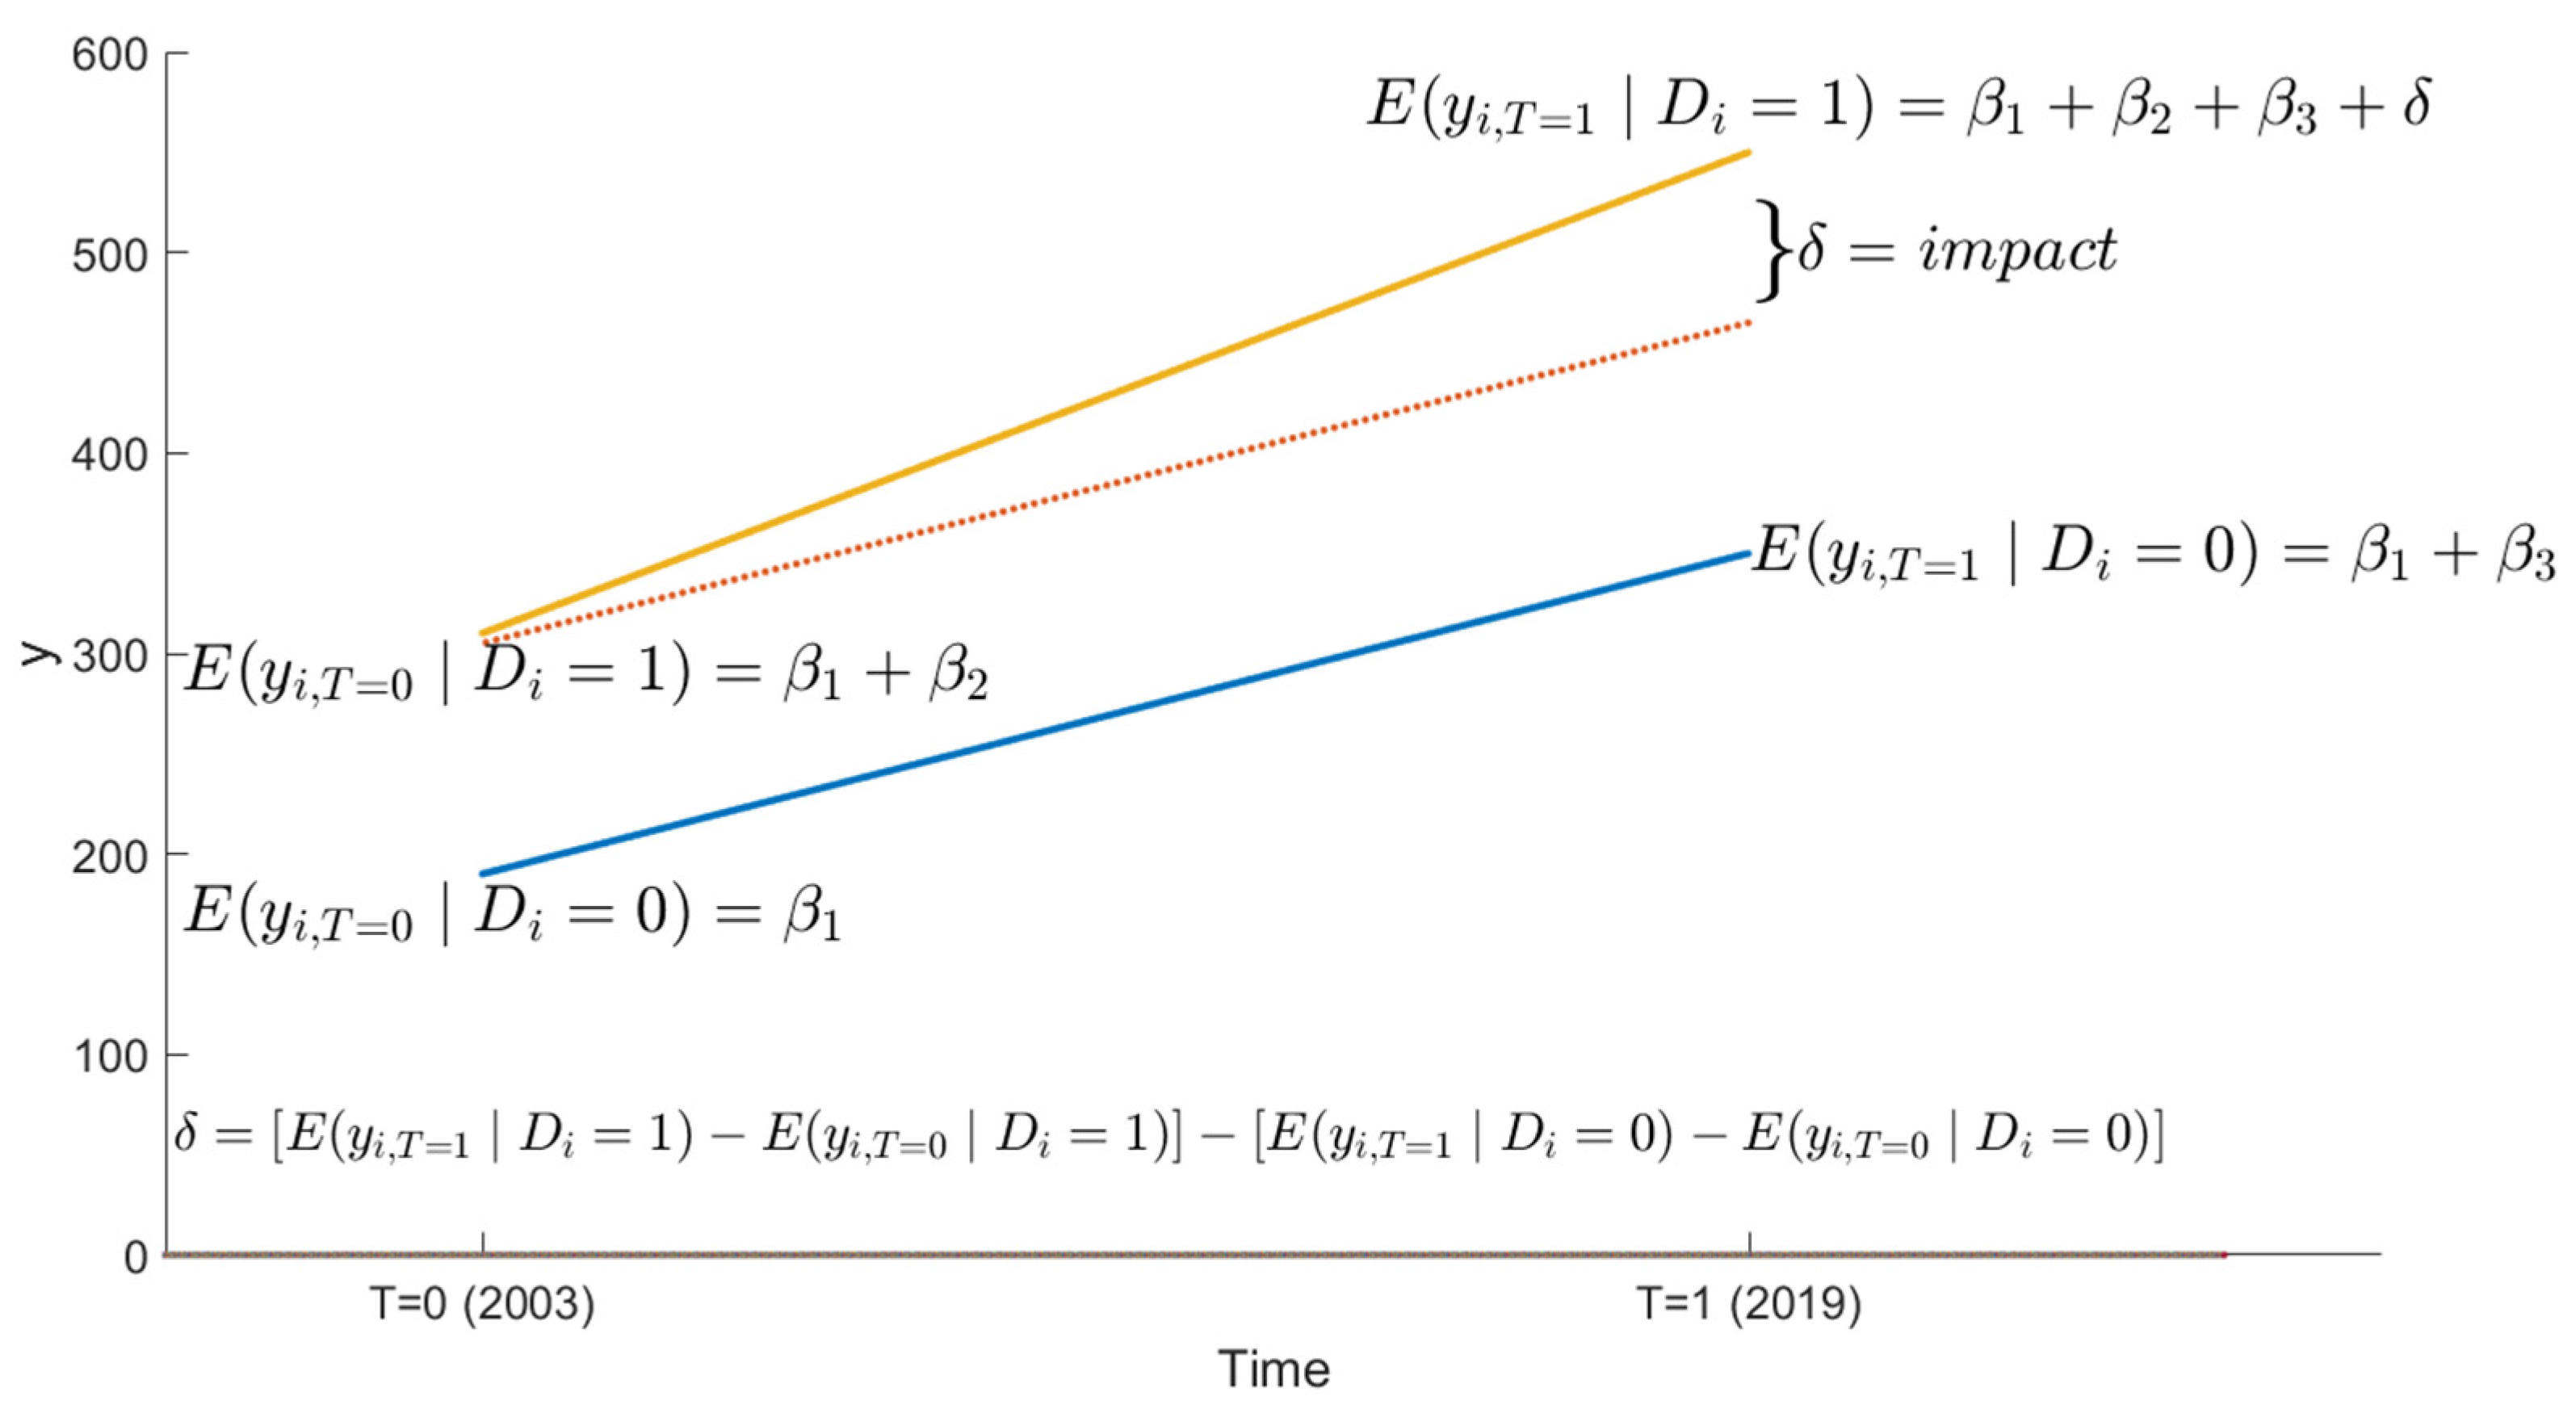
The parameter δ in Equation (1) measures the impact of the mining company on some socioeconomic indicators (for example, income or education) between two periods, as illustrated in Figure 4, Figure 5 and Figure 6. If denoted by E y i , T = 0 D i = 0 and E y i , T = 0 D i = 1 the expected per capita family income of the control group ( D i = 0 ) and of the treatment group ( D i = 1 ), respectively, in the period T i = 0 ; and by E y i , T = 1 D i = 0 and E y i , T = 1 D i = 1 the expected per capita family income of the control group ( D i = 0 ) and treatment group ( D i = 1 ) in the period T i = 1 . The impact of the program by the difference-in-differences method [38] results in the following:
δ d i f d i f = E ( y i , T = 1 D i = 1 ) E ( y i , T = 0 D i = 1 ) E ( y i , T = 1 D i = 0 ) E ( y i , T = 0 D i = 0 )

2.1. Random Effects Panel Data Model

The use of panel data in the study of the socioeconomic impacts of mining in the Puno region is justified for several methodological reasons that enhance the accuracy and understanding of the phenomenon. Firstly, panel data allow for the analysis of temporal and spatial variability, facilitating the study of how socioeconomic indicators such as per capita income, education rates, and the Human Development Index (HDI) evolve over time across different districts in Puno [1]. Furthermore, this approach enables control over unobservable effects specific to each district, such as geographical or social characteristics, which could influence the results, thereby reducing bias present in studies with cross-sectional data [2]. Another key aspect is that panel data allow for the examination of the dynamic effects of mining, observing how impacts on income and human development vary over time [3]. The ability to capture both variability between districts and temporal variability within the same district increases the efficiency and accuracy of estimates, improving the robustness of the analysis [4]. Finally, the use of this approach facilitates a more thorough analysis of public policies implemented in response to mining impacts, allowing for the evaluation of their effectiveness over time and in different contexts [3]. Thus, the use of panel data not only optimizes the quality of the analysis but also provides a more comprehensive and accurate understanding of the socioeconomic impacts of mining in the region.
With the purpose of measuring the direct and indirect impacts of mining on socioeconomic indicators, the following econometric model is proposed (2):
y i t = β 1 + β 2 D 1 i t + β 3 D 2 i t + γ T i t + δ 1 ( D 1 T ) i t + δ 2 ( D 2 T ) i t + δ 1 W ( D 1 T W ) i t +                   δ 2 W ( D 2 T W ) i t + γ t + u i + e i t                                                           e i t = λ W e i t + v i t

2.2. Random Effects Panel Data Model

The equation is adjusted to account for the fact that the unobserved effects are random and vary across the units of observation (in contrast to fixed effects, where the unobserved effects are constant for each unit). The econometric model assumes that area-level effects are random rather than fixed to account for unobserved factors influencing socioeconomic outcomes that vary across districts but remain constant over time. This approach allows for greater flexibility in capturing the heterogeneity between districts, considering that each district may have unique, time-invariant characteristics such as local culture, geography, or regional policies. By treating these effects as random, the model can accommodate district-level variability and provide more efficient estimates, as long as the random effects are uncorrelated with explanatory variables. In contrast, fixed effects would assume these unobserved characteristics are constant for each district, limiting the model’s ability to capture diverse and dynamic influences on socioeconomic outcomes. The use of a spatial autocorrelation matrix based on contiguity (where wij = 1 for neighboring districts) helps capture the direct influence between districts sharing a geographical boundary. This is particularly important in cases like mining activities, where their impact on one district can spill over to neighboring districts due to proximity. For instance, mining districts may drive demand for labor, infrastructure, or services that benefit nearby areas through migration or development. A contiguity matrix enables the model to consider how the socioeconomic outcomes of one district (e.g., per capita income, human development) are influenced by neighboring districts. This method is valuable in regional studies, such as in Puno, where geographic proximity and economic and social interdependencies shape the spatial interactions between districts.
yit is the dependent variable for unit i in period t (for example, family income per capita, the percentage of the population with secondary education, or HDI), γt is the time effect (or year effect), capturing any changes common to all units (districts) in the same period, ui is the random effect specific to unit ii, representing unobserved characteristics that are random and vary between districts, but are constant over time for each unit, eit is the error term capturing random fluctuations not explained by the model’s variables, vit is also the error term, and D1 is a binary variable that takes the value of 1 if the district is mining and 0 if the district is non-mining. This variable is crucial as it allows us to estimate the direct impact of mining activities on socioeconomic outcomes, such as income, human development, and educational levels in mining districts. D2 is a binary variable that takes the value of 1 if the non-mining district is within the jurisdiction of a mining province and 0 otherwise. This variable captures the indirect effects of mining, considering the collateral benefits that non-mining districts may experience due to their proximity to mining activities (e.g., access to services, infrastructure development, or labor migration from mining areas). T is a time dummy variable that takes the value of 0 if the data correspond to the year 2003 and 1 if it corresponds to the year 2019. This variable is included to capture temporal effects and trends in the data over time, reflecting the evolving impact of mining on socioeconomic indicators as the industry develops or policies change.
W = w 11 w 12 w 13 w 1 , 110 w 21 w 22 w 23 w 2 , 110 w 31 w 32 w 33 w 3 , 110 w 110 , 1 w 110 , 2 w 110 , 3 w 110 , 110
It is a crucial tool in spatial econometric models, as it captures the relationship between districts within a specific geographic area, in this case, the 110 districts of the Puno region. The purpose of this matrix is to account for spatial dependencies, meaning that events or behaviors in one district can influence neighboring districts due to geographic or economic proximity. In the context of this study, the matrix W is used to adjust the econometric model so that correlations between neighboring districts—whether economic, social, or environmental—are considered when estimating the impacts of mining on socioeconomic indicators such as per capita income, human development, and education. Each element wij of the matrix represents the spatial relationship between district ii and district jj. If wij = 1, it means that districts i and j are neighbors, i.e., they share a physical border or are geographically close enough to be considered interrelated. If wij = 0, the districts are not neighbors. This binary relationship, where only 1 or 0 is considered, is useful for measuring the direct influence of one district on another, suggesting that the economic activity (such as mining) in one district can extend to adjacent districts. In this type of matrix, the rows and columns represent all the districts in the region, and the matrix W is of size 110 × 110, as there are 110 districts in Puno. The spatial interactions reflected in the matrix allow the econometric model to account for “contiguity” or proximity between districts, adjusting the estimates to reflect how economic activities in one district can have indirect effects on neighboring districts. For instance, a mining district may generate a demand for labor, services, or infrastructure that affects neighboring districts, which is captured in the matrix W. λ is the spatial autocorrelation parameter of the errors, and they are error terms of the model, the parameter δ 1 is the interaction coefficient between T and D1, which measures the impact of mining on the socioeconomic indicator (per capita income, education, and HDI), the parameter δ 2 measures the direct impact of mining on the non-mining district, the parameter δ 1 w measures the indirect impact of mining on the district mining district, and δ 2 w measures the indirect impact of mining on the non-mining district. In the context of the Puno region, “non-mining areas” refers to those districts where there is no mining activity at all. These areas either lack exploitable mineral resources, have environmental restrictions protecting sensitive ecosystems, or prioritize other economic activities such as agriculture, livestock, and tourism. Some of these districts do not have the necessary infrastructure for mining projects, and in other cases, local communities have actively rejected mining due to its environmental and health impacts. This distinction is important, as it suggests that the indirect effects of mining, such as economic spillovers or environmental degradation, are not experienced in these areas. Therefore, the interpretation of indirect effects needs to consider the absence of mining activity in these districts.
The proposed econometric model for measuring the direct and indirect impacts of mining on socioeconomic indicators is a complex yet essential framework for understanding the multifaceted effects of mining activities on local economies. The model incorporates several key variables, including D1, D2, T, W, and the interaction coefficients, which collectively allow for a nuanced analysis of how mining influences socioeconomic indicators such as per capita income, education, and the Human Development Index (HDI). To begin with, the variable D1, which indicates whether a district is mining or non-mining, serves as a fundamental binary classification that allows researchers to differentiate between the socioeconomic conditions prevalent in mining districts versus non-mining districts. This distinction is crucial, as mining activities can lead to significant economic transformations in the regions where they occur. For instance, highlight that mining plays a pivotal role in national economies by contributing to GDP, employment, and infrastructure development, thereby influencing various socioeconomic indicators [41]. Furthermore, the presence of mining can create a ripple effect, impacting not only the immediate mining district but also surrounding areas, as indicated by the variable D2, which captures the influence of mining on non-mining districts within the same province [42].
The temporal variable T, which differentiates between data from 2003 and 2019, is particularly important for assessing changes over time. The socioeconomic impacts of mining are often dynamic, evolving as mining operations expand or contract, and as local economies adapt to these changes. For example, studies have shown that the economic benefits of mining can lead to increased public investment in education and health services, which in turn can enhance the HDI and per capita income in both mining and non-mining districts [43,44]. The interaction coefficient between T and D1 is critical for measuring the specific impact of mining over time, allowing researchers to capture trends and shifts in socioeconomic indicators directly attributable to mining activities. Moreover, the inclusion of a spatial autocorrelation matrix W acknowledges the interconnectedness of socioeconomic conditions across geographic boundaries. Spatial econometrics has become increasingly relevant in understanding how local economic activities, such as mining, can influence neighboring regions. The importance of spatial dependence in socioeconomic data suggests that mining activities in one district can have spillover effects on adjacent areas, affecting employment rates, income levels, and educational outcomes [45,46]. This spatial dimension is essential for accurately modeling the indirect impacts of mining, as it recognizes that socioeconomic changes do not occur in isolation but are influenced by broader regional dynamics. The parameters measuring the direct and indirect impacts of mining on socioeconomic indicators are also vital for understanding the full scope of mining’s effects. The direct impact parameter quantifies the immediate benefits of mining activities on the local economy, such as job creation and income generation. In contrast, the indirect impact parameters assess how these benefits extend to non-mining districts, highlighting the broader economic interdependencies that exist within mining provinces. Research has shown that mining can stimulate local economies by increasing demand for goods and services, thereby benefiting non-mining sectors as well [47]. This interconnectedness underscores the necessity of employing a comprehensive econometric model that captures both direct and indirect effects. In conclusion, the proposed econometric model provides a robust framework for analyzing the socioeconomic impacts of mining. By incorporating variables that account for both direct and indirect effects, as well as spatial dependencies and temporal changes, the model enables a thorough examination of how mining influences key socioeconomic indicators. The insights gained from such analyses are critical for policymakers and stakeholders seeking to understand the complex relationship between mining activities and local economic development. As the mining sector continues to evolve, ongoing research utilizing this model will be essential for informing sustainable development practices and maximizing the benefits of mining for local communities.

3. Data

For the impact analysis, UNDP data for the years 2003 and 2019 are used for 110 districts of the Puno region (Table 1) shows the descriptive statistics of the variable data used in the impact measurement.
Table 1 provides descriptive statistics to measure the impact of mining between 2003 and 2019. The data reveal several key trends:
The average family income per capita increased significantly from PEN 214 in 2003 to PEN 347 in 2019. However, the disparity between the minimum and maximum values widened considerably, indicating that while some districts saw substantial income growth, others lagged behind or even experienced declines.
The percentage of the 18-year-old population with completed secondary education improved from 54% in 2003 to 68% in 2019. Moreover, the gap between the maximum and minimum values decreased, suggesting a more equitable distribution of educational attainment across districts.
Finally, the average years of education for the population aged 25 and older showed only a modest increase, from 5.3 years in 2003 to 6.4 years in 2019. This indicates some progress in educational attainment, though it remains relatively low.
In summary, while there have been positive changes in income and education levels, the data also highlight growing inequality in income distribution and only modest improvements in the overall educational level of the population.

4. Results and Discussion

4.1. Impact of Mining on Socioeconomic Indicators in the Long Term: 2003–2029

The results obtained through the panel data method with random effects, using data from 110 districts of the Puno region for the years 2003 and 2019 and (Table 2) (for the estimation of the results, Stata 18 https://www.stata.com/ (accessed on 15 May 2023) software was use), show the following results. Firstly, in relation to the impact of mining on per capita income, the results show that there is a positive impact of PEN 239.44 in favor of the metal mining-producing districts (column 1 of Table 2). Secondly, there is a positive impact of 12.27 points of mining on the percentage of the 18-year-old population with secondary education (column 2 of Table 2) and an increase of 0.09 points on the HDI (column 3 of Table 2).
The significant spatial lag terms indicate that there is a strong spatial dependence for the percentage of the 18-year-old population with secondary education and a moderate spatial dependence for the Human Development Index (HDI). Specifically, the positive and significant coefficient for the spatial lag in education (0.46, p = 0.005) suggests that improvements in secondary education attainment in one district are associated with similar improvements in neighboring districts. Similarly, the HDI exhibits a weaker but still notable spatial dependence (0.31, p = 0.064), indicating that higher human development in one district tends to spill over to adjacent areas. In contrast, no significant spatial dependence is found for family income per capita, implying that income levels are more localized and less influenced by neighboring districts in the short term.
Impact on Family Income per Capita. Mining activities resulted in a significant increase of PEN 239.44 in family income per capita in mining districts. This effect is statistically significant (p < 0.001), emphasizing the strong economic benefits of mining in these areas. Non-mining Districts within Mining Provinces: These districts also saw a significant positive impact, with an increase of PEN 352.30 in family income per capita, showing that mining activities generate notable spillover effects into surrounding non-mining areas (p < 0.001).
Impact on Secondary Education (percentage of 18-year-olds with secondary education). The direct effect of mining in these districts led to an increase of 12.27 percentage points in the proportion of 18-year-olds with secondary education (p < 0.05), suggesting that mining activities contribute to improved educational outcomes, possibly through increased funding or local demand for a more educated workforce. Non-mining Districts within Mining Provinces: These districts experienced a more modest increase of 9.71 percentage points in secondary education, suggesting that mining indirectly influences education levels even in areas not directly involved in the industry (p < 0.05).
Impact on the Human Development Index (HDI). Mining Districts: Mining had a positive impact on the HDI of mining districts, with an increase of 0.09 points (p < 0.01), highlighting improvements in overall human development, possibly related to higher incomes and better access to education and services. Non-mining Districts within Mining Provinces: The HDI in non-mining districts also showed an improvement of 0.08 points (p < 0.001), reinforcing the idea that mining’s economic activities lead to broader development benefits in the region.
Total Impact of Mining in mining districts: The total impact of mining in these districts, considering both direct and indirect effects, resulted in an increase of PEN 211.37 in family income per capita and an improvement of 0.10 points in the HDI. While these effects are still significant, they are somewhat less pronounced than the direct effects of mining activities. Non-mining Districts: The total impact of mining in non-mining districts within mining provinces resulted in an increase of PEN 248.83 in family income per capita, a rise of 10.14 percentage points in the percentage of 18-year-olds with secondary education, and an improvement of 0.10 points in the HDI. These total impacts suggest that non-mining districts benefit significantly from mining activities in neighboring districts, particularly in terms of income and education.
Mining activities in the Puno region have significant positive effects on the socioeconomic indicators of both mining and non-mining districts, with a particularly strong impact on family income. The positive spillover effects of mining on non-mining districts, in terms of income, education, and development, underscore the broader benefits of mining for the regional economy and social well-being. The findings highlight the importance of mining not only as a direct economic driver in mining districts but also as a catalyst for economic and social improvements in surrounding areas.
The coefficient for mining districts (D1) indicates that, on average, mining areas tend to have lower per capita income, with a value of −5.97 for family income per capita. This suggests that, without accounting for the effects of time or spatial factors, mining districts exhibit a lower income level compared to non-mining districts. Similarly, the coefficient of −10.09 for the percentage of 18-year-olds with secondary education indicates that mining districts have a lower percentage of educated youth, with 10.09% fewer 18-year-olds completing secondary education compared to their non-mining counterparts. The coefficient for the HDI is −0.01, suggesting that mining districts have minimal improvements in human development compared to non-mining districts when time and spatial effects are controlled.
The coefficient for non-mining districts within mining provinces shows slightly better socioeconomic outcomes than mining districts but still worse than non-mining districts outside mining provinces. For example, the coefficient of −1.72 for family income per capita implies that non-mining districts in mining provinces have a slightly lower per capita income than districts outside mining areas. Similarly, the coefficient of −8.67 for the percentage of 18-year-olds with secondary education indicates a modest decrease in the proportion of educated youth in non-mining districts within mining provinces. The HDI coefficient of −0.01 shows no significant impact on human development in these districts.
The year variable represents the time trend across the data. The positive coefficients for the year variable reflect an upward trend in all indicators over time. Specifically, the coefficient of 25.51 for family income per capita suggests an annual increase in income, while the coefficient of 9.71 for the percentage of 18-year-olds with secondary education shows that education levels have improved over time. The coefficient of 0.03 for the HDI indicates a gradual improvement in human development across the study period. These results suggest that broader socioeconomic changes over time have led to improvements in income, education, and human development.
The interaction term for mining districts and time (D1T) indicates a significant positive impact of mining on socioeconomic indicators over time. For family income per capita, the coefficient of 239.44 shows that mining districts experience substantial income growth due to mining activities. Similarly, the coefficient of 12.27 for the percentage of 18-year-olds with secondary education suggests that mining districts see an increase in educational attainment over time. The coefficient of 0.09 for the HDI suggests significant improvements in human development in mining districts due to the ongoing effects of mining, showing the positive role of mining in boosting socioeconomic outcomes.
For non-mining districts within mining provinces, the interaction term (D2T) reveals less pronounced effects. The coefficient of −26.34 for family income per capita indicates a slight negative effect on income in these districts, suggesting that while mining areas may benefit economically, non-mining districts within mining provinces experience a modest decline. However, the positive coefficients for the percentage of 18-year-olds with secondary education (9.71) and for the HDI (0.02) imply that mining activity indirectly boosts educational outcomes and human development in non-mining districts, albeit to a lesser extent compared to mining districts.
The coefficient for the indirect effect of mining on mining districts (D1TW) shows a negative impact on socioeconomic outcomes. The coefficient of −35.93 for family income per capita indicates that while mining districts may benefit from mining, the indirect spatial effects reduce these benefits, potentially due to externalities such as inflation, resource depletion, or environmental degradation. Similarly, the coefficients for education (−3.47) and for the HDI (0.003) suggest that indirect effects from neighboring areas or broader regional factors negatively affect education and human development in mining districts. The indirect effects on non-mining districts within mining provinces (D2TW) show positive impacts, especially in terms of income and human development. The coefficient of 352.30 for family income per capita indicates a substantial positive impact from mining activities on income in non-mining districts. The positive coefficients for education (0.79) and the HDI (0.08) indicate that non-mining districts in mining provinces benefit from the spillover effects of mining, particularly in improving educational outcomes and human development indicators. These results highlight the indirect positive influence of mining on socioeconomic indicators in surrounding districts.
Although incomes in mining areas such as the Puno region have increased due to mining activities, inequality has also risen, which calls for a deeper reflection on how the benefits of mining are distributed. Primarily, the largest beneficiaries are the large mining companies, which control the extraction of valuable resources. While they contribute through taxes and royalties, most of their profits are not reinvested directly into the region. Formal mining workers do benefit from relatively higher wages than the local average, but the number of available jobs is limited, meaning not all residents benefit equally. Additionally, artisanal miners, who make up a significant portion of the population, receive fewer benefits due to the informality of their work, leaving them outside social protections and improvements in working conditions. Local communities, on the other hand, experience some indirect benefits, such as improved infrastructure, but these are limited and do not reach all rural areas of the region. To achieve a more equitable distribution of benefits, it is essential to formalize artisanal mining, ensure transparency in the allocation of resources generated by mining, promote economic diversification to reduce dependence on mining, and ensure that local communities are actively involved in decision-making about the use of these resources. Additionally, strengthening local content policies, which encourage mining companies to source goods and services from the region, can create more economic opportunities for local residents, thus contributing to a fairer distribution of benefits.

4.2. Impact of Mining on Socioeconomic Indicators in the Short Term: 2015–2019

The impact of mining on socioeconomic indicators in the short term (2015–2019) (Table 3) shows differentiated effects both in mining districts and in non-mining districts within provinces where mining activities take place. The data reveal how mining influences key variables such as family income per capita, secondary education, and the Human Development Index (HDI), reflecting both direct and indirect effects.
The direct impact of mining on family income in mining districts shows a significant increase of 65.03 units. This result is highly significant (p < 0.001), indicating that mining has a strong and positive economic effect in these areas. This effect can be explained by the increased local economic activity driven by mining: job creation in resource extraction, the establishment of supporting businesses (such as stores, restaurants, services, transportation), and increased public and private investment in local infrastructure. All these factors contribute to higher purchasing power for families in mining areas.
The indirect impact on family income in non-mining districts shows an increase of 80.59 units. This impact is also highly significant (p < 0.001), highlighting that the benefits of mining extend beyond the areas directly involved in mineral extraction and also positively affect neighboring communities. This can be explained by various indirect factors, such as job creation in sectors not directly linked to mining but necessary to support mining activities (like suppliers of goods and services), the increased local demand for products and services, or even tourism and trade spurred by the presence of mining workers.
The total impact on family income in mining districts, considering both direct and indirect effects, is an increase of 57.75 units. This result is highly significant (p < 0.001), reinforcing the idea that mining has a broadly positive impact on the local economy. While the direct impact (65.03 units) is greater, the indirect effects contribute to a significant overall impact. This suggests that while the direct income increase is important, the broader economic growth generated by mining also benefits families through enhanced economic opportunities, even outside direct mining jobs. The total impact on family income in non-mining districts is an increase of 79.06 units, which is significant (p < 0.001) and demonstrates that even areas not directly involved in mining benefit from it.
This value is relatively close to the direct impact seen in mining districts, suggesting that the indirect benefits of mining are robust and have a significant effect on neighboring areas. These impacts may result from increased public investment due to mining revenues, which could include infrastructure like roads, hospitals, schools, and other services. Additionally, the expansion of the labor market in mining districts likely creates demand for services and products in non-mining districts.
The direct impact of mining on secondary education in mining districts shows an increase of 6.74 percentage points in the proportion of 18-year-olds with secondary education. This result is significant (p < 0.05) and suggests that mining has a positive indirect effect on education, possibly through increased resources or educational programs in these areas. This increase could be due to greater resources available in mining areas, which allow for improved access to educational programs, scholarships, and initiatives that promote continued education. Additionally, there may be a rise in demand for technical or vocational education related to mining, which increases graduation rates among youth.
The direct impact on secondary education in non-mining districts shows an increase of 5.19 percentage points. This result is also significant (p < 0.05), indicating that, although these districts are not directly involved in mining, they benefit from the educational effects of mining’s indirect influences. This could be related to increased resources or educational programs triggered by the economic dynamics generated by mining in neighboring areas. Moreover, the improvement in family incomes in non-mining districts could enable more families to afford secondary education for their children.
The direct impact on the Human Development Index (HDI) in mining districts shows an increase of 0.022 points. This increase is small but significant (p < 0.05), suggesting that mining has a positive, albeit modest, effect on human development in these areas.
This small increase could be related to improvements in income and education, which are key components of the HDI. However, the positive impact on the HDI might be counterbalanced by other negative factors associated with mining, such as environmental degradation or community displacement.
The total impact on the HDI in mining districts is an increase of 0.03 points, which also suggests a slight positive effect, although small (p < 0.05). This finding indicates that, overall, the effects of mining are slightly positive for human development in these areas, but the impact is limited compared to other factors that influence the HDI, such as health or quality of life.
Finally, the total impact on the HDI in non-mining districts shows an increase of 0.003 points, which is statistically significant (p < 0.001), although very small. This impact suggests that, while non-mining districts are not directly involved in mining, they still benefit from the indirect effects of mining, such as improvements in infrastructure, services, and overall quality of life.
The results suggest that mining has a significant positive impact on mining districts, both in terms of income, education, and human development, although the effects on the HDI are modest. What is most notable is that non-mining districts also benefit significantly from mining, particularly in terms of income and education, reflecting the indirect effects that mining has beyond the areas directly involved in extraction. This demonstrates that mining generates economic and social spillover effects, benefiting the broader region, including areas that are not directly involved in mining operations.
In a similar study, Loayza & Rigolini [11] show that mining districts in Peru have higher levels of per capita consumption compared to similar districts. Likewise, it showed that the positive impacts decrease drastically with the administrative and geographical distance from mining centers. On the other hand, Mancini & Sala [48] show that the positive impact of mining is mainly in monetary income and employment; on the negative side, the impacts are related to the use of the land, the environmental impacts, and the impacts on human health and human rights.
The results obtained from the panel data analysis using random effects for 110 districts in the Puno region between 2003 and 2019 reveal significant positive impacts of mining activities on various socioeconomic indicators, including per capita income, educational attainment, and the Human Development Index (HDI). Specifically, mining districts experienced an increase of PEN 239.44 in family per capita income, a rise of 12.27 percentage points in the proportion of the 18-year-old population with secondary education, and an enhancement of 0.09 points in the HDI. These findings corroborate previous studies that have documented the economic benefits associated with mining activities, particularly in resource-rich regions.
The positive impact of mining on per capita income is particularly noteworthy, as it suggests that mining activities can serve as a catalyst for economic growth in the Puno region. This is consistent with the findings of Loayza and Rigolini [11], who demonstrated that mining districts in Peru exhibit higher levels of per capita consumption compared to similar districts. The increase in income can be attributed to the direct economic benefits derived from mining operations, including job creation and increased local spending. However, it is essential to consider the broader implications of these findings, particularly regarding income inequality and the distribution of benefits among different socioeconomic groups [49].
Moreover, the results indicate that non-mining districts within mining provinces also experienced significant benefits, with an increase of PEN 352.30 in per capita income. This suggests the presence of positive externalities or spillover effects from mining activities, which can enhance the economic conditions of surrounding areas. Such findings align with the work of Mancini and Sala [48], who highlighted that while mining contributes positively to monetary income and employment, it may also lead to negative consequences related to land use and environmental degradation. Therefore, while the economic benefits of mining are evident, it is crucial to balance these with sustainable practices to mitigate adverse effects on local communities and ecosystems [35].
In terms of educational attainment, the observed increase of 12.27 percentage points in the percentage of the 18-year-old population with secondary education in mining districts is significant. This finding suggests that mining activities may contribute to improved educational outcomes, potentially due to increased household incomes that allow families to invest more in education. However, it is important to note that the study did not find a corresponding increase in educational attainment for the population aged 25 years and older. This discrepancy may indicate that while mining activities can enhance educational opportunities for younger generations, they may also create economic pressures that discourage older individuals from pursuing further education [50].
The relationship between mining and education is complex, as evidenced by the findings of Yamada, Molina, and Velásquez [51], who noted that resource booms can slow the accumulation of human capital by increasing the opportunity cost of education. This phenomenon may be particularly pronounced in mining regions, where lucrative job opportunities in the mining sector can divert young individuals from pursuing higher education. Similarly, Bishop [52] highlighted that mining booms in Australia led to increased wages for lower-skilled jobs, raising the opportunity cost of education for many young people. Therefore, while mining may provide immediate economic benefits, it is essential to consider its long-term implications for human capital development [7].
The increase in the HDI by 0.09 points in mining districts further underscores the positive impacts of mining on socioeconomic development. The HDI is a composite measure that reflects not only income but also education and health outcomes. The observed increase suggests that mining activities may contribute to overall improvements in living standards. However, it is crucial to recognize that HDI improvements can be influenced by various factors, including government policies, healthcare access, and community development initiatives. Thus, while mining can play a role in enhancing the HDI, it should be part of a broader strategy aimed at sustainable development [8].
The total impact of mining activities, which includes both direct and indirect effects, reveals a nuanced picture of socioeconomic development in the Puno region. The total impact on mining districts resulted in an increase of PEN 211.37 in per capita income and an improvement of 0.10 points in the HDI. In non-mining districts within mining provinces, the total impact led to an increase of PEN 248.83 in per capita income, a rise of 10.14 percentage points in the percentage of the population with secondary education, and an enhancement of 0.10 points in the HDI. These findings suggest that mining activities can generate substantial positive externalities that benefit not only the mining districts but also the surrounding areas [8].
However, it is essential to approach these findings with caution, as the positive impacts of mining can be accompanied by significant challenges. Environmental degradation, social disruption, and the potential for increased inequality are critical issues that must be addressed to ensure that the benefits of mining are equitably distributed. The work of Sher [53] highlights the potential negative consequences of mining on educational attainment, particularly in regions where mining employment is prevalent. This underscores the importance of implementing policies that promote sustainable mining practices and support community development initiatives [35].
In relation to education, in this study, a positive impact was found on the increase in the population aged 18 with completed secondary school and not on the years of education of the population 25 years of age and older; these results are consistent with the findings of Yamada et al. [51] that show the causal relationship between natural resources and the accumulation of human capital during the mining resources boom (2004–2006). The authors point out that booms slow down the process of human capital accumulation by increasing the opportunity cost of studying and show that the Peruvian mining boom had a positive impact on the probability of postsecondary school interruption. In addition, the likelihood of young individuals remaining inactive increased. Along the same lines, Bichop [52] shows that mining in Australia during the mining boom led to large increases in wages for many lower-skilled jobs in mining regions, raising the opportunity cost of staying in school or university for many students, particularly 15–24-year-olds and those in mining areas [52]. For their part, Ahlerup et al. [54], combining Afrobarometer survey data with geocoded data on the discovery and closure dates of gold mines in Africa, show that, in districts with a gold mine, adolescents have a significantly lower educational level, which suggests that households make shortsighted educational decisions when gold mining employment is an alternative. In countries where small-scale and artisanal mining predominate, at least one child from each household participates in mining due to poverty [55].
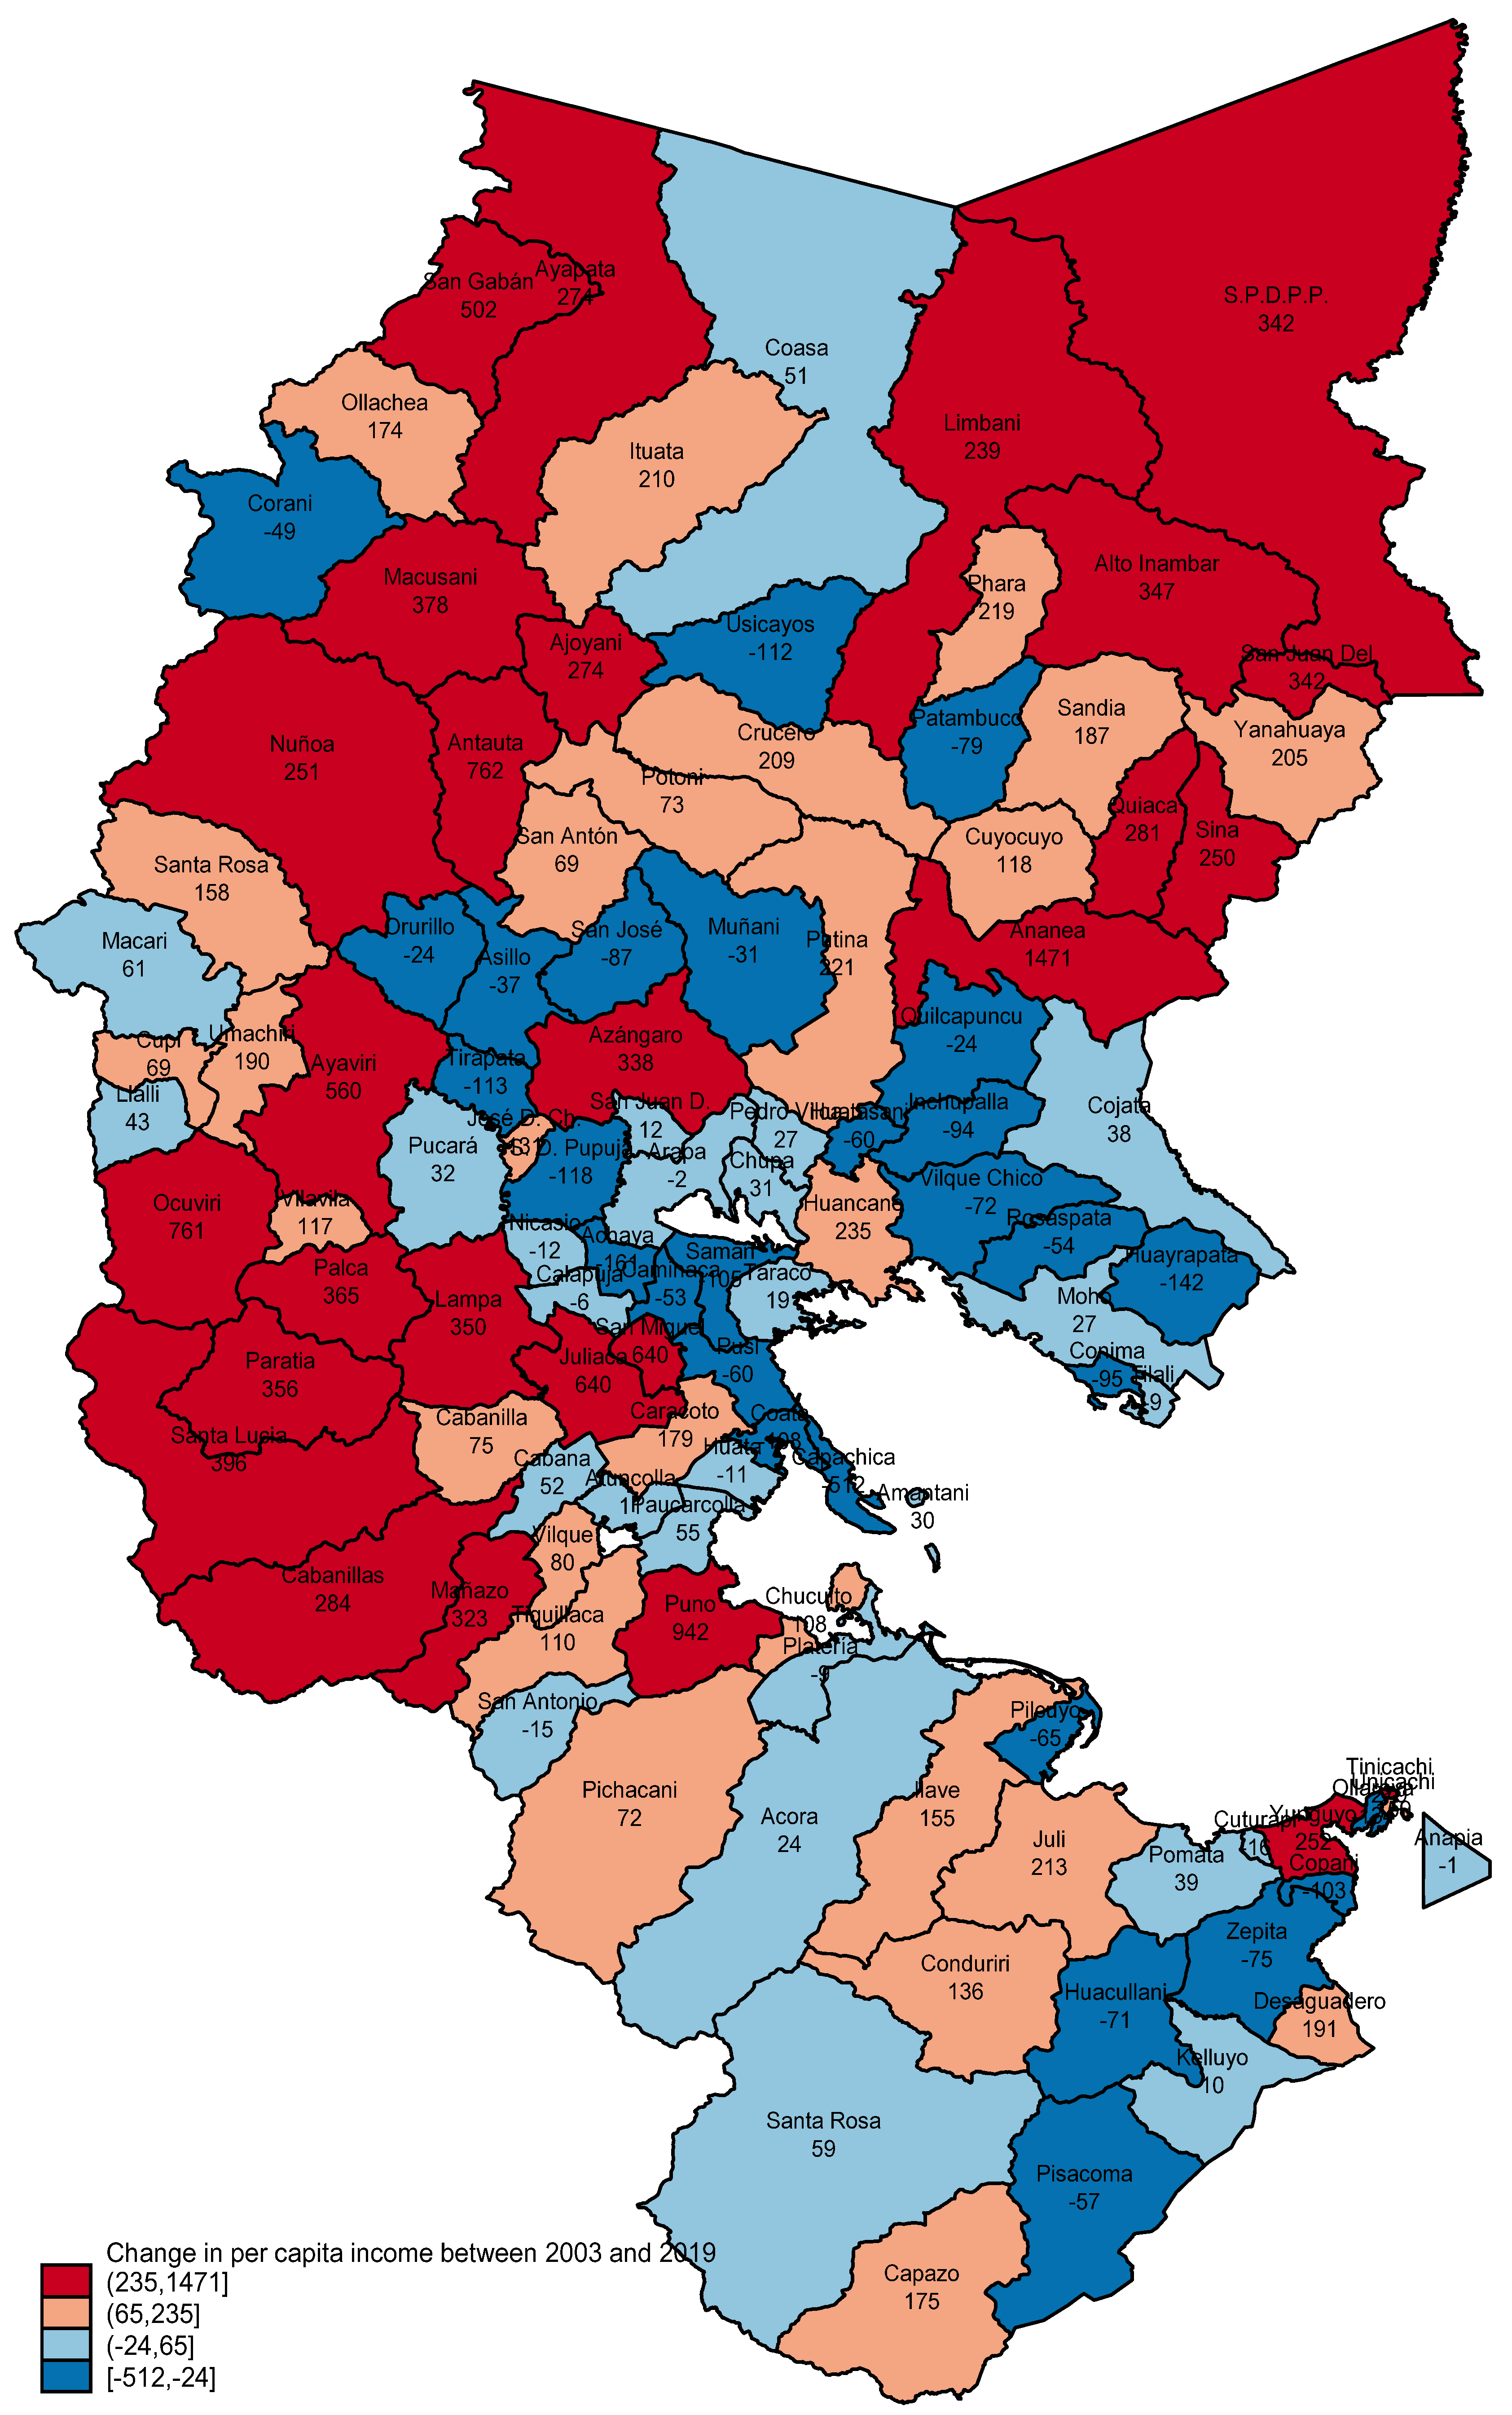
Of 110 districts analyzed in the Puno region, 24.55% are in stratum 1, which have improved the level of per capita income between PEN 235 and 1471. Most of these districts are mineral producers; some districts such as Juliaca, Puno, and Azángaro have a higher population density and trade predominates. In stratum 2, there are 25.45% of the districts, which have improved per capita income between PEN 65 and 235; in these districts, the agricultural sector predominates and to a lesser extent commerce. In strata 3 and 4, there are 50% of the districts whose income levels have been maintained and even decreased between 2003 and 2019; in these districts, the agricultural sector predominates strongly (Table 4 Figure 7).
The analysis of per capita income variation across 110 districts in the Puno region between 2003 and 2019 reveals significant disparities in socioeconomic outcomes, particularly influenced by the presence of mining activities. The data indicate that 24.55% of the districts fall into stratum 1, where per capita income increased between PEN 235 and 1471, predominantly in mining districts. This suggests that mining activities have a substantial positive impact on local economies, particularly in areas where mineral extraction is a primary economic driver. Districts such as Juliaca, Puno, and Azángaro, characterized by higher population densities and active trade sectors, exemplify this trend, highlighting the interconnectedness of mining and urban economic activities [56].
In contrast, stratum 2, which includes 25.45% of districts, shows a more modest increase in per capita income, ranging from PEN 65 to 235, with agriculture and trade being the predominant sectors. This indicates that while mining significantly boosts income in certain areas, other districts still rely heavily on traditional sectors, which may not experience the same level of economic growth. The findings underscore the importance of diversifying economic activities beyond mining to ensure broader regional development and mitigate the risks associated with over-reliance on a single industry [57].
Strata 3 and 4, which encompass 50% of the districts, reveal concerning trends where income levels have stagnated or even decreased between 2003 and 2019. These districts are primarily agricultural, suggesting that the benefits of mining have not permeated all areas of the Puno region. The predominance of agriculture in these strata raises questions about the sustainability of income levels and the potential for economic vulnerability in the face of external shocks, such as climate change or fluctuations in commodity prices. This situation aligns with the resource curse theory, which posits that regions rich in natural resources may experience slower economic growth and poorer development outcomes due to factors such as corruption, conflict, and neglect of other sectors [58].
The observed variations in per capita income also reflect broader socioeconomic inequalities within the Puno region. The concentration of income growth in mining districts raises concerns about income disparity and social cohesion. As mining activities generate wealth, it is crucial to ensure that the benefits are equitably distributed among the population to prevent exacerbating existing inequalities. This is particularly relevant in the context of the findings by Mancini and Sal [48], which highlight the dual nature of mining’s impact—while it can enhance monetary income and employment, it may also lead to negative consequences such as environmental degradation and social disruption [59].
Furthermore, the data indicate that the positive impacts of mining are not uniformly experienced across all districts. The significant income increases in mining districts contrast sharply with the stagnation or decline in income levels in non-mining areas. This disparity suggests the presence of spillover effects from mining activities that benefit surrounding districts, yet it also points to the need for targeted interventions to support those areas lagging in economic development. Policymakers must consider strategies that promote inclusive growth, ensuring that the economic benefits of mining extend beyond the immediate vicinity of mining operations [60].
In terms of educational outcomes, the positive impact of mining on the percentage of the 18-year-old population with secondary education is noteworthy. The increase of 12.27 percentage points in mining districts suggests that higher incomes may facilitate greater access to education. However, it is essential to contextualize these findings within the broader educational landscape. The lack of significant improvements in educational attainment for the population aged 25 years and older raises concerns about the long-term implications of mining on human capital development. The opportunity costs associated with mining employment may deter older individuals from pursuing further education [61].
Moreover, the findings indicate that while mining can enhance educational opportunities for younger generations, it may also create economic pressures that discourage older individuals from investing in their education. This dynamic underscores the importance of implementing policies that promote lifelong learning and skill development, particularly in regions heavily reliant on mining. The potential for mining to divert attention and resources away from education must be addressed to ensure that the benefits of economic growth translate into sustainable human capital development [62].
The analysis of per capita income variation in the Puno region highlights the complex interplay between mining activities and socioeconomic outcomes. While mining has generated significant income increases in certain districts, the disparities in economic growth and educational attainment raise important questions about equity and sustainability. Policymakers must adopt a holistic approach that considers the broader implications of mining on regional development, ensuring that the benefits are equitably distributed and that investments in education and other sectors are prioritized. Future research should continue to explore the multifaceted impacts of mining on socioeconomic indicators to inform effective policy interventions that promote inclusive and sustainable development [63].
The future of mining in Peru, alongside global trends, is increasingly oriented toward sustainable practices, technological innovation, and addressing socioeconomic disparities. As one of the leading producers of various minerals, particularly copper and gold, Peru’s mining sector significantly influences its economy, accounting for about 14% of the country’s GDP and providing substantial export revenues [64]. Despite this economic reliance, the sector faces serious challenges including environmental degradation, social conflicts, and demands for responsible mining practices.
Recent studies indicate that the environmental impacts of mining are coming under closer scrutiny. For instance, the management of mine tailings has emerged as a critical issue. Innovative strategies like underground backfilling using mine tailings are being explored as eco-friendlier solutions, thereby reducing the socioenvironmental conflicts often associated with surface disposal methods [24]. Such approaches not only help mitigate environmental damage but also aim to foster better relationships with local communities, which have historically been resistant to mining projects due to past grievances. The need for sustainable practices is underscored by the repercussions of unchecked mining operations, particularly the pollution associated with the release of heavy metals into surrounding ecosystems [65].
Moreover, the dynamics of mining governance in Peru reveal a complex interplay between corporate interests and community rights. Large-scale mining operations continue to receive government backing, often at the expense of artisanal and small-scale miners (ASMs) and local communities that depend on natural resources for their livelihoods [66]. For example, during the COVID-19 pandemic, large-scale mining was exempt from lockdown measures while ASMs faced severe restrictions, highlighting systemic inequalities within the sector [67]. The demand for more equitable governance frameworks has prompted community engagement initiatives where local stakeholders voice their concerns and aspirations regarding mining activities [68].
On a global scale, the mining sector is undergoing transformation driven by advancements in technology and shifts in market demands. An increasing focus on sustainability and responsible mining practices is seen worldwide, with countries like Peru being part of this trend. The incorporation of innovation in mining operations—such as utilizing advanced drilling techniques and optimizing operational efficiencies—has the potential to enhance production while minimizing negative impacts [69,70]. Furthermore, the integration of Corporate Social Responsibility (CSR) initiatives is becoming a vital component in establishing trust and social capital within mining contexts, helping to reconcile the tensions that often arise between mining companies and local communities [71].
In summary, the future of mining in Peru and globally is challenged by the dual imperatives of sustainable practice and socioeconomic equity. As the industry evolves, it must reconcile its economic contributions with the urgent need for responsible environmental stewardship and equitable treatment of affected communities. Continuous innovations and robust policy frameworks will be key to shaping a mining landscape that contributes positively to society while mitigating its adverse effects.
The interpretation of the findings from the analysis of mining’s impact on economic development in the mining districts of Puno reveals a clear distinction between short-term and long-term effects. In the short term, there is a significant increase in per capita income, indicating immediate economic improvement in mining areas. This short-term growth is driven by mining activity, generating both direct and indirect employment and boosting financial flows in the region.
The positive short-term effects extend beyond the mining districts, impacting neighboring areas. This suggests that the economic growth driven by mining also benefits surrounding communities, contributing to an overall improvement in income levels and access to basic services.
In the long term, the results show that mining’s impact on human development and inequality reduction becomes more apparent when the generated income is invested in education, infrastructure, and health. These investments improve Human Development Indices (HDIs), suggesting that mining profits can significantly enhance living conditions by providing better access to services and development opportunities. This, in turn, creates a more skilled workforce, leading to long-term productivity and competitiveness gains.
However, the sustained long-term growth depends on the proper management of mining revenues. In districts where mining profits have not been properly directed toward strategic investments, long-term benefits tend to be more limited. This highlights the importance of public policies that promote economic diversification, ensuring that mining-dependent areas develop beyond just the mining sector. The findings indicate that mining has positive effects in both the short and long term. However, for these benefits to be sustainable, local authorities must manage the generated resources effectively, ensuring investments are focused on improving social and economic conditions in the long run. Thus, mining can contribute not only to immediate economic growth but also to structural transformation that reduces inequality and fosters sustainable, inclusive development.
In Puno, the mining industry plays a crucial role in shaping educational demands, especially for secondary education. The industry requires a workforce skilled in areas such as engineering (particularly mining and civil engineering), geotechnical sciences, metallurgy, and environmental management. Secondary education programs that focus on technical skills related to machinery operation, mining safety, and environmental protection are highly valued. Additionally, there is a growing need for training in areas like sustainable mining practices, which address the increasing focus on environmental and social responsibility in the mining sector. Programs that integrate theoretical knowledge with hands-on experience in mining processes, along with certifications in specialized fields like occupational health and safety or mine surveying, are particularly in demand. By aligning secondary education with these industry needs, Puno can better equip its youth with the skills necessary to thrive in the mining sector while fostering sustainable economic growth.

5. Conclusions

The mining sector has both positive and negative impacts on socioeconomic indicators in the Puno region. On the positive side, mining significantly contributes to tax income, exports, employment, investment, and household income. Specifically, the Puno region, rich in metallic mineral resources, has seen a substantial rise in gold and tin production, with gold production ranking fourth nationally and tin production being led by the San Rafael mine, the country’s largest producer. This mining activity has driven the region’s economic growth, with mineral exports accounting for 99% of total exports in 2020, highlighting the sector’s central role in the regional economy.
However, the benefits of mining are unevenly distributed across districts. The data show that while the average family income per capita increased from PEN 214 in 2003 to PEN 347 in 2019, the income disparity between districts widened. Mining-producing districts experienced more significant income growth, contributing to a growing income gap compared to non-mining districts. This inequality underscores the need for strategies to ensure that the economic benefits of mining are more evenly shared across the region.
In terms of education, mining has had a positive impact on the percentage of the 18-year-old population completing secondary education, which increased from 54% in 2003 to 68% in 2019. Despite this progress, the overall educational attainment for the population aged 25 and older showed only a modest increase, indicating that while younger generations may be benefiting from mining-related economic opportunities, long-term human capital development remains limited.
Overall, while mining has been a catalyst for economic growth in the Puno region, it has also contributed to widening income inequality and only modest improvements in educational attainment. These findings suggest a need for policies that address the unequal distribution of mining’s benefits and promote more inclusive socioeconomic development.
The study reveals a positive impact of mining on per capita income at the district level in the Puno region between 2003 and 2019, with an increase of PEN 299.83. However, districts where agriculture predominates have seen stagnation or even a decline in per capita income levels. This suggests that while mining has boosted incomes in certain areas, it has also exacerbated economic disparities between districts with different predominant economic activities.
Regarding education, mining has had a positive effect on the percentage of the 18-year-old population completing secondary education. However, it has not significantly impacted the years of education for the population aged 25 and older. The increase in mineral prices has raised the opportunity cost of studying for young people, leading many to leave school to work in mining, particularly in regions where mining and poverty are prevalent. This trend indicates that while mining may provide immediate economic benefits, it may also hinder long-term human capital development.
Finally, the study highlights that the income gap between mining and non-mining districts has widened between 2003 and 2019. This growing disparity may contribute to the social discontent observed in Peru. Therefore, it is crucial for the government to implement mechanisms to ensure a more equitable distribution of income generated from mining activities.

6. Recommendations

Promoting Inclusive Economic Development through Regional Policy: In response to the widening income disparity between mining and non-mining districts in Puno, it is essential for the government to implement policies that ensure the equitable distribution of the benefits generated by the mining sector. This could include investing in infrastructure, public services, and economic diversification programs in non-mining districts to foster sustainable growth beyond mining. Targeted social programs should be designed to support communities in agriculture-based regions to mitigate the negative impacts of the mining sector’s growth on their economies and well-being.
Enhancing Education and Skills Development Programs: While mining has positively impacted secondary education completion, the modest improvements in educational attainment for the population aged 25 and older highlight the need for educational reforms. It is recommended that the government, in collaboration with the private sector, invests in adult education and skills development programs, especially in mining-heavy districts, to ensure lifelong learning opportunities. Moreover, promoting technical and vocational education aligned with the mining industry’s needs would help better prepare youth for the workforce, increasing their employability while addressing the potential loss of long-term human capital.
Encouraging Sustainable Practices in Mining and Education Integration: To address the challenges mining poses to long-term human capital development, it is crucial to integrate education with sustainable mining practices. Schools should include curriculum on the environmental and social impacts of mining, alongside skills training specific to the mining sector’s future, such as green mining technologies and post-mining rehabilitation. By encouraging responsible mining practices and offering a more holistic approach to education, the government can help prevent the resource sector from impeding long-term development while ensuring a skilled workforce for the future of the industry.

Author Contributions

Conceptualization, R.P.P., R.A. and A.H.; methodology, R.P.P., O.A.V.H., R.A.-A., R.C.F. and H.S.T.; software, H.S.T., H.S. and R.P.P.; validation, R.P.P., R.A., A.H. and R.A.-A.; formal analysis, R.P.P., R.A.-A., A.H. and R.A.; investigation, R.P.P., O.A.V.H., R.C.F., R.A.-A. and H.S.; resources, R.P.P., R.A., R.C.F. and A.H.; data curation, R.P.P., H.S.T., R.A. and R.C.F.; writing—original draft preparation, R.P.P., O.A.V.H., R.C.F., R.A.-A., A.H. and H.S.; writing—review and editing, R.P.P., R.A.-A., O.A.V.H., R.A., A.H. and H.S.; visualization, R.P.P., O.A.V.H. and H.S.; supervision, R.P.P., R.A.-A. and O.A.V.H.; project administration, R.P.P., A.H. and R.A.; funding acquisition, O.A.V.H. and R.C.F. All authors have read and agreed to the published version of the manuscript.

Funding

This research received no external funding.

Institutional Review Board Statement

Not applicable.

Informed Consent Statement

Not applicable.

Data Availability Statement

The original contributions presented in this study are included in the article. Further inquiries can be directed to the corresponding author.

Conflicts of Interest

There is no conflict of interest.

References

  1. Rice, B.; Buller, A.M.; Boccia, D.; Bazán, C.; Miranda, R.; Cea, X.; Laro, R.; Fontes, M.; Hayes, R.; de Wit, M.; et al. Establishing the Health and Wellbeing Needs of Mining Host Community in Brazil, Chile and Peru: A Mixed-Method Approach to Identify Priority Areas for Action to Help Communities Meet Their SDG3 Targets. BMC Public Health 2023, 23, 2218. [Google Scholar] [CrossRef]
  2. Davis, K.F.; Akram, H.; Meydani, A.; Khan, B.; Ali, S.H. Socio-Ecological Tradeoffs Between Household Wealth and Water Stress in Global Mining Areas. 2024. Available online: https://www.researchsquare.com/article/rs-4438652/v1 (accessed on 25 May 2024).
  3. Muvuka, B. A Rapid Assessment of the Impacts of Gold Mining on Women’s Health and Quality of Life in Ashanti Region, Ghana. J. Public Health Issues Pract. 2019, 3, 138. [Google Scholar] [CrossRef]
  4. Leuenberger, A.; Winkler, M.S.; Cambaco, O.; Cossa, H.; Kihwele, F.; Lyatuu, I.; Zabré, H.R.; Farnham, A.; Macete, E.; Munguambe, K.; et al. Health Impacts of Industrial Mining on Surrounding Communities: Local Perspectives from Three Sub-Saharan African Countries. PLoS ONE 2021, 16, e0252433. [Google Scholar] [CrossRef]
  5. Xiao-jing, C.; Tan, X. How Does the Urban-Rural Income Disparity Affect Economic Growth? Acta Univ. Agric. Silvic. Mendel. Brun. 2017, 65, 245–257. [Google Scholar]
  6. Taylor, A.; Bonner, M.D. Policing Economic Growth: Mining, Protest, and State Discourse in Peru and Argentina. Lat. Am. Res. Rev. 2017, 52, 3–17. [Google Scholar] [CrossRef]
  7. Aromolaran, A.B. Does Increase in Women’s Income Relative to Men’s Income Increase Food Calorie Intake in Poor Households? Evidence From Nigeria. Agric. Econ. 2010, 41, 239–249. [Google Scholar] [CrossRef]
  8. Pearson, D.S.; Nyonna, D.; Kim, K.J. The Relationship Between Economic Freedom, State Growth and Foreign Direct Investment in US States. Int. J. Econ. Financ. 2012, 4, 140. [Google Scholar] [CrossRef]
  9. Boachie, M.K.; Ramu, K. Effect of Public Health Expenditure on Health Status in Ghana. Int. J. Health 2016, 4, 6. [Google Scholar] [CrossRef]
  10. Aragón, F.M.; Rud, J.P. Natural resources and local communities: Evidence from a peruvian gold mine. Am. Econ. J. Econ. Policy 2013, 5, 1–25. [Google Scholar] [CrossRef]
  11. Loayza, N.; Rigolini, J. The Local Impact of Mining on Poverty and Inequality: Evidence from the Commodity Boom in Peru. World Dev. 2016, 84, 219–234. [Google Scholar] [CrossRef]
  12. MINEM. Anuario 2019. Minesterio de Energia y Minas. 2019. Available online: https://www.gob.pe/institucion/minem/informes-publicaciones/1424993-anuario-minero-2019 (accessed on 15 May 2024).
  13. Swenson, J.J.; Carter, C.E.; Domec, J.C.; Delgado, C.I. Gold mining in the peruvian amazon: Global prices, deforestation, and mercury imports. PLoS ONE 2011, 6, e18875. [Google Scholar] [CrossRef]
  14. SUNAT-ADUANAS. Exportaciones de oro en las Demás Formas en Bruto del Perú (Partida 7108120000). Available online: https://www.siicex.gob.pe/siicex/portal5ES.asp?page=234.00000 (accessed on 24 June 2024).
  15. Al Rawashdeh, R.; Campbell, G.; Titi, A. The socio-economic impacts of mining on local communities: The case of Jordan. Extr. Ind. Soc. 2016, 3, 494–507. [Google Scholar] [CrossRef]
  16. Isung, C.B.; Salifu, Y.; Agana, T.A. The Socio-Economic Implications of Artisanal and Small-Scale Mining on Mining Communities in Northern Ghana. OAlib 2021, 08, 1–17. [Google Scholar] [CrossRef]
  17. Carpio, A.L.; Salcedo, Y.C. Mercurio en Un Arroyo Altoandino Con Alto Impacto Por Minería Aurífera Artesanal (La Rinconada, Puno, Perú). Rev. Int. Contam. Ambient. 2020, 36, 33–44. [Google Scholar] [CrossRef]
  18. Quiroz, C.J.C.; Choque, G.J.M.; Quispe, G.L.F.; Pajuelo, D.G.F.; Velarde, E.D.O.; Chiampo, F.; Carpio, M. Evaluation of Potentially Toxic Elements in Soil andPotential Ecological Risks Generated by Environmental Liabilities in Tacna, Peru. BioRxiv 2024, arXiv:2024.09.21.614289. [Google Scholar]
  19. Ticona, R.S.; Terán, R.M. Contaminación Minera Informal en El Derecho a La Vida. Rev. Cient. Andin. Sci. Humanit. 2023, 3, 281–294. [Google Scholar]
  20. Muriki, J.G.; Wambugu, S.K.; Obando, J.A. The Spatial Distribution of Quarry Stone Mining Sites in Igembe South Sub-County Meru County, Kenya. J. Humanit. Soc. Sci. 2023, 2, 120–129. [Google Scholar] [CrossRef]
  21. Cartolin, H.M.B.; Felix, M.H. Contamination of Natural Resources and Its Configuration of Environmental Crime in a High Andean Artisanal Mining, Apurimac, Perú. IOP Conf. Ser. Earth Env. Sci. 2023, 1236, 012002. [Google Scholar] [CrossRef]
  22. Mamani, E.Q.; Chura, F.F.C.; Avila, D.; Quispe, G.B. Imaginario Social De Actores Locales Sobre La Contaminación Ambiental Minera en El Altiplano Peruano. RCS 2022, 28, 303–321. [Google Scholar]
  23. Delgado, A.; Arroyo, E.; Rivera, B.; Pacheco, D.; Quispe, K.; Medina, M.; Colonia, A.; León, V. Applying Grey Systems to Determine if Mining Activity Is Main Factor of Water Pollution in Huallaga River in Peru. Int. J. Emerg. Technol. Adv. Eng. 2022, 12, 27–37. [Google Scholar] [CrossRef]
  24. Cacciuttolo, C.; Pulido, A.M. Experiences of Underground Mine Backfilling Using Mine Tailings Developed in the Andean Region of Peru: A Green Mining Solution to Reduce Socio-Environmental Impacts. Sustainability 2023, 15, 12912. [Google Scholar] [CrossRef]
  25. Nuryanty, C.D.; Riani, E.; Abidin, Z.; Sutjahjo, S.H.; Riyadi, A. Predictive Modelling of Mercury Pollution in Indonesian ASGM Areas and Evaluation of the Main Factors Using Machine Learning Algorithm. IOP Conf. Ser. Earth Environ. Sci. 2022, 1109, 012046. [Google Scholar] [CrossRef]
  26. D’souza, M.S.; Karkada, S.N.; Somayaji, G.; Venkatesaperumal, R. Women’s Well-Being and Reproductive Health in Indian Mining Community: Need for Empowerment. Reprod Health 2013, 10, 1–24. [Google Scholar] [CrossRef] [PubMed]
  27. Heemskerk, M.; Le Tourneau, F.-M.; Hiwat, H.; Cairo, H.; Pratley, P. In a Life Full of Risks, COVID-19 Makes Little Difference. Responses to COVID-19 Among Mobile Migrants in Gold Mining Areas in Suriname and French Guiana. Soc. Sci. Med. 2022, 296, 114747. [Google Scholar] [CrossRef]
  28. Chakuya, J. An Assessment of the Impact of Illegal Artisanal Gold Mining on the Environment in Parts of Chewore Safari Area, Northern Zimbabwe. Environ. Res. Commun. 2023, 5, 075005. [Google Scholar] [CrossRef]
  29. Stoll, E.; Roopsind, A.; Maharaj, G.; Velazco, S.; Caughlin, T.T. Detecting Gold Mining Impacts on Insect Biodiversity in a Tropical Mining Frontier with SmallSat Imagery. Remote Sens. Ecol. Conserv. 2022, 8, 379–390. [Google Scholar] [CrossRef]
  30. Meaza, H.; Ali, M.; Tesfamariam, Z.; Abebe, N. Impacts of Artisanal Gold Mining Systems on Soil and Woody Vegetation in the Semi-arid Environment of Northern Ethiopia. Singap. J. Trop. Geogr. 2017, 38, 386–401. [Google Scholar] [CrossRef]
  31. Shikhov, A. Satellite-Based Mapping of Gold-Mining-Related Land-Cover Changes in the Magadan Region, Northeast Russia. Remote Sens. 2023, 15, 3564. [Google Scholar] [CrossRef]
  32. Mestanza-Ramón, C.; Cuenca-Cumbicus, J.; D’Orio, G.; Flores-Toala, J.M.; Segovia-Cáceres, S.M.; Bonilla-Bonilla, A.E.; Straface, S. Gold Mining in the Amazon Region of Ecuador: History and a Review of Its Socio-Environmental Impacts. Land 2022, 11, 221. [Google Scholar] [CrossRef]
  33. Diogens, C.J.; Nääs, I.d.A.; Benvenga, M.A.C. The Impact of Gold Mining on Regional Development in Brazil. Eur. J. Sustain. Dev. Res. 2024, 8, em0256. [Google Scholar] [CrossRef]
  34. Hilmawan, R.; Amalia, S. Coal and Mineral and Its Impact on Human Development Index: An Empirical Study in South and East Kalimantan Region, Indonesia. Int. J. Energy Econ. Policy 2020, 10, 488–494. [Google Scholar] [CrossRef]
  35. Warner, D.C.; Rao, D.S.P.; Griffiths, W.E.; Chotikapanich, D. Global Inequality; Levels and Trends, 1993–2005: How Sensitive Are These to the Choice of PPP s and Real Income Measures? Rev. Income Wealth 2014, 60, S281–S304. [Google Scholar] [CrossRef]
  36. Afkarina, K.I.I.; Wardana, S.; Damayanti, P. Coal Mining Sector Contribution to Environmental Conditions and Human Development Index in East Kalimantan Province. J. Environ. Sci. Sustain. Dev. 2019, 2, 6. [Google Scholar] [CrossRef]
  37. Arellano, M. Panel Data Econometrics; Advanced Texts in Econometrics; OUP Oxford University Press: Oxford, UK, 2003; Available online: https://global.oup.com/academic/product/panel-data-econometrics-9780199245291?cc=pe&lang=en& (accessed on 25 May 2024).
  38. Bernal, R.S.; Peña, X. Guía Práctica Para la Evaluación de Impacto; Uniandes, E., Ed.; Facutad de Economía, Centro de Estudios sobre Desarrollo Económico; Universidad de los Andes: Bogota, Colombia, 2011; p. 325. Available online: http://www.scielo.org.co/scielo.php?script=sci_arttext&pid=S0120-35842010000200007 (accessed on 25 May 2024).
  39. UNDP. Human Development Index—HDI. Instituto Peurano de Economia. 2021. Available online: https://ipe.org.pe/indice-de-desarrollo-humano-idh/ (accessed on 20 June 2024).
  40. Abadie, A.; Cattaneo, M.D. Econometric Methods for Program Evaluation. Annu. Rev. Econ. 2018, 10, 465–503. [Google Scholar] [CrossRef]
  41. Dorin, I.; Diaconescu, C.; Topor, D.I. The Role of Mining in National Economies. Int. J. Acad. Res. Account. Financ. Manag. Sci. 2014, 4, 155–160. [Google Scholar] [CrossRef]
  42. Frederiksen, A.; Centerpark, B. Mining in Arctic and Non-Arctic Regions: A Socioeconomic Assessment. SSRN Electron. J. 2016, 9883. [Google Scholar] [CrossRef]
  43. Moritz, T.; Ejdemo, T.; Söderholm, P.; Wårell, L. The Local Employment Impacts of Mining: An Econometric Analysis of Job Multipliers in Northern Sweden. Miner. Econ. 2017, 30, 53–65. [Google Scholar] [CrossRef]
  44. Gochero, P.; Seetanah, B. The Effect of Mining Foreign Direct Investment Inflow on the Economic Growth of Zimbabwe. J. Econ. Struct. 2020, 9, 54. [Google Scholar] [CrossRef]
  45. Wang, C.; Wang, L.; Xue, Y.; Li, R. Revealing Spatial Spillover Effect in High-Tech Industry Agglomeration from a High-Skilled Labor Flow Network Perspective. J. Syst. Sci. Complex. 2021, 35, 839–859. [Google Scholar] [CrossRef]
  46. Wang, X.; Fang, H.; Zhang, F.; Fang, S. The Spatial Analysis of Regional Innovation Performance and Industry-University-Research Institution Collaborative Innovation—An Empirical Study of Chinese Provincial Data. Sustainability 2018, 10, 1243. [Google Scholar] [CrossRef]
  47. Ncanywa, T. Economic Activities of Mining Production and Agricultural Economic Growth in South Africa. J. Rev. Glob. Econ. 2019, 8, 1289–1297. [Google Scholar] [CrossRef]
  48. Mancini, L.; Sala, S. Social impact assessment in the mining sector: Review and comparison of indicators frameworks. Resour. Policy 2018, 57, 98–111. [Google Scholar] [CrossRef]
  49. Zeng, X.; Liu, Z.; He, C.; Ma, Q.; Wu, J. Quantifying Surface Coal-Mining Patterns to Promote Regional Sustainability in Ordos, Inner Mongolia. Sustainability 2018, 10, 1135. [Google Scholar] [CrossRef]
  50. Broadberry, S.; Irwin, D.A. Lost Exceptionalism? Comparative Income and Productivity in Australia and the UK, 1861–1948. Econ. Rec. 2007, 83, 262–274. [Google Scholar] [CrossRef]
  51. Yamada, G.; Molina, O.; Velásquez, D. Mining and Human Capital Accumulation: The Role of the Return to Education; Working Paper No. 135; PERUVIAN ECONOMIC ASSOCIATION, 2018. [Google Scholar]
  52. Bishop, J. Education Choices and Labour Supply During the Mining Boom. RBA Bull. 2019, 20–27. [Google Scholar]
  53. Sher, L. Per Capita Income Is Related to Suicide Rates in Men but Not in Women. J. Men’s Health Gend. 2006, 3, 39–42. [Google Scholar] [CrossRef]
  54. Ahlerup, P.; Baskaran, T.; Bigsten, A.; Ahlerup, P.; Baskaran, T.; Bigsten, A. Gold mining and education: A long-run resource curse in Africa? Gold mining and education: A long-run resource curse in Africa? J. Dev. Stud. 2016, 2473, 666. [Google Scholar]
  55. Owusu, S.A.; Afrifa, R.D.; Obeng, F.A. Effect of illegal small-scale mining on basic education of children in rural communities in Ghana: Perspectives for future development. Afr. Geogr. Rev. 2021, 41, 336–349. [Google Scholar] [CrossRef]
  56. Ruijven, B.v.; Cian, E.D.; Wing, I.S. Amplification of Future Energy Demand Growth Due to Climate Change. Nat. Commun. 2019, 10, 2762. [Google Scholar] [CrossRef]
  57. Zullig, K.J.; Hendryx, M. A Comparative Analysis of Health-Related Quality of Life for Residents of U.S. Counties With and Without Coal Mining. Public Health Rep. 2010, 125, 548–555. [Google Scholar] [CrossRef]
  58. Frantál, B.; Nováková, E. A Curse of Coal? Exploring Unintended Regional Consequences of Coal Energy in the Czech Republic. Morav. Geogr. Rep. 2014, 22, 55–65. [Google Scholar] [CrossRef]
  59. Wagenius, C.M.; Sebastián, M.S.; Gustafsson, P.E.; Goicolea, I. Access for All? Assessing Vertical and Horizontal Inequities in Healthcare Utilization Among Young People in Northern Sweden. Scand. J. Public Health 2018, 47, 1–8. [Google Scholar] [CrossRef]
  60. Singh, G. Estimating Optimal Hedge Ratio and Hedging Effectiveness in the NSE Index Futures. Jindal J. Bus. Res. 2017, 6, 108–131. [Google Scholar] [CrossRef]
  61. Locke, C. Frac Sand Mines Are Preferentially Sited in Unzoned Rural Areas. PLoS ONE 2015, 10, e0131386. [Google Scholar] [CrossRef] [PubMed]
  62. Yazici, M.; Islam, M.Q. Determinants of Turkish Mining Trade Balance With Eu(15): Estimates from Bound Testing Approach. Pressacademia 2016, 5, 233. [Google Scholar] [CrossRef]
  63. Zengarini, N.; Ponti, A.; Tomatis, M.; Casella, D.; Giordano, L.; Mano, M.P.; Segnan, N.; Whitehead, M.; Costa, G.; Spadea, T. Absence of Socioeconomic Inequalities in Access to Good-Quality Breast Cancer Treatment Within a Population-Wide Screening Programme in Turin (Italy). Eur. J. Cancer Prev. 2016, 25, 538–546. [Google Scholar] [CrossRef] [PubMed]
  64. Mikami, S.; Ito, Y.; Gonzales, H.G.O. Assessing Peruvian University Students’ Preferences for Labor Conditions in Mining Site. Sustainability 2021, 13, 9648. [Google Scholar] [CrossRef]
  65. Sánchez, T.; Espinoza-Culupú, A.; Ramírez, P.; Iwai, L.K.; Montoni, F.; Macedo-Prada, D.; Sulca-López, M.; Sulca-López, Y.; Farfán-López, M.; Farfán-López, J. Proteomic Study of Response to Copper, Cadmium, and Chrome Ion Stress in Yarrowia Lipolytica Strains Isolated from Andean Mine Tailings in Peru. Microorganisms 2022, 10, 2002. [Google Scholar] [CrossRef]
  66. Vallejos, P.Q.; Veit, P.; Tipula, P.; Reytar, K. Undermining Rights: Indigenous Lands and Mining in the Amazon. Wripub 2020, 132. [Google Scholar]
  67. Benites, G.V.; Bebbington, A. Political Settlements and The Governance of COVID-19: Mining, Risk, And Territorial Control in Peru. J. Lat. Am. Geogr. 2020, 19, 215–223. [Google Scholar] [CrossRef]
  68. Armstrong, R.; Baillie, C.; Fourie, A.; Rondon, G. Mines and Community Engagement in Peru: Communities Telling Their Stories to Improve Future Practice; 2020; pp. 7–51. Available online: https://ouci.dntb.gov.ua/en/works/4NrdEbK4/ (accessed on 25 May 2024).
  69. Araujo, L.R.C. Capital Humano, Programas Sociales Y Desarrollo. El Caso Del Programa Tekoporã en Yuty, Caazapá, Paraguay. Kera Yvoty Reflex. Sobre Cuestión Soc. 2023, 8, 1–22. [Google Scholar] [CrossRef]
  70. Nenci, S.; Quatraro, F. Innovation and Competitiveness in Mining Value Chains in Latin America. 2021. Available online: https://publications.iadb.org/en/innovation-and-competitiveness-mining-value-chains-latin-america (accessed on 25 May 2024).
  71. Sáenz, C.; Ostos, J. Corporate Social Responsibility Supports the Construction of a Strong Social Capital in the Mining Context: Evidence from Peru. J. Clean. Prod. 2020, 267, 122162. [Google Scholar] [CrossRef]
Figure 1. Geographical location of the Puno region in Peru.
Sustainability 17 09951 g001
Figure 2. Gold production in Peru by region (in FMT). Source: MINEM [12].
Sustainability 17 09951 g002
Figure 3. Gold and tin exports from Puno. Source: SUNAT-ADUNAS [14], MINEM [12].
Sustainability 17 09951 g003
Figure 4. Correlation between gold exports and the Human Development Index in the Puno region: 2003–2020.
Sustainability 17 09951 g004
Figure 5. Evolution of per capita income at the district level in Puno. Own elaboration based on UNDP data [39].
Sustainability 17 09951 g005
Figure 6. Impact measurement using the difference-in-difference method. Source: Prepared based on Abadie & Cattaneo [40].
Sustainability 17 09951 g006
Figure 7. Change in per capita income in the Puno region between 2003 and 2019. Source: UNDP 2021 [39].
Sustainability 17 09951 g007
Table 1. Descriptive statistics of the variables to measure the impact of mining.
NotationVariable20032019
MeanMin.Max.MeanMin.Max.
IDHHuman Development Index0.260.180.380.340.130.64
y1Per capita household income at the district level21419628934751.11673
y2Percentage of the 18-year-old population with completed secondary school541587684685
y3Years of education of the population ≥ 25 years5.33.611.26.44.211.7
DDichotomous variable that identifies the mining-producing district0.14010.1401
TDichotomous variable that identifies the year of impact evaluation000111
DTInteraction variable between D and T0000.1401
Source: UNDP 2021 [39] and MINEM [12].
Table 2. Impact of mining on socioeconomic variables: 2003–2029.
VariableParameterFamily Income per CapitaPercentage of 18-Year-Old Population with Secondary EducationHDI
Constant β 1 215.72 ***58.12 ***0.26 ***
0.000.000.00
Mining district (D1) β 2 −5.97−10.09 ***−0.01
0.89 0.000.54
Non-mining district of the mining province (D2) β 3 −1.72−8.67 ***−0.01
0.92 0.000.31
Year (T) γ 25.519.710.03 ***
0.363 0.000.00
Direct impact on the mining district (D1T) δ 1 239.44 ***12.27 **0.09 **
0.000.010.00
Direct impact on the non-mining district of the mining province (D2T) δ 2 −26.349.710.02
0.650.0120.29
Indirect impact on the mining district (D1TW) δ 1 W −35.93−3.470.003
0.750.670.92
Indirect impact on the non-mining district of the mining province (D2TW) δ 2 W 352.30 ***0.790.08 ***
0.000.880.00
Spatial lag (We) λ 0.980.42 ***0.41 ***
0.980.000.0
Total impact
Total impact on the mining district δ 1 + δ 1 W 211.37 ***9.550.10 **
0.000.1280.00
Total impact on the non-mining district of the mining province δ 2 + δ 2 W 248.83 ***10.14 **0.10 *
constant 0.000.320.00
Sigma_u 36.396.44 ***0.04 ***
27.780.900.00
Sigma_e 140.49 ***8.42 ***0.46
9.570.570.00
Number of obs 216216216
Number of groups 108108108
Obs per group 222
Wald chi2 110.7175.05112.04
Prob > chi2 0.000.000.00
Log likelihood −1382−811.47303.11
Pseudo R2 0.370.340.40
Wald test of spatial terms
chi2(3) 20.938.7517.5
Prob > chi2 0.000.030.00
Note: ***, **, *: significant at the 1%, 5%, and 10% levels, respectively.
Table 3. Impact of mining on socioeconomic variables: 2015–2019.
VariableParameterFamily Income per CapitaPercentage of 18-Year-Old Population with Secondary EducationHDI
Constant β 1 245.78 ***62.42 ***0.29 ***
0.000.000.00
Mining district (D1) β 2 236.54 ***−5.72 **−0.084 ***
0.00 0.0360.000
Non-mining district of the mining province (D2) β 3 69.89 *−4.86 **−0.03 ***
0.098 0.0190.000
Year (T) γ 15.53 *5.48 ***0.013 ***
0.059 0.000.000
Direct impact on the mining district (D1T) δ 1 65.03 ***6.74 **0.022 **
0.0050.0160.012
Direct impact on the non-mining district of the mining province (D2T) δ 2 −1.535.19 **0.007
0.090.0130.27
Indirect impact on the mining district (D1TW) δ 1 W −7.27−0.260.010
−0.230.960.49
Indirect impact on the non-mining district of the mining province (D2TW) δ 2 W 80.59 ***0.340.03 ***
0.000.920.005
Spatial lag (We) λ 0.2880.46 ***0.31 *
1.550.0050.064
Total impact
Total impact on the mining district δ 1 + δ 1 W 57.75 ***6.53 *0.03 **
0.000.0850.004
Total impact on the non-mining district of the mining province δ 2 + δ 2 W 79.06 ***5.46 *0.03 ***
Constant 0.000.0530.000
Sigma_u 184.60 ***6.44 ***0.078 ***
12.780.900.00
Sigma_e 36.04 ***8.42 ***0.013 ***
2.450.570.00
Number of obs 218218218
Number of groups 109109109
Obs per group 222
Wald chi2 119.0575.52160.22
Prob > chi2 0.0000.000.00
Log likelihood −1308−739.13394.91
Pseudo R2 0.230.210.20
Wald test of spatial terms
chi2(3) 12.678.5410.13
Prob > chi2 0.0050.030.017
Note: ***, **, *: significant at the 1%, 5%, and 10% levels, respectively.
Table 4. Variation in per capita income between 2003 and 2019.
Variation in per Capita IncomeStratumNumber
of Districts
PercentPredominant Sectors
(235, 147112724.55%Mining, trade, agriculture
(65, 235]22825.45%Agriculture and trade
(−24, 65]31311.82%Agriculture
(−512. −24]44238.18%Agriculture
Total 110100.00%
Disclaimer/Publisher’s Note: The statements, opinions and data contained in all publications are solely those of the individual author(s) and contributor(s) and not of MDPI and/or the editor(s). MDPI and/or the editor(s) disclaim responsibility for any injury to people or property resulting from any ideas, methods, instructions or products referred to in the content.