1. Introduction
Floods are among the most destructive hydrological hazards worldwide, and their frequency and socio-environmental impacts are rising in many regions [
1,
2]. Recent studies indicate that climate change is intensifying extreme precipitation and flood events, with major consequences for floodplain agriculture and food security [
3,
4]. Even semiarid areas are not immune: in Central Asia and Kazakhstan, spring floods regularly threaten rural communities despite generally arid climates [
5,
6]. Kazakhstan has experienced severe floods in recent decades on rivers such as the Syr Darya, the Ishim (Esil), and their tributaries [
5].
In the Akmola Region of northern Kazakhstan, rapid snowmelt produces brief but intense spring flood pulses known locally as floods. These events frequently overwhelm infrastructure and inundate extensive tracts of floodplain farmland [
6]. On the Zhabay River—a right-bank tributary of the Ishim—an extreme flood on 17 April 2017 reached 6.1 m (versus a 3.45 m critical level), inundating approximately 450 homes in Atbasar City. Under broadly similar snowpack conditions, the 2018 flood peaked at only 3.6 m, underscoring the complex interplay of interannual climate variability and catchment controls on flood generation [
6].
Foundational geomorphological work established quantitative descriptors of basin morphometry and linked stormflow parameters to erosive potential [
7]. Subsequent research demonstrated that the amplification of spring flood waves reflects not only climatic trends but also land-use transformations, particularly channelization and flow regulation by reservoirs [
8,
9,
10,
11,
12,
13,
14,
15]. Contemporary practice integrates distributed hydrological models (e.g., SWAT and HEC-RAS) with high-frequency satellite data (Landsat 8/Sentinel-2) and unmanned aerial surveys, markedly improving the precision of inundation mapping and change detection [
5,
10,
11,
12,
16]. From a water management perspective, long observational and modeling records illustrate how flow regulation can reduce environmental water allocations while heightening the risk of peak releases that degrade floodplain soils and shift trade-offs between flood protection and consumptive water use [
8,
13,
17,
18,
19,
20,
21,
22,
23]. In drought-prone parts of Europe, stochastic inflow–outflow analyses for reservoir systems have been used to reconcile flood protection with sustainable water use [
14,
24].
The ecological and pedological consequences of flooding constitute a distinct but still underexplored domain. Floodplain soils experience rapid wetting and anoxia, pulses of sediment deposition, and sharp chemical fluxes that can diminish land productivity [
16]. Globally, floods are known to alter soil texture through the redistribution of sand and fines, modify nutrient availability, shift pH and redox conditions, and restructure microbial communities [
16,
17,
18,
25,
26,
27]. Case studies report increases in the sand fraction following inundation and depth-dependent leaching of soil organic carbon [
16,
17], while post-flood surges in trace metals (e.g., Zn and Ni) have been observed in urban and peri-urban alluvial soils [
18,
19]. Synthesis efforts emphasize a two-phase evolution of the soil solution: an initial reductive phase during peak inundation marked by Fe–Mn mobilization, followed by an oxidative phase during drawdown when metals can be immobilized in carbonate or oxide forms [
17,
18,
28].
Despite this growing international evidence base, the long-term soil ecological consequences of flooding in northern Kazakhstan remain insufficiently documented [
5,
6]. A small number of integrative assessments have mapped flood hazards along the lower Esil (Ishim) and Nura Rivers, suggesting that flood-prone zones may occupy a notable share of the Astana urban agglomeration; however, the soil component in these studies is treated only descriptively [
5,
6]. Remote-sensing analyses of specific events (e.g., 2017 on the Ishim, using NDWI) have linked inundation depth to water-quality proxies, yet soil chemical indicators were not collected [
5,
11,
12,
20]. Moreover, much of the available information on floodplain soils resides in nonpublic operational reports that lack methodological harmonization and remain inaccessible to the scientific community, limiting their use for comparative analysis [
6].
This gap is particularly significant for the Zhabay River basin, the largest right-bank tributary of the Ishim within the Akmola Region, where floods are recurrent and their geomorphic imprint on floodplain soils is evident [
6]. Field inspections conducted after the recent floods revealed noticeable changes in soil texture—sand content in some places rose to almost 50%. During the water recession phase, soil pH fluctuated from slightly acidic to mildly alkaline conditions. At the same time, several samples showed temporary exceedances of safe limits for ammonium and certain heavy metals. Altogether, these findings suggest an increased risk of soil degradation and possible limitations for its safe agricultural use.
Although progress has been made in studying flood hydrology, there is still a noticeable lack of information on how the steppe soils and ecosystems of Northern Kazakhstan react to such extreme events. This study aims to address this gap by presenting the first comprehensive analysis of the impact of spring floods on the region’s floodplain soils.
The research integrates hydrological, soil and microbiological approaches in order to:
Study recent hydroclimatic changes and anomalies in the spring flood;
Accurately assess the extent and depth of flooding, as well as classify flood-prone areas;
Trace the changes in the physical, chemical and biological properties of the soil at different stages after the flood;
Identify key natural and anthropogenic factors contributing to degradation;
Propose practical data-based measures to enhance ecosystem resilience and reduce damage.
These findings support regional policies aimed at sustainable land-use planning and climate adaptation in the Atbasar District and broader northern Kazakhstan [
29].
2. Materials and Methods
2.1. Study Area
The study was conducted on the middle floodplain of the Zhabay River near Atbasar, in the Akmola Region of northern Kazakhstan (52°48′ N, 68°22′ E). The region has a sharply continental steppe climate with cold, snow-covered winters and mild springs. Rapid snowmelt in March–April produces the annual flood pulse. The Zhabay catchment drains into the Ishim River and features flat to gently undulating relief, with loamy dark chestnut soils (Calcic Kastanozems) in the floodplain and chestnut soils on the adjacent uplands. Land use is dominated by pasture and fodder crop cultivation.
2.2. Hydrological and Climatic Data
To characterize the hydrological regime, daily water level and discharge records (2012–2024) from the Atbasar gauging station (Kazhydromet) (Atbasar, Akmola region, Kazakhstan) were compiled, together with regional snowpack measurements. Meteorological observations (air temperature and precipitation) were obtained from the Atbasar weather station (Atbasar, Akmola region, Kazakhstan). These data formed the basis for analyzing long-term trends in flood magnitude, frequency, and timing and served as reference information for subsequent flood mapping and validation.
2.3. Remote Sensing and Flood Mapping
The depth and area of flooding were estimated using NDWI (>0.28). A comparison of DEM before and during the flood made it possible to build maps of the depth of flooding and divide them into three classes of environmental impact. The remote sensing data has been verified by field observations to improve accuracy.
2.4. Field Measurements
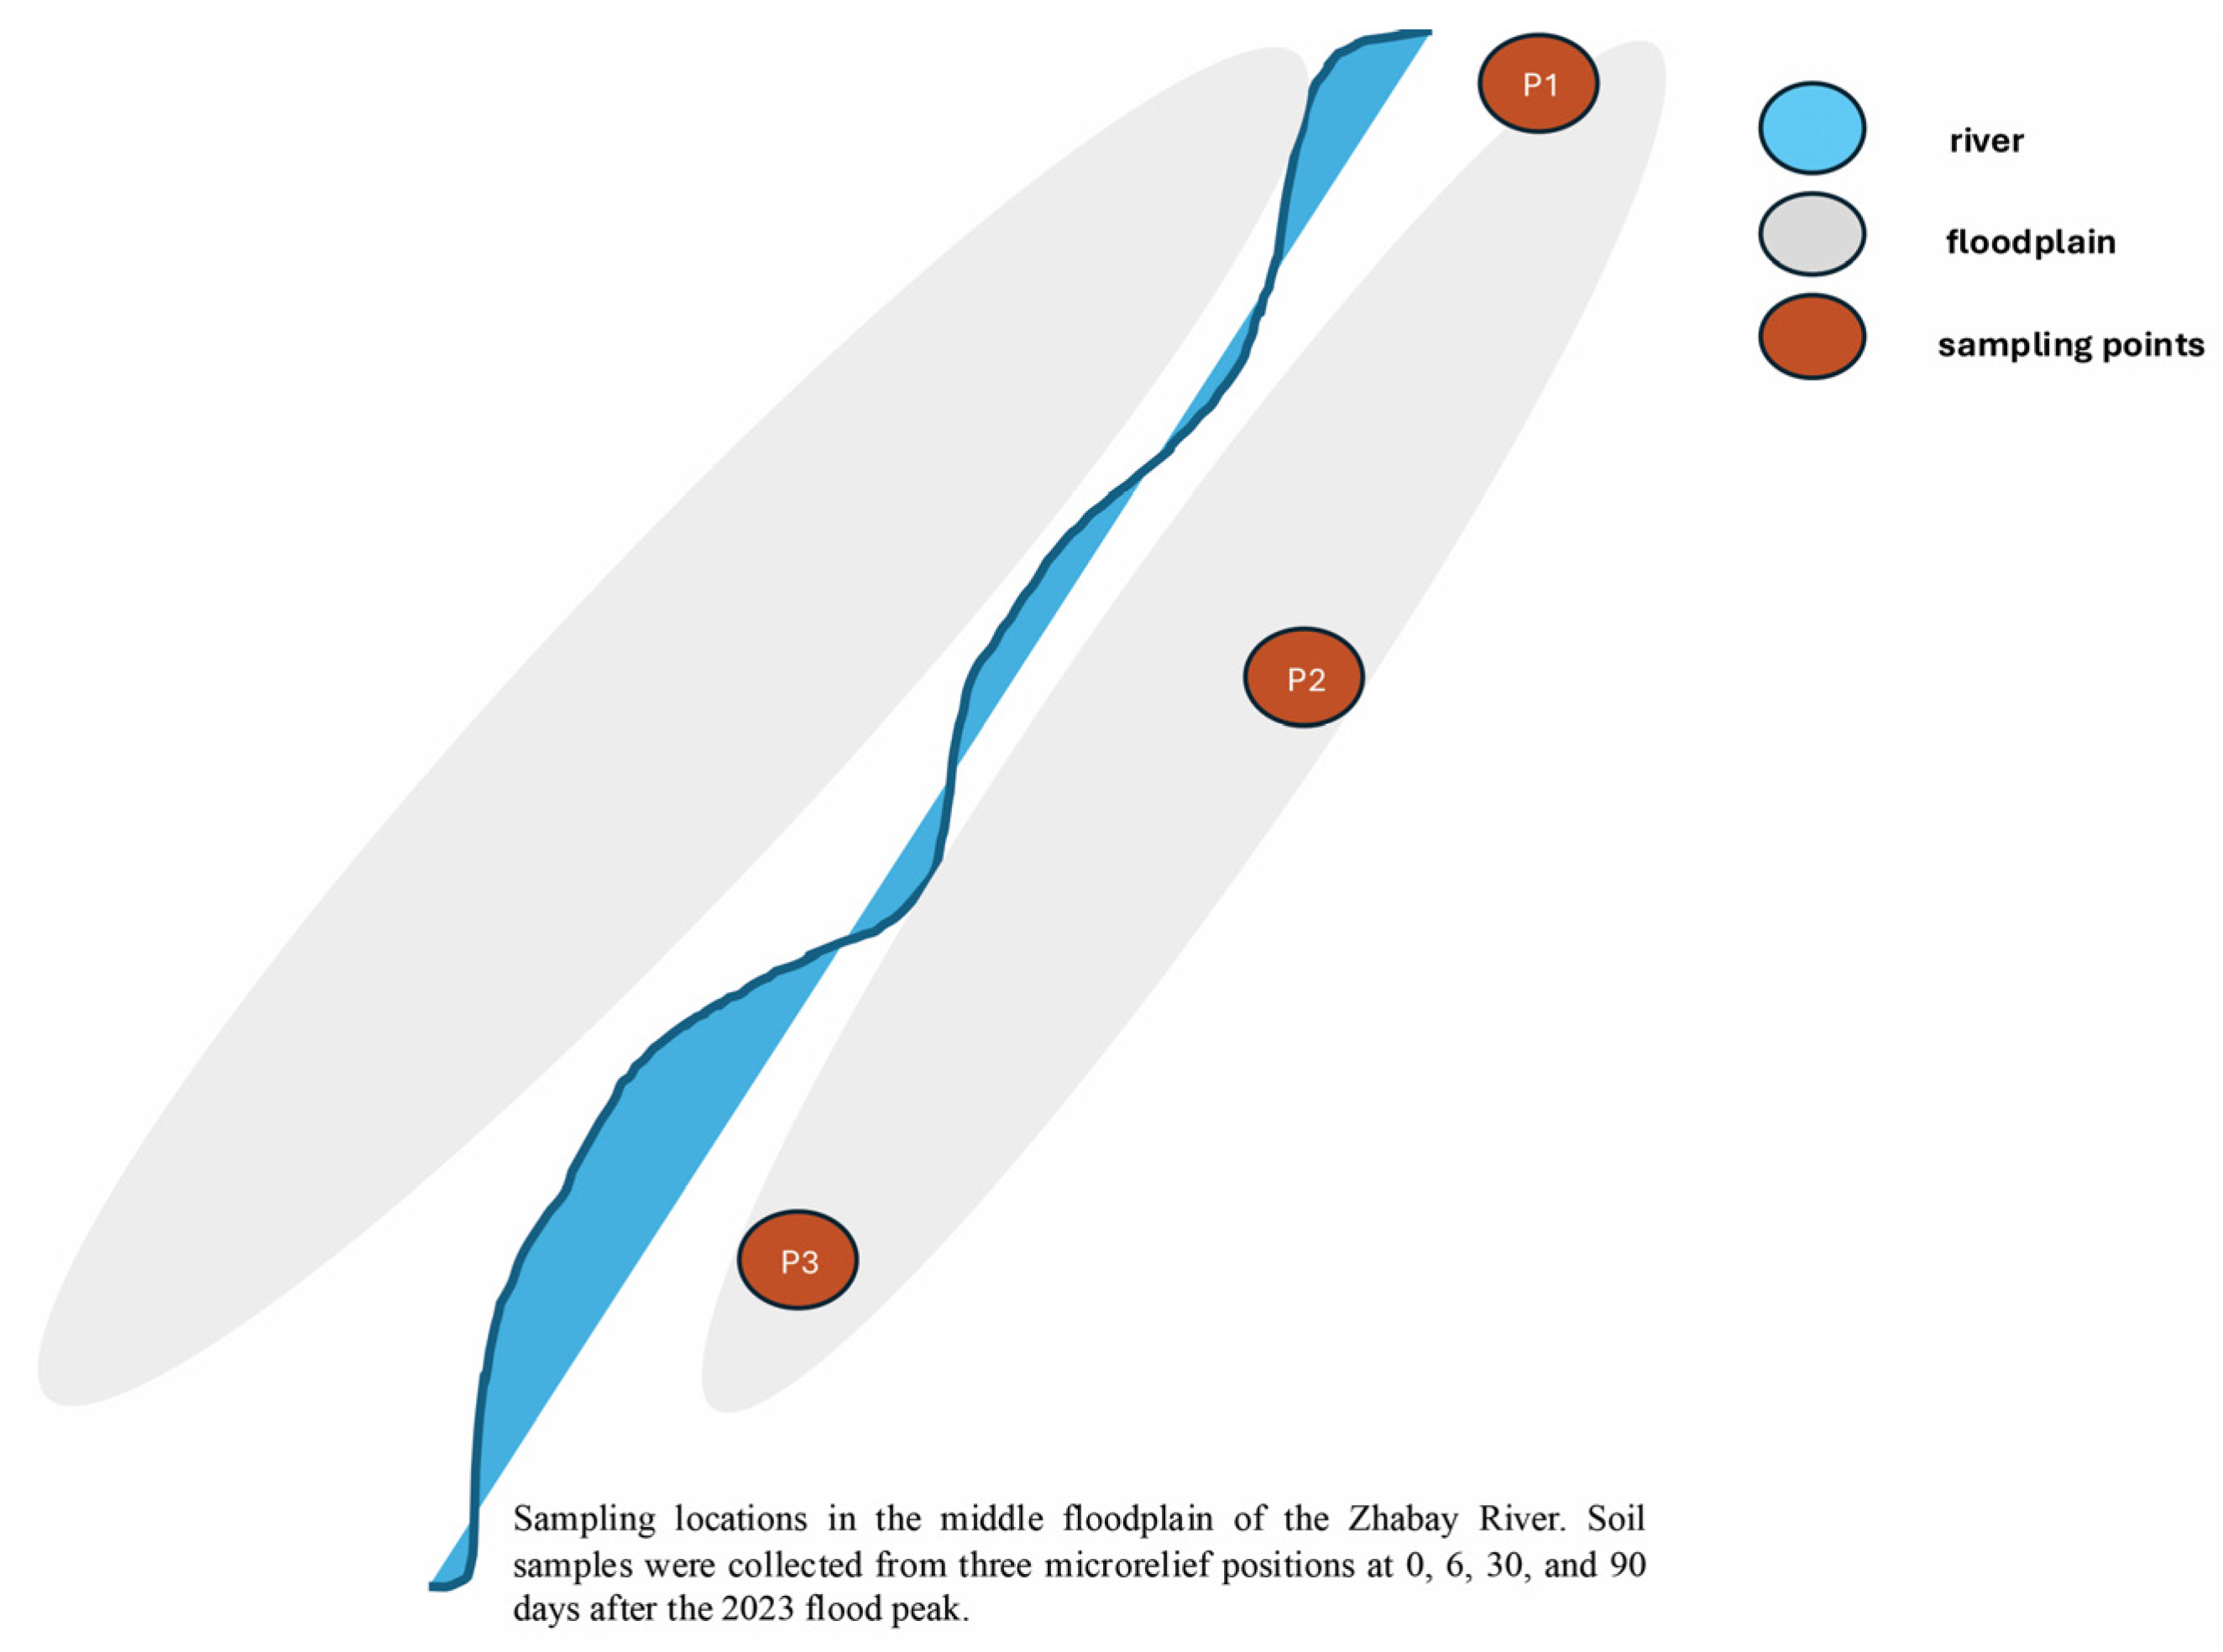
During the spring flood of 2023, field measurements of the depth of flooding were carried out at 54 geo-connected points covering various microrelief positions (
Figure 1). The water parameters (pH, EC, dissolved oxygen, and ORP) were determined in situ using a YSI ProDSS sensor (YSI, Yellow Springs, OH, USA). Soil samples (0–20 cm) were taken before the flood and 6, 30, and 90 days after the peak from the crests of dams, terraces, and depressions. The data made it possible to link the flooding models obtained by remote sensing with the reaction of soil and water in the field.
2.5. Laboratory Analyses
The collected soil samples were processed and analyzed following established laboratory standards. Particle size distribution was measured using laser diffraction (Malvern Panalytical, Malvern, UK), while bulk density and porosity were calculated from oven-dried soil cores. Saturated hydraulic conductivity was determined with a constant-head permeameter.
For chemical characterization, we assessed pH, redox potential (Eh), major nutrients (N, P, and K), and total organic carbon (C_org). Concentrations of heavy metals (Zn, Ni, Pb, and Cd) were quantified using inductively coupled plasma–mass spectrometry (ICP–MS (Agilent 7900, Agilent Technologies, Santa Clara, CA, USA)) after microwave-assisted digestion. Sequential extraction procedures were applied to evaluate metal mobility.
Enzymatic activities (dehydrogenase and β-glucosidase) were determined spectrophotometrically, and microbial community composition was characterized through 16S rRNA gene sequencing. All analyses complied with ISO 17025 [
30] and APHA protocols to ensure data quality, reproducibility, and cross-laboratory comparability.
2.6. Data Processing and Statistical Analysis
All hydrological, spatial and soil data were combined for statistical analysis. Flood mapping was performed in ArcGIS Pro 3.1 (Esri, Redlands, CA, USA) and QGIS 3.28 (
https://qgis.org), and processing of soil and water parameters was performed in R (v. 4.3) (
https://www.r-project.org). The relationships between flood characteristics (depth, duration, and extent) and soil parameters (pH, Eh, bulk density, and nutrient and heavy metal content) were assessed using the Pearson correlation coefficient and paired
t-tests. Multiple regression models were used to identify key factors of soil degradation and assess their relative importance.
The simulated flood depths were verified using 54 field observations, and accuracy was estimated using MAE, RMSE, and bias; spatial uncertainty was taken into account based on vertical RMSE (±0.14 m). ROC analysis was used to determine practical thresholds for the depth and duration of flood effects on soil degradation. For each variable, binarization of the soil condition (with/without degradation) was performed relative to the observed values, after which sensitivity–1-specificity curves were plotted. The threshold values were chosen so as to maximize the area under the curve (AUC) and achieve a probability of detecting degradation of ≥0.7.
Data visualization and plotting were performed taking into account the principles of transparency and reproducibility. Despite the lack of laboratory modeling, a combination of field observations, UAV data, lidar, and long-term satellite imagery provided a reliable basis for quantifying the impact of floods on soil properties.
3. Results
3.1. Spring Flood Regime (Hydrographs)
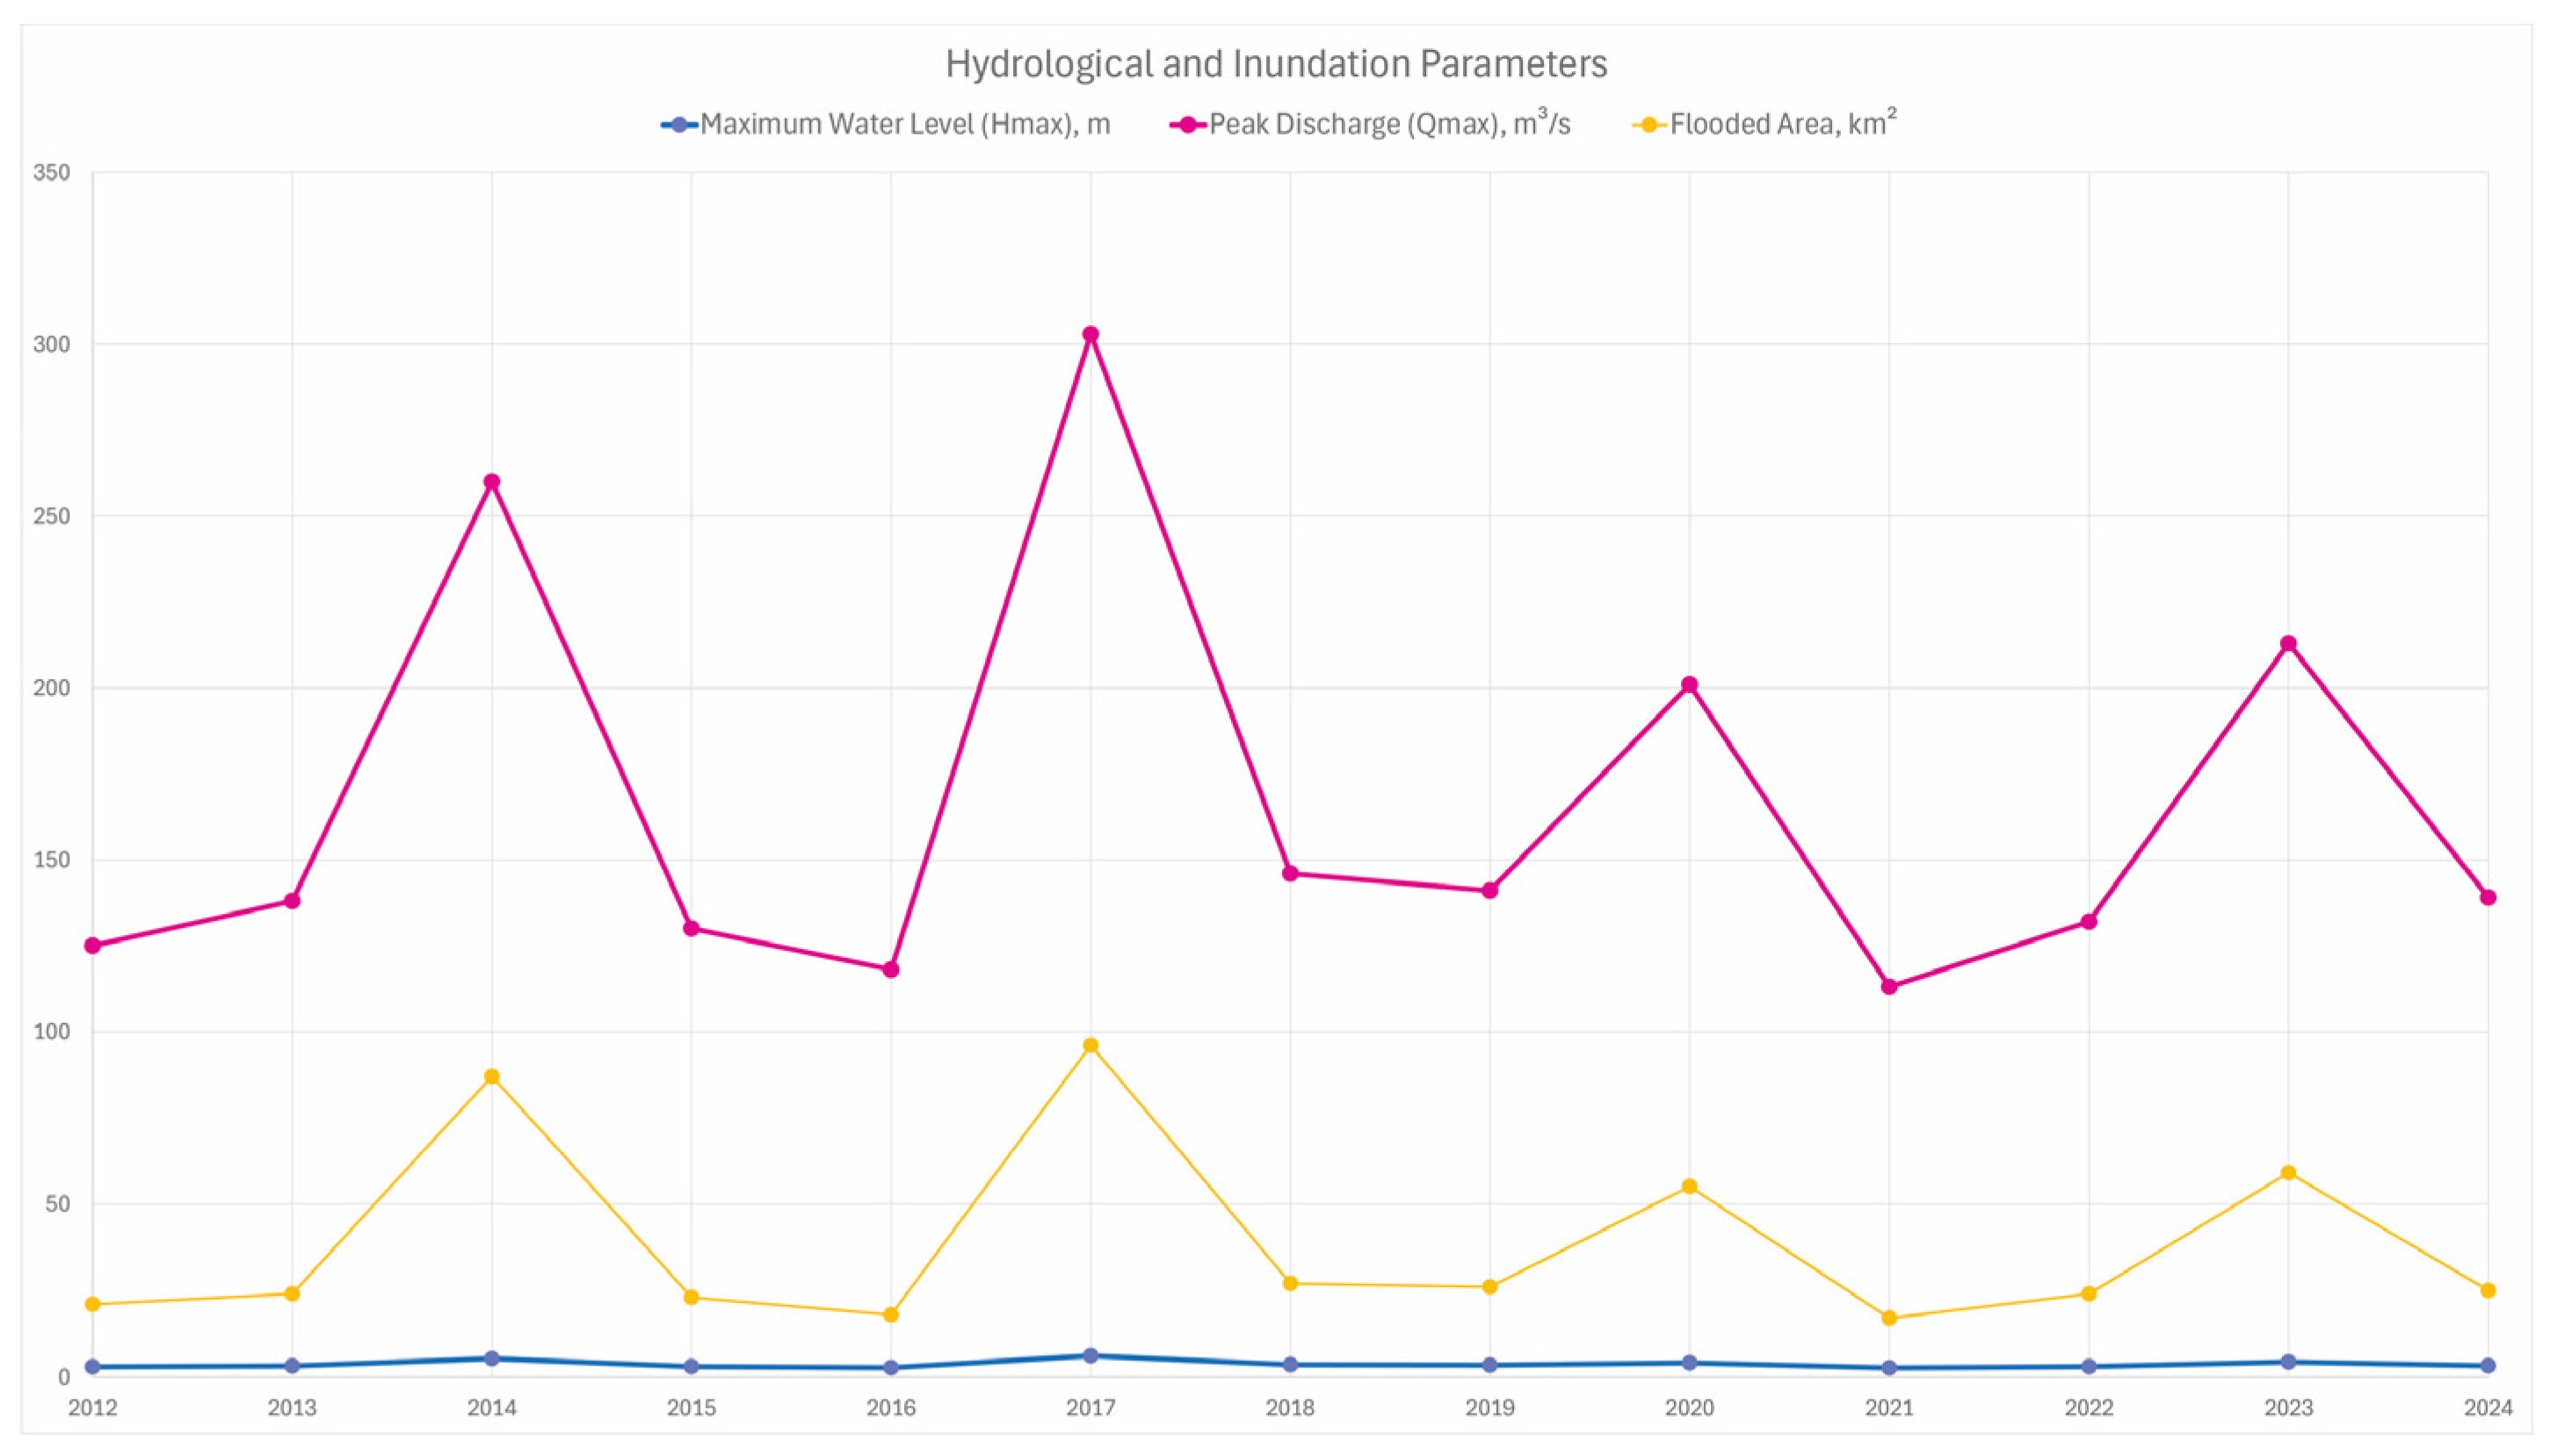
Long-term analysis of the Zhabay River hydrographs reveals a consistent single-peaked spring flood, typically occurring in the first ten days of April (mean onset: 6 April ± 5 days). Over a 12-year observation window, four hydrologically anomalous seasons—2014, 2017, 2020, and 2023—were identified, each with flood-wave amplitudes exceeding 4 m. The historical maximum water level was recorded on 17 April 2017 at 6.15 m, far above the critical threshold of 3.45 m. The recurrence frequency of peak discharges at or above the Q5 threshold was 0.33 (4 events in 12 years), a 1.7-fold increase relative to the long-term average for the 1970–2010 baseline period.
The dataset underpinning
Figure 2 (Atbasar gauge) is provided below to facilitate plotting.
3.2. Trend Analysis of Annual Maxima
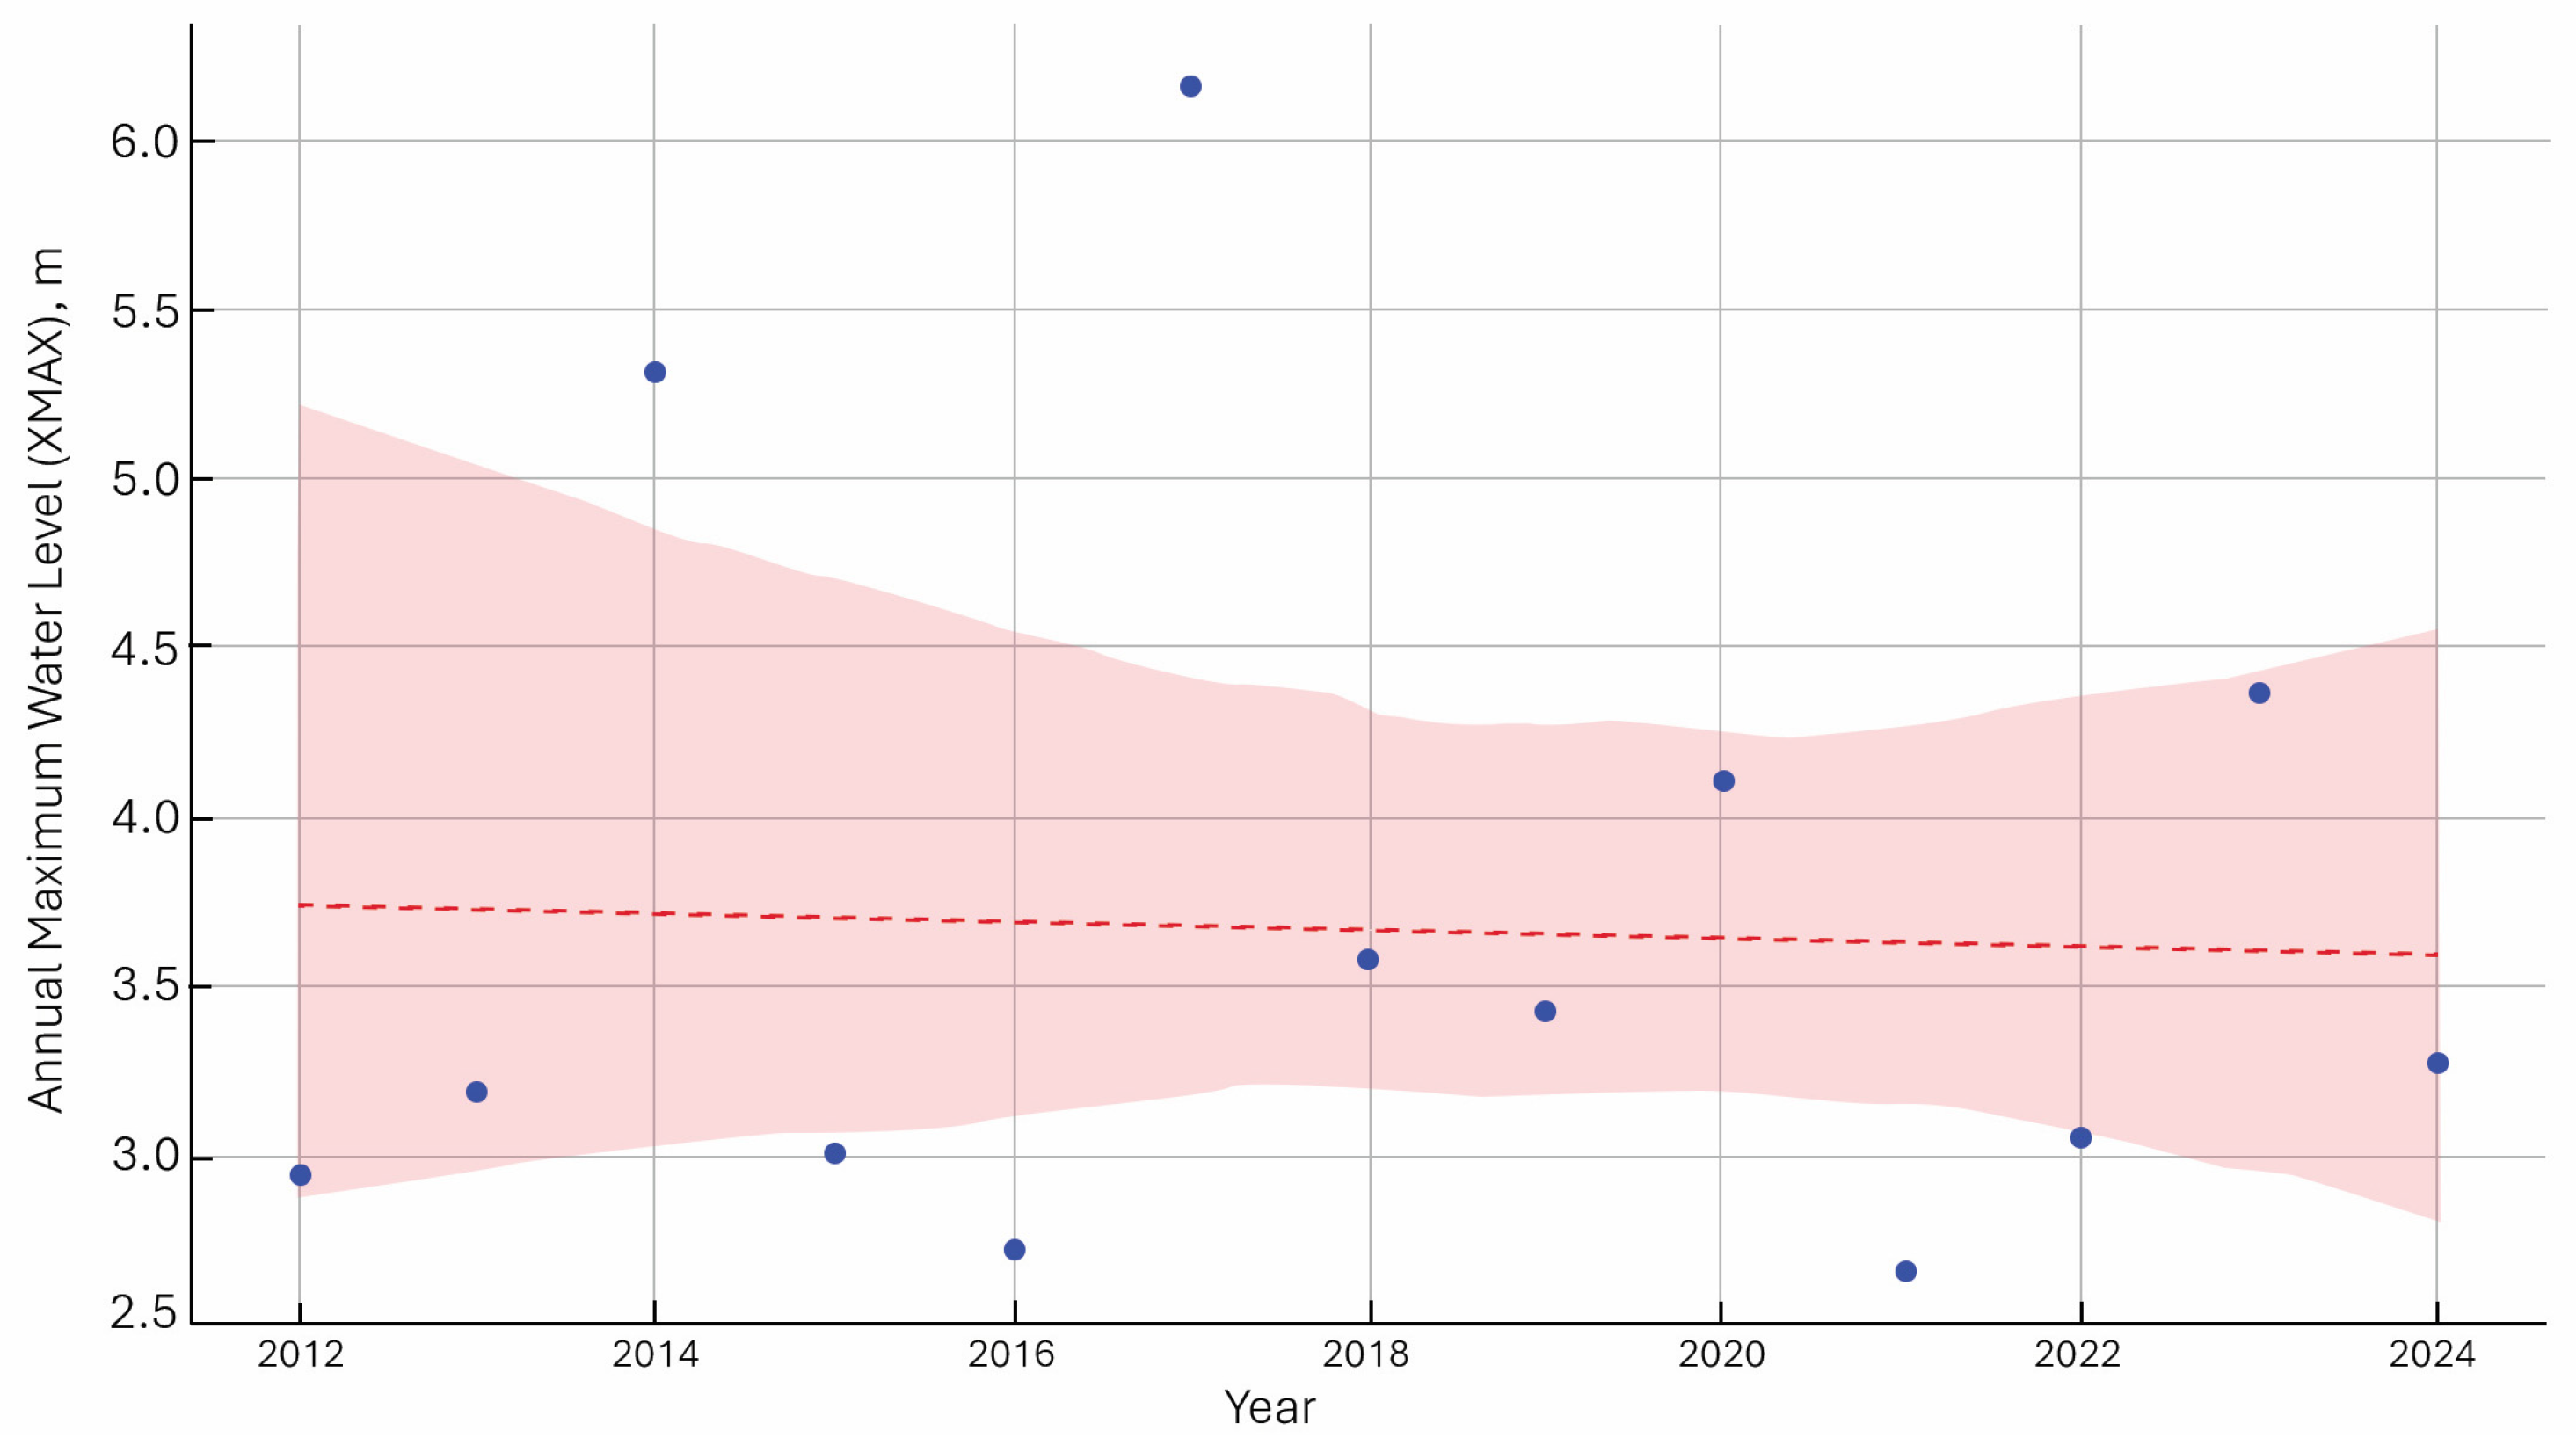
A linear model fitted to annual
Hmax indicates a positive slope of +0.08 m yr
−1, pointing to gradual intensification of peak flood amplitudes (
Figure 3). The coefficient of determination (
R2 = 0.43) suggests that ~43% of the variance in
Hmax is explained by the linear trend. The mean recurrence interval of high-magnitude peaks (
Q ≥
Q5) decreased from 5.8 to 3.0 years over the study period, consistent with an increasing density of extreme peaks.
3.3. Flood Energy and Event Typology
Flood energy was quantified as the area under the daily hydrograph (ΣQ·Δt). Since 2014, integrated spring runoff has increased by ≈5.1% yr
−1. Rapid waves (trise ≤ 5 days) predominated in 2018 and 2020, with a fast-to-slow event ratio of 1.8 (versus 0.9 during 2012–2016). Despite similar
Hmax, the 2014 flood had 24% greater energy than 2020, explaining its broader inundation footprint at a lower
Qmax. The mean recession phase shortened from 28 to 19 days, plausibly reflecting increased snowmelt infiltration in the 0–30 cm layer and expanded drainage infrastructure after 2017. Pairwise correlations between
Hmax and climatic predictors are summarized in
Table 1.
Peak levels are most strongly associated with snow water equivalent on 1 March (r = 0.81; p = 0.002) and cumulative winter precipitation (r = 0.73; p = 0.006). A moderate negative correlation with late-March/early-April air temperature (r = −0.59; p = 0.038) indicates the role of melt intensity. The diurnal amplitude relationship is not statistically significant (p = 0.072).
3.4. High-Resolution Inundation Mapping
To resolve spatial patterns of flood depth, a 0.30 m DEM was generated by integrating SRTM, Landsat-8/Sentinel-2 imagery, and UAV data (DJI M-300 RTK). Elevations were corrected using drone-borne LiDAR profiles and Empirical Bayesian Kriging, which accounts for spatial uncertainty (mean vertical error ±0.14 m, n = 27).
The Normalized Difference Water Index (NDWI) was computed for each scene from 2012–2024. Water pixels were identified using a threshold of 0.28, determined via the maximum likelihood criterion to statistically separate water and land.
Water depth maps were obtained by subtracting the “dry” DEM from the “flooded” DEM. Averaging across 23 dates reduced temporal variability, producing a composite map of maximum flood depths, classified into three ranges: 0–0.5 m, 0.5–1 m, and >1 m (
Table 2).
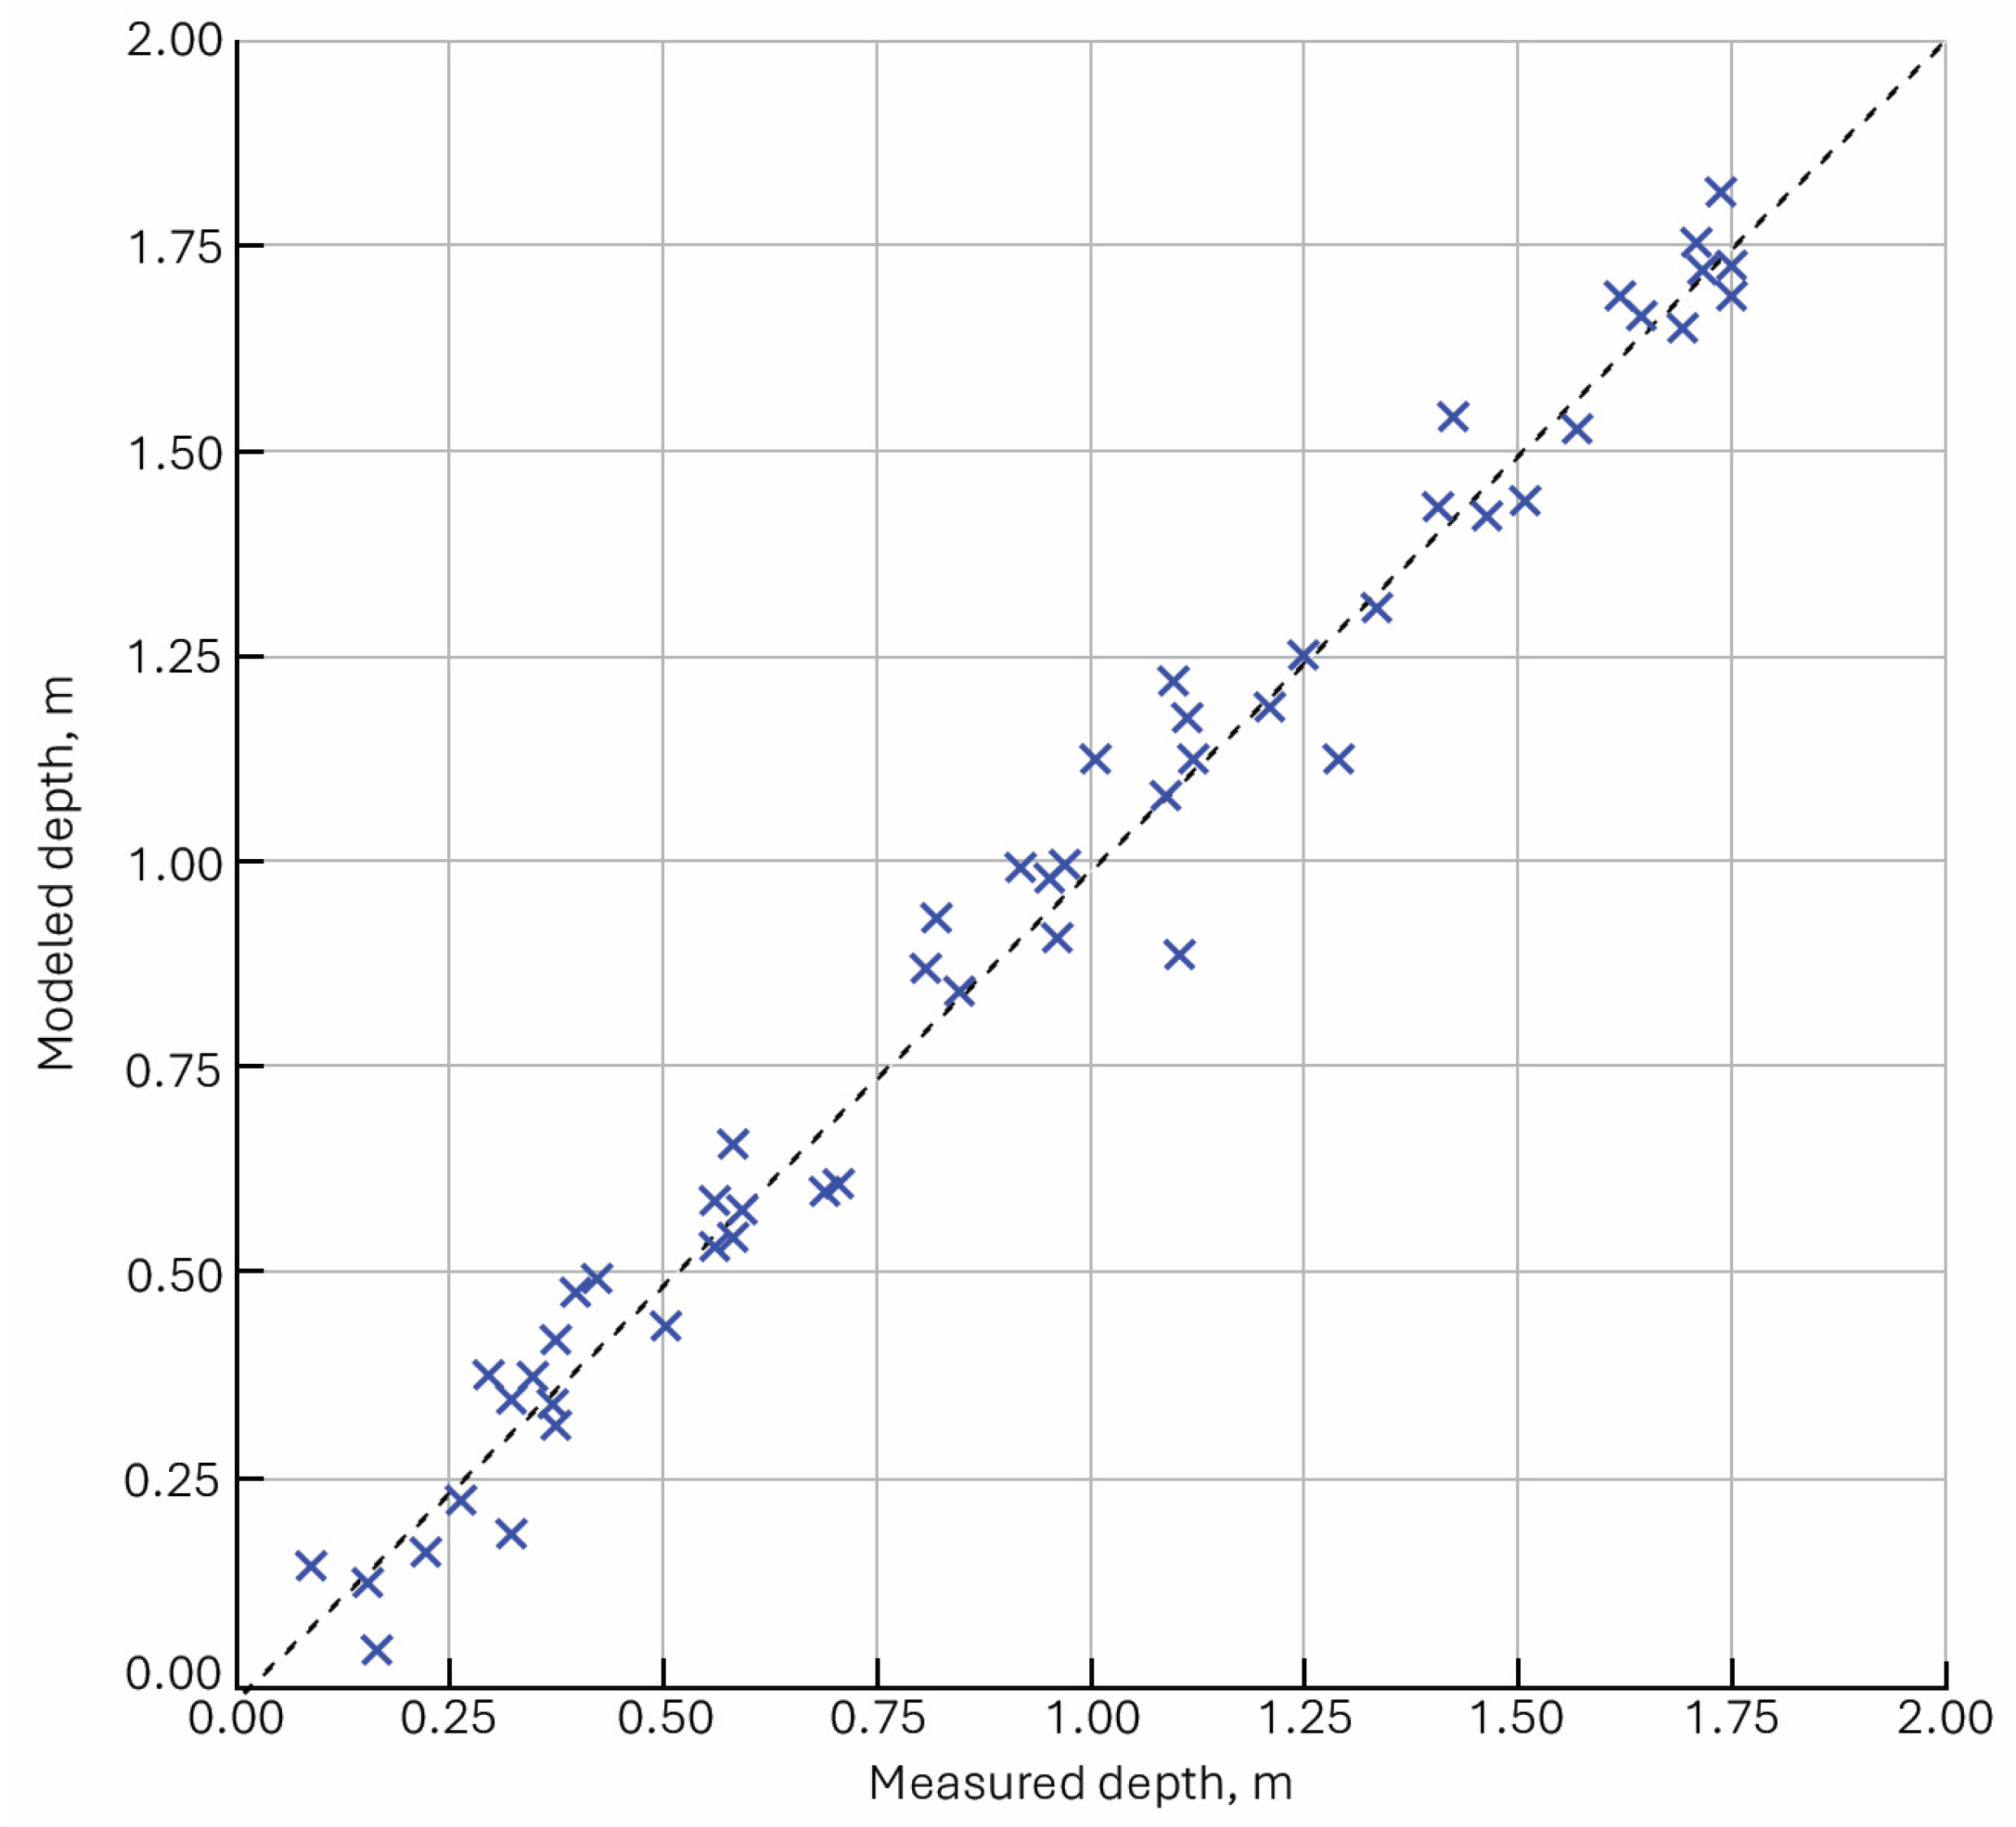
Model reliability was assessed by comparing the estimated flood depths with 54 field measurements obtained using a lambda probe (accuracy ±2 cm). The mean absolute error (MAE) was 0.17 m, the root mean square error (RMSE) was 0.22 m, and the systematic bias was 0.05 m, indicating a slight underestimation of calculated values relative to observations.
Figure 4 shows the observed vs. predicted scatter plot, with the 1:1 line indicated by a dashed line.
3.5. Textural Shifts in Alluvial Soils
During the 2020–2023 spring floods, particle size distributions shifted markedly: sand increased from 35 ± 3% to 49 ± 4%, silt declined from 45 ± 2% to 34 ± 2%, and clay from 20 ± 2% to 17 ± 2% (all
p < 0.01), consistent with selective removal of fines (
Figure 5).
3.6. Bulk Density, Porosity, and Infiltration
Following floods, bulk density increased by 6–9%, with concomitant declines in porosity and saturated hydraulic conductivity, especially in poorly drained microdepressions. Desaturation of the profile lasted 5–7 weeks; thawing to 50–90 cm created transient anaerobic conditions, as evidenced by redoximorphic Bg horizons. May–September 2023 monitoring showed partial recovery: humus rose from 1.7% to 2.2%; bulk density decreased by 0.05–0.07 g cm
−3 (primarily on levees; only −0.02 g cm
−3 in depressions); and macropore conductivity recovered to 0.45 m day
−1 (~67% of the pre-flood baseline) (
Table 3).
Sites in Class III (deep/prolonged inundation;
Table 2) showed persistently degraded conditions by crop maturation: a dense subsurface horizon with partial salinization and carbonate accumulation restricted aeration and root development. Targeted agro-reclamation—subsoiling and gypsum application—proved most effective for these areas.
Eh–pH Dynamics and Post-Flood Recovery
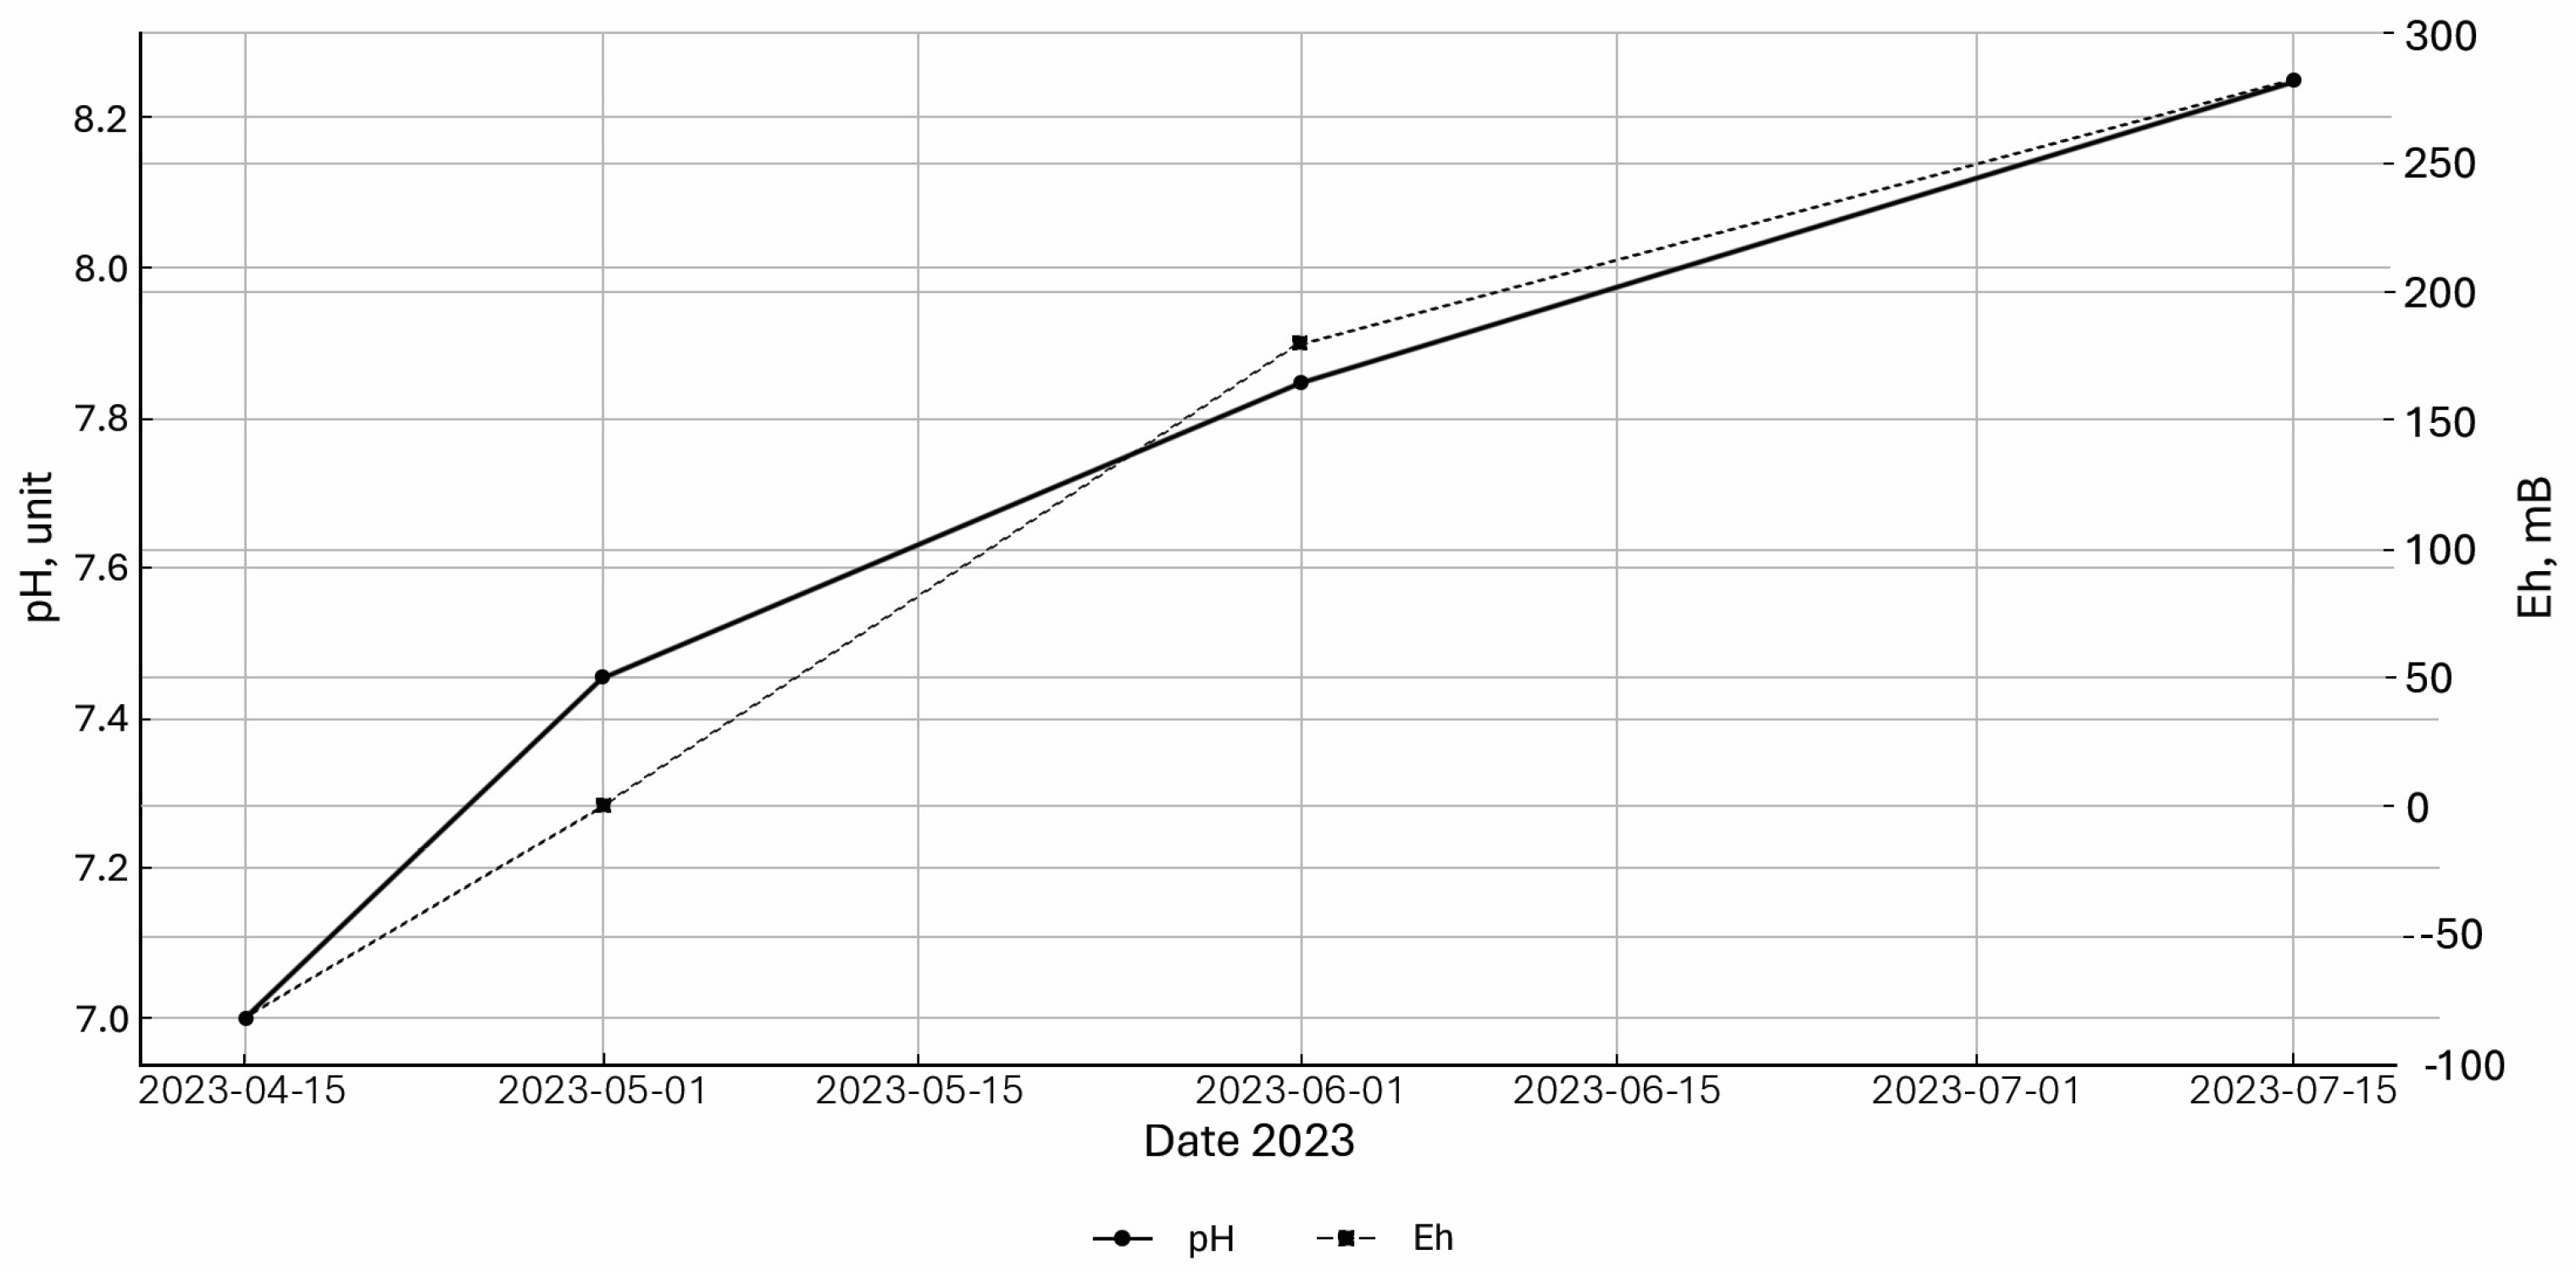
Eh–pH trajectories (
Figure 6) show a shift from minimum values (Eh ≈ –85 mV at pH ≈ 6.98) to positive Eh by late April, reaching +287 mV during May–July, with pH moving toward mildly alkaline (pH ≈ 8.29). This phase curve typifies post-flood soil recovery.
3.7. Macronutrients and Soil Organic Carbon
Within the humus horizon, readily available N and P decreased, while NH
4+-N increased due to mineralization under anaerobic conditions (Phase I), as shown in (
Table 4). Soil organic carbon decreased by 0.43 percentage points, driven by export of suspended material and enhanced microbial mineralization at ~14 °C.
3.8. Heavy Metals and Self-Purification
Table 5 shows the concentrations of heavy metals in the upper soil layer (0–20 cm) with self-purification coefficients (Ks) and efficiency classes. Zn and Ni exceed the MPC by ~19% and ~3%, respectively. The labile fraction indicates partial mobilization of Zn2
+ and resuspension of Ni from bottom sediments.
Ks (the ratio of concentrations on the 30th and 7th day) reflects the recovery after the flood: Zn and Ni are cleared slowly (Ks ≥ 0.7) and Nh4+-N and organic carbon faster (Ks ≈ 0.57). In general, Zn and Ni pollution is moderate and Pb, Cd, and Nh4+-N recover faster, which allows sites to be allocated for possible intervention to improve soil quality and nutrient availability.
3.9. Microbial Community Shifts and Enzyme Activity
High-throughput 16S profiling (Illumina MiSeq v3, 2 × 300 bp; ≥45,000 reads per sample;
n = 18) showed pronounced community reassembly along the inundation–recovery sequence (
Table 6).
During the anaerobic phase, Firmicutes (including sulfate-reducing Clostridium) tripled in relative abundance, while aerobic Proteobacteria and Actinobacteriota declined. By July, both groups nearly recovered, mirroring re-oxygenation.
To link taxonomy with function, we assayed dehydrogenase and urease at key stages (
Table 7). Activities dropped 2.5–2.6× under Eh < 0 mV and moisture > 50%, rebounding to 75–80% of baseline by Day 30 and fully recovering by Day 90. Spearman correlations showed that dehydrogenase was negatively associated with moisture (ρ = −0.74,
p < 0.01) and positively with Eh (ρ = 0.69,
p < 0.01), underscoring aeration control of biochemical functions.
Consistent with this pattern, alpha-diversity increased along the drainage gradient (
Table 8).
Flood-induced “compression” of diversity (H′ ↓ 34%, 1−D ↓ 20%) reflects dominance of a narrow reducing guild; by July, both indices were statistically indistinguishable from pre-flood values (t-test, p > 0.05).
3.10. Threshold Analysis and Degradation Drivers as Shown (Figure 7)
ROC analysis identified statistically significant thresholds (α = 0.05):
Water depth ≥ 0.5 m and duration > 7 days—onset of compaction (ρ + 0.08–0.10 g cm−3) and porosity loss (−6–8 pp).
Depth > 1.0 m and duration ≥ 12 days (Class III)—maximum Corg loss (−0.40 pp) and Zn/Ni reaching 1.2–1.3 × MAC.
Figure 7.
ROC curves linking inundation metrics to degradation indicators Δρ and ΔC_org). Curved lines show ROC performance for soil compaction (Δρ) and organic carbon loss (ΔC_org) thresholds. The diagonal dotted line from (0,0) to (1,1) represent random classification(AUC = 0.5).
Figure 7.
ROC curves linking inundation metrics to degradation indicators Δρ and ΔC_org). Curved lines show ROC performance for soil compaction (Δρ) and organic carbon loss (ΔC_org) thresholds. The diagonal dotted line from (0,0) to (1,1) represent random classification(AUC = 0.5).
These thresholds match mapped frequency patterns: 83% of Class III areas occur in microdepressions and planar fluvial flats with impeded drainage. Textural mapping shows that critical zones coincide with fine-sand alluvium (sand 45–55%), forming a 10–25 cm “cap” over loamy substrate, producing a two-layered profile that (i) facilitates rapid saturation (Kfs ≈ 10−4 m s−1), (ii) impedes downward percolation (substrate Kfs ≈ 10−6 m s−1), and (iii) prolongs anaerobiosis.
Anthropogenic pressures reinforce degradation:
- -
Late-winter tillage (Feb–Mar) during thaw disrupts aggregates and accelerates first-flush erosion (suspended load +42%).
- -
Seasonal grazing (May–June) causes localized over-compaction (ρ + 0.06 g cm−3) and surface sealing; infiltration halves to one-third of baseline.
- -
Heavy machinery (forage harvest) creates wheel-rut traps retaining water an additional 3–4 days, extending anaerobic phases and mobilizing Zn/Ni.
A multiple-regression model (R2 = 0.64; p < 0.01) attributes the largest share of variance in a composite degradation index to duration × texture (β = 0.51), followed by grazing (β = 0.27) and inundation depth (β = 0.22). A critical combination of factors is deep (>0.5 m) and prolonged (>7 days) flooding of the fine-grained sand cover, aggravated by the load from land use. It is in these areas that priority intervention (priming, gypsum, and grazing restrictions) and constant monitoring are required.
4. Discussion
4.1. Regional and Global Context
The observed hydrological, structural, and geochemical characteristics along the Zhabai River correspond to regional and global trends. The data show increased frequency of short-term floods, an increase in the sand content and a decrease in the level of organic carbon in the soil (C_org) [
4,
32]. The mobility of heavy metals is significantly affected by changes in pH and the buffering effect of carbonates [
33].
In the regional context, a similar dynamic is observed on the Ishim River, where peak runoff occurs more frequently and winter soil moisture increasingly affects spring runoff [
34]. This indicates the increasing synchronicity of hydrological processes and soil reactions to climate change in the steppes of Northern Kazakhstan.
Our study differs from [
6] and [
34] in that it combines high-resolution UAV and lidar data with long-term satellite observations (2012–2024), takes into account both spatial and temporal variability, and combines hydrological, soil, and microbiological data. This makes it possible to accurately assess the depth of flooding, identify risk areas and the vulnerability of the soil.
Overall, this is the first comprehensive study of the impact of spring floods on floodplain soils in Northern Kazakhstan. Despite compliance with general global trends, the relatively high post-flood mobility of Zn and Ni highlights the features of soil management in Kazakhstan related to the buffering capacity of soils and the content of carbonates.
4.2. Priority Zones and Management Implications
About 820 hectares were identified as “critical zones”, which are micro-sinks in fine sand, where the depth of flooding was above 1 m and the water persisted for more than 12 days. Enhanced management measures in these high-risk areas make it possible to purposefully restore only about 12% of the total floodplain area, while reducing overall restoration costs by almost 60% compared to full-scale measures.
To enhance hydrological stability, a combined set of measures is proposed. These include the installation of shallow surface drains (0.4 × 0.6 m, spaced every 35 m), subsoiling to a depth of 50 cm, and gypsum application at a rate of 1.5 t ha−1. Together, these treatments help to disrupt compact carbonate layers, accelerate water drainage by roughly 3–4 days, and decrease Zn and Ni concentrations to around 0.9 × MAC levels. In parallel, phytoremediation with Phragmites australis and Phalaris arundinacea proved effective in restoring soil organic carbon, bringing C_org back to nearly 90% of its baseline value within two growing seasons.
Agroecological measures complement technical interventions and include:
Winter or flood-resistant spring crops (rye, oats, and vetch–oat mixtures) with sprinkler irrigation;
Rotational grazing with a 45-day rest period and a delay to Eh > +150 mV, maintaining a livestock population of <0.4 per 1 ha;
Agriculture with controlled movement of machinery to reduce the bulk density < 1.35 g/cm3.
The integrated application of these measures ensures cost-effective and sustainable recovery of soils after floods and the long-term sustainability of floodplain ecosystems. These combined measures reduced soil structural damage by roughly one-third and increased forage yields by 12–15% in the first season, while stabilizing redox profiles and supporting rapid ecological recovery.
This comprehensive analysis transforms abstract flood risk indicators into specific agronomic strategies for areas in Northern Kazakhstan. The identification of 820 hectares of particularly vulnerable micro-sinks allows for targeted drainage and reclamation, providing up to 60% resource savings. The treatment with soil and gypsum reduced the stagnation of water by 3–4 days and led to a decrease in the content of labile fractions of Zn and Ni to a safe level. The established operating thresholds for depth (0.5 m) and duration of flooding (7 days) provide a practical basis for adaptive crop selection and pasture management.
Finally, the demonstrated link between increasingly frequent “rapid” floods and enhanced snow-water equivalent, combined with earlier spring warming, offers actionable insights for climate-adaptive agro-policy [
35]. Integrating hydrological forecasts with soil monitoring can improve preparedness and strengthen resilience of agroecosystems in the Atbasar District and other semiarid floodplains of Central Asia [
36].
5. Conclusions
This study assessed the impact of spring floods on floodplain soils along the Zhabai River using high-resolution field monitoring and remote sensing (2012–2024). The results of the study provide practical recommendations for flood-resistant land management and sustainable agroecological planning.
Critical flooding thresholds for soil compaction, loss of organic carbon, and mobilization of heavy metals were identified, providing a quantitative basis for early warning and risk assessment.
- 2.
Spatial risk zones
High-risk micro-depressions with greater depth and prolonged flooding were mapped, which made it possible to take targeted measures and efficiently allocate resources.
- 3.
Mitigation strategies
Recommended measures, including site-specific drainage, soil loosening, gypsum, and adaptive management of crops and livestock grazing, can reduce soil degradation and remediation costs while contributing to environmental restoration.
- 4.
Policy and agroecological implications
The results confirm the validity of planning, early warning systems, and decision-making for flood-prone areas. These findings are directly applicable to agriculture, helping land managers reduce yield losses in semi-arid floodplains of northern Kazakhstan and similar regions.

