Article

Spatio-Temporal Patterns and Decoupling Analysis of Land Use-Related Carbon Emissions in Jilin Province

College of Geographic Science and Tourism, Jilin Normal University, Siping 136000, China
*
Author to whom correspondence should be addressed.
Sustainability 2025, 17(22), 10377; https://doi.org/10.3390/su172210377
Submission received: 13 October 2025 / Revised: 6 November 2025 / Accepted: 15 November 2025 / Published: 20 November 2025

Abstract

Land use change is a key driver of regional carbon emissions. Understanding the mechanisms through which regional land use changes influence carbon emissions, as well as their spatiotemporal evolution, is of great significance for the optimization of land use structure and the formulation of low-carbon policies. This study, based on land use data and socio-economic data from 2002 to 2022, combines decoupling analysis models with carbon carrying capacity assessment frameworks to systematically analyze the dynamic evolution of carbon emissions from land use in Jilin Province. The results show the following: (1) From 2002 to 2022, the cultivated land area in Jilin Province remained stable and accounted for the largest proportion; the areas of water bodies and construction land expanded, while forest, grassland, and unutilized land continued to decline. (2) Total carbon emissions exhibited a “growth-stabilization-slight decline” trend, with construction land contributing the most to emissions. Spatially, carbon emissions were concentrated in the central region with Changchun at its core. (3) The overall carbon ecological carrying capacity of Jilin Province showed a fluctuating upward trend, with notable differences in carbon ecological carrying capacity across cities. (4) Cultivated land showed the highest correlation with carbon emissions, followed by woodland. The decoupling relationship between carbon emissions and economic development exhibited phase fluctuations, evolving from weak decoupling to strong decoupling and then transitioning back to weak negative decoupling. Therefore, it is recommended that effective measures be adopted to curb the excessive expansion of construction land, enhance ecological carbon sink functions, and facilitate the transformation of cultivated land from a carbon source to a carbon sink. This will promote the efficient and green utilization of land resources, advance the synergistic progress of economic development and environmental protection, and achieve the goal of regional sustainable development.

1. Introduction

In the context of global climate change and the “dual carbon” targets, land-use change has become one of the key factors influencing regional carbon emissions. With the continuous growth of the global economy and population, the relationship between land use change and carbon emissions has increasingly attracted widespread attention within the international academic community. The impact of land use change on carbon emissions represents not only a significant challenge for developing nations such as China but also a critical issue for global climate governance and sustainable development. As the largest developing country globally, China has experienced rapid economic growth in recent years while simultaneously facing significant carbon emission challenges. In 2020, during the 75th United Nations General Assembly, China set forth the ambitious goal of achieving carbon peak by 2030 and carbon neutrality by 2060. This strategic initiative further underscores the pivotal role of land use in realizing these emission reduction targets.
As a vital grain production base and ecological functional zone in China, Jilin Province is at a critical juncture where high-quality economic development and ecological conservation must advance in tandem. The impact of shifting land use patterns on regional carbon cycles warrants urgent, in-depth investigation. Consequently, a thorough analysis of land use-related carbon emissions holds significant implications not only for Jilin’s low-carbon development but also offers valuable insights for sustainable land management in comparable regions worldwide. For instance, Foley et al. [1] examined the contribution of global land-use change to carbon emissions, identifying it as one of the primary sources of global greenhouse gas emission. Furthermore, Shiqi Tian et al. [2] emphasized the long-term impacts of land-use change, particularly its role within the global carbon cycle.
In recent years, scholars both domestically and internationally have conducted extensive research on the accounting of carbon emissions from land use. Among the various methodologies, bookkeeping models [3], sample plot surveys [4], and emission inventory approaches [5] are the most commonly used. Of these, the emission inventory method is recognized for its simplicity, practicality, and broad applicability, making it widely adopted. From a research perspective, studies on land-use carbon emissions have expanded across multiple dimensions, covering topics such as the spatiotemporal differentiation of carbon emissions [6,7], carbon budgets [8], the effects of carbon emissions [9], and future carbon emission projections [10]. For instance, Huang et al. [11] applied a land use transfer matrix and carbon emission coefficient method to assess the impact of land use change on carbon patterns in the Poyang Lake Basin. Liu et al. [12] evaluated carbon budget trends in Jiangsu Province using carbon emission and sink accounting models. Li et al. [13] employed emission coefficient conversion methods to analyze changes in land use carbon emissions and influencing factors in Gansu Province. Additionally, Shen et al. [14] used the Tapio decoupling model to examine the decoupling relationship between carbon emissions and economic growth across four major regions of China. Furthermore, GIS and RS technologies have been applied to interpret different land use types, supporting the development of refined and systematic carbon budget cycling frameworks [15].
However, existing studies have largely focused on macro-scale analyses, and the long-term spatiotemporal evolution of carbon emissions from land use remains insufficiently understood. In particular, the dual role of cultivated land as both a carbon source and a carbon sink, as well as the complexity and heterogeneity of the decoupling mechanisms between land use change and carbon emissions, have been largely overlooked. Research specifically targeting Jilin Province is notably scarce, and in global studies on the mechanisms linking land use change and carbon emissions, Jilin Province has received insufficient attention. Most current studies fail to systematically analyze the dual role of cultivated land and neglect the spatiotemporal heterogeneity of how land use changes influence carbon emission decoupling. Therefore, developing land spatial optimization and targeted emission reduction policies adapted to the actual conditions of Jilin Province remains an urgent challenge.
In response, this study utilizes land use data for Jilin Province from 2002 to 2022 to analyze the spatiotemporal characteristics of carbon emissions across different periods and their relationships with economic growth and ecological carrying capacity. It further explores the spatial heterogeneity and driving mechanisms of land use change and carbon emission decoupling. The findings provide scientific support and policy guidance for the province’s low-carbon transition and green development, while also offering valuable insights for sustainable development and carbon reduction strategies in similar regions worldwide.

2. Materials and Methods

2.1. Study Area Overview

Jilin Province (40°52′–46°18′ N, 121°38′–131°19′ E) is a central region in the revitalization of the northeast’s old industrial base and the modernization of agriculture (Figure 1). Covering an area of approximately 187,400 km2, the province consists of one sub-provincial city, seven prefecture-level cities, one autonomous prefecture, 60 counties (cities, districts), and the Changbai Mountain Protection and Development Zone Administrative Committee, with Changchun as the provincial capital. Jilin experiences a temperate continental monsoon climate, characterized by distinct seasonal changes. The average annual temperature ranges from 2 °C to 6 °C, and the annual precipitation typically falls between 400 and 900 mm. The province’s topography is marked by significant variation: the southeastern part is dominated by mountainous terrain and rich forest resources, serving as a vital ecological barrier; the central region is part of the Songliao Plain, with flat, expansive land; while the northwest features plains and wetlands, with the western part of the province being a typical agropastoral zone. As a key national grain production base, Jilin’s total grain output in 2022 reached 4.08 million tons, maintaining a leading position in the country for several years. Notably, corn production accounts for about 10% of the national total, and the province holds an international reputation as part of the “Golden Corn Belt.” In terms of industry, Jilin has developed a diverse industrial system centered around automotive manufacturing, petrochemicals, and agricultural product processing. Changchun, the provincial capital, is known as the “cradle of China’s automobile industry,” with FAW Group consistently producing over 10% of the country’s annual automobile output.

2.2. Data Sources

The land use raster data for Jilin Province from 2002, 2007, 2012, 2017, and 2022 were obtained from the CLCD dataset published by the research team of Professor Huang Xin at Wuhan University [16], with a spatial resolution of 30 m × 30 m. In this study, five time points (2002, 2007, 2012, 2017, and 2022) were selected for analysis. These years correspond to the available periods of the CLCD dataset, which provides consistent and high-quality land use data at five-year intervals across China. This temporal resolution effectively captures long-term land use dynamics and economic transitions while maintaining data consistency and model stability.
The CLCD dataset was produced through a combination of pixel- and object-based supervised classification methods using Landsat surface reflectance data, incorporating temporal-spectral metrics and time-series analysis on the Google Earth Engine platform. A spatio-temporal consistency adjustment was applied to ensure continuity among different years, including temporal filtering and post-classification refinement to reduce misclassification noise. The overall accuracy of the CLCD data exceeds 85%, and the Kappa coefficient is higher than 0.80, as verified by visual interpretation and comparison with high-resolution satellite imagery. The CLCD data were further integrated with supplementary information from the Resource and Environmental Data Center of the Chinese Academy of Sciences (http://www.resdc.cn/). According to the national land use classification standard [17], land use types in Jilin Province were reclassified into six major categories: cultivated land, woodland, grassland, water bodies, construction land, and unutilized land.
Energy consumption, socioeconomic, and population data for Jilin Province were sourced from the China Statistical Yearbook and “the Jilin Province Statistical Yearbook”. The administrative boundary vector data for Jilin Province was generated using standard maps, with the review number GS (2024) 0650.

2.3. Research Methods and Ideas

2.3.1. Dynamic Degree of Land Use Change

A single land use dynamic degree is used to analyze the land use changes in Jilin Province, and the equation is
K = U b U a U a × 1 T × 100 %
In the equation, K is the single land use statistic, Ua is the initial land use data, Ub is the final land use data, and T is the time period.

2.3.2. Accounting of Carbon Emissions from Land Use

Regional land use changes significantly affect the carbon cycle of terrestrial ecosystems and are a key driver of regional carbon emission increases. Among these land use types, carbon emissions from woodland, grassland, water bodies, and unutilized land tend to remain relatively stable over extended periods, allowing for direct estimation of their carbon emissions using the carbon emission coefficients provided in the IPCC (2006) Guidelines for National Greenhouse Gas Inventories [18]. These coefficients (t·hm−2) represent the average carbon emissions or absorptions per unit area and are derived from long-term observations of ecosystem carbon fluxes, including soil respiration, vegetation growth, and organic carbon storage. Specifically, the coefficients are calculated by converting ecosystem carbon density (tC·hm−2) into equivalent CO2 emissions using molecular weight conversion (1 tC = 3.667 tCO2). For construction land, carbon emissions are estimated indirectly using regional primary energy consumption data, as this land use type primarily contributes to emissions through human activities such as industrial production, transportation, and residential energy use. Given that cultivated land functions both as a carbon source and a carbon sink [19], its carbon emissions are determined through a comprehensive approach that accounts for both CO2 emissions from soil respiration and fertilizer use and the carbon fixation capacity of crops during photosynthesis. The net carbon emission coefficient for cultivated land is thus derived as the difference between the gross emission coefficient and the carbon sequestration coefficient associated with crop biomass accumulation. Accordingly, the direct calculation method for carbon emissions from cultivated land, woodland, grassland, water bodies, and unutilized land, and the indirect calculation method for construction land, are defined in Equations (2) and (3), respectively. The carbon emission and absorption coefficients used in this study are summarized in Table 1 [19,20,21,22,23,24,25,26,27,28,29,30,31,32,33], which integrates parameters from the IPCC Guidelines and relevant empirical studies on China’s terrestrial ecosystems.
The carbon emission coefficients used in this study were derived from the IPCC (2006) Guidelines for National Greenhouse Gas Inventories [18]. Although several regionally adjusted coefficients for China have been reported, the differences from the IPCC defaults are generally limited at the provincial level. Therefore, the IPCC coefficients were adopted to ensure consistency and comparability with previous studies. However, uncertainties may still exist due to regional variations in land-use structure, vegetation types, and management practices. Future research could further refine these coefficients by incorporating localized empirical data to enhance the accuracy of carbon emission estimates.
Direct Carbon Emission Accounting Method:
C directly = A i × E F i
In the equation, Cdirectly represents the total carbon emissions from non-construction land, Ai represents the area of the i-th type of land use, and EFi represents the carbon emission coefficient of the i-th type of land use. When EFi is positive, it indicates that this type of land is a carbon source; if it is negative, it indicates that it has a carbon sink function.
Indirect carbon emission accounting method:
C indirectly = E j = F C j q j ε j
In the equation, Cindirectly represents the total carbon emissions generated by construction land. Ej is the carbon emissions corresponding to the j-th type of energy, FCj is the actual consumption of the j-th type of energy, qj is the standard coal conversion coefficient of the j-th type of energy, and εj is the carbon emission coefficient of the j-th type of energy. In the study, the consumption of various energy sources, including raw coal, coke, and natural gas, is uniformly converted into standard coal units (Table 2) to more accurately calculate the total carbon emissions from construction land.

2.3.3. Carbon Ecological Carrying Capacity

In recent years, with the continuous development of the low-carbon economy, the concept of carbon ecological carrying capacity has attracted increasing attention. Existing research primarily defines carbon ecological carrying capacity from three dimensions: specific regions, different types of vegetation, and the amount of fixed CO2 [34,35]. However, a universally applicable standard has yet to be established. Therefore, this study builds on the work of previous scholars and defines carbon ecological carrying capacity as the total amount of CO2 fixed by woodland, grassland, and crops within a given region during a specific time period [36]. This definition explores the carbon reduction potential in Jilin Province from the perspectives of woodland, grassland, and crops.
The carbon ecological carrying capacities of woodland and grassland were estimated using their net ecosystem productivity (NEP), which represents the net carbon accumulation of vegetation and soil per unit area over time. Land area data for woodland and grassland (Te, Tf) were derived from CLCD land use classification results. The equations for calculating the carrying capacity of woodland and grassland are as follows:
C e = T e × N E P e × 44 12
C f = T f × N E P f × 44 12
In the equation, Ce and Cf are the carbon ecological carrying capacities of woodland and grassland, respectively. Te and Tf are their areas, respectively. NEPe and NEPf are their average net ecological productions, respectively. The ratio of their CO2 to carbon molecular weight is 44/12.
The Net Ecological Productivity (NEP) data used in this study were derived from the Resource and Environmental Science Data Center of the Chinese Academy of Sciences (https://www.resdc.cn/). Specifically, NEPe and NEPf represent the average net ecological productivity of forest and grassland ecosystems, respectively. These values were calculated based on the Net Primary Productivity (NPP) dataset generated by the CASA model, with a spatial resolution of 30 m × 30 m, which provides consistent and high-quality long-term estimates of ecosystem productivity across China. NEP values were extracted by overlaying the NPP dataset with land use classification data to isolate forest and grassland areas and then averaged for each category. Finally, the NEP values were converted into CO2 equivalents according to the molecular weight ratio (1 gC = 44/12 gCO2). This approach ensures spatial and temporal consistency between NEP estimation and land use data.
The carrying capacity of crops is determined by five key factors. Carbon sequestration is closely related to crop type, yield, and physiological characteristics. The carrying capacity of crops was calculated based on the total carbon stored in aboveground and belowground biomass. Parameters including carbon content per unit biomass (Ci), moisture coefficient (Mi), and root-to-shoot ratio (Ni) were obtained from field survey data and relevant studies (As shown in Table 3) [37]. Economic yield data (Pi) were derived from the Jilin Statistical Yearbook (2002–2022). The estimation was conducted for six main crops: paddy rice, wheat, corn, soybean, peanut, and flue-cured tobacco. The equation used is:
C g = i = 1 n C i 1 M i × 1 + N i × P i × 44 12
In the equation, Cg represents the carbon capacity of the crop, Ci represents the carbon content per unit of biomass, Mi is the moisture coefficient of the crop type, Ni is the root-shoot ratio coefficient of the crop type, and Pi is the economic yield of crop type I.

2.3.4. Correlation Analysis Between Land Use Types and Carbon Emissions

The Gray Relational Analysis (GRA) method was first proposed by Professor Deng Julong in 1995 [38], with the aim of revealing the degree of association between variables within a system. This method offers significant advantages when dealing with situations such as small sample sizes and irregular data distributions. It is characterized by its simplicity in computation and high efficiency. In this study, the relationships among land use types and carbon emissions are complex and interdependent. Compared with methods such as Partial Least Squares Regression (PLS-R), Generalized Additive Models (GAM), and machine learning approaches (Random Forest, XGBoost, LightGBM), GRA offers advantages including low data requirements, minimal model assumptions, and clear interpretability. Therefore, this study employs Gray Relational Analysis, utilizing SPSS Statistics 27 and MATLAB R2021a software, to quantitatively assess the degree of association between various land use types and carbon emissions. This approach helps to identify the primary and potential influencing factors. The equation used is:
G 0 i = 1 n k = 1 n γ 0 i k
The value range of the correlation degree G0i is [0, 1]. The closer its value is to 1, the stronger the correlation between the driving factor and land use carbon emissions, indicating a greater degree of influence.

2.3.5. Tapio Decoupling Model

The decoupling development theory was initially introduced by the Organization for Economic Co-operation and Development (OECD) with the goal of establishing a model to express the environmental pressure associated with economic growth [39,40]. One of the primary objectives of decoupling research is to identify an ideal decoupling state amidst the dynamic changes between economic growth and resource consumption [41]. Given that the Tapio model allows for the analysis and comparison of data across different time periods, it provides a more detailed assessment of the decoupling relationship between land use carbon emissions and the economy. The decoupling model is presented in Equation (8).
e = Δ C / C 0 Δ G D P / G D P 0
where e is the decoupling elasticity index; ΔC is the difference in carbon emissions between the current year and the base year, in ten thousand tons; ΔGDP is the difference in regional gross domestic product between the current year and the base year, in 100 million yuan; C0 and GDP0 are the carbon emissions and regional gross domestic product of the base year, respectively.
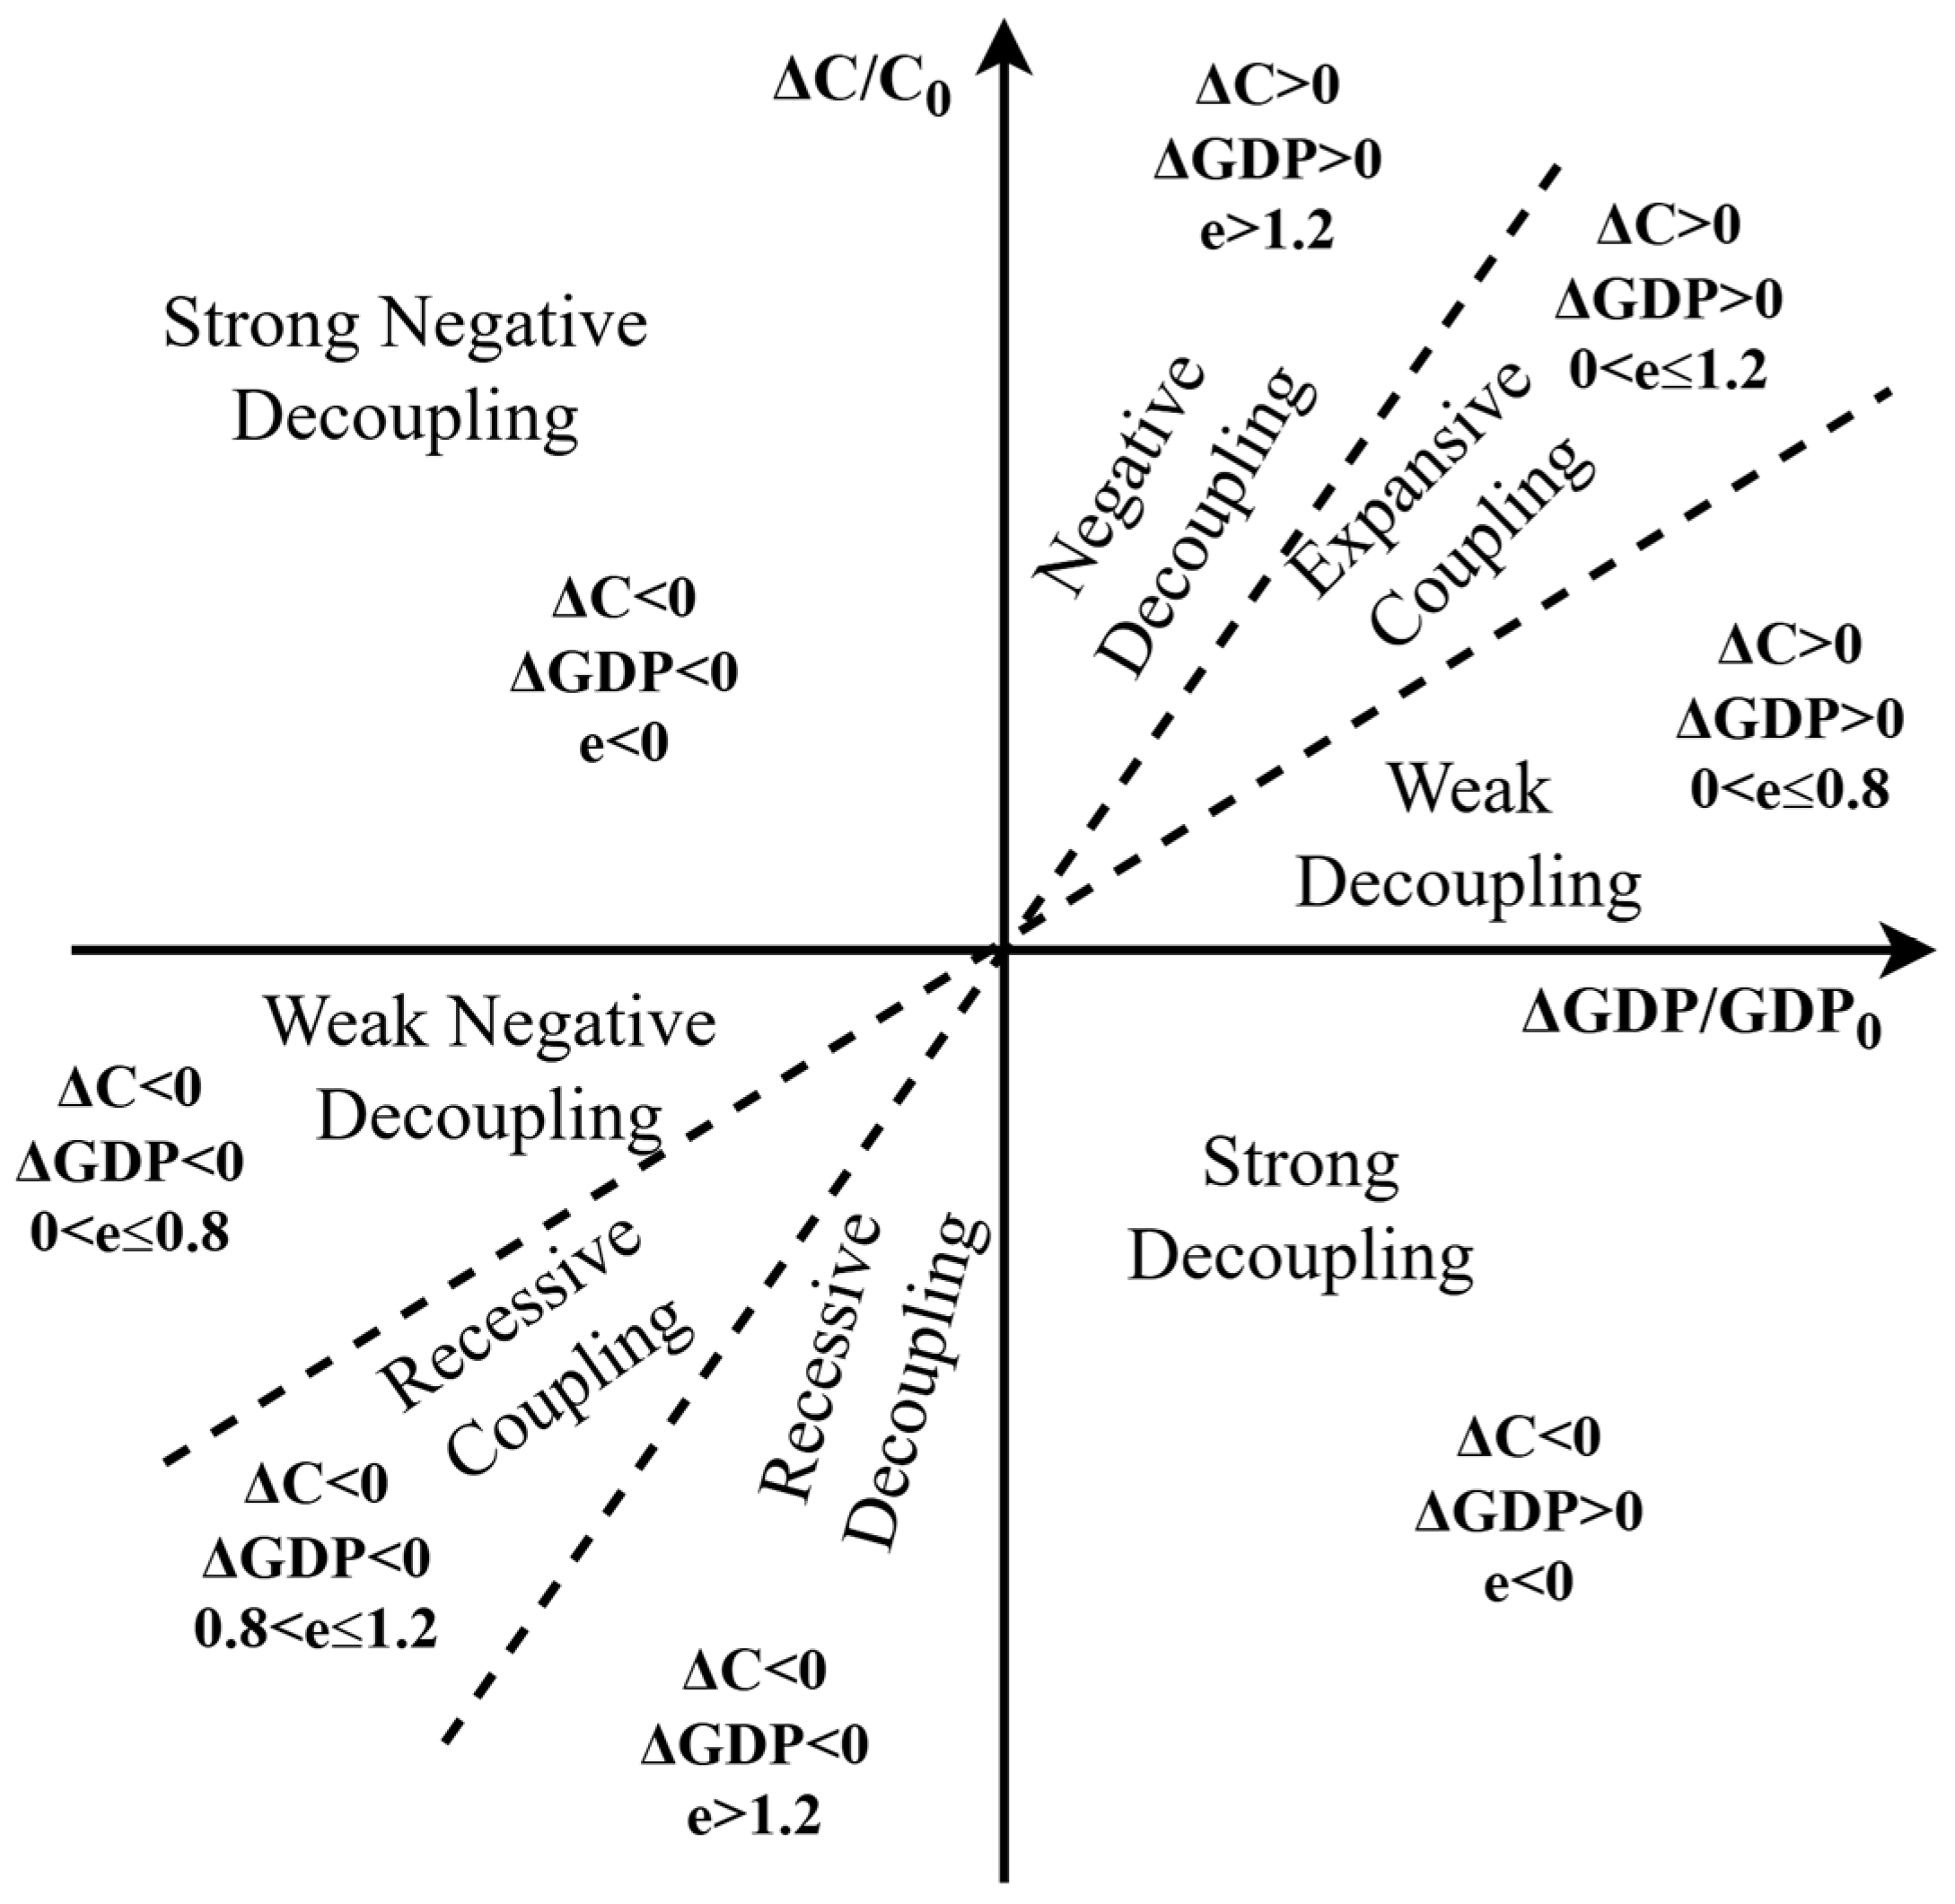
Based on the value of e and the relative growth rates of carbon emissions and GDP, the Tapio model classifies the decoupling relationship into eight categories: strong decoupling, weak decoupling, expansive coupling, expansive negative decoupling, strong negative decoupling, weak negative decoupling, recessive coupling, and recessive decoupling (Figure 2). These categories reflect the direction and intensity of interaction between economic activity and carbon emissions. For example, strong decoupling indicates economic growth accompanied by declining carbon emissions, while expansive negative decoupling signifies that emissions increase faster than economic output.

2.4. Flowchart

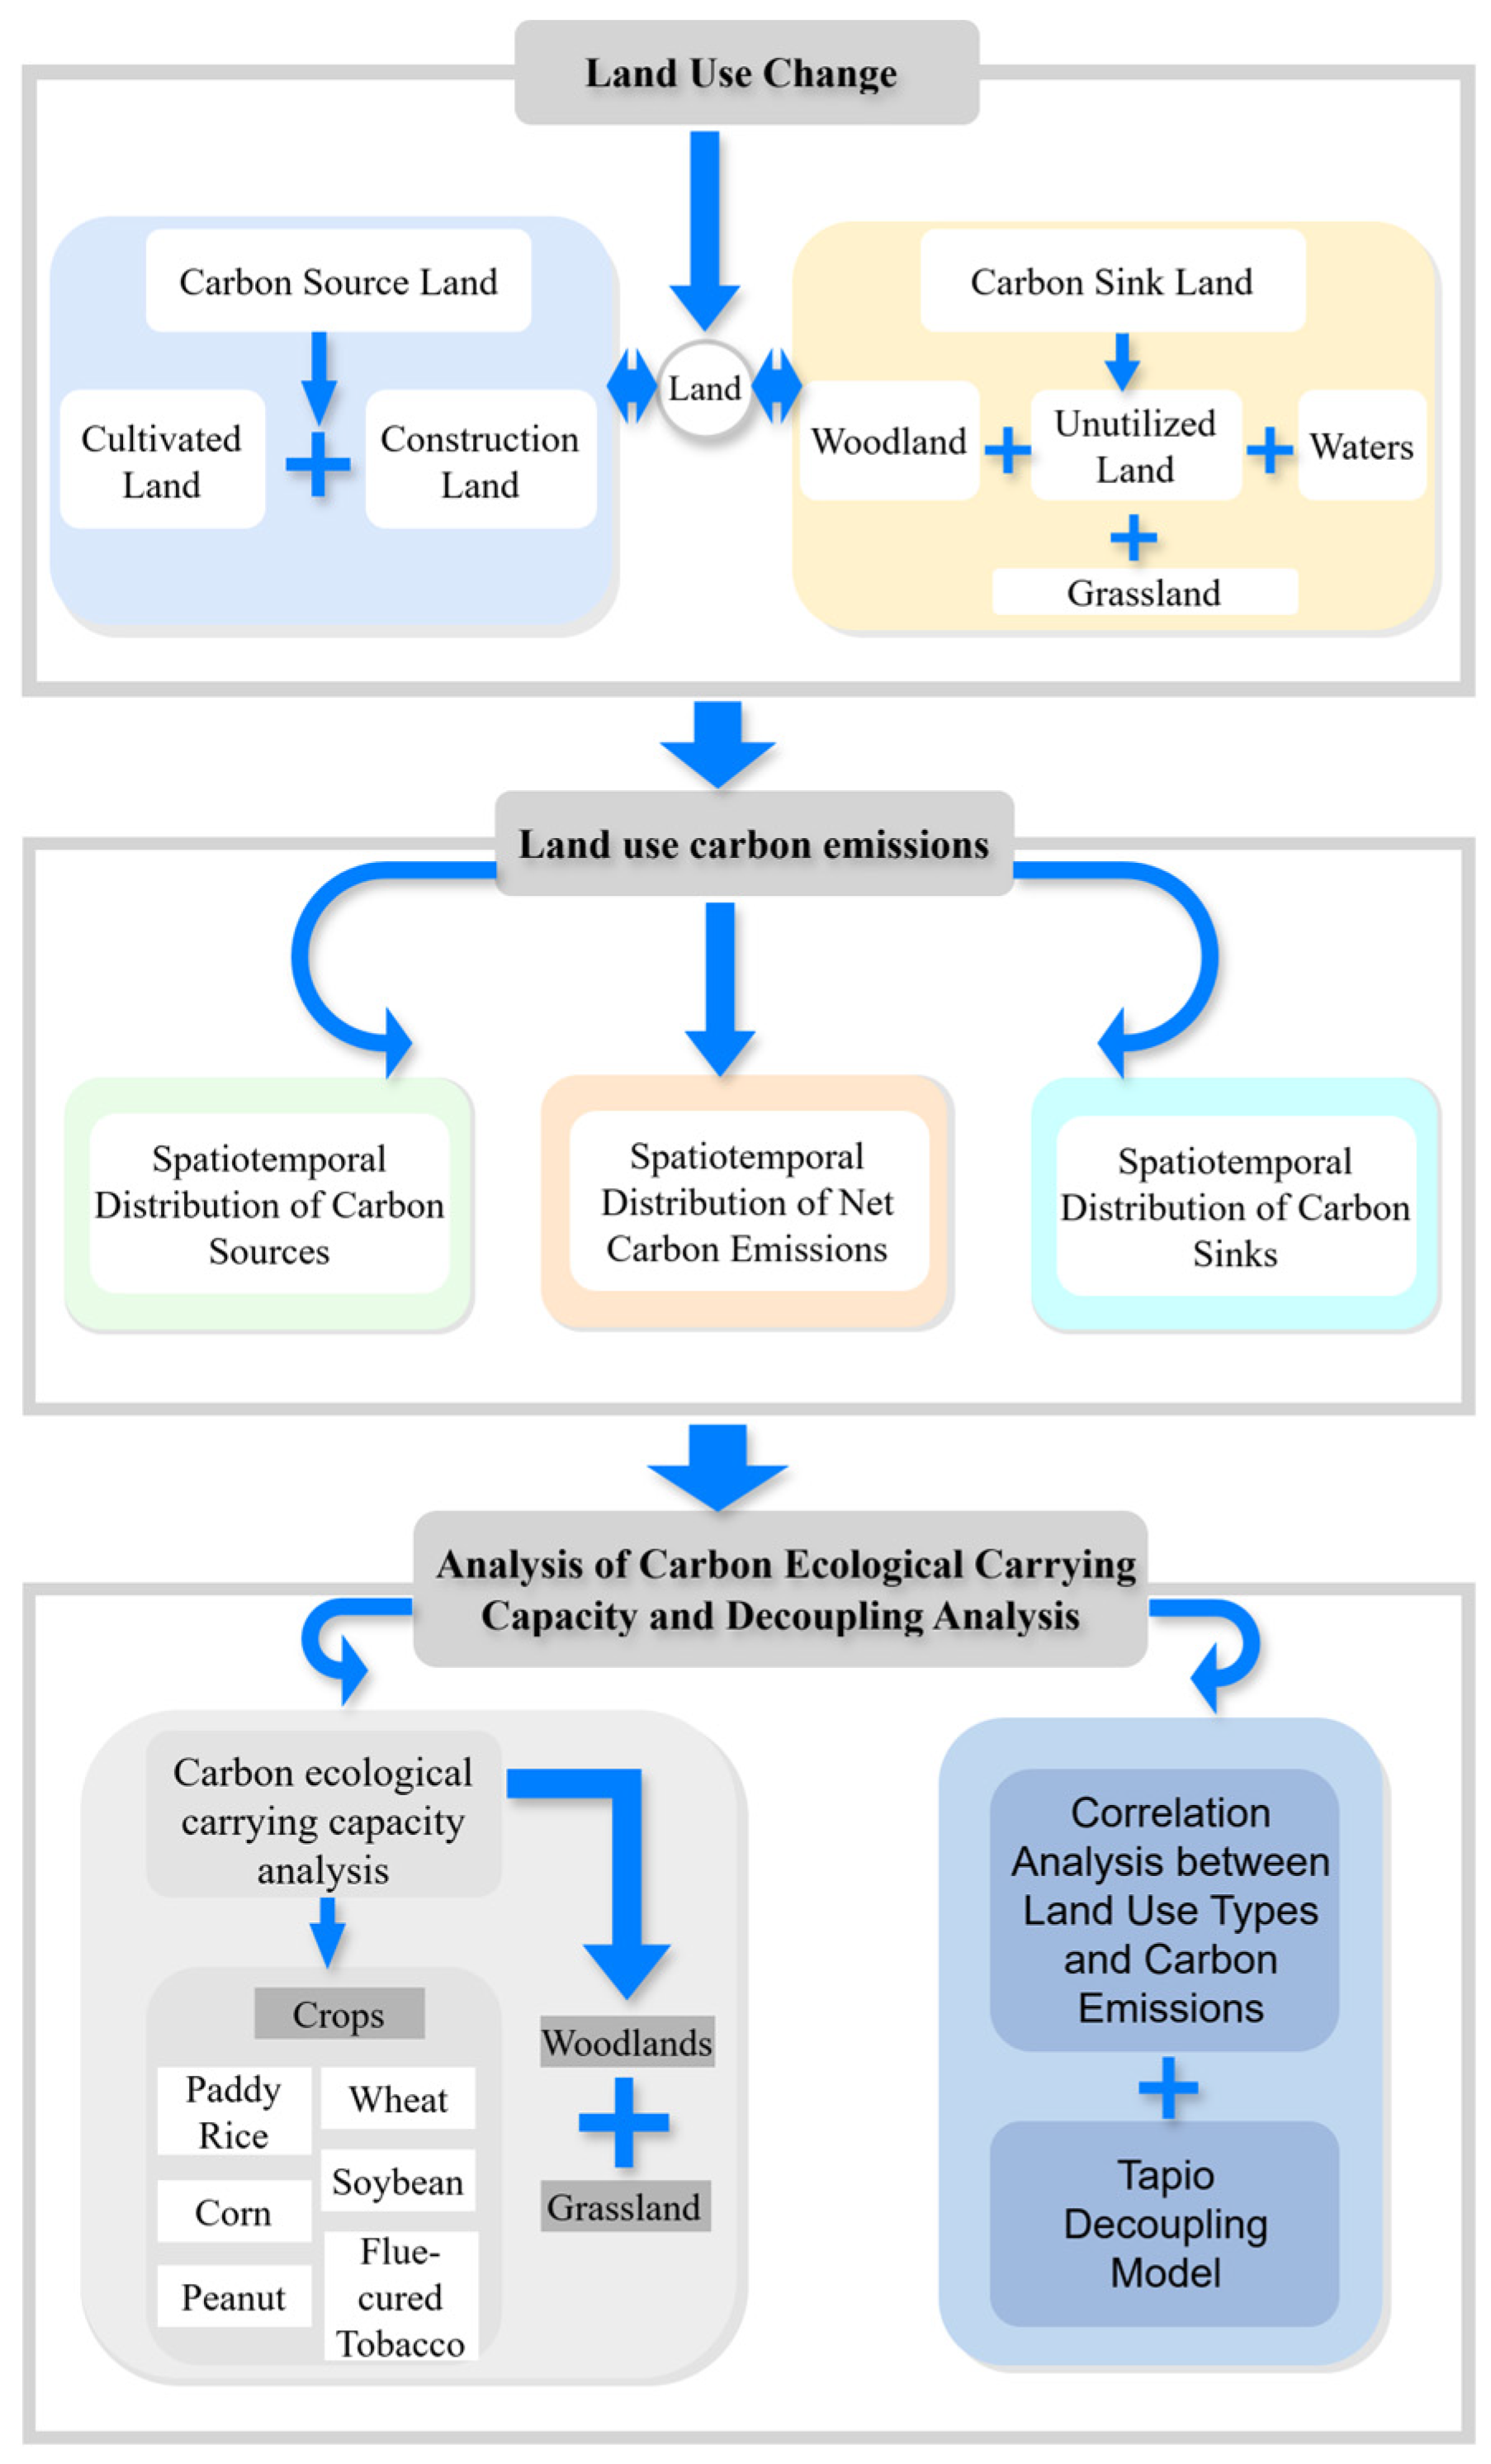
This study adopts a systematic, multi-stage framework to examine the relationship between land use change and carbon emissions. Land use types were classified into carbon source areas (cultivated and construction land) and carbon sink areas (woodland forest, grassland, water, and unutilized land) based on remote sensing data. Carbon emissions were estimated using the emission coefficient and energy consumption methods to reveal the spatiotemporal evolution of net carbon emissions. The carbon ecological carrying capacity was then analyzed to assess the net carbon effect. Finally, correlation analysis and the Tapio decoupling model were applied to explore the linkage and decoupling between land use structure and carbon emissions, providing scientific support for low-carbon land use planning. The detailed analysis flow is shown in Figure 3.

3. Results

3.1. Dynamic Changes in Land Use Types

The distribution of land use types in Jilin Province, in terms of both their area proportions and dynamic changes, exhibits distinct characteristics across different periods and land use categories. From 2002 to 2022, cultivated land consistently accounted for the largest share, maintaining an average proportion of 90,000 km2, approximately 46%. Woodland and built-up areas followed, with respective shares of around 43% and 4%. Together, these three land use types made up more than 90% of the total land area. The remaining land use types, ranked by area proportion from high to low, include grasslands, water bodies, and unutilized land. This distribution pattern indicates that cultivated land, woodland, and built-up areas were the dominant land use types in Jilin Province during this period.
As shown in Table 4, during the years 2002–2007, land use patterns exhibited a “three increases and three decreases” trend. The areas of grasslands, construction land, and water bodies all showed an increasing trend, while the areas of cultivated land, woodland, and unutilized land experienced a decline. From 2007 to 2012, the most notable increase occurred in construction land, which expanded by 2.54%, followed by unutilized land and water bodies. This growth is closely related to significant urbanization and the rapid expansion of urban areas. 2012–2017, compared to the previous period, the most substantial change occurred in grasslands, which decreased by 3.58%. The decline in woodland was also more pronounced, showing a more significant reduction. From 2017 to 2022, the water area increased by 403.99 km2, while the changes in the areas of cultivated land and woodland were relatively minimal.
As illustrated in Figure 4, the land-use dynamics in Jilin Province from 2002 to 2022 followed a distinct and structured transformation trend. The most substantial land transitions occurred among grasslands, unutilized land, and cultivated land, indicating continuous adjustment between ecological and productive land categories. Specifically, grasslands exhibited the largest outflow, primarily converting into cultivated land and unutilized land, which reflects the province’s emphasis on agricultural expansion during earlier years, followed by partial degradation in marginal zones. Conversely, unutilized land showed a significant inflow toward grasslands, construction land, and waters. These bidirectional conversions between grasslands and unutilized land reveal a dynamic balance between ecological restoration and land exploitation.
Overall, Figure 4 demonstrates that Jilin Province’s land-use change over the past two decades is characterized by a progressive increase in construction land, a relative stability in cultivated land, and a gradual reduction in grassland and unutilized land areas. These transformations collectively reveal a shift from an ecologically dominated to a more economically driven land-use structure, reflecting the region’s evolving balance between development and ecological sustainability.
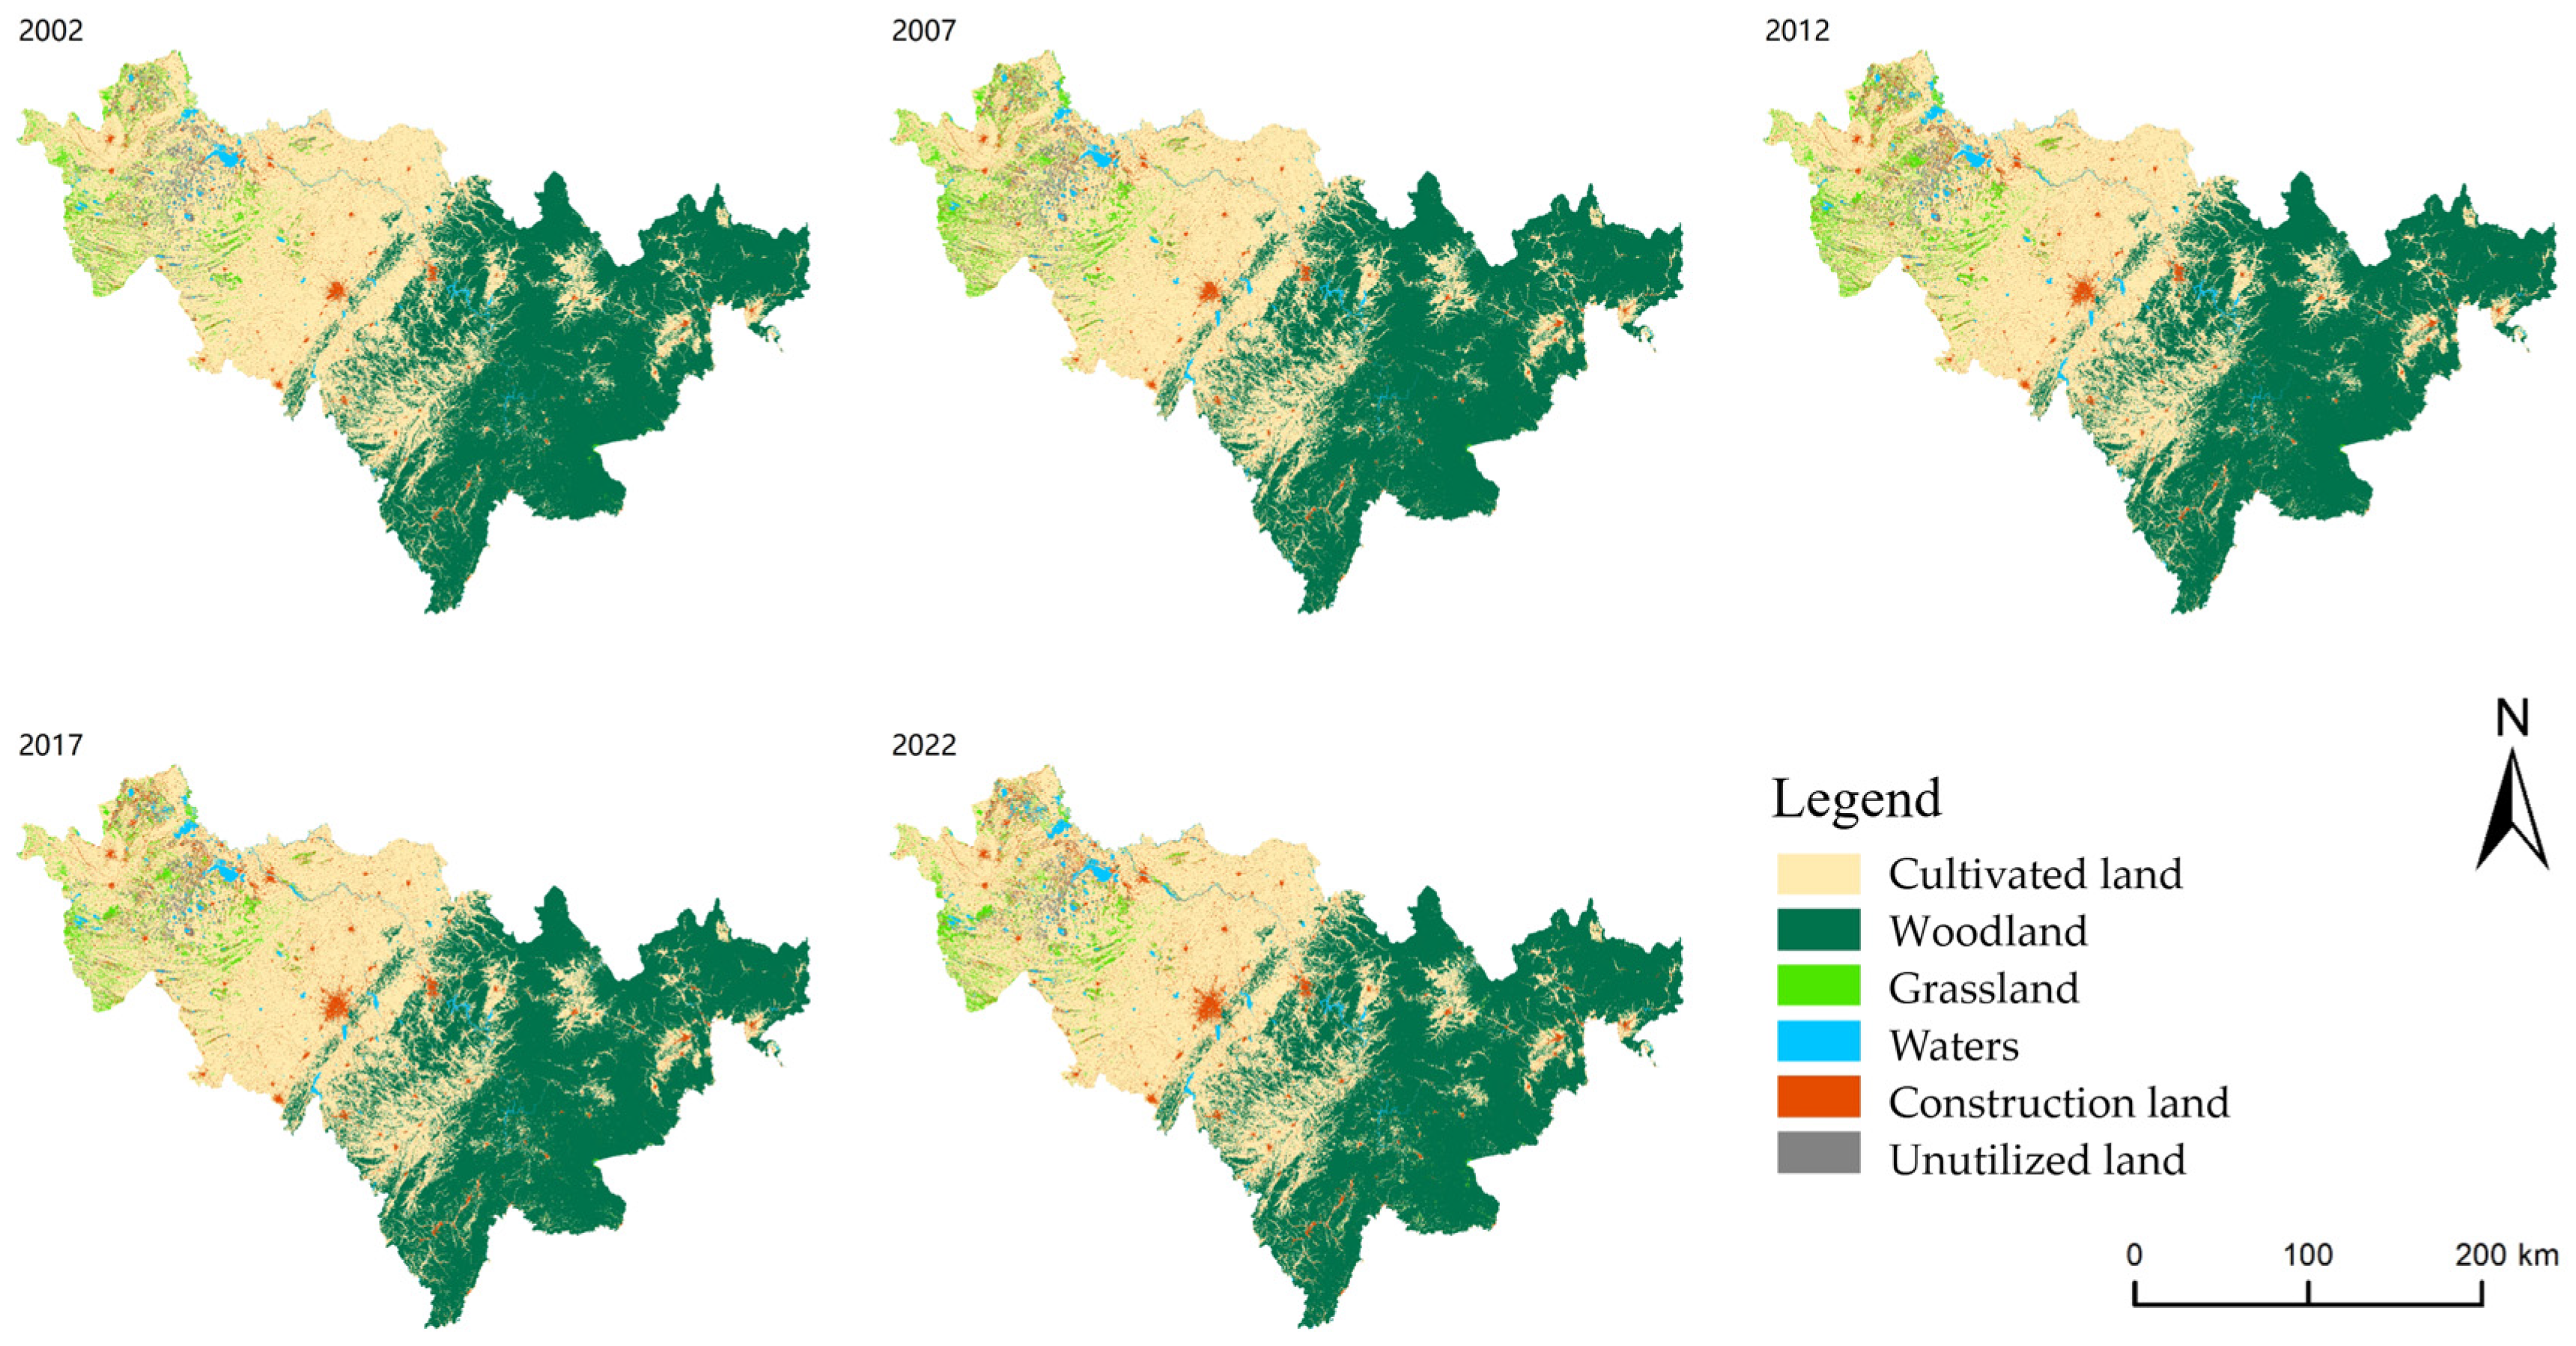
From the perspective of land use spatial patterns, cultivated land is primarily concentrated in the central lowland areas, as well as in the eastern mountainous and semi-mountainous regions. Over the period from 2002 to 2022, its distribution exhibited an initial increase followed by a subsequent decrease. Forestland is predominantly located in the eastern mountainous regions, with a noticeable trend of area reduction. Grassland is mainly distributed along the western plains’ edges and partly on the peripheries of eastern forest areas. Although water bodies occupy a relatively small area, there has been an observable expansion in their spatial extent, particularly in regions previously occupied by cultivated land. Urban built-up areas are largely concentrated in the central urban cluster core, the river valley plains of various regions, and along major transportation corridors. The area of urban land has consistently increased throughout the study period, reflecting the rapid urbanization process in Jilin Province during this time. Unutilized land has significantly decreased, particularly in areas previously occupied by cultivated land or water bodies, which have been extensively converted for other uses. For instance, large areas of unutilized land in the western part of the province have been converted into grassland, serving as a direct manifestation of Jilin Province’s success in the reclamation of saline-alkali land (see Figure 5).

3.2. Spatiotemporal Evolution of Carbon Emissions from Land Use

As shown in Table 5, the carbon emissions from construction land contribute the most, accounting for approximately 90%, while the carbon emissions from cultivated land are the lowest, fluctuating around 10%. This indicates that the rapid urbanization process has led to an increasing pressure on carbon emissions. In terms of carbon sequestration, forestland has consistently served as the primary carbon sink, with its carbon storage capacity declining from −511.90 × 10⁴ t to −496.43 × 10⁴ t, reflecting a weakening trend. This decline may be linked to a decrease in forest cover or ongoing ecosystem degradation. Conversely, grassland, water bodies, and unutilized land contribute minimally to carbon sequestration, with their contributions remaining below −10 × 104 t. Therefore, it is crucial to control the expansion of built-up areas and promote the increase in forestland and water bodies. Such measures could reduce carbon emissions and enhance carbon absorption, ultimately leading to a reduction in the overall carbon output of Jilin Province.
From a temporal perspective, the net carbon emissions from land use in Jilin Province exhibit distinct phase characteristics over the period of 2002–2022. The first phase (2002–2012) represents a period of rapid growth, with emissions increasing from 2788.20 × 104 t to 7041.45 × 104 t. This phase is closely associated with rapid economic development and a significant rise in urbanization levels, during which the continuous expansion of construction land drove a sustained increase in regional carbon emissions.
The second phase (2012–2022) marks a shift to a relatively stable or even slightly decreasing trend in carbon emissions. This change can primarily be attributed to the gradual implementation of national energy conservation and emission reduction policies. As a key old industrial base in China, Jilin Province has been significantly influenced by these national policy directives, particularly in terms of its industrial structure and energy consumption patterns. This phase reflects the interactive relationship between policy interventions and regional development, illustrating the effectiveness of regulatory measures in shaping local carbon emissions.
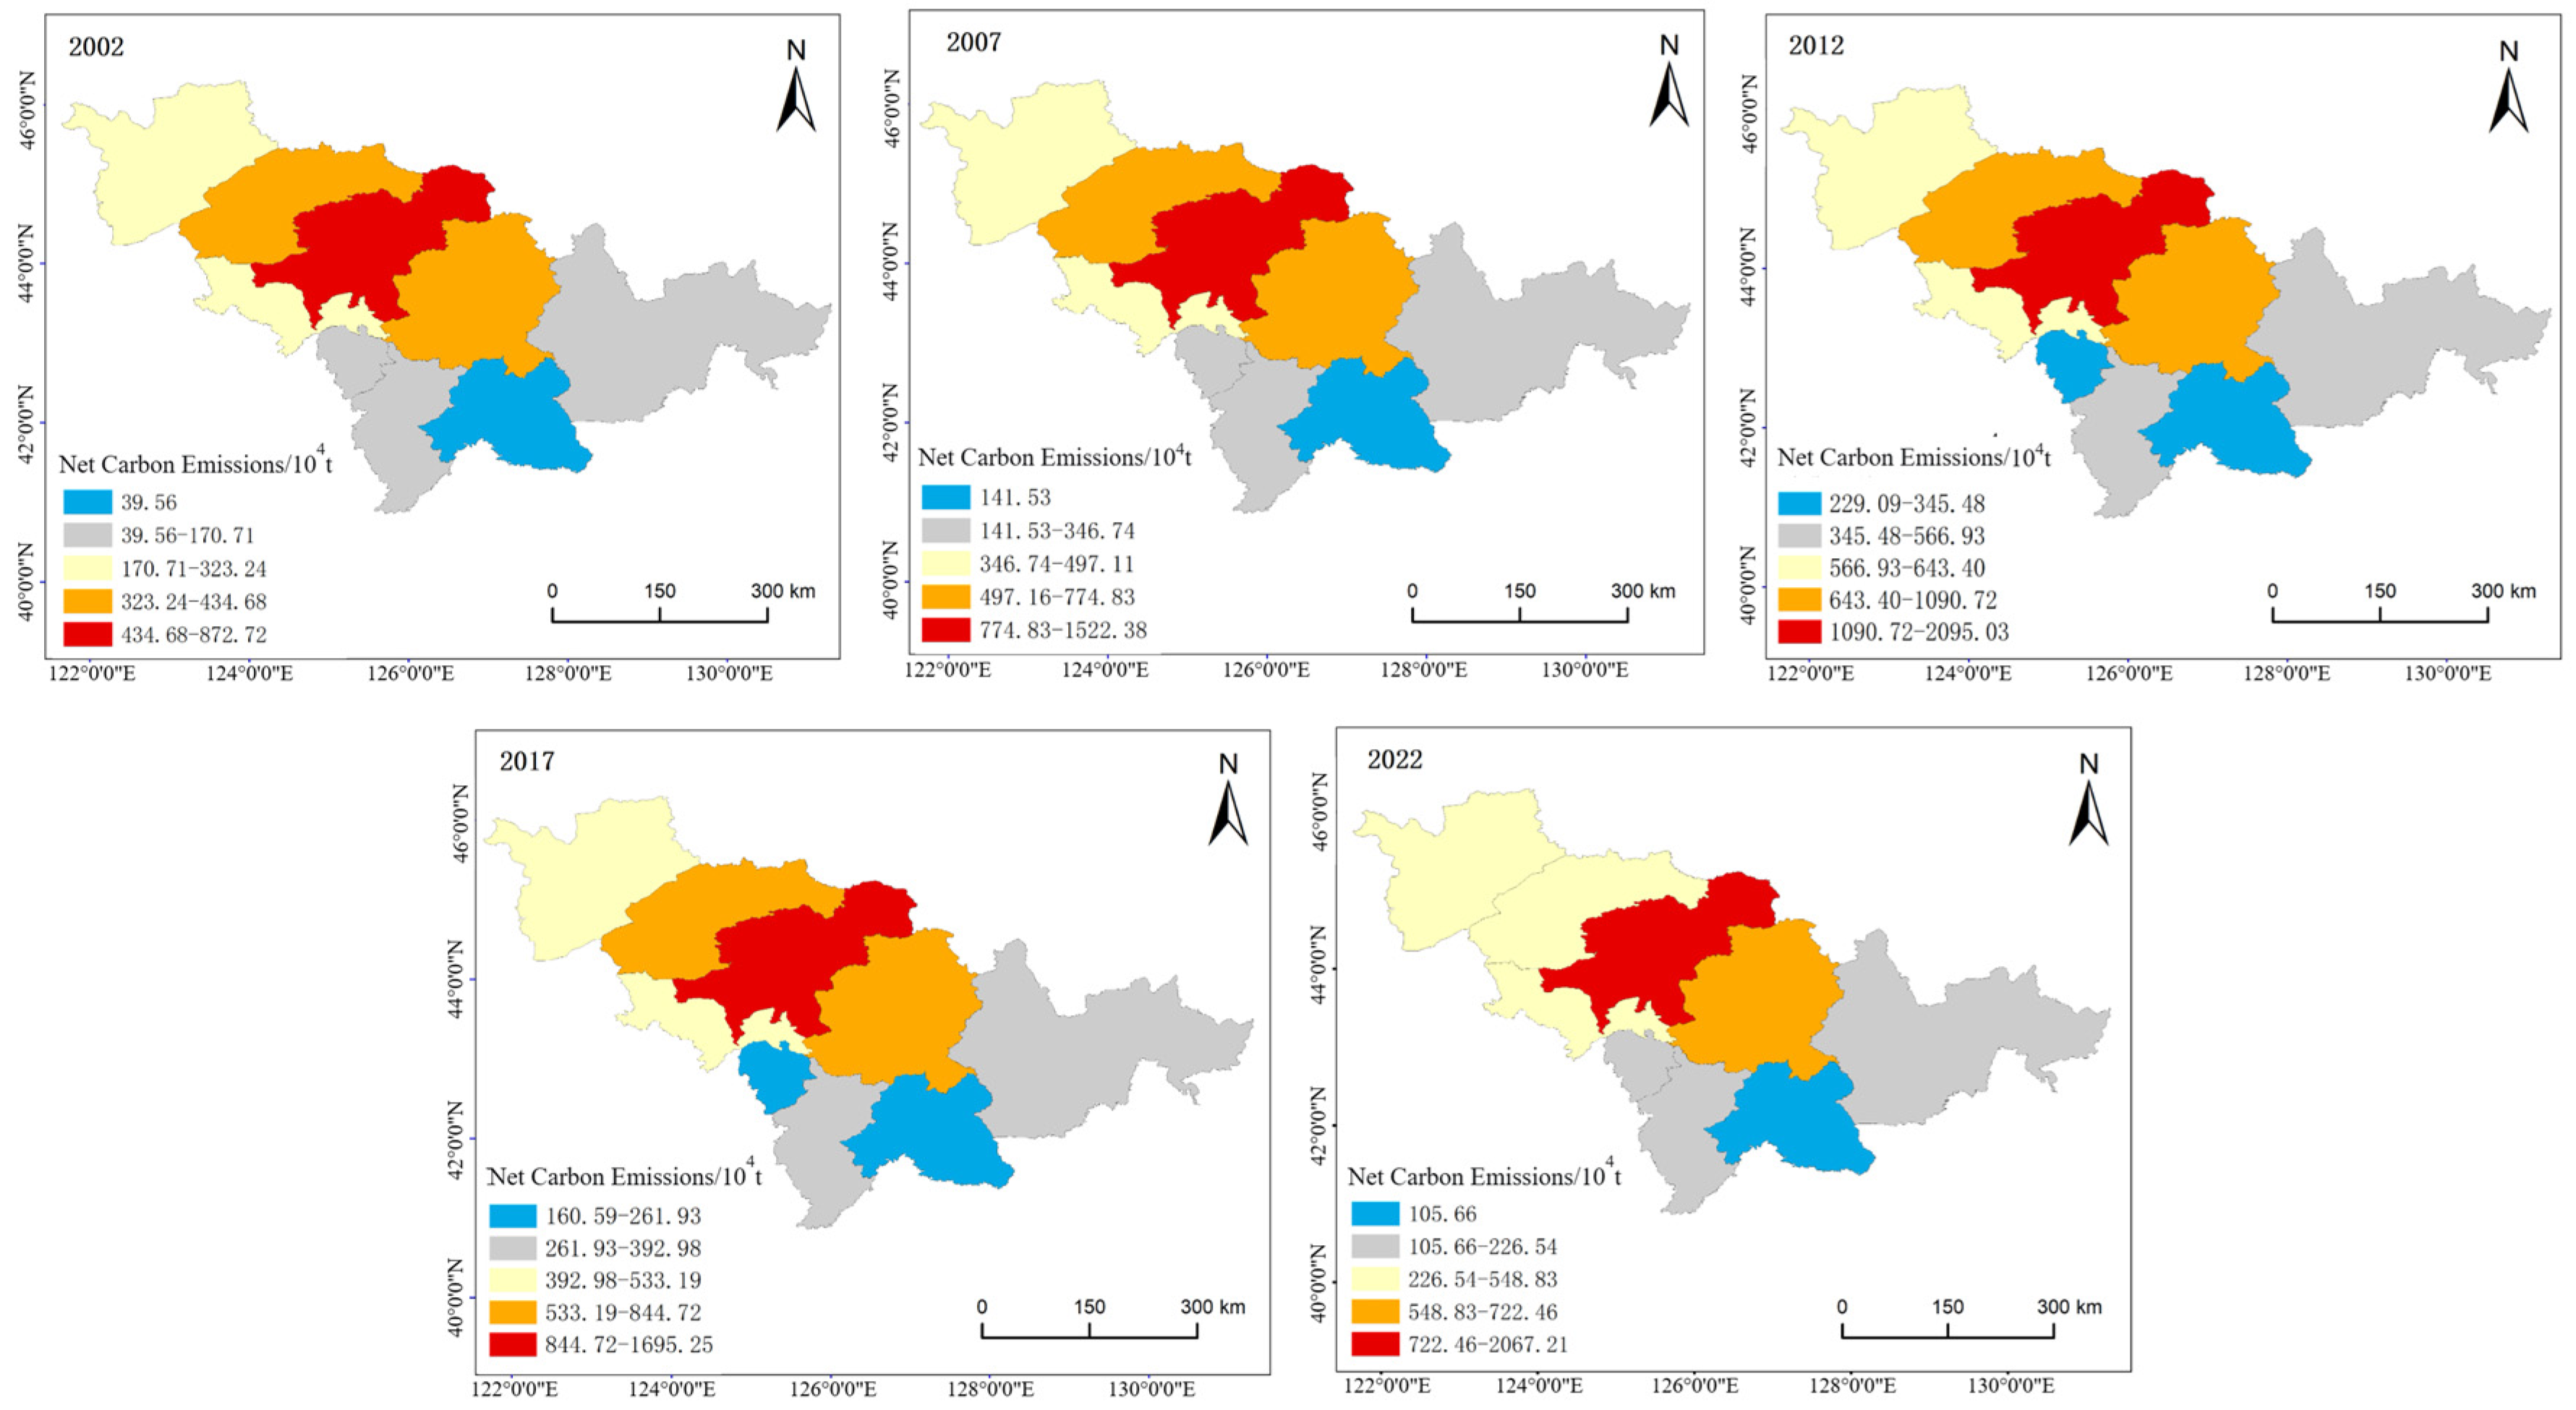
This study employs a natural discontinuity method to categorize net carbon emissions into five distinct levels, with Level 1 representing the minimum and Level 5 representing the maximum (Figure 6). The differences in net carbon emissions across various prefecture-level cities in Jilin Province are evident. From the spatial distribution of land-use carbon emissions between 2002 and 2022, it is clear that carbon emissions in the province are predominantly concentrated in the central region, with Changchun City as the core. The emissions exhibit a spatial gradient extending outward from Changchun. Notably, the land-use carbon emission changes in Liaoyuan and Songyuan cities show the most significant fluctuations during this period. Changchun City consistently remains in the Level 1 category for net carbon emissions, primarily due to the concentration of industrial development in the region. In addition, the central part of Jilin, including Songyuan and Jilin cities, also experiences relatively high carbon emissions. The Chang–Ji–Tu Development and Opening-Up Pilot Zone, along with the north–south industrial corridor involving Siping, further reinforced emission intensity in the central zone by accelerating urban–industrial integration and land-use conversion. In contrast, the Yanbian Korean Autonomous Prefecture, Baishan City, Tonghua City, and Liaoyuan City have consistently remained in low-carbon emission areas, as these regions are predominantly characterized by cultivated land and forestland. With relatively rich forest resources, the carbon emissions per unit area of land use in these areas are comparatively low.

3.3. Spatio-Temporal Analysis of Carbon Ecological Carrying Capacity

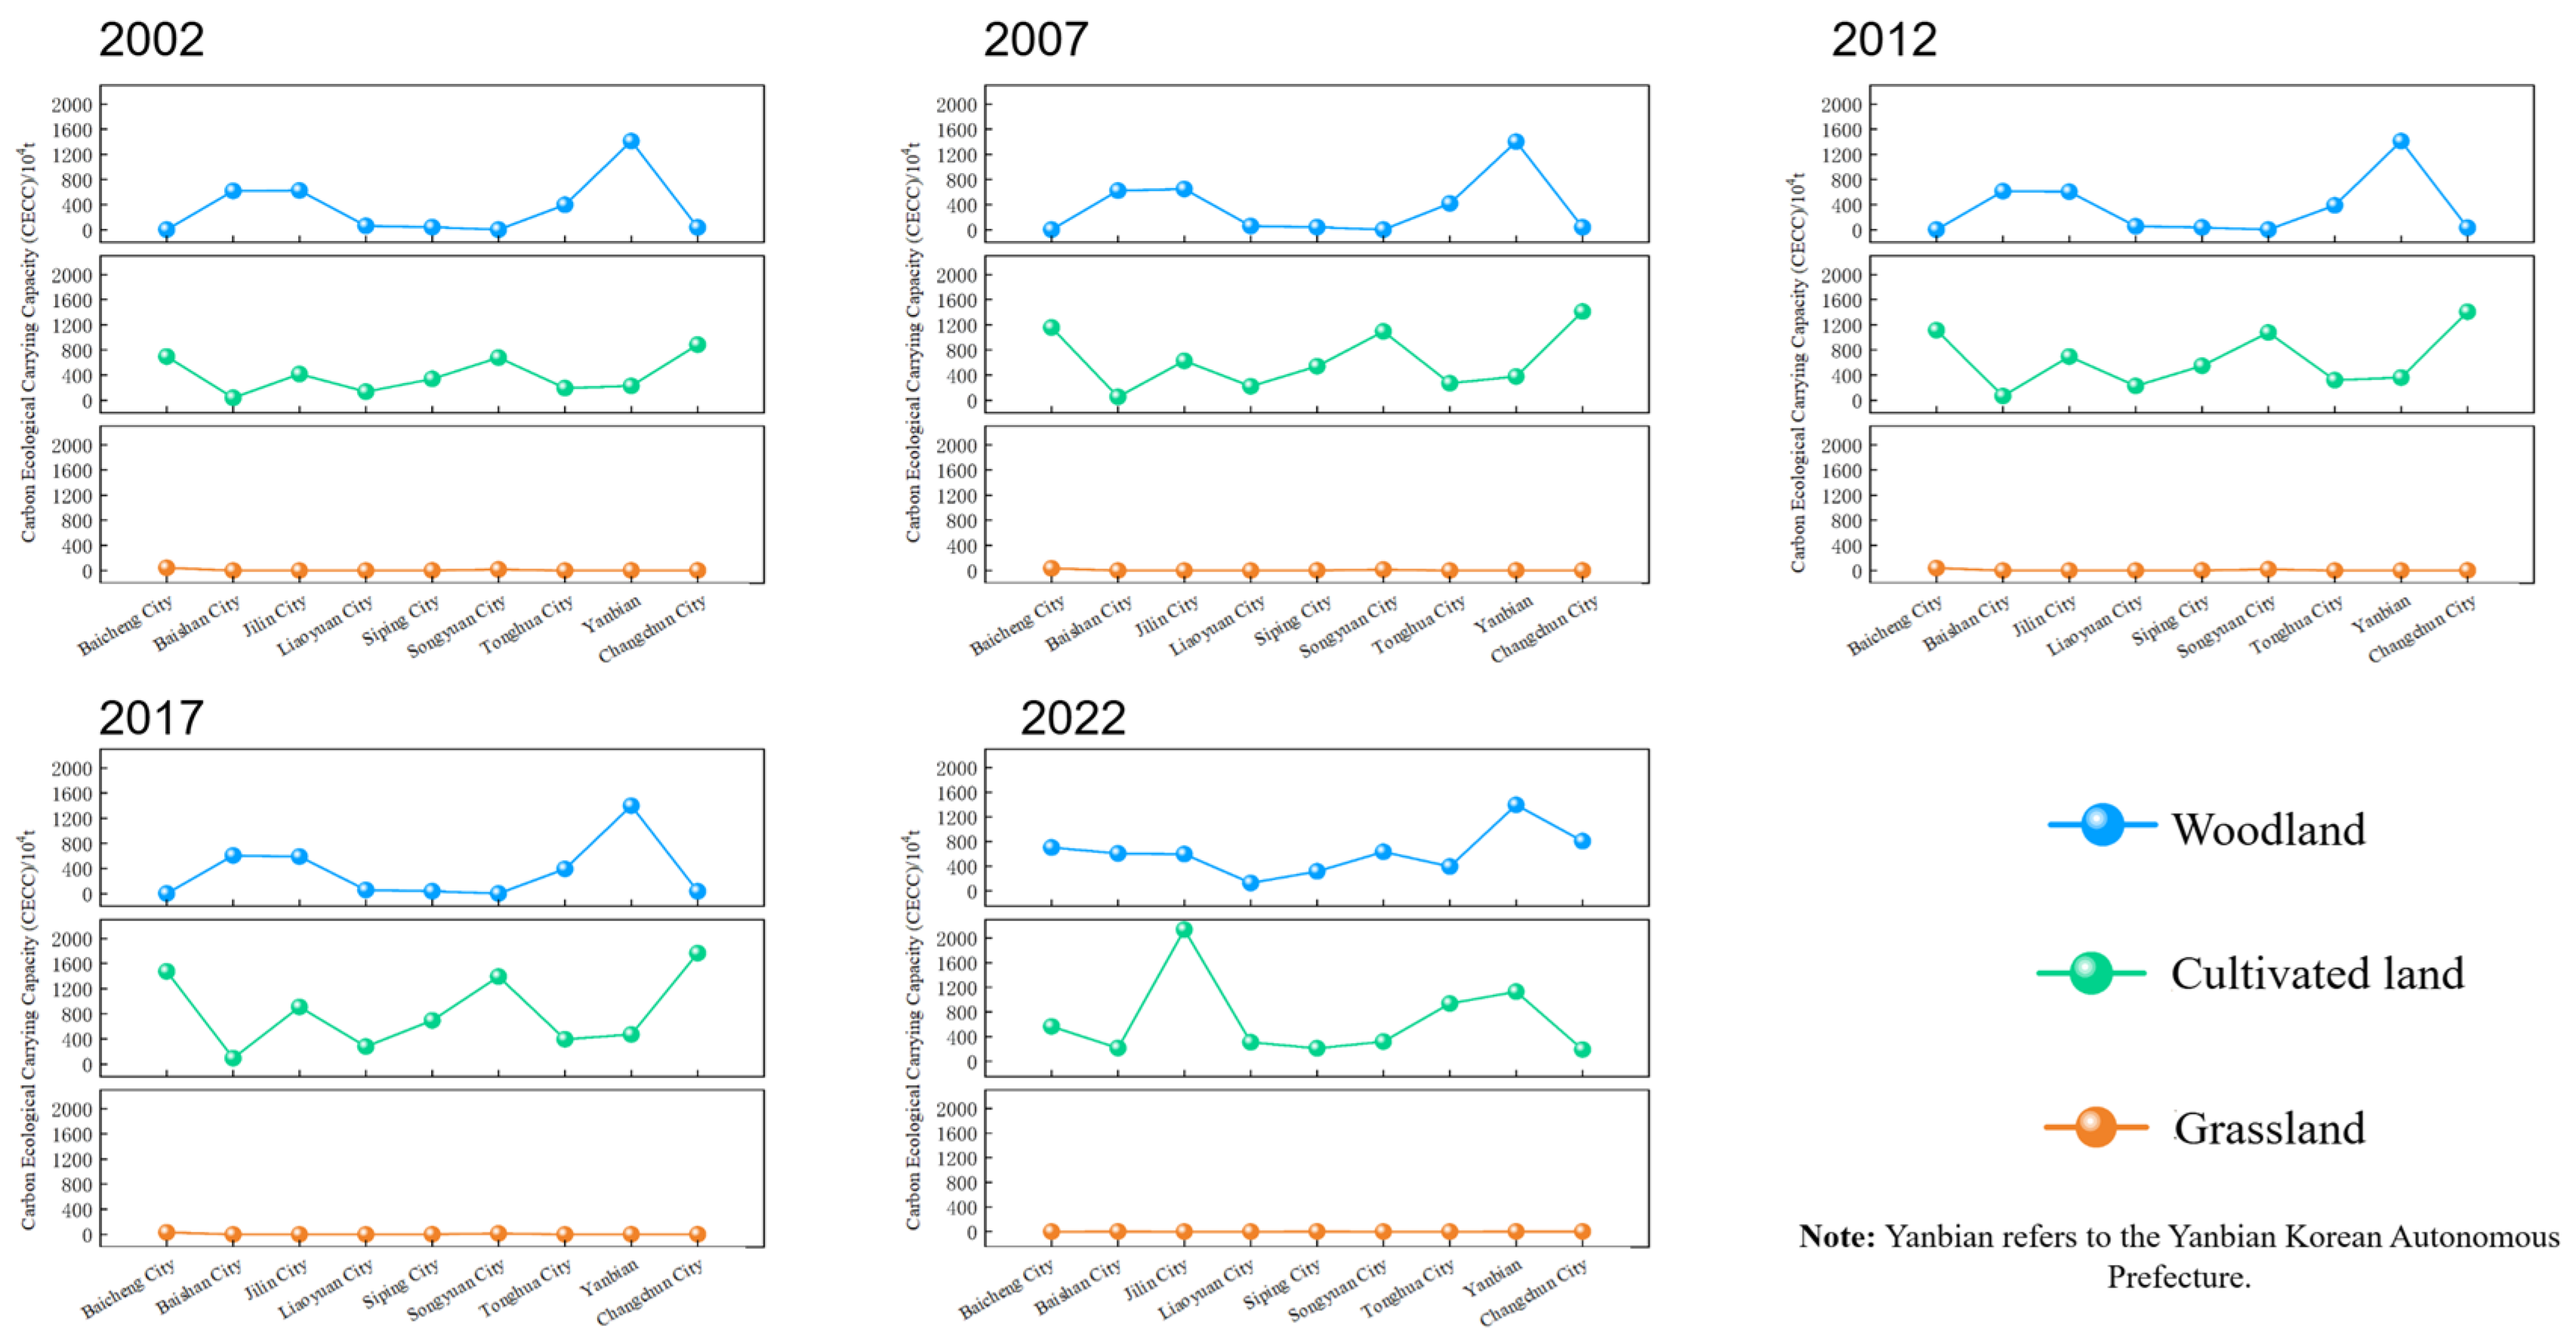
The study applies a natural discontinuity method to classify carbon ecological carrying capacity into five levels, as shown in Figure 7. Yanbian Korean Autonomous Prefecture exhibits the highest carbon ecological carrying capacity, followed by Changchun, Baicheng, Songyuan, and Jilin cities. Siping, Liaoyuan, Tonghua, and Baishan cities have the lowest levels of carbon ecological carrying capacity. The analysis reveals that the overall carbon ecological carrying capacity of Jilin Province has shown a fluctuating upward trend throughout the study period. There was a gradual decline in carbon ecological carrying capacity from 2007 to 2012, but it rapidly increased to 10,647.23 million tons in 2017.
To further assess the spatial distribution characteristics of carbon ecological capacity across cities, this study presents a visual analysis of the evaluation results (Figure 8). Over the past two decades, the carbon carrying capacity of grasslands in each city has remained relatively stable, with Songyuan and Baicheng cities exhibiting comparatively higher capacity. The differences in the carrying capacity of forestland are more pronounced than those of grassland. The carbon ecological capacity of forestland in Baishan, Jilin, Tonghua, and Yanbian Korean Autonomous Prefecture is significantly higher than in other regions, while Baicheng and Songyuan cities have the lowest forestland carrying capacity. Among prefecture-level cities, the variation in the carrying capacity of crops is the most notable, dominating the total carbon ecological capacity, with a proportion of approximately 60%. Specifically, Baicheng, Songyuan, Jilin, and Changchun cities show considerably higher crop carrying capacities than other cities. Compared to forestland and grassland, crops exhibit a stronger carbon sink potential, which aligns with the region’s advanced agricultural development and extensive crop planting areas.

3.4. Analysis of Gray Relational Degree and Decoupling Status

As shown in Table 6, the gray relational degrees between different land use types and carbon emissions in Jilin Province follow the order: cultivated land > woodland > water bodies > construction land > grassland > unutilized land. Among them, cultivated land exhibits the strongest correlation with carbon emissions, with a relational degree of 0.756, followed by woodland (0.749). This indicates that cultivated land and woodland play the most significant roles in the province’s carbon emission process. This result is closely related to Jilin Province’s location in the black soil region of Northeast China, where agricultural production dominates the regional land use structure.
Compared with other regions, Jilin’s correlation pattern differs considerably. For example, in northern Jiangsu Province, carbon emissions are more closely associated with construction land such as industrial, transportation, and water conservancy facilities [42]; in Hebei Province, construction land also shows the highest correlation [43]; while in Shanxi Province, woodland has the largest impact [44]. These differences mainly stem from variations in regional land use structure, industrial development pathways, and energy consumption patterns. In Jilin, where agriculture remains the key economic sector, carbon emissions from cultivated land—including agricultural inputs, soil respiration, and biomass burning—constitute a major component of total emissions. Meanwhile, woodland functions as an important carbon sink, offsetting part of the emissions but still exhibiting a strong association due to its extensive area and productivity.
From Table 7, it can be seen that the overall decoupling relationship between carbon emissions and economic growth in Jilin Province exhibits stage-based fluctuations over time. During 2002–2007, the decoupling elasticity index was 0.65, indicating a weak decoupling state—carbon emissions increased more slowly than the economy, reflecting an early stage of green development. From 2007 to 2012, the index decreased to 0.31, remaining in a weak decoupling state but suggesting reduced efficiency in emission reduction relative to economic growth. From 2012 to 2017, the decoupling index turned −0.97, representing strong decoupling, meaning that carbon emissions declined significantly despite continuous economic growth—an ideal stage of sustainable development. However, during 2017–2022, the index rose to 0.43, shifting to a weak negative decoupling state, indicating a partial rebound effect of emissions during rapid economic expansion.
Spatially, the decoupling status varies across cities. During 2002–2007, most cities, such as Baicheng, Liaoyuan, Siping, Songyuan, and Changchun, exhibited weak decoupling, reflecting early progress in low-carbon transition. In 2007–2012, all cities achieved weak decoupling, where emission growth rates were lower than GDP growth, suggesting an increasing potential for strong decoupling in the short term. Between 2012 and 2017, five cities—Baicheng, Baishan, Liaoyuan, Siping, and Changchun—achieved strong decoupling (55.6% of the sample), whereas the remaining cities showed recession decoupling, mainly due to their continued dependence on resource-intensive industries. By 2017–2022, Yanbian Korean Autonomous Prefecture achieved strong decoupling, realizing simultaneous economic growth and emission reduction. In contrast, Changchun City showed a growth connection type, where carbon emissions still increased but at a rate 3.5 times slower than economic growth, indicating improved carbon efficiency within rapid economic development.
Overall, these results highlight a temporal shift from weak to strong decoupling followed by a mild reversal, as well as a spatial heterogeneity in decoupling performance across Jilin Province. Regions with stronger industrial restructuring and cleaner energy transitions—such as Yanbian and Changchun—exhibited more favorable decoupling trends. This pattern suggests that optimizing land use structure, promoting low-carbon agricultural practices, and accelerating green industrial transformation are key pathways for maintaining long-term strong decoupling and achieving sustainable carbon reduction in Jilin Province.

3.5. Validation of the Results

To ensure the reliability of the results, both data consistency and methodological robustness were verified. The estimated carbon emissions and their temporal trends (2002–2022) were compared with the China Energy Statistical Yearbook and previous studies, showing strong consistency in magnitude and direction. Spatially, the distribution of emissions and carbon ecological carrying capacity corresponded well with land use changes—areas converted to construction land exhibited higher emissions, while woodland and grassland maintained stronger sink capacities. In addition, a sensitivity test adjusting carbon emission coefficients by ±10% resulted in less than 5% variation in total emissions, indicating model stability. These validations confirm that the proposed framework reliably captures the spatiotemporal dynamics of land use–related carbon emissions in Jilin Province.

4. Discussion

This study provides a systematic analysis of the spatiotemporal distribution of carbon emissions from land use in Jilin Province and its relationship with economic decoupling. It reveals the temporal and spatial variations in the province’s progress toward carbon reduction goals, as well as the impact of policy interventions. The results indicate that land use types and their associated carbon emissions in Jilin exhibit significant stage-specific differences and spatial heterogeneity. Notably, during land use transitions, the expansion of construction land and cultivated land is closely related to the enhanced carbon carrying capacity of crops.
Firstly, the study shows distinct temporal fluctuations in carbon emissions in Jilin Province. Between 2002 and 2012, carbon emissions increased significantly, followed by a decline from 2017 to 2022. This change in emission trends is closely tied to the province’s economic development stages and national policy interventions. The earlier increase in carbon emissions coincided with the rapid economic growth during the implementation of the revitalization plan for the Northeast’s old industrial base [45]. After 2012, the deceleration and even reduction in carbon emissions can likely be attributed to the effective implementation of energy-saving and emission-reduction policies under the 12th Five-Year Plan [46].
In terms of spatial distribution, carbon emissions are highly concentrated in the central region, with Changchun at its core. This pattern is primarily driven by two factors: first, as the economic, industrial, and population hub of the province, Changchun has seen continuous expansion of construction land, which has been identified as a major source of carbon emissions; second, the central region is a key agricultural zone in Jilin, where emissions from cultivated land play a significant role [47]. Notably, Jilin’s carbon emission trajectory, characterized by an initial increase followed by a decline, contrasts with the persistent growth patterns observed in some western regions like Ningxia [48]. However, it mirrors the trend in Shandong Province [49], reflecting the province’s early successes in economic transformation and carbon reduction efforts.
Additionally, the carbon sequestration capacity of crops in Jilin Province dominates the overall carbon sink, with agricultural regions such as Baicheng and Songyuan contributing significantly to crop-based carbon sequestration. This finding contrasts with the conclusions drawn from studies in Shandong Province, where forest carbon sinks play a dominant role [49], highlighting Jilin’s distinctive position as a major grain-producing area. However, the carbon sequestration capacity of forests in Jilin is relatively weak and unevenly distributed, with the majority concentrated in the Changbai Mountain region in the eastern part of the province. This raises concern, as forests are typically a core component of regional carbon sinks. The limited contribution of Jilin’s forest carbon capacity may be linked to the observed trend of forest area contraction followed by expansion during the study period [50], where early reductions in forest resources diminished their carbon sink potential.
On the other hand, the decoupling relationship between economic development and carbon emissions in Jilin Province exhibits certain stage-specific fluctuations. In regions such as Baicheng and Yanbian, strong decoupling was achieved during specific phases, indicating that local governments have made notable progress in the green transformation process. For instance, areas with strong decoupling tend to have a higher proportion of the tertiary sector or a more advanced level of agricultural modernization, while regions still experiencing weak decoupling may remain heavily dependent on energy-intensive industries [51]. The phased changes in Jilin’s decoupling relationship also reflect the effectiveness of policy interventions. Since the 13th Five-Year Plan, the province has implemented measures such as the energy consumption revolution and industrial structure adjustments, including the promotion of new energy industries and the elimination of outdated production capacities, which have contributed to the improvement of the decoupling status [46].
The analytical framework and findings of this study also have broader applicability beyond Jilin Province. The approach used to couple land-use carbon emissions with economic decoupling analysis can be extended to other provinces and regions with similar socio-economic or ecological characteristics, particularly those undergoing rapid land-use transitions or industrial restructuring. For instance, agricultural regions in northeastern and northern China, where cultivated land plays a dominant role in the carbon balance, could adopt a similar framework to evaluate how changes in land-use policy and agricultural modernization influence carbon dynamics. Likewise, in forest-dominated or urbanizing landscapes—such as southern or coastal provinces—the same methodological structure can be adjusted to emphasize forest carbon sequestration or construction land emissions. This adaptability demonstrates that the proposed framework is not limited to a single regional context but can serve as a reference model for assessing the interactions among land-use change, carbon emissions, and economic development across diverse landscape systems.
Beyond these findings, the observed spatiotemporal patterns of carbon emissions are also closely linked to the evolution of China’s and Jilin Province’s public policy frameworks. The introduction of major national strategies—such as the “Grain Security Strategy,” the “Northeast Revitalization Plan,” and the “Dual-Carbon Goals” (carbon peaking and neutrality)—has directly influenced land-use decisions, industrial layout, and ecological restoration efforts. In particular, Jilin’s implementation of policies including the “Black Soil Conservation Project,” the “Return of Farmland to Forests and Grasslands Program,” and “High-Standard Farmland Construction” has altered the balance between carbon sources and sinks, leading to improved land-use efficiency and enhanced carbon sequestration capacity in recent years. At the same time, local governments have aligned economic transformation initiatives with national green development policies, promoting renewable energy and modern agriculture, which jointly accelerated the transition toward low-carbon land use. These policy-driven changes underscore the pivotal role of institutional frameworks and governance in shaping the province’s carbon emission trajectory.

5. Conclusions

The analysis of the spatiotemporal distribution of carbon emissions from land use in Jilin Province and its relationship with economic decoupling leads to the following conclusions:
(1).
Over the period from 2002 to 2022, Jilin Province exhibited significant stage-specific variations in land use types. The area of water bodies and construction land generally showed an expanding trend, while the area of cultivated land remained relatively stable, consistently accounting for approximately 46% of total land use.
(2).
Spatiotemporal Variations in Carbon Emissions: The carbon emissions from land use in Jilin displayed significant spatiotemporal heterogeneity. In terms of temporal trends, the province’s carbon emissions initially increased, followed by a subsequent decline. Spatially, carbon emissions were primarily concentrated in the central region, with Changchun as the core.
(3).
The carbon sequestration capacity of crops in Jilin exhibited significantly higher urban variation compared to forests and grasslands. Agricultural areas, particularly cities such as Baicheng and Songyuan, demonstrated a stronger carbon sequestration capacity in crops.
(4).
The correlation between different land use types and carbon emissions in Jilin Province, ranked from highest to lowest, is as follows: cultivated land, woodland, water bodies, construction land, grasslands, and unutilized land. Additionally, the relationship between carbon emissions and economic development exhibited stage-specific fluctuations. Some regions, such as Baicheng and Yanbian, achieved strong decoupling of carbon emissions from economic growth, while other areas still face issues of resource-dependent growth. These regions require optimized development paths to facilitate low-carbon growth.

Limitations and Future Perspectives

Although this study provides valuable insights into the spatiotemporal dynamics of land-use carbon emissions and economic decoupling in Jilin Province, several limitations should be acknowledged. First, the estimation of carbon emissions relied on the IPCC (2006) default coefficients, which may not fully reflect regional variations in emission characteristics. Second, the analysis was based primarily on land use and bioeconomic data, without incorporating detailed local energy consumption or technological factors. Future research could integrate higher-resolution datasets, localized carbon emission coefficients, and dynamic simulation models to enhance the precision of carbon accounting. Additionally, comparative analyses with other provinces or cross-regional studies would further clarify the role of policy frameworks and socio-economic transitions in shaping low-carbon land-use patterns.

Author Contributions

Conceptualization, W.L. and Y.L.; methodology, W.L.; software, W.L.; validation, W.L. and Y.L.; formal analysis, W.L.; investigation, W.L.; resources, W.L.; data curation, W.L.; writing—original draft preparation, W.L.; writing—review and editing, W.L. All authors have read and agreed to the published version of the manuscript.

Funding

This research was funded by Excellent Young and Middle-aged Science and Technology Innovation and Entrepreneurship Talent (Team) Project of Join Province, grant number 20210509028RQ.

Institutional Review Board Statement

Not applicable.

Informed Consent Statement

Not applicable.

Data Availability Statement

The data presented in this study are openly available in https://doi.org/10.6084/m9.figshare.30647534, accessed on 14 November 2025.

Acknowledgments

We are very grateful to the academic editors and reviewers for their valuable suggestions.

Conflicts of Interest

The authors declare no conflicts of interest.

References

  1. Foley, J.A.; DeFries, R.; Asner, G.P.; Barford, C.; Bonan, G.; Carpenter, S.R.; Chapin, F.S.; Coe, M.T.; Daily, G.C. Global Consequences of Land Use. Science 2005, 309, 570–574. [Google Scholar] [CrossRef]
  2. Tian, S.Q.; Wang, S.J.; Bai, X.Y.; Luo, G.J.; Li, Q.; Yang, Y.J.; Hu, Z.Y.; Li, C.J.; Deng, Y.H. Global patterns and changes of carbon emissions from land use during 1992–2015. Environ. Sci. Ecotechnol. 2021, 7, 100108. [Google Scholar] [CrossRef]
  3. Yang, X.H.; Jin, X.B.; Liu, J.; Gu, Z.M.; Zhou, Y.K. Design and implementation of a land use carbon emission accounting system. Bull. Surv. Map. 2019, 54–59. [Google Scholar]
  4. Fang, J.Y.; Chen, A.P.; Peng, C.H.; Zhao, S.Q.; Ci, L.J. Changes in forest biomass carbon storage in China between 1949 and 1998. Science 2001, 292, 2320–2322. [Google Scholar] [CrossRef]
  5. Lai, L.; Huang, X.J.; Yang, H.; Chuai, X.W.; Zhang, M.; Zhong, T.Y.; Thompson, J.R. Carbon emissions from land-use change and management in China between 1990 and 2010. Sci. Adv. 2016, 2, e1601063. [Google Scholar] [CrossRef]
  6. Feng, W.; Zhao, R.Q.; Xie, Z.X.; Wang, S.G.; Liu, Y. Land use carbon emission efficiency and its spatiotemporal pattern under the carbon neutrality goal: A case study of 72 prefecture-level cities in the Yellow River Basin. China Land Sci. 2023, 37, 102–113. [Google Scholar]
  7. Peng, W.F.; Zhou, J.M.; Xu, X.L.; Yang, L.; Ouyang, X.J. Effect of land use changes on the temporal and spatial patterns of carbon emissions and carbon footprints in the Sichuan Province of Western China, from 1990 to 2010. Acta Ecol. Sin. 2016, 36, 7244–7259. [Google Scholar] [CrossRef]
  8. Wang, Y.Q.; Zhen, W.Q. Spatiotemporal differentiation of carbon budget and carbon compensation zoning based on the plan for major function-oriented zones: A case study of counties in the Yellow River Basin. Environ. Sci. 2024, 45, 5015–5026. [Google Scholar] [CrossRef]
  9. Yang, Y.; Zhou, H.; Wen, G.H.; Xia, W.S.; Luo, M.Y. Land use change and its carbon effect in Dongting Lake Basin during 1980–2020. Bull. Soil Water Conserv. 2023, 43, 390–397. [Google Scholar] [CrossRef]
  10. Yuan, J.X.; Fang, B.; Kan, H.Y.; He, S.S. Multi-scenario simulation of carbon emission intensity and ecological profit and loss from the perspective of nature and economy in Huaihai Economic. Zone. Acta Ecol. Sin. 2024, 44, 2199–2215. [Google Scholar] [CrossRef]
  11. Huang, Y.T.; Zhong, Y.X.; Bi, M.Y. Effects of land use change on spatio-temporal pattern of carbon source/sink in Poyang Lake Basin. Resour. Environ. Yangtze Basin 2025, 34, 546–557. [Google Scholar] [CrossRef]
  12. Liu, Y.H.; Chuai, X.W.; Liang, Y.F.; Li, H.D.; Li, J.B.; Zhou, Y.; Wu, J.; Liu, G.Q.; Zhang, J.L. Evolution characteristics of carbon budgets and pressure of carbon neutrality in Jiangsu Province. Environ. Sci. 2025, 50, 1–14. [Google Scholar] [CrossRef]
  13. Li, Z.H.; Zhou, D.M.; Jiang, J.; Ma, J.; Zhu, X.Y.; Shi, P.; Zhang, J.; Dong, Q.H. Spatial and temporal evolution characteristics of carbon emission from land use and influencing factors in Gansu Province. Environ. Sci. 2024, 49, 5040–5048. [Google Scholar] [CrossRef]
  14. Shen, T.; Hu, R.; Hu, P.; Tao, Z. Decoupling between economic growth and carbon emissions: Based on four major regions in China. Int. J. Environ. Res. Public Health 2023, 20, 1496. [Google Scholar] [CrossRef] [PubMed]
  15. Ayitursun, S.; Ailixier, Y.; Liu, X.M.; Cai, B.F.; Chen, Q.L.; Feng, T.; Ju, C.Y.; Li, S.; Zhang, F.Y. Study on the spatiotemporal evolution of land use carbon emission intensity in Urumqi. Chin. J. Agric. Resour. Reg. Plan. 2020, 41, 139–146. [Google Scholar]
  16. Yang, J.; Huang, X. The 30 m annual land cover dataset and its dynamics in China from 1990 to 2019. Earth Syst. Sci. Data 2021, 13, 3907–3925. [Google Scholar] [CrossRef]
  17. GB/T 21010–2017; National Land Use Classification Standard. Ministry of Land and Resources of the People’s Republic of China, China Standard Press: Beijing, China, 2017.
  18. Intergovernmental Panel on Climate Change (IPCC). 2006 IPCC Guidelines for National Greenhouse Gas Inventories; Institute for Global Environmental Strategies (IGES): Kanagawa, Japan, 2006. [Google Scholar]
  19. Zhao, M.Y.; Liu, Y.X.; Zhang, X.Y. A review of research advances on carbon sinks in farmland ecosystems. Acta Ecol. Sin. 2022, 42, 9405–9416. [Google Scholar] [CrossRef]
  20. Tsuruta, H.; Mosier, A. Estimate of CH4 emissions from year-round flooded rice fields during rice growing season in China. Pedosphere 2005, 42, 66–71. [Google Scholar]
  21. Cai, Z.; Tsuruta, H.; Gao, M.; Xu, H.; Wei, C.F. Options for mitigating methane emission from a permanently flooded rice field. Glob. Change Biol. 2003, 9, 37–45. [Google Scholar] [CrossRef]
  22. Hergoualc’h, K.; Verchot, L.V. Greenhouse gas emission factors for land use and land-use change in Southeast Asian peatlands. Mitig. Adapt. Strateg. Glob. Change 2014, 19, 789–807. [Google Scholar] [CrossRef]
  23. Wu, J.; Li, K. Analysis of spatial and temporal evolution and driving factors of carbon emission in Shandong Province: Based on the perspective of land use. Environ. Sci. Eur. 2024, 36, 171. [Google Scholar] [CrossRef]
  24. Fang, J.Y.; Guo, Z.D.; Piao, S.L.; Chen, A.P. Terrestrial vegetation carbon sinks in China, 1981–2000. Sci. China Ser. D-Earth Sci. 2007, 50, 1341–1350. [Google Scholar] [CrossRef]
  25. Shi, H.X.; Mu, X.M.; Zhang, Y.L.; Lü, M.Q. Effects of different land use patterns on carbon emission in Guangyuan City of Sichuan Province. Bull. Soil Water Conserv. 2012, 32, 101–106. [Google Scholar] [CrossRef]
  26. Tan, J.; Liu, Q.; Tang, X.P.; Tan, X.L.; Liu, P. Spatial and temporal evolution of carbon emissions from land use and its influencing factors based on LMDI model: A case study of the Dongting Lake area. Areal Res. Dev. 2024, 43, 160–166. [Google Scholar]
  27. Hu, Y.Z.; Yu, D. Transmission effect and prediction of land use carbon emissions in urban agglomeration around Poyang Lake. Res. Soil Water Conserv. 2024, 31, 342–353. [Google Scholar] [CrossRef]
  28. Li, Y.L.; Li, S.P.; Qi, J.J. Influencing factors on carbon emissions of land uses and analysis of their decoupling effects in Shaanxi Province. Res. Soil Water Conserv. 2018, 25, 382–390. [Google Scholar] [CrossRef]
  29. Sun, L.G.; Liu, J.F.; Xu, Q.H.; Wang, S.Q.; Zhou, L. Effects of urban carbon emissions and their spatial-temporal patterns around Beijing and Tianjin. Geo-Inf. Sci. 2016, 32, 113–118. [Google Scholar]
  30. Jia, K.L.; Li, X.Y.; Wei, H.M.; Liu, R.L.; Li, H.Y.; Yang, S.Y. Spatial differentiation and risk of land use carbon emissions in county region of Ningxia. Arid Land Geogr. 2023, 46, 1757–1767. [Google Scholar]
  31. Sun, H.; Liang, H.M.; Chang, X.L.; Cui, Q.C.; Tao, Y. Land use patterns on carbon emission and spatial association in China. Econ. Geogr. 2015, 35, 154–162. [Google Scholar] [CrossRef]
  32. Guan, W.; Dong, F.C.; Xu, S.T. Spatial correlation and carbon balance zoning of land use carbon emissions in Liaoning province. J. Liaoning Norm. Univ. Nat. Sci. Ed. 2023, 46, 546–556. [Google Scholar]
  33. Su, Y.L.; Zhang, Y.F. Study on effects of carbon emission by land use patterns of Shaanxi Province. J. Soil Water Conserv. 2011, 25, 152–156. [Google Scholar] [CrossRef]
  34. Lin, X.Q.; Yang, H.J. The concept and calculation model of terrestrial ecosystem’s bearing capacity of CO2. J. Kunming Univ. Sci. Technol. Soc. Sci. 2015, 15, 71–76. [Google Scholar] [CrossRef]
  35. Zhang, X.P.; Zheng, G.Z. Dynamics of carbon footprint and carbon carrying capacity of Shanxi province. J. Shanxi Agric. Univ. Nat. Sci. Ed. 2016, 36, 128–132. [Google Scholar] [CrossRef]
  36. Xiao, L.; Zhao, X.G.; Xu, H.X. Dynamics of carbon footprint and carbon carrying capacity of Shandong Province. J. Ecol. Rural Environ. 2013, 29, 152–157. [Google Scholar]
  37. Zhang, X.J. The Breadth and Depth Measurement of Carbon Footprint of Energy Consumption in Yunnan and Spatial Research. Master’s Thesis, Southwest Forestry University, Kunming, China, 2022. [Google Scholar]
  38. Tan, X.; Deng, J. Grey relational analysis: A new method of multi-factor statistical analysis. Stat Res. 1995, 12, 46–48. [Google Scholar]
  39. Liang, S.; Liu, Z.; Crawford-Brown, D.; Wang, Y.; Xu, M. Decoupling analysis and socioeconomic drivers of environmental pressure in China. Environ. Sci. Technol. 2014, 48, 1103–1113. [Google Scholar] [CrossRef]
  40. Chen, J.D.; Wang, P.; Cui, L.B.; Huang, S.; Song, M.L. Decomposition and decoupling analysis of CO2 emissions in OECD. Appl. Energy 2018, 231, 937–950. [Google Scholar] [CrossRef]
  41. Huang, X.K.; Huang, Y.J.; Li, R.L.; Cheng, W.; Su, Y.; Li, F.; Du, X.X. Decoupling of land-use net carbon flux, economic growth, and population change in China. Environ. Sci. Pollut. Res. 2023, 30, 107058–107067. [Google Scholar] [CrossRef]
  42. Huang, R. The research on the relationship between land use and carbon emissions based on the grey model. Environ. Eng. 2016, 47, 856–861. [Google Scholar]
  43. Luo, Y.; Chen, S.; Liu, W.Q.; Wang, X.; Qi, A.H. Analysis and prediction on the spatiotemporal evolution of carbon emissions from land use in Hebei province. Chin. J. Environ. Eng. 2024, 18, 3360–3373. [Google Scholar]
  44. Yan, C.; Hou, L.G. Study on land use change and carbon emission in Shaanxi Province based on grey theory. J. Xi’an Univ. Technol. 2021, 37, 25–31. [Google Scholar] [CrossRef]
  45. Shi, Z.M.; Liu, Z.L.; Hao, Y.; Liu, X.Y.; Zhang, L.X. Industrial sector correlation mechanism of regional carbon emissions: An empirical study of Jilin province based on ecological network analysis. J. Beijing Norm. Univ. Nat. Sci. 2022, 58, 223–231. [Google Scholar]
  46. Lü, J.H.; Ji, J.Y.; Li, C.; Ye, X.Y. Analysis of energy carbon emission driving mechanism and decoupling level under “dual carbon” goal: Taking the three northeastern provinces as an example. Ecol. Econ. 2024, 40, 39–46. [Google Scholar]
  47. Yi, M.H.; Yan, Q.W.; Zhang, D.X.; Chen, Y.H.; Li, Y.N. Measurement of carbon emissions from cultivated land use and decoupling analysis with grain production in Jilin Province. Chin. J. Agric. Resour. Reg. Plan. 2023, 44, 45–56. [Google Scholar]
  48. Wang, W.; Yang, S.T.; Hai, Y.R. The spatiotemporal evolution and influencing factors of carbon emissions from land use in Ningxia. Arid Zone Res. 2025, 42, 545–555. [Google Scholar] [CrossRef]
  49. Sun, C.F.; Jiang, W.; Gao, W.D. Spatial-temporal evolution and influencing factors of land use carbon emissions in Shandong Province. Environ. Sci. 2025, 46, 30–40. [Google Scholar]
  50. Tian, H.L.; Zhu, J.H.; He, X.; Chen, X.Y.; Jian, Z.J.; Li, C.Y.; Guo, X.Y.; Huang, G.S.; Xiao, W.F. Projected biomass carbon stock of arbor forest of three provinces in northeastern China based on random forest model. Sci. Silvae Sin. 2022, 58, 40–50. [Google Scholar]
  51. Li, B.Y. Synergistic effects of carbon mitigation and economic growth in China: Measurement and regional disparities. J. Stat. Inf. 2025, 40, 14–25. [Google Scholar] [CrossRef]
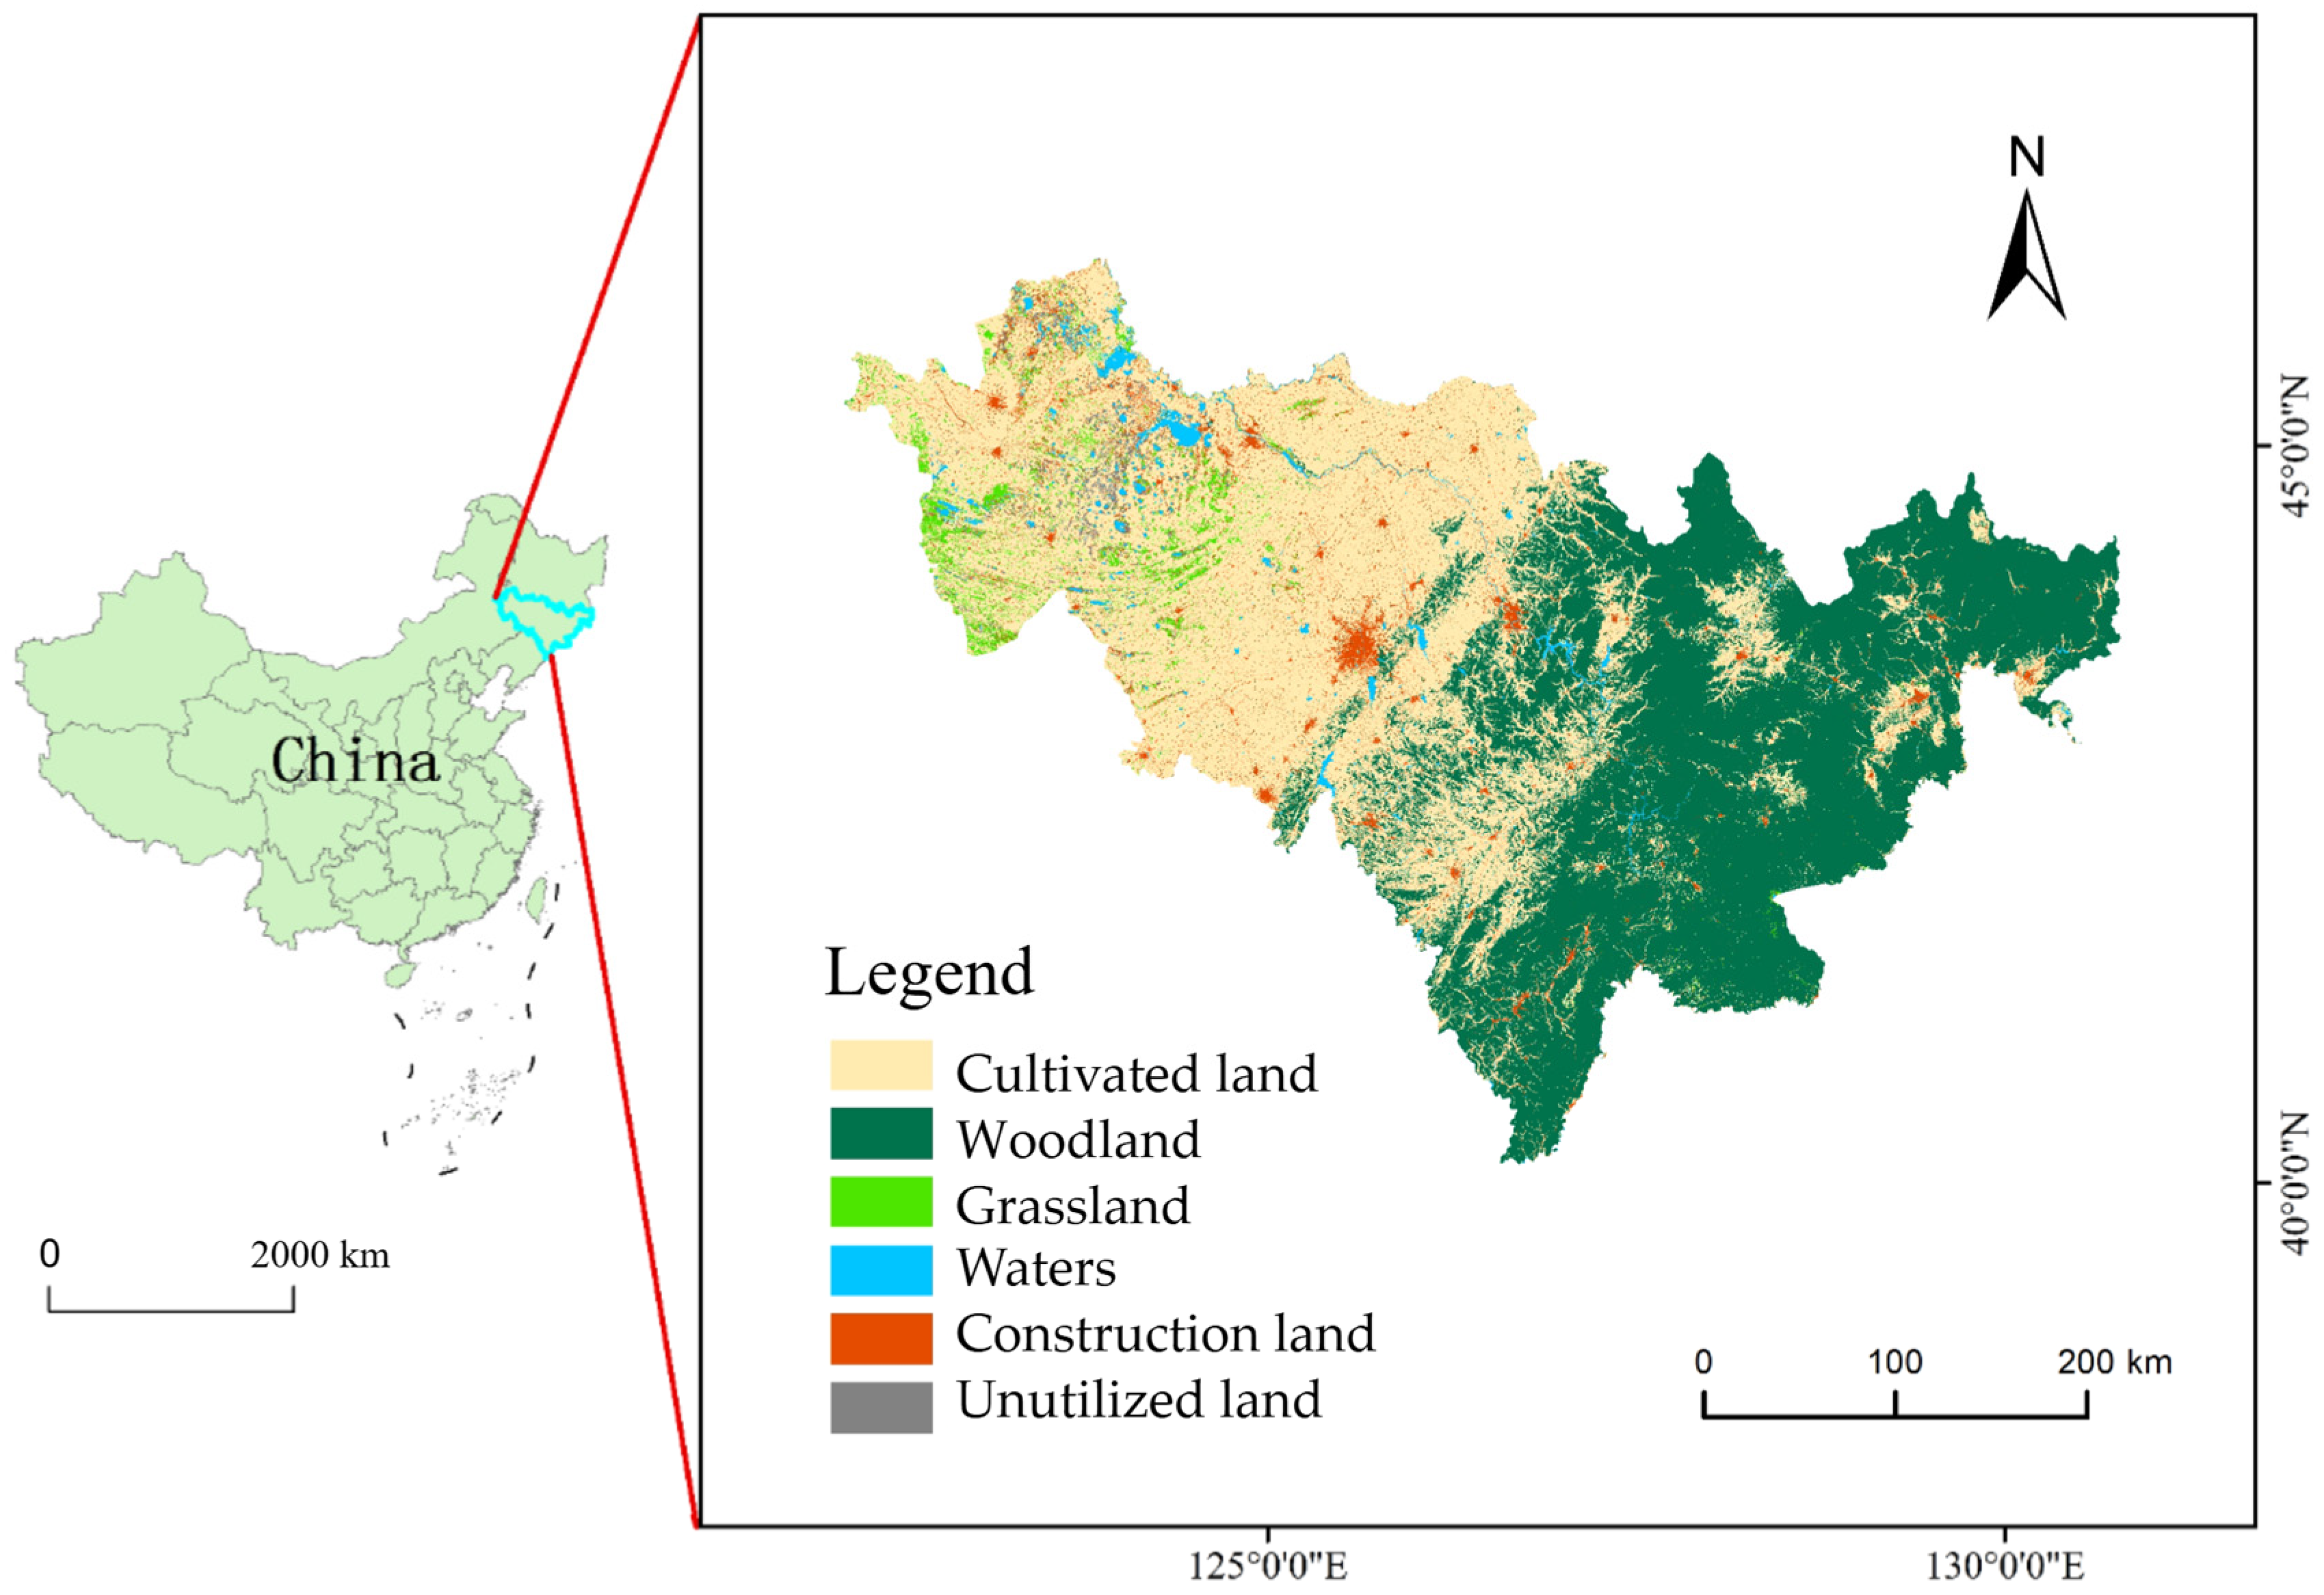
Figure 1. Overview of the Study Area.
Sustainability 17 10377 g001
Figure 2. Classification of Tapio decoupling states illustrating eight possible relationships between economic growth and carbon emissions.
Sustainability 17 10377 g002
Figure 3. Flowchart and research method.
Sustainability 17 10377 g003
Figure 4. Net changes in area of land use types in Jilin province from 2002 to 2022.
Sustainability 17 10377 g004
Figure 5. Spatial distribution of land use types from 2002 to 2022.
Sustainability 17 10377 g005
Figure 6. Spatiotemporal distribution of carbon emissions from land use in Jilin province from 2002 to 2022.
Sustainability 17 10377 g006
Figure 7. Spatial and temporal distribution of carbon ecological carrying capacity in Jilin province.
Sustainability 17 10377 g007
Figure 8. Comparison of carbon carrying capacities among woodlands, crops, and grasslands in Jilin province.
Sustainability 17 10377 g008
Table 1. Land use classification and corresponding carbon emission coefficients.
Land Use TypeCarbon Emission Coefficient/(t·hm−2)
Cultivated land0.497
Woodland−0.604
Grassland−0.021
Waters−0.253
Unutilized land−0.005
Table 2. Conversion coefficients of various energy sources to standard coal and carbon emission coefficients.
Types of EnergyCoalCokeGasolineKeroseneDiesel OilFuel OilNatural Gas
Energy standard coal conversion coefficient/(kg·kg−1)0.71430.97141.47141.47141.45711.42861.7143
Energy carbon emission coefficient/
(kg·kg−1)
0.75590.8550.55380.57140.59210.61850.5042
Table 3. Estimation parameters of vegetation carbon storage for major crops in Jilin province, including carbon content, moisture coefficient, root-to-shoot ratio, and average economic yield.
TypeCarbon Content (%)Moisture Coefficient (%)Root-Shoot Ratio
Paddy Rice41.7111.860.60
Wheat47.0711.670.39
Corn46.3712.230.16
Soybean44.515.000.13
Peanut45.0015.000.72
Flue-cured
Tobacco
45.0015.000.32
Table 4. Land use area and dynamic degree in Jilin Province from 2002 to 2022.
Land TypeLand Use Area/km2Land Use Dynamic
Degree/%
200220072012201720222002–20072007–20122012–20172017–2022
Cultivated Land89,143.8887,946.6388,855.9889,885.4389,745.28−0.2690.2070.232−0.031
Woodland84,698.3583,742.7782,362.1981,941.2682,139.31−0.226−0.330−0.1030.048
Grassland5744.286847.796579.435402.624957.703.842−0.784−3.577−1.647
Waters2368.262636.152783.612775.773179.762.2621.119−0.0562.911
Construction Land6007.866958.417843.628702.289159.593.1642.5442.1891.051
Unutilized Land2796.942627.842334.742052.211577.94−1.209−2.231−2.420−4.622
Table 5. Estimation of carbon emissions from different land use types in Jilin province from 2002 to 2022.
YearCarbon SourceCarbon SinkNet Carbon Emissions
Construction LandCultivated LandWoodlandGrasslandWatersUnutilized Land
20022864.40443.05−511.90−1.21−6.00−0.142788.20
20075137.56437.09−506.12−1.45−6.67−0.135060.28
20127106.16441.61−497.78−1.39−7.05−0.127041.45
20175382.92446.73−495.23−1.14−7.03−0.105326.14
20225098.79446.03−496.43−1.05−8.05−0.085039.22
Unit: /104 t.
Table 6. Gray correlation degree between land types and net carbon emissions from land use.
Land TypeRelevanceRanking
Cultivated land0.7561
Woodland0.7492
Waters0.7043
Construction land0.6774
Grassland0.6265
Unutilized land0.5556
Table 7. Decoupling relationship between carbon emissions and economic development.
City2002–20072007–20122012–20172017–2022
Decoupling IndexDecoupling TypesDecoupling
Index
Decoupling TypesDecoupling
Index
Decoupling TypesDecoupling
Index
Decoupling Types
Baicheng City0.433weak decoupling0.174weak decoupling−37.939forced decoupling3.297recession decoupling
Baishan City1.886recession decoupling0.362weak decoupling−11.283forced decoupling1.908recession decoupling
Jilin City0.890growth connection0.289weak decoupling2.477recession decoupling0.463weak negative decoupling
Liaoyuan City0.321weak decoupling0.201weak decoupling−2.304forced decoupling0.712weak negative decoupling
Siping City0.696weak decoupling0.347weak decoupling−1.644forced decoupling1.030recession connection
Songyuan City0.309weak decoupling0.209weak decoupling1.441recession decoupling0.773weak negative decoupling
Tonghua City1.000growth connection0.276weak decoupling4.854recession decoupling1.310Recession decoupling
Yanbian Korean Autonomous Prefecture2.213negative decoupling of growth0.449weak decoupling3.977recession decoupling−2.356forced decoupling
Changchun City0.723weak decoupling0.314weak decoupling−0.546forced decoupling0.908growth Connection
The whole province0.652weak decoupling0.311weak decoupling−0.968forced decoupling0.430weak negative decoupling
Disclaimer/Publisher’s Note: The statements, opinions and data contained in all publications are solely those of the individual author(s) and contributor(s) and not of MDPI and/or the editor(s). MDPI and/or the editor(s) disclaim responsibility for any injury to people or property resulting from any ideas, methods, instructions or products referred to in the content.