Abstract
Geographic Information Systems (GIS) are central to spatial evidence in Environmental Impact Assessment (EIA). In this review, GIS is used in a broad, integrative sense to refer to an ecosystem of geospatial technologies—such as remote sensing (RS) and GPS—where GIS serves as the core platform for managing, analyzing, and communicating spatial data throughout the EIA process. GIS plays a crucial role at each stage of EIA, from baseline data collection to spatial analysis, ecological sensitivity mapping, impact prediction, scenario simulation, and landscape connectivity assessment. These capabilities support alternatives analysis, risk communication, and decision-making in EIA. This paper synthesizes thematic evidence and presents case studies to illustrate the synergies between GIS, remote sensing, GeoAI, and multisource data fusion. It highlights operational workflows and key deliverables for EIA applications, including urban expansion, transport corridors, and protected-area management. We identify persistent challenges in data quality and standardization, interoperability, model uncertainty, and policy gaps. To address them, we propose a minimum geospatial dataset with clear metadata standards, interpretable GeoAI paired with formal sensitivity analysis, IoT–GIS pipelines for real-time monitoring and adaptive management, and the systematic inclusion of cumulative effects and climate scenarios. By linking GIS methods to typical decision points and reporting standards in EIA, this review clarifies where GIS adds value, how to quantify and communicate uncertainty, and how to align analytical outputs with regulatory requirements and stakeholder expectations. The study offers a practical framework and implementation checklist for standardized, transparent, and reproducible EIA processes, contributing to evidence-based ecological governance.
1. Introduction
Ecological Impact Assessment (EIA) has become a cornerstone of modern environmental governance and a critical instrument for achieving sustainable development [1,2,3,4]. Conceived as a preventive tool, EIA aims to systematically identify, predict, and evaluate the potential environmental consequences of proposed projects, plans, or policies, thereby integrating ecological considerations directly into the decision-making process [1,5,6,7,8,9]. The need for such a tool arises from growing human impacts on the environment. Rapid urbanization, infrastructure expansion, and climate change create complex environmental challenges that require advanced, predictive, and holistic assessment methods [10,11].
The formal genesis of EIA is often traced to the United States’ National Environmental Policy Act (NEPA) of 1969, a landmark piece of legislation that mandated the assessment of environmental impacts for all major federal actions [12,13]. This procedural innovation rapidly gained global traction, particularly following the 1992 United Nations Earth Summit, and has since been adopted in various forms by most nations worldwide [14]. Over the decades, EIA has evolved from basic checklists to rigorous, science-based analyses. This shift reflects a growing global recognition of the profound and often irreversible impact of human activities on ecosystems, and the need for proactive, evidence-based planning rather than reactive remediation [15,16]. As a result, contemporary EIA frameworks are increasingly expected to address not only direct impacts but also indirect, cumulative, and long-term effects with greater accuracy and transparency [1,17].
At the heart of the evolution of EIA from a procedural requirement to a powerful analytical discipline is the integration of Geographic Information Systems (GIS). Initially employed for basic cartographic visualization and simple map overlays, GIS has transformed into an indispensable, integrative analytical engine that underpins modern EIA practice [18,19]. This paper posits that GIS is no longer merely a supplementary mapping tool; it has become a central analytical framework that transforms EIA from a static, qualitative exercise into a dynamic, quantitative, and spatially explicit process [20]. Throughout this paper, unless otherwise specified, “GIS” refers to an integrative geospatial toolkit (GIS/RS/GPS and related standards), rather than a single software product; we emphasize GIS as the coordinating platform within the broader geospatial technology stack.
This paper reviews, analyzes, and synthesizes the application of GIS in EIA. It explores the core methods now standard in practice, examines the synergy of GIS with advanced technologies, and evaluates its real-world application through case studies. Additionally, the paper assesses the persistent challenges—data quality, technical complexity, and institutional support—that hinder the full potential of GIS in EIA [20]. This paper explores future development directions that will revolutionize the field, including intelligent assessment systems, real-time monitoring, and participatory frameworks. By providing this overview, it aims to be a key reference for researchers, practitioners, and policymakers, clarifying the current state and guiding the way toward a more effective and scientifically robust approach to managing our ecological future.
This paper is organized into seven sections. Section 1 introduces the importance of GIS in Environmental Impact Assessment (EIA) and provides an overview of the methods and objectives of the review. Section 2 discusses core GIS applications and methods in EIA, from data management to impact simulation. Section 3 explores the integration of GIS with key technologies like Remote Sensing (RS), Artificial Intelligence (AI), and Machine Learning (ML), highlighting the power of multi-source data fusion. Section 4 presents case studies from urban planning, transportation, and natural reserve management to illustrate practical GIS applications. Section 5 analyzes the persistent challenges in GIS use for EIA, focusing on data, technology, and policy issues. Section 6 looks ahead, discussing emerging trends such as intelligent assessment, real-time monitoring, and policy-driven applications. Section 7 concludes with a summary of key findings and a discussion on GIS’s role in sustainable development.
2. Core Applications of GIS in the EIA Process
The integration of geospatial techniques, including GIS, remote sensing, and GPS, has fundamentally redefined the operational capabilities of EIA, transforming it into a spatially explicit and data-driven process. GIS serves not as a single tool but as a comprehensive framework that enhances every stage of the assessment, from initial data collection to final impact visualization and mitigation planning. Its capacity to manage, analyze, and model geographic information provides the analytical backbone for a more rigorous and objective evaluation of ecological impacts. The EIA process, supported by GIS, is broken down into several stages, from data acquisition to analysis and visualization. The structured workflow includes data acquisition, data analysis, impact visualization and decision support. Figure 1 provides a schematic overview of this standard workflow, outlining the key stages that will be detailed in the subsequent sections.
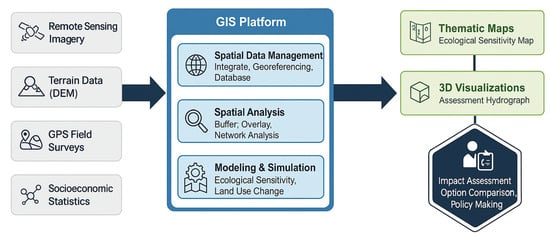
Figure 1.
GIS in the EIA Process: A Standard Workflow. Note: “GIS” is used broadly to include the geospatial toolkit (RS/GPS) coordinated by the GIS platform.
2.1. Spatial Data Management: The Foundation of Geospatial Assessment
A robust spatial database must be established before meaningful analysis can begin. This baseline study, which outlines the project’s environmental conditions, is critical to the EIA process. GIS provides the framework for creating and managing it [21,22].
GIS is powerful because it can collate and manage data from diverse sources. Modern data collection methods, such as high-precision GPS for ground-truthing, LiDAR for digital elevation models, and drones for high-resolution imagery, produce vast amounts of geospatial data [23,24]. GIS is the platform that allows these disparate data types to be ingested, georeferenced, and organized into a coherent and quarriable database [20,25]. This function is foundational, as it creates a structured digital representation of the study area’s environmental attributes.
Beyond simple collection, the core strength of GIS lies in its capacity to serve as a comprehensive framework to capture, store, integrate, query, analyze, and display spatial data [26]. In EIA, this means that layers of information—such as topography, hydrology, soil types, vegetation, species distribution, land use, and socio-economic demographics—can be integrated into one analytical environment [25]. This integration enables a holistic assessment, allowing practitioners to examine complex relationships between environmental components, which would be difficult with non-spatial, tabular methods.
The effectiveness of GIS in EIA is enhanced by the development of Spatial Data Infrastructures (SDIs). An SDI is a framework of technologies, policies, and arrangements that improve access to spatial data [25]. Initiatives like the European Union’s INSPIRE Directive mandate the creation of such infrastructures to ensure that spatial data is discoverable, accessible, and interoperable across different agencies and national borders [20]. For large-scale or transboundary EIAs, a well-established SDI is crucial, as it provides a standardized and reliable source of baseline data, reducing redundancy in data collection efforts and promoting consistency in assessments [20].
2.2. Spatial Analysis Methods: The Analytical Engine of EIA
Once a comprehensive spatial database is established, GIS provides a powerful suite of analytical tools to interrogate the data and assess potential impacts. These methods transform raw data into actionable information, forming the analytical engine of the EIA process [18,27]. The application of these techniques introduces a level of objectivity and reproducibility that was absent in earlier, more qualitative assessment methods. To visually explain these core methods, Figure 2 illustrates three of the most common spatial analysis techniques used in EIA.
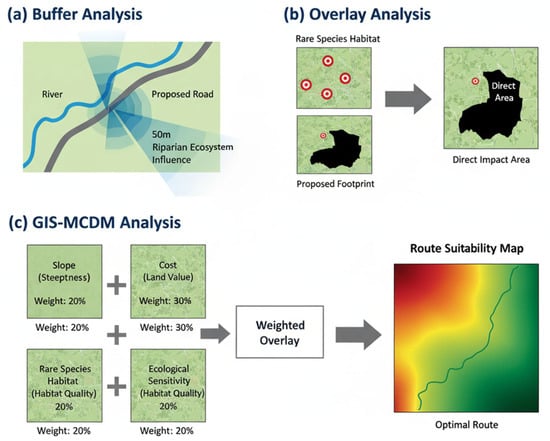
Figure 2.
Illustration of Core GIS Spatial Analysis Methods in EIA. (a) Buffer Analysis identifies proximity zones; (b) Overlay Analysis spatially combines layers to identify intersections; and (c) GIS-MCDM integrates multiple weighted factors to determine optimal locations or routes.
Defining criteria, assigning weights, and running spatial models enhances transparency, making the assessment more scientifically credible and legally defensible. These fundamental techniques are the foundation of most GIS-based EIAs. For example, buffer analysis creates zones around geographic features like roads, rivers, or industrial sites. In EIA, this helps assess proximity-based impacts such as noise pollution, chemical runoff, and habitat disturbance [9]. Overlay analysis, one of the most GIS operations, involves the geometric combination of multiple data layers to create a new output layer [28]. This technique is essential for identifying spatial conflicts and opportunities, for example, by overlaying a proposed development footprint with a map of ecologically sensitive areas to precisely quantify the area of direct habitat loss [1,29]. Network analysis is used to model the flow and connectivity within linear networks. In transportation EIA, it is used to optimize road or rail alignments to minimize ecological disruption, while in conservation planning, it can model habitat connectivity and identify critical wildlife corridors that might be severed by a proposed project [30].
Building on these fundamentals, more advanced approaches are now common. GIS-based Multi-Criteria Decision-Making (MCDM) is a powerful tool for conducting suitability and sensitivity analyses. It integrates multiple, often conflicting, criteria by assigning weights to data layers based on their importance to the objective [30,31]. A common method used in conjunction with GIS-MCDM is the Analytic Hierarchy Process (AHP), a structured technique for organizing and analyzing complex decisions based on expert opinion or stakeholder input [32,33]. For example, in selecting a route for a new highway, GIS-MCDM could combine layers representing construction cost, slope, soil stability, proximity to settlements. Each layer is weighted according to project priorities, and the GIS is used to calculate a composite suitability score for every location in the study area, thereby identifying the optimal corridor that best balances developmental and environmental objectives [30].
To summarize the various GIS techniques discussed in this section, Table 1 presents a comparative overview of their core attributes and applications in the EIA process.

Table 1.
Comparative summary of key GIS techniques for EIA.
As summarized in Table 1, different GIS techniques offer distinct advantages and disadvantages depending on the type of environmental assessment being conducted. Each method has its strengths in specific contexts, and their combined use can provide a more comprehensive evaluation of ecological impacts.
2.3. Ecological Sensitivity Assessment
A key application of GIS-based spatial analysis in EIA is the assessment of ecological sensitivity, which is defined as the degree to which an ecosystem is susceptible to damage or degradation from natural or anthropogenic disturbances [32]. Identifying and mapping these sensitive areas is a proactive measure that allows planners to steer development away from the most vulnerable parts of the landscape.
Ecological Sensitivity Assessment (ESA) using GIS involves integrating various factors such as topographical, hydrological, biotic, abiotic, and human disturbance elements. By employing weighted overlay analysis, each factor is assigned a specific weight based on its relative importance. GIS is then used to generate a composite sensitivity map, which helps identify areas vulnerable to environmental degradation. These areas are known to influence the resilience of ecosystems (Figure 3). The factors typically include:
- Topographical factors: such as steep slopes (prone to erosion) and high elevations (often containing unique or fragile ecosystems).
- Hydrological factors: such as proximity to rivers, lakes, and wetlands, which are critical for water quality and biodiversity.
- Biotic factors: including vegetation cover (e.g., dense forests provide more stability than sparse grasslands), habitat for rare or endangered species, and biodiversity hotspots.
- Abiotic factors: such as soil type and erodibility.
- Human disturbance factors: such as proximity to existing roads and urban areas [32].

Figure 3.
Workflow for Ecological Sensitivity Assessment using Weighted Overlay Analysis.
GIS uses techniques like AHP to assign weights to each factor and perform a weighted overlay analysis. The result is a composite ecological sensitivity map that classifies the landscape into zones, such as insensitive, slightly sensitive, moderately sensitive, highly sensitive, and extremely sensitive [32,34,35]. This final map serves as a powerful visual and analytical tool for decision-makers. It provides a clear and intuitive guide for land use planning, highlighting areas where development should be restricted or prohibited and directing projects towards areas with lower ecological sensitivity, thereby minimizing potential impacts from the earliest stages of planning.
2.4. Impact Prediction and Simulation
Perhaps the most significant contribution of GIS to EIA is its ability to facilitate a shift from static impact identification to dynamic impact prediction and simulation [1]. While traditional methods could identify that a project would have an impact, GIS-based models can predict the spatial extent, magnitude, and temporal dynamics of that impact with far greater specificity [36,37].
GIS models the spatial distribution and propagation of various impacts. For instance, air dispersion models integrated with GIS predict how pollutants from a factory smokestack will spread across the landscape under different wind conditions, identifying hotspots and affected communities [38]. Hydrological models can simulate how the construction of a road or dam will alter surface runoff patterns, sediment transport, and flood risk downstream [39]. In ecology, landscape metrics can be calculated within GIS to quantify the degree of habitat fragmentation caused by a new pipeline, predicting its effect on wildlife movement and population viability.
In addition to modeling a project’s direct consequences, integrating GIS with land use change models can forecast future landscape patterns under various development or policy scenarios. Cellular Automata (CA) models, like the FLUS model, use spatial relationships and transition rules from historical data to simulate how landscapes will evolve over time [40]. By running models under a “business-as-usual” scenario and a “proposed project” scenario, practitioners can assess long-term and cumulative impacts, such as predicting urban sprawl or deforestation caused by a new transportation corridor. This predictive capability is crucial for strategic environmental assessments and developing more effective mitigation plans, as shown in Figure 4.
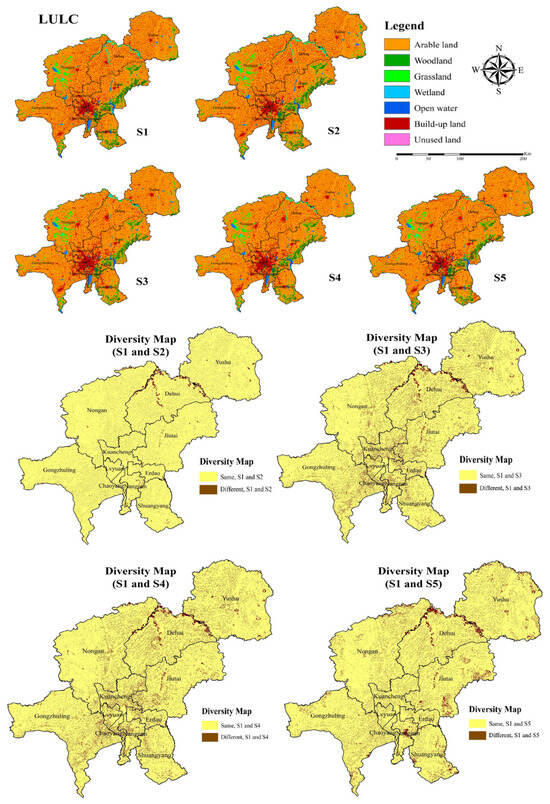
Figure 4.
Land use maps and diversity maps under S1–S5 in 2030. Reprinted with permission from Ref. [40]. Copyright 2023 MDPI.
To provide a clear overview of these analytical capabilities, Table 2 summarizes the key GIS spatial analysis techniques discussed and their primary applications within the EIA framework.
Table 2.
Key GIS Spatial Analysis Techniques in EIA.
3. Integration of GIS with Other Technologies
GIS provides the coordinating platform, modern EIA leverages an integrated suite of geospatial techniques—including remote sensing (RS) and GPS—together with AI/ML to achieve scalable monitoring, predictive modeling, and decision support. This technological convergence is creating a new paradigm for environmental assessment, with richer data, advanced analytics, and a more dynamic understanding of complex ecological systems. The integration of GIS, Remote Sensing (RS), Artificial Intelligence (AI), and Machine Learning (ML) is making EIA more predictive, efficient, and scientifically rigorous [41,42].
3.1. Synergy with Remote Sensing (RS)
Remote sensing (RS) is the most important data source for modern GIS-based EIA, providing large-scale, spatially explicit data without physical contact with the Earth’s surface [43]. GIS, in turn, serves as the platform to manage, analyze, and extract meaningful information from this data. RS captures the “what” and “when” of environmental change, while GIS reveals the “where” and “why” through spatial analysis and integration with other datasets.
A key application of this synergy is establishing the environmental baseline. Satellite platforms, such as Landsat and ESA’s Sentinel, provide continuous multispectral imagery, which can be processed to create accurate and up-to-date Land Use/Land Cover (LULC) maps [44]. These maps are essential to most EIAs, providing a base layer for assessing habitat distribution, agricultural land, and urban areas. Spectral indices, such as the Normalized Difference Vegetation Index (NDVI), can also be calculated from the imagery to assess vegetation health and density, offering a quantitative measure of ecosystem productivity [45].
The power of GIS-RS integration is evident in temporal monitoring. By analyzing satellite image time-series within a GIS, practitioners can move beyond static assessments and quantify environmental dynamics over decades [46]. This capability is critical for detecting and measuring long-term trends such as deforestation, coastal erosion, glacier retreat, or urban expansion [47]. This historical perspective is crucial for understanding environmental pressures and assessing cumulative impacts in the context of ongoing changes. The integrated approach enhances assessment precision and scope, enabling regional analyses that were once infeasible [48].
3.2. Artificial Intelligence (AI) and Machine Learning (ML)
The integration of Artificial Intelligence and Machine Learning into GIS, a field often referred to as GeoAI, represents the next frontier in environmental assessment [49]. AI and ML algorithms augment the analytical power of GIS by automating complex tasks, identifying subtle patterns in massive datasets that are invisible to the human eye, and building powerful predictive models [50,51].
A key application of ML in EIA is classifying remote sensing imagery. Traditional methods require significant manual intervention and struggle with complex landscapes. ML algorithms, like Random Forests, SVMs, and deep learning models such as CNNs, can automatically and more accurately classify LULC types, identify habitats, or map plant species distributions from high-resolution or hyperspectral imagery [52,53,54,55]. This automation improves accuracy, streamlining baseline data creation and enhancing the reliability of impact analyses. Figure 5a–h compares the results of four machine learning algorithms—ANN, KNN, RF, and SVM—applied to the study area for 2000 and 2020. Figure 5a,b show the ANN classification, Figure 5c,d display the KNN results, Figure 5e,f represent the RF classification, and Figure 5g,h show the SVM classification. Comparing the classifications for both years reveals distinct results, with varying accuracy and spatial representation. Notably, RF and SVM algorithms demonstrate significant improvements in accuracy and efficiency, reducing the need for manual intervention in complex landscape classifications.
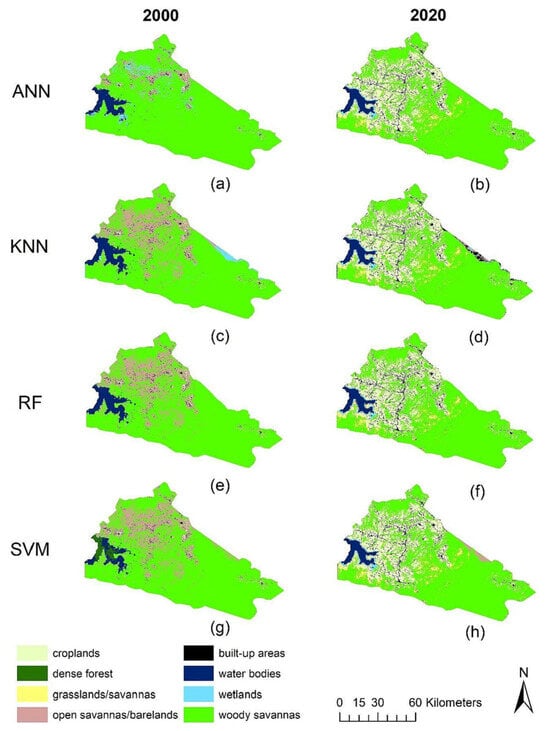
Figure 5.
Comparison of LULC classification of the study area between the years 2000 (a,c,e,g) and 2020 (b,d,f,h) based on the four models. Reprinted with permission from Ref. [54]. Copyright 2023 Elsevier.
The most transformative role of AI/ML is in predictive modeling. By learning from historical environmental data, ML models can forecast future outcomes with high accuracy. For example, ML models can predict landslide susceptibility by analyzing the relationships between past landslides and factors such as slope, geology, rainfall, and land cover [56]. In ecology, species distribution models (SDMs) use ML to predict the potential habitat of a species based on locations where it is known to occur and a suite of environmental variables, allowing for the assessment of how a project or climate change might impact that species’ range [57]. Research has demonstrated that the use of AI can significantly improve assessment outcomes, with some studies indicating that AI-driven analyses can boost anomaly detection rates by up to 40% and enhance the predictive accuracy of models by over 30% compared to traditional methods [58].
AI is also being applied to automate and accelerate various stages of the EIA process itself. AI-powered tools can assist in cleaning and preparing large datasets, extracting relevant features for analysis, and even conducting initial literature reviews by summarizing vast numbers of scientific papers, drastically reducing the time and resources required for an assessment [59,60,61].
In the case of land use planning in the London Borough of Bromley, GIS-MCDM was used to integrate environmental factors such as slope, soil stability, and proximity to settlements to select the most suitable site for a new highway [62]. The MCDM method allowed for each factor to be weighted according to its significance to the project’s sustainability goals. By overlaying these weighted layers in a GIS environment, decision-makers were able to identify locations that minimized ecological disruption, such as avoiding areas of high soil erosion potential and critical wildlife habitats. This approach not only ensured environmental protection but also streamlined the decision-making process, making it more transparent and objective. The integration of GIS and MCDM helped prioritize areas for development that were least likely to contribute to long-term environmental degradation [63,64].
3.3. Multi-Source Data Fusion
Ecological systems’ complexity requires a holistic approach that considers a wide range of interacting factors. Multi-source data fusion integrates data from diverse sources and formats to create a more comprehensive, consistent, and accurate dataset. GIS is the ideal platform for this fusion, as it spatially aligns and integrates various types of information [65,66].
This process combines core geospatial data from sources like RS and LiDAR with non-spatial or differently formatted data. A key application is fusing socio-economic data, such as population density, income levels, and infrastructure locations. Overlaying this data with maps of environmental impacts, like pollution plumes or flood risk zones, helps assess environmental justice and identify vulnerable communities [43,67,68,69,70].
The fusion of GIS with climate data is becoming vital. By integrating historical climate records and climate model outputs, practitioners can assess a project’s vulnerability to climate change (e.g., increased flood risk or water scarcity) and its contribution to greenhouse gas emissions [71]. The integration of real-time sensor data from the Internet of Things (IoT), discussed in Section 6, adds another dimension to data fusion, enabling dynamic environmental management [72,73].
By fusing these multi-source datasets, practitioners can move beyond a purely ecological assessment to a more comprehensive socio-ecological systems analysis. This holistic, multi-dimensional view of the project environment reduces uncertainty and enables a more robust and well-rounded EIA that accounts for the complex interplay of environmental, social, and economic factors [74,75,76]. Figure 6 shows how integrating Social-Ecological Systems (SES) into Ecosystem Services (ES) management provides a more comprehensive, multi-dimensional view that goes beyond ecological assessment. It illustrates how combining datasets from land use, climate, and soil helps assess changes in key ecosystem services like water yield, carbon storage, and habitat quality. This holistic approach enables practitioners to account for the complex interactions between environmental, social, and economic factors, reducing uncertainty and enhancing the robustness of Environmental Impact Assessment (EIA). Integrating SES and ES changes improves decision-making effectiveness in environmental management.
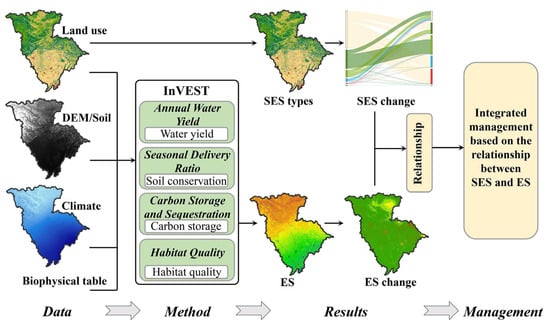
Figure 6.
Integrated framework of social-ecological system (SES) into ecosystem services (ES) management. Reprinted with permission from Ref. [75]. Copyright 2024 Elsevier.
The convergence of GIS with RS and AI/ML represents a transformative shift, enabling the creation of a “digital twin” of the environment. In this system, GIS provides the spatial framework, RS continuously updates it, and AI/ML processes the data, learns system dynamics, and simulates responses to proposed interventions. This creates a virtual laboratory where complex ecosystem interactions can be modeled and tested before physical changes are made [77,78]. The integration of GIS with Remote Sensing (RS), AI/ML, and Multi-Source Data Fusion enhances Environmental Impact Assessment (EIA) capabilities. Table 3 compares these technologies, showing their contributions, data inputs, benefits, and challenges. RS improves data acquisition with satellite imagery and LiDAR but faces issues like atmospheric interference. AI/ML enables predictive analytics and automation, offering valuable insights but requiring large datasets and expertise. Multi-Source Data Fusion provides a holistic view by integrating diverse data sources, though challenges like data heterogeneity and computational complexity persist.
Table 3.
Comparison of Integrated Technologies in GIS-based EIA.
4. GIS in EIA: Typical Case Studies
The methods and technology behind GIS in EIA are best understood through real-world applications. In various development sectors, GIS has proven essential for assessing and mitigating ecological impacts. Case studies from urban planning, transportation, and natural resource management demonstrate the practical value and potential of GIS in EIA. These examples show how GIS’s ability to handle large, complex datasets is shifting the focus from project-specific EIA to proactive, landscape-scale Strategic Environmental Assessment (SEA).
4.1. Urban Planning and Expansion
The rapid and often unplanned expansion of urban areas is a primary driver of habitat loss, resource depletion, and environmental degradation globally. GIS-based EIA is a critical tool for managing this growth sustainably by providing planners with the means to monitor urban sprawl and assess the carrying capacity of the surrounding environment [85,86,87].
In response to rapid urbanization, planners in Hangzhou used a GIS-based approach to assess the region’s capacity for growth without causing ecological damage. The study began by creating an ecological sensitivity map by integrating data layers such as topography (elevation and slope from a Digital Elevation Model), land use (from Landsat imagery), and development intensity (proximity to residential areas, roads, and population density). Each factor was weighted to create a composite sensitivity index, categorizing the region into four levels of sensitivity: non-sensitive, lightly sensitive, moderately sensitive, and highly sensitive. The results showed a clear gradient, with ecological sensitivity increasing from the urban core to the periphery [87].
The GIS-generated sensitivity map calculated the Urban Land Carrying Capacity (ULCC), distinguishing areas suitable for development from those that should be preserved. Highly sensitive areas, such as mountains, forests, and riversides near the Qiantang River, were identified as critical zones for protection. This GIS analysis provided a scientifically sound framework for urban planning and zoning, guiding development toward fewer sensitive areas and targeting conservation efforts at vulnerable zones. The same approach was used to assess urban sustainability in Dammam, Saudi Arabia, offering insights into managing urban growth through spatial decision-support systems [88].
4.2. Transportation Infrastructure Construction
Linear infrastructure projects, such as highways and railways, pose unique and significant ecological challenges, most notably habitat fragmentation, which can isolate wildlife populations and disrupt ecological processes [30]. GIS is now central to the EIA process for such projects, used for everything from initial route selection to detailed modeling of specific environmental impacts [89,90].
In Ukraine, a study assessed the environmental impact of a new national road by using GIS to model its effects on local hydrology and erosion [39]. Researchers used a high-resolution Digital Elevation Model (DEM) in GIS to calculate two key indices: the Topographic Wetness Index (TWI), predicting soil moisture, and the LS factor, modeling erosion risk based on slope length and steepness. They ran models for two scenarios: the existing landscape and the proposed road embankment. The simulation predicted that the road would significantly alter water redistribution within a 3 km buffer zone, increasing moisture in some areas (risking waterlogging) and decreasing it in others (risking desiccation). It also identified locations with higher erosion risk. This spatially explicit forecast enabled the design of targeted mitigation measures, such as culverts and slope stabilization, which a non-spatial assessment would have missed.
A GIS-based framework was developed for the environmental risk assessment of transportation projects in Lagos State, Nigeria [9]. It combined spatial analysis with multi-criteria decision analysis to evaluate proposed road alignments. Vulnerability maps were created using data on environmental sensitivity, proximity to ecosystems, and potential hazards, providing a vulnerability score for each alternative. This allowed planners to identify the corridor with the least ecological impact, justifying its selection for further study. A similar GIS-based Spatial Decision Support System (SDSS) was used for the Via Baltica corridor in Poland, offering a holistic comparison of route alternatives based on their cumulative environmental impacts [91].
4.3. Natural Reserve and Protected Area Management
EIAs are of paramount importance for any development project proposed near or within natural reserves and protected areas, where the margin for error is minimal and the primary objective is conservation [92]. GIS provides the essential tools for establishing detailed ecological baselines, mapping critical habitats, monitoring environmental conditions, and assessing the potential impacts of external pressures on these sensitive ecosystems [93,94].
An EIA for the Chaishitan Water Conservancy Project in Yunnan, China, showcases a comprehensive approach to assessing impacts in an ecologically significant area [95]. The study used GIS, remote sensing, and a Composite Evaluation Index (CEI) to predict the project’s effects on land use and plant diversity. Remote sensing classified the existing landscape, while field surveys cataloged plant species. The project’s footprint was overlaid on these maps in GIS to model predicted changes. The CEI, with indicators for naturality, diversity, stability, and human interference, provided a quantitative “before and after” assessment. The study found that the project would cause minor land use changes and, by providing a stable water supply, could enhance local plant diversity over time. This model-driven assessment supported the decision to approve the project and established a baseline for future monitoring.
In another example, GIS-based MCDA guided sustainable development in Kurdistan, Iraq, by mapping its ecotourism potential [96]. The study integrated indicators across three categories: Natural-Based Ecotourism, Ecotourism Hospitality, and Intangible Cultural Heritage. These indicators, such as biodiversity, scenic beauty, accessibility, and cultural sites, were standardized and weighted within a GIS framework. The resulting suitability map identified high-potential zones for sustainable ecotourism, creating a strategic plan to direct investment and infrastructure toward tourism-supporting areas while avoiding the most ecologically fragile regions.
5. Challenges and Enduring Problems
Although GIS has transformative potential and is widely adopted in EIA, its full impact is often limited by persistent challenges in data, technology, and policy. These issues affect the consistency, validity, and influence of GIS-based assessments. Addressing them is crucial for improving EIA and ensuring decisions are based on reliable, comprehensive scientific information.
5.1. Data Quality, Availability, and Standardization
The axiom “garbage in, garbage out” is particularly resonant in the context of GIS-based EIA. The reliability of any spatial analysis or model is fundamentally dependent on the quality of the input data, and issues with data integrity remain a primary challenge [97]. Several key dimensions of data quality are of concern.
Accuracy and precision are crucial, including positional accuracy (correct location), attribute accuracy (correct information), and temporal accuracy (reflecting the current state). Outdated LULC maps or inaccurate species data can lead to flawed conclusions about potential impacts [20]. For example, in a recent EIA for a linear infrastructure project in Northern China, outdated habitat maps led to flawed impact conclusions. The habitat maps used were based on data that was over a decade old, and they did not account for recent land use changes, which resulted in a miscalculation of the potential effects on endangered species [98]. As a result, the project was initially approved without the necessary mitigation measures for these species, leading to significant delays and costly revisions to the project. This case illustrates how outdated or inaccurate data can severely hinder the EIA process, leading to incorrect conclusions and increased costs [99].
Data availability and accessibility present another significant barrier. High-quality, high-resolution geospatial data, such as recent satellite imagery or LiDAR-derived elevation models, can be prohibitively expensive or subject to proprietary restrictions, particularly in developing countries or for smaller organizations [100]. In many cases, the necessary data for a comprehensive assessment simply may not exist, requiring costly and time-consuming primary data collection efforts.
Scale and resolution are critical factors. Environmental processes occur at different spatial scales, and using inappropriate data scales can lead to misleading results, known as the Modifiable Areal Unit Problem (MAUP) [101]. For instance, a regional-scale habitat map may be too coarse to accurately assess the impact of a small-footprint project on a specific microhabitat.
A major issue is the lack of standardization. Agencies often produce data in various formats, using different classification schemes, coordinate systems, and metadata standards. This lack of common standards hinders data integration—a process known as interoperability—which is essential for comprehensive impact assessments [102,103]. Without standardization, practitioners must spend a significant amount of time and resources on data cleaning, transformation, and harmonization before any analysis can even begin.
5.2. Technical and Methodological Complexity
The growing complexity of GIS and its integrated technologies presents challenges. While powerful, these tools require high technical expertise. A key hurdle is interoperability, not only between different GIS platforms but also with other software used in planning and design. For example, integrating GIS data with Building Information Modeling (BIM) systems is essential for seamless assessments but is often hindered by differences in data structures and standards [104,105,106].
Advanced analytical models in EIA also present challenges. AI/ML algorithms, in particular, often function as “black boxes,” making their internal logic and decision-making difficult to interpret [107]. This lack of transparency can hinder their acceptance by regulatory agencies, decision-makers, and the public, who may distrust models they cannot understand. Additionally, all predictive models face uncertainty due to incomplete knowledge of ecological systems, errors in input data, and the inherent randomness of natural processes. Quantifying and communicating this uncertainty is crucial for maintaining the scientific credibility of an assessment [108].
These technical complexities highlight the need for specialized expertise. Using advanced GIS, remote sensing, and AI/ML effectively requires combining ecological knowledge with skills in spatial statistics, data science, and computational modeling. Often, there is a gap between the technology’s capabilities and the capacity of personnel in environmental agencies and consulting firms, limiting the adoption of advanced assessment methods [41,109].
5.3. Policy, Legal, and Institutional Support Gaps
The successful use of GIS in EIA depends on a supportive policy, legal, and institutional framework, but gaps often exist. While most countries have legal mandates for EIA, these regulations often lack specific requirements for GIS or other geospatial technologies. Legislation may be vague, inconsistent, or outdated, failing to keep up with technological advancements [109,110]. Without a clear legal or policy driver, there is little incentive for project proponents or regulatory agencies to adopt more rigorous, GIS-based assessment methods.
Institutional inertia and capacity limitations are major barriers. Environmental agencies may lack the financial resources for necessary software, hardware, and data, or the will to overhaul paper-based workflows [111]. This is often compounded by the lack of trained personnel discussed previously.
The major challenge is the disconnect between technical assessments and political decision-making. Even with a high-quality, scientifically robust GIS-based EIA, its findings may be ignored or marginalized due to political or economic pressures. Often, the assessment is treated as a procedural step rather than a tool to genuinely guide the decision [112].
GIS has great potential to improve public participation by visualizing complex information in accessible, map-based formats. However, institutional mechanisms for this are often underdeveloped. Traditional consultation processes may not accommodate new digital, interactive engagement methods, limiting GIS’s ability to create a more inclusive and transparent EIA process. Data, technology, and policy challenges are deeply intertwined, often reinforcing each other and creating a cycle of inertia that is hard to break [113,114].
6. Future Development Directions
As technology advances and environmental challenges grow, GIS in EIA is set for a transformative leap. The future is moving beyond static assessments toward intelligent, dynamic, and participatory environmental management systems. This shift is driven by innovations in artificial intelligence, real-time sensor networks, and the increasing need for stronger policy frameworks and more inclusive decision-making [41,115].
6.1. Intelligent and Automated Assessment Methods
The integration of Artificial Intelligence and Big Data with GIS will revolutionize EIA’s efficiency and analytical depth. This convergence, known as GeoAI, will create “intelligent” EIA systems that automate time-consuming assessment tasks. These systems can process and classify large amounts of remote sensing data, identify complex patterns of environmental change, and run impact scenarios to test the resilience of project designs or mitigation strategies [116,117].
The focus of assessment will shift from retrospective analysis to proactive predictive analytics. Advanced Machine Learning models will offer more accurate forecasts of ecological responses to development and climate change, moving from basic impact prediction to risk and vulnerability modeling. This shift will be supported by the growing availability of geospatial big data. New data streams—from high-resolution satellites, social media feeds, mobile location data, and citizen science platforms—will be integrated into GIS to provide real-time insights into human-environment interactions and their ecological impacts [118,119].
GeoAI, which combines machine learning, artificial intelligence, and geospatial techniques, is rapidly transforming the Environmental Impact Assessment (EIA) process. One of the emerging applications of GeoAI in EIA is the use of large language models (LLMs), such as GPT-based models, to automate the analysis of textual data. LLMs can process and extract key concerns, trends, and compliance risks from a wide range of unstructured data sources, including public comments, technical reports, and environmental regulations.
By integrating LLMs with GIS workflows, decision-makers can gain deeper insights from large volumes of textual information, enhancing the spatial analysis capabilities of traditional GIS methods. Additionally, LLMs facilitate real-time data analysis through conversational interfaces to environmental data portals, making the EIA process not only more accessible but also more efficient. The integration of AI-powered models with geospatial data sources will significantly improve decision-making in EIA by enabling faster processing, more accurate predictions, and more transparent analyses of environmental impacts.
The rapid advancement of technologies such as Big Data and the Internet of Things (IoT) has already reshaped many aspects of the EIA process by enabling real-time monitoring and enhanced data integration. However, GeoAI, with its potential for automating the analysis of unstructured data, represents a further leap in the integration of AI with GIS, leading to faster, more accurate, and more dynamic environmental assessments.
6.2. Real-Time Monitoring and Adaptive Management Systems
The key shift in EIA’s future will be moving from one-time pre-project assessments to continuous, real-time monitoring. This is enabled by integrating GIS with the Internet of Things (IoT). In this model, GIS platforms will act as a central dashboard, processing and visualizing data from in situ sensors monitoring environmental parameters like air and water quality, soil moisture, noise levels, and wildlife movement via GPS collars [115].
This real-time capability shifts EIA from a static assessment to dynamic environmental management. The EIA report becomes the starting point of an ongoing, lifecycle-based process. Known as adaptive management, this approach continuously evaluates a project’s impacts after construction [120,121]. If real-time monitoring detects unforeseen negative impacts or underperforming mitigation measures, managers can promptly adjust strategies. This creates a dynamic feedback loop, managed through a geospatial intelligence platform [122,123]. The goal is a “digital twin”—a virtual model of the project and its ecosystem, continuously updated with real-time data from IoT sensors. This digital twin enables continuous simulation, stress-testing, and optimization throughout the project’s life [124,125].
6.3. Policy-Driven and Participatory GIS Applications
Technological advancement alone is not enough; its success depends on parallel innovations in policy, governance, and public engagement. A key development will be strengthening legal and policy frameworks to mandate and standardize the use of geospatial technologies in EIA. Clear guidelines on data quality, methods, and reporting will ensure consistency and promote best practices across projects [102,126]. As these frameworks mature, GIS will become a more critical tool for evidence-based policymaking, helping decision-makers visualize the environmental impacts of land use plans, regulations, and development strategies before implementation [127].
The future will emphasize greater public participation through web-based and mobile GIS platforms, known as Public Participation GIS (PPGIS). These tools make complex spatial data accessible to non-experts through interactive maps, 3D visualizations, and user-friendly dashboards [113]. They also enable two-way information flow, allowing citizens to contribute local knowledge and environmental observations through mobile apps—a practice called Volunteered Geographic Information (VGI) or citizen science. This enriches the EIA with detailed local data and promotes a more transparent, inclusive, and legitimate decision-making process [113].
In addition to the integration of GIS in decision-making and policy frameworks, Public Participation GIS (PPGIS) and citizen science have increasingly become valuable tools in enhancing the EIA process. PPGIS platforms enable the public to actively contribute to environmental assessments, making spatial data more accessible to non-experts through interactive maps, 3D visualizations, and user-friendly dashboards. For example, in the EPA’s Community Mapping Initiative, local communities used PPGIS to map environmental hazards, such as pollution sources, and these data were incorporated into formal environmental assessments. This not only helped ensure that community concerns were considered but also improved the overall accuracy of environmental monitoring by including local knowledge.
Another successful example of citizen science in EIA is the eBird project, where volunteers contribute data about bird populations and their habitats. This information is often used in EIA processes to assess how proposed projects might impact migratory patterns or local species. Additionally, Sentinel Hub, an online tool that allows citizens to analyze satellite imagery, has been used in EIA to monitor deforestation and urbanization, providing real-time data on environmental changes [128].
The incorporation of these community-driven data sources into the EIA process promotes greater inclusivity, transparency, and public trust. It also provides a broader range of data for analysis, including fine-grained, localized environmental information, that might otherwise be missing from more traditional, top-down data collection methods. These applications show how PPGIS and citizen science are not only enhancing public participation but also improving the quality and scope of EIA data collection, contributing to more robust and comprehensive environmental assessments.
The challenges and future directions are intrinsically linked, with emerging innovations providing direct solutions to current limitations. Table 4 provides a synthesized overview of these relationships.
Table 4.
Summary of Challenges and Correlated Future Directions in GIS for EIA.
6.4. Research Gaps and Future Research Directions
Although this study has systematically explored the application of GIS technologies in Environmental Impact Assessment (EIA), integrating key techniques such as remote sensing, artificial intelligence/machine learning, and public participation GIS, several research gaps remain to be addressed. From the perspective of data and modelling, current geospatial models often suffer from uneven data distribution, temporal lags, mismatched scales, and significant uncertainty in model outputs [132]. In EIA contexts, how to systematically incorporate these uncertainties into model construction, enhance predictive reliability, and achieve model transferability across different scales (from micro-habitats to regional landscapes) remains an underdeveloped area. Future research may focus on building more explainable GeoAI models (such as XAI), integrating long-time-series data, developing multi-scale change detection methods, and establishing open, reproducible workflows for geospatial model construction to improve the verifiability and transparency of assessment results.
Important opportunities exist in the domain of public participation and methodological fusion. Although this paper has discussed the potential of Public Participation GIS (PPGIS) and citizen science in EIA, there is still limited research on how community-driven data can be systematically integrated into GIS-EIA workflows, how data quality can be assured, and how its influence on actual decision-making can be evaluated. The literature highlights that the integration of local knowledge and digital geospatial technologies is still underexplored [133]. Future research could examine how to design more interactive and sustainable mobile/web participation platforms to seamlessly connect public-contributed data with GIS analysis; concurrently, it should study the pathways through which citizen-provided data affect policy and governance. In addition, given the rapid urbanization and climate-change context of many EIA projects, emerging technologies (such as automated GIS agents and large-language-model-driven geospatial intelligence systems) still represent frontier opportunities. By filling these research gaps, future scholarship will better support EIA applications in highly dynamic and complex environments.
7. Conclusions
7.1. Summary of Findings
This paper examines the role of a Geographic Information System (GIS) in Ecological Impact Assessment (EIA), tracing its evolution and future direction. The analysis shows that GIS has evolved from a peripheral tool to a central framework in modern environmental assessment. Its core applications—spatial data management, spatial analysis, ecological sensitivity mapping, and impact prediction—have strengthened the scientific basis of EIA.
The transformative power of GIS is amplified through its integration with other technologies. Synergy with Remote Sensing enables large-scale, long-term environmental monitoring. Integration with Artificial Intelligence and Machine Learning enhances predictive analytics and automation, improving the efficiency and insight of assessments. GIS’s ability to combine ecological, climatic, and socio-economic data provides a more comprehensive understanding of human-environment systems. Case studies from urban planning, transportation infrastructure, and protected area management show how these integrated approaches address real-world challenges, offering a strategic, landscape-scale perspective that was once unattainable [42,119,134,135].
The path to realizing the full potential of GIS in EIA is fraught with significant challenges. Issues with data quality, availability, and standardization undermine assessment reliability. The complexity of advanced models and lack of system interoperability create adoption barriers, while a shortage of specialized expertise remains. Most critically, technological advancements often outpace the development of supportive policies, legal frameworks, and institutions, creating a disconnect between scientific assessments and political decision-making [8,136].
The future of GIS in EIA is moving toward intelligent, real-time, and participatory systems. GIS’s fusion with AI and Big Data will enable more automated, predictive assessments. Integration with the Internet of Things (IoT) will shift the focus from static pre-project evaluation to continuous, lifecycle-based monitoring and adaptive management. The development of policy frameworks and the expansion of Public Participation GIS (PPGIS) will be key to ensuring these technologies are used transparently, equitably, and effectively [131,137].
7.2. Research Significance and Final Remarks
The overarching significance of GIS in EIA lies in its profound contribution to the scientific rigor, objectivity, and transparency of the process. By using verifiable spatial data and reproducible methods, GIS transforms EIA from a subjective exercise into a more credible scientific endeavor. This has important real-world implications. It provides decision-makers with clearer, more comprehensive information, enables more effective mitigation strategies, and strengthens the accountability of projects for their environmental performance [20,138].
The integration of GIS and its technologies into EIA is essential for managing the trade-offs in sustainable development. In an era of environmental change, balancing human development and ecological preservation requires dynamic, interconnected tools. GIS is that tool. However, its effectiveness will depend not only on technological innovation but also on the evolution of our institutions and policies. The challenge is to build the capacity to use these geospatial technologies wisely and equitably, ensuring they contribute to a more sustainable and resilient future.
Author Contributions
X.L. and J.D. conceived the study; X.L., J.D. and B.D. designed the methodology; X.L., B.D. and Y.J. performed validation; X.L. and B.D. conducted formal analysis; B.D., Y.J. and Y.W. carried out the investigation; X.L. and H.G. provided resources; X.L. and Y.W. curated the data; X.L. and J.D. drafted the original manuscript; X.L., B.D., Y.J., Y.W. and H.G. reviewed and edited the manuscript; X.L. and Y.W. prepared the visualizations; X.L. and H.G. supervised the work; X.L. administered the project and acquired funding. All authors have read and agreed to the published version of the manuscript.
Funding
This study was supported by the Heilongjiang Natural Science Foundation (YQ2022C027).
Institutional Review Board Statement
Not applicable.
Informed Consent Statement
Not applicable.
Data Availability Statement
No new data were created or analyzed in this study.
Conflicts of Interest
The authors declare no conflicts of interest.
References
- Vishwakarma, R.; Singh, P.; Singh, Y. Methods and Applications of Environmental Impact Assessments. In Energy, Ecology, and Environment: Fundamentals and Applications; Zenodo: Geneva, Switzerland, 2025. [Google Scholar]
- Luo, L.; Zhang, J.; Wang, H.; Chen, M.; Jiang, Q.; Yang, W.; Wang, F.; Zhang, J.; Swain, R.B.; Meadows, M.E.; et al. Innovations in science, technology, engineering, and policy (iSTEP) for addressing environmental issues towards sustainable development. Innov. Geosci. 2024, 2, 100087. [Google Scholar] [CrossRef]
- Wanner, M.S.T.; Miljand, M. Unlocking the transformative potential of multi-stakeholder partnerships for sustainable development: Assessing perceived effectiveness and contributions to systemic change. World Dev. 2025, 191, 107007. [Google Scholar] [CrossRef]
- Alarcón-Ferrari, C.; Jönsson, M.; Do, T.; Gebrehiwot, S.G.; Chiwona-Karltun, L.; Mark-Herbert, C.; Powell, N.; Ruete, A.; Hilding-Rydevik, T.; Bishop, K. Analyzing environmental communication and citizen science in the context of environmental monitoring and assessment for Agenda 2030 in rural settings of Chile and Sweden. Front. Commun. 2024, 9, 1387111. [Google Scholar] [CrossRef]
- Bond, A.; Pope, J.; Fundingsland, M.; Morrison-Saunders, A.; Retief, F.; Hauptfleisch, M. Explaining the political nature of environmental impact assessment (EIA): A neo-Gramscian perspective. J. Clean. Prod. 2020, 244, 118694. [Google Scholar] [CrossRef]
- Aljareo, A.; Watson, I.; Schwaibold, U. Developing an evaluation approach to consider the influence of country context on environmental impact assessment performance, from a southern African perspective. Integr. Environ. Assess. Manag. 2023, 19, 1510–1524. [Google Scholar] [CrossRef]
- Pinheiro, M.D. Environmental Impact Assessment—Exploring New Frontiers. Environments 2025, 12, 8. [Google Scholar] [CrossRef]
- Eitan, A.; Levi-Faur, D. Environmental impact assessments as a mechanism of regulatory intermediation: The case of Israeli wind energy. Policy Soc. 2025, puaf006. [Google Scholar] [CrossRef]
- Miriam, O.O.; Adike, F.U.; Folake, O.R.; Sodiq, S.K.; Chukwu, B.N.; Animashaun, T.A.; Ebenmelu, C.E.; Chinonyerem, C.A. Environmental Risk Assessment of Transportation Infrastructure Development Using Gis in Lagos State. Int. J. Earth Des. Innov. Res. 2024, 6, 13–26. [Google Scholar] [CrossRef]
- Das, S.; Choudhury, M.R.; Chatterjee, B.; Das, P.; Bagri, S.; Paul, D.; Bera, M.; Dutta, S. Unraveling the urban climate crisis: Exploring the nexus of urbanization, climate change, and their impacts on the environment and human well-being—A global perspective. AIMS Public Health 2024, 11, 963–1001. [Google Scholar] [CrossRef]
- Laurance, W.F.; Clements, G.R.; Sloan, S.; O’connell, C.S.; Mueller, N.D.; Goosem, M.; Venter, O.; Edwards, D.P.; Phalan, B.; Balmford, A.; et al. A global strategy for road building. Nature 2014, 513, 229–232. [Google Scholar] [CrossRef]
- Gazzola, P.; Onyango, V. The evolution of environmental assessment through storytelling—Stories from five decades of experience. Environ. Impact Assess. Rev. 2024, 108, 107591. [Google Scholar] [CrossRef]
- Struthers, C.L.; Murenbeeld, K.J.; Williamson, M.A. Environmental impact assessments not the main barrier to timely forest management in the United States. Nat. Sustain. 2023, 6, 1542–1546. [Google Scholar] [CrossRef]
- Bhatt, R.; Khanal, S. Environmental impact assessment system and process: A study on policy and legal instruments in Nepal. J. Environ. Sci. Technol. 2010, 4, 586–594. [Google Scholar]
- Caro-Gonzalez, A.L.; Nita, A.; Toro, J.; Zamorano, M. From procedural to transformative: A review of the evolution of effectiveness in EIA. Environ. Impact Assess. Rev. 2023, 103, 107256. [Google Scholar] [CrossRef]
- Bond, A.; Retief, F.P.; Alberts, R.C.; Roos, C.; Cilliers, D.; Moolman, J. What would environmental impact assessment look like if we started from scratch today? Designing better EIA for developed neoliberal nations. Impact Assess. Proj. Apprais. 2024, 42, 410–422. [Google Scholar] [CrossRef]
- Foley, M.M.; Mease, L.A.; Martone, R.G.; Prahler, E.E.; Morrison, T.H.; Murray, C.C.; Wojcik, D. The challenges and opportunities in cumulative effects assessment. Environ. Impact Assess. Rev. 2017, 62, 122–134. [Google Scholar] [CrossRef]
- Cilliers, D.; Retief, F.; Bond, A.; Roos, C.; Alberts, R. The validity of spatial data-based EIA screening decisions. Environ. Impact Assess. Rev. 2022, 93, 106729. [Google Scholar] [CrossRef]
- Xie, Y.; Xie, B.; Wang, Z.; Gupta, R.K.; Baz, M.; AlZain, M.A.; Masud, M. Geological Resource Planning and Environmental Impact Assessments Based on GIS. Sustainability 2022, 14, 906. [Google Scholar] [CrossRef]
- Campo, A.G.D. GIS in Environmental Assessment: A Review of Current Issues and Future Needs. J. Environ. Assess. Policy Manag. 2012, 14, 1250007. [Google Scholar] [CrossRef]
- Christiansen, S.; Bräger, S.; Jaeckel, A. Evaluating the quality of environmental baselines for deep seabed mining. Front. Mar. Sci. 2022, 9, 898711. [Google Scholar] [CrossRef]
- Kamara, S.M. Development of a geographic information systems baseline spatial geodatabase template for evaluating potential and predicted environmental impacts for sustainable environmental impact assessment of mining in Sierra Leone. J. Geosci. Environ. Prot. 2020, 8, 262–284. [Google Scholar] [CrossRef]
- Quamar, M.M.; Al-Ramadan, B.; Khan, K.; Shafiullah, M.; El Ferik, S. Advancements and Applications of Drone-Integrated Geographic Information System Technology—A Review. Remote Sens. 2023, 15, 5039. [Google Scholar] [CrossRef]
- Štular, B.; Lozić, E.; Eichert, S. Airborne LiDAR-Derived Digital Elevation Model for Archaeology. Remote Sens. 2021, 13, 1855. [Google Scholar] [CrossRef]
- Ali, A.; Hadeed, M.; Safavi, S.; Ahmad, M. Leveraging GIS for Environmental Planning and Management. In Global Challenges for the Environment and Climate Change; IGI Global Scientific Publishing: Hershey, PA, USA, 2024; pp. 308–331. [Google Scholar]
- Choi, Y.; Baek, J.; Park, S. Review of GIS-Based Applications for Mining: Planning, Operation, and Environmental Management. Appl. Sci. 2020, 10, 2266. [Google Scholar] [CrossRef]
- Calka, B.; Szostak, M. GIS-Based Environmental Monitoring and Analysis. Appl. Sci. 2025, 15, 3155. [Google Scholar] [CrossRef]
- Zhao, K.; Jin, B.; Fan, H.; Song, W.; Zhou, S.; Jiang, Y. High-Performance Overlay Analysis of Massive Geographic Polygons That Considers Shape Complexity in a Cloud Environment. ISPRS Int. J. Geo-Inf. 2019, 8, 290. [Google Scholar] [CrossRef]
- Mohammadi, A.; Fatemizadeh, F. Quantifying Landscape Degradation Following Construction of a Highway Using Landscape Metrics in Southern Iran. Front. Ecol. Evol. 2021, 9, 721313. [Google Scholar] [CrossRef]
- Krstić, M.; Tadić, S.; Miglietta, P.P.; Porrini, D. Enhancing Biodiversity and Environmental Sustainability in Intermodal Transport: A GIS-Based Multi-Criteria Evaluation Framework. Sustainability 2025, 17, 1391. [Google Scholar] [CrossRef]
- AbdelRahman, M.A.E.; Yossif, T.M.H.; Metwaly, M.M. Enhancing land suitability assessment through integration of AHP and GIS-based for efficient agricultural planning in arid regions. Sci. Rep. 2025, 15, 31370. [Google Scholar] [CrossRef]
- Feng, H.; Zhang, X.; Nan, Y.; Zhang, D.; Sun, Y. Ecological Sensitivity Assessment and Spatial Pattern Analysis of Land Resources in Tumen River Basin, China. Appl. Sci. 2023, 13, 4197. [Google Scholar] [CrossRef]
- Yaman, A. A GIS-based multi-criteria decision-making approach (GIS-MCDM) for determination of the most appropriate site selection of onshore wind farm in Adana, Turkey. Clean Technol. Environ. Policy 2024, 26, 4231–4254. [Google Scholar] [CrossRef]
- Liu, T.; Peng, X.; Li, J. Evaluation of Ecological Sensitivity and Spatial Correlation Analysis of Landscape Patterns in Sanjiangyuan National Park. Sustainability 2024, 16, 5294. [Google Scholar] [CrossRef]
- Yang, X.; Shen, J. Landscape Sensitivity Assessment of Historic Districts Using a GIS-Based Method: A Case Study of Beishan Street in Hangzhou, China. ISPRS Int. J. Geo-Inf. 2023, 12, 462. [Google Scholar] [CrossRef]
- Dahal, A.; Tanyas, H.; van Westen, C.; van der Meijde, M.; Mai, P.M.; Huser, R.; Lombardo, L. Space–time landslide hazard modeling via Ensemble Neural Networks. Nat. Hazards Earth Syst. Sci. 2024, 24, 823–845. [Google Scholar] [CrossRef]
- Che, L.; Yin, S.; Jin, J.; Wu, W. Assessment and Simulation of Urban Ecological Environment Quality Based on Geographic Information System Ecological Index. Land 2024, 13, 687. [Google Scholar] [CrossRef]
- Wang, X. Integrating GIS, simulation models, and visualization in traffic impact analysis. Comput. Environ. Urban Syst. 2005, 29, 471–496. [Google Scholar] [CrossRef]
- Neposhyvailenko, N.; Omelych, I.; Dziuba, N. Assessment of environmental impact of road construction based on results of remote sensing monitoring. Agrology 2024, 7, 54–60. [Google Scholar] [CrossRef]
- Luan, C.; Liu, R.; Sun, J.; Su, S.; Shen, Z. An Improved Future Land-Use Simulation Model with Dynamically Nested Ecological Spatial Constraints. Remote Sens. 2023, 15, 2921. [Google Scholar] [CrossRef]
- Li, W.; Arundel, S.; Gao, S.; Goodchild, M.; Hu, Y.; Wang, S.; Zipf, A. GeoAI for Science and the Science of GeoAI. J. Spat. Inf. Sci. 2024, 1–17. [Google Scholar] [CrossRef]
- Song, Y.; Kalacska, M.; Gašparović, M.; Yao, J.; Najibi, N. Advances in geocomputation and geospatial artificial intelligence (GeoAI) for mapping. Int. J. Appl. Earth Obs. Geoinf. 2023, 120, 103300. [Google Scholar]
- Singh, A. Integration-of-Remote-Sensing-and-GIS-for-Environmental-Assessment. Environ. Rep. 2025, 6, 35–40. [Google Scholar]
- Nasiri, V.; Deljouei, A.; Moradi, F.; Sadeghi, S.M.M.; Borz, S.A. Land Use and Land Cover Mapping Using Sentinel-2, Landsat-8 Satellite Images, and Google Earth Engine: A Comparison of Two Composition Methods. Remote Sens. 2022, 14, 1977. [Google Scholar] [CrossRef]
- Bourbonnais, M. Applications of geographic information systems, spatial analysis, and remote sensing in environmental impact assessment. In Routledge Handbook of Environmental Impact Assessment; Routledge: London, UK, 2022; pp. 201–220. [Google Scholar]
- Dahy, B.; Al-Memari, M.; Al-Gergawi, A.; Burt, J.A. Remote sensing of 50 years of coastal urbanization and environmental change in the Arabian Gulf: A systematic review. Front. Remote Sens. 2024, 5, 1422910. [Google Scholar] [CrossRef]
- Hugonnet, R.; McNabb, R.; Berthier, E.; Menounos, B.; Nuth, C.; Girod, L.; Farinotti, D.; Huss, M.; Dussaillant, I.; Brun, F.; et al. Accelerated global glacier mass loss in the early twenty-first century. Nature 2021, 592, 726–731. [Google Scholar] [CrossRef] [PubMed]
- Zhang, X.; Zhao, T.; Xu, H.; Liu, W.; Wang, J.; Chen, X.; Liu, L. GLC_FCS30D: The first global 30 m land-cover dynamics monitoring product with a fine classification system for the period from 1985 to 2022 generated using dense-time-series Landsat imagery and the continuous change-detection method. Earth Syst. Sci. Data 2024, 16, 1353–1381. [Google Scholar] [CrossRef]
- Kolios, S.; Vorobev, A.V.; Vorobeva, G.R.; Stylios, C. GIS and Environmental Monitoring; Springer: Berlin/Heidelberg, Germany, 2017. [Google Scholar]
- Choi, Y. GeoAI: Integration of artificial intelligence, machine learning, and deep learning with GIS. Appl. Sci. 2023, 13, 3895. [Google Scholar] [CrossRef]
- Şanlı, C. Artificial intelligence in geography teaching: Potentialities, applications, and challenges. Int. J. Curr. Educ. Stud. 2025, 4, 47–76. [Google Scholar] [CrossRef]
- Zhao, S.; Tu, K.; Ye, S.; Tang, H.; Hu, Y.; Xie, C. Land Use and Land Cover Classification Meets Deep Learning: A Review. Sensors 2023, 23, 8966. [Google Scholar] [CrossRef]
- Yang, H.; Jiang, Z.; Zhang, Y.; Wu, Y.; Luo, H.; Zhang, P.; Wang, B. A high-resolution remote sensing land use/land cover classification method based on multi-level features adaptation of segment anything model. Int. J. Appl. Earth Obs. Geoinf. 2025, 141, 104659. [Google Scholar] [CrossRef]
- Yuh, Y.G.; Tracz, W.; Matthews, H.D.; Turner, S.E. Application of machine learning approaches for land cover monitoring in northern Cameroon. Ecol. Inform. 2023, 74, 101955. [Google Scholar] [CrossRef]
- Ma, L.; Liu, Y.; Zhang, X.; Ye, Y.; Yin, G.; Johnson, B.A. Deep learning in remote sensing applications: A meta-analysis and review. ISPRS J. Photogramm. Remote Sens. 2019, 152, 166–177. [Google Scholar] [CrossRef]
- Abdelkader, M.M.; Csámer, Á. Comparative assessment of machine learning models for landslide susceptibility mapping: A focus on validation and accuracy. Nat. Hazards 2025, 121, 10299–10321. [Google Scholar] [CrossRef]
- Zhang, C.; Liu, D.; Tsangaratos, P.; Ilia, I.; Ma, S.; Chen, W. Enhancing Predictive Accuracy of Landslide Susceptibility via Machine Learning Optimization. Appl. Sci. 2025, 15, 6325. [Google Scholar] [CrossRef]
- Immadisetty, A.; Olusegun, J. Machine Learning for Real-Time Anomaly Detection. 2025. Available online: https://www.researchgate.net/publication/387754595_Machine_Learning_for_Real-Time_Anomaly_Detection (accessed on 3 October 2025).
- Anifowose, B.; Anifowose, F. Artificial intelligence and machine learning in environmental impact prediction for soil pollution management—Case for EIA process. Environ. Adv. 2024, 17, 100554. [Google Scholar] [CrossRef]
- Gerassis, S.; Giráldez, E.; Pazo-Rodríguez, M.; Saavedra, Á.; Taboada, J. AI Approaches to Environmental Impact Assessments (EIAs) in the Mining and Metals Sector Using AutoML and Bayesian Modeling. Appl. Sci. 2021, 11, 7914. [Google Scholar] [CrossRef]
- Olawade, D.B.; Wada, O.Z.; Ige, A.O.; Egbewole, B.I.; Olojo, A.; Oladapo, B.I. Artificial intelligence in environmental monitoring: Advancements, challenges, and future directions. Hyg. Environ. Health Adv. 2024, 12, 100114. [Google Scholar] [CrossRef]
- Jiang, F.; Li, J.; Ma, L.; Dong, Z.; Chen, W.; Broyd, T.; Wang, G. Sustainable urban road planning under the digital twin-MCDM-GIS framework considering multidisciplinary factors. J. Clean. Prod. 2024, 469, 143097. [Google Scholar] [CrossRef]
- Rahman, M.M.; Szabó, G. Sustainable Urban Land-Use Optimization Using GIS-Based Multicriteria Decision-Making (GIS-MCDM) Approach. ISPRS Int. J. Geo-Inf. 2022, 11, 313. [Google Scholar] [CrossRef]
- Chen, J.; Xie, C.; Zhang, W.; Fu, C.; Shen, J.; Yang, B.; Li, H.; Shi, D. Current Status and Outlook of Roadbed Slope Stability Research: Study Based on Knowledge Mapping Bibliometric Network Analysis. Sustainability 2025, 17, 4176. [Google Scholar] [CrossRef]
- Castanedo, F. A review of data fusion techniques. Sci. World J. 2013, 2013, 704504. [Google Scholar] [CrossRef]
- Azari, P.; Li, S.; Shaker, A.; Sattar, S. Georeferencing Building Information Models for BIM/GIS Integration: A Review of Methods and Tools. ISPRS Int. J. Geo-Inf. 2025, 14, 180. [Google Scholar] [CrossRef]
- Priyashani, N.; Kankanamge, N.; Yigitcanlar, T. Multisource Open Geospatial Big Data Fusion: Application of the Method to Demarcate Urban Agglomeration Footprints. Land 2023, 12, 407. [Google Scholar] [CrossRef]
- Romshoo, S.A.; Amin, M.; Sastry, K.L.N.; Parmar, M. Integration of social, economic and environmental factors in GIS for land degradation vulnerability assessment in the Pir Panjal Himalaya, Kashmir, India. Appl. Geogr. 2020, 125, 102307. [Google Scholar] [CrossRef]
- Ma, X.; Zhang, L.; Yang, X.; Fan, Y.; Hiroatsu, F.; Zhang, J.; Li, L. Developing an environmental equity index for urban heat wave event. Environ. Sustain. Indic. 2025, 25, 100565. [Google Scholar] [CrossRef]
- Kross, A.; Kaur, G.; Jaeger, J.A.G. A geospatial framework for the assessment and monitoring of environmental impacts of agriculture. Environ. Impact Assess. Rev. 2022, 97, 106851. [Google Scholar] [CrossRef]
- Mahmoudi, H.; Sayahnia, R.; Esmaeilzadeh, H.; Azadi, H. Integrating resilience assessment in environmental impact assessment. Integr. Environ. Assess. Manag. 2018, 14, 567–570. [Google Scholar] [CrossRef]
- Bagheri, A.; Liu, G.-J. Climate change and urban flooding: Assessing remote sensing data and flood modeling techniques: A comprehensive review. Environ. Rev. 2024, 33, 1–14. [Google Scholar] [CrossRef]
- Chen, T.-L.; Pei, S.-L.; Pan, S.-Y.; Yu, C.-Y.; Chang, C.-L.; Chiang, P.-C. An engineering-environmental-economic-energy assessment for integrated air pollutants reduction, CO2 capture and utilization exemplified by the high-gravity process. J. Environ. Manag. 2020, 255, 109870. [Google Scholar] [CrossRef]
- Gain, A.K.; Giupponi, C.; Renaud, F.G.; Vafeidis, A.T. Sustainability of complex social-ecological systems: Methods, tools, and approaches. Reg. Environ. Change 2020, 20, 102. [Google Scholar] [CrossRef]
- Wang, Y.; Gong, J.; Zhu, Y. Integrating social-ecological system into watershed ecosystem services management: A case study of the Jialing River Basin, China. Ecol. Indic. 2024, 160, 111781. [Google Scholar] [CrossRef]
- Zhang, B.; Yin, J.; Jiang, H.; Chen, S.; Ding, Y.; Xia, R.; Wei, D.; Luo, X. Multi-source data assessment and multi-factor analysis of urban carbon emissions: A case study of the Pearl River Basin, China. Urban Clim. 2023, 51, 101653. [Google Scholar] [CrossRef]
- Ali, M.E.; Cheema, M.A.; Hashem, T.; Ulhaq, A.; Babar, M.A. Enabling Spatial Digital Twins: Technologies, Challenges, and Future Research Directions. PFG J. Photogramm. Remote Sens. Geoinf. Sci. 2024, 92, 761–778. [Google Scholar] [CrossRef]
- Attaran, M.; Celik, B.G. Digital Twin: Benefits, use cases, challenges, and opportunities. Decis. Anal. J. 2023, 6, 100165. [Google Scholar] [CrossRef]
- Chaminé, H.I.; Pereira, A.J.S.C.; Teodoro, A.C.; Teixeira, J. Remote sensing and GIS applications in earth and environmental systems sciences. SN Appl. Sci. 2021, 3, 870. [Google Scholar] [CrossRef]
- Pu, W.; Wang, Z.; Liu, D.; Zhang, Q. Optical Remote Sensing Image Cloud Detection with Self-Attention and Spatial Pyramid Pooling Fusion. Remote Sens. 2022, 14, 4312. [Google Scholar] [CrossRef]
- Binetti, M.S.; Massarelli, C.; Uricchio, V.F. Machine Learning in Geosciences: A Review of Complex Environmental Monitoring Applications. Mach. Learn. Knowl. Extr. 2024, 6, 1263–1280. [Google Scholar] [CrossRef]
- Liu, P.; Wang, L.; Li, J. Unlocking the Potential of Explainable Artificial Intelligence in Remote Sensing Big Data. Remote Sens. 2023, 15, 5448. [Google Scholar] [CrossRef]
- Abdulhafiz, W.; Khamis, A. Handling Data Uncertainty and Inconsistency Using Multisensor Data Fusion. Adv. Artif. Intell. 2013, 2013, 241260. [Google Scholar] [CrossRef]
- Ranatunga, S.; Ødegård, R.S.; Jetlund, K.; Onstein, E. Use of Semantic Web Technologies to Enhance the Integration and Interoperability of Environmental Geospatial Data: A Framework Based on Ontology-Based Data Access. ISPRS Int. J. Geo-Inf. 2025, 14, 52. [Google Scholar] [CrossRef]
- Furberg, D. Satellie Monitoring of Urban Growth and Indicator-Based Assessment of Environmental Impact; KTH Royal Institute of Technology: Stockholm, Sweden, 2014. [Google Scholar]
- Simkin, R.D.; Seto, K.C.; McDonald, R.I.; Jetz, W. Biodiversity impacts and conservation implications of urban land expansion projected to 2050. Proc. Natl. Acad. Sci. USA 2022, 119, e2117297119. [Google Scholar] [CrossRef]
- Tsou, J.; Gao, Y.; Zhang, Y.; Genyun, S.; Ren, J.; Li, Y. Evaluating Urban Land Carrying Capacity Based on the Ecological Sensitivity Analysis: A Case Study in Hangzhou, China. Remote Sens. 2017, 9, 529. [Google Scholar] [CrossRef]
- Alshuwaikhat, H.; Aina, Y. GIS-based urban sustainability assessment: The case of Dammam City, Saudi Arabia. Local Environ. 2006, 11, 141–162. [Google Scholar] [CrossRef]
- Mell, H.; Fack, V.; Percevault, L.; Vanpeene, S.; Bertheau, Y.; Coulon, A.; de Lachapelle, F.F.; Guinard, E.; Jeusset, A.; Le Mitouard, E.; et al. Can linear transportation infrastructure verges constitute a habitat and/or a corridor for vascular plants in temperate ecosystems? A systematic review. Environ. Evid. 2024, 13, 4. [Google Scholar] [CrossRef]
- Yang, F.; Tang, Y.; Xiong, S.; Gu, C.; Xiao, Y. Development of Highway Construction Route Selection Based on Ecological Sensitivity Evaluation and Intervention Optimization Strategy Research. Land 2024, 13, 1850. [Google Scholar] [CrossRef]
- Keshkamat, S.S.; Looijen, J.M.; Zuidgeest, M.H.P. The formulation and evaluation of transport route planning alternatives: A spatial decision support system for the Via Baltica project, Poland. J. Transp. Geogr. 2009, 17, 54–64. [Google Scholar] [CrossRef]
- Rajvanshi, A.; Mathur, V.B.; Iftikhar, U.A. Best Practice Guidance for Biodiversity-Inclusive Impact Assessment. A Manual for Practitioners and Reviewers in South Asia; International Association for Impact Assessment (IAIA): Fargo, ND, USA, 2008. [Google Scholar]
- Pegler, G.; Lemos, C.; Ranieri, V. Exploring the application of environmental impact assessment to tourism and recreation in protected areas: A systematic literature review. Environ. Dev. Sustain. 2024, 27, 15053–15075. [Google Scholar] [CrossRef]
- Tezel, D.; Inam, S.; Kocaman, S. GIS-Based Assessment of Habitat Networks for Conservation Planning in Kas-Kekova Protected Area (Turkey). ISPRS Int. J. Geo-Inf. 2020, 9, 91. [Google Scholar] [CrossRef]
- Zhu, Z.-X.; Zhao, K.-K.; Lin, Q.-W.; Qureshi, S.; Ross Friedman, C.; Cai, G.-Y.; Wang, H.-F. Systematic Environmental Impact Assessment for Non-natural Reserve Areas: A Case Study of the Chaishitan Water Conservancy Project on Land Use and Plant Diversity in Yunnan, China. Front. Ecol. Evol. 2017, 5, 60. [Google Scholar] [CrossRef]
- Mohammed, M. GIS Based Ecotourism Potentially Assessment in Kurdistan Region—Iraq. Doctoral Dissertation, University of Tabriz, Tabriz, Iran, 2024. [Google Scholar]
- Porter, D.E.; Kirtland, K.A.; Neet, M.J.; Williams, J.E.; Ainsworth, B.E. Considerations for using a geographic information system to assess environmental supports for physical activity. Prev. Chronic. Dis. 2004, 1, A20. [Google Scholar]
- Wei, Y.; Wang, H.; Xue, M.; Yin, Y.; Qian, T.; Yu, F. Spatial and Temporal Evolution of Land Use and the Response of Habitat Quality in Wusu, China. Int. J. Environ. Res. Public Health 2023, 20, 361. [Google Scholar] [CrossRef]
- Scherer, L.; Rosa, F.; Sun, Z.; Michelsen, O.; De Laurentiis, V.; Marques, A.; Pfister, S.; Verones, F.; Kuipers, K.J.J. Biodiversity Impact Assessment Considering Land Use Intensities and Fragmentation. Environ. Sci. Technol. 2023, 57, 19612–19623. [Google Scholar] [CrossRef]
- Pereira Mendes, C.; Lim, N.T.L. EcoLiDAR: An economical LiDAR scanner for ecological research. PLoS ONE 2024, 19, e0298712. [Google Scholar] [CrossRef]
- Jahan, F.; Haque, S.; Hogg, J.; Price, A.; Hassan, C.; Areed, W.; Thompson, H.; Cameron, J.; Cramb, S.M. Assessing the influence of the modifiable areal unit problem on Bayesian disease mapping in Queensland, Australia. PLoS ONE 2025, 20, e0313079. [Google Scholar] [CrossRef]
- Mushtaq, F.; O’Brien, C.D.; Parslow, P.; Åhlin, M.; Di Gregorio, A.; Latham, J.S.; Henry, M. Land Cover and Land Use Ontology—Evolution of International Standards, Challenges, and Opportunities. Land 2024, 13, 1202. [Google Scholar] [CrossRef]
- Lei, T.L.; Lei, Z. Harmonizing Full and Partial Matching in Geospatial Conflation: A Unified Optimization Model. ISPRS Int. J. Geo-Inf. 2022, 11, 375. [Google Scholar] [CrossRef]
- Chen, L.; Li, J.; Xu, M.; Xing, W. Navigating urban complexity: The role of GIS in spatial planning and urban development. Appl. Comput. Eng. 2024, 65, 282–287. [Google Scholar] [CrossRef]
- Tan, Y.; Liang, Y.; Zhu, J. CityGML in the Integration of BIM and the GIS: Challenges and Opportunities. Buildings 2023, 13, 1758. [Google Scholar] [CrossRef]
- Şenol, H.İ.; Gökgöz, T. Integration of Building Information Modeling (BIM) and Geographic Information System (GIS): A new approach for IFC to CityJSON conversion. Earth Sci. Inform. 2024, 17, 3437–3454. [Google Scholar] [CrossRef]
- Bond, A.; Cilliers, D.; Retief, F.; Alberts, R.; Roos, C.; Moolman, J. Using an Artificial intelligence chatbot to critically review the scientific literature on the use of Artificial intelligence in Environmental Impact Assessment. Impact Assess. Proj. Apprais. 2024, 42, 189–199. [Google Scholar] [CrossRef]
- Giménez, J.; Merino-Benítez, T.; Bojórquez-Tapia, L.A.; Esponda-Darlington, F.; Pérez, T.M. Facilitating public scrutiny of EIA reports with open data and artificial intelligence: Insights from a Mexican case study. Impact Assess. Proj. Apprais. 2025, 43, 354–365. [Google Scholar] [CrossRef]
- Han, H.; Liu, Z.; Li, J.; Zeng, Z. Challenges in remote sensing based climate and crop monitoring: Navigating the complexities using AI. J. Cloud Comput. 2024, 13, 34. [Google Scholar] [CrossRef]
- Milenov, P.; Sima, A.; Lugato, E.; Devos, W.; Loudjani, P. Enabling Spatial Data Interoperability through the Use of a Semantic Meta-Model—The Peatland Example from the JRC SEPLA Project. Land 2024, 13, 473. [Google Scholar] [CrossRef]
- Leeonis, A.N.; Ahmed, M.F.; Mokhtar, M.B.; Lim, C.K.; Halder, B. Challenges of Using a Geographic Information System (GIS) in Managing Flash Floods in Shah Alam, Malaysia. Sustainability 2024, 16, 7528. [Google Scholar] [CrossRef]
- Mabey, P.T.; Li, W.; Sundufu, A.J.; Lashari, A.H. The Potential of Strategic Environmental Assessment to Improve Urban Planning in Sierra Leone. Int. J. Environ. Res. Public Health 2021, 18, 9454. [Google Scholar] [CrossRef]
- Lei, L.; Hilton, B. A Spatially Intelligent Public Participation System for the Environmental Impact Assessment Process. ISPRS Int. J. Geo-Inf. 2013, 2, 480–506. [Google Scholar] [CrossRef]
- Brown, G. Public participation GIS (PPGIS) for regional and environmental planning: Reflections on a decade of empirical research. J. Urban Reg. Inf. Syst. Assoc. 2012, 25, 5–16. [Google Scholar]
- Kochanek, A.; Generowicz, A.; Zacłona, T. The Role of Geographic Information Systems in Environmental Management and the Development of Renewable Energy Sources—A Review Approach. Energies 2025, 18, 4740. [Google Scholar] [CrossRef]
- Li, Z.; Chen, B.; Wu, S.; Su, M.; Chen, J.M.; Xu, B. Deep learning for urban land use category classification: A review and experimental assessment. Remote Sens. Environ. 2024, 311, 114290. [Google Scholar] [CrossRef]
- Fullman, T.J.; Sullender, B.K.; Cameron, M.D.; Joly, K. Simulation modeling accounts for uncertainty while quantifying ecological effects of development alternatives. Ecosphere 2021, 12, e03530. [Google Scholar] [CrossRef]
- Camps-Valls, G.; Fernández-Torres, M.-Á.; Cohrs, K.-H.; Höhl, A.; Castelletti, A.; Pacal, A.; Robin, C.; Martinuzzi, F.; Papoutsis, I.; Prapas, I.; et al. Artificial intelligence for modeling and understanding extreme weather and climate events. Nat. Commun. 2025, 16, 1919. [Google Scholar] [CrossRef]
- Yin, J.; Dong, J.; Hamm, N.A.S.; Li, Z.; Wang, J.; Xing, H.; Fu, P. Integrating remote sensing and geospatial big data for urban land use mapping: A review. Int. J. Appl. Earth Obs. Geoinf. 2021, 103, 102514. [Google Scholar] [CrossRef]
- Morrison-Saunders, A.; Arts, J.; Bond, A.; Pope, J.; Retief, F. Reflecting on, and revising, international best practice principles for EIA follow-up. Environ. Impact Assess. Rev. 2021, 89, 106596. [Google Scholar] [CrossRef]
- Williams, B.K.; Brown, E.D. Adaptive management: From more talk to real action. Environ. Manag. 2014, 53, 465–479. [Google Scholar] [CrossRef] [PubMed]
- García, G.A.; Atkinson, B.; Donfack, O.T.; Hilton, E.R.; Smith, J.M.; Eyono, J.N.M.; Iyanga, M.M.; Vaz, L.M.; Avue, R.M.N.; Pollock, J.; et al. Real-time, spatial decision support to optimize malaria vector control: The case of indoor residual spraying on Bioko Island, Equatorial Guinea. PLoS Digit. Health 2022, 1, e0000025. [Google Scholar] [CrossRef]
- Wild, T.A.; van Schalkwyk, L.; Viljoen, P.; Heine, G.; Richter, N.; Vorneweg, B.; Koblitz, J.C.; Dechmann, D.K.N.; Rogers, W.; Partecke, J.; et al. A multi-species evaluation of digital wildlife monitoring using the Sigfox IoT network. Anim. Biotelem. 2023, 11, 13. [Google Scholar] [CrossRef]
- Wang, Y.; Wang, L.; Han, W.; Yan, J. Digital twin of earth: A novel information framework for managing a sustainable earth. Innov. Geosci. 2024, 2, 100092. [Google Scholar] [CrossRef]
- Zhao, T.; Song, C.; Yu, J.; Xing, L.; Xu, F.; Li, W.; Wang, Z. Leveraging Immersive Digital Twins and AI-Driven Decision Support Systems for Sustainable Water Reserves Management: A Conceptual Framework. Sustainability 2025, 17, 3754. [Google Scholar] [CrossRef]
- Ogryzek, M.; Tarantino, E.; Rząsa, K. Infrastructure of the Spatial Information in the European Community (INSPIRE) Based on Examples of Italy and Poland. ISPRS Int. J. Geo-Inf. 2020, 9, 755. [Google Scholar] [CrossRef]
- Hoalst-Pullen, N.; Patterson, M.W. Geospatial Technologies in Environmental Management; Springer Science & Business Media: New York, NY, USA, 2010; Volume 3. [Google Scholar]
- Ruiz-Gutierrez, V.; Bjerre, E.R.; Otto, M.C.; Zimmerman, G.S.; Millsap, B.A.; Fink, D.; Stuber, E.F.; Strimas-Mackey, M.; Robinson, O.J. A pathway for citizen science data to inform policy: A case study using eBird data for defining low-risk collision areas for wind energy development. J. Appl. Ecol. 2021, 58, 1104–1111. [Google Scholar] [CrossRef]
- Kotsev, A.; Minghini, M.; Tomas, R.; Cetl, V.; Lutz, M. From Spatial Data Infrastructures to Data Spaces—A Technological Perspective on the Evolution of European SDIs. ISPRS Int. J. Geo-Inf. 2020, 9, 176. [Google Scholar] [CrossRef]
- Sjoukema, J.-W.; Samia, J.; Bregt, A.K.; Crompvoets, J. The Governance of INSPIRE: Evaluating and Exploring Governance Scenarios for the European Spatial Data Infrastructure. ISPRS Int. J. Geo-Inf. 2022, 11, 141. [Google Scholar] [CrossRef]
- Rösch, C.; Fakharizadehshirazi, E. Public participation GIS scenarios for decision-making on land-use requirements for renewable energy systems. Energy Sustain. Soc. 2025, 15, 18. [Google Scholar] [CrossRef]
- Koldasbayeva, D.; Tregubova, P.; Gasanov, M.; Zaytsev, A.; Petrovskaia, A.; Burnaev, E. Challenges in data-driven geospatial modeling for environmental research and practice. Nat. Commun. 2024, 15, 10700. [Google Scholar] [CrossRef] [PubMed]
- Briggs, C.; Burfurd, I.; Duckham, M.; Guntarik, O.; Kerr, D.; McMillan, M.; Saldias, D.S.M. Bridging the geospatial gap: Data about space and indigenous knowledge of place. Geogr. Compass 2020, 14, e12542. [Google Scholar] [CrossRef]
- Yu, D.; Fang, C. Urban Remote Sensing with Spatial Big Data: A Review and Renewed Perspective of Urban Studies in Recent Decades. Remote Sens. 2023, 15, 1307. [Google Scholar] [CrossRef]
- Weng, Q.; Li, Z.; Cao, Y.; Lu, X.; Gamba, P.; Zhu, X.; Xu, Y.; Zhang, F.; Qin, R.; Yang, M.Y.; et al. How will ai transform urban observing, sensing, imaging, and mapping? NPJ Urban Sustain. 2024, 4, 50. [Google Scholar] [CrossRef]
- Ncube, M.M.; Ngulube, P. Enhancing environmental decision-making: A systematic review of data analytics applications in monitoring and management. Discov. Sustain. 2024, 5, 290. [Google Scholar] [CrossRef]
- Popescu, S.M.; Mansoor, S.; Wani, O.A.; Kumar, S.S.; Sharma, V.; Sharma, A.; Arya, V.M.; Kirkham, M.B.; Hou, D.; Bolan, N.; et al. Artificial intelligence and IoT driven technologies for environmental pollution monitoring and management. Front. Environ. Sci. 2024, 12, 1336088. [Google Scholar] [CrossRef]
- Gonzalez, A.; Enríquez-de-Salamanca, Á. Spatial multi-criteria analysis in environmental assessment: A review and reflection on benefits and limitations. J. Environ. Assess. Policy Manag. 2018, 20, 1840001. [Google Scholar] [CrossRef]
Disclaimer/Publisher’s Note: The statements, opinions and data contained in all publications are solely those of the individual author(s) and contributor(s) and not of MDPI and/or the editor(s). MDPI and/or the editor(s) disclaim responsibility for any injury to people or property resulting from any ideas, methods, instructions or products referred to in the content. |
© 2025 by the authors. Licensee MDPI, Basel, Switzerland. This article is an open access article distributed under the terms and conditions of the Creative Commons Attribution (CC BY) license (https://creativecommons.org/licenses/by/4.0/).