Abstract
Due to intensified climate change and increasing extreme wind events, wind–sand and wind–snow compound disasters pose growing threats to the safety, serviceability, and long-term sustainability of railway infrastructure, particularly in arid and cold regions such as Xinjiang. To support sustainable transportation and enhance infrastructure resilience, this study investigates the airflow field characteristics and composite particle transport under different fence configurations through a combination of wind tunnel testing and numerical simulations. The results show that double-row fences significantly reduce particle transport and deposition, improving the long-term stability of railway lines while minimizing maintenance frequency and energy consumption. Orthogonal analysis indicates that fence spacing exerts the strongest influence on composite particle deposition, followed by fence height and porosity. Furthermore, composite sand–snow particles exhibit a synergistically enhanced transport capacity under high wind speeds, highlighting the need for integrated mitigation measures. This study provides practical guidance for designing sustainable, low-impact, and climate-adaptive protection systems in regions facing compound wind-driven hazards, contributing to the broader goals of enhancing infrastructure durability and achieving sustainable regional development.
1. Introduction
Disasters, rather than occurring in isolation, are often complex and compound [1,2]. When two or more disasters occur simultaneously, or when one disaster triggers another, a “composite disaster” is formed [3]. Compound disasters are usually described in primary disasters and secondary disasters, and the “compound loss” incurred by compound disasters is often more complex and more challenging to control than the loss caused by a single disaster. The losses caused by such composite disasters are often more severe and complex than those caused by single disasters, making their management and mitigation more challenging. Wind-induced sand deposition and wind-induced snow cover are both surface gas–solid two-phase flows driven by wind, and both processes involve the transport and redistribution of surface materials [4]. Existing studies primarily focus on the wind–sand process [5,6] or the wind–snow process [7,8] alone, but rarely examine the compound disasters resulting from their interaction. Wind–sand flows and snow drifts are important natural disaster-causing factors that can be highly harmful to traffic lines [9,10], as shown in Figure 1. In particular, the compound disasters caused by the interaction between wind-induced sand deposition and wind-induced snow cover in the winter are even more harmful [11,12].
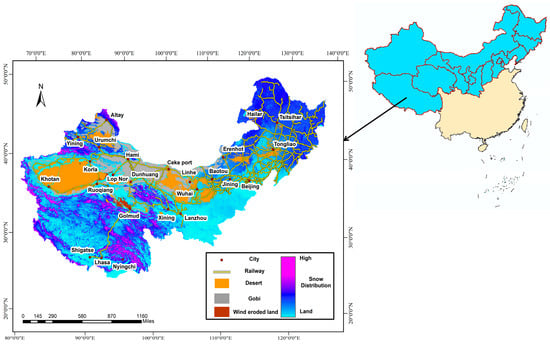
Figure 1.
Railway distribution network of wind–sand–snow compound disasters in northern China.
Wind–sand flow, as a typical surface dynamic process in arid and semi-arid regions, is frequently active in desert, sandy, and Gobi areas. Its core feature is the transportation of sand particles via creeping, saltation, and suspension [13,14]. This process poses multidimensional and persistent hazards to railway lines. Saltating and suspended sand particles gradually bury tracks and switches, leading to signal failure. High-speed moving sand particles also cause abrasion to components such as contact wires and locomotive windows, thereby shortening the service life of equipment. Long-term wind and sand erosion further compromises the stability of subgrade slopes [15,16], potentially triggering structural safety issues like slope collapse. In recent years, numerical simulation has become a key approach in both academia and industry for analyzing and controlling wind–sand disasters. Beyond railway engineering, simulation-based techniques have been extensively applied in other engineering fields such as energy extraction, geothermal resource development, and aerospace [17,18], where they serve as powerful tools to reveal complex fluid–solid coupling and optimize protective structures. These studies demonstrate that numerical simulation provides a universal theoretical and methodological foundation for understanding multiphase flow phenomena, thereby reinforcing its significance in the present research. Building upon these advances, numerous scholars have conducted wind tunnel and numerical experiments to optimize fence structures and improve the prevention and control efficiency of wind–sand disasters. Zhang et al. conducted wind tunnel experiments to study the protective effects of sand fences with different porosities and row arrangements. Their findings indicated that a double-row sand fence with a porosity of 30% demonstrated the best performance in terms of wind resistance and sand-blocking efficiency [19]. Xin et al. showed that placing two sand fences near railway subgrades, with a combination of optimal porosities (30% and 20%) and horizontal openings, could achieve a windproof and sand-fixation efficiency of up to 97.16% [20]. Wang et al. revealed that a single-row, high-vertical sand fence creates a wind–sand flow field with distinct zones: a deceleration zone, acceleration zone, turbulence zone, and stabilization zone. Their study concluded that the optimal spacing for sand fences is 2H (where H is the height of the fence), and the best fence height is between 1.5 and 2.0 m for maximum protective efficiency [21].
Unlike aeolian sand hazards, blowing snow is widely distributed in temperate, frigid, and high-altitude mountainous regions [22]. Its core process is the coupling of wind fields with snow particles, involving particle entrainment, turbulent diffusion during transport, and deposition in accumulation zones [23]. This hazard primarily threatens railways during winter: strong blowing snow can bury tracks and turnouts within a short period, while long-term snow cover reduces the service life of subgrades, pavements, and associated facilities [24]. The prevention and control of blowing snow hazards mainly rely on physical barriers and optimization through numerical simulations. Lei et al. identified the key design parameters of snow fences and their sensitivities, demonstrating that fence height is the dominant factor influencing snow distribution within the protection zone, while porosity plays a decisive role in controlling snow accumulation on the subgrade surface. Their results showed that a snow fence with 75% porosity, a height of 4.8 m, and a 60 m setback from the subgrade effectively altered the airflow field and reduced snow deposition on the track [25]. Qiu et al. found through wind tunnel experiments that snow deposition exhibits a “U-shaped” distribution on embankments and an “M-shaped” distribution in cuttings. Their study determined that windbreak walls achieved optimal performance when porosity was set at 50%, height at 3 m, and spacing at seven times the wall height [26]. Yang et al. using numerical simulations, further revealed that leeward slopes of roadways accumulate more snow and require longer times to reach equilibrium, particularly under snowfall conditions. Snow fences effectively intercept drifting snow on leeward slopes, reducing near-surface snow particle concentrations and thereby decreasing short-term snow deposition [27].
Although prevention and control technologies for individual aeolian sand and blowing snow hazards are relatively mature, compound disasters involving the coexistence of wind-blown sand and snow frequently occur in regions such as Xinjiang and the Qinghai–Tibet Plateau during winter [28]. At present, railways are typically equipped with sand-blocking or snow-blocking measures tailored to a single hazard type, while the cross-adaptability of these measures is often overlooked: sand-control facilities rarely consider snow-control performance, and snow-control structures are seldom evaluated for their sand-control capacity. Owing to the distinct physical properties and disaster cycles of snow and sand particles, existing measures show seasonal limitations. In some areas of Xinjiang, sand-control facilities perform effectively during summer but fail to mitigate wind-induced snow cover in winter, which continues to block transportation and restrict economic activity. Conversely, snow-control measures can successfully reduce snow accumulation in winter but prove largely ineffective against sand deposition in summer. Moreover, due to spatial constraints along railways, it is impractical to install multiple sets of sand- and snow-control facilities simultaneously.
The Jianghei Railway (Jiangjunmiao to Heishan) is located in the Junggar Basin of Xinjiang and is designed as a National Railway Class II line. From 25–28 December 2021, the Jianghei Railway experienced prolonged interruptions in train operations due to wind-blown snow and sand burying the tracks, severely disrupting transportation order. Beginning at 2:00 a.m. on December 25, the northern part of Qitai County in the Changji Prefecture of northern Xinjiang experienced continuous snowstorm weather. The Jianghei Railway, from Jiangjunmiao to Beishan, encountered persistent adverse weather conditions with wind-blown snow and drifting sand, with sustained wind speeds reaching 10–13 on the Beaufort scale. Starting at 10:00 a.m. on December 25, four stations along the Jianghei line lost control of six sets of switch equipment, which became inoperative. Wind-blown sand and accumulated snow buried the tracks across six sections spanning 20 segments, totaling 4840 m. The longest section, covered with sand and snow, stretched 1650 m with a burial depth of 1.7 m. This resulted in the closure of two sections for 50 h and 14 min, and speed restrictions in four sections for 104 h and 15 min, as shown in Figure 2. Due to the railway line passing through uninhabited areas during the snowfall period, there is a lack of historical meteorological observation data. Currently, the study of wind-induced sand and snow compound disasters on the railway line remains in the preliminary judgment stage. However, the formation of these compound disasters has already severely impacted the normal operation of trains. Therefore, the prevention and control of wind-induced sand and snow compound disasters are urgently needed.
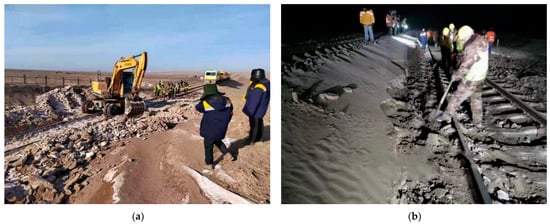
Figure 2.
Wind-induced sand–snow compound disasters along the Jianghei Railway. (a) Snow accumulation burying the track near Heishan section, photographed on 26 December 2021. (b) Combined sand and snow deposition at the Jiangjunmiao section, photographed on 27 December 2021.
With the intensification of climate change, compound hazards have become increasingly frequent, posing significant challenges to the long-term safety, reliability, and sustainability of railway systems in arid and cold regions. Sustainable transportation infrastructure requires not only effective short-term hazard mitigation but also long-term resilience that reduces maintenance demands, prolongs service life, and minimizes environmental disturbance. Integrated sand–snow control measures are therefore essential for ensuring stable transport capacity, reducing energy and resource consumption associated with repeated repairs, and supporting the ecological security of vulnerable desert–Gobi environments. In this context, the present study contributes to sustainability by providing scientifically validated mitigation strategies that reduce disaster risks, improve infrastructure durability, and support sustainable regional development.
2. Materials and Methods
2.1. Overview of the Study Area
2.1.1. Subsection
Figure 3 indicates that the Jianghei Railway, located on the southeastern extension of the Gurbantunggut Desert, has a total length of 65.5 km. It belongs to a typical temperate continental cold climate, characterized by deep and long-term snow cover in the winter. Field surveys indicate that compound disasters significantly disrupt railway operations, and the single prevention and control measures implemented along the railway have been ineffective in resolving the issue.
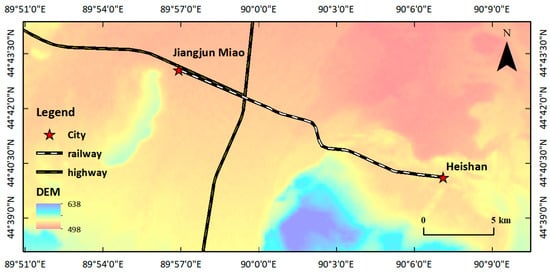
Figure 3.
Geographical location of the Jianghei Railway.
The fifth-generation European Centre for Medium Range Weather Forecasts Reanalysis 5 (ERA5) was adopted as the data source, supported by parametric field monitoring to clarify the wind regime characteristics of the study area. The geographic coordinate point (90°0′0″ E, 44°42′0″ N) along the railway was selected as the monitoring site. This point is located near the central section of the Jianghei Railway, within a typical area where the interaction between wind-blown sand and snow occurs frequently. The terrain, landform, and wind field characteristics at this site are highly representative of the overall railway corridor, providing reliable and characteristic wind regime data for this study. Wind data from 2019 to 2021 were collected for analysis. Figure 4 shows that the W azimuth frequencies of the study area in 2019, 2020, and 2021 are 15.81%, 16.06%, and 15.50%, respectively, and the corresponding average wind speeds are 3.96, 4.03, and 3.91 m/s, respectively. Based on a statistical analysis of the wind regime data for the study area in winter over the past three years, the E azimuth frequencies are 19.79%, 18.16%, and 25.50%, and the average wind speeds are 4.57, 4.94, and 5.27 m/s, respectively. W was the prevailing wind direction in the whole year, and E was the prevailing wind direction in the winter for the study area in the three years. The prevailing wind direction in the study area during winter differs significantly from that throughout the year. Since compound disasters are time-dependent, the occurrence of a sand–snow compound disaster necessarily means that sand and snow coexist, and that winter data are more precise and reasonable. Therefore, E was selected as the prevailing wind direction for studying the compound disaster in the study area.
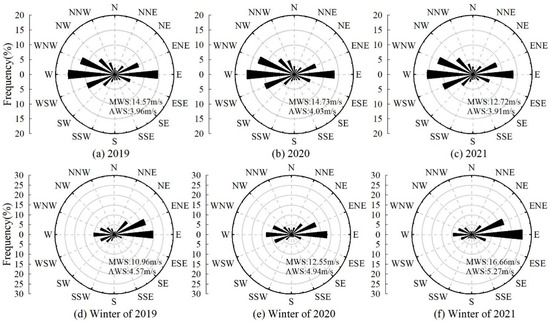
Figure 4.
Rose plot of the frequency of wind directions in the winter.
The critical start-up wind speed ranges from 4 to 5 m/s [29], with a median value of 4.5 m/s used in this study. Based on wind speed statistics over the past three years, the time when the wind speed exceeds the start-up wind speed in the study area in 2019, 2020, and 2021 accounts for 31.74% of the total time of the whole year. The dominant direction is W, and the average and maximum wind speeds are 6.25 and 16.69 m/s, respectively. The time when wind speed exceeds the start-up wind speed in the winter accounts for 24.74% of the total time of the winter. The dominant direction is E, and the average and maximum wind speeds are 6.34 and 16.66 m/s, respectively. The study area exhibits intermittent sand and snow transport, with stable directional patterns. The shift in prevailing wind direction from W during the annual cycle to E in winter has direct implications for the aerodynamic design and orientation of protective fences. Because the compound disaster has the timeliness, the compound disaster must be sand and snow at the same time, so take the winter data is more accurate and reasonable, E orientation for the region to study the compound disaster of the main wind direction. At the same time, the alignment of fences should be optimized to be perpendicular to this direction in order to achieve maximum flow resistance and particle interception efficiency.
2.1.2. Regional Sand Sources
This research randomly sampled the eolian sand in the study area along the Jianghei Railway to provide data support for the selection of similar materials in subsequent wind tunnel tests. A Bettersize 2600 laser particle size distribution analyzer was employed to analyze the particle sizes of the samples, which were collected twice to obtain precise data and minimize accidental errors. Analysis results showed that the errors of D10, D50, and D90 in the two particle size analyses are within 1 μm, which meets the precision requirements. The specific particle size distribution is listed in Table 1, and the cumulative percentage curves of particle sizes are depicted in Figure 5.

Table 1.
Particle size distribution of eolian sand along the Jianghei Railway.
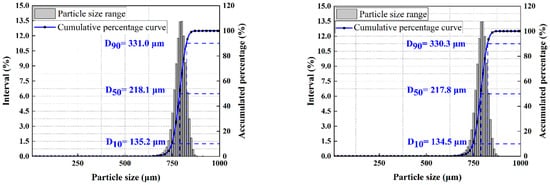
Figure 5.
Cumulative percentage curves of particle sizes.
The sand drift potential (DP) is a research method used to reveal the potential for sand transport in a given region based on wind condition data. Also known as sand drift wind energy, it explains the capability of wind to transport sand in a particular direction over a period of time, measured in vector units (VU). The sand drift potential from 16 directions at a specific point is generally vectorially synthesized, with the resultant vector’s direction and magnitude referred to as the resultant drift direction (RDD) and resultant drift potential (RDP), respectively. In this study, hourly wind condition data from monitoring points along the Jianghei line from 2019 to 2021 were obtained, with hours featuring wind speeds ≥ 4.5 m/s filtered. The frequency of threshold wind speeds and sand DP in 16 directions were calculated for the years 2019, 2020, and 2021. The DP calculation formula is as follows:
In this context, DP represents the sand transport potential. V and Vt denote the sand-moving wind speed and the critical sand-moving wind speed, respectively, measured in knots (1 knot ≈ 0.514 m/s). The variable t represents the duration of sand-moving winds, expressed as a percentage of the sand-moving wind hours to the total observation hours.
Based on the definition in Equation (1), wind speeds for sand-transporting winds are categorized into five speed levels: 4.5 m/s ≤ V < 7 m/s, 7 m/s ≤ V < 9 m/s, 9 m/s ≤ V < 11 m/s, 11 m/s ≤ V < 13 m/s, and V ≥ 13 m/s. The weight factors for each of these wind speed levels were calculated to determine the DP for the Jianghei Railway section. The vector sum of the DP for the 16 directions was used to obtain the RDP and the RDD. The ratio of RDP to DP was used as the directional variability index, characterizing the directional variability of sand-transporting winds in a given area. Using these formulas, the drift potential for each direction was calculated, and a sand rose diagram was plotted, as shown in Figure 6. According to wind energy environment classifications, a DP > 400 VU represents a high wind energy environment, 200–400 VU represents a moderate wind energy environment, and <200 VU represents a low wind energy environment. A directional variability index ≤ 0.3 indicates low variability, 0.3–0.8 indicates moderate variability, and ≥0.8 indicates high variability. The higher the directional variability index, the more stable the wind direction in the area. The study area is classified as a moderate wind energy region.

Figure 6.
Rose diagram of the characteristics of drift potential. The red arrow indicates the RDD direction.
2.1.3. Regional Snow Sources
The snowfall data for the study area from 2019 to 2021 were obtained from the ERA5 dataset to analyze regional snow cover. The average and maximum snow densities in the study area over the three years were 122.56 kg/m3 and 192.30 kg/m3, respectively. Figure 7 indicates that there were 111, 86, and 122 snow-covered days in 2019, 2020, and 2021, respectively, with snow cover occurring in approximately three months every year. However, there are 50, 46, and 54 days with a snow thickness of above 10 cm, respectively. The maximum snow thickness of the study area in the three years reaches 36.13 mm. In general, the heavy snowfall and long snow cover time in the study area provide favorable conditions for the formation of compound disasters.
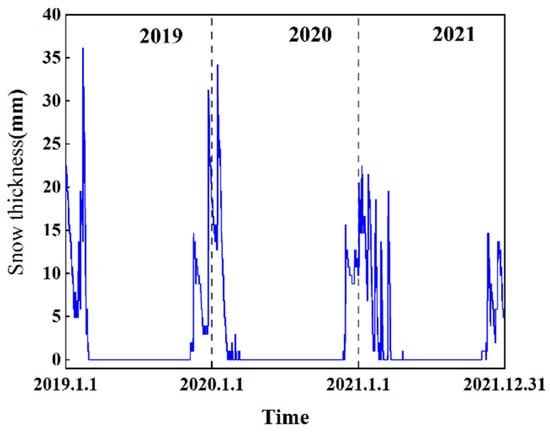
Figure 7.
Time-history diagram of snow thickness.
Studies have revealed that a snow layer in terms of particle size structure is mainly composed of depth hoar (particle size: 3.0–5.0 mm; density: 210–300 kg/m3), coarse-grained snow (particle size: 2.0–3.0 mm; density: 190–280 kg/m3), medium-grained snow (particle size: 1.0–2.0 mm; density: 150–240 kg/m3), fine-grained snow (particle size: 0.5–1.0 mm; density: 100–200 kg/m3), and fresh snow (particle size: <0.5 mm; density: 40–100 kg/m3) from bottom to top [30]. Field surveys reveal that the study area often experiences fresh snow, fine-grained snow, and medium-grained snow, with particle sizes of the snow phase generally less than 0.5 mm. At temperatures below −6 °C, the start-up wind speed of snow particles increases linearly with the square root of snow particle size, as expressed by the following formula [25]:
where Vt is the start-up wind speed of snow particles, m/s; D is the snow particle size, mm. The start-up wind speed of snow particles in the study area ranges between 3.7 and 4.3 m/s, with a median of 4.0 m/s adopted.
2.2. Design of Numerical Simulation
2.2.1. Modeling and Grid Division
Three-dimensional modeling was performed using Unigraphics NX (UG). The fence was reproduced at a scale of 1:1 to ensure the compliance of simulation results with engineering practice. The wall conditions and model dimensions are shown in Figure 8. The ground and wall surfaces of the flow field, along with the fence model surfaces, are defined as walls with a roughness coefficient set to Ks. The inlet is configured as a velocity inlet, with velocity conditions defined via a UDF. The velocity profile formula is given by Equation (3) [31]. The outlet is set as a free outlet. To realistically simulate the atmospheric boundary layer and prevent wall interference with simulation results, the upper wall and left/right walls are defined as symmetric boundaries. The engineering structure consisted of two rows of porous fences with a height of 3 m and a porosity of 75%. The width of a single fence was 3.2 m, and the total width of ten fences in each row amounted to 32 m. Fence spacing was 20 times the fence height (60 m). The fences were positioned 50 m away from the inlet to ensure the formation of a fully developed wind field. The computational domain for the simulation was 30 m in height, 35 m in width, and 150 m in length. According to the principles of fluid dynamics, the blockage ratio of the cross-section in numerical simulations or wind tunnel tests must be kept below 5% to ensure that the conditions in the simulation are comparable to natural settings and yield reliable results. In this study, the blockage ratio was 2.2%, ensuring that the simulation conditions accurately reflect the real-world scenario.
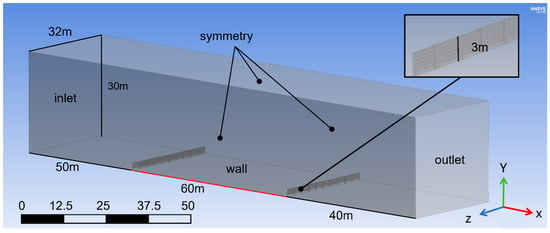
Figure 8.
Numerical simulation model for double-row fences.
In the equation, v0 is the friction wind speed, k is the von Karman coefficient (taken as 0.4), z0 is the height of the rough section, h is the height, and v(h) is the wind speed at height h.
Fluent-compatible Mesh was used for grid division. An unstructured tetrahedral grid division was utilized for the calculation model. The growth rate of grid size was 1.1. Local grid encryption was performed for the main parts monitored (fences and ground). The minimum grid size was set to 0.10 m, the number of grids was 3,078,558, and the relative error was approximately 0.3%. The average grid quality was 0.83451, and the maximum grid quality was 0.99995, so the grid quality was good, as illustrated in Figure 9.
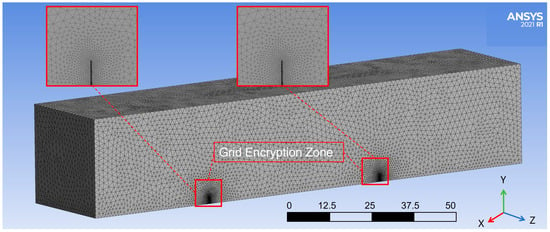
Figure 9.
Grid division for numerical simulation of a double-row fence.
2.2.2. Preprocessing
A multi-phase flow analysis model was built based on computational fluid dynamics (CFD) numerical simulation. The three-phase flow consists of air, sand particles, and snow particles. A three-phase flow model within the Euler-Euler framework was employed to numerically simulate the air–snow–sand system. Field sampling combined with particle size analysis using a Bettersize 2600 laser particle size analyzer determined that the median diameter of sand particles was 0.25 mm, while the three-year average particle diameter of snow samples from the selected region was 0.15 mm. Gravitational acceleration was taken as 9.81 m/s2, and the other material properties are listed in Table 2.

Table 2.
Main material parameters.
The standard k-ε model was used, where k represents the turbulent kinetic energy and ε denotes the turbulence dissipation rate, as shown in Equation (4).
In the equation, I and l represent the turbulence intensity and the turbulence length scale, respectively. Turbulence intensity describes the relative strength of wind fluctuations and is an important parameter for characterizing the intensity of atmospheric turbulence. It is calculated using the following equation:
where α = 0.15, ZG = 350 m. The turbulence length scale is calculated using the following equation:
2.2.3. Design of Numerical Simulation
In the principle of “guiding tests through simulation and supporting simulation with tests”, the correlation between wind tunnel tests and numerical simulation was comprehensively considered to analyze the flow field laws in front of and behind the fence at different wind speeds. Single-factor simulation with variable incoming wind speed was designed to guide wind tunnel tests. The test parameters are listed in Table 3, where “spacing” is fence spacing (the spacing between double-row fences), “porosity” is fence porosity, and “height” is fence height.

Table 3.
Single-factor test parameters.
Three key parameters that impact the protective effect were selected: porosity, fence height, and fence spacing [32,33], to meet the demand for an optimal design of wind–snow fences in engineering practice. The optimal parameter combination was established to optimize the aerodynamic configuration parameters of the double-row fence model for wind tunnel tests. The L9 (33) orthogonal test scheme was established by combining orthogonal test design with CFD numerical simulation. The orthogonal test parameters are detailed in Table 4.

Table 4.
Orthogonal test parameters.
2.3. Wind Tunnel Tests
2.3.1. Experimental Design
Wind tunnel tests were conducted at the State Key Laboratory of Desertification and Aeolian Sand Disaster Mitigation in Gansu Province, China. Adopting open-circuit downward-flow tunnels can accurately simulate the laws of wind speed distribution in the atmospheric boundary layer, as described by the logarithmic law. The wind speed was continuously adjustable within the range of 4–35 m/s, and the measurement precision was ±3%. The system, with a total length of 38.9 m, consisted of an intake section, a power section, a rectification section, a shrinking section, an experimental section, and a diffusion section. The experimental section is 16 m long, with a cross-sectional area of 1.2 m × 1.2 m.
Before the experiment, the wind speed and turbulence intensity in the model area need to be adjusted. The wind field turbulence is modified by using closure wedges and placing roughness elements at the inlet, making the wind field more suitable for the engineering environment. According to the requirements of the wind tunnel flow field, Pitot tubes were placed at distances of 3.1 m, 4.8 m, and 7.2 m from the roughness elements, where 3.1 m corresponds to the position before the test section, 4.8 m is at the middle of the test section, and 7.2 m is at the end of the test section. Monitoring points were set at heights of 1 cm, 3 cm, 5 cm, 8 cm, 13 cm, 20 cm, 30 cm, 40 cm, and 60 cm above the wind tunnel floor. The wind speed data were collected for wind speeds of 6 m/s, 8 m/s, 10 m/s, 12 m/s, 14 m/s, 16 m/s, and 18 m/s at the monitoring points. For the wind tunnel tests, two repeated experiments were conducted under identical conditions. The standard deviation of measured wind velocity and particle deposition mass did not exceed ±3%, demonstrating that experimental variability remained within acceptable engineering limits. The wind speed profile of the test flow field is shown in Figure 10.
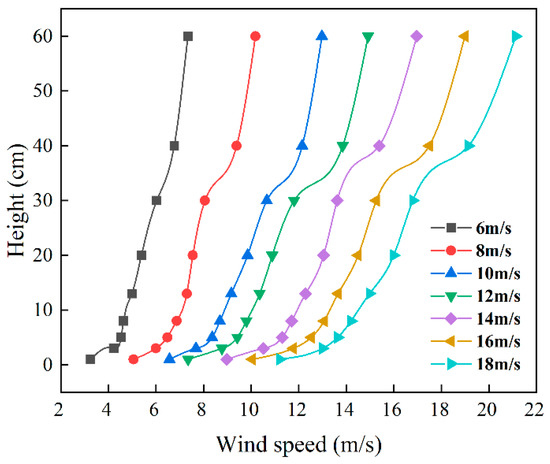
Figure 10.
Wind speed profile.
The calculation of turbulence intensity requires time-averaging and spatial-averaging of the wind speed at different locations to obtain more accurate results. Turbulence intensity was calculated using wind speed measurements from different locations, as expressed in the following equation:
In the equation, I denotes the turbulence intensity, σ represents the standard deviation, and is the mean wind speed. The standard deviation is a measure of the degree to which the instantaneous wind speed deviates from the mean wind speed. The experimental turbulence intensity profile is presented in Figure 11. As shown in the figure, following the installation of the closed wedge and roughness elements, the turbulence intensity remains below 10%, with an average value of approximately 7%. With increasing height, the wind speed gradually increases, while the turbulence intensity decreases correspondingly, which meets the experimental requirements.
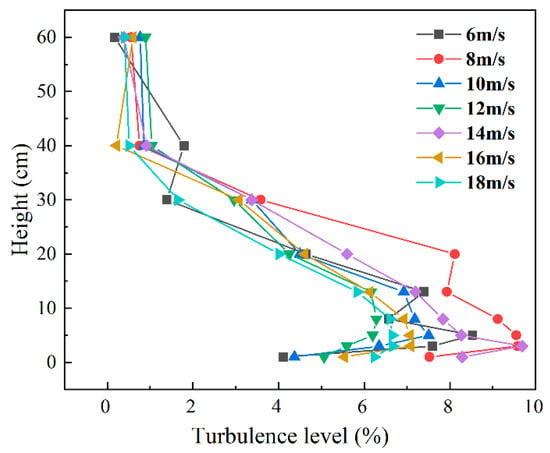
Figure 11.
Turbulence change curve.
The primary consideration of model design was blockage ratio, defined as the ratio of the projected area of the test model on the cross-section of the air duct to the cross-sectional area of the air duct, which should preferably be less than 5%. The shortest distance between the model and the side wall of the wind tunnel should not be less than 15% of the width of the experimental section. Hence, model design should be appropriately scaled to actual dimensions in engineering practice based on relevant specifications. The projected area of the model calculated from wind tunnel specifications should be less than 0.072 m2, and the width of the model should be less than 0.84 m. Assuming a similarity ratio of L, a fence height of 3 m, a windward angle of 90°, and a width of x, the model must satisfy the following formula:
For the sake of calculation, the model adopted a width x of 0.6 m, a blockage ratio of ≤4%, and a similarity ratio of 1:25. A blockage ratio below 4% indicates that the interference of the wind tunnel sidewall effects on the flow field around the model is minimal. Under such conditions, the impact on the measured aerodynamic coefficients is generally considered negligible within the acceptable range of engineering accuracy [34]. A double-row fence model was used in the experiment, with a height of 8.4 cm and a width of 60 cm. To ensure high precision in model parameters, components were fabricated from PVC using a high-precision engraving machine and were fixed within the test section, as shown in Figure 12. The spacing between the fences was set to 1.6 m, with a porosity of 50%. The open area was calculated according to the porosity, and the perforations were square holes with dimensions of 1 × 2 cm.

Figure 12.
Model fabrication and erection.
2.3.2. Selection of Similar Materials
Due to the difficulties of storing and transporting snow particles, it is necessary to select materials similar to sand and snow as substitutes. For the sake of experimental accuracy and in consideration of the differences in experimental dimensions, the substitute materials selected must meet the requirements for kinematic similarity in terms of particle deposition, transport, and settlement. Following the principle of substitution, water-atomized iron powder was used as a substitute for sand particles, and quartz sand was utilized as a substitute for snow particles. The particle size distribution of the substitute materials is illustrated in Figure 13. The main parameters of raw and substitute materials are listed in Table 5.
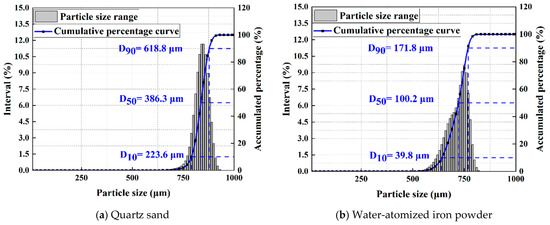
Figure 13.
Particle size distribution of substitute materials.

Table 5.
Physical properties of raw and substitute materials.
The similarity criterion for material substitution is defined as follows:
(1) Particle entrainment similarity: When the shear velocity acting on a particle exceeds its threshold entrainment velocity, the particle is set into motion. If the friction velocity of the model particles is consistent with that of the prototype particles, the two types of particles are considered to satisfy the condition of entrainment similarity. The threshold entrainment velocity of particles is given as [35]:
where D is the friction velocity parameter, ρ is the air density, ρp is the particle density, and dp is the particle diameter.
(2) Particle motion similarity: In this study, the wind profile near the railway subgrade in the study area is described using the exponential law. To achieve motion similarity, the experiment requires that the velocity ratios between the model and the prototype remain equal at all points within the flow field. This condition can be expressed as [36]:
where u is the velocity at any point in the flow field, and U is the reference velocity.
(3) Particle settling similarity: When the Froude number (Fr) is less than 1, the particle settling process is dominated by inertial forces. Therefore, it is necessary to ensure that the model and prototype particles have the same Fr. The expression is given as:
where u* is the wall friction velocity, and L is the characteristic length.
(4) Geometric similarity: The model and prototype particles must have the same angle of repose (θ). Typically, the angle of repose for natural sand particles ranges from 20° to 30°, while that for snow particles ranges from 30° to 50°.
2.3.3. Design of Control Groups
Three different working conditions in this study were designed, namely, single snow source, single sand source, and composite source (a mixture of sand and snow particles), in order to reveal the characteristics of compound disasters, compare them with single sand disasters/snow disasters, and discuss the applicability of prevention and control measures based on double-row fences. Based on the wind regime data along the Jianghei Railway, the particle size distribution and protective effects under three wind speed gradients (8, 12, and 16 m/s) were compared. The experimental layout is shown in Figure 14. Before the experiment starts, the particle source is placed in the front section of the test section, and the first row of sand fences is arranged 3 m away from the particle source. The specific sand fence model parameters were calculated based on simulation results, as detailed in Table 6.


Figure 14.
Layout of wind tunnel tests.

Table 6.
Computational variables and working conditions.
Two self-made particle collectors were arranged on the leeward side. Each collector was designed with 25 gradients, ranging from bottom to top at 2 cm intervals, and an air-permeable collection bag was equipped at each gradient to collect wind-carried particles. The average mass of particles collected at different heights was determined after testing to compare particle transport under various operating conditions.
3. Results and Analysis
3.1. Single-Factor Tests
Figure 15 compares the wind speed profiles of numerical simulation and wind tunnel tests at incoming wind speeds of 6, 8, 12, and 16 m/s. It indicates that the results of numerical simulation and wind tunnel tests are similar, with consistent trends at different incoming wind speeds. The simulated change in wind speed represents the ideal state, and the test results, which are disturbed by uncertain factors, differ from the ideal state, but only slightly.
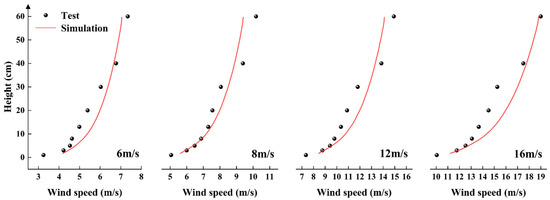
Figure 15.
Comparison of numerical simulation and wind tunnel tests at different incoming wind speeds.
Figure 16 shows the flow field distribution near the double-row fence at different wind speeds, where the arrow direction denotes the incoming wind direction. It indicates that the airflow generates an airflow deceleration zone on the leeward side of the two fences, and the area between them is also included in this deceleration zone. With the increase in incoming wind speed, the length of the airflow deceleration zone in the area impacted by the two fences increases first and decreases afterward, and the range of the airflow deceleration zone is the widest at 12 m/s. The trend of the incoming wind is uniform. The airflow gradually decreases between the fences in the first row, until reaching 0 m/s at the fences in the first row. After passing through the fences in the first row, the wind speed between the fences first gradually decreases to the minimum value and then increases to the maximum value, followed by a decrease again. At the fences in the second row, the wind speed first gradually reduces to the minimum value and then rises. The minimum values behind the fences in the first row fell within the range of 10–20 m, i.e., −1.90, −4.16, −5.85, and −7.11 m/s, respectively. However, the greater the incoming wind speed, the smaller the minimum value. From the minimum value to 10–15 m in front of the fences in the second row, the wind speed gradually increases, yielding maximum values of 0.95, 1.72, 0.87, and 4.95 m/s, respectively. From the maximum value to the turbulence zone on the leeward side of the fences in the second row, the airflow speed presents a trend of gradual decrease, and the minimum values of wind speed in the turbulence zone on the leeward side of the fences in the second row are −1.03, −2.29, −4.62, and −2.79 m/s, respectively. At the same wind speed, the minimum value in the turbulence zone on the leeward side of the fences in the first row is smaller than that in the turbulence zone on the leeward side of the fences in the second row. The main reason is that, obstructed by the fences in the first row, the incoming wind speed declines. The incoming wind is reduced when passing through the fences in the second row, resulting in insufficient backflow power on the leeward side, which decreases the backflow speed in the turbulence zone on the leeward side of the fences in the second row. Setting a double-row fence makes it easier to control changes in the turbulence zone on the leeward side of the fence.
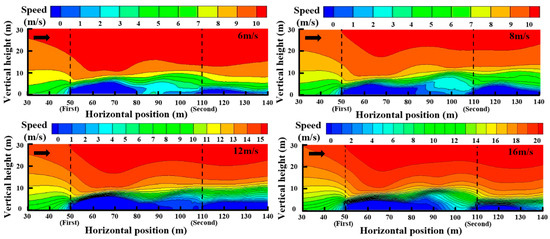
Figure 16.
Contour maps and flow field nephograms at different incoming wind speeds.
3.2. Orthogonal Tests
In this study, the area between the double-row fences is designated as Area I, while the area within 20 m behind the second row of fences is referred to as Area II. The monitoring focused primarily on the volume fraction of composite particles. Table 7 presents the detailed orthogonal conditions used in the orthogonal tests, along with the corresponding volume fractions of composite particles recorded in both zones under each condition.

Table 7.
Orthogonality Conditions and Orthogonality Results.
3.2.1. Analysis of Variance
Table 8 presents the ANOVA results for the mean volume fraction of composite particles. The analysis indicates that 99.33% of the variation in particle volume fraction can be attributed to spacing, height, and porosity. As shown in the table, both spacing and height have a statistically significant effect on the accumulation of composite particles (p < 0.05), whereas porosity does not exhibit a significant influence. The three factors are ranked in descending order of impact as follows: spacing > height > porosity.

Table 8.
ANOVA of the average volume fraction of composite particles.
3.2.2. Analysis of Range
Range analysis was conducted on the mean volume fraction of composite particles (αm) in both areas to determine the influence of each factor on particle accumulation patterns. Table 9 summarizes the range analysis results of αm in Area I. Figure 17 illustrates the variation in the mean volume fraction of composite particles across both areas under the influence of the three factors. As indicated in Table 8 and Figure 17a, αm in Area I initially increases and then decreases with increasing porosity, while it exhibits a declining trend with greater fence height and spacing. A higher volume fraction of composite particles reflects stronger barrier performance. Thus, based on the range analysis, the optimal design parameters for Area I are determined as follows: porosity of 50%, height of 2.1 m, and spacing of 40 m.

Table 9.
Range analysis of the mean volume fraction of composite particles in area I.
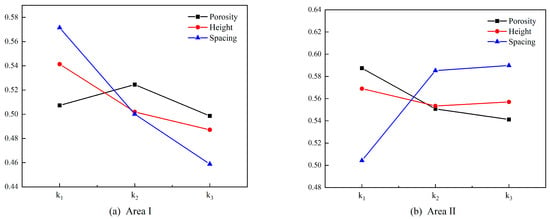
Figure 17.
Range analysis results of the mean composite particle volume fraction.
Range analysis was conducted on αm in Area II, as presented in Table 10 and Figure 17b. The results demonstrate that αm in Area II exhibits trends distinct from those observed in Area I: it shows a decreasing trend with increasing porosity, initially decreases and then increases with greater fence height, and displays an increasing trend with larger fence spacing. Based on the range analysis results, the optimal design parameters for Area II are determined as follows: porosity of 25%, height of 2.1 m, and spacing of 80 m.

Table 10.
Range analysis of the mean volume fraction of composite particles in area II.
Considering the distribution of composite particles in both areas collectively, the variation rates of the volume fraction in Figure 17 indicate that in Area I, porosity, height, and spacing all exert considerable influence. In Area II, however, the impact of increasing porosity gradually diminishes, the effect of height is relatively minor, while spacing remains a highly influential factor. Therefore, the optimal design parameters for the double-row fence are determined as follows: porosity of 50%, height of 2.1 m, and spacing of 40 m.
3.3. Deposition Distribution of Particles Under Three Layouts
Figure 18 indicates that the deposition distribution of particles behind double-row fences varies with different incoming wind speeds, resulting in differences in the protective effect. The range between the fences in the first row and those in the second row is referred to as Area I, while that behind the fences in the second row is referred to as Area II. Under the three layouts, the deposition distribution of particles in Area I presents an approximately “U”-shaped pattern, and the deposition area gradually moves away from the fence with the increase in wind speed, causing the particle-free area to expand. Particles in Area II deposit close to the fence, forming small dunes, and the deposition area gradually shrinks with the increase in wind speed. The increase in wind speed leads to intensified erosion of particle deposition structures and a gradual increase in the thickness of particle deposition. This is because the increased wind speed enhances the ability to transport particles, and the double-row fence intercepts more particles, which settle and deposit. This indicates the strong ability of the double-row fence to intercept the particle flow.
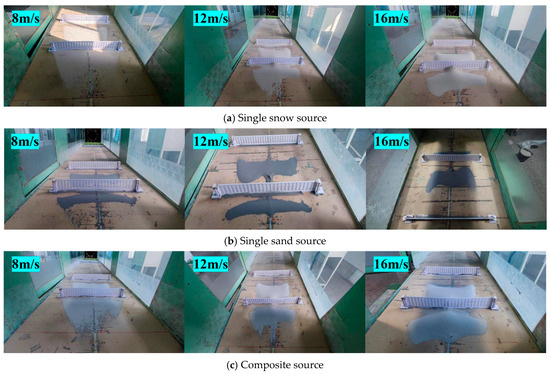
Figure 18.
Protective effects of double-row fences at different incoming wind speeds.
Under the three layouts, there are also slight differences in the deposition distribution of particles. The three layouts in Area I can be ranked as follows in the descending order of the deposition distribution range of particles at the same wind speed: composite source > single snow source > single sand source. The three layouts in Area II can be ranked as follows in the descending order of the deposition distribution thickness of particles at the same wind speed: composite source > single snow source > single sand source. This is primarily due to the differences in the physical properties and aerodynamic behavior of particles, resulting in significant variations in their saltation and deposition modes within the wind flow field.
The motion and deposition of particles are closely related to the characteristics of wind flow. After the incoming wind passes through the pores of the fence, its speed increases, forming a high-speed shear zone and enhancing the airflow’s ability to carry particles. Therefore, the particles near the leeward side of the fence are continuously taken away, forming a particle-free area. Hence, the higher the wind speed, the stronger the ability of the airflow to carry particles, and the larger the range of particle-free area on the leeward side. This phenomenon, observed under each of the three layouts, is a fundamental physical process that impacts the protective effect near the fence. The deposition distribution of particles indicates that the double-row fence scheme proposed in this study has a limited effect on preventing and controlling single sand hazards, but proves significantly effective in preventing and controlling compound disasters. In engineering practice, railways are more significantly impacted by single sand hazards for a longer time. Therefore, in practical applications, fence spacing or porosity can be appropriately reduced to more effectively prevent and control sand hazards.
3.4. Particle Transport Capacity Under Three Layouts
Figure 19 shows the particle mass curves as a function of the height gradient. It indicates that the mass of particles collected exhibits the same trend at different wind speeds under the three layouts, i.e., the mass of particles decreases with increasing height. Regarding the height gradient, the mass of particles decreases significantly within the range of 0–10 cm, changes little within the range of 10–30 cm, and exhibits a gentle trend of decrease within the range of 30–50 cm. These three ranges are defined as bottom, middle, and top, respectively. Based on the research results of Chepil and Woodruff [37], 90% of particle transport occurs within the range near the underlying surface, so the results of this study accord with the general laws of motion of wind-carried particles in a natural state. Within a specific range in the middle, particles are mainly suspended, and the concentration of the particle flow is stable. As height continues to increase, the concentration of the particle flow decreases until there is no particle motion. This trend becomes more obvious with the increase in wind speed. The maximum particle mass values of the single snow source at 16 m/s, the single sand source, and the composite source are 77.82, 51.42, and 85.83 g, respectively. This once again validated the general law that the stronger the wind speed, the stronger the particle transport capacity of the wind. At the same height, the three layouts can be ranked in descending order of the mass of particles at different wind speeds as follows: composite source > single snow source > single sand source, which reflects the dominant role of snow in the composite source.

Figure 19.
Particle mass curves under three layouts.
The transport rate within each of the above three ranges (bottom, middle, and top) was then calculated, as shown in Figure 20. At the same wind speed and within the same height range, the transport rates under the three layouts decrease with increasing height. Due to their differences in physical properties, sand and snow particles exhibit distinct transport characteristics. Due to their larger size and density, sand particles require a higher start-up speed threshold and more wind energy to be transported. At each wind speed, the sediment transport rate of the composite source is always greater than that of the single sand source/the single snow source at the same height, which indicates the complex synergistic enhancement effect of particle motion in the case of mixed sand and snow particles. For example, when snow particles start or settle, they drive the motion of sand particles. According to the study by Sun et al. [38], when particles collide with each other, the original static state is disrupted, resulting in motion. This study mainly focuses on the macroscopic results of particle motion but does not examine the process of particle motion at the mesoscale. This will be discussed in more depth in future research. Generally, compound disasters are more detrimental to railway engineering, primarily due to their greater particle transport capacity.

Figure 20.
Changes in sediment transport rate under three layouts.
4. Conclusions
This study conducts wind tunnel tests at the State Key Laboratory of Desertification and Aeolian Sand Disaster Mitigation in Gansu Province, China, as the primary means of research. Following the principle of “guiding tests through simulation and supporting simulation with tests”, simulation and test parameters are set with reference to the field situation in the study area. A Bettersize 2600 laser particle size distribution analyzer is utilized to select simulation materials, and a YPP-I digital barometer is adopted to measure air pressure, humidity, and temperature. The self-made particle collector and PVC fence model are employed to assist the tests, and the protective effects of double-row fences at different incoming wind speeds are analyzed. The main conclusions are as follows:
(1) This study uses water-atomized iron powder and quartz sand to replace sand and snow particles, respectively, in wind tunnel tests. Test results indicated that water-atomized iron powder can effectively replace sand particles, and that quartz sand can serve as a suitable substitute for snow particles. It is possible to accurately simulate the migration and deposition process of sand and snow particles by simulating wind–sand and wind–snow compound disasters. Similarly to sand particles, water-atomized iron powder can show the same particle transport characteristics in the simulation of wind–sand flows. Quartz sand, on the other hand, is similar to snow in particle size and can well represent the particle motion laws of snow drifts. This substitution method provided a reliable experimental means for similar future research on wind–sand and wind–snow compound disasters.
(2) This study discusses the application effect of double-row fences in preventing and controlling wind–sand and wind–snow compound disasters by combining wind tunnel tests and numerical simulation. It reveals that under different wind speeds, double-row fences have a significant inhibitory effect on the wind flow field and can effectively inhibit the transport of mixed sand and snow particles. Moreover, compared with single-row sand barriers, they have a longer protective range.
(3) Orthogonal tests and range analysis reveal the impacts of fence porosity, fence spacing, and fence height on the deposition volume of composite particles. Fence spacing has the highest sensitivity to particle deposition, followed by fence height, while porosity has the smallest influence on composite particles. When designing protective fences, a reasonable fence spacing can significantly improve the protective effect. Adjusting fence height can significantly improve the protective effect under extreme wind speed conditions.
(4) Wind tunnel tests are conducted to explore the particle transport capacity and motion laws of mixed sand and snow particles. The mass of particles decreases with increasing height under each of the three layouts, but the composite source exhibits a stronger particle transport capacity than either the single snow source or the single sand source. In particular, at high wind speeds, the interaction between the deposition of snow particles and the migration of sand particles produces a synergistic enhancement effect, making the transport of particles more complex. This finding highlights the distinct nature of wind–sand and wind–snow compound disasters, which can pose significant challenges to single prevention and control measures, particularly in engineering practice.
Author Contributions
Conceptualization, J.C. and A.M.; methodology, Y.W.; software, R.Z.; validation, D.C., A.M. and Y.W.; formal analysis, J.L.; investigation, A.M.; resources, Y.W.; data curation, D.C.; writing—original draft preparation, A.M.; writing—review and editing, A.M.; visualization, Y.W.; supervision, J.C.; project administration, J.L. All authors have read and agreed to the published version of the manuscript.
Funding
The research was funded by the National Natural Science Foundation of China (12472416) and the National Natural Science Foundation of China (52168065).
Institutional Review Board Statement
Not Applicable.
Informed Consent Statement
Not Applicable.
Data Availability Statement
The original contributions presented in this study are included in the article. Further inquiries can be directed to the corresponding author(s).
Conflicts of Interest
Author Akelamjiang Maimait is employed by the Xinjiang Kusha Highway Development Limited Liability Company. The remaining authors declare that the research was conducted in the absence of any commercial or financial relationships that could be construed as a conflict potential of interest.
References
- Lv, C.C.; Lei, Y.L.; Zhang, Y.; Duan, D.L.; Si, S.B. Resilience of the interdependent network against cascade failure. Chaos Solitons Fractals Interdiscip. J. Nonlinear Sci. Nonequilibrium Complex Phenom. 2025, 192, 116064. [Google Scholar] [CrossRef]
- Wu, Y.; Tan, X.Z.; Mo, H.Y.; Li, X.D.; Zhang, Y.; Yang, F.; Song, L.X.; He, Y.; Chen, X.H. A Dynamic Game Model for Emergency Resource Managers and Compound Disasters Induced by Heavy Rainstorms. Water 2024, 16, 2959. [Google Scholar] [CrossRef]
- Michele, C.D.; Banfi, F.; Russomando, M.P. Disasters classification in a compound event perspective: Insights from existing databases. Environ. Res. Lett. 2025, 20, 084054. [Google Scholar] [CrossRef]
- Deems, J.S.; Fassnacht, S.R.; Elder, K.J. Fractal distribution of snow depth from lidar data. J. Hydrometeorol. 2006, 7, 285–297. [Google Scholar] [CrossRef]
- Zheng, X.J.; Huang, N.; Zhou, Y.H. Laboratory measurement of electrification of wind-blown sands and simulation of its effect on sand saltation movement. J. Geophys. Res. Atmos. 2023, 108, 4322. [Google Scholar] [CrossRef]
- Huang, N.; He, P.L.; Zhang, J. Large-eddy simulation of sand transport under unsteady wind. Geomorphology 2020, 358, 107105. [Google Scholar] [CrossRef]
- Zhou, X.Y.; Zhang, Y.; Kang, L.Y.; Gu, M. RANS CFD simulations can be successfully used for simulating snowdrift on roofs in a long period of snowstorm. Build. Simul. 2020, 13, 1157–1163. [Google Scholar] [CrossRef]
- Qiang, S.G.; Zhou, X.Y.; Kosugi, K.; Gu, M. A study of snow drifting on a flat roof during snowfall based on simulations in a cryogenic wind tunnel. J. Wind Eng. Ind. Aerodyn. 2019, 188, 269–279. [Google Scholar] [CrossRef]
- Zhang, H.X.; Zhang, K.C.; An, Z.S.; Yu, Y.P. Wind dynamic environment and wind-sand erosion and deposition processes on different surfaces along the Dunhuang-Golmud railway, China. J. Arid Land 2023, 15, 393–406. [Google Scholar] [CrossRef]
- An, Z.S.; Zhang, K.C.; Tan, L.H.; Niu, Q.H.; Wang, T. Mechanisms Responsible for Sand Hazards Along Desert Highways and Their Control: A Case Study of the Wuhai-Maqin Highway in the Tengger Desert, Northwest China. Front. Environ. Sci. 2022, 10, 878778. [Google Scholar] [CrossRef]
- Xie, S.B.; Qu, J.J.; Pang, Y.J.; Zhang, K.C.; Wang, C. Dynamic mechanism of blown sand hazard formation at the Jieqiong section of the Lhasa-Shigatse railway. Geomat. Nat. Hazards Risk 2021, 12, 153–165. [Google Scholar] [CrossRef]
- Li, G.; Qin, J.M.; Yu, H.X.; Huang, N. Wind-tunnel experimental studies of the spatial snow distribution over grass and bush surfaces. J. Hydrodyn. 2022, 34, 85–93. [Google Scholar] [CrossRef]
- Dong, Z.B.; Chen, G.T.; He, X.D.; Han, Z.W.; Wang, X.M. Controlling blown sand along the highway crossing the Taklimakan Desert. J. Arid Environ. 2004, 57, 329–344. [Google Scholar] [CrossRef]
- Watson, A. The control of wind blown sand and moving dunes: A review of the methods of sand control in deserts, with observations from Saudi Arabia. Q. J. Eng. Geol. Hydrogeol. 1985, 18, 237–252. [Google Scholar] [CrossRef]
- Li, C.; Gao, Y. Experimental studies of wind erosion failure of aeolian soils subgrade for desert highway. Rock Soil Mech. 2011, 32, 33–38. [Google Scholar]
- Wang, Y.L.; Cheng, J.J.; An, Y.F.; Zhang, R.Y. Optimal sand transport roadbed geometry structure of Taklamakan Desert highway. Front. Earth Sci. 2024, 12, 1402878. [Google Scholar] [CrossRef]
- Wang, F.L.; Kobina, F. The Influence of Geological Factors and Transmission Fluids on the Exploitation of Reservoir Geothermal Resources: Factor Discussion and Mechanism Analysis. Reserv. Sci. 2025, 1, 3–18. [Google Scholar] [CrossRef]
- Cao, L.L.; Lv, M.; Li, C.Y.; Sun, Q.; Wu, M.Q.; Xu, C.X.; Dou, J.W. Effects of Crosslinking Agents and Reservoir Conditions on the Propagation of Fractures in Coal Reservoirs During Hydraulic Fracturing. Reserv. Sci. 2025, 1, 36–51. [Google Scholar] [CrossRef]
- Zhang, K.; Zhao, P.W.; Zhao, J.C.; Zhang, X.X. Protective effect of multi-row HDPE board sand fences: A wind tunnel study. Int. Soil Water Conserv. Res. 2020, 9, 103–115. [Google Scholar] [CrossRef]
- Xin, G.W.; Zhang, J.; Fan, L.Q.; Deng, B.; Bu, W.J. Numerical simulations and wind tunnel experiments to optimize the parameters of the second sand fence and prevent sand accumulation on the subgrade of a desert railway. Sustainability 2023, 15, 12761. [Google Scholar] [CrossRef]
- Wang, F.; Liu, S.X.; Jiang, Y.J.; Duan, W.J. Research on the Effect of Sand Barriers on Highways in Desert Areas on Sand Control. Sustainability 2023, 15, 13906. [Google Scholar] [CrossRef]
- Feng, S.J.; Wang, P. The influences of boundary layer thickness on the characteristics of saltation sand flow-A large eddy simulation study. Aeolian Res. 2023, 60, 100853. [Google Scholar] [CrossRef]
- Schmidt, R.A. Properties of blowing snow. Rev. Geophys. 1982, 20, 39–44. [Google Scholar] [CrossRef]
- Liu, D.T.; Li, Y.L.; Wang, B.; Hu, P.; Zhang, J.Y. Mechanism and effects of snow accumulations and controls by lightweight snow fences. J. Mod. Transp. 2016, 24, 261–269. [Google Scholar] [CrossRef]
- Lei, J.; Cheng, J.J.; Gao, L.; Ma, B.T.; An, Y.F.; Dong, H.G. Characteristics of snow cover distribution along railway subgrade and the protective effect of snow fences. J. Arid Land 2023, 15, 901–919. [Google Scholar] [CrossRef]
- Qiu, S.M.; Bai, M.Z.; Lin, D.M.; Xia, H.Y.; Tang, Z.Y. Study on the Evolution Process of Snow Cover in Wind-Induced Railway Embankments and the Control Effect of Snow Fences. Appl. Sci. 2025, 15, 6057. [Google Scholar] [CrossRef]
- Yang, S.; Zhang, M.Y.; Pei, W.S.; Melnikov, A.; Zhang, Z.; You, Z.L. Numerical study on snow erosion and deposition around an embankment with a snow fence under snowfall conditions. Aeolian Res. 2022, 56, 100798. [Google Scholar] [CrossRef]
- Che, T.; Hao, X.H.; Dai, L.Y.; Li, H.Y.; Huang, X.D.; Xiao, L. Snow cover change and its influence on the Qinghai-Tibet Plateau. Bull. Chin. Acad. Sci. 2019, 34, 1247–1253. [Google Scholar]
- Ma, B.T.; Gao, L.; Cheng, J.J.; Ding, B.S.; Ding, L.S.; Qu, L.; An, Y.F. Characteristics and Hazards of an Aeolian Sand Environment along Railways in the Southeastern Fringe of the Taklimakan Desert and Sand Control Measures. Appl. Sci. 2022, 12, 9186. [Google Scholar] [CrossRef]
- Liao, X.; Huang, K.Y.; Li, M.H.; Song, D.J.; Wu, X.Y.; Wen, H.; Ling, S.X. Study on the genetic characteristics and prevention measures of wind blowing snow in Youludus Basin. J. Eng. Geol. 2023, 31, 1450–1460. [Google Scholar]
- Paulina, J.G.; Tomasz, L.; Michał, P.; Jerzy, P. Wind velocity changes along the passage between two angled walls—CFD simulations and full-scale measurements. Build. Environ. 2019, 157, 391–401. [Google Scholar]
- Lima, I.A.; Parteli, E.J.R.; Shao, Y.P.; Andrade, J.; Herrmann, H.; Araujo, A. CFD simulation of the wind field over a terrain with sand fences: Critical spacing for the wind shear velocity. Aeolian Res. 2020, 43, 100574. [Google Scholar] [CrossRef]
- Xin, G.W.; Huang, N.; Zhang, J.; Dun, H.C. Investigations into the design of sand control fence for Gobi buildings. Aeolian Res. 2021, 49, 100662. [Google Scholar] [CrossRef]
- Sun, J.; Wang, S.; Liu, Y.Z.; Meng, J.J.; Hong, J.Z.; Wang, J.; Chang, P.; Liu, H.B.; Zhang, B.Y.; Li, Y. Experimental study on a combined sand barrier: Integration of porous mesh plate and novel porous sand-fixing bricks. J. Wind Eng. Ind. Aerodyn. 2024, 251, 105809. [Google Scholar] [CrossRef]
- Schmidt, R.A. Threshold wind-speeds and elastic impact in snow transport. J. Glaciol. 1980, 26, 453–467. [Google Scholar] [CrossRef]
- Kind, R.J. A critical examination of the requirements for model simulation of wind-induced erosion/deposition phenomena such as snow drifting. Atmos. Environ. 1976, 10, 219–227. [Google Scholar] [CrossRef]
- Chepil, W.S.; Woodruff, N.P. The Physics of Wind Erosion and its Control. Adv. Agron. 1963, 15, 211–302. [Google Scholar]
- Sun, Q.C.; Wang, G.Q.; Xu, Y. DEM Applications to Aeolian Sediment Transport and Impact Process in Saltation. Part. Sci. Technol. 2001, 19, 339–353. [Google Scholar] [CrossRef]
Disclaimer/Publisher’s Note: The statements, opinions and data contained in all publications are solely those of the individual author(s) and contributor(s) and not of MDPI and/or the editor(s). MDPI and/or the editor(s) disclaim responsibility for any injury to people or property resulting from any ideas, methods, instructions or products referred to in the content. |
© 2025 by the authors. Licensee MDPI, Basel, Switzerland. This article is an open access article distributed under the terms and conditions of the Creative Commons Attribution (CC BY) license (https://creativecommons.org/licenses/by/4.0/).