Article

Hydrogeochemical Characteristics and Formation Mechanisms of Groundwater Around Ji’an City, Southern China

by
Chao Xu
1,2,
Bing Xia
1,2,
Linming Dong
2,3,
Ximin Bai
4,5,
Xiaoyun Wang
6,
Yingying Xie
6,
Shengpin Yu
4,5,* and
Haiyan Liu
6,*
1
Jiangxi Coal Geological Exploration and Research Institute, Nanchang 330001, China
2
Jiangxi Institute of Geological Survey and Exploration, Geological Environment Monitoring Center, Nanchang 330001, China
3
Jiangxi Zhonghuan Geotechnical Engineering Investigation Institute Co., Ltd., Nanchang 330029, China
4
Hydrogeological Brigade of Jiangxi Geological Bureau and Nanchang Key Laboratory of Hydrogeology and High Quality Groundwater Resources Exploitation and Utilization, Nanchang 330224, China
5
Jiangxi Institute of Survey & Design Ltd., Nanchang 330224, China
6
Jiangxi Provincial Key Laboratory of Genesis and Remediation of Groundwater Pollution, School of Water Resources and Environmental Engineering, East China University of Technology, Nanchang 330013, China
*
Authors to whom correspondence should be addressed.
Sustainability 2025, 17(22), 10306; https://doi.org/10.3390/su172210306
Submission received: 11 October 2025 / Revised: 6 November 2025 / Accepted: 14 November 2025 / Published: 18 November 2025
(This article belongs to the Topic Water-Soil Pollution Control and Environmental Management)

Abstract

Understanding the occurrence and genesis of groundwater is vital for management and utilization. This study examines the hydrogeochemical characteristics and influencing factors of groundwater around Ji’an City, southern China, with 235 groundwater samples collected from pore, fissure–pore, karst, and bedrock fissure aquifers. Methods such as multivariate statistical analysis, Piper plot, Gibbs plots, and ion ratio coefficient were used for data analysis. Results indicated that groundwater hydrochemical types primarily were HCO3-Ca, HCO3·Cl-Na·Ca, and HCO3-Na·Ca. The TDS and pH values ranged from 139.92 to 329.66 mg/L and from 4.7 to 8.5, respectively, indicating freshwater with a weakly acidic to neutral nature. Groundwater composition was shaped by a combination of rock weathering/dissolution, cation exchange, and anthropogenic activities. Karst water was notably affected by carbonate rock weathering/dissolution, whereas bedrock fissure water was primarily influenced by silicate rock weathering. Human activities showed a minimal impact on karst and bedrock fissure water, while pore and red-bed fissure–pore water were significantly impacted. The contributions of natural and anthropogenic input to groundwater chemistry were constrained by PCA, showing the rate was 78.09% 15.79%, respectively. Our findings provide insights into the distinct hydrogeochemical processes within different aquifer systems, contributing valuable data and methodologies for groundwater research and management in multi-aquifer systems.

1. Introduction

Groundwater is a vital component of global water resources [1,2] due to its superior quality, stable availability, widespread distribution, and ease of decentralized exploitation [3]. It plays an indispensable role in regional water supplies and acts as a critical strategic reserve during extreme droughts to mitigate surface water scarcity in some rural areas [4,5,6]. However, the rapid socio-economic development has resulted in significant transformations in groundwater environments, where spatiotemporal variations in chemical composition have become key indicators of groundwater quality and hydrogeochemical processes.
Water–rock–gas–biocompound interactions drive the formation and evolution of groundwater chemistry, reflecting both the current state of groundwater environments and the influence of natural processes and anthropogenic activities [2,7,8]. Studies have shown that mineral dissolution, cation exchange, and human activities dominantly control groundwater chemistry, with shallow aquifers being more sensitive to anthropogenic impacts [9]. Groundwater in the red-bed basins of southern Jiangxi has been shown to be predominantly of the HCO3-Ca type, with chemical characteristics primarily governed by silicate and carbonate weathering [10]. Further investigations by Mao et al. in the southwest of Poyang Lake Basin emphasized water–rock interactions as a primary driver of hydrochemical evolution in the recharge zones, while human activities imposed influences by altering ion migration patterns on groundwater in transition and discharge zones [11]. The findings of these studies highlight the complexity of groundwater chemistry as a “dual imprint” of natural and anthropogenic processes.
Existing research indicates significant heterogeneity in groundwater chemical features across different geological settings. Groundwater chemistry was suggested to evolve from weakly acidic, low-TDS, and HCO3–Na·Mg type in shallow phreatic zones to near-neutral, high-TDS, and HCO3–Ca·Na type in deeper fractured aquifers in the southern Jiangxi Province, mainly attributed to silicate weathering, cation exchange, and fault-controlled circulation [12,13,14]. In contrast, groundwaters in mining areas and intensive agriculture areas have been shown to bear abundant NH4+, SO42−, and metal ions due to human activities, locally depressing pH to <5 and rendering up to 50% of shallow groundwaters unfit for irrigation or drinking [15,16]. The shallow groundwater in southern Jiangxi in Poyang Lake Basin was predominantly weakly alkaline fresh water of the HCO3-Ca type, with cations chiefly derived from carbonate weathering/dissolution and anions mainly affected by agricultural activities [17]. However, this previous research mostly focused on single aquifer types or broad assessments, neglecting the differential impacts of natural and anthropogenic factors across diverse aquifer conditions. Under the circumstances, an in-depth understanding of the hydrogeochemical formation and origin of groundwater chemistry in multi-aquifer systems within complex geological regions remains challenging.
Ji’an City, home to the middle reaches of the Gan River, forms a core segment of the ecological barrier in the middle-lower Yangtze River Basin. The quality of the groundwater environment in the basin directly influences watershed water security and ecosystem health. Due to the strategic ecological significance of groundwater and research gaps, this study leverages the latest groundwater survey data, integrating multivariate statistics, Piper trilinear diagrams, ion ratio analysis, Gibbs models, and hydrogeochemical simulations to elucidate the formation mechanisms of groundwater chemistry. The objectives of this study are to (1) characterize hydrochemical types and spatial distribution patterns of different types of groundwaters, (2) explore key processes controlling groundwater chemistry, and (3) determine the relative impacts of natural processes and anthropogenic activities on groundwater chemical composition. Through a detailed analysis of groundwater chemistry across four major aquifer types in the Ji’an City region and quantifying the impacts of natural and human-induced impacts, the outcomes of this study offer novel insights into spatial and aquifer-specific hydrochemical variations, inform early warning systems for environmental risks, and advance sustainable groundwater utilization in southern China.

2. Materials and Methods

2.1. Regional Settings

The study area is situated in the central-western part of Jiangxi Province, within the midstream section of the Gan River (113°46–115°56′ E, 25°58–27°57′ N). Administratively, it comprises two urban districts (Jizhou and Qingyuan) and ten counties (Ji’an, Anfu, Yongxin, Taihe, Suichuan, Wan’an, Jishui, Yongfeng, Xiajiang, and Xingan), covering a total area of 25,000 km2. The terrain is characterized by mountainous surroundings to the east, south, and west, with the Gan River flowing northward through the central valley, forming a topographic gradient descending from south to north (Figure 1). Geomorphologically, the region features three dominant types: landforms–hills, plains, and mountains. The peripheral zones consist of medium-low mountain ranges, with the highest peak reaching 2120.4 m. Fluvial plains (elevation: 24–100 m) flank the Gan River and its tributaries, exhibiting gentle relief, while hilly transitional areas (elevation: 100–500 m) connect the plains to the mountainous regions. The study area has a subtropical monsoon humid climate. Meteorological records (1960–2020) indicate a mean annual temperature of 17.7 °C and mean annual precipitation of 1578.4 mm, with 67% of rainfall occurring during the flood season from April to September [18]. Hydrographically, the Gan River and its tributaries form a centripetal drainage network, with abundant secondary streams distributed across both banks.
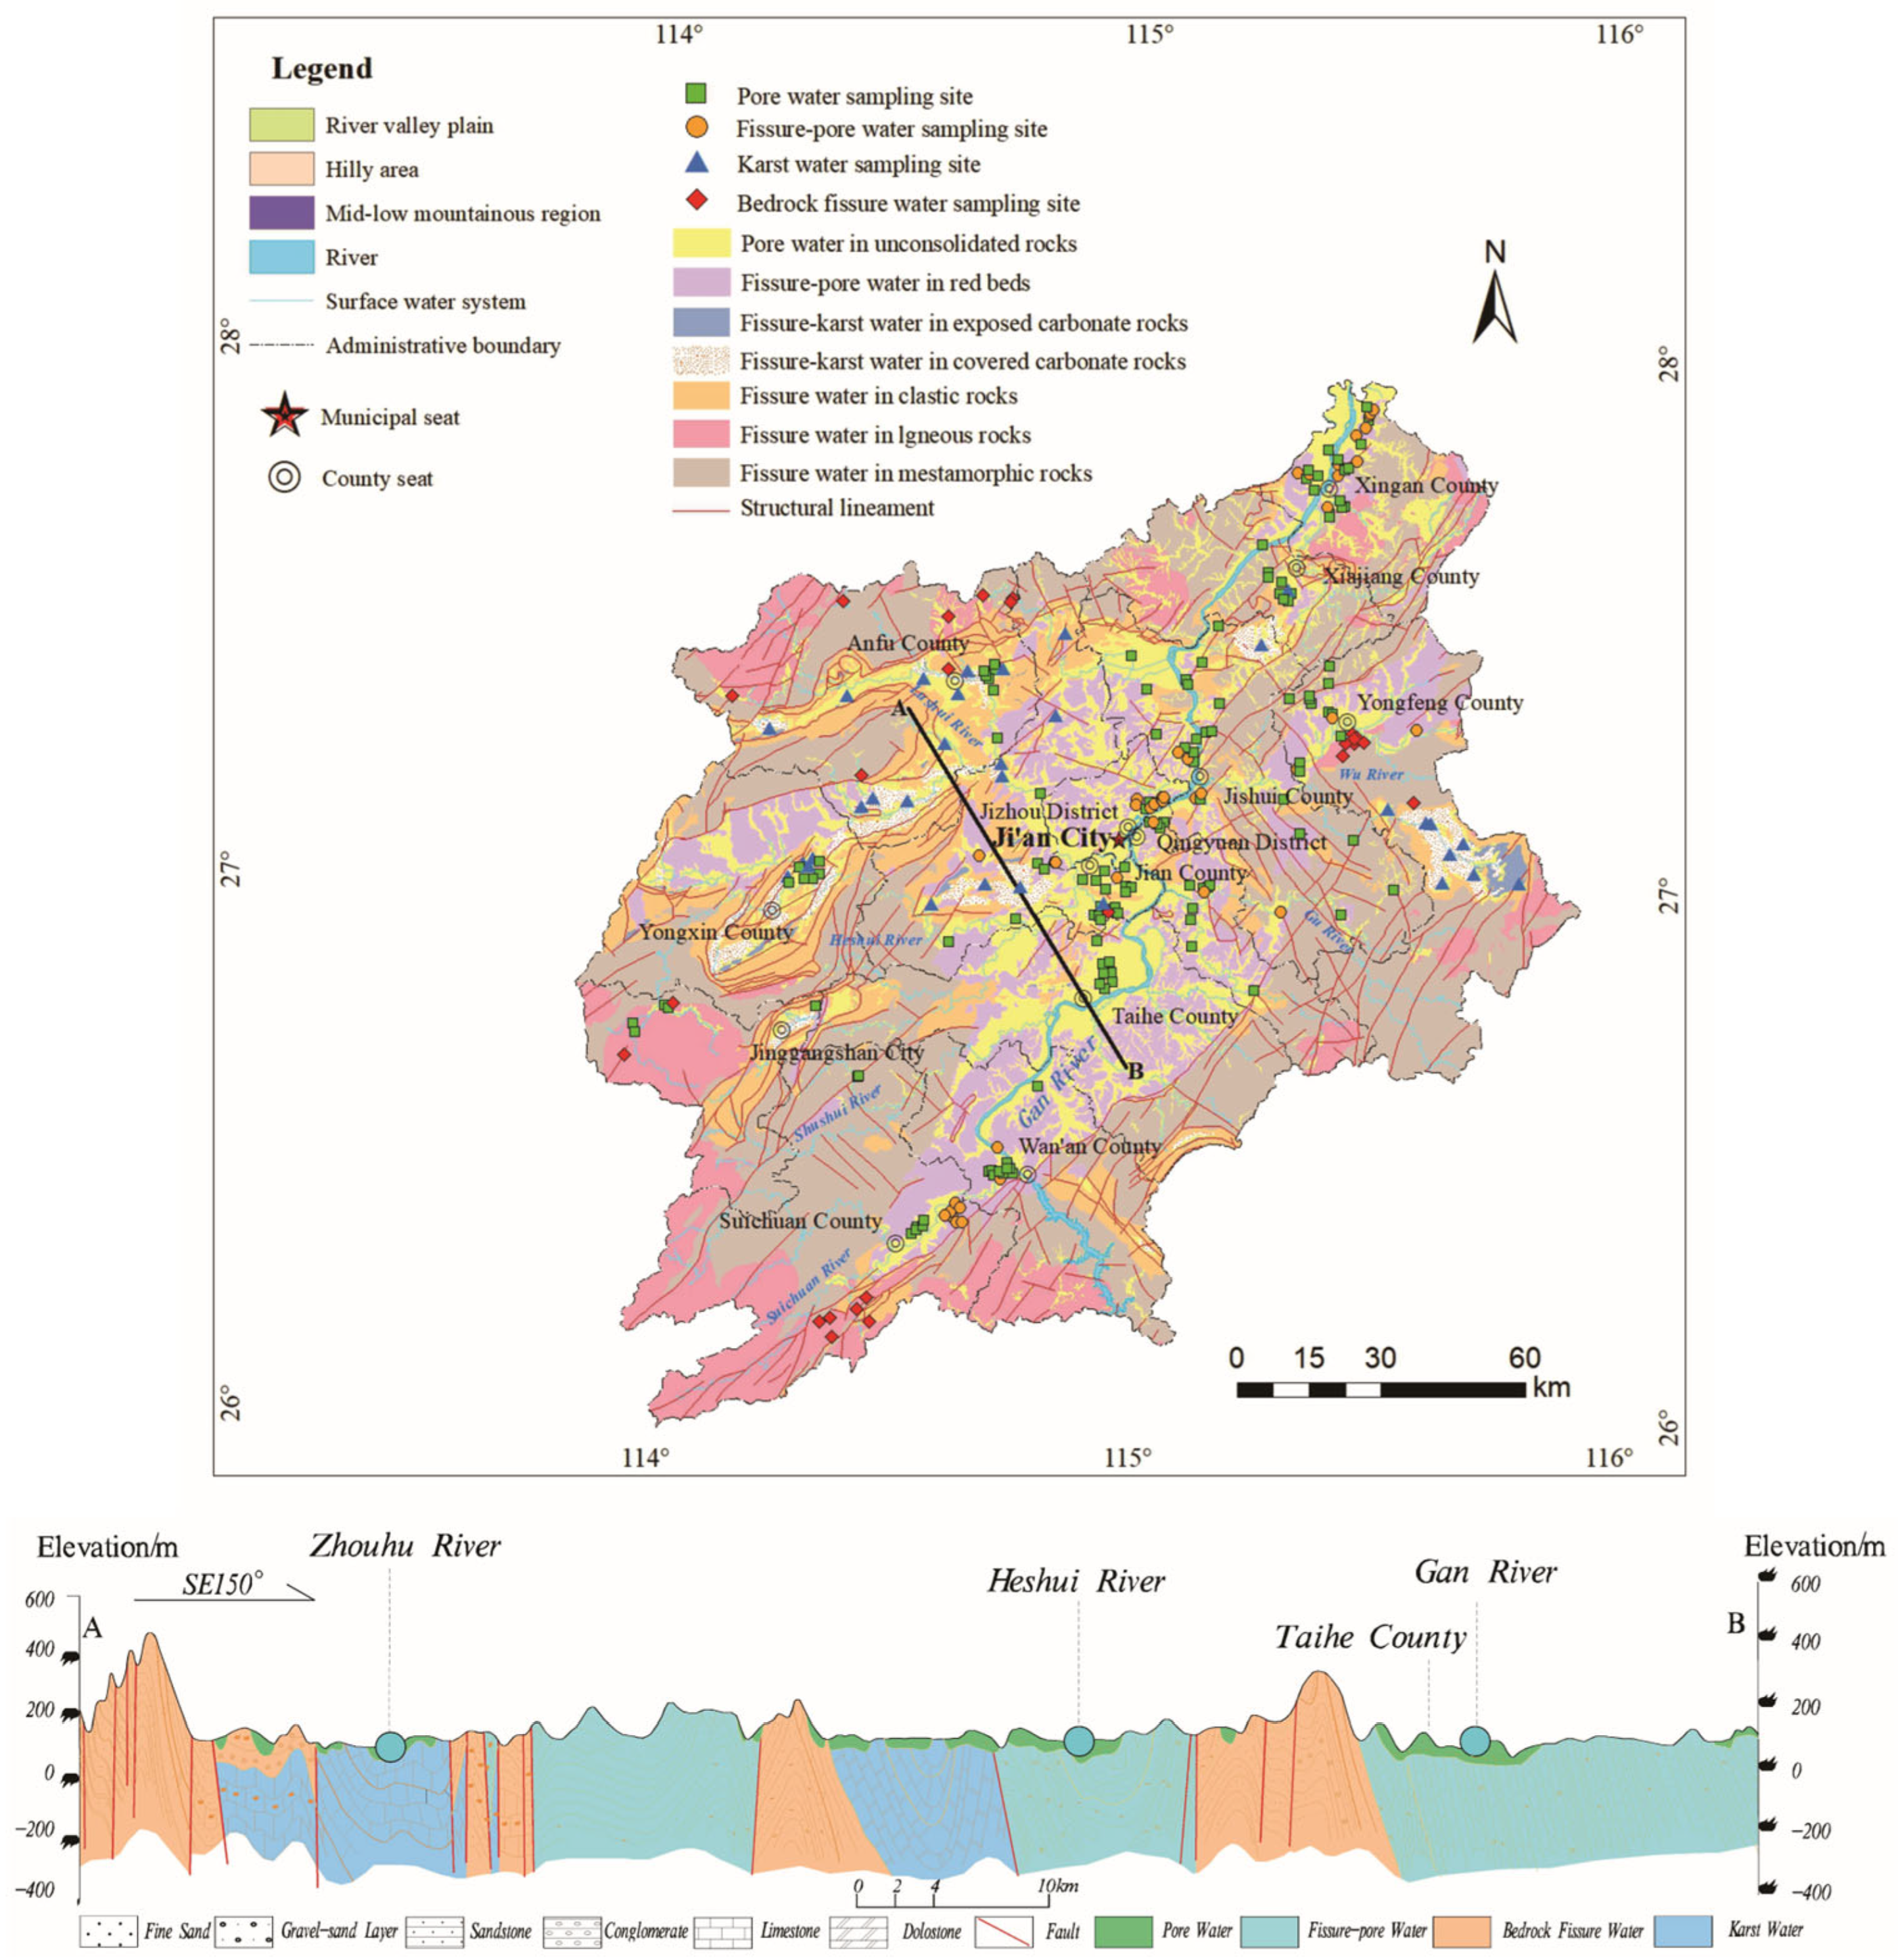
Accessible groundwater mainly occurs in four hydrogeological units: porous aquifers in unconsolidated sediments, fissured–porous aquifers in red-beds, karst aquifers in carbonate rocks, and fissured aquifers in bedrock [19]. The distribution of different groundwater types is shown using color-coded symbols, allowing for a quick visual assessment of where certain types of groundwater are prevalent (Figure 2). Porous aquifers are primarily distributed along the Gan River and tributary valleys, which comprise Quaternary alluvial deposits with their age ranging from Holocene to Middle Pleistocene, and early Pleistocene residual layers. Groundwater occurs in gravel layers (lower alluvium) or loosely cemented conglomerates (residual deposits). High-yield zones occur in thick, unconsolidated sediments of first terraces, while other areas exhibit low yields due to thin, semi-cemented strata with clay interbeds. Fissured–porous aquifers are mainly found in Cretaceous–Paleogene red-bed basins (e.g., Jitai, Yongfeng, Xingan, Yongxin) with low yield. Lithologies include weakly consolidated purple conglomerates, sandstones, siltstones, and mudstones, with groundwater hosted in pores and fractures. Karst aquifers are dominantly developed in Permo-Carboniferous limestones and dolomites within the Yongfeng (Tengtian Basin), Jishui (Badu Basin), Ji’an, Yongxin, and Anfu areas. These are mostly covered karst systems, with localized exposures. Aquifer productivity is controlled by lithology, structure, and aquicludes. Thick pure limestone/dolomite sequences exhibit well-developed fractures and karst conduits, yielding abundant groundwater—several centralized drinking water sources are established [10]. Conversely, thin-bedded or impure carbonates intercalated with clastic rocks show poor karstification and low yields. Fissured aquifers are widespread in medium-low mountains and hills, comprising igneous/metamorphic rocks of Yanshanian granites and Neoproterozoic–Cambrian metamorphic sandstones, phyllites, and slates, and sedimentary rocks of Ordovician–Jurassic quartz sandstones, conglomerates, and siltstones [15,19]. Groundwater occurs in weathering fractures and tectonic fissures, typically with low productivity, except in localized fracture zones where moderate yields are observed. The locations of various groundwater sampling sites were marked with different symbols. Pore water sampling sites were represented by green squares, fissure–pore water sampling sites by orange circles, karst water sampling sites by blue triangles, and bedrock fissure water sampling sites by red diamonds. The vertical sequence of geological layers is illustrated in the cross-section. They include fine sand, gravel sand, sandstone, conglomerate, limestone, dolomite, and faults. Major rivers such as the Zhouhu River, Heshui River, and Gan River were distributed on the cross-section (Figure 2).

2.2. Sample Collection and Analysis

Based on preliminary hydrogeological surveys, a total of 235 groundwater samples were collected from centralized drinking water supply wells, private wells, industrial monitoring wells, and boreholes across the study area in September 2021. The samples include 133 Quaternary porous groundwater samples, 44 fissured–porous groundwater samples, 33 karst groundwater samples, and 25 bedrock fissure groundwater samples. The spatial distribution of sampling locations is shown in Figure 2. To ensure data quality, strict protocols were followed during sample collection, including field parameter measurements using calibrated instruments, storage into pre-cleaned polyethylene bottles, filtration using a 0.45 μm membrane filter, and acidification to prevent contamination and preserve ion stability (shown below).
Parameters including pH, electrical conductivity (EC), dissolved oxygen (DO), oxidation-reduction potential (ORP), and temperature (T) were measured in situ using a DZB-712F portable multi-parameter analyzer (Shanghai REX Instrument Factory, Shanghai, China). Before sampling, wells were purged with submersible pumps or bailers until at least three times the well volume was discharged, and field parameters stabilized. All samples were stored in high-density polyethylene (HDPE) bottles, stored at 4 °C, and analyzed within 48 h. Cations (K+, Na+, Ca2+, Mg2+) were analyzed by inductively coupled plasma optical emission spectrometry (ICP-OES, Optima 5300DV-F016, PerkinElmer, Waltham, MA, USA) with a detection limit of 0.003 mg/L. Anions (Cl, SO42−, NO3) were determined by ion chromatography (Eco IC-F263, Metrohm, Herisau, Switzerland) with a detection limit of 0.007 mg/L. HCO3 and total hardness (TH) were measured by titration, and total dissolved solids (TDS) were quantified using the gravimetric method (AL204-F076, Mettler Toledo, Greifensee, Switzerland). All samples were measured in duplicate, and the average values of the replicates were recorded. To validate the reliability of the analytical results, the ionic balance was determined using Equation (1). Results indicated that all balance error percentages (%CBE) for all samples were within 5%.
% C B E = c e i + c e j c e i + + c e j

2.3. Data Processing

Statistical data analysis was performed using Microsoft Excel. Groundwater hydrochemical characteristics were analyzed using a combination of graphical and statistical methods. A Piper plot was employed to visualize the major ion chemistry and classify groundwater types. Ion correlations were assessed using Pearson’s correlation analysis to identify relationships between variables. The Gibbs plots were used to interpret water-rock interaction mechanisms by examining the ratios of Na+/(Na+ + Ca2+) and Cl/(Cl + HCO3) against TDS values, which helps to distinguish between evaporation-crystallization, rock-weathering, and precipitation-dominated processes. Principal component analysis (PCA) was applied to reduce dimensionality and identify underlying factors influencing groundwater chemistry. The PCA was conducted using varimax rotation to enhance interpretability, with components extracted based on eigenvalues >1. The factor scores were then used to quantify the contributions of natural and anthropogenic inputs to groundwater composition.

3. Results and Discussion

3.1. Hydrochemical Characteristics

3.1.1. General Hydrochemistry

Statistical analysis of the main hydrochemical parameters was conducted for different groundwater types (Table 1). The results revealed that cations were dominated by Ca2+ in all four groundwater types, accounting for 61.20%, 52.73%, 80.77%, and 53.72% of total cations, respectively. Anions were predominated by HCO3, representing 71.48%, 43.53%, 90.21%, and 73.47% of total anions in the corresponding groundwater types. This indicates a broad similarity in hydrochemical composition across the study area, with Ca2+ and HCO3 consistently being dominant.
Porous water exhibited a weakly acidic pH (mean 6.66). Total dissolved solids (TDSs) ranged from 13 to 820 mg/L, classifying it as freshwater. Total hardness (TH) averaged 122.6 mg/L, indicating soft to moderately hard water. Nitrate (NO3) contamination was significant, with concentrations ranging from 0.09 to 320 mg/L (mean 15.41 mg/L), reflecting substantial anthropogenic influence, likely from agricultural activities.
Fissured–porous water had a near-neutral pH (mean 6.84). TDS showed a wide range (27 to 3282 mg/L), with 9.09% of samples classified as brackish or saline. This elevated salinity may be attributed to the presence of gypsum lenses and chloride-rich brine in red-bed strata. TH was relatively high (mean 204.6 mg/L), indicating hard water. Nitrate levels (0.04 to 82.4 mg/L, mean 16.28 mg/L) also suggested anthropogenic impacts.
Karst water had a pH ranging from 6.6 to 8.2 (mean 7.35). TDS ranged from 13 to 820 mg/L, remaining within freshwater limits. Despite high total hardness (mean 206.46 mg/L), NO3 concentration was relatively low (0.6 to 12.8 mg/L, mean 5.54 mg/L). This lower vulnerability to NO3 was likely due to the confined nature of karst aquifers, which limit external contaminant infiltration.
Bedrock fissure water exhibited a weakly acidic pH (mean 6.68). TDS was low (freshwater range), and TH was the lowest among all types (mean 87.88 mg/L), indicating soft water. NO3 levels were not prominently highlighted in this aquifer type, suggesting minimal anthropogenic influence.
The observed hydrochemical signatures in different groundwaters highlight the lithology, aquifer structure, and human activities in shaping groundwater quality. The neutral pH of karst water reflected buffering by carbonate dissolution [14,20], whereas the slightly lower pH of porous and fissured–porous waters was consistent with limited buffering in siliciclastic red-beds and Quaternary sediments [21]. A wide range of TDS values in fissured–porous aquifers mirrored the evaporite window described by Herczeg et al. in analogous red-bed basins, where intercalated gypsum and upward leakage of deep basial brines created local salinity maxima. A 9% brackish/saline proportion was similar to the 8–12% reported for the Jurassic–Cretaceous red-beds of the Sichuan Basin [22]. Total hardness covaried with both TDS and lithology, suggesting that Ca2+ and Mg2+ in karst and fissured–porous waters were derived from carbonate and gypsum dissolutions, whereas the lower TH in bedrock fissure water reflected the quartz–feldspar dominance of granitic terranes with only minor calcite along fracture coatings [23].
The distinct NO3 levels across aquifer types underscore the varying susceptibility of groundwater systems to anthropogenic influences. Porous and fissured–porous waters are more vulnerable to human activities, as evidenced by elevated NO3 levels, necessitating targeted pollution control measures. In contrast, karst and bedrock fissure waters appear more protected, with their chemistry primarily governed by natural geochemical processes such as carbonate and silicate rock weathering.
The relatively high level of NO3, with a maximum of 320 mg/L in porous water and a lower value in karst water, illustrated the dual-porosity paradox [24], where unconfined granular aquifers with high recharge rates and oxygenated conditions favored rapid transport of agricultural nitrate, whereas karst aquifers, though permeable, were episodically flushed and less densely farmed, limiting cumulative loading. Similar results were documented by Mao et al., where NO3 in shallow alluvium exceeded 100 mg/L, while confined karstic limestones remained <10 mg/L [25].

3.1.2. Water Type

According to the Shukarev classification, groundwater was categorized into 22 hydrochemical types, with HCO3-Ca, HCO3·Cl-Na·Ca, HCO3-Na·Ca, HCO3-Ca·Mg, and HCO3·Cl-Na being the most dominant (Table 2), accounting for 38.30%, 14.89%, 12.77%, 8.94%, and 5.53% of the total samples, respectively.
Porous water exhibited the highest diversity, comprising 18 hydrochemical types, dominated by HCO3-Ca, HCO3·Cl-Na·Ca, and HCO3-Na·Ca, which represented 65.42% of the porous water samples. Fissured–porous water included 14 hydrochemical types, primarily HCO3-Ca and HCO3-Na·Ca, contributing to 50% of the fissured–porous water samples. In contrast, karst water showed limited variability, with only 3 hydrochemical types, where HCO3-Ca dominated at 69.70%. Bedrock fissure water consisted of 9 hydrochemical types, with HCO3-Na·Ca and HCO3-Ca being predominant, representing 56% of the bedrock fissure samples.
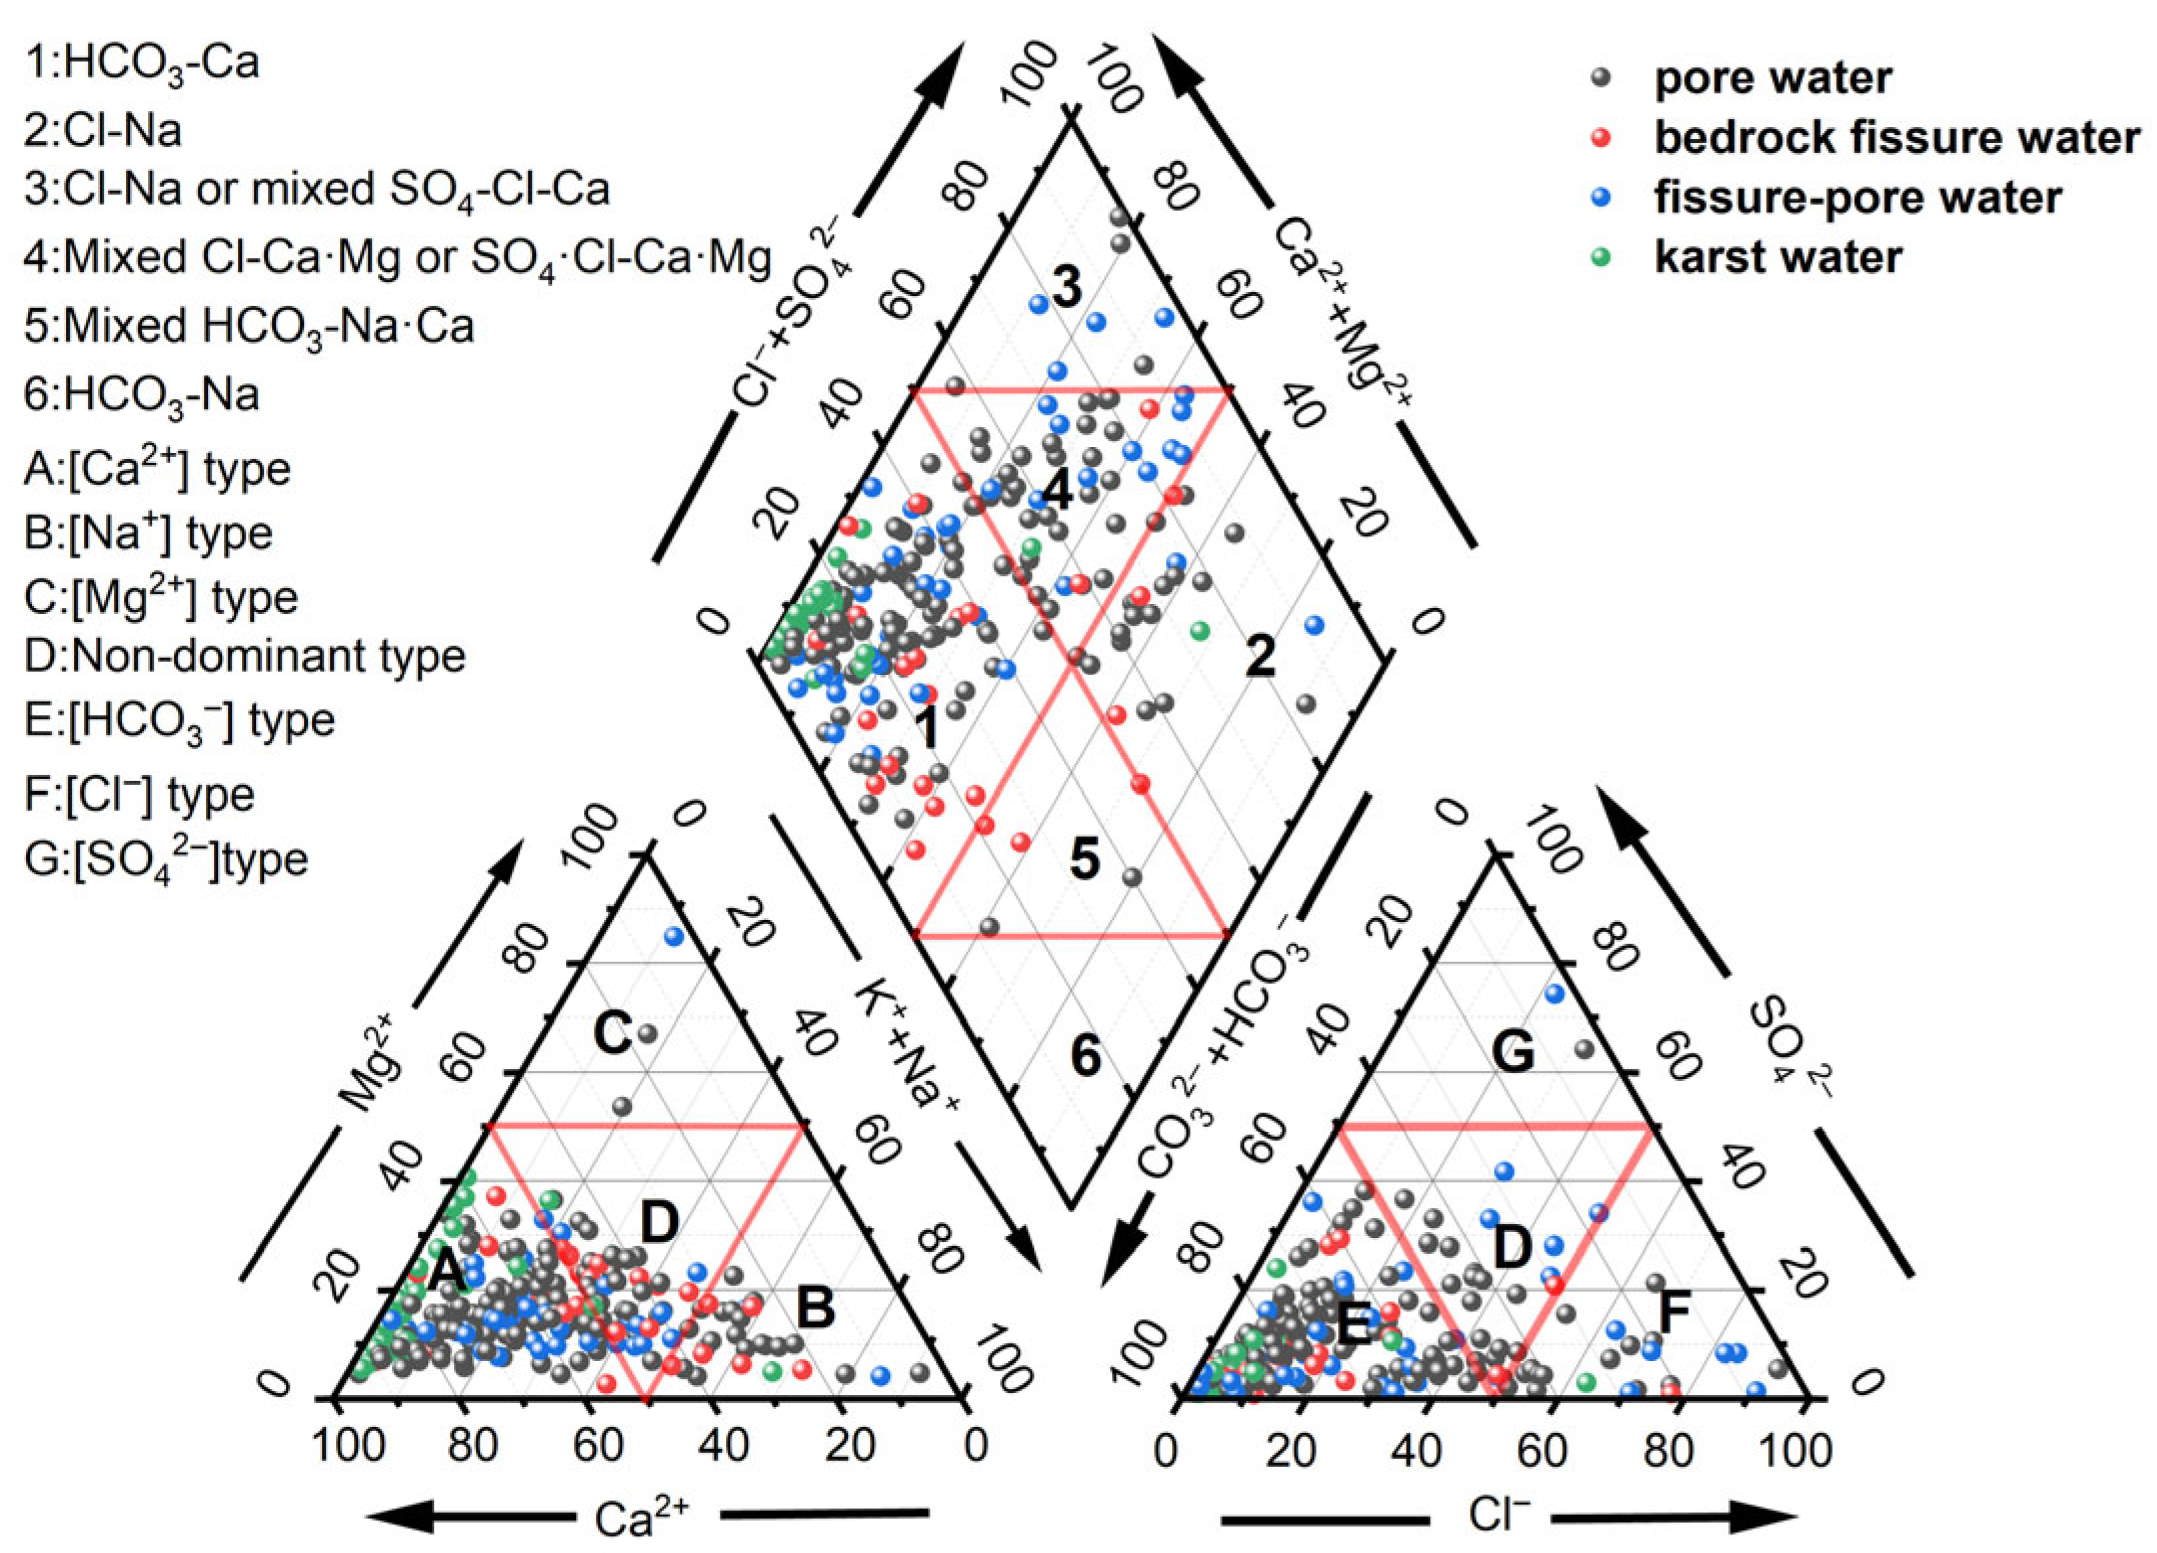
In the Piper plot (Figure 3), most samples fell within Zone A of the cation triangle, followed by Zone D and Zone B, with only three samples located in Zone C, indicating that Ca2+ dominated the cationic composition of groundwater. While karst water exhibited the highest concentration near the Ca2+ end-member, porous, fissured–porous, and bedrock fissure waters still showed significant proportions of non-dominant (mixed) and Na+-dominant types. In the anion triangle, samples primarily clustered in Zone E, with secondary distributions in Zone D and Zone F, and only two samples in Zone G, revealing HCO3 as the predominant anion. However, a notable number of porous, fissured–porous, and bedrock fissure waters displayed non-dominant or Cl-dominant characteristics. Within the central diamond, the majority of the samples were plotted in Region 1, followed by Region 4. Only two porous water and three bedrock fissure water samples were found in Region 5. These water facies underscore the hydrochemical diversity across different aquifer systems, reflecting variations in lithology, mineral dissolution, and recharge mechanisms. The spatial patterns demonstrated that, despite the predominance of the HCO3-Ca type, the groundwater system hosted considerable hydrochemical discrepancy, suggesting influences from anthropogenic activities or external environmental factors. Studies have shown that pore water hosted the richest facies diversity, owing to rapid lateral facies changes, agricultural nitrate inputs, and seasonally fluctuating redox conditions [26,27]. Fissured–porous red-beds showed intermediate variability modulated by evaporite lenses, whereas karst water’s 70% HCO3–Ca dominance reflected uniform carbonate dissolution and short, buffered flow paths [7,28]. The moderate diversity in water type of bedrock fissure waters was probably attributed to discrete fracture networks and limited residence time [29].

3.2. Formation Mechanism of Groundwater Chemistry

3.2.1. Correlation Analysis

A correlation matrix of the main ions, TDS, and TH in the groundwater was obtained through correlation analysis (Table 3). The results showed that TDS had a strong correlation with Ca2+, HCO3, Mg2+, and SO42−, with correlation coefficients greater than 0.7, indicating that the contents of these ions made significant contributions to the TDS mass concentration in the groundwater. The correlation coefficients among Ca2+, HCO3, and Mg2+ were all greater than 0.7, and the correlation coefficients between Na+ and K+, and between Na+ and Cl were 0.623 and 0.657, respectively, suggesting that they probably shared the same material sources. NO3 had good positive correlations with K+, Na+, and Cl, with correlation coefficients of 0.324, 0.342, and 0.481, respectively, indicating their homology, which reflected the influence of human activities or the same environmental factors. NO3 showed negative correlations with Ca2+ and HCO3, indicating different sources, migration, and transformation processes in the water body. The strong positive loadings of Ca2+, HCO3, Mg2+, and SO42− on TDS agreed with the recent PCA result of Huang et al. [29], indicating that the first principal component explained 51.8% of variance in an over-exploited red-bed aquifer, dominated by the same ions, and attributed it to combined carbonate/gypsum dissolution as well as industrial inputs. A correlation between Na+ and Cl fits their high-RC Na+/Cl plot (R2 = 0.803), reinforcing halite as a common source. The positive NO3–Cl–Na+ cluster mirrored the manure & sewage signal identified in seasonal nitrate-isotope studies in Jiangxi, where elevated NO3, Cl, and Na+ co-occurred during the fertilisation period. The weak negative NO3 vs. Ca2+/HCO3 relation further indicated that nitrate originates from surficial anthropogenic inputs rather than carbonate-buffered deep flow, consistent with the findings of Wang et al. [27], who reported analogous negative loadings of NO3 against Ca2+ and HCO3 in PCA of agricultural red-bed groundwater.

3.2.2. Leaching Process

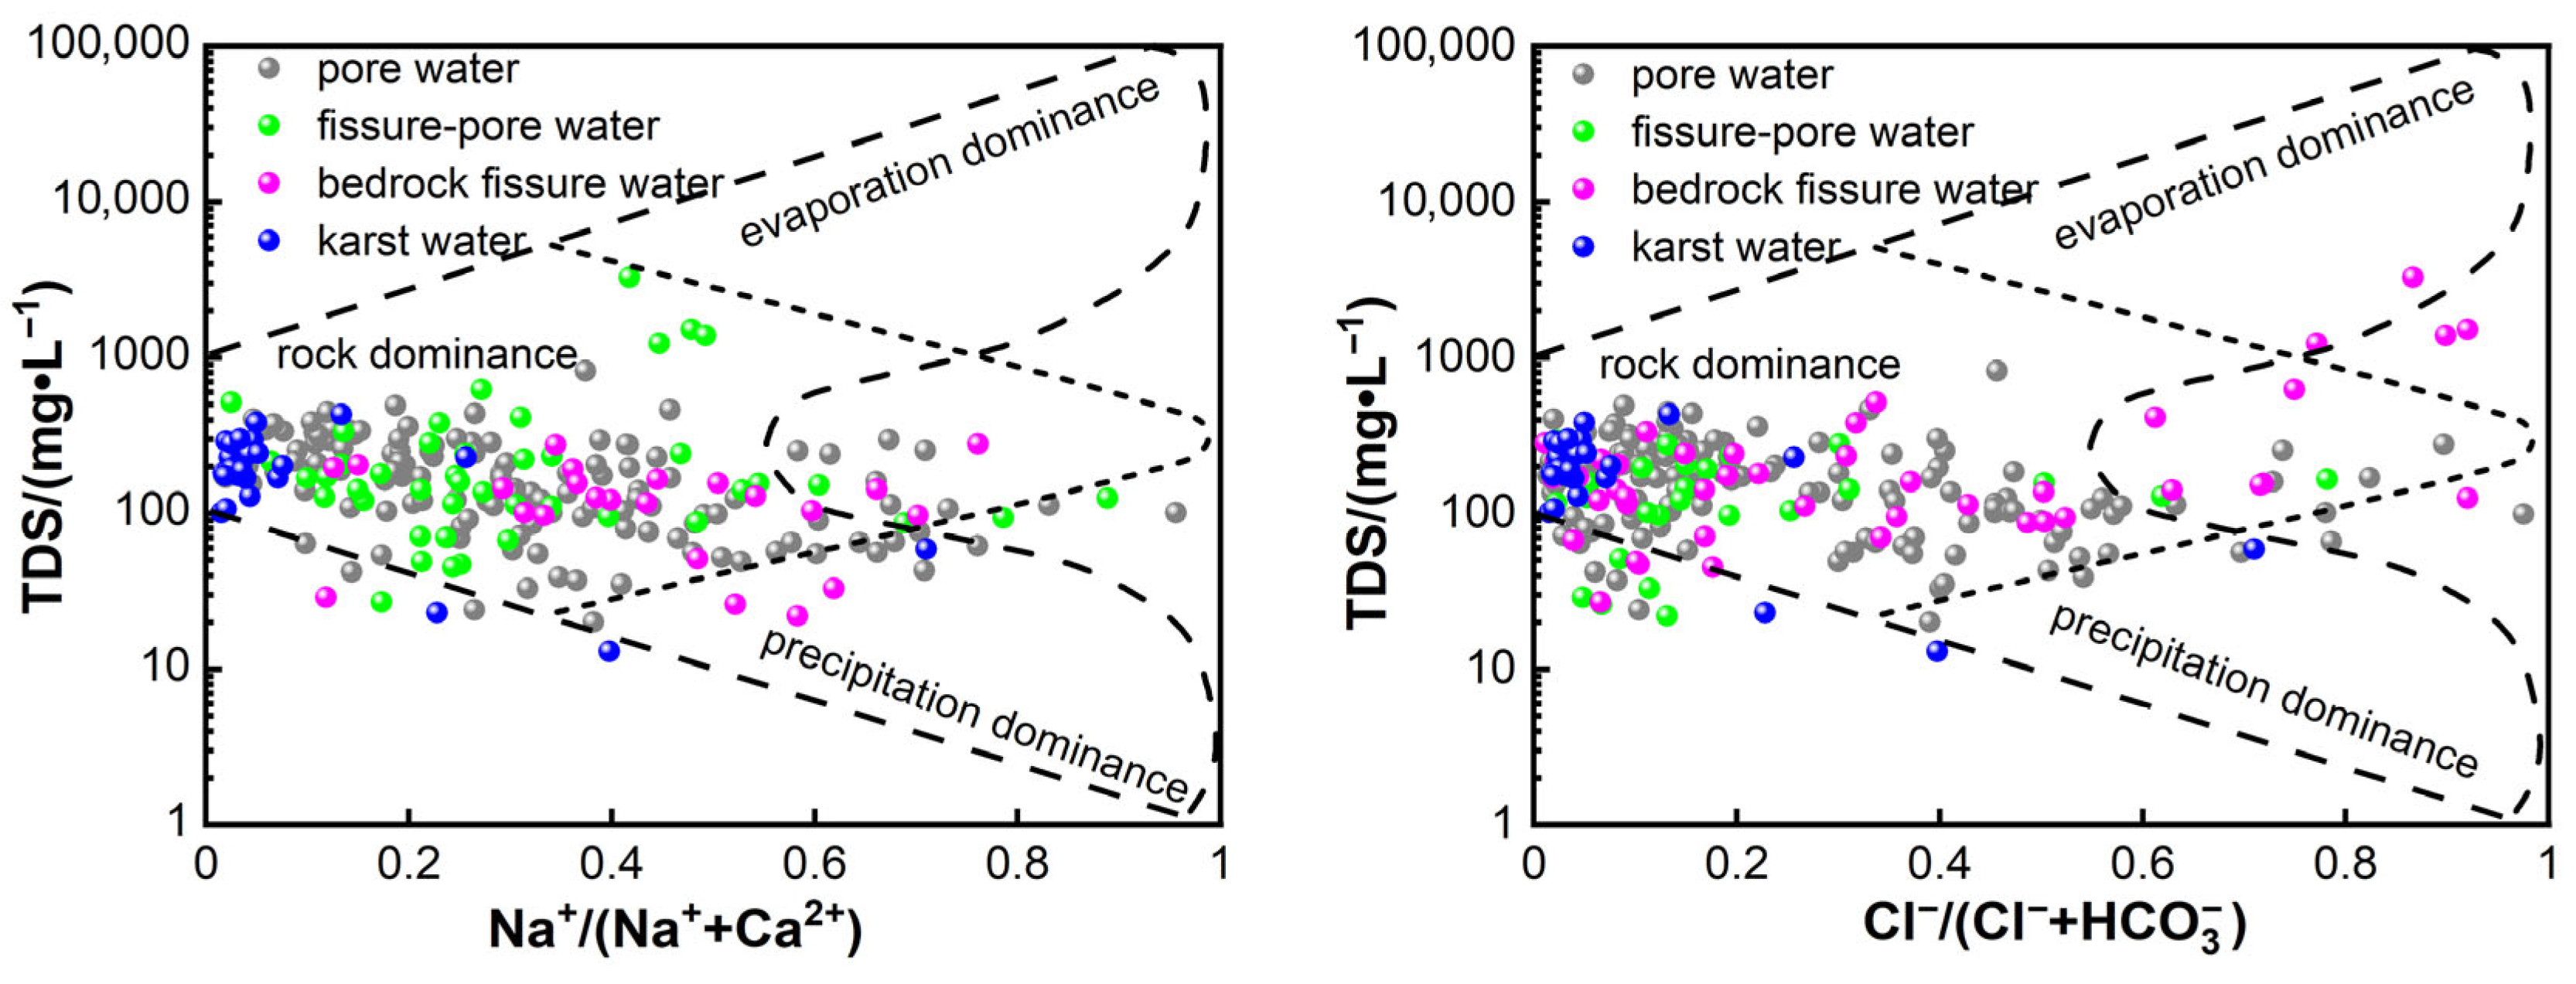
The Gibbs diagram has been widely used to analyze the changes in water chemical composition and its main genetic mechanisms. By examining the relationship between the TDS concentration and the ratios of Na+/(Na+ + Ca2+) or Cl/(Cl + HCO3), it can effectively determine the influence of factors such as rock weathering, evaporation concentration, and atmospheric precipitation on the hydrochemical components [30,31,32]. As shown in Figure 4, the groundwater samples were mainly located in the rock weathering control area, indicating that the hydrochemical components of various types of groundwater were primarily affected by the leaching process of rock weathering. Some samples of red-bed fissure–pore water were close to the evaporation concentration control area, suggesting that the local red-bed groundwater was formed and evolved from ancient atmospheric precipitation through evaporation concentration in a continental environment. Some pore water and bedrock fissure water samples were close to the atmospheric precipitation control area, indicating that atmospheric precipitation also had a certain impact on the hydrochemical components of groundwater. The sampling points outside the three areas indicated that they were affected by human activities to a certain extent [9,30].
Naturally, the ratios of ions generated by the weathering of different rock minerals vary significantly. Therefore, the milligram-equivalent concentration ratios of Ca2+/Na+ to HCO3/Na+ and Mg2+/Na+ are often used to reveal the interactions between groundwater and different rocks, and to further qualitatively analyze the sources of groundwater chemical components [9,13,20,33]. Groundwater samples were generally distributed between the control end-members of silicate rocks and carbonate rocks (Figure 5), indicating that the chemical components of groundwater were derived from the weathering and dissolution of silicate and carbonate rock minerals. However, the fissure–pore water and pore water in some red-bed areas were also influenced by the weathering and dissolution of evaporite rocks. Among them, the karst water samples were mainly concentrated near the carbonate rock control end-member, suggesting that they were mainly affected by the weathering and dissolution of carbonate rock minerals. The bedrock fissure water samples were closer to the silicate rock control end-member, indicating that they were mainly influenced by the weathering and dissolution of silicate rock minerals. The remaining groundwaters were controlled by the combined weathering and dissolution of the above two types of salt rock minerals.
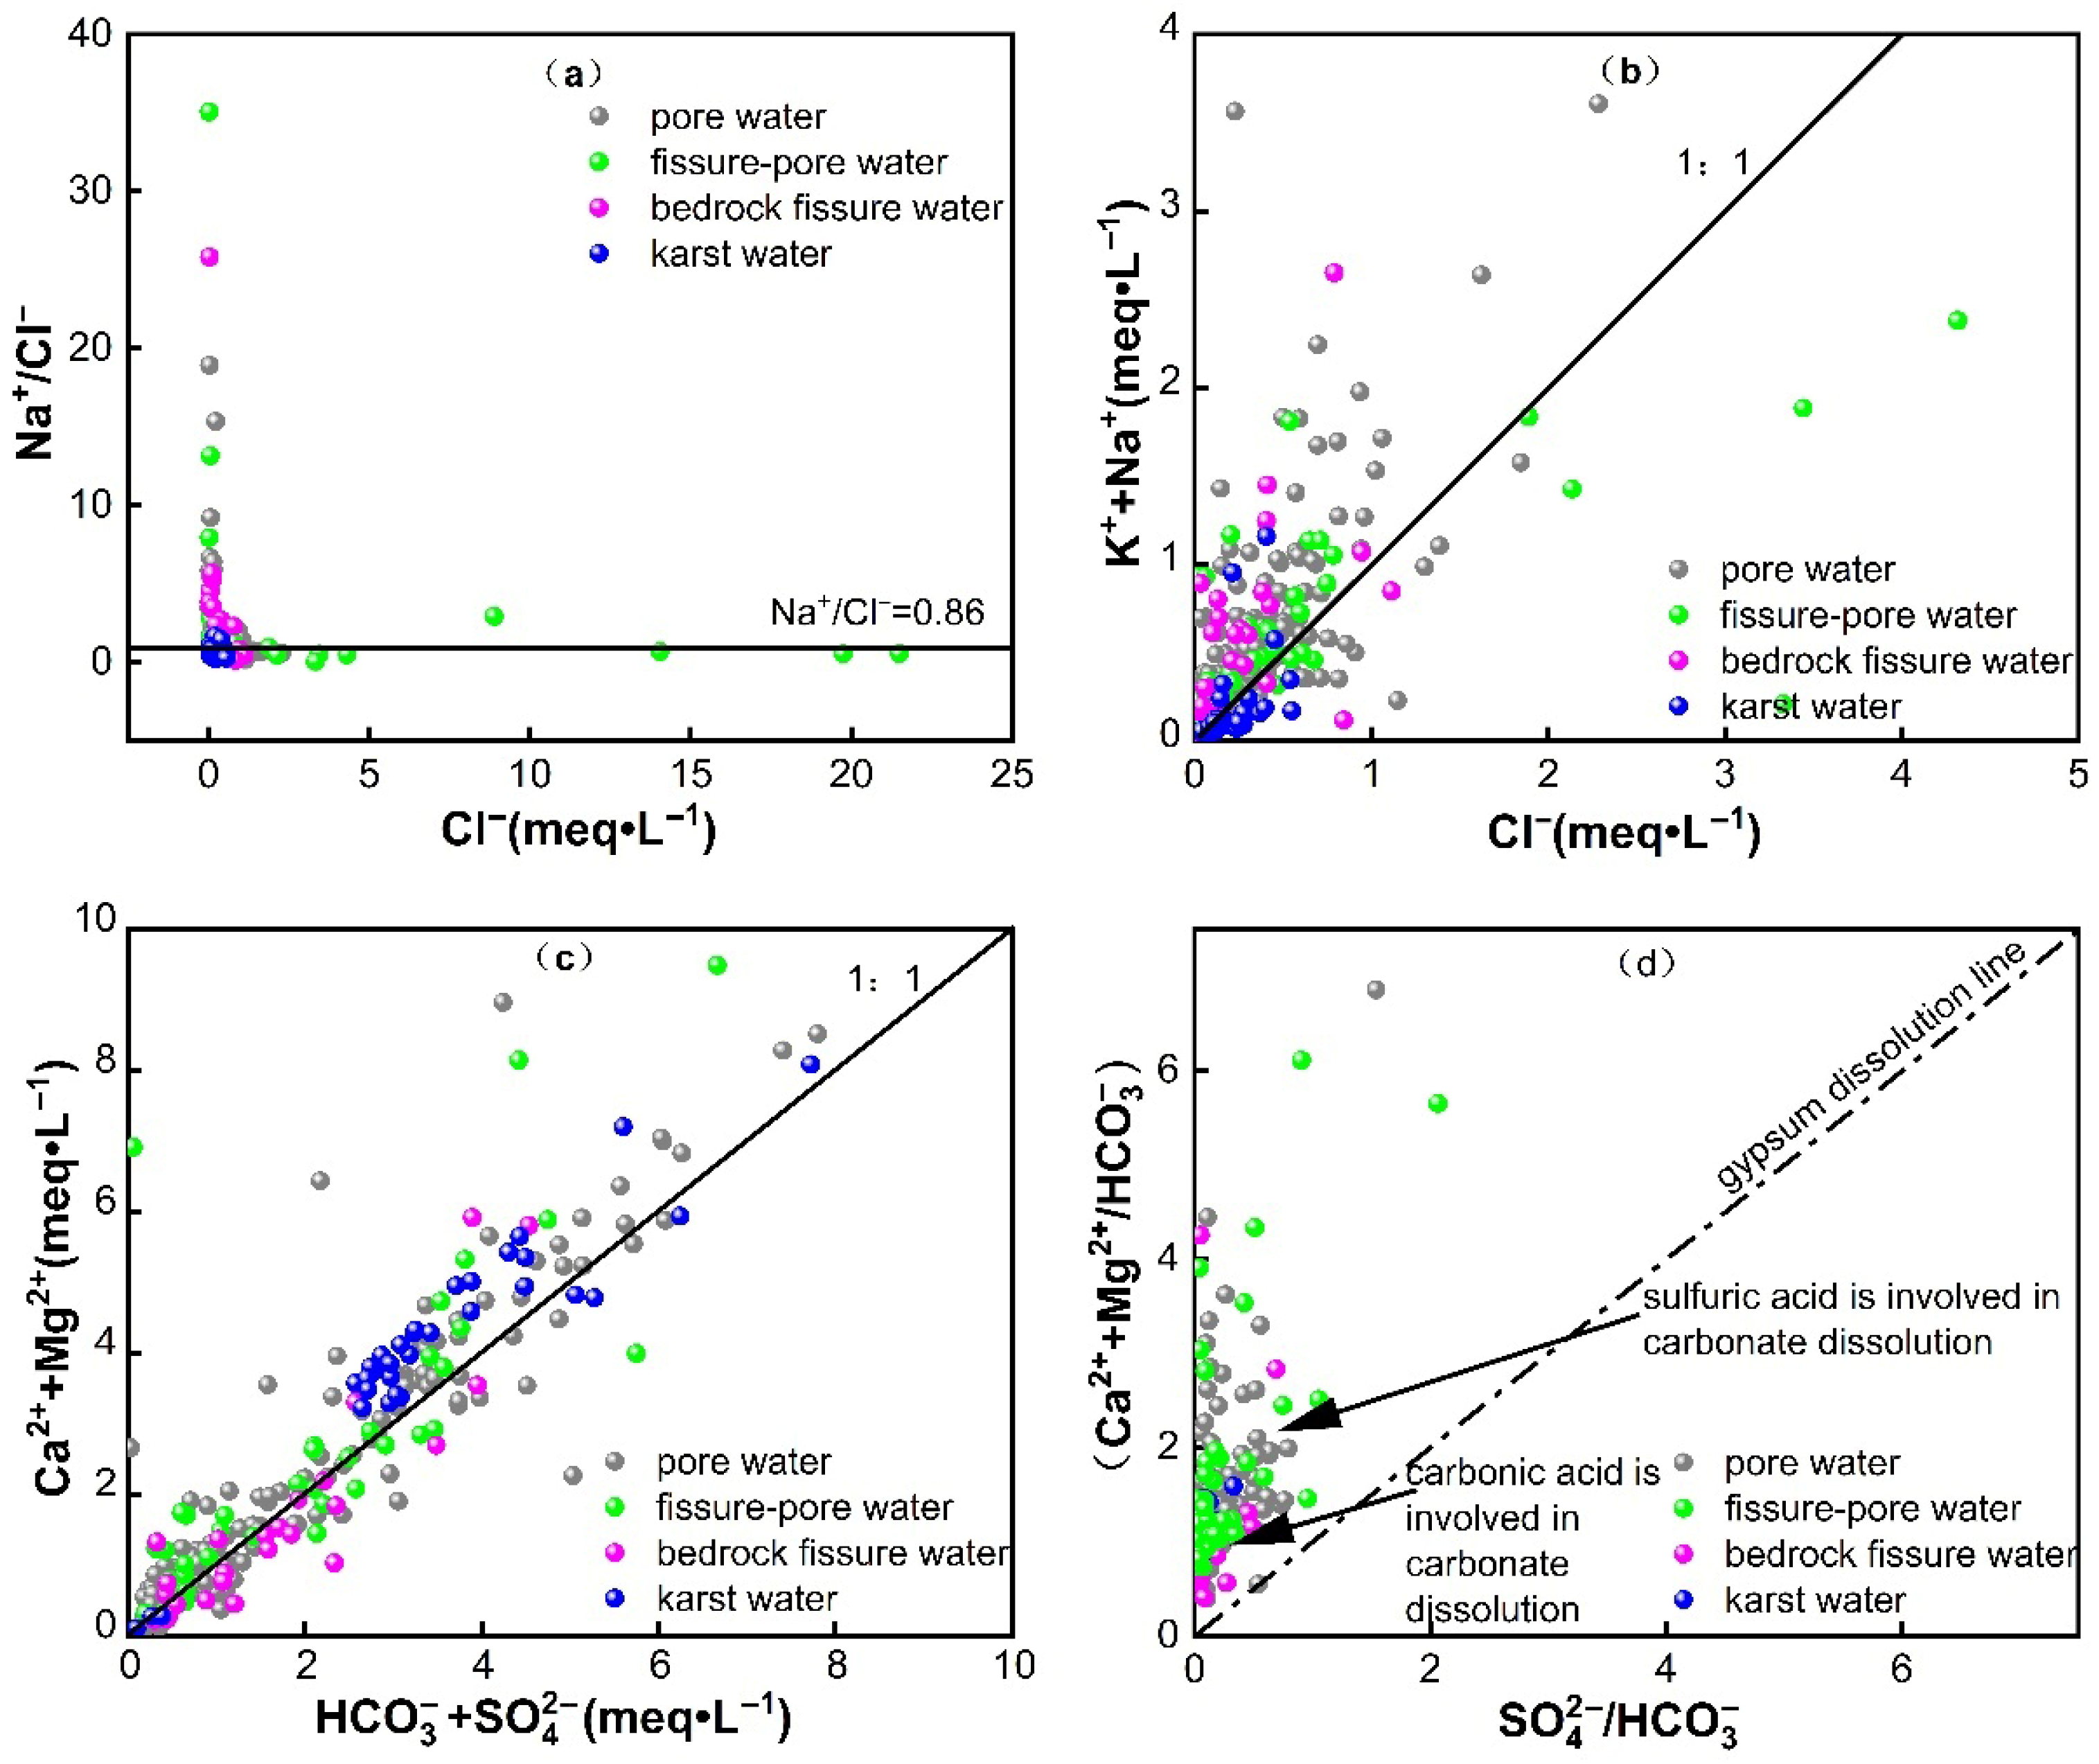
The Na+ and K+ in groundwater mainly originate from atmospheric precipitation, weathering of silicate rocks, and dissolution of rock salt. The main sources and formation processes of ionic components in groundwater can be investigated by examining the relationships of typical ion ratios. The Na+/Cl ratio in atmospheric precipitation is close to that of seawater, which is 0.86 [30]. Figure 6a shows that the Na+/Cl ratio in the studied groundwater ranged from 0.05 to 35.06, with an average of 1.86, indicating that atmospheric precipitation was not the main source. When the (K+ + Na+)/Cl ratio equals 1, Na+ and K+ come from the dissolution of rock salt [34]. In Figure 6b, the groundwater samples are distributed on both sides of the (K+ + Na+)/Cl = 1 line, suggesting that the dissolution of rock salt was not the only influencing factor for their sources. Most of the pore water, red-bed fissure pore water, and bedrock fissure water samples are distributed above this line, indicating that their Na+ and K+ were mainly controlled by the dissolution of sodium- and potassium-containing aluminosilicate minerals [35]. However, a considerable number of water samples are still distributed below this line, where Cl was in excess relative to K+ + Na+, indicating that these groundwater components were affected by both the dissolution of rock salt and human activities [7,13].
The Ca2+ and Mg2+ in water bodies mainly originate from the weathering and dissolution of carbonate rocks (e.g., calcite and dolomite), silicate rocks (e.g., K-feldspar and Na-feldspar), and evaporite rocks (e.g., gypsum). Therefore, the ratio of (Ca2+ + Mg2+) to (HCO3 + SO42−) is commonly used to explore the sources of Ca2+ and Mg2+ in groundwater. When the ratio is greater than 1, it indicates that Ca2+ and Mg2+ mainly come from the dissolution of carbonate rocks; when the ratio equals 1, they come from the dissolution of both carbonate and evaporite rocks; when the ratio is less than 1, they mainly come from the dissolution of silicate or evaporite minerals [24]. The karst water samples are mostly distributed above the (Ca2+ + Mg2+)/(HCO3 + SO42−) = 1 line (Figure 6c), indicating that the Ca2+ and Mg2+ in karst groundwater mainly come from the dissolution of carbonate rocks such as calcite and dolomite. The bedrock fissure water samples are generally distributed below this line, suggesting that the Ca2+ and Mg2+ in bedrock fissure water mainly come from the dissolution of silicate or evaporite minerals. The other groundwater samples are distributed on both sides of this line, and there are generally more samples above the line, indicating that the sources of Ca2+ and Mg2+ in these groundwaters were affected by both the dissolution of carbonate minerals and the dissolution of silicate or evaporite minerals.
The ratio relationship between (Ca2+ + Mg2+)/HCO3 and SO42−/HCO3 can be used to analyze the process of rock weathering and dissolution involving carbonic acid and sulfuric acid. When only carbonic acid participates in carbonate dissolution, (Ca2+ + Mg2+)/HCO3 equals 1, and SO42−/HCO3 equals 0. If (Ca2+ + Mg2+)/HCO3 > 1, sulfuric acid is needed for balance. When only sulfuric acid participates in carbonate dissolution, (Ca2+ + Mg2+)/HCO3 equals 2, and SO42−/HCO3 equals 1. In addition, when carbonic acid participates in the reaction with silicates, no SO42− is produced, and (Ca2+ + Mg2+)/HCO3 equals 1, while, when sulfuric acid participates in the reaction with silicates, SO42− is produced, along with more Ca2+ and Mg2+ [25,26]. The bivariate (Ca2+ + Mg2+) versus SO42− + HCO3 plot (Figure 6d) revealed a geochemical zonation. Karst and bedrock fissure samples cluster along or immediately below the carbonic acid carbonate-dissolution line, implying that calcite/dolomite and Ca-bearing silicates were predominantly weathered by soil CO2 with limited external acid input. In contrast, porous water and red-bed fissure–pore samples plot between the carbonic and sulfuric acid end-members and extend beyond the 1:1 line, evidencing a mixed-acid regime. Elevated Ca2+ + Mg2+ and SO42− in these facies indicated additional supply from gypsum dissolution and proton-promoted desorption from Ca-Mg silicates. Anthropogenic acids derived from fertilizer surplus and atmospherically deposited NOₓ/SO2 accelerate this process, as confirmed by recent column experiments on red-bed sandstone [29]. Consequently, the progressive shift toward higher SO42−/HCO3 ratios in unconfined Quaternary and red-bed aquifers served as a robust proxy for acid loading and highlights the increasing role of anthropogenic forcing in the geochemical evolution of regional groundwater.
These findings advance our understanding of groundwater hydrogeochemical evolution in multi-aquifer systems by highlighting the differential controls exerted by rock type on groundwater chemistry. Specifically, this study emphasizes how aquifer lithology dictates the primary weathering processes and, consequently, the dominant ions in groundwater. From a practical perspective, this knowledge is crucial for groundwater resource management and protection. Particularly, in regions dominated by carbonate aquifers, efforts should focus on monitoring and mitigating the effects of carbonate dissolution, which can lead to issues such as hardness and scaling. While in silicate-dominated bedrock fissure aquifers, the emphasis should be on preserving the natural geochemical balance, as these systems are less influenced by human activities but may be sensitive to environmental changes.

3.2.3. Cation Exchange

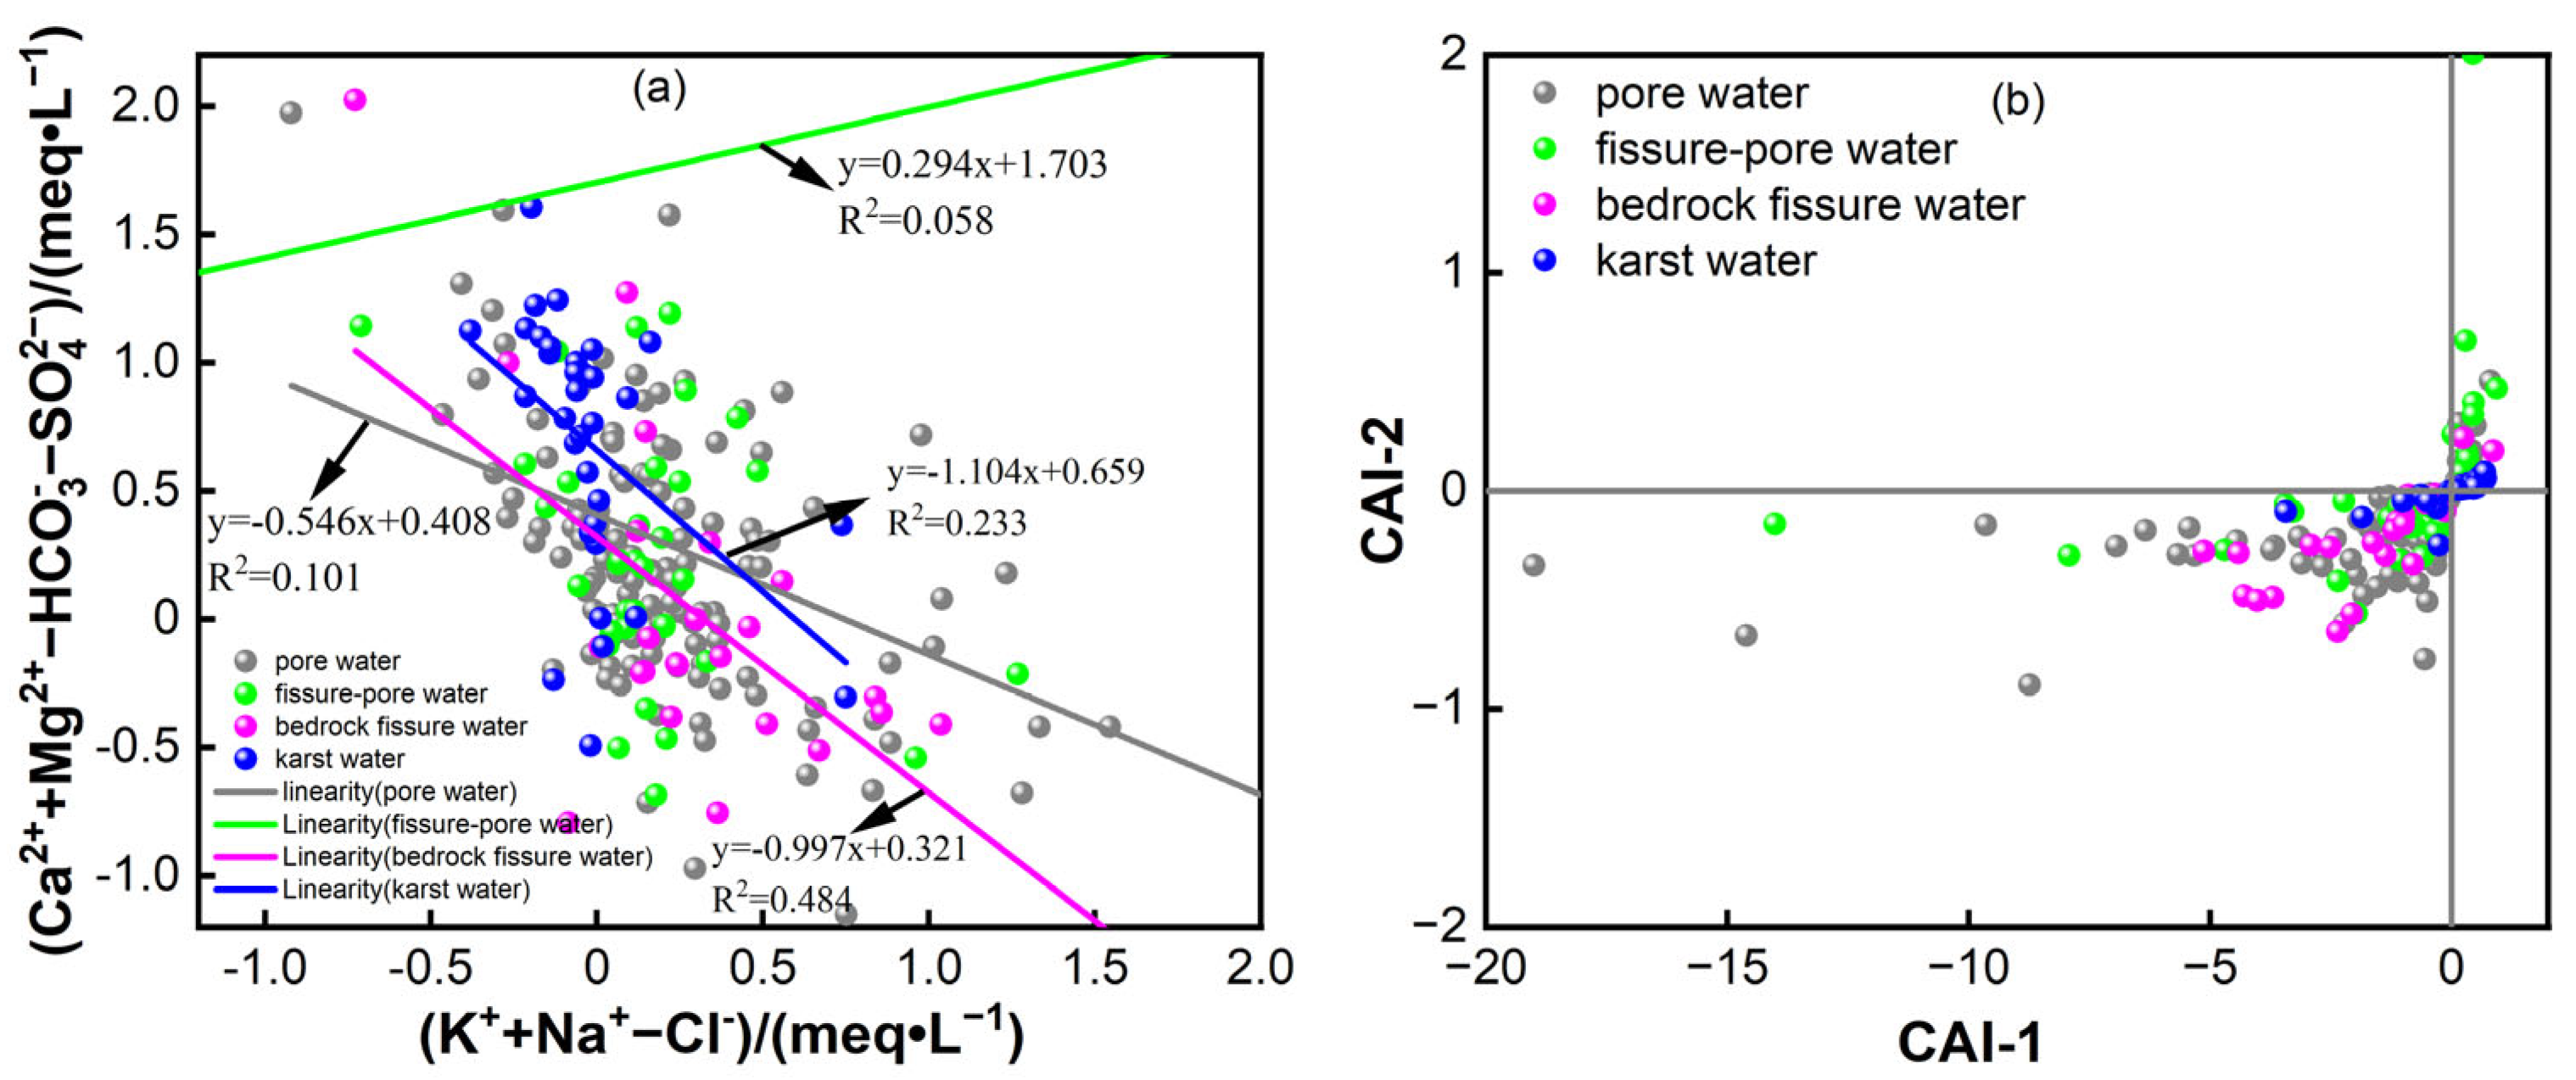
Cation exchange also has a certain influence on the formation of ionic components in groundwater. This process usually refers to the exchange between Ca2+, Mg2+ and K+, Na+ in groundwater. The ratio of (Ca2+ + Mg2+ − HCO3 − SO42−) to (K+ + Na+ − Cl) can be used to determine whether cation exchange occurs in groundwater. When there is a linear negative correlation between (Ca2+ + Mg2+ − HCO3 − SO42−) and (K+ + Na+ − Cl) with a slope close to −1, it indicates that there is obvious cation exchange in groundwater [36,37]. From the fitted lines of (Ca2+ + Mg2+ − HCO3 − SO42−) and (K+ + Na+ − Cl) for different types of groundwater samples in Figure 7a, it can be observed that the slope of the fitted line for bedrock fissure water samples was −0.997 (R2 = 0.484), indicating a larger extend of cation exchange, as compared to karst water (slope −1.104, R2 = 0.233) and pore water (slope −0.546, R2 = 0.101).
Chlor-alkali indices CAI-1 = (Cl − K+ − Na+)/(Cl) and CAI-2 = (Cl − K+ − Na+)/(HCO3 + SO42− + CO32− + NO3) were calculated to quantify the direction and intensity of cation exchange. Negative values of both indices indicate forward exchange, i.e., Ca2+ and Mg2+ in groundwater replace K+ and Na+ in the surrounding rock aquifer, whereas positive values reflect reverse exchange. In Figure 7b, 76% of karst water samples exhibit positive indices, implying that forward cation exchange was the dominant process in carbonate aquifers, consistent with the release of Na+ and K+ from clay minerals within paleo-karst fills. 23%, 27% and 12% of the pore water samples, red-bed fissure–porous water, and bedrock fissure water had CAI-1 and CAI-2 values greater than 0. This signified that a forward exchange that buffers Ca2+ and Mg2+ concentrations and enriches the aqueous phase in Na+ and K+ existed in the investigated groundwater. The absolute values of both indices further suggested moderate exchange intensities, in agreement with recent spectroscopic evidence for Ca-Na montmorillonite transformation in red-bed sequences [37]. Thus, lithology-controlled clay mineralogy and residence time jointly determined whether forward or reverse cation exchange governs the hydrochemical evolution of groundwater across the study area.
From a practical perspective, recognizing the role of cation exchange in groundwater chemistry is crucial for effective water resource management. Since forward exchange is dominant in karst aquifers, tracking changes in Ca2+, Mg2+, Na+, and K+ concentrations should be the first monitoring effort to assess the impacts of natural geochemical processes. In groundwater influenced by human activities, understanding cation exchange can aid in predicting the attenuation and transformation of pollutants within the aquifer.

3.2.4. Anthropogenic Impact

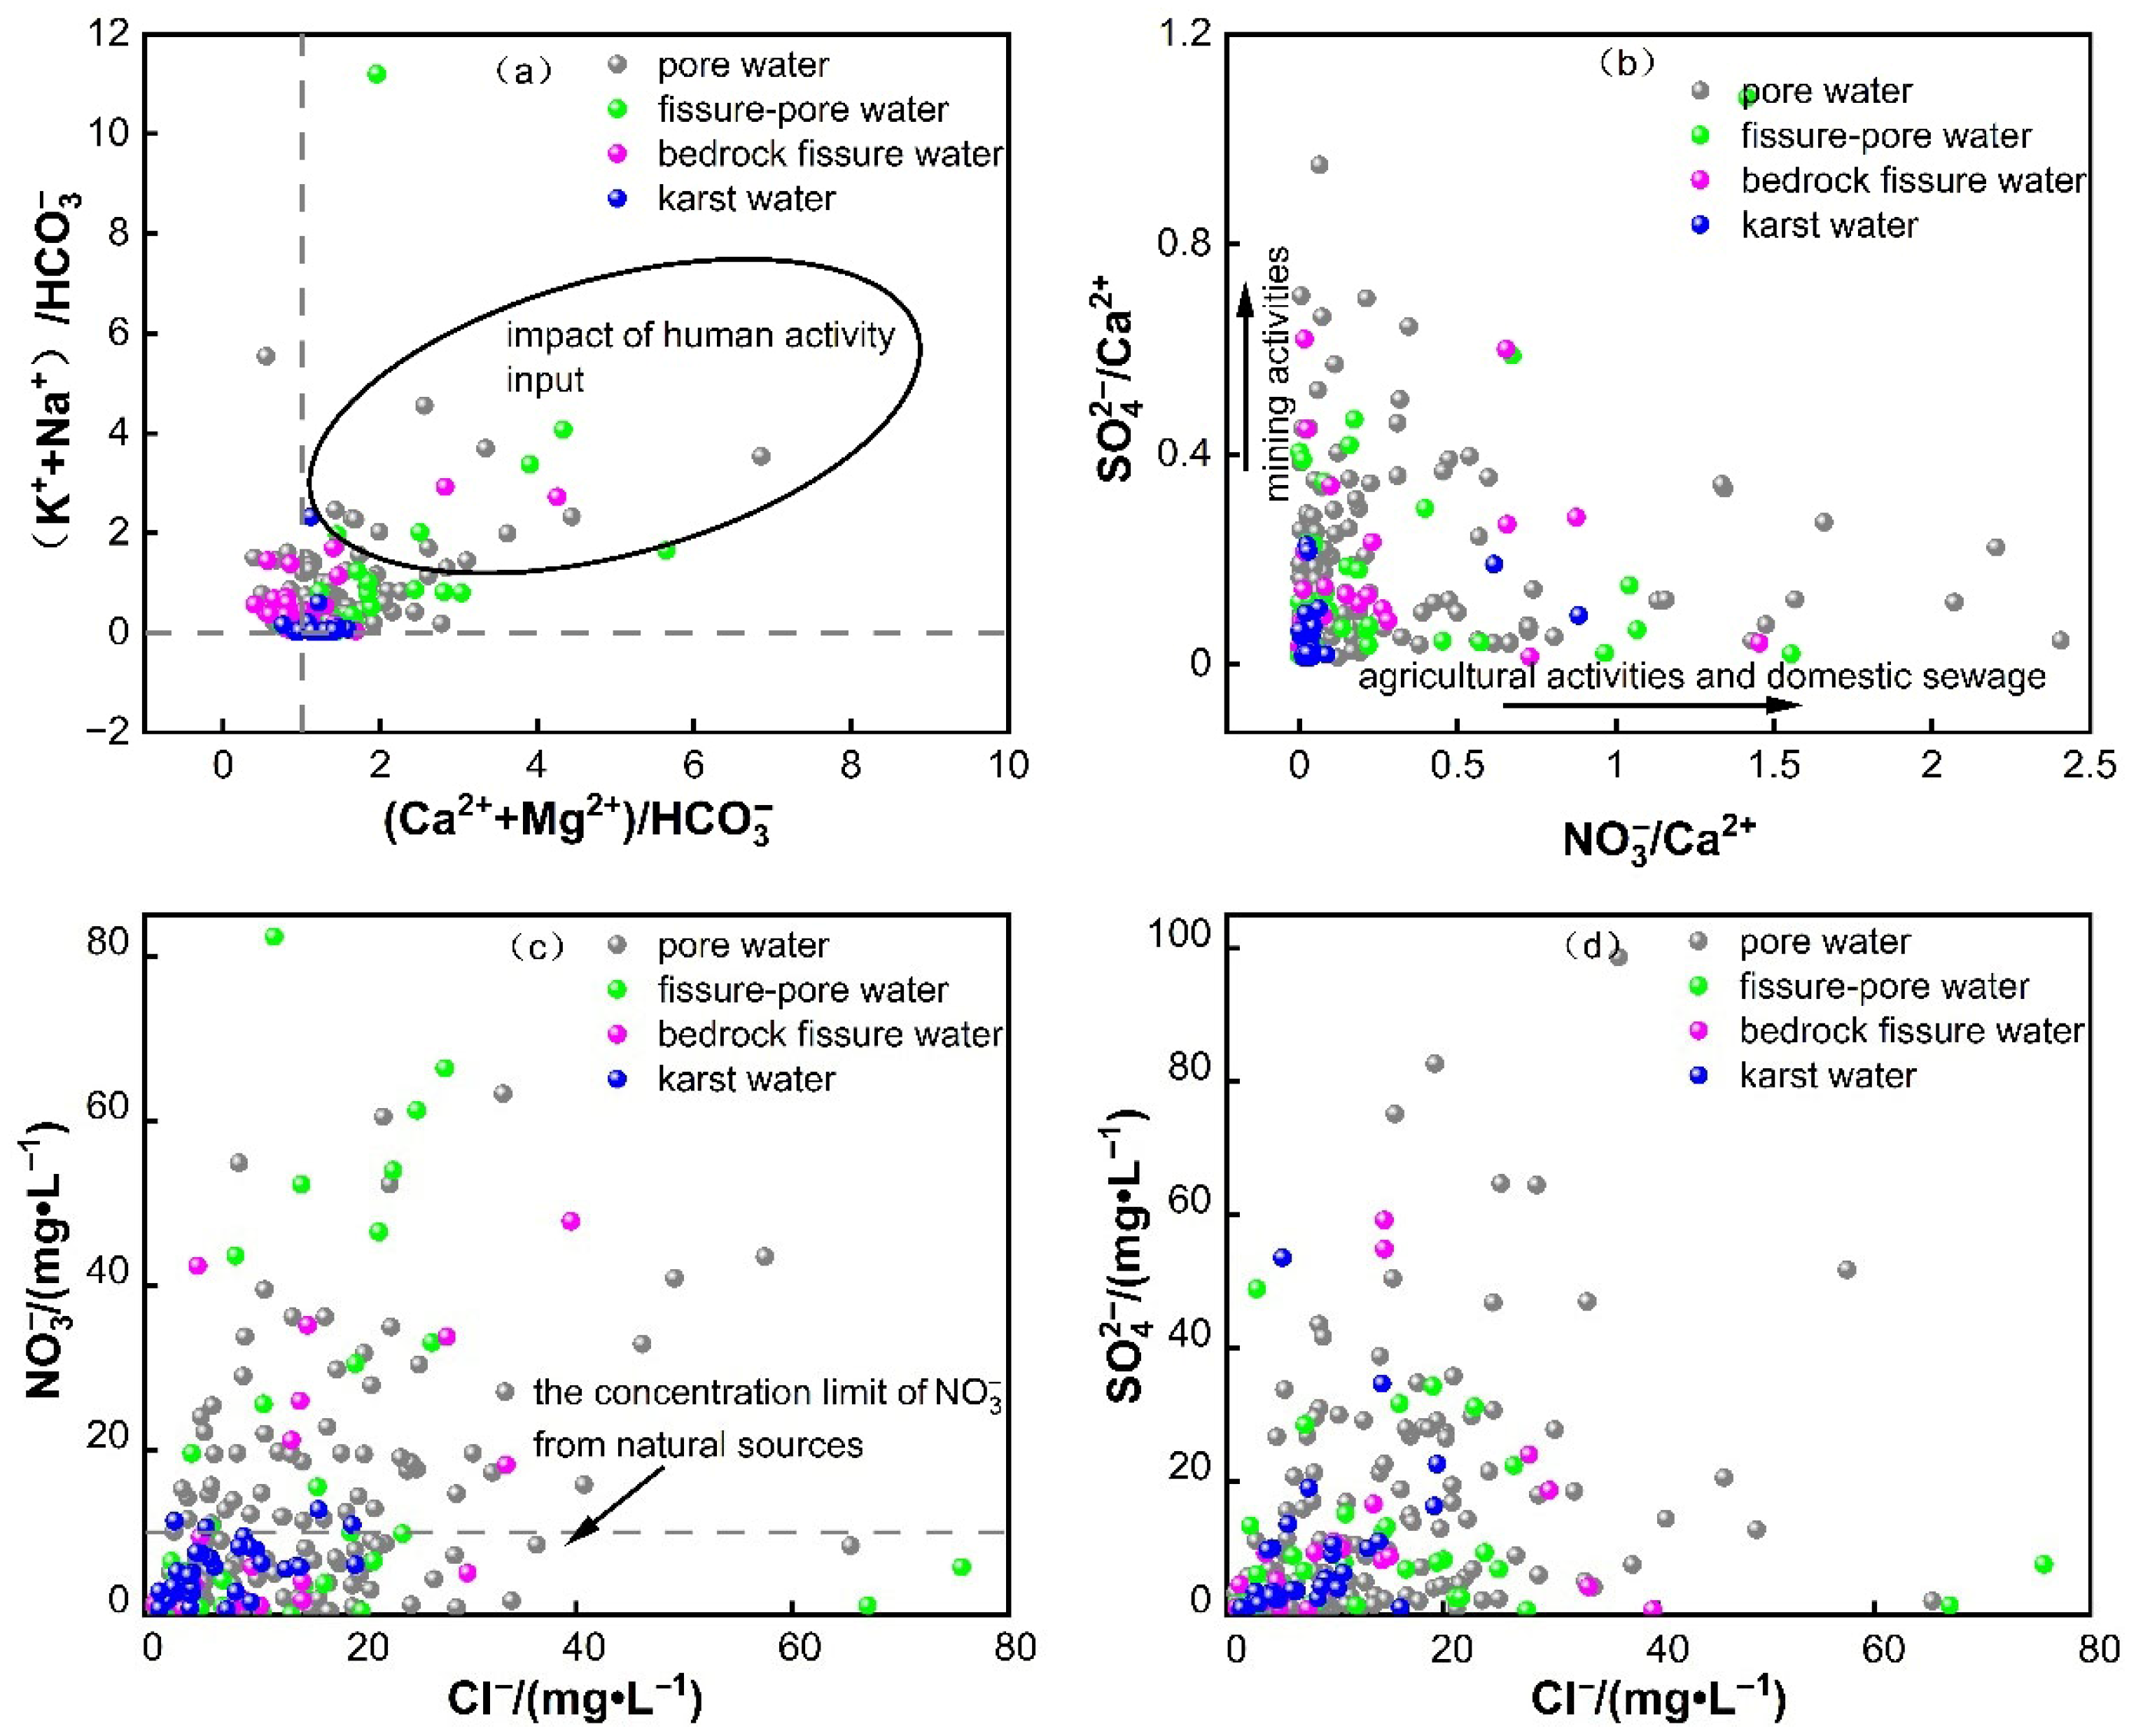
The influence of human activities on groundwater receives considerable attention. The relationship between (Ca2+ + Mg2+)/HCO3 and (K+ + Na+)/HCO3 can be used to determine the relative contributions of carbonate rocks, silicate rocks, and human activities [38]. The karst water samples were concentrated near the intersection of (Ca2+ + Mg2+)/HCO3 = 1 and (K+ + Na+)/HCO3 = 0 (Figure 8a), indicating that carbonate dissolution was a dominant process. The bedrock fissure water samples were generally located near the 45° line, suggesting that silicate dissolution was the main process. In addition, some pore water samples and red-bed fissure pore water samples fell in the area where both (Ca2+ + Mg2+) and (K+ + Na+) were greater than HCO3, indicating that they were affected by human activities. The degree of the influence of human activities on the groundwater chemical compositions can be judged by the relationship between SO42−/Ca2+ and NO3/Ca2+. The value of the SO42−/Ca2+ ratio represents the influence from industrial and mining activities, while the value of the NO3/Ca2+ ratio represents the influence from agricultural activities and domestic sewage [39,40]. Figure 8b shows that 61.28% of the water samples had a higher SO42−/Ca2+ ratio than the NO3/Ca2+ ratio, indicating an association with industrial and mining activities, which was related to the industrial activities in the study area. Meanwhile, 38.72% of the water samples had a higher NO3/Ca2+ ratio than the SO42−/Ca2+ ratio, suggesting that this groundwater was affected by agricultural activities and domestic sewage. In terms of the typical ion ratios, the karst water and bedrock fissure water samples were mainly located in the area near the intersection of SO42−/Ca2+ = 0 and NO3/Ca2+ = 0 with relatively small ratios, indicating that karst water and bedrock fissure water were less affected by human activities. A considerable number of pore water and red-bed fissure pore water sample points are distributed in the area with larger ratios, indicating that pore water and red-bed fissure pore water were susceptible to human-induced impact.
Recent studies confirm that dual-ion ratios are effective proxies for distinguishing geogenic from anthropogenic drivers of groundwater evolution. In a multi-aquifer system of Changhua River Basin, 61% of samples exhibited SO42−/Ca2+ > NO3/Ca2+, indicating that SO42−-rich industrial effluent and mining leachate dominate over agricultural nitrate inputs [37]. Conversely, 39% of samples with higher NO3/Ca2+ were attributed to fertilizer and sewage seepage, consistent with the seasonal NO3 pulses reported in the Hutuo River fan [29]. The clustering of karst and bedrock fissure waters near the origin of these ratio plots further supported their minimal exposure to surface-derived contaminants, whereas the elevated ratios in pore and red-bed fissure–pore waters aligned with the rapid infiltration of sulfate-bearing industrial effluents documented in the Muda River Basin [41]. Thus, the observed ion signatures not only reflected lithologically controlled weathering but also quantitatively fingerprinted the relative influence of industrial versus agricultural pollution sources in the study area. Notably, the spatial clustering of uncontaminated karst waters versus polluted pore waters underscores the method’s utility in source discrimination, quantifying the relative contributions of lithogenic weathering versus industrial/agricultural pollution. It also advances vulnerability assessment, which helps in identifying high-risk aquifers (e.g., fissure–pore systems) with rapid anthropogenic infiltration pathways.

3.3. Factor Analysis

To further explore the relative contributions of various factors to the chemical components in groundwater, factor analysis was conducted using SPSS software 10.0. Before performing the factor analysis, the KMO and Bartlett’s sphericity tests were carried out on the data. The test results showed that the KMO index of the groundwater samples was 0.812, which supported the applicability of factor analysis. Additionally, the significance level of Bartlett’s sphericity test reached 0.000, indicating significant correlations among the variables and further confirming the applicability of factor analysis.
By performing principal component analysis, the main factors were extracted from the chemical components of groundwater, and the cumulative variance contribution rates of these factors were calculated. The results indicated that the cumulative variance contribution rates of factors PC 1, PC 2, and PC 3 reached 97.28%, indicating that these three factors were enough to reflect the main factors influencing the chemical composition of groundwater in the study area. Therefore, SPSS software was used to calculate the scores of each principal factor, and the scores reflected the importance of the factor at the corresponding sampling point (Table 4).
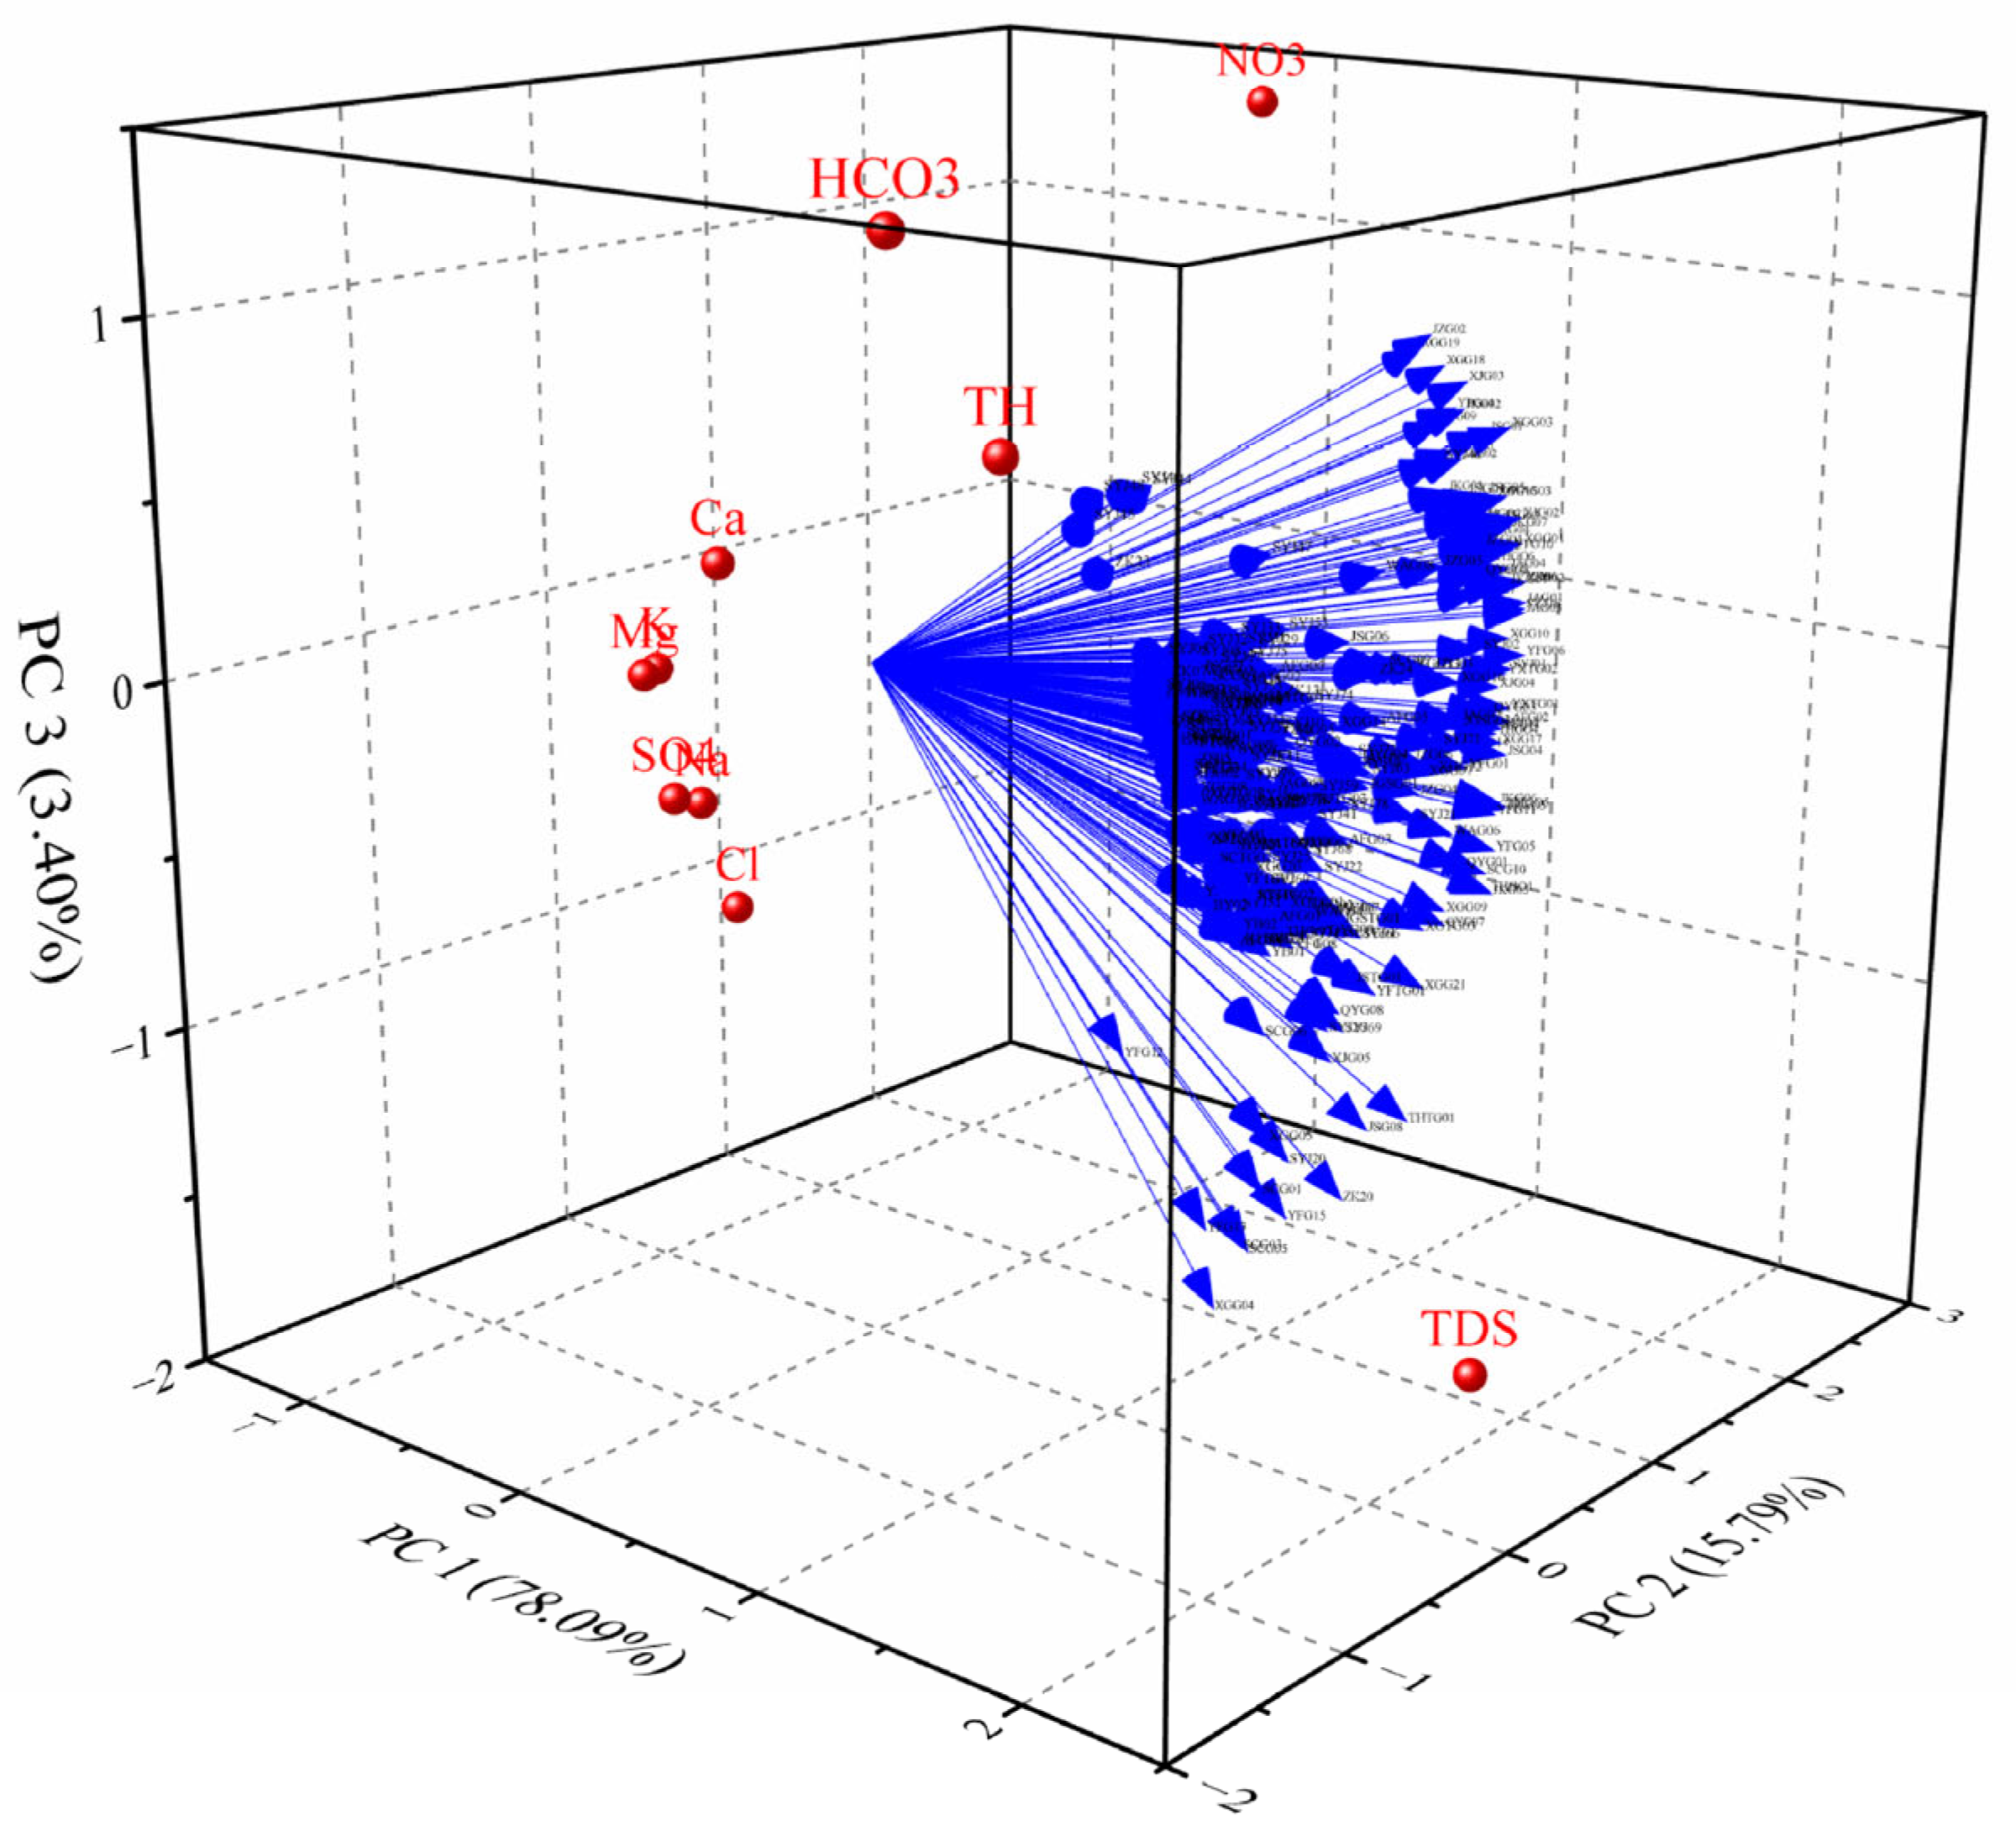
Factor PC1 explained 78.09% of the variance, and its main contributors included TDS, TH, and HCO3. Although the scores of the main ions were negative, correlation analysis showed that the correlation coefficients between TDS and Na+ + K+, Ca2+, Mg2+, SO42−, and Cl concentrations were 0.865 (p < 0.001), 0.900 (p < 0.001), 0.671 (p < 0.001), 0.700 (p < 0.001), and 0.511 (p < 0.005), respectively (Table 3). Moreover, the bi-coordinate plot of factor analysis scores and loadings showed that Na+, K+, Ca2+, Mg2+, SO42−, and Cl were relatively concentrated in space (Figure 9). This indicated that F1 mainly reflected the interaction between groundwater and rocks during its flow, representing a natural process. This interaction involves processes such as mineral dissolution and ion exchange, which are inherent to the geological setting and significantly shape the groundwater’s chemical composition. Understanding the dominance of PC1 highlights the importance of considering natural geochemical processes in water quality assessment and protection strategies. This knowledge can guide the sustainable utilization of groundwater resources by ensuring the natural equilibrium conditions are not disrupted by external effects.
The variance contribution rate of factor PC2 was 15.79%, and the high-scoring components were NO3 and TDS. Nitrate was an important indicator of groundwater pollution caused by human activities. A significant increase in NO3 concentration in groundwater was usually the result of human activities, including agricultural activities, industrial emissions, domestic sewage, and fossil fuel combustion. Relevant studies have shown that these activities not only increased the concentration of NO3 in groundwater, but often led to an increase in TDS [19,39,40]. Therefore, PC2 represented the influence of human activities on the chemical composition of groundwater. The identification of PC2 as an anthropogenic factor has significant implications for groundwater management. It underscores the need for targeted measures to mitigate human-induced pollution. Since NO3-serves as an indicator of anthropogenic impacts, implementing best management practices such as optimized fertilizer application and the establishment of buffer zones can help minimize the influence of agricultural practices. The variance contribution rate of PC3 was only 3.4%, and its influence on groundwater was negligible.
The factor analysis results highlighted the dual control mechanisms of groundwater chemistry documented in the study area. PC1’s dominant contribution (78.09%) from TDS, TH, and HCO3, coupled with clustered major ions, echoed findings by Saleh et al. [42], reporting that water–rock interaction drove ion accumulation through mineral dissolution, with HCO3 and divalent cations as key tracers of carbonate and silicate weathering. The significant correlations between TDS and major ions further validated this natural process, consistent with PCA results in arid region groundwater studies [43]. Association of PC2 with NO3 and TDS reflected anthropogenic interference, which was supported by Gu et al. [44], who reported that agricultural fertilization and domestic sewage increased both nitrate and TDS via leaching and infiltration. This was analogous to groundwater research by Raheja et al. [45], where nitrate-TDS co-enrichment served as a reliable indicator of human impact. The negligible influence of PC3 implied minor secondary processes, such as localized redox reactions or minor ion exchange, which might require further site-specific investigation. Overall, the findings underscore the need for integrated groundwater management strategies that address both natural hydrogeochemical backgrounds and human-induced contamination.
The spatial distribution of main factor scores reveals distinct patterns of the influences of human activities (F1) and natural processes (F2) on groundwater chemistry across the region (Figure 10). The contour map shows relatively uniform high scores for F1 across most central areas, indicating a widespread impact of human activities on groundwater. The scores were consistently above 1.0, with some areas reaching up to 2.0. This suggested that human activities, such as agricultural practices, industrial discharges, and urbanization, were significantly affecting groundwater throughout the region. The highest scores were observed in central areas, corresponding to densely populated or agriculturally intensive zones.
In contrast, scores for F2 exhibited a more heterogeneous spatial pattern. The scores ranged from negative to positive values, with a notable concentration of high positive scores in the east-central part of the region. This indicated that natural processes, such as geological formations, soil characteristics, and hydrological cycles, had a varied influence on groundwater. Indeed, areas with high F2 scores were characterized by specific geological features that enhance natural groundwater recharge or contain minerals that affect water chemistry. Conversely, areas with negative scores were influenced by factors that limit natural groundwater replenishment or alter its composition.
Overall, the maps underscore the importance of considering both human activities and natural processes when assessing the origin and quality of groundwater, as their influences vary spatially and can interact in complex ways.

3.4. Implication for Groundwater Sustainable Management

The hydrochemical and multivariate statistical analyses performed in this study offer critical insights for sustainable groundwater management, especially in regions where multi-aquifer systems are characterized by varying lithological and anthropogenic influences. As distinct hydrochemical signatures and degree of anthropogenic impacts have been observed in karst, bedrock fissure, porous, and red-bed fissure–pore groundwater, it is highly advised to propose aquifer-specific protection strategies.
For karst and bedrock fissure aquifers, preserving recharge zones and minimizing pollutants from direct infiltration (e.g., agricultural runoff) should be a top priority, due to their deep circulation and limited connectivity. For instance, in some mountainous regions of Europe, where karst aquifers are prevalent, local governments have implemented strict land-use planning around recharge areas [46,47]. These plans restrict agricultural activities that use large amounts of fertilizers and pesticides, and instead promote the planting of native vegetation to enhance natural filtration and reduce soil erosion.
The protection of porous and red-bed fissure–pore groundwater, characterized by elevated NO3 levels, requires strict land-use controls. Establishing buffer zones around wellfields and regulating fertilizer application have been proven effective in mitigating nitrate contamination. In the agricultural regions of the Midwest, buffer zones of a certain width are mandated around groundwater wellfields in the United States [48]. In these zones, the application of nitrogen-rich fertilizers close to the wells is strictly restricted. Moreover, farmers are provided with incentives to adopt precision agriculture techniques, which optimize fertilizer use and reduce the risk of excess nitrogen leaching into the groundwater.
Since changes in groundwater chemistry largely arise from natural processes (e.g., water–rock interactions), sustainable management should account for baseline geochemical signatures. On the other hand, the SO42−/Ca2+ and NO3/Ca2+ ratios could serve as proxies for anthropogenic interferences. Monitoring these ratios, combining traditional hydrochemical parameters, can act as early warnings of human-induced pollution trends in groundwater. Notwithstanding, to protect groundwater in multi-aquifer systems, policy and community engagement are always necessary. This includes enforcement of stricter regulations on human discharges in vulnerable aquifer zones, raising public awareness of reducing domestic wastewater infiltration, and adopting adaptive management frameworks that iteratively update protection measures based on long-term hydrochemical monitoring data.
Indeed, groundwater sustainable management policies have been implemented in different regions worldwide. The European Union’s Water Framework Directive (WFD) is a well-accepted policy aimed at protecting all water bodies, including groundwater. It requires member states to develop river basin management plans, which account for the specific characteristics of each river basin district, including the presence of multi-aquifer systems. The Danube River Basin, spanning multiple countries, is a good example. The WFD has led to the implementation of coordinated groundwater protection measures. Countries are working together to monitor groundwater quality, identify pollution sources, and develop strategies to reduce anthropogenic impacts. The Safe Drinking Water Act (SDWA) is a federal law in the United States. Drinking water quality has been regulated by setting standards for contaminants in groundwater, which requires public water systems to monitor and treat wastewater to meet these standards. Additionally, the law provides funding for states to develop and implement source water protection programs. These programs include developing measures such as land-use controls, best management practices for agriculture, and public education campaigns. Singapore has adopted an integrated water management approach. Under the framework of this approach, the country has implemented strict regulations on industrial water use and wastewater discharge. It has also conducted detailed hydrogeological studies to understand the characteristics of different aquifer systems. Based on these studies, it has developed policies to protect groundwater from contamination, such as restricting land-use activities in areas with high-quality groundwater resources.
Eventually, by coupling hydrogeological surveys with laboratory analyses, this study highlights the need for aquifer-specific, data-driven management to balance natural processes and anthropogenic pressures. This approach not only safeguards groundwater quality but also ensures long-term resource resilience in complex multi-aquifer settings. The global examples of groundwater sustainable management policies demonstrate that a combination of regulations, community engagement, and adaptive management frameworks can be effective in protecting groundwater resources.

4. Conclusions

Regional groundwater had distinct characteristics, with hydrochemical facies evolving differently across aquifer types due to varied geochemical processes and increasing anthropogenic impacts. Water type shifted from HCO3-Ca in karst and fissure–pore aquifers to HCO3-Na·Ca in porous and red-bed fissure–pore systems, reflecting a progressive increase in residence time, silicate weathering, and cation exchange. Carbonate weathering driven by carbonic acid governed karst water chemistry, whereas incongruent dissolution of Na-/K-bearing aluminosilicates dominated bedrock fissure water. Elevated SO42−/Ca2+ and NO3/Ca2+ ratios indicated additional proton sources from human activities. Forward cation exchange prevailed in porous media, whereas reverse exchange characterized karst conduits where clay-rich paleo-karst fills released adsorbed Na+ and K+. Principal component analysis showed that 78% of the total variance in groundwater chemistry was attributed to natural water–rock interaction and 16% to anthropogenic inputs. Karst and bedrock fissure aquifers exhibited negligible NO3 and low SO42−/Ca2+, confirming their relative immunity to surface contamination. However, pore and red-bed fissure–pore waters frequently exceeded 50 mg/L NO3 and displayed high SO42−/Ca2+, signifying high vulnerability to anthropogenic interferences. By integrating geochemical tracers with multivariate statistics, this study provided a robust framework for discriminating against natural evolution from anthropogenic perturbation, thereby guiding targeted groundwater-protection strategies in multi-aquifer systems. Actionable recommendations, including implementing aquifer-specific management strategies, establishing comprehensive monitoring and early warning systems, and formulating stricter environmental protection and integrated water resource management policies, should be highly encouraged, with an aim to guide targeted groundwater protection in multi-aquifer systems for sustainable resource use.

Author Contributions

C.X., B.X. and L.D.: writing—original draft, editing, visualization, and methodology. X.B.: investigation, data curation, formal analysis, and resources. X.W. and Y.X.: software and visualization. S.Y. and H.L.: writing—original draft, editing, conceptualization, data curation, investigation, supervision, and project administration. All authors have read and agreed to the published version of the manuscript.

Funding

This research was funded by the Preliminary Survey Project on Groundwater Environment in Ji’an City, grant number Z155110010004, and the Open Fund of the Nanchang Key Laboratory of Hydrogeology and High Quality Groundwater Resources Exploitation and Utilization, grant number 20251B201. The APC was funded by the Preliminary Survey Project on Groundwater Environment in Ji’an City.

Data Availability Statement

All discharge data are publicly available in the text.

Conflicts of Interest

Author Linming Dong was employed by the company Jiangxi Zhonghuan Geotechnical Engineering Investigation Institute Co., Ltd., and authors Ximing Bai and Shengpin Yu were employed by Jiangxi Institute of Survey & Design Ltd. The remaining authors declare that the research was conducted in the absence of any commercial or financial relationships that could be construed as a potential conflict of interest.

References

  1. UNESCO. Groundwater: Making the Invisible Visible. The United Nations World Water Development Report. 2022; 246p, Available online: https://unesdoc.unesco.org/ark:/48223/pf0000380721 (accessed on 15 October 2025).
  2. Wang, Y.X.; Deng, Y.M.; Zhang, J.W.; Yan, B.; Xiao, Z.Y.; Fan, R.Y.; Xie, X.J. Advances in groundwater quality and health studies: A comprehensive review. Sci. China Earth Sci. 2025, 68, 2753–2766. [Google Scholar] [CrossRef]
  3. Karandish, F.; Liu, S.; de Graaf, I. Global groundwater sustainability: A critical review of strategies and future pathways. J. Hydrol. 2025, 657, 133060. [Google Scholar] [CrossRef]
  4. Choubisa, S.L.; Choubisa, D.; Choubisa, A. Fluoride contamination of groundwater and its threat to health of villagers and their domestic animals and agriculture crops in rural Rajasthan, India. Environ. Geochem. Health 2023, 45, 607–628. [Google Scholar] [CrossRef] [PubMed]
  5. Udokpoh, U.U.; Ndem, U.A.; Abubakar, Z.S.; Yakasi, A.B.; Saleh, D. Comparative assessment of groundwater and surface water quality for domestic water supply in rural areas surrounding crude oil exploration facilities. J. Environ. Pollut. Hum. Health 2021, 9, 80–90. [Google Scholar] [CrossRef]
  6. Marwaha, N.; Kourakos, G.; Levintal, E.; Dahlke, H.E. Identifying agricultural managed aquifer recharge locations to benefit drinking water supply in rural communities. Water Res. Res. 2021, 57, e2020WR028811. [Google Scholar] [CrossRef]
  7. Feng, Y.; Kang, F.; Guo, Y.; Li, Z.; Liu, B.; Bu, H.; Xia, C.; He, Q. Evolution of hydrochemistry and water quality of karst groundwater under the effects of intense anthropogenic activities. J. Environ. Manag. 2024, 371, 123059. [Google Scholar] [CrossRef]
  8. Xu, P.; Bian, J.; Li, Y.; Wu, J.; Sun, X.; Wang, Y. Characteristics of fluoride migration and enrichment in groundwater under the influence of natural background and anthropogenic activities. Environ. Pollut. 2022, 314, 120208. [Google Scholar] [CrossRef]
  9. Liao, F.; Wang, G.; Shi, Z.; Huang, X.; Xu, F.; Xu, Q.; Guo, L. Distributions, sources, and species of heavy metals/trace elements in shallow groundwater around the Poyang Lake, East China. Expo. Health 2018, 10, 211–227. [Google Scholar] [CrossRef]
  10. Zhao, X.; Xiao, P.; Song, W.; Li, Y.; Liu, Q. Hydrochemical characteristics and genetic analysis of groundwater in the red bed area of southern Jiangxi Province. Sci. Technol. Eng. 2023, 23, 14112–14122, (In Chinese with English abstract). [Google Scholar]
  11. Mao, H.; Wang, G.; Liao, F.; Shi, Z.; Huang, X.; Li, B.; Yan, X. Geochemical evolution of groundwater under the influence of human activities: A case study in the southwest of Poyang Lake Basin. Appl. Geochem. 2022, 140, 105299. [Google Scholar] [CrossRef]
  12. Yang, H.; Hou, B.; Ye, L.; Xu, S.; Xin, H.; Zhang, S. Groundwater chemical evolution characteristics and human health risk assessment in Shicheng County, Jiangxi Province. Environ. Sci. Pollut. Res. 2024, 31, 37337–37355. [Google Scholar] [CrossRef]
  13. Yu, S.; Wang, T.; Bai, X.; Chen, G.; Wan, P.; Chen, S.; Chen, Q.; Wan, H.; Deng, F. Hydrochemical characteristics and formation mechanisms of groundwater in the Nanmiao emergency groundwater source area, Yichun, western Jiangxi, China. Water 2025, 17, 2063. [Google Scholar] [CrossRef]
  14. Lubang, J.; Liu, H.; Chen, R. Combined application of hydrogeological and geoelectrical study in groundwater exploration in karst-granite areas, Jiangxi Province. Water 2023, 15, 865. [Google Scholar] [CrossRef]
  15. Hao, X.; Wang, D.; Wang, P.; Wang, Y.; Zhou, D. Evaluation of water quality in surface water and shallow groundwater: A case study of a rare earth mining area in southern Jiangxi Province, China. Environ. Monit. Assess. 2016, 188, 24. [Google Scholar] [CrossRef] [PubMed]
  16. Liu, H.Y.; Guo, H.M.; Pourret, O.; Wang, Z.; Liu, M.H.; Zhang, W.M.; Li, Z.B.; Gao, B.; Sun, Z.X.; Laine, P. Geochemical signatures of rare earth elements and yttrium exploited by acid solution mining around an ion-adsorption type deposit: Role of source control and potential for recovery. Sci. Total Environ. 2022, 804, 150241. [Google Scholar] [CrossRef]
  17. Zheng, W.; Guo, X.; Zhao, L.; Wang, J. Characteristics and influencing factors of karst groundwater in southern Jiangxi in Poyang Lake Basin. Shaanxi Water Res. 2023, 2, 97–100, (In Chinese with English abstract). [Google Scholar]
  18. Li, Y.T.; Wang, H.; Hu, H.J.; Fang, Y.H. Analysis of climate change characteristics in Ji’an City from 1960 to 2020. South-Central Agric. Sci. Technol. 2024, 45, 120–124. (In Chinese) [Google Scholar]
  19. Xie, X.D.; Gu, Y.Y.; Lin, T.H. Regional Hydrogeological Survey Report of Ji’an Area; Unpublished Report; Hydrogeological Team of Jiangxi Geological Bureau: Nanchang, China, 1981. (In Chinese) [Google Scholar]
  20. Appelo, C.A.J.; Postma, D. Geochemistry, Groundwater and Pollution, 2nd ed.; A.A. Balkema: Leiden, The Netherlands, 2005; ISBN 9780415364287. [Google Scholar]
  21. Edmunds, W.M.; Shand, P. Natural Groundwater Quality; Blackwell Publishing: Oxford, UK, 2008; pp. 1–20. ISBN 9781405156752. [Google Scholar]
  22. Guo, J.; Zhou, X.; Zhang, Y.; Ta, M.; Wang, Y. Occurrence and hydrochemical characteristics of saline and salty springs in the Sichuan Basin of China. Geofluids 2019, 2019, 8671973. [Google Scholar] [CrossRef]
  23. O Dochartaigh, B.E.; MacDonald, A.M.; Fitzsimons, V.; Ward, R. Scotland’s Aquifers and Groundwater Bodies; British Geological Survey: Nottingham, UK, 2015; 63p. [Google Scholar]
  24. Foster, S.S.D.; Chilton, P.J. Groundwater: The processes and global significance of aquifer degradation. Phil. Trans. R. Soc. B. 2003, 358, 1957–1972. [Google Scholar] [CrossRef]
  25. Mao, H.; Wang, G.; Liao, F.; Shi, Z.; Rao, Z.; Zhang, H.; Qiao, Z.; Bai, Y.; Chen, X.; Yan, X.; et al. Spatiotemporal variation of groundwater nitrate concentration controlled by groundwater flow in a large basin: Evidence from multi-isotopes (15N, 11B, 18O, and 2H). Water Resour. Res. 2024, 60, e2023WR035299. [Google Scholar] [CrossRef]
  26. Zhang, L.; Wang, G.; Liu, B.; Sun, F.; Wang, R. Experimental investigation of the fracture evolution and fracture criterion of jointed sandstone subject to dry-wet cycling. Bull. Eng. Geol. Environ. 2023, 82, 101. [Google Scholar] [CrossRef]
  27. Wang, G.L.; Zhang, T.Y.; Zhang, L. The law of strength damage and deterioration of jointed sandstone after dry-wet cycles. J. Mt. Sci. 2023, 20, 1170–1182. [Google Scholar] [CrossRef]
  28. Ran, G.; Chen, J.; Zhang, Z.; Zeng, Y.; Yin, C.; Yu, J.; Wu, D.; Yuan, H.; Cen, M. Cyanobacterial dominance under CO2(aq)-limited conditions increases ecological risks in karst reservoirs. Water Res. 2025, 285, 124060. [Google Scholar] [CrossRef] [PubMed]
  29. Huang, K.; Dai, Z.; Meng, Y.; Yu, F.; Yao, J.; Zhang, W.; Chi, Z.; Chen, S. Mechanical behavior and fracture mechanism of red-bed mudstone under varied dry-wet cycling and prefabricated fracture planes with different loading angles. Theor. Appl. Fract. Mech. 2023, 127, 104094. [Google Scholar] [CrossRef]
  30. Gibbs, R.J. Mechanisms controlling world water chemistry. Science 1970, 170, 1088–1090. [Google Scholar] [CrossRef]
  31. Liang, H.T.; Wang, W.; Li, J.L.; Fang, Y.H. Hydrochemical characteristics and health risk assessment of groundwater in Dingbian county of the Chinese Loess Plateau, northwest China. Environ. Earth Sci. 2022, 81, 319. [Google Scholar] [CrossRef]
  32. Zhang, Y.; Liu, J.; Zhang, Y. Hydrochemical evolution of shallow and deep groundwater in Tongchuan city, China. J. Coastal Res. 2015, 73, 436–442. [Google Scholar] [CrossRef]
  33. Li, S.; Xu, Z.; Wang, H.; Zhang, Q. Geochemistry of the upper Han River basin, China: 3: Anthropogenic inputs and chemical weathering to the dissolved load. Chem. Geol. 2009, 264, 89–95. [Google Scholar] [CrossRef]
  34. Lin, M.L.; Peng, W.H.; Gui, H.R. Hydrochemical characteristics and quality assessment of deep groundwater from the coal-bearing aquifer of the Linhuan Coal-mining District, northern Anhui Province, China. Environ. Monit. Assess. 2016, 188, 202. [Google Scholar] [CrossRef]
  35. Barzegar, R.; Moghaddam, A.A.; Tziritis, E.; Fakhri, M.S.; Soltani, S. Identification of hydrogeochemical processes and pollution sources of groundwater resources in the Marand Plain, northwest of Iran. Environ. Earth Sci. 2017, 76, 297. [Google Scholar] [CrossRef]
  36. Wang, Y.; Liu, J.; Li, S.; Chen, J.; Li, Y. Origin and hydrochemical evolution of confined groundwater in Shanghai, China. Front. Earth Sci. 2024, 11, 1117132. [Google Scholar] [CrossRef]
  37. Wang, D.; Zhang, L.; Pei, L.; Li, X.; Yang, Y.; Chen, Z.; Liang, L. Chemical characteristics and controlling factors of shallow groundwater in the lower reaches of Changhua River basin, Hainan Island, China. Water 2023, 15, 3508. [Google Scholar] [CrossRef]
  38. Houatmia, F.; Azouzi, R.; Charef, A.; Bédir, M. Assessment of groundwater quality for irrigation and drinking purposes and identification of hydrogeochemical mechanisms evolution in Northeastern, Tunisia. Environ. Earth Sci. 2016, 75, 746. [Google Scholar] [CrossRef]
  39. Liu, H.; Zhang, G.; Guo, H.; Wang, Z.; Ge, Q. Occurrences of nitrate-contaminated groundwater in the piedmont aquifers: Hydrogeochemical characteristics and health risks. Environ. Geochem. Health 2024, 46, 366. [Google Scholar] [CrossRef] [PubMed]
  40. Wang, S.Q.; Wei, S.C.; Liang, H.Y.; Zheng, W.B.; Li, X.X.; Hu, C.S.; Currell, M.J.; Zhou, F.; Min, L.L. Nitrogen stock and leaching rates in a thick vadose zone below areas of long-term nitrogen fertilizer application in the North China Plain: A future groundwater quality threat. J. Hydrol. 2019, 576, 28–40. [Google Scholar] [CrossRef]
  41. Zazouli, M.A.; Yousefi, Z.; Babanezhad, E.; Ala, A. Evaluation of combined efficiency of conventional coagulation-flocculation process with advanced oxidation process (sulfate-hydroxyl radical) in leachate treatment. Environ. Eng. Res. 2024, 29, 230548. [Google Scholar] [CrossRef]
  42. Saleh, A.; Gad, A.; Ahmed, A.; Arman, H.; Farhat, H.I. Groundwater hydrochemical characteristics and water quality in Egypt’s central eastern desert. Water 2023, 15, 971. [Google Scholar] [CrossRef]
  43. Amer, R.; Ripperdan, R.; Wang, T.; Encarnación, J. Groundwater quality and management in arid and semi-arid regions: Case study, Central Eastern Desert of Egypt. J. Afr. Earth Sci. 2012, 69, 13–25. [Google Scholar] [CrossRef]
  44. Gu, X.; Xiao, Y.; Yin, S.; Pan, X.; Niu, Y.; Shao, J.; Cui, Y.; Zhang, Q.; Hao, Q. Natural and anthropogenic factors affecting the shallow groundwater quality in a typical irrigation area with reclaimed water, North China Plain. Environ. Monit. Assess. 2017, 189, 514. [Google Scholar] [CrossRef]
  45. Raheja, H.; Goel, A.; Pal, M. Groundwater quality appraisal using IWQI and PCA for irrigation uses. ISH J. Hydraul. Eng. 2023, 29 (Suppl. 1), 264–273. [Google Scholar] [CrossRef]
  46. Huneau, F.; Jaunat, J.; Kavouri, K.; Plagnes, V.; Rey, F.; Dörfliger, N. Intrinsic vulnerability mapping for small mountainous karst aquifers, implementation of the new PaPRIKa method to Western Pyrenees (France). Eng. Geol. 2013, 161, 81–93. [Google Scholar] [CrossRef]
  47. Pochon, A.; Tripet, J.P.; Kozel, R.; Meylan, B.; Sinreich, M.; Zwahlen, F. Groundwater protection in fractured media: A vulnerability-based approach for delineating protection zones in Switzerland. Hydrogeol. J. 2008, 16, 1267–1281. [Google Scholar] [CrossRef]
  48. Stoker, P.; Albrecht, T.; Follingstad, G.; Carlson, E. Integrating land use planning and water management in US cities: A literature review. J. Am. Water Resour. Assoc. 2022, 58, 321–335. [Google Scholar] [CrossRef]
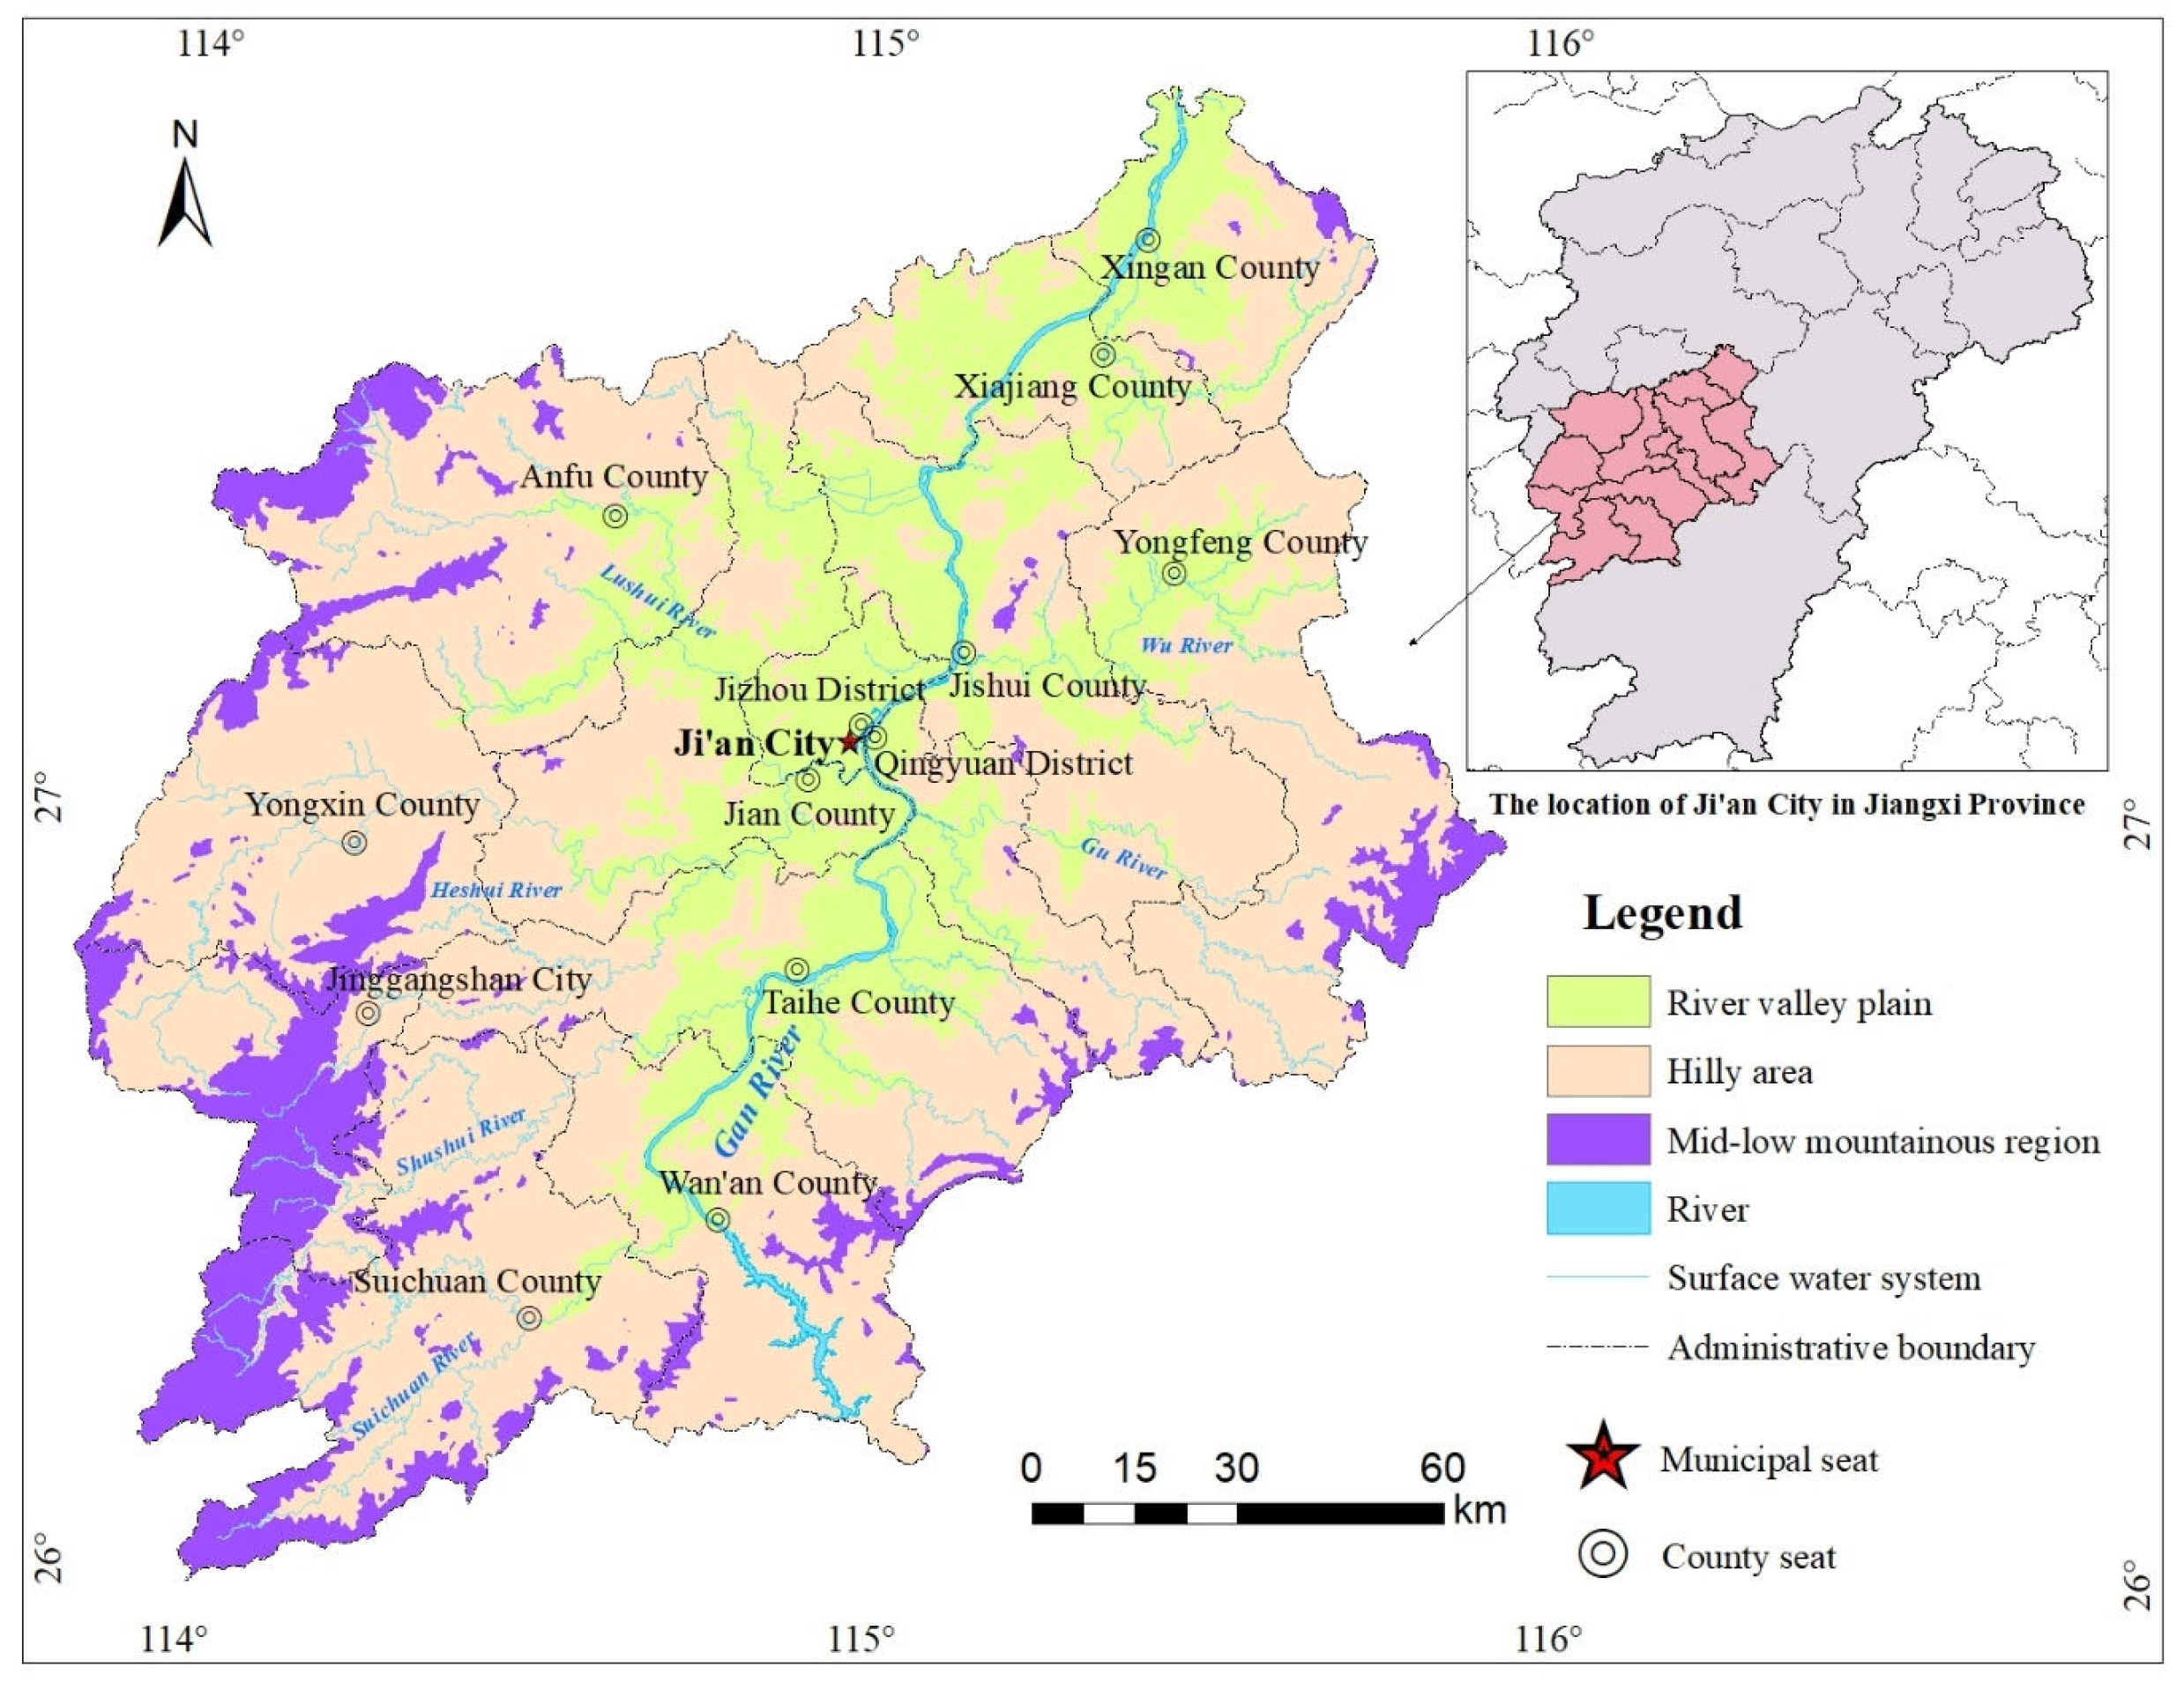
Figure 1. Geographic location and landforms of the study area.
Sustainability 17 10306 g001
Figure 2. Hydrogeology of the study area and groundwater sampling locations.
Sustainability 17 10306 g002
Figure 3. Piper plot for groundwater.
Sustainability 17 10306 g003
Figure 4. Gibbs diagram for groundwater.
Sustainability 17 10306 g004
Figure 5. Molar ratios of Ca2+/Na+, HCO3/Na+, and Mg2+/Na+ in groundwater.
Sustainability 17 10306 g005
Figure 6. Typical ion ratios for groundwater ((a): Na+ vs. Cl; (b): K+ + Na+ vs. Cl; (c): Ca2+ + Mg2+ vs. HCO3 + SO42−; (d): (Ca2+ + Mg2+)/HCO3 vs. SO42−/HCO3).
Sustainability 17 10306 g006
Figure 7. Cation exchange diagram for groundwater ((a): Ca+ + Mg2+ − HCO3 − SO42− vs. K+ + Na+ − Cl; (b): CIA-1 vs. CIA-2).
Sustainability 17 10306 g007
Figure 8. Typical ion ratios in groundwater ((a): (K+ + Na+)/HCO3 vs. (Ca2+ + Mg2+)/HCO3; (b): SO42−/Ca2+ vs. NO3/Ca2+; (c): NO3 vs. Cl; (d): SO42− vs. Cl).
Sustainability 17 10306 g008
Figure 9. The score and load bi-coordinate diagram of factor analysis of groundwater components in the study area.
Sustainability 17 10306 g009
Figure 10. Distribution map of main factor scores ((a): F1; (b): F2; (c): F3).
Sustainability 17 10306 g010
Table 1. Statistics of groundwater main parameters.
Category pHConcentration (mg/L)
K+Na+Ca2+Mg2+SO42−NO3ClHCO3THTDS
pore water
(n = 133)
Max.8.5088.3080.60146.0052.0098.70320.0081.00446.00449.00820.00
Min.4.700.230.671.170.500.330.090.830.556.3020.00
Avg.6.667.4510.8738.956.3715.3215.4114.90114.35122.60180.03
Std.0.7412.679.8233.477.0718.4530.4713.0199.34100.82119.75
Vc.0.111.700.900.861.111.201.980.870.870.820.67
fissure–pore water
(n = 44)
Max.8.1039.70597.00737.00202.001427.0082.40762.00399.001868.03282.0
Min.5.200.320.594.620.460.650.040.911.4216.0027.00
Avg.6.845.6041.7968.3813.9052.4516.2873.07109.30204.60329.66
Std.0.737.29104.91120.2732.04214.4422.60170.6891.53316.85562.81
Vc.0.111.302.511.762.304.091.392.340.841.551.71
karst water
(n = 33)
Max.8.2023.4013.30132.0031.4053.6012.8019.50447.00405.00432.00
Min.6.600.220.561.490.310.680.601.345.005.5013.00
Avg.7.352.542.9365.4210.118.505.547.41197.79206.46202.48
Std.0.405.452.8527.927.6410.953.245.0087.8982.9288.26
Vc.0.052.140.970.430.761.290.590.670.440.400.44
bedrock fissure water
(n = 25)
Max.7.5032.7041.70108.0017.0059.2047.8039.50265.00301.00296.00
Min.5.400.430.562.830.700.710.100.9416.0011.2022.00
Avg.6.686.7111.2326.014.4710.4610.7211.2189.6887.88139.92
Std.0.548.678.8926.553.7915.3114.7910.8163.9278.4278.73
Vc.0.081.290.791.020.851.461.380.960.710.890.56
Table 2. Groundwater main hydrochemical types and their percentage.
Pore WaterFissure–Pore WaterKarst WaterBedrock Fissure Water
Water TypePercentageWater TypePercentageWater TypePercentageWater TypePercentage
HCO3-Ca34.59%HCO3-Ca38.64%HCO3-Ca69.70%HCO3-Na·Ca40%
HCO3·Cl-Na·Ca19.55%HCO3-Na·Ca11.36%HCO3-Ca·Mg24.24%HCO3-Ca16%
HCO3-Na·Ca11.28%HCO3·Cl-Na·Ca9.09%HCO3·Cl-Na·Ca6.06%HCO3·Cl-Na·Ca12%
HCO3-Ca·Mg6.77%HCO3·Cl-Ca9.09% HCO3-Ca·Mg12%
HCO3·Cl-Ca6.77%Cl-Na·Ca9.09%
Table 3. Correlation matrix of main ions, TH, and TDS in groundwater.
K+Na+Ca2+Mg2+SO42−NO3ClHCO3THTDS
K+10.623 *0.172 *0.251 *0.491 *0.324 *0.546 *0.0810.184 *0.351 *
Na+0.623 *10.1040.220 *0.423 *0.341 *0.657 *0.0150.129 **0.366 *
Ca2+0.172 *0.10410.759 *0.628 *−0.0390.324 *0.899 *0.983 *0.891 *
Mg2+0.251 *0.220 *0.759 *10.578 *0.0120.408 *0.687 *0.826 *0.752 *
SO42−0.491 *0.423 *0.628 *0.578 *10.0940.517 *0.514 *0.639 *0.728 *
NO30.324 *0.341 *−0.0390.0120.09410.481 *−0.226−0.0380.105
Cl0.546 *0.657 *0.324 *0.408 *0.517 *0.481 *10.1100.338 *0.491 *
HCO30.0810.0150.899 *0.687 *0.514 *−0.226 *0.11010.908 *0.801 *
TH0.184 *0.129 **0.983 *0.826 *0.639 *−0.0380.338 *0.908 *10.902 *
TDS0.351 *0.366 *0.891 *0.752 *0.728 *0.1050.491 *0.801 *0.902 *1
Note: * indicates significance at the 0.01 level; ** indicates significance at the 0.05 level.
Table 4. Matrix of factor analysis indicator score of groundwater components.
ParameterPC1PC2PC3
78.09%15.79%3.40%
K+−0.823−0.180−0.114
Na+−0.729−0.060−0.519
Ca2+−0.313−0.4550.297
Mg2+−0.818−0.262−0.122
SO42−−0.712−0.235−0.476
NO3-0.0052.4731.394
Cl−0.6540.044−0.841
HCO3-0.989−1.2381.384
TH1.057−0.7430.787
TDS1.9990.656−1.789
Disclaimer/Publisher’s Note: The statements, opinions and data contained in all publications are solely those of the individual author(s) and contributor(s) and not of MDPI and/or the editor(s). MDPI and/or the editor(s) disclaim responsibility for any injury to people or property resulting from any ideas, methods, instructions or products referred to in the content.