Article

Developing a Capacity Model for Roundabouts Using SIDRA Calibrated via Simulation-Based Optimization

1
The Graduate School of Natural and Applied Sciences, Pamukkale University, Denizli 20160, Turkey
2
Department of Civil Engineering, Faculty of Engineering, Pamukkale University, Denizli 20160, Turkey
*
Author to whom correspondence should be addressed.
Sustainability 2025, 17(22), 10289; https://doi.org/10.3390/su172210289
Submission received: 16 October 2025 / Revised: 13 November 2025 / Accepted: 14 November 2025 / Published: 17 November 2025

Abstract

Various intersection structures are utilized in city-wide traffic network infrastructure by local transportation authorities to handle the exponentially increasing traffic loads in developing countries. In this regard, numerous studies have considered the notable positive contribution of the modern roundabouts in intersection performance as a prominent method utilized widely in our contemporary world. Properly designed roundabouts are vital components of sustainable transportation planning, as they significantly influence traffic efficiency, safety, and environmental performance. Accurate estimation of roundabout capacity is essential to ensure that they can accommodate anticipated traffic volumes without causing congestion, thereby contributing to energy efficiency and reducing emissions. Moreover, sustainable roundabout design supports the development of safer and more inclusive transportation networks by improving accessibility for all road users, thus strengthening the overall sustainability of urban mobility. The SIDRA (version 8.0), a traffic simulation software, is frequently employed in performance analysis and determining the effects of possible outcomes of different scenarios of roundabouts in today’s world. On the other hand, driver behaviors are found to play a significant role in software performance during the analysis process of roundabout capacity and performance. Therefore, in order to optimize the environmental factor (EF) representing driver behaviors in the SIDRA software, a Differential Evolution Algorithm-Based Bi-Level Calibration Model (DEBCAM) was introduced. Observation data collected from eight different modern-structured roundabouts through drones were run into the SIDRA simulation software; the average delays obtained were employed to estimate optimum EF values through DEBCAM. Observed average delay values were taken into consideration with respect to the delay values obtained as a result of the SIDRA calibration by using the GEH statistics. GEH values indicate the consistency of vehicle delay data obtained via the DEBCAM with observed data. Acquired results clearly suggest that the SIDRA software needs to be calibrated so that it can represent drivers’ behaviors. After determination of the optimum values of the EF parameter for calibration of the SIDRA software, the regression analysis was conducted through the Partial Least Squares (PLS) method. As a result of the analysis, a capacity estimation model was developed, which displayed a significant conformity with the SIDRA capacity estimation results. Our findings suggested that the parameter requirement for the roundabout capacity estimation can be decreased by employing the appropriate EF value for the roundabout that needs to be analyzed.

1. Introduction

In developing countries, an increasing population accompanied by economic growth and fast-paced urbanization has multiplied the demand for transportation. When it fails to manage such transportation demand accurately, it results in a number of consequences, such as increasing traffic delays at city intersections and the release of vehicle-borne emissions. Local administrations strive to develop short- and long-sighted strategies against these adverse consequences experienced regarding in-city intersections, or at least minimize their impact. As is widely known, the effect of the intersection management method on its performance has long been studied in the literature. The positive effect of roundabouts, one of the popular intersection management methods, on intersection performance has been reported by numerous studies so far [1,2,3]. As reported, various geometrical characteristics of roundabouts, such as central island diameter, width of rotational platform, entry/exit angles, and their widths, play a substantial role in intersection capacity [4]. On the other hand, driver behaviors are also found to be remarkably effective on roundabout capacities [5]. Currently, in the literature, fundamental roundabout capacity estimation models differ from empirical models, gap models, and microscopic simulation models [6]. In specific, microscopic simulation models have frequently been employed in recent periods, in which driver behavior parameters are required to be calibrated so as to obtain the most realistic results from the simulation model [7,8].
In the literature, studies on roundabouts have mostly started to be concerned with capacity estimation models. For instance, Al-Masaeid and Faddah [9] utilized empirical models in their capacity estimation model and compared their results with different findings of their peers in the literature. Authors conclude their estimation models display similar results to those published. Hagring et al. [10] aim to develop a capacity estimation model for multi-lane roundabouts in their study. Researchers suggest a capacity estimation model based on critical data assumptions for dual-lane roundabouts by using data on critical gaps, follow-up periods, and delays. As a result of their analyses, they report a significant effect of estimation errors in capacity estimation on delay and service level. Tanyel [11] studies the effect of heavy-vehicle percentage in main traffic on the side-road capacity at four roundabout intersections. The author reports that heavy-vehicle drivers’ acceptance intervals and reactions of other drivers are almost the same. Moreover, for such intersections, dimensions and travel times of heavy vehicles are reported to be significantly effective on intersection capacity. Cheng et al. [12] conduct analyses on roundabouts in China for their critical interval value. To that end, authors investigate accepted or refused cumulative critical interval values for different days and hours. Their findings suggest that the critical interval value assumed for peak hours is less than that for periods other than the peak hours. Tanyel and Yayla [13] compare the performances of the critical gap assumption, one on roundabout intersection capacity estimation methods, and another on regression analysis methods, by using the data from the four different intersections. The authors report that both methods yield acceptable results.
On the other hand, Yin and Qiu [14] utilize simulation software of Verkehr In Staedten SIMulation (VISSIM) Version 7 and Signalized Intersection Design and Research Aid (SIDRA) to reveal the impacts of performance parameters of control delay and queue length on roundabout performance. The authors report that VISSIM and SIDRA software yield similar results against the changing factors. Moreover, they underline the need for calibration for both software utilized in their study. In an attempt to determine the effect of the flows on roundabout capacity, Wang and Yang [15] used data captured from 21 different roundabouts in their study, relying on the acceptance of the critical gap to develop a capacity estimation model, which was constructed on the relationship between the flows turning to the left and going straight. Shi et al. [16], by employing methods of conjunction theory, critical gap assumption, and regression analysis, suggest a capacity model based on the relationship between roundabout diameter and critical gap values for single- and multiple-lane roundabouts. Chen and Lee [17] consider multi-lane roundabouts in their study, in which they emphasize deficiencies in the determination of reference values of delay and capacity parameters. In order to eliminate this deficiency, analyses were conducted by running delay and queue-length data through simulation software, and the results portrayed a different picture from the data collected from the field. Macioszek and Akçelik [18] aim to compare two different capacity estimation models for roundabouts by using SIDRA software. In this regard, the authors calibrated the SIDRA software in a way that it could accurately reflect the conditions of the country having the intersections to be analyzed. Fang and Castenada [19], by using parameters collected through field observation of four different roundabouts, such as queue length and travel time, aim to calibrate VISSIM software. Stanimirovic et al. [20] analyze critical gap and follow-up distance variables at four different roundabouts for frequent and non-frequent drivers in Bosnia and Herzegovina. Researchers put emphasis on the fact that intersection capacity is correlated with driver behavior, and non-frequent drivers decrease intersection capacity. Karunarathne et al. [21] aim to develop a capacity estimation model for roundabout intersections in Sri Lanka. Nevertheless, the authors report that current capacity estimation models do not meet the needs of the analysis since 50% of the vehicle composition is composed of light vehicles in the study territory. Accordingly, they follow the path of making amendments on the passenger car unit value of the SIDRA software to create an equivalent parameter to move on to developing their capacity estimation model. Consequently, owing to these adjustments, researchers report results in conformity with the real roundabout conditions. Macioszek [22] analyzes roundabouts in Japan by employing the capacity estimation model developed according to the conditions of single-lane roundabouts in Poland. The researcher’s results indicate that the method developed for the conditions in Poland is in conformity with the conditions in Japan. Shaaban et al. [23] emphasize the significance of the critical gap parameter for roundabouts. The critical gap value is estimated for roundabouts of various types in Qatar; driver characteristics were determined. Additionally, drivers are reported to display aggressive driver behavior as a result of the analysis on the basis of the accepted critical gap value. Anagnostopoulos et al. [24] investigate the effects of geometric properties of roundabouts and driver behaviors on capacity estimations. Moreover, the researchers estimate the roundabout capacity by using an artificial neural network method. Pratelli and Broccini [25] mention the concept of capacity for a two-geometry roundabout. In order to estimate the capacity of the mentioned roundabout, different capacity estimation models, such as the SETRA and Brilon-Wu methods, were compared using the Aimsun software. Assolie et al. [26] emphasize that various parameters, such as queue length, delay, and level of service (LOS), are required to be taken into consideration to enhance roundabout performance. The authors suggest that the placement of a detector at the point where the queuing starts is effective on the performance. As a result of their study, their conclusion is that appropriately positioned detectors could reduce delay and queue length values at signalized roundabouts. Chen et al. [27] investigated the differences in highway lane-changing behavior under complex scenarios. The analysis is based on a comprehensive dataset consisting of 6506 lane-changing trajectories obtained from the highway drone dataset. Statistical significance tests and heat maps are used to examine differences in lane-changing behavior under complex scenarios. The findings showed that lane-changing behavior differs notably across scenarios, offering useful insights for microscopic traffic flow modeling. Tang et al. [28] emphasize the significance of calibration for the microscopic traffic simulation models. With the end of the facilitating calibration process, the authors integrate genetic algorithm and particle swarm optimization methods with the parallel estimation infrastructure. Hence, it yields an 80% reduction in the estimation time required for the calibration process. Guerrieri [29] compares roundabouts structured in different types with respect to their overall capacity, travel period, and LOS estimations by employing microscopic simulations and deterministic fundamental diagrams. The author suggests the most appropriate roundabout type with respect to the specific traffic loading. Afshari et al. [30] aimed to investigate the accuracy of microscopic traffic simulation models. Using a calibration study based on a genetic algorithm, the authors tried to minimize the differences between field observations and the values produced by the simulation software. Avsar et al. [31] aim to discover the effects of geometric characteristics on intersection capacity. In this regard, they develop an empirical capacity estimation model to estimate intersection capacity. Their results conclude that intersection geometry could yield various effects on roundabout capacity.
On the basis of this literature review, various models are introduced for capacity estimation for modern roundabouts. Especially, it is seen that capacity estimations made through microscopic models evidently require calibration to reflect characteristics of driver behaviors. In the design and performance evaluation of roundabouts, calibration of simulation models is essential to accurately account for the effects of driver behavior. Driver characteristics such as gap acceptance, reaction time, and acceleration or deceleration tendencies can significantly influence entry capacity, delay, and overall traffic performance at roundabouts. Since these behavioral patterns often vary across regions and cultures, relying solely on default simulation parameters may lead to misleading results. Therefore, model calibration ensures that local driving habits are properly reflected in the simulation, improving the reliability of the analysis and the applicability of the design outcomes. By incorporating calibrated behavioral parameters, simulation tools can provide more realistic predictions of operational performance and help engineers develop safer and more efficient roundabout designs. Therefore, in the present study, a Differential Evolution Algorithm-Based Bi-Level Calibration Model (DEBCAM) was developed in order to optimize the environmental factor (EF) parameter, a key variable influencing roundabout capacity in the SIDRA software. It is anticipated that the proposed model will make significant contributions to the existing literature by incorporating the optimal value of the EF parameter, which reflects driver behavior characteristics in roundabout capacity estimation. Thus, the DEBCAM may enhance the precision and applicability of capacity predictions, particularly for regions where driver behavior deviates from international standards. Furthermore, the model provides a flexible framework that can be adapted to different urban contexts and traffic compositions, thus offering a practical tool for both researchers and practitioners seeking to improve the reliability of roundabout performance analysis.
Moreover, the EF values optimized via DEBCAM and other parameters effective on capacity were primarily employed to develop a roundabout capacity estimation model by using the Partial Least Squares (PLS) method. The developed capacity estimation model contributes to the literature by integrating both behavioral and geometric parameters through the optimized EF value and the application of the PLS method. Unlike conventional capacity models that rely solely on standard gap-acceptance parameters, this model explicitly incorporates driver behavior characteristics and their interaction with geometric features, providing a more realistic representation of traffic conditions. Moreover, the use of the PLS approach enables the identification of the most influential variables affecting capacity, allowing for a data-driven calibration process that enhances model accuracy. The high level of consistency observed between the SIDRA and the developed capacity estimation model results further validates the model’s reliability. Overall, this research contributes to the existing body of knowledge by presenting a flexible, behavior-sensitive framework for roundabout capacity estimation that can be adapted to different regional traffic conditions.
In Section 2, the employed method and developed DEBCAM were introduced in depth. Section 3 depicts the study territory and provides detailed information on modern roundabouts. While Section 4 evaluated the DEBCAM analyses and the PLS method used in developing the capacity estimation model and discussed their results, Section 5 summarized the findings and outlined potential directions for future research.

2. Bi-Level Calibration Model

SIDRA, a micro-analytic simulation software, allows analysis of different types of intersection structures according to the number of lanes. Similarly, SIDRA software enables local administrators to test various scenarios on intersections so that they can compare different solution approaches toward diversified traffic issues before taking any actual application step. SIDRA software offers various variables as performance parameters, such as delay, saturated flow degree, service level, emission release, fuel consumption, average speed, queue length, and travel time. As indicated by our literature review in the previous section, SIDRA software is commonly taken into commission for the analysis of roundabouts and their capacity estimation [32]. SIDRA considers variables of follow-up time and critical gap as fundamental parameters in the roundabout capacity model [33]. As is commonly noticed, gap values preferred by individual drivers at roundabouts differ from one another. It is frequently encountered that a gap value adopted by a driver could be much wider than the one preferred by another driver [34]. For this reason, calibration is required on the parameters effective on the capacity model during the capacity estimation analysis with the SIDRA software in order to reflect driver behaviors on the model capacity. The values suggested by SIDRA for the EF parameter, reflecting driver characteristics and intersection geometry, represent characteristics of the country for which the software was developed. Therefore, the EF parameter is required to be calibrated in accordance with the characteristics of the territory of focus of interest in order to acquire the most realistic results from the software. In our study, the EF parameter used in SIDRA analysis was optimized through DEBCAM. The bi-level programming model employed in DEBCAM allows integrated analysis of two different intercorrelated optimization problems together [35]. The model consists of two optimization problems: lower and upper levels. The outputs of the upper-level problem constitute the inputs of the lower-level problem [36]. Equations (1) and (2) below represent an upper-level problem in the bi-level programming model [37].
m i n x F ( x , y )
G ( x , y ) 0
where G ( x , y ) 0 denotes the constraint function of the upper-level optimization problem; y denotes the solution of the lower-level optimization problem for any x. Equations (3) and (4) below exhibit the lower-level optimization problem:
m i n y f ( x , y )
g ( x , y ) 0
where g ( x , y ) 0 denotes the constraint function of the lower-level optimization problem.

2.1. Differential Evolution (DE) Algorithm

The DE algorithm developed by Storn and Price [38] is a population-based optimization method and is extensively utilized in the solution of sophisticated optimization problems [39]. Owing to its straightforward, robust, and heuristic optimization algorithm, as well as its lesser dependence on control parameters than the other algorithms, the DE algorithm has gained substantial common ground among researchers [40,41]. Furthermore, the DE algorithm displays other advantages, such as that its coding is conducted with real numbers, requiring less computation time, eliminating the need for competency in derivatives, and answering all sorts of problem types [42,43,44].
The DE algorithm uses two control parameters of mutation factor (F) and crossover rate (CR) in the solution of optimization problems [45]. The p parameter, which represents the size of the population used in the algorithm, denotes the number of solution vectors considered during the solution of the problem. The solution process of the DE algorithm consists of four steps. At the initializing stage, the initial population is created randomly as it is given by Equation (5) in Step 1 after determining the values of the F, CR, and p parameters.
x i j = x i ,   m i n j + r a n d 0 , 1 x i , m a x j x i , m i n j
where x i j denotes the ith decision variable of the x vector at the jth row of the initial population (i = 1, 2, …, n and j = 1, 2, …, p). The n value denotes the number of decision variables specific to the problem. x i , m i n j and x i , m a x j denote the lower and upper bounds of the ith decision variable, respectively. After creating the initial population, the objective function values are estimated for each solution vector, called the target vector, in a specific way for the problem.
At the second step of the DE algorithm, called the mutation step, the suggested usage interval for the mutation factor parameter is 0.5–1 [30]. At this step, the mutant vector is generated by using the F parameter and three solution vectors randomly selected from among the initial population. At the mutation step, mutant vectors are generated, respectively, by using Equation (6) below for each solution vector, called the target vector. At this step, three solution vectors are randomly selected from the interval of [1, p]; they need to be different from each other and outside of the target vector that needs to incur the mutation process [46].
m i j = x i r 0 + F x i r 1 x i r 2
where r0, r1, and r2 denote indexes of solution vectors, unique and different from the target vector. Similarly, m i j denotes ith variable of the m vector generated for the jth target vector.
At the crossover step, the third step of the algorithm, a prospective trial vector is generated through probability by using each mutant vector obtained via mutation and the target vector. As exhibited by Equation (7), the ith element of the r vector, referred to as the trial vector, is formed by crossing the generated mutant vector with each of the target vectors in the population. Here, if the value created randomly in the range of (0, 1) is smaller than or equal to the CR parameter, the ith element of the mutant vector is selected from the r vector; otherwise, it is selected from the target vector. As prescribed by the condition given as i = irand in Equation (7), it is aimed to ensure that at least one element of the trial vector is selected from the mutant vector and that an alteration is made to the target vector at each generation.
r i j = m i j ,         i f   r a n d   0 , 1 C R   o r   i = i r a n d   x i j ,           o t h e r w i s e                                                                                        
After determining the objective function of the r vector obtained as a result of crossing, at the fourth step, called selection, the objective function values of the r vector and the x target vector are compared. As seen from Equation (8), if the value of the objective function belonging to the r vector is found to be less than the value of the objective function belonging to the x vector, the r vector replaces the x vector and is transferred to the next generation, where gen value denotes the number of generations and the y vector denotes the solution vector transferred to the next generation.
y g e n + 1 = r g e n ,           i f   f r g e n f x g e n x g e n ,         o t h e r w i s e                                            
The iterative solution conducted along the generations is required to be pursued until reaching the maximum number of generations or reaching the cessation point determined beforehand.

2.2. DEBCAM

In the upper-level of the DEBCAM, EF values randomly generated for intersection approaching roads are used in the lower-level as an input value for the intersection modeled SIDRA software, so as to determine delay values. For the intersection whose EF values need to be optimized, the square of the difference between the average vehicle delay ( d o ) value captured via field observation and the delay value ( d s ) estimated by the SIDRA software as a result of simulation is described as the objective function. The DEBCAM is utilized to determine the EF values, minimizing the objective function given in Equation (9).
min f E F i , j = i I d o i , j d s i , j 2
where I denotes the number of approaching roads at the intersection, d o i , j denotes average delays obtained from the field of ith approaching roads of the jth intersection, and d s i , j denotes average delays obtained from the SIDRA software of ith approaching roads of jth intersection. Below, Figure 1 exhibits the developed DEBCAM.
At the initialization stage, values of the F and CR parameters were selected as 0.8 in parallel to the practices in the literature [41]. The value of p, which denotes population size, was selected as 50 [47]. For the algorithm developed for the DEBCAM solution, the maximum number of generations (maxgen) was selected as 100. At Step 1, the EF values, which would constitute solution vectors, in other words, target vectors, are randomly generated according to Equation (10) by observing lower and upper boundaries:
E F i , j = r a n d 0 , 1 × E F i , j m a x E F i , j m i n + E F i m i n   j = 1 , 2 , , p   i = 1 , 2 , , n
where E F i , j value denotes the EF value of the ith intersection approaching the road of the jth target vector. The SIDRA software makes its estimates of the EF value based on the approaching road. Since there were four approaching roads in all of the intersections taken into consideration for our study, the number of decision variables (n) was selected as four for each intersection. The usage interval of the EF value in the SIDRA software is given as 0.5–2. At this stage, in order to determine the values of the objective function given in Equation (9), the average delay is estimated via the SIDRA software by using randomly generated EF values for each target vector. After determining values of the objective function, there were attempts to enhance the solution quality of the target by using mutation, crossover, and selection operators for each solution vector in the population. At Step 2, a mutation operation is conducted for each target vector, respectively. At the mutation step, mutant vectors are generated by using the F-parameter and three randomly selected solution vectors from the population outside the considered target vector. For the jth target vector, Ψ j g e n , jth mutant vector denoted as j g e n given in Equation (11) is generated. At the mutation stage, the indices of three solution vectors that need to be selected differently from the jth target vector were denoted as j 0 , j 1 , and j 2 .
j g e n = Ψ j 0 g e n + F × Ψ j 1 g e n Ψ j 2 g e n
At the next step, a trial vector is generated probabilistically by using the jth target and mutant vectors with the help of the CR parameter. At this step, referred to as crossover, the purpose is to test the enhancement status of the problem-solving quality of the generated jth trial vector. Each element of the jth trial vector, referred to as Ω j g e n , is generated as ω i , j g e n (i = 1, 2, …, n), exhibited by Equation (12). From the equation, if the randomly generated number in the interval of [0, 1] is smaller than the CR parameter, the ith element of the jth trial vector is selected from the mutant vector; otherwise, it is selected from the target vector. The expression given i = n given in Equation (12) is used to ensure the absolute difference in the generated trial vector from the target vector. At this stage, EF values generating the jth trial vector, Ω j g e n , are entered into the SIDRA software as input so as to estimate average delay values.
Ω j g e n = ω i , j g e n = δ i , j g e n ,       i f   r a n d 0 , 1 C R       o r     i = n ψ i , j g e n ,   o t h e r w i s e                                                                
At the last step referred to as the selection step, as it is given in Equation (13), if the trial vector, Ω j g e n , yields a smaller objective function value than the target vector, Ψ j g e n , it needs to be included in the population instead of the target vector. The iterative process in the developed DE-based bi-level calibration model is required to be continued until reaching the maximum number of generations.
Ψ j g e n + 1 = Ω j g e n ,               i f     f   Ω j g e n f Ψ j g e n   Ψ j g e n ,               o t h e r w i s e                                                      

3. Study Area

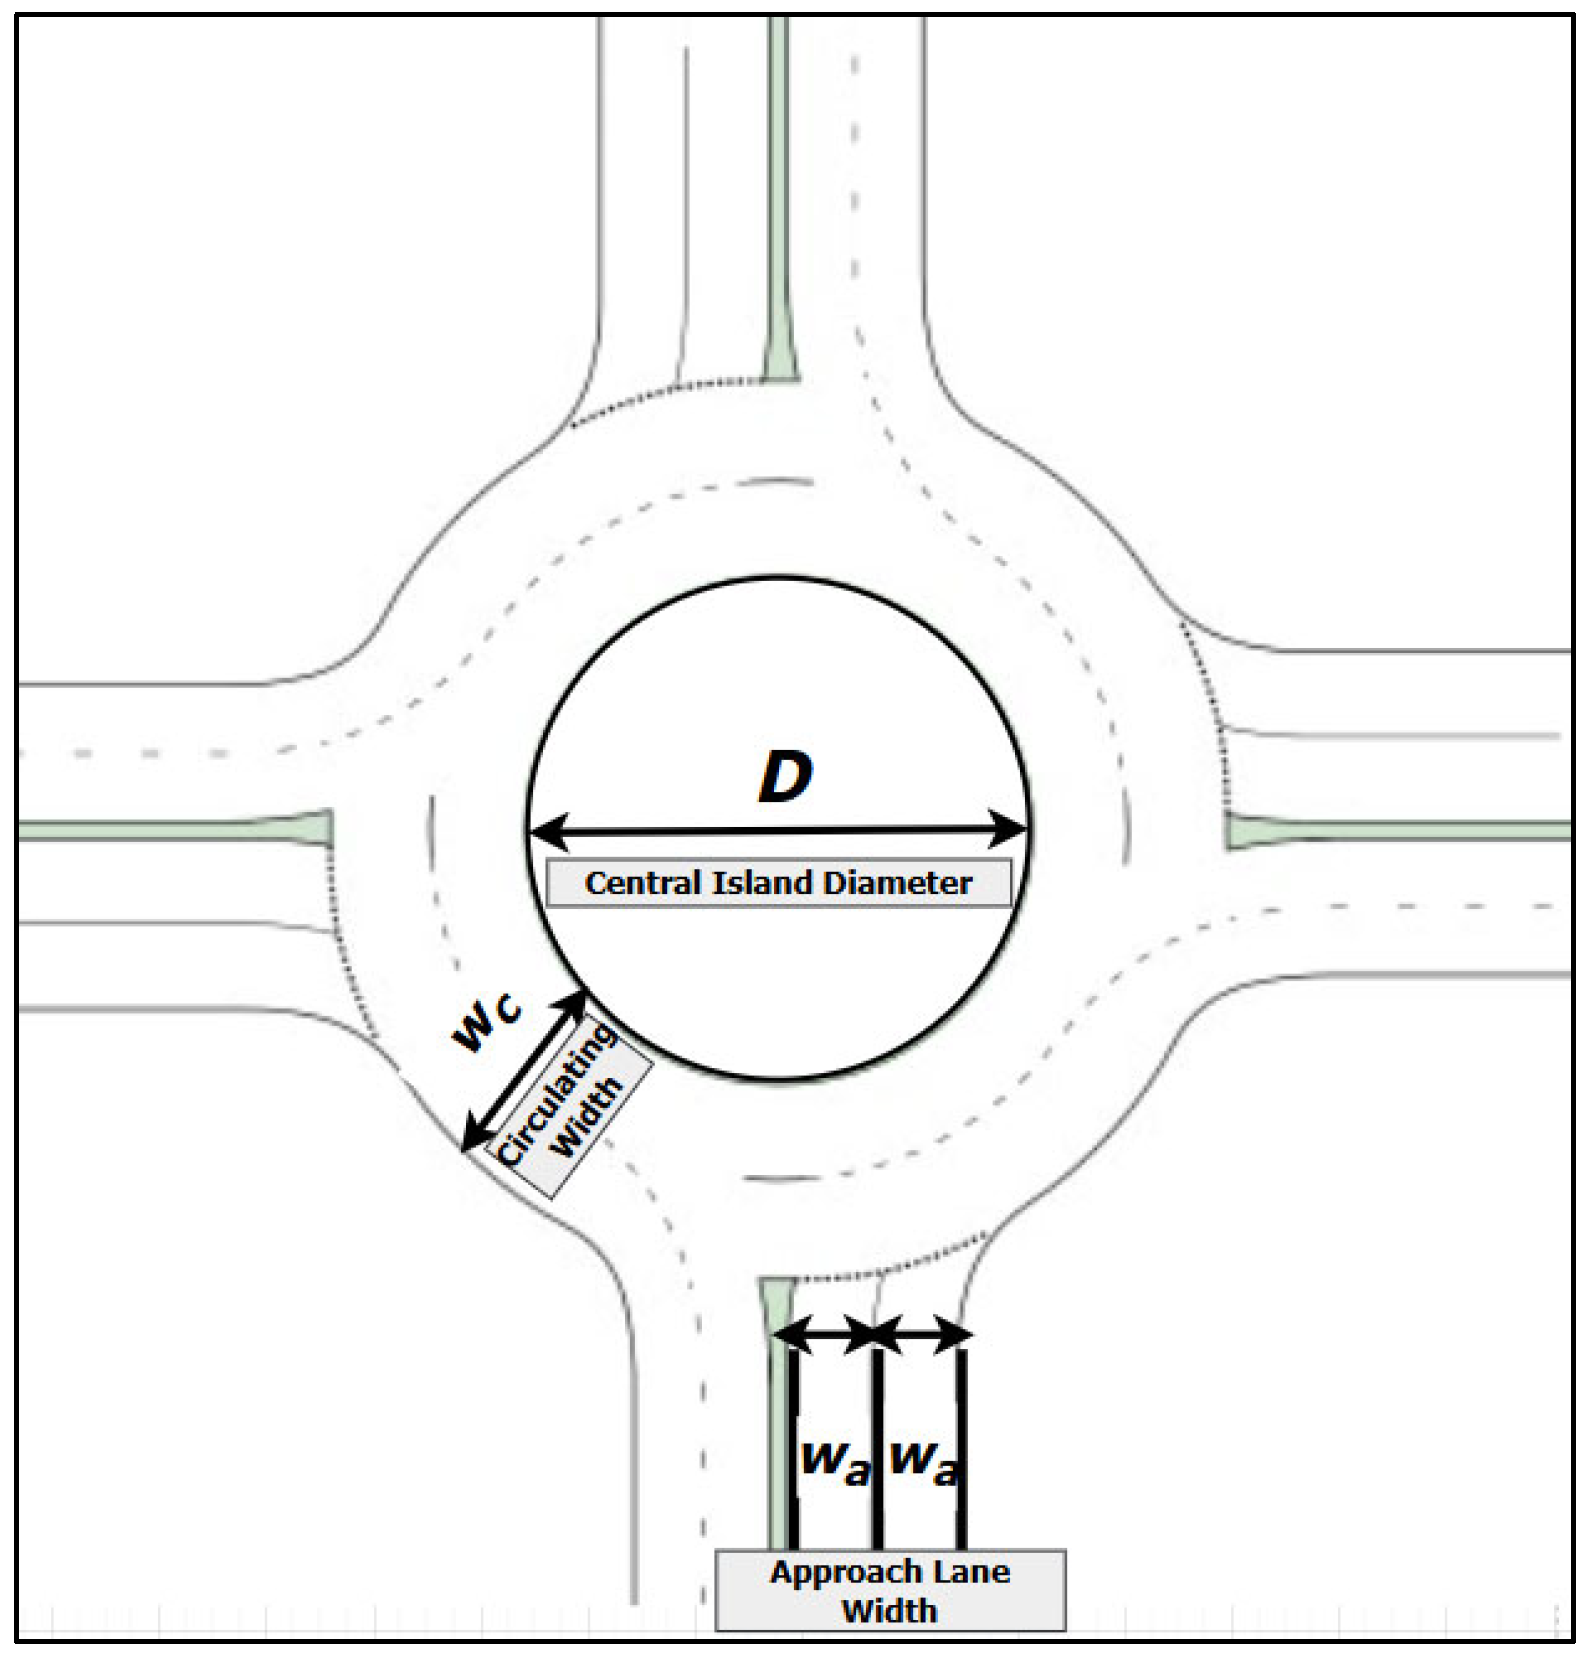
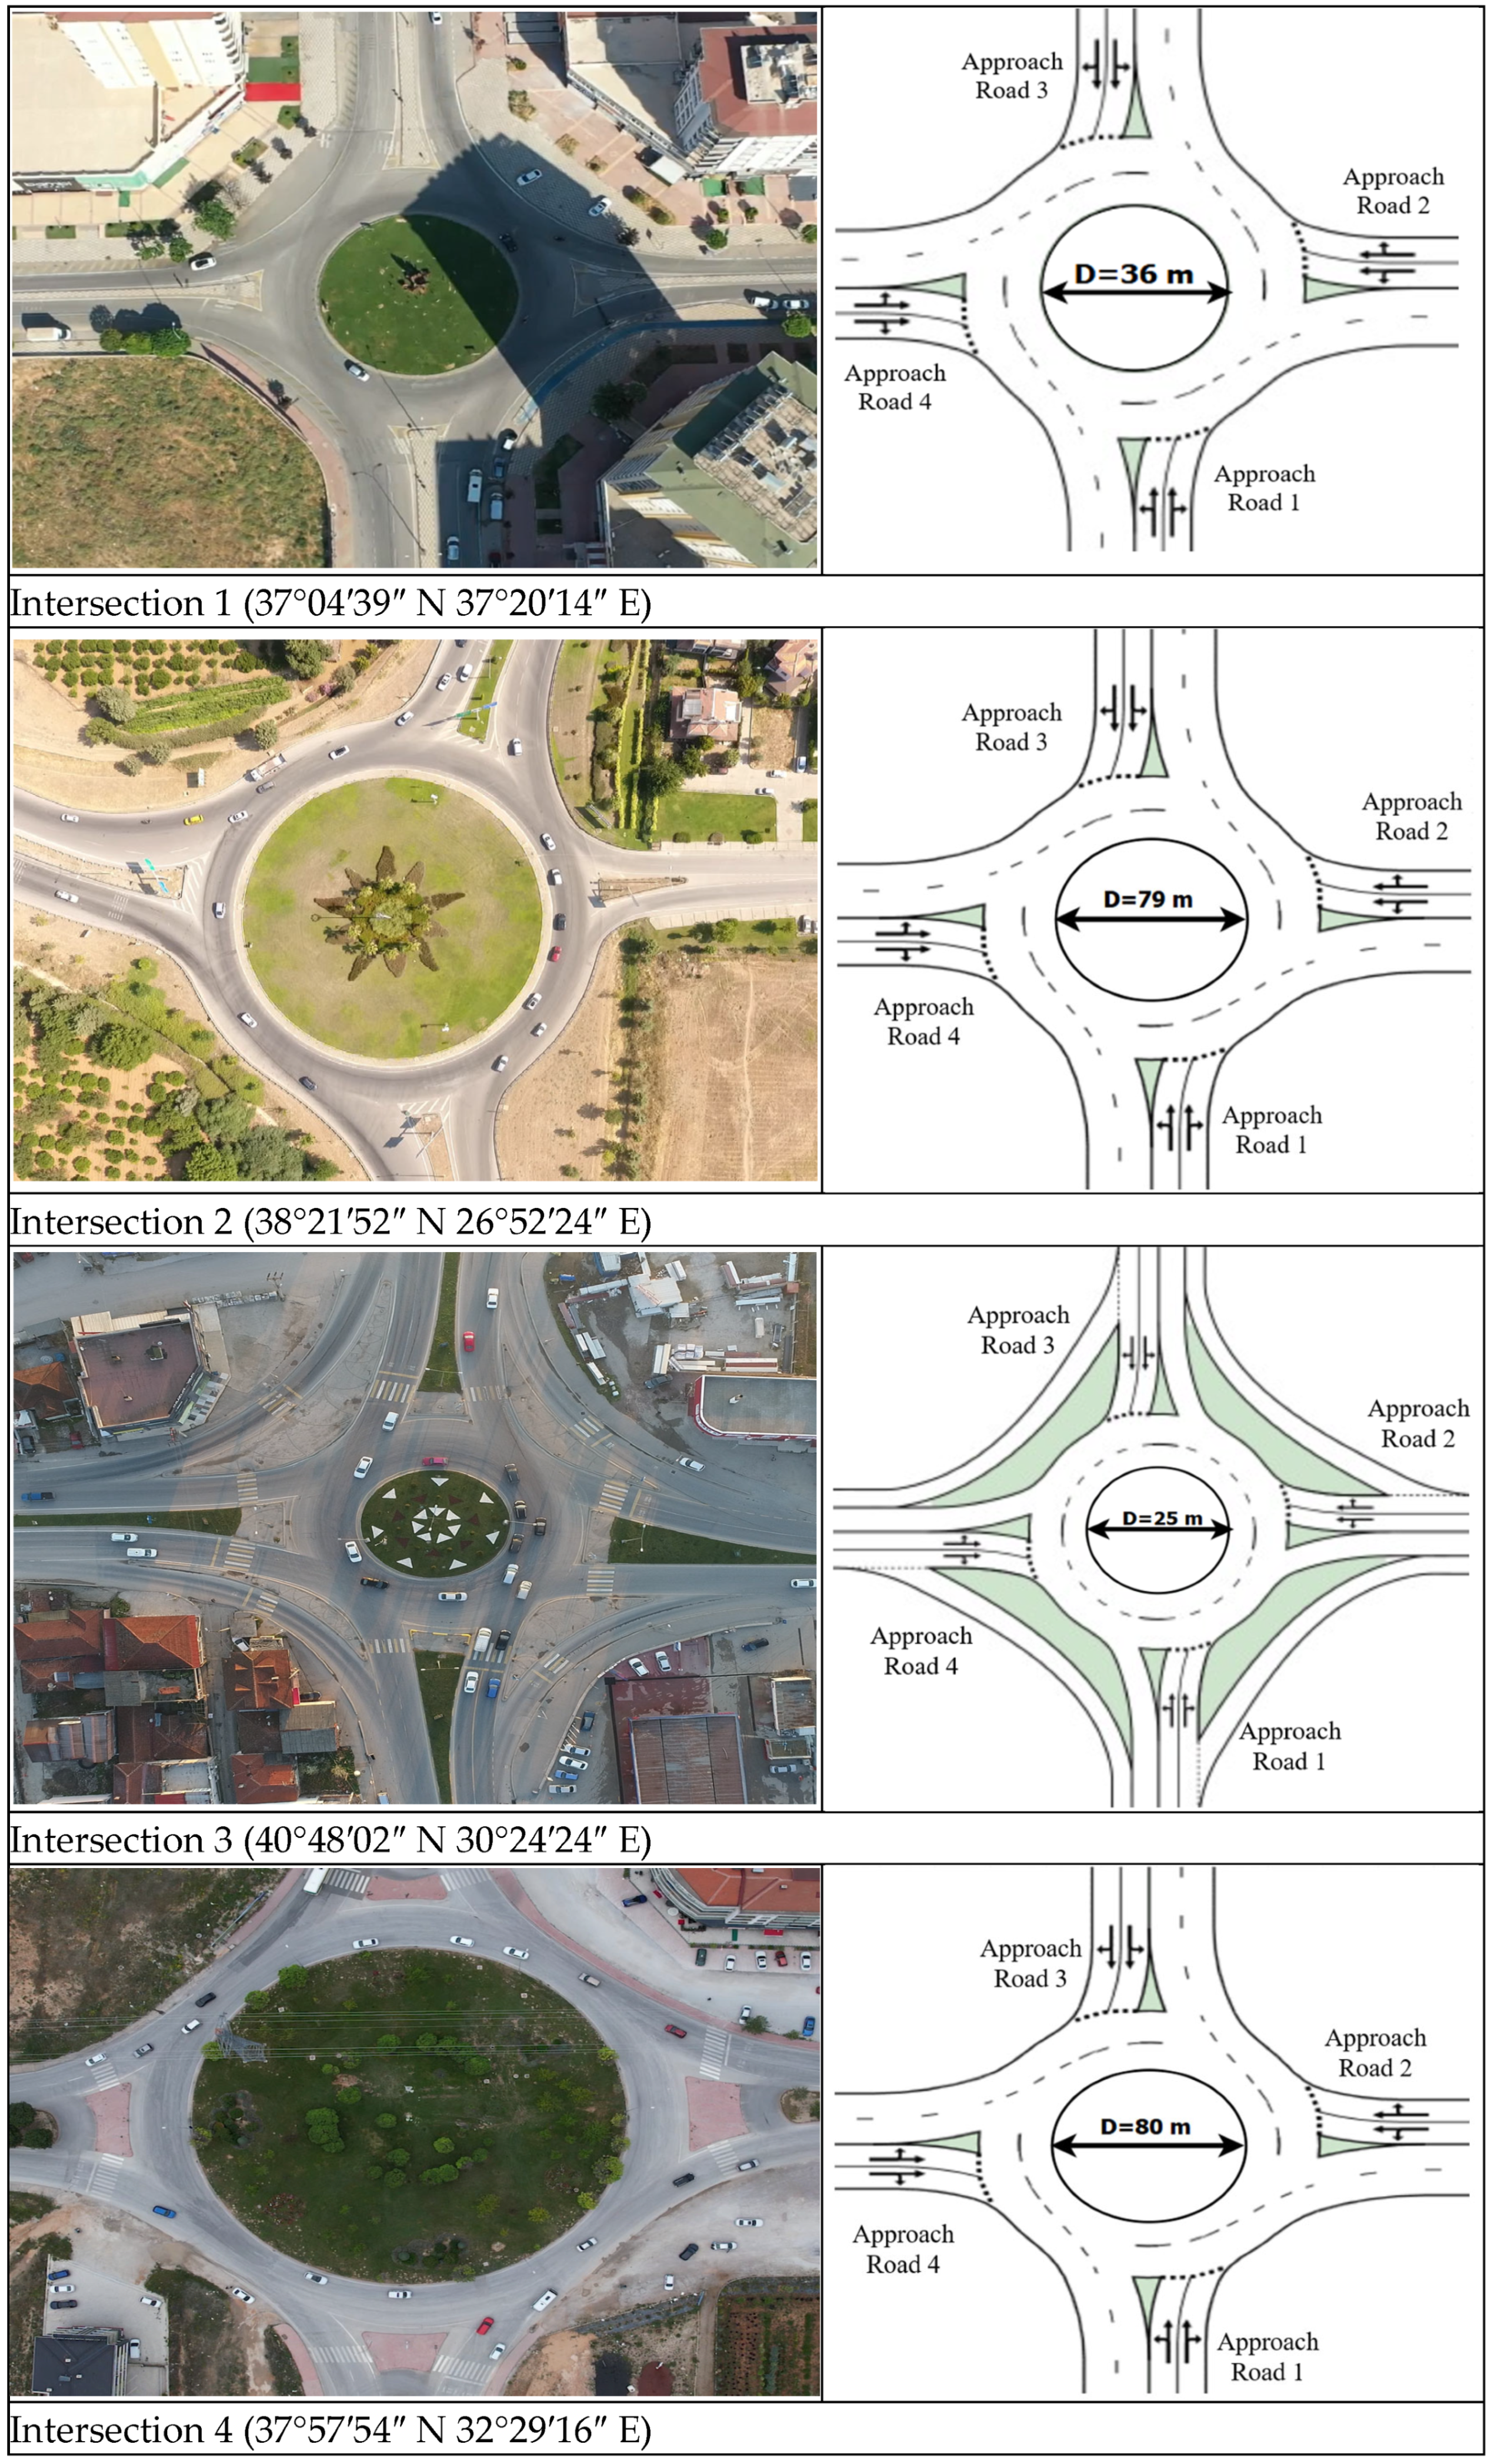
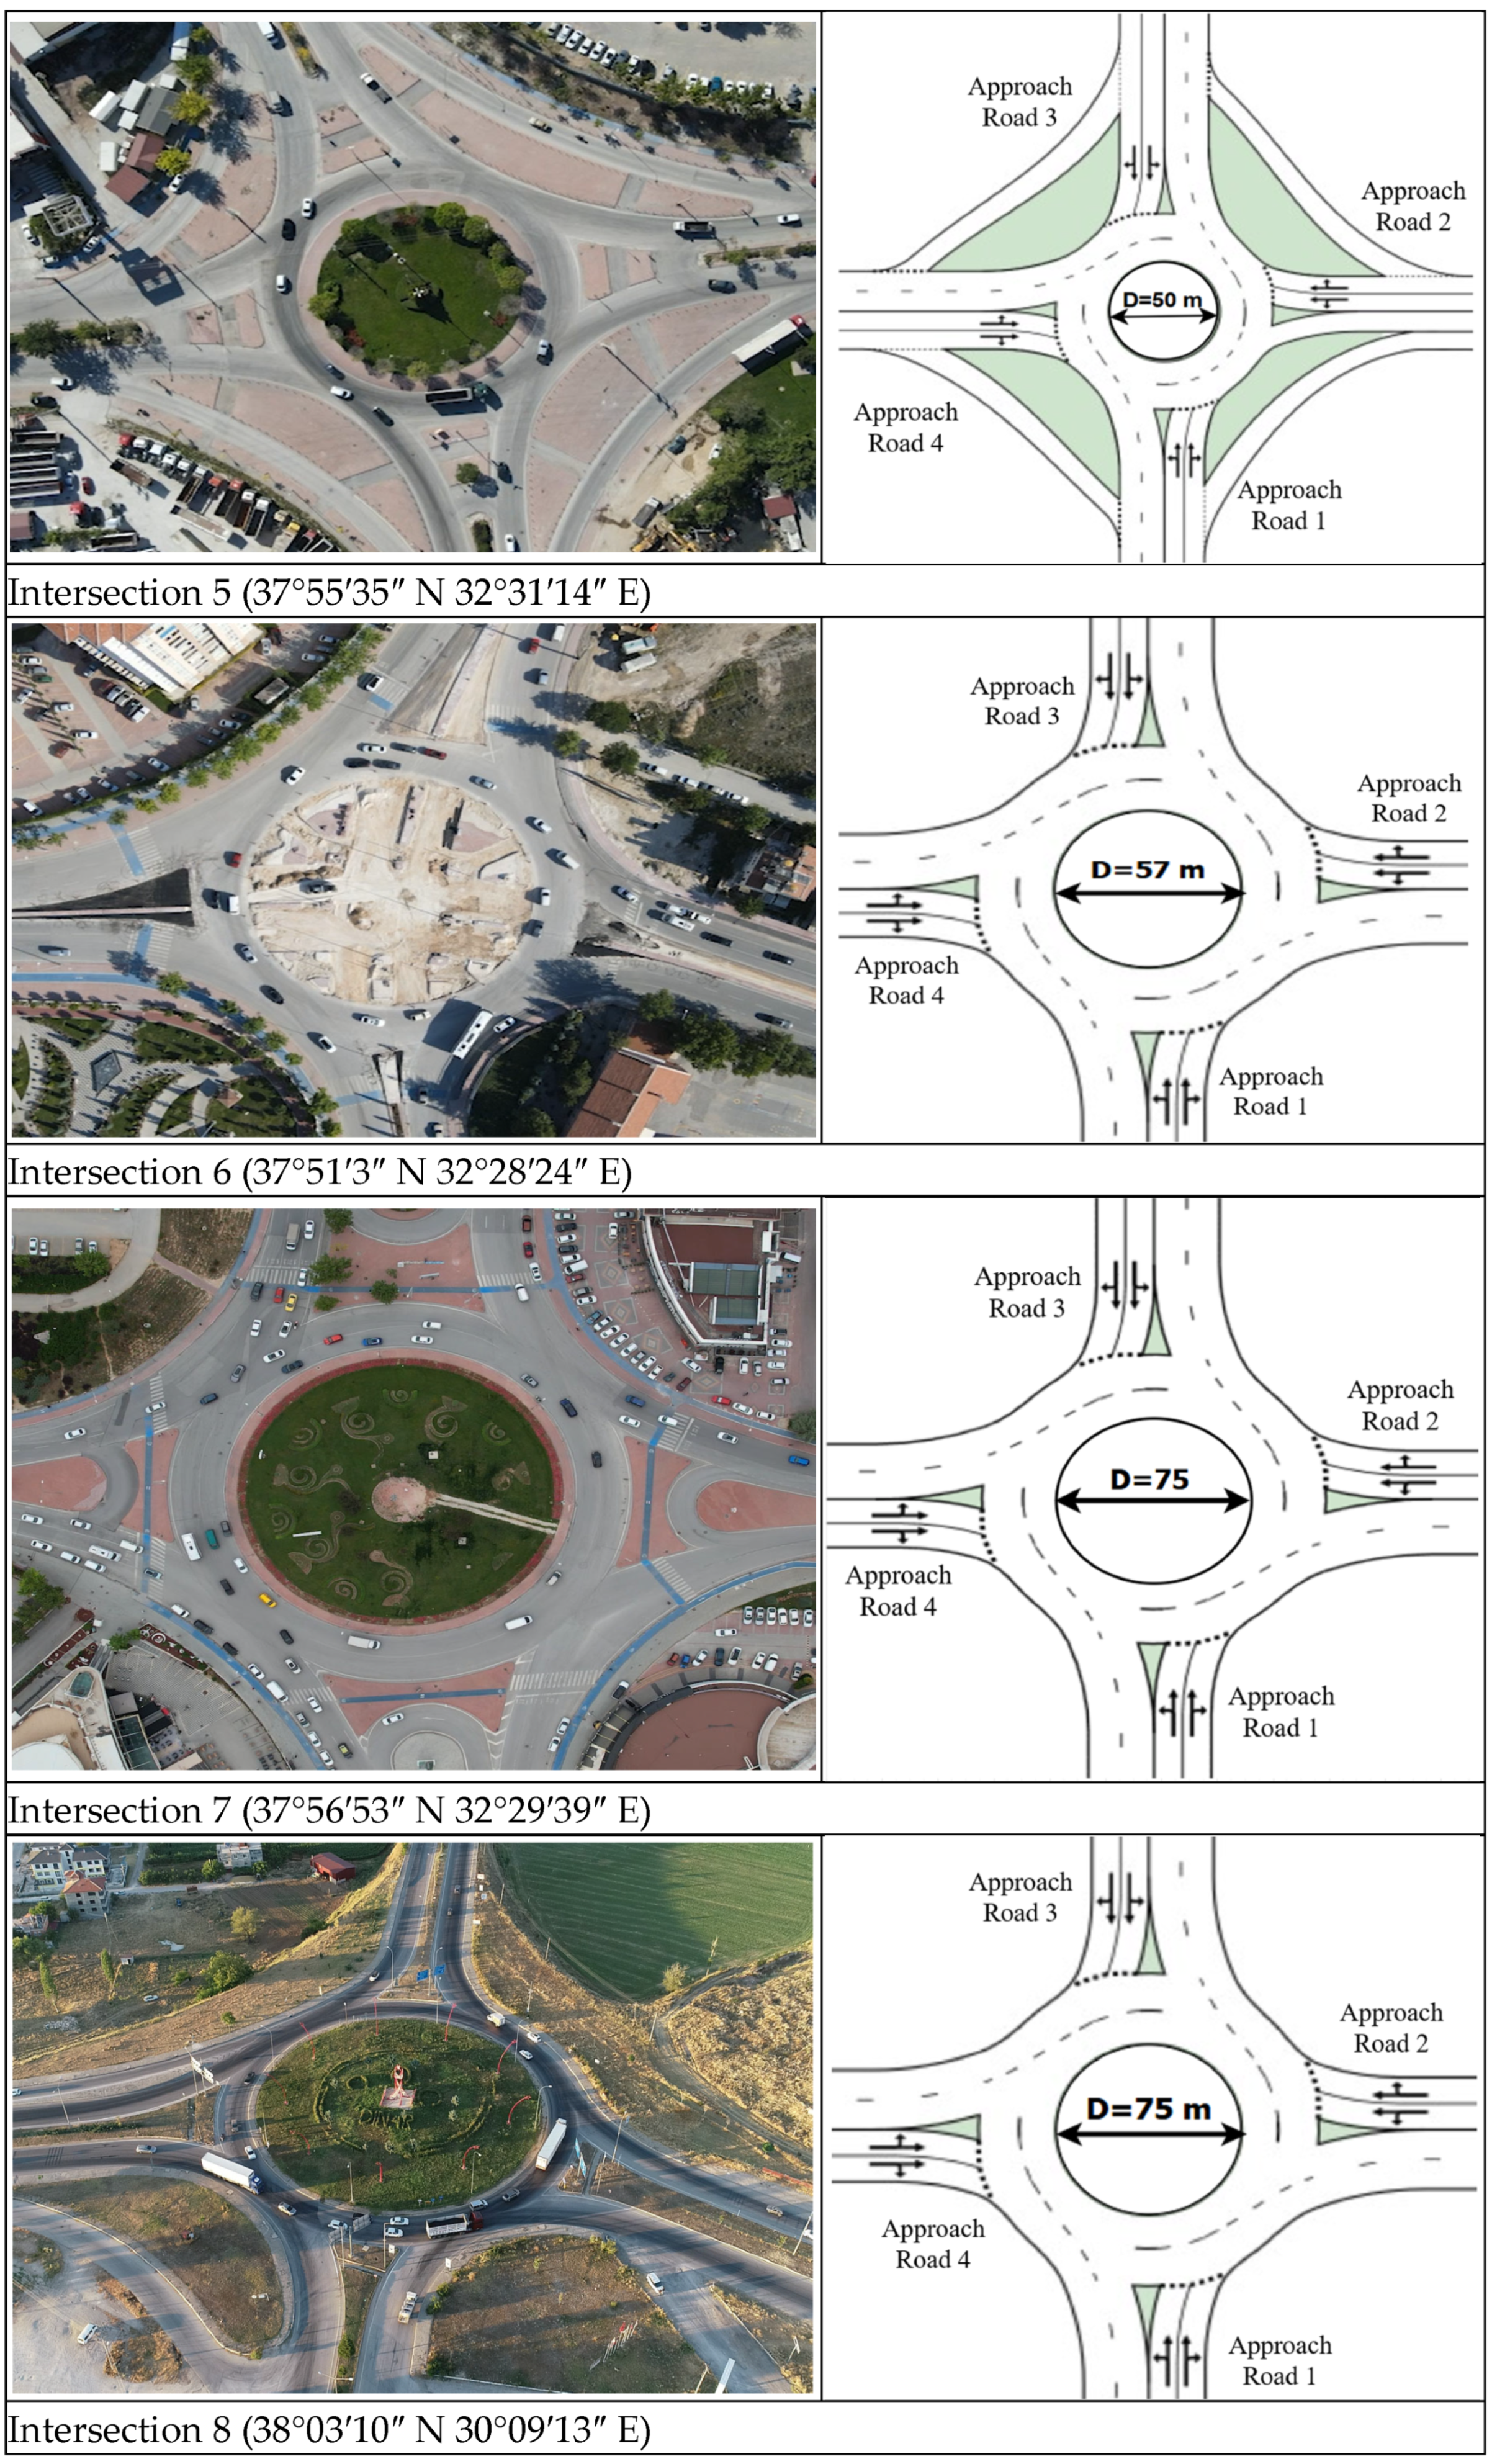
Eight different intersections were selected to test the performance of the developed DEBCAM. All of them are two-lane roundabouts with four approaching roads. The first intersection is located in a residential neighborhood of Gaziantep, and its connecting roads are equipped with signalized roundabouts. The roundabouts in İzmir and Sakarya are situated along routes predominantly used by heavy vehicles. The fifth intersection is located in an industrial zone of Konya, while the fourth, sixth, and seventh intersections are situated in residential and commercial areas of Konya, respectively. The eighth and final intersection is located on the outskirts of Dinar County in Afyonkarahisar, which carries an intensive mix of local and intercity traffic. The primary reason for selecting intersections from different cities in Turkey was to represent the diversity of driver behaviors. Moreover, special attention was paid to ensure that these intersections were located across various territorial and functional contexts. For example, while one intersection was located in a residential area, another was chosen from an industrial zone. Observations on these roundabouts were conducted at morning and evening peak hours to utilize in our model through drone between 2022 and 2024. For all intersections, a 15 min time period was determined; shootings were divided into three sections, each of which took 5 min [48,49]. Average vehicle delays (d0), flow rate (q), heavy vehicle rate ( p h v ) , conflict flow (Qe) right-turning (qr), left-turning (ql), and straight-going (qth) vehicle rates were captured. During the observation of delay values, a reference point was identified outside the vehicle queue formed along the intersection approach. The time elapsed between a vehicle passing this reference point and its exit from the intersection was defined as the delay of that specific vehicle. Furthermore, the average delay time of vehicles using the intersection was calculated based on their individual delay times recorded during the observation period. Table 1 summarizes observed data for the first section regarding geometric characteristics of intersections, such as central island diameter (D), approach lane width ( w a ) , and circulating width ( w c ) , which are given in Figure 2. Figure 3 exhibits intersection drone images and their SIDRA illustrations.

4. Development of Capacity Estimation Model

4.1. SIDRA Analyses

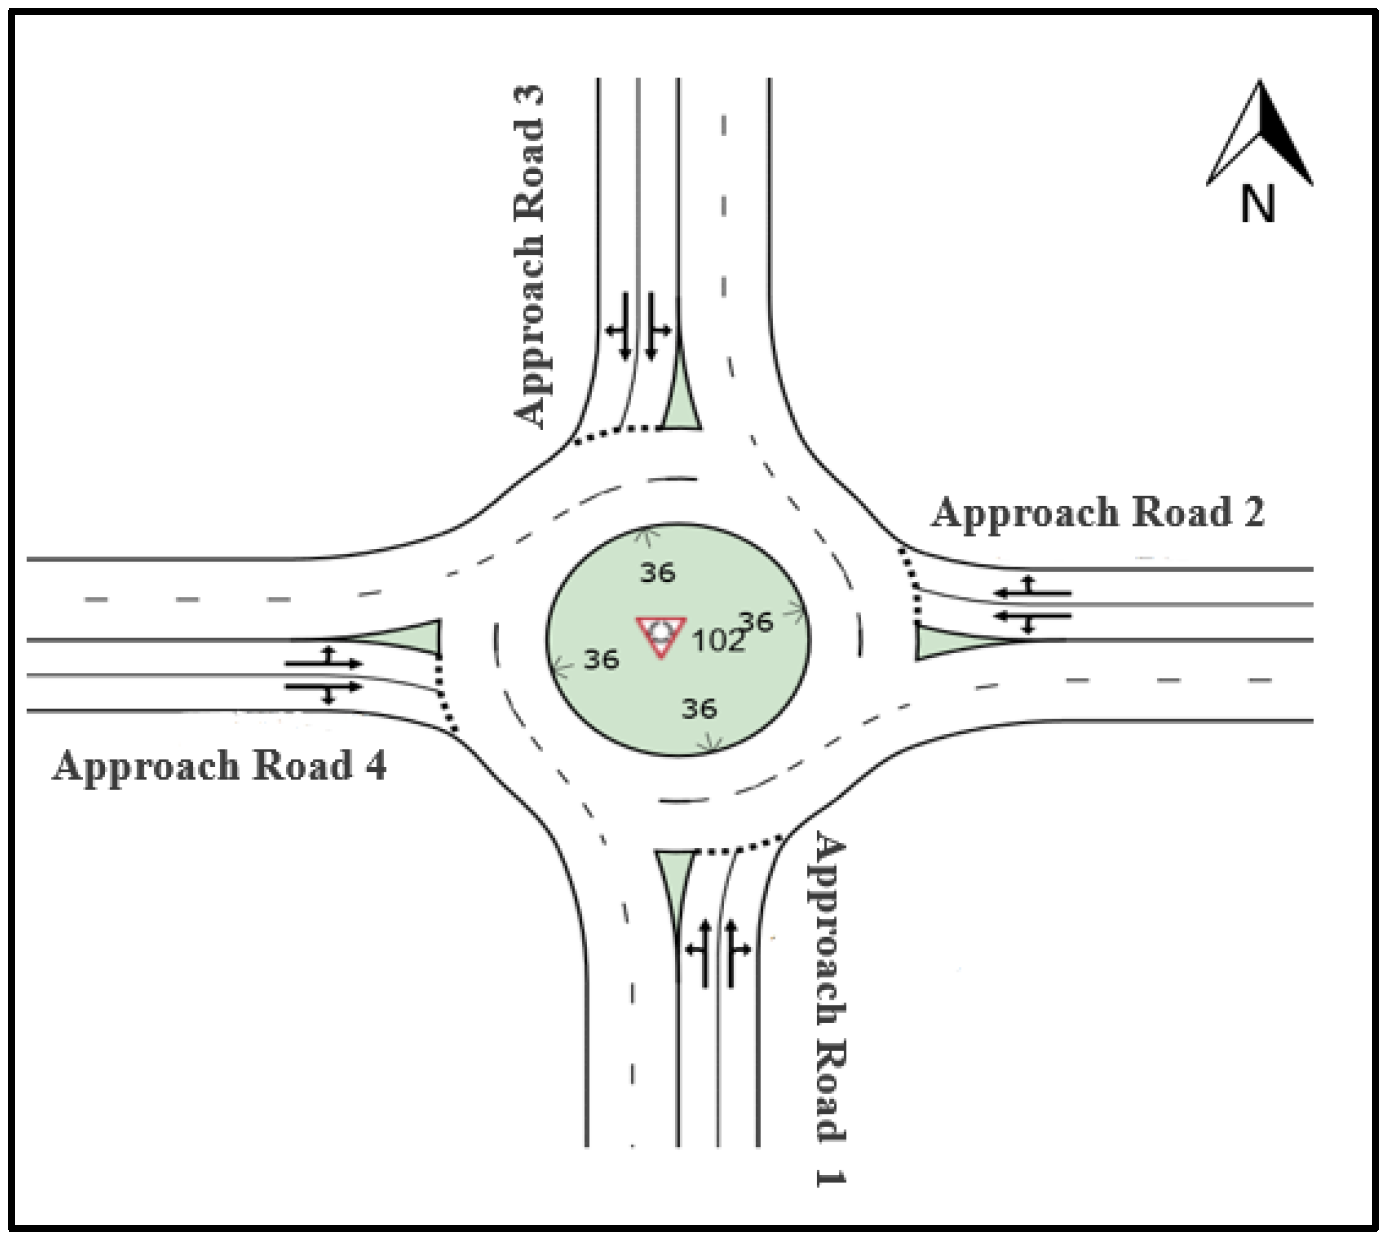
SIDRA software utilizes the Highway Capacity Manual (HCM) and the SIDRA Standard (SIDRAST) roundabout capacity estimation models. The fundamental components of the SIDRAST roundabout capacity model include the classification of approaching lanes as either dominant or subdominant, depending on the roundabout geometry, gap-acceptance parameters, circulating flows, interdependence of entry lane flows, and the differing capacity characteristics of approach lanes. The SIDRAST gap-acceptance models are also used in estimating capacity, delay, queue length, and other performance measures. The model depends on various geometric parameters, such as roundabout geometry, approach width, and entry and exit diameters. During roundabout analysis in SIDRAST, the EF value is employed to account for the effects of operating speed, proportions of heavy and light vehicles, driver characteristics, reaction times, and geometric parameters (such as roundabout dimensions, lane widths, and entry diameters and angles) on capacity, as well as the vehicle movements at entry and exit approaches. Thus, the model estimates capacity by incorporating both geometric characteristics and driver behavior factors. Owing to these aforementioned characteristics, the SIDRAST model was employed as the capacity estimation model within the DEBCAM framework [33]. The EF parameter employed for calibration purposes in the SIDRAST model switches with respect to intersection geometry, sight length, driver behavior, operation speed of the intersection, driver reaction speed, and driver aggressiveness. The EF parameter value could vary between 0.5 and 2.0, and SIDRA assumes the value of the parameter as 1. In SIDRA, while delay values are estimated on the basis of the lane and leg of an intersection, the capacity value is estimated on the basis of the lane. The software performs numbering intersection approaching the road by assigning 1 to the south side, and proceeds counterclockwise. Figure 4 exhibits an example of the intersection approaching road numbering procedure below:
First, intersections in our study area were modeled in SIDRA software; our analyses were conducted by taking the EF value as the assumed value of the software. Delay values obtained from SIDRA and observed delay values were summarized in Table 2. The Root Mean Square Error (RMSE) value was determined as 30.05. The RMSE is a statistical measure used to assess the goodness of fit of a model to the observed data. The RMSE value shows that there was a significant difference between the average delay values obtained by field observations and the delay values yielded by the SIDRA software.

4.2. DEBCAM Analyses

The DEBCAM, developed for intersections that need to be analyzed, was utilized to obtain optimum EF values of each approaching road located at the intersection, whose objective function in Equation (9) was minimized. Table 3 exhibits approach-based EF values obtained during the first period of intersections.
EF values obtained as a result of DEBCAM analyses, as exhibited in Table 3, were re-entered in the SIDRA software to analyze again and to obtain the calibrated SIDRA (C-SIDRA) delay values ( d s _ c ). Table 4 exhibits the comparison of d s _ c and observation delay values d o .
The reliability of C-SIDRA delay values was tested with Geoffrey E. Heavers (GEH) statistics. The GEH statistic is a parameter frequently used in traffic engineering for observation and comparison of model data. Equation (14) exhibits the GEH statistics [50].
  G E H = 2 ( M G ) 2 M + G
where M denotes average delays obtained with C-SIDRA; G denotes average delays obtained through field observations. GEH statistics value smaller than 5 suggest that there is significant conformity between model and observation data [51]. Table 5 exhibits GEH statistics values below. The GEH values exhibited in Table 5 suggested that the delay values obtained through C-SIDRA showed significant conformity with the observation delay values. In addition, Table 6 exhibits capacity values obtained with both the SIDRAST model and C-SIDRA. According to Table 6, capacity values obtained by using the assumed value of EF were found to be considerably higher than the C-SIDRA capacity value estimated by optimization of EF values with DEBCAM. This status could result in policymakers making erroneous decisions during planning and performance analyses. Accordingly, it was considered that C-SIDRA capacity values were significantly effective in mimicking driver behaviors realistically in intersection areas.

4.3. Capacity Estimation Model

Mathematical models constructed to explain the relationship between two or more variables are referred to as regression models [52,53]. The prominent issues encountered frequently with regression models are given as numerous variables, a group of variables greater than the number of observations, and multiple linear correlation situations. In order to eliminate these issues, the Least Squares method was introduced by Herman Wold in the 1960s. The researcher’s method could be described as a statistical method consisting of Partial Least Squares analysis and multiple linear regression methods [54]. PLS models consider two variable matrices, independent and dependent, so as to determine the number of constituents maximizing the covariance matrix [55]. Recently, PLS regression (PLSR) models have been employed frequently to introduce solutions to traffic issues [56,57].
In the PLSR analysis, where the capacity ( Q c ) value was selected as the dependent variable, our independent variables were, the EF value was obtained by means of the developed DEBCAM, and the heavy vehicle rate was obtained through field observations ( p h v ) , approach lane width ( w a ) , circulating width ( w c ) , central island diameter (D), and conflict flow ( Q e ) values. Since the capacity value, one of the outputs of the SIDRA software employed in our study, is lane-based and estimated for intersection-approaching lanes, the lane concept is defined as a dummy variable in regression analyses. The dummy variable is an artificial variable that reflects a characteristic with two or more different categories [58]. In quantitative analyses, a dummy variable could replace a qualitative phenomenon or a hypothesis numerically [59]. If a dummy variable carries the desired characteristic, it is included in the regression analysis as 1, or otherwise as 0. According to the studies available in the relevant literature, it can be seen that dummy variables are frequently used in regression analyses [60,61,62]. In the present study, our dummy variable was determined as the right lane as 1, otherwise 0. Equation (15) is exhibited below:
l = 1 ,         i f   t h e   r i g h t   l a n e       0 ,         o t h e r w i s e                          
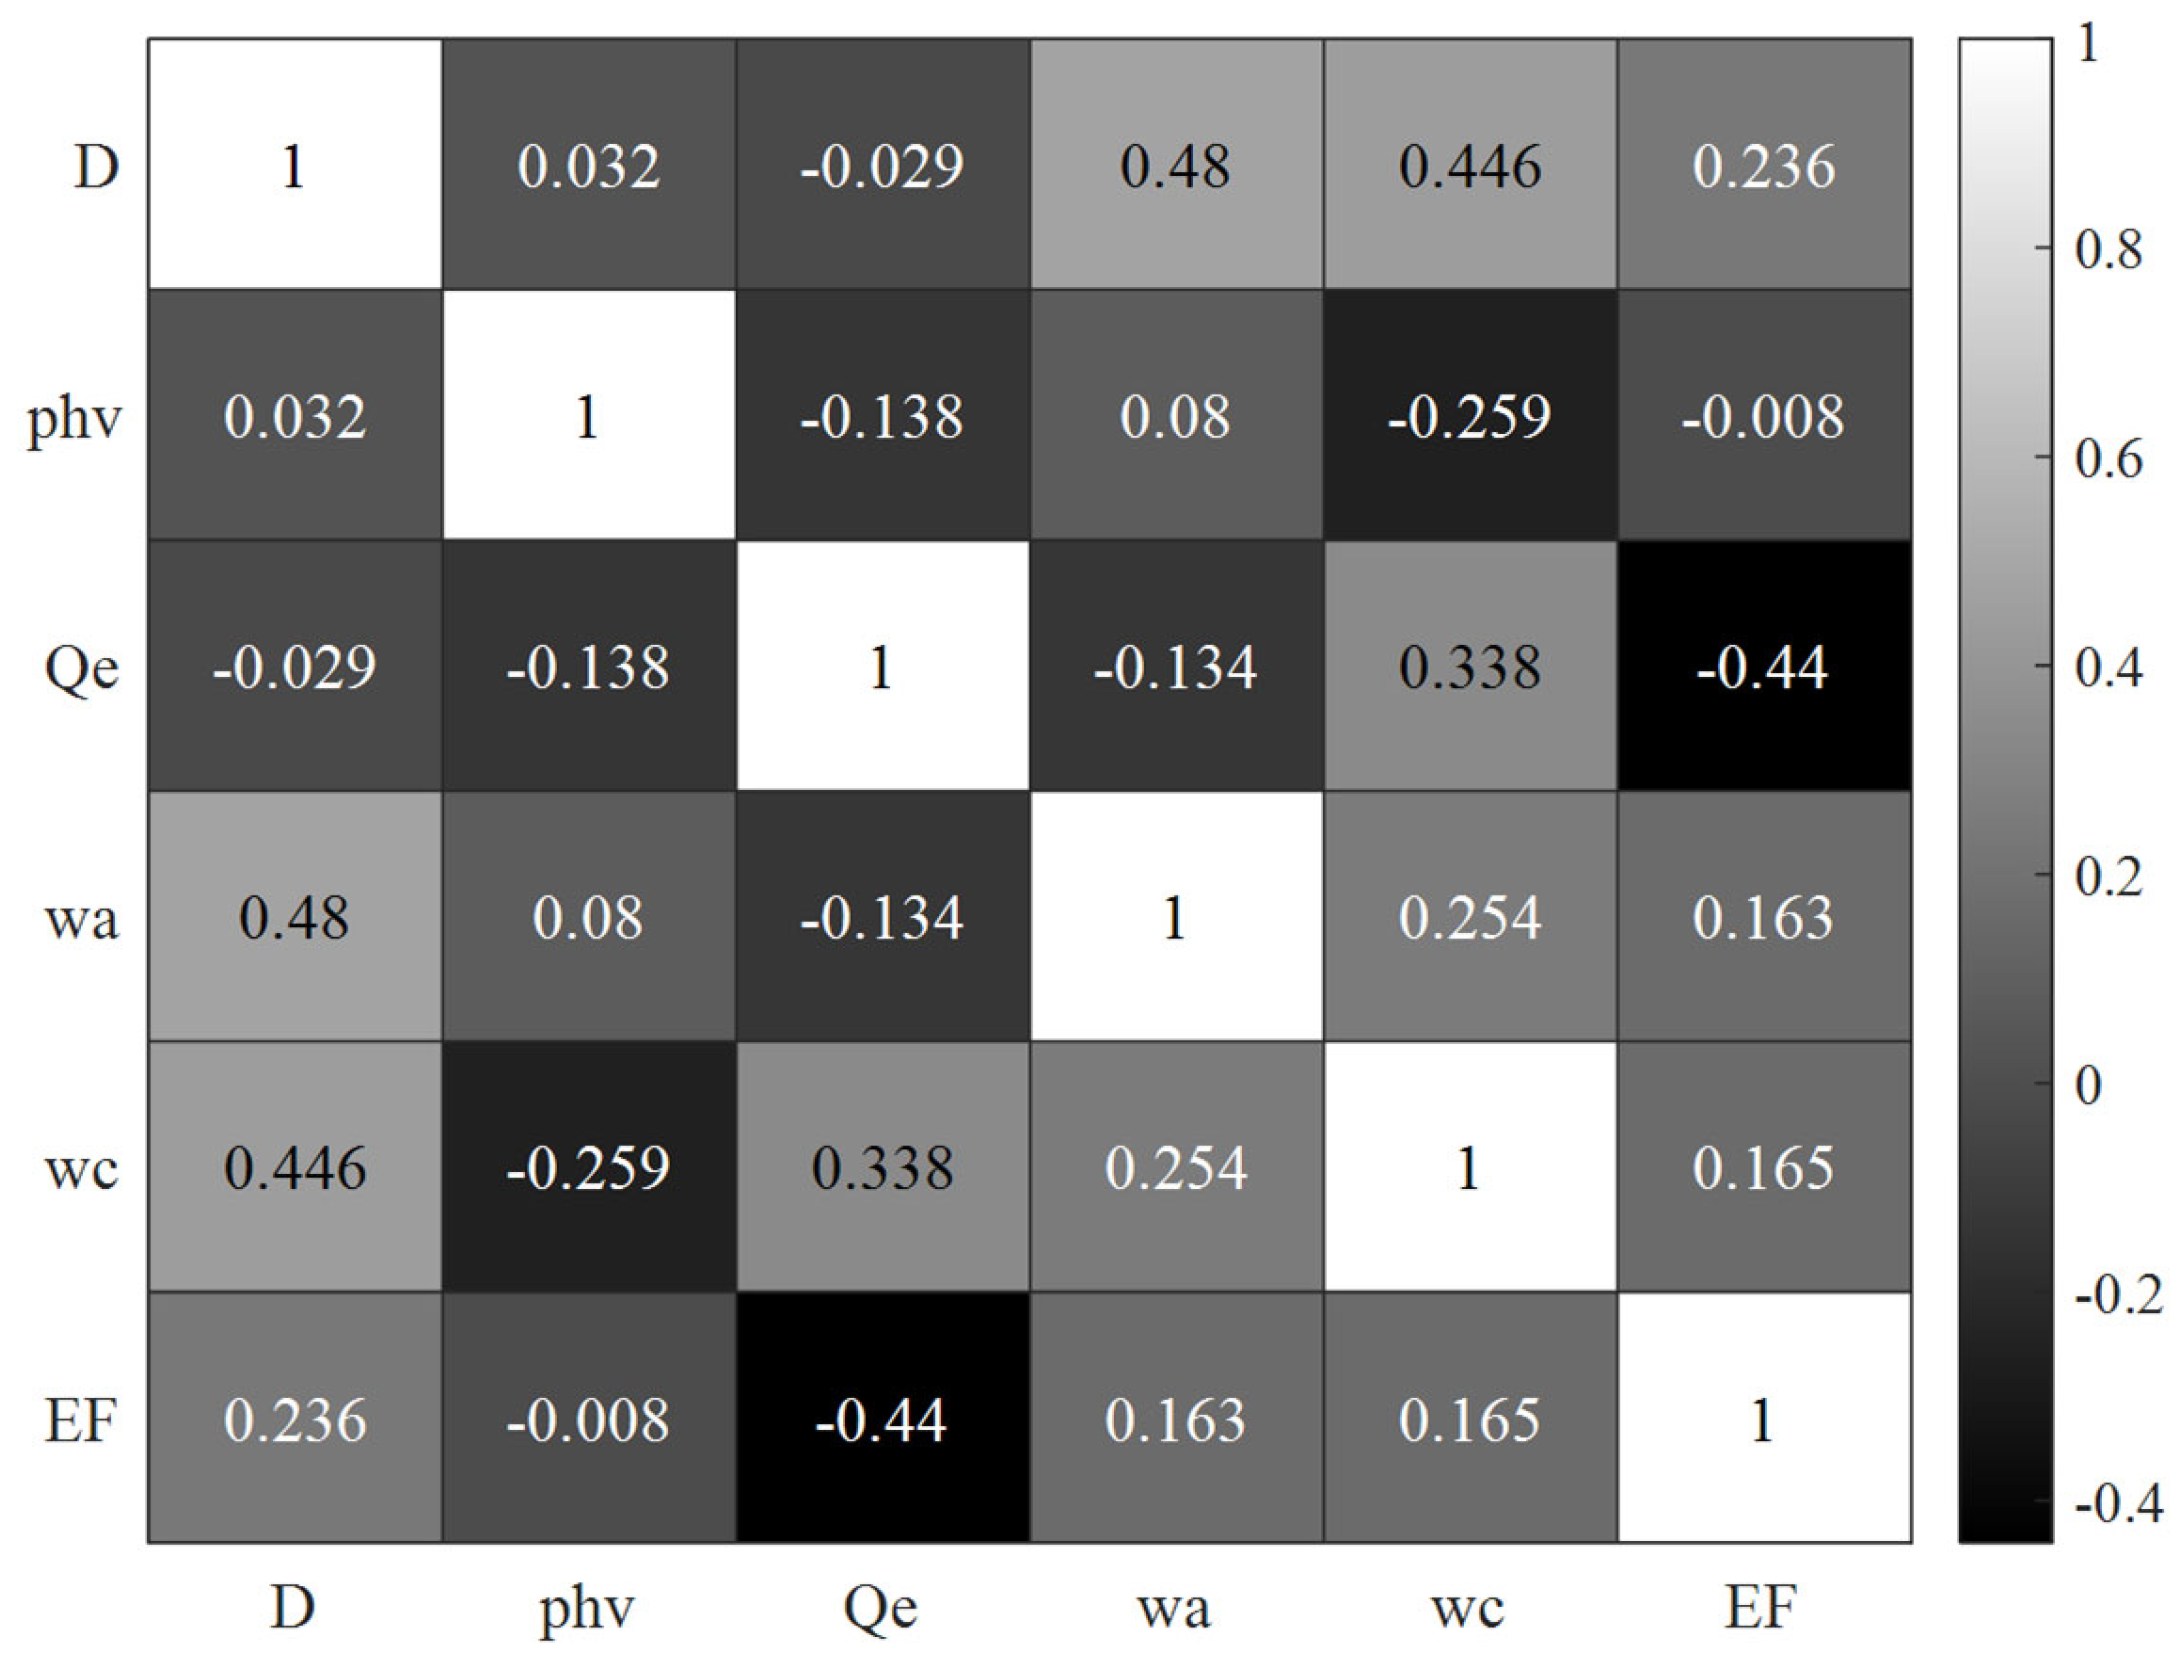
A correlation matrix is utilized in various disciplines to determine the relationship between dependent and/or independent variables [63,64]. The correlation coefficient (r) employed to explain the relationship between the variables ranges between −1 and + 1 [65]. If the value of r approaches +1, this indicates a positive and significant relationship between the considered variables. On the other hand, if the correlation coefficient approaches −1, this indicates a negative and significant relationship between variables. Additionally, if the value of r is found to be 0, this suggests no relationship between variables [66,67,68]. Within the scope of our study, a correlation matrix was created among the independent variables as exhibited by Figure 5.
As Cohen [69,70] reports, if the correlation coefficient is in the range of 0.10 < r < 0.30 , this suggests a weak relationship; if in the range of 0.30 r < 0.50 , it is medium; if r 0.50 , it is a strong relationship [71,72]. In consideration of the correlation matrix in our study, a medium-level relationship was determined between the central island diameter and approach lane width; similarly, a medium-level relationship was determined between the central island diameter and circulating width. Additionally, a negative weak relationship was determined between heavy vehicle rate and circulating width. A negative and medium-level relationship was determined between the conflict flow and the EF, whereas a medium-level relationship was determined between the conflict flow and the circulating width. As a result of the correlation analysis, if the number of medium-level relationships between independent variables is more than one, it is required to be careful with internal dependency among variables [73]. According to the current literature, it was seen that the PLSR analysis was frequently utilized when internal dependency is determined among independent variables [74]. In this regard, the PLSR analysis was employed in our study. Equation (16) exhibits the capacity estimation model obtained as a result of the analysis results of the PLSR method:
Q c = 1111.71 + 49.16 l 0 ; 1 + 1.08 · D 545.23 · E F 3.47 · p h v 0.41 · Q e + 92.65 · w a + 22.86 · w c
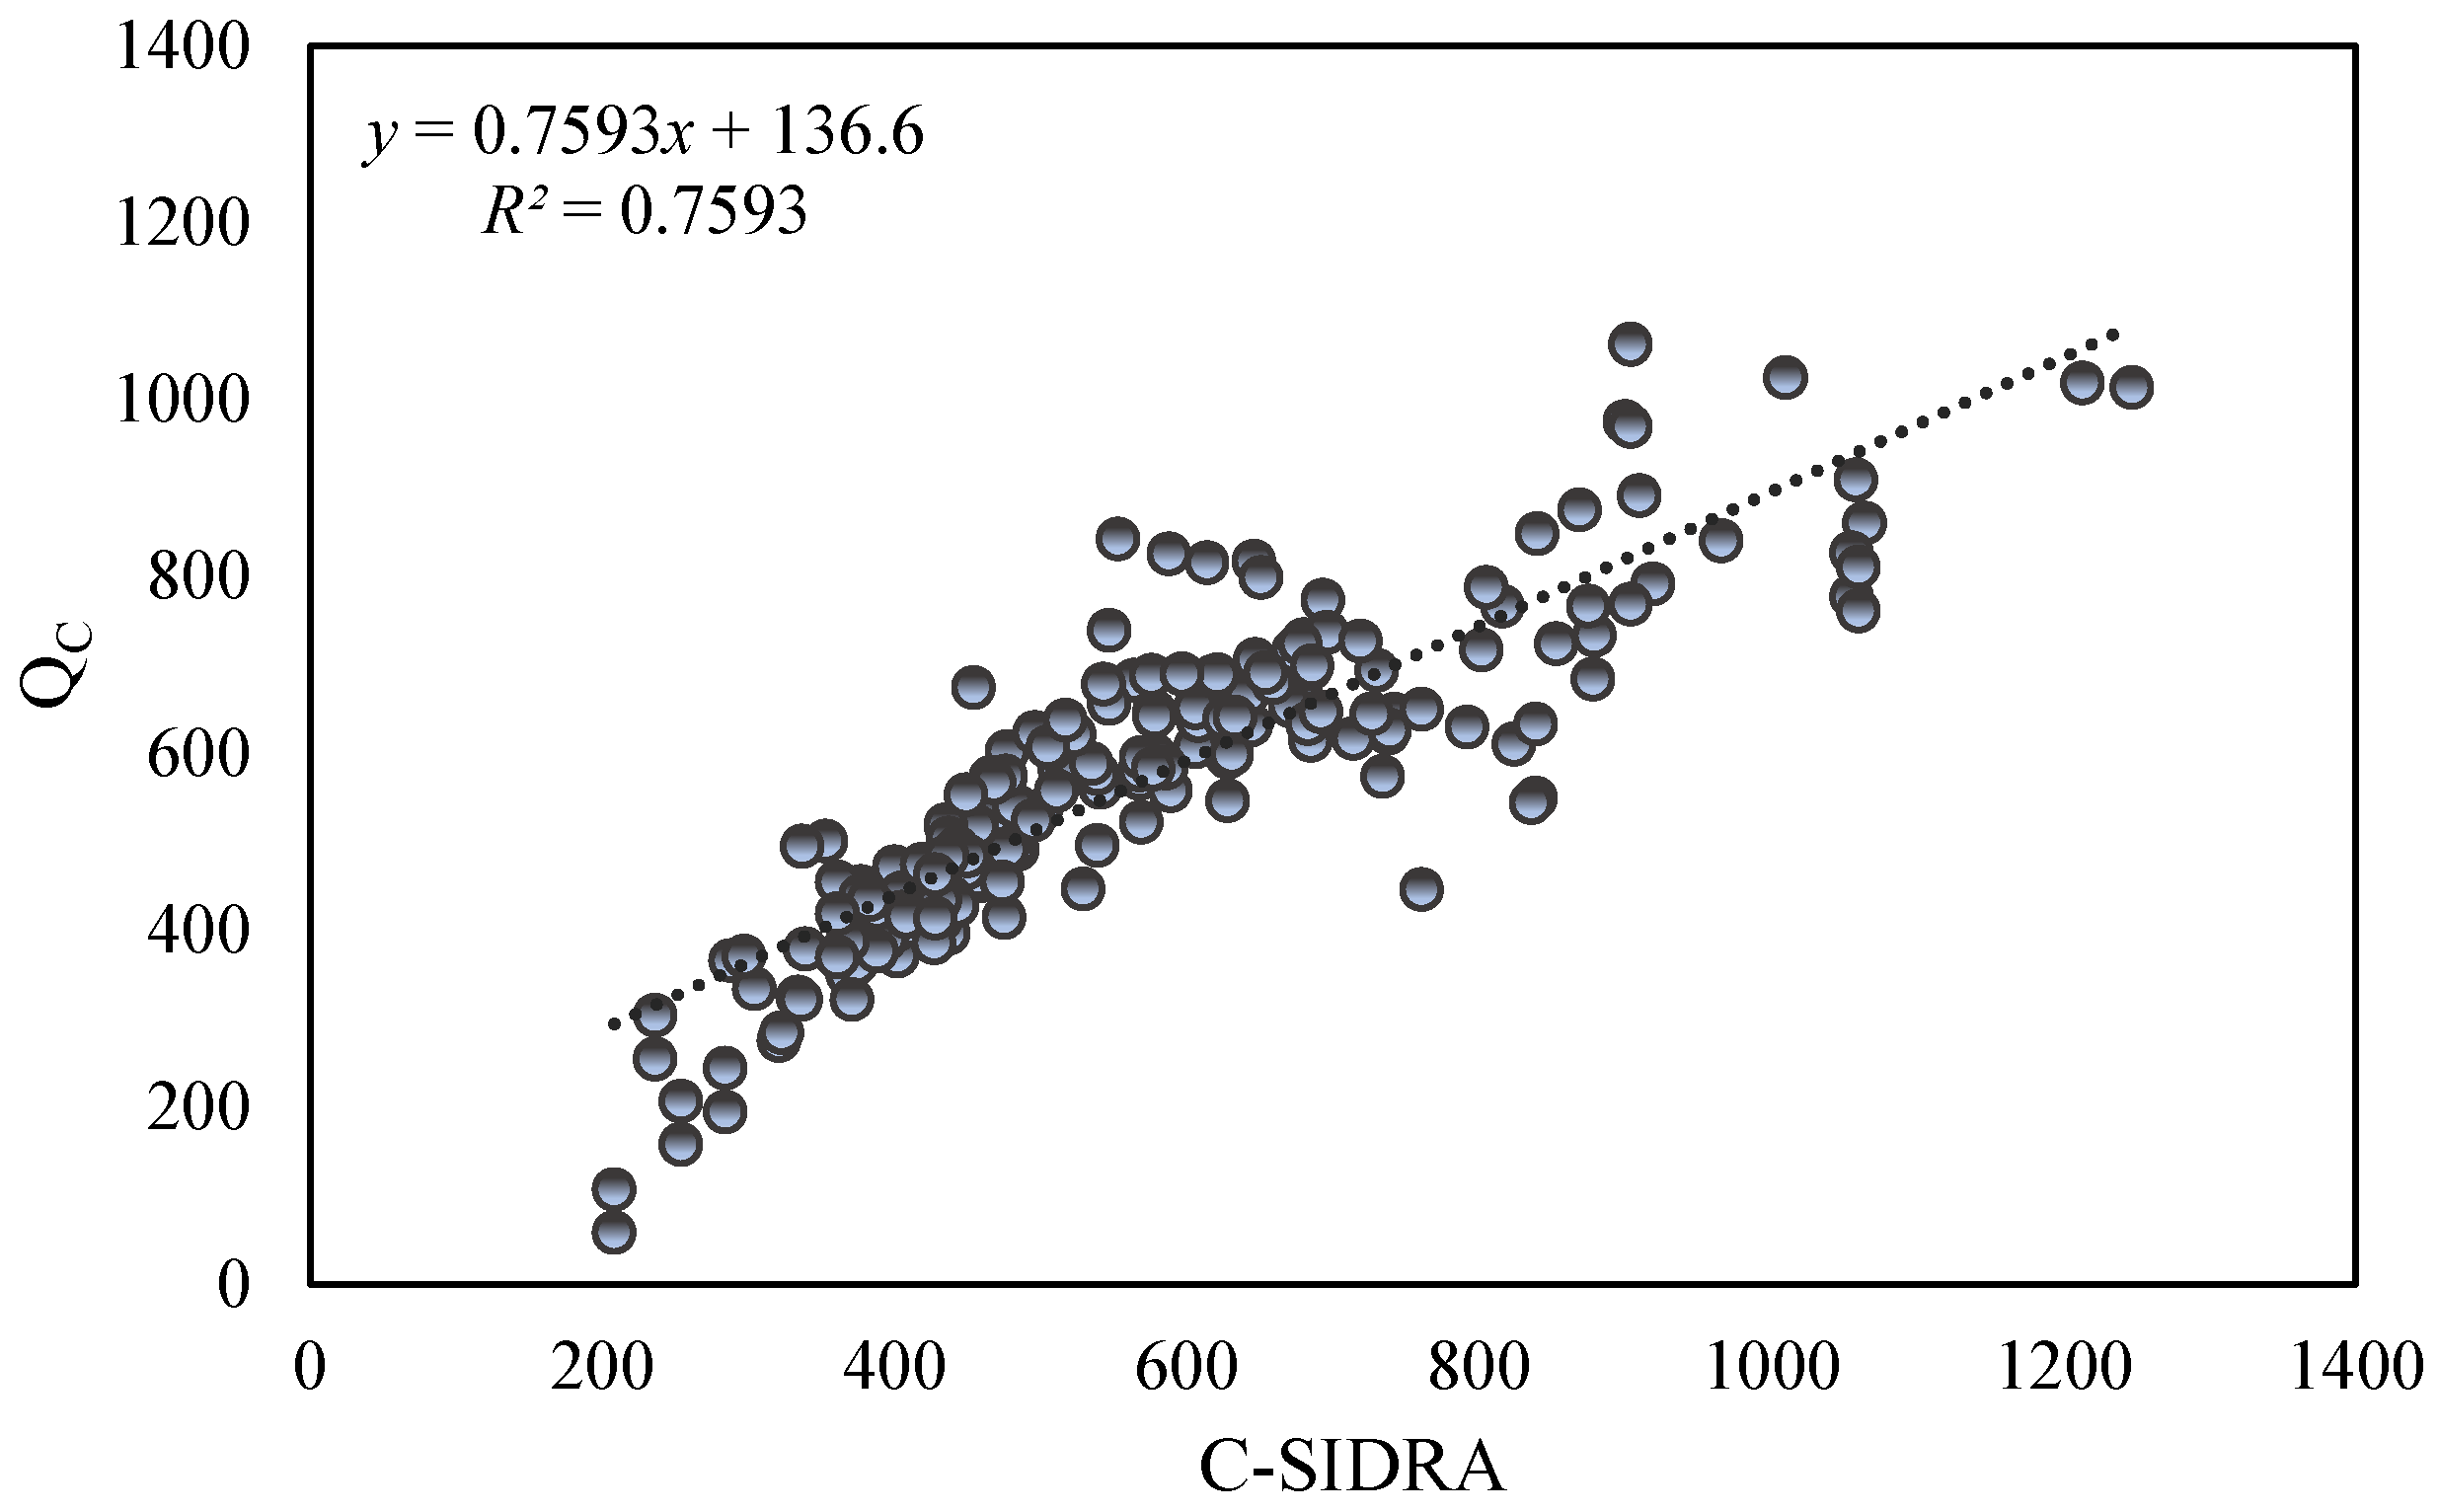
Figure 6 compares the capacity values ( Q c ) obtained with the capacity estimation model and the values obtained with C-SIDRA. Our findings suggested a similarity between the capacity estimation model obtained as a result of PLSR analysis and the C-SIDRA capacity values calibrated with the developed DEBCAM.

5. Conclusions and Future Studies

In parallel with the objectives of the present study, a calibration model was developed in order to optimize the EF parameter representing driver behaviors in the SIDRA software. While driver behaviors have been identified as one of the most influential factors affecting the accuracy and reliability of software-based analyses of roundabout capacity, the EF parameter is used to account for such behavioral variations in the SIDRA. However, determining an appropriate EF value for specific local conditions can be challenging. To address this issue, a DEBCAM was developed. For testing the administrative capability of the DEBCAM, field data was collected across eight different modern roundabouts in several cities in Turkey by means of drone surveillance; average vehicle delays were observed at the same time. After field observations, average delays (d0), flow rate (q), heavy vehicle rate ( p h v ) , conflict flow (Qe), right-turning (qr), left-turning (ql), and straight-going (qth) vehicle rates were captured for all intersections.
The DE algorithm was used in the DEBCAM due to its straightforward structure, robustness, and heuristic nature. One of its key advantages lies in its relatively low dependence on control parameters compared to many other optimization algorithms, which makes it easier to implement and tune. On the other hand, the use of a bi-level programming model provides a clear understanding of how changes made at the upper level, specifically to the EF parameter, affect the performance parameters of the roundabout obtained from SIDRA simulations at the lower level. In other words, this method facilitates the identification of the relationship between driver behavior adjustments and the resulting variations in capacity, delay, and other performance indicators, thereby providing a systematic framework for model calibration and optimization. Based on this approach, EF parameters of intersection-approaching roads were utilized as the decision variable at the upper level of the DEBCAM. At the lower level, simulations were conducted by the SIDRA software to obtain average delays. Intersections were analyzed with the DEBCAM, in which the objective function was taken as the difference in observation and SIDRA average delays; thus, optimum values of EF parameters were estimated for these intersections. Afterwards, the PLSR method was utilized in our regression analysis, which yielded a capacity estimation model whose results displayed significant conformity with the C-SIDRA’s results. The comparison between the C-SIDRA capacity results and the outcomes of the PLSR-based capacity estimation model revealed a strong level of agreement, with an R2 value of approximately 0.76, demonstrating the reliability and predictive capability of the proposed model. Furthermore, it was concluded that our capacity estimation model, structured based on modern fundamental roundabout data in addition to optimized EF parameters, such as heavy vehicle rate, approaching lane width, circulating width, central island diameter, and conflict flow, would introduce valuable support for decision makers.
The findings of this study clearly demonstrate that roundabout capacity is strongly influenced by geometric characteristics such as diameter, approach lane width, and circulating width. The analyses conducted using roundabouts with diverse geometric configurations confirmed that these parameters have a direct and significant impact on capacity outcomes. Furthermore, the results emphasized that employing optimized values of the EF parameter substantially enhances the accuracy of capacity estimation. Our results strongly suggested that the SIDRA software, a microscopic simulation software utilized in modern roundabout analyses, needs to be calibrated according to the domestic conditions. These insights underline the importance of integrating both geometric design and localized driver behavior calibration in achieving reliable and realistic roundabout performance evaluations. Additionally, accurate roundabout capacity estimation plays a crucial role in promoting sustainable transportation. By precisely predicting the maximum traffic volumes a roundabout can handle, decision makers and planners can design intersections that minimize delays and prevent congestion. This leads to lower fuel consumption and fewer emissions, contributing to environmental sustainability. Moreover, well-calibrated capacity models enhance traffic safety and provide more predictable traffic flows. Consequently, accessibility for all road users can be enhanced, promoting socially inclusive and efficient urban mobility.
On the other hand, it is obvious that the findings presented in this study do not fully resolve all issues related to the estimation of roundabout capacity. However, they clearly highlight the necessity for continued investigation to enhance the accuracy and applicability of capacity estimation models. Since the data obtained from only eight roundabouts in this study may be insufficient to represent all possible geometric and operational conditions, expanding the dataset will improve the robustness and generalizability of the proposed model. Thus, selection criteria may be created for decision makers during their analyses of roundabout intersections using simulation software. As another potential future contribution on this topic, the long-term monitoring of driver behavior trends at roundabouts should be conducted. Identifying and analyzing the factors that contribute to behavioral changes over time will provide valuable insights for model updates. Continuous observation will allow the periodic calibration of the developed models, ensuring that they remain adaptive to evolving traffic dynamics and driver behavior patterns.

Author Contributions

Conceptualization, D.E. and O.B.; Methodology, D.E. and O.B.; Software, D.E.; Formal Analysis, D.E. and O.B.; Data Curation, D.E. and O.B.; Writing—Original Draft Preparation, D.E.; Writing—Review and Editing, O.B.; Visualization, D.E.; Supervision, O.B. All authors have read and agreed to the published version of the manuscript.

Funding

This research received no external funding.

Institutional Review Board Statement

Not applicable.

Informed Consent Statement

Not applicable.

Data Availability Statement

Some or all data that support the findings of this study are available from the corresponding author upon reasonable request.

Conflicts of Interest

The authors declare that there is no conflict of interest regarding the publication of this paper.

References

  1. Sisiopiku, V.; Oh, H. Evaluation of roundabout performance using SIDRA. J. Transp. Eng. 2001, 127, 143–150. [Google Scholar] [CrossRef]
  2. Erol, D. Kent İçi Işıklı ve Dönel Kavşak Uygulamalarının Performans Kriterlerine Etkisi: Denizli Örneği. Master’s Thesis, Pamukkale University, Denizli, Turkey, 2018. [Google Scholar]
  3. Ahmad, A.; Rastogi, R. Calibrating HCM model for roundabout entry capacity under heterogeneous traffic. J. Mod. Transp. 2019, 27, 293–305. [Google Scholar] [CrossRef]
  4. Tanyel, S. Türkiye’deki Dönel Kavşaklar Için Kapasite Hesap Yöntemi. Ph.D. Thesis, İstanbul Teknik University, İstanbul, Turkey, 2001. [Google Scholar]
  5. Silva, A.B.; Santos, S.; Vasconcelos, L.; Seco, A.; Silva, J.P. Driver behavior characterization in roundabout crossings. In Proceedings of the 17th Meeting of the EURO Working Group on Transportation (EWGT 2014), Seville, Spain, 2–4 July 2014. [Google Scholar]
  6. Yap, Y.H.; Gibson, M.H.; Waterson, B.J. An International Review of Roundabout Capacity Modelling. Transp. Rev. 2013, 33, 593–616. [Google Scholar] [CrossRef]
  7. Liu, W.W.; Qin, Y.; Dong, H.H.; Yang, Y.F. Driving behavior parameter sensitivity analysis based on VISSIM. Appl. Mech. Mater. 2014, 668, 1453–1457. [Google Scholar] [CrossRef]
  8. Erol, D.; Başkan, Ö.; Ozan, C. Dönel Kavşak Uygulamalarında Merkez Ada Yarıçapının Gecikme ve Hız Parametrelerine Etkisinin İncelenmesi. In proceeding of the International Congress on Engineering and Arhitecture (ENAR), Alanya, Turkey, 14–18 November 2018. [Google Scholar]
  9. Al-Masaeid, H.R.; Faddah, M.Z. Capacity of roundabouts in Jordan. Transp. Res. Rec. 1997, 1572, 76–85. [Google Scholar] [CrossRef]
  10. Hagring, O.; Rouphail, N.M.; Sørensen, H.A. Comparison of capacity models for two-lane roundabouts. Transp. Res. Rec. 2003, 1852, 114–123. [Google Scholar] [CrossRef]
  11. Tanyel, S. Yuvarlakada Kavşaklarda Anaakımdaki Ağır Araç Yüzdesinin Yanyol Kapasitesi Üzerindeki Etkisi. Deü Mühendislik Fakültesi Fen Ve Mühendislik Derg. 2005, 7, 19–30. [Google Scholar]
  12. Cheng, J.; Yang, X.; Deng, W.; Huang, X. Driver’s critical gap calibration at urban roundabouts: A case study in China. Tsinghua Sci. Technol. 2008, 13, 237–242. [Google Scholar] [CrossRef]
  13. Tanyel, S.; Yayla, N. Yuvarlakada kavşakların kapasiteleri üzerine bir tartışma. İMO Tek. Dergi 2010, 21, 4935–4958. [Google Scholar]
  14. Yin, D.; Qiu, T.Z. Comparison of Macroscopic and Microscopic Simulation Models in Modern Roundabout Analysis. Transp. Res. Rec. J. Transp. Res. Board 2011, 2265, 244–252. [Google Scholar] [CrossRef]
  15. Wang, W.; Yang, X. Research on Capacity of Roundabouts in Beijing. In Proceedings of the 8th International Conference on Traffic and Transportation Studies (ICTTS), Changsha, China, 1–4 August 2012. [Google Scholar]
  16. Shi, J.; Wang, W.; Yang, X. Model of Capacity Estimation of Roundabout in Beijing. In Proceedings of the IEEE 17th International Conference on Intelligent Transportation Systems (ITSC 2014), Qingdao, China, 8–11 October 2014; IEEE: Piscataway, NJ, USA. [Google Scholar]
  17. Chen, X.; Lee, M.S. A case study on multi-lane roundabouts under congestion: Comparing software capacity and delay estimates with field data. J. Traffic Transp. Eng. (Engl. Ed.) 2016, 3, 154–165. [Google Scholar] [CrossRef]
  18. Macioszek, E.; Akçelik, R. A comparison of two roundabout capacity models. In Proceedings of the 5th International Roundabout Conference, Transportation Research Board, Green Bay, WI, USA, 8–10 May 2017. [Google Scholar]
  19. Fang, C.F.; Castaneda, H. Computer Simulation Modeling of Driver Behavior at Roundabouts. Int. J. Intell. Transp. Syst. Res. 2018, 16, 66–77. [Google Scholar]
  20. Stanimirovic, D.; Bogdanović, V.; Davidović, S.; Zavadskas, E.K.; Stević, Ž. The Influence of the Participation of Non-Resident Drivers on Roundabout Capacity. Sustainability 2019, 11, 3896. [Google Scholar] [CrossRef]
  21. Karunarathne, H.K.D.T.; Sandaruwan, M.A.K.; Madushani, U.K.A.H.; Wickramasinghe, W.M.V.S.K. Capacity Analysis for Urban Roundabouts in Sri Lanka Using Modified SIDRA Model. In Proceedings of the 10th International Conference on Structural Engineering and Construction Management (ICSECM), Kandy, Sri Lanka, 13–15 December 2019. [Google Scholar]
  22. Macioszek, E. Roundabout Entry Capacity Calculation—A Case Study Based on Roundabouts in Tokyo, Japan, and Tokyo Surroundings. Sustainability 2020, 12, 1533. [Google Scholar] [CrossRef]
  23. Shaaban, K.; Hamad, H. Critical Gap Comparison between One-, Two-, and Three-Lane Roundabouts in Qatar. Sustainability 2020, 12, 4232. [Google Scholar] [CrossRef]
  24. Anagnostopoulos, A.; Kehagia, F.; Damaskou, E.; Mouratidis, A.; Aretoulis, G. Predicting Roundabout Lane Capacity using Artificial Neural Networks. J. Eng. Sci. Technol. Rev. 2021, 14, 210–215. [Google Scholar] [CrossRef]
  25. Pratellia, A.; Brocchini, L. Two Geometry Roundabouts: Estimation of Capacity. Transp. Res. Procedia 2022, 64, 232–239. [Google Scholar] [CrossRef]
  26. Assolie, A.A.; Sukor NS, A.; Khliefat, I.; Abd Manan, T.S.B. Modeling of Queue Detector Location at Signalized Roundabouts via VISSIM Micro-Simulation Software in Amman City, Jordan. Sustainability 2023, 15, 8451. [Google Scholar] [CrossRef]
  27. Chen, S.; Piao, L.; Zang, X.; Luo, Q.; Li, J.; Yang, J.; Rong, J. Analyzing differences of highway lane-changing behavior using vehicle trajectory data. Phys. A Stat. Mech. Its Appl. 2023, 624, 128980. [Google Scholar] [CrossRef]
  28. Tang, L.; Zhang, D.; Han, Y.; Fu, A.; Zhang, H.; Tian, Y.; Yue, L.; Wang, D.; Sun, J. Parallel-Computing-Based Calibration for Microscopic Traffic Simulation Model. Transp. Res. Rec. 2024, 2678, 279–294. [Google Scholar] [CrossRef]
  29. Guerrieri, M. Total capacity and LOS estimation of innovative and conventional roundabouts through macroscopic fundamental diagrams. Transp. Res. Interdiscip. Perspect. 2024, 27, 101232. [Google Scholar] [CrossRef]
  30. Afshari, A.; Lee, J.; Besenski, D.; Dimitrijevic, B.; Spasovic, L. Calibrating Microscopic Traffic Simulation Model Using Connected Vehicle Data and Genetic Algorithm. Appl. Sci. 2025, 15, 1496. [Google Scholar] [CrossRef]
  31. Avsar, Ö.Y.; Yıldırım, Z.B.; Politi, R.R.; Tanyel, S. Investigation of the effect of geometric irregularities on capacity of traffic circles by using partial least squares regression method. Can. J. Civ. Eng. 2024, 51, 1388–1408. [Google Scholar] [CrossRef]
  32. Algherbal, E.A.; Ratrout, N.T. A Comparative Analysis of Currently Used Microscopic, Macroscopic, and Mesoscopic Traffic Simulation Software. In Proceedings of the 1st International Conference on Smart Mobility and Logistics Ecosystems (SMiLE), Dhahran, Saudi Arabia, 17–19 September 2024. [Google Scholar]
  33. Akcelik & Associates Pty Ltd. SIDRA Intersection 8.0 User Guide; Akcelik & Associates PTY Ltd.: Greythorn, Australia, 2016. [Google Scholar]
  34. Gedizlioğlu, E. Denetimsiz Kavşaklarda Yanyol Sürücülerinin Davranışlarına Göre Pratik Kapasite Saptanması Için bir Yöntem. Ph.D. Thesis, İstanbul Teknik University, İstanbul, Turkey, 1979. [Google Scholar]
  35. Colson, B.; Marcotte, P.; Savard, G. An overview of bilevel optimization. Ann. Oper. Res. 2007, 153, 235–256. [Google Scholar] [CrossRef]
  36. Wang, Y.; Zhang, Y.; Qi, X.; Wang, M.; Wang, X. A Bi-Level Optimization Model for Virtual Power Plant Membership Selection Considering Load Time Series. Sustainability 2023, 15, 2138. [Google Scholar] [CrossRef]
  37. Başkan, Ö. Karınca Kolonisi Optimizasyonu ile Ulaşım ağ Tasarımı. Ph.D. Thesis, Pamukkale University, Denizli, Turkey, 2009. [Google Scholar]
  38. Storn, R.; Price, K. Differential Evolution: A Simple and Efficient Adaptive Scheme for Global Optimization over Continuous Spaces; Technical Report TR-95-012; International Computer Science Institute: Berkeley, CA, USA, 1995. [Google Scholar]
  39. Başkan, Ö. Birleştirilmiş Ulaşım Ağ Tasarım Probleminin Diferansiyel Gelişim Algoritması ile Çözümü. In Proceedings of the 10. Ulaştırma Kongresi, İzmir, Turkey, 24–27 September 2013. [Google Scholar]
  40. Başkan, Ö.; Ceylan, H. Ulaşım Ağ Tasarımı Problemlerinin Çözümünde Diferansiyel Gelişim Algoritması Tabanlı Çözüm Yaklaşımları. Pamukkale Üniversitesi Mühendislik Bilim. Derg. 2014, 20, 324–331. [Google Scholar] [CrossRef]
  41. Baskan, O.; Ceylan, H.; Ozan, C. A Simultaneous Solution for Reserve Capacity Maximization and Delay Minimization Problems in Signalized Road Networks. J. Adv. Transp. 2019, 6203137. [Google Scholar] [CrossRef]
  42. Karaboğa, D. Yapay Zekâ Optimizasyon Algoritmaları; Nobel Publication: İstanbul, Turkey, 2004. [Google Scholar]
  43. Karaboga, D.; Basturk, B. Image Segmentation Using Differential Evolution Algorithm. In Proceedings of the 13th IEEE Signal Processing and Communications Applications Conference (SIU 2005), Kayseri, Turkey, 16–18 May 2005. [Google Scholar]
  44. Gürarslan, G. Yeraltı Suyu Kirletici Kaynak Yerlerinin ve Boşalım Geçmişlerinin Diferansiyel Gelişim Algoritması Kullanılarak Belirlenmesi. Ph.D. Thesis, Pamukkale University, Denizli, Turkey, 2011. [Google Scholar]
  45. Liu, H.; Cai, Z.; Wang, Y. Hybridizing Particle Swarm Optimization with Differential Evolution for Constrained Numerical and Engineering Optimization. Appl. Soft Comput. 2010, 10, 629–640. [Google Scholar] [CrossRef]
  46. Keskintürk, T. Diferansiyel Gelişim Algoritması. İstanbul Ticaret Üniversitesi Fen Bilim. Derg. 2006, 5, 85–99. [Google Scholar]
  47. Baskan, O. A Multiobjective Bilevel Programming Model for Environmentally Friendly Traffic Signal Timings. Adv. Civ. Eng. 2019, 2019, 1638618. [Google Scholar] [CrossRef]
  48. Abadi, A.; Rajabioun, T.; Ioannou, P.A. Traffic flow prediction for road transportation networks with limited traffic data. IEEE Trans. Intell. Transp. Syst. 2014, 16, 653–662. [Google Scholar] [CrossRef]
  49. Kang, N.; Kanbe, N.; Nakamura, H.; Odaka, S. Development and validation of a roundabout entry capacity model considering pedestrians under Japanese conditions. Asian Transp. Stud. 2016, 4, 350–365. [Google Scholar]
  50. Politi, R.R.; Tanyel, S. Minimizing Delay at Closely Spaced Signalized Intersections Through Green Time Ratio Optimization: A Hybrid Approach With K-Means Clustering and Genetic Algorithms. IEEE Veh. Technol. Soc. Sect. 2025, 13, 43981–43999. [Google Scholar] [CrossRef]
  51. An, H.K.; Javeed, M.A.; Bae, G.; Zubair, N.; Metwally, A.S.M.; Bocchetta, P.; Na, F.; Javed, M.S. Optimized Intersection Signal Timing: An Intelligent Approach-Based Study for Sustainable Models. Sustainability 2022, 14, 11422. [Google Scholar] [CrossRef]
  52. Gürünlü Alma, Ö.; Vupa, Ö. Regresyon Analizinde Kullanılan En Küçük Kareler ve En Küçük Medyan Kareler Yöntemlerinin Karşılaştırılması. SDÜ Fen Edeb. Fakültesi Fen Derg. E-Dergi 2008, 3, 219–229. [Google Scholar]
  53. Birkes, D.; Dodge, Y. Alternative Methods of Regression; John Wiley & Sons: New York, NY, USA, 1993; pp. 80–140. [Google Scholar]
  54. Ümit, A.Ö.; Bulut, E. Türkiye’de işsizliği etkileyen faktörlerin kısmi en küçük kareler regresyon yöntemi ile analizi: 2005–2010 dönemi. Dumlupınar Üniversitesi Sos. Bilim. Derg. 2013, 37, 131–141. [Google Scholar]
  55. Bulut, E.; Alın, A. Kısmi En Küçük Kareler Regresyon Yöntemi Algoritmalarından Nipals ve PLS-Kernel Algoritmalarının Karşılaştırılması ve Bir Uygulama. Dokuz Eylül Üniversitesi İktisadi Ve İdari Bilim. Fakültesi Derg. 2009, 24, 127–138. [Google Scholar]
  56. Lu, J.; Chen, S.; Wang, W.; Van Zuylen, H.J. A hybrid model of partial least squares and neural network for traffic incident detection. Expert Syst. Appl. 2012, 39, 4775–4784. [Google Scholar] [CrossRef]
  57. Wang, W.; Chen, S.; Qu, G. Incident Detection Algorithm Based on Partial Least Squares Regression. Transp. Res. Part C Emerg. Technol. 2008, 16, 54–70. [Google Scholar] [CrossRef]
  58. Skrivanek, S. The Use of Dummy Variables in Regression Analysis; More Steam, LLC.: Powell, OH, USA, 2009. [Google Scholar]
  59. Garavaglia, S.; Sharma, A. A Smart Guide to Dummy Variables: Four Applications and a Macro. In Proceedings of the Northeast SAS Users Group Conference, Pittsburgh, PA, USA, 4–6 October 1998. [Google Scholar]
  60. Chen, F.; Song, M.; Ma, X. Investigation on the injury severity of drivers in rear-end collisions between cars using a random parameters bivariate ordered probit model. Int. J. Environ. Res. Public Health 2019, 16, 2632. [Google Scholar] [CrossRef]
  61. Alomari, A.H.; Khedaywi, T.S.; Marian AR, O.; Jadah, A.A. Traffic speed prediction techniques in urban environments. Heliyon 2022, 8, e11847. [Google Scholar] [CrossRef]
  62. Toledo, T.; Koutsopoulos, N.; Ben, M. Estimation of an Integrated Driving Behavior Model. Transp. Res. Part C Emerg. Technol. 2009, 17, 365–380. [Google Scholar] [CrossRef]
  63. Graffelman, J.; De Leeuw, J. Improved approximation and visualization of the correlation matrix. Am. Stat. 2023, 77, 432–442. [Google Scholar] [CrossRef]
  64. Yılmaz Sönmez, H. Kentiçi Demiryolunda Trafik Yükünün Ray Aşınmaları Üzerindeki Etkisinin Araştırılması. Ph.D. Thesis, İstanbul Teknik University, İstanbul, Turkey, 2021. [Google Scholar]
  65. Akoglu, H. User’s guide to correlation coefficients. Turk. J. Emerg. Med. 2018, 18, 91–93. [Google Scholar] [CrossRef] [PubMed]
  66. Jierula, A.; Wang, S.; Oh, T.-M.; Wang, P. Study on accuracy metrics for evaluating the predictions of damage locations in deep piles using artificial neural networks with acoustic emission data. Appl. Sci. 2021, 11, 2314. [Google Scholar] [CrossRef]
  67. Ünver, Ö.; Gamgam, H. Uygulamalı Temel Istatistik Yöntemler; Seçkin Publication: Ankara, Turkey, 2008. [Google Scholar]
  68. Han, S.; Li, Y.; Shen, D.; Wang, C. Comprehensive evaluation method of privacy-preserving record linkage technology based on the modified criteria importance through intercriteria correlation method. Mathematics 2024, 12, 3476. [Google Scholar] [CrossRef]
  69. Cohen, J. Statistical Power Analysis for the Behavioral Sciences, 2nd ed.; Routledge: New York, NY, USA, 1988. [Google Scholar]
  70. Cohen, J. A power primer. Psychol. Bull. 1992, 112, 155–159. [Google Scholar] [CrossRef] [PubMed]
  71. Vos, J.; Farah, H.; Hagenzieker, M. How do Dutch drivers perceive horizontal curves on freeway interchanges and which cues influence their speed choice? IATSS Res. 2021, 45, 258–266. [Google Scholar] [CrossRef]
  72. Gardner, B.; Abraham, C. Psychological correlates of car use: A meta-analysis. Transp. Res. Part F Traffic Psychol. Behav. 2008, 11, 300–311. [Google Scholar] [CrossRef]
  73. Vatcheva, K.P.; Lee, M. Multicollinearity in Regression Analyses Conducted in Epidemiologic Studies. Epidemiology 2016, 6, 227. [Google Scholar] [CrossRef]
  74. Wold, S.; Sjöström, M.; Eriksson, L. PLS-regression: A basic tool of chemometrics. Chemom. Intell. Lab. Syst. 2001, 58, 109–130. [Google Scholar] [CrossRef]
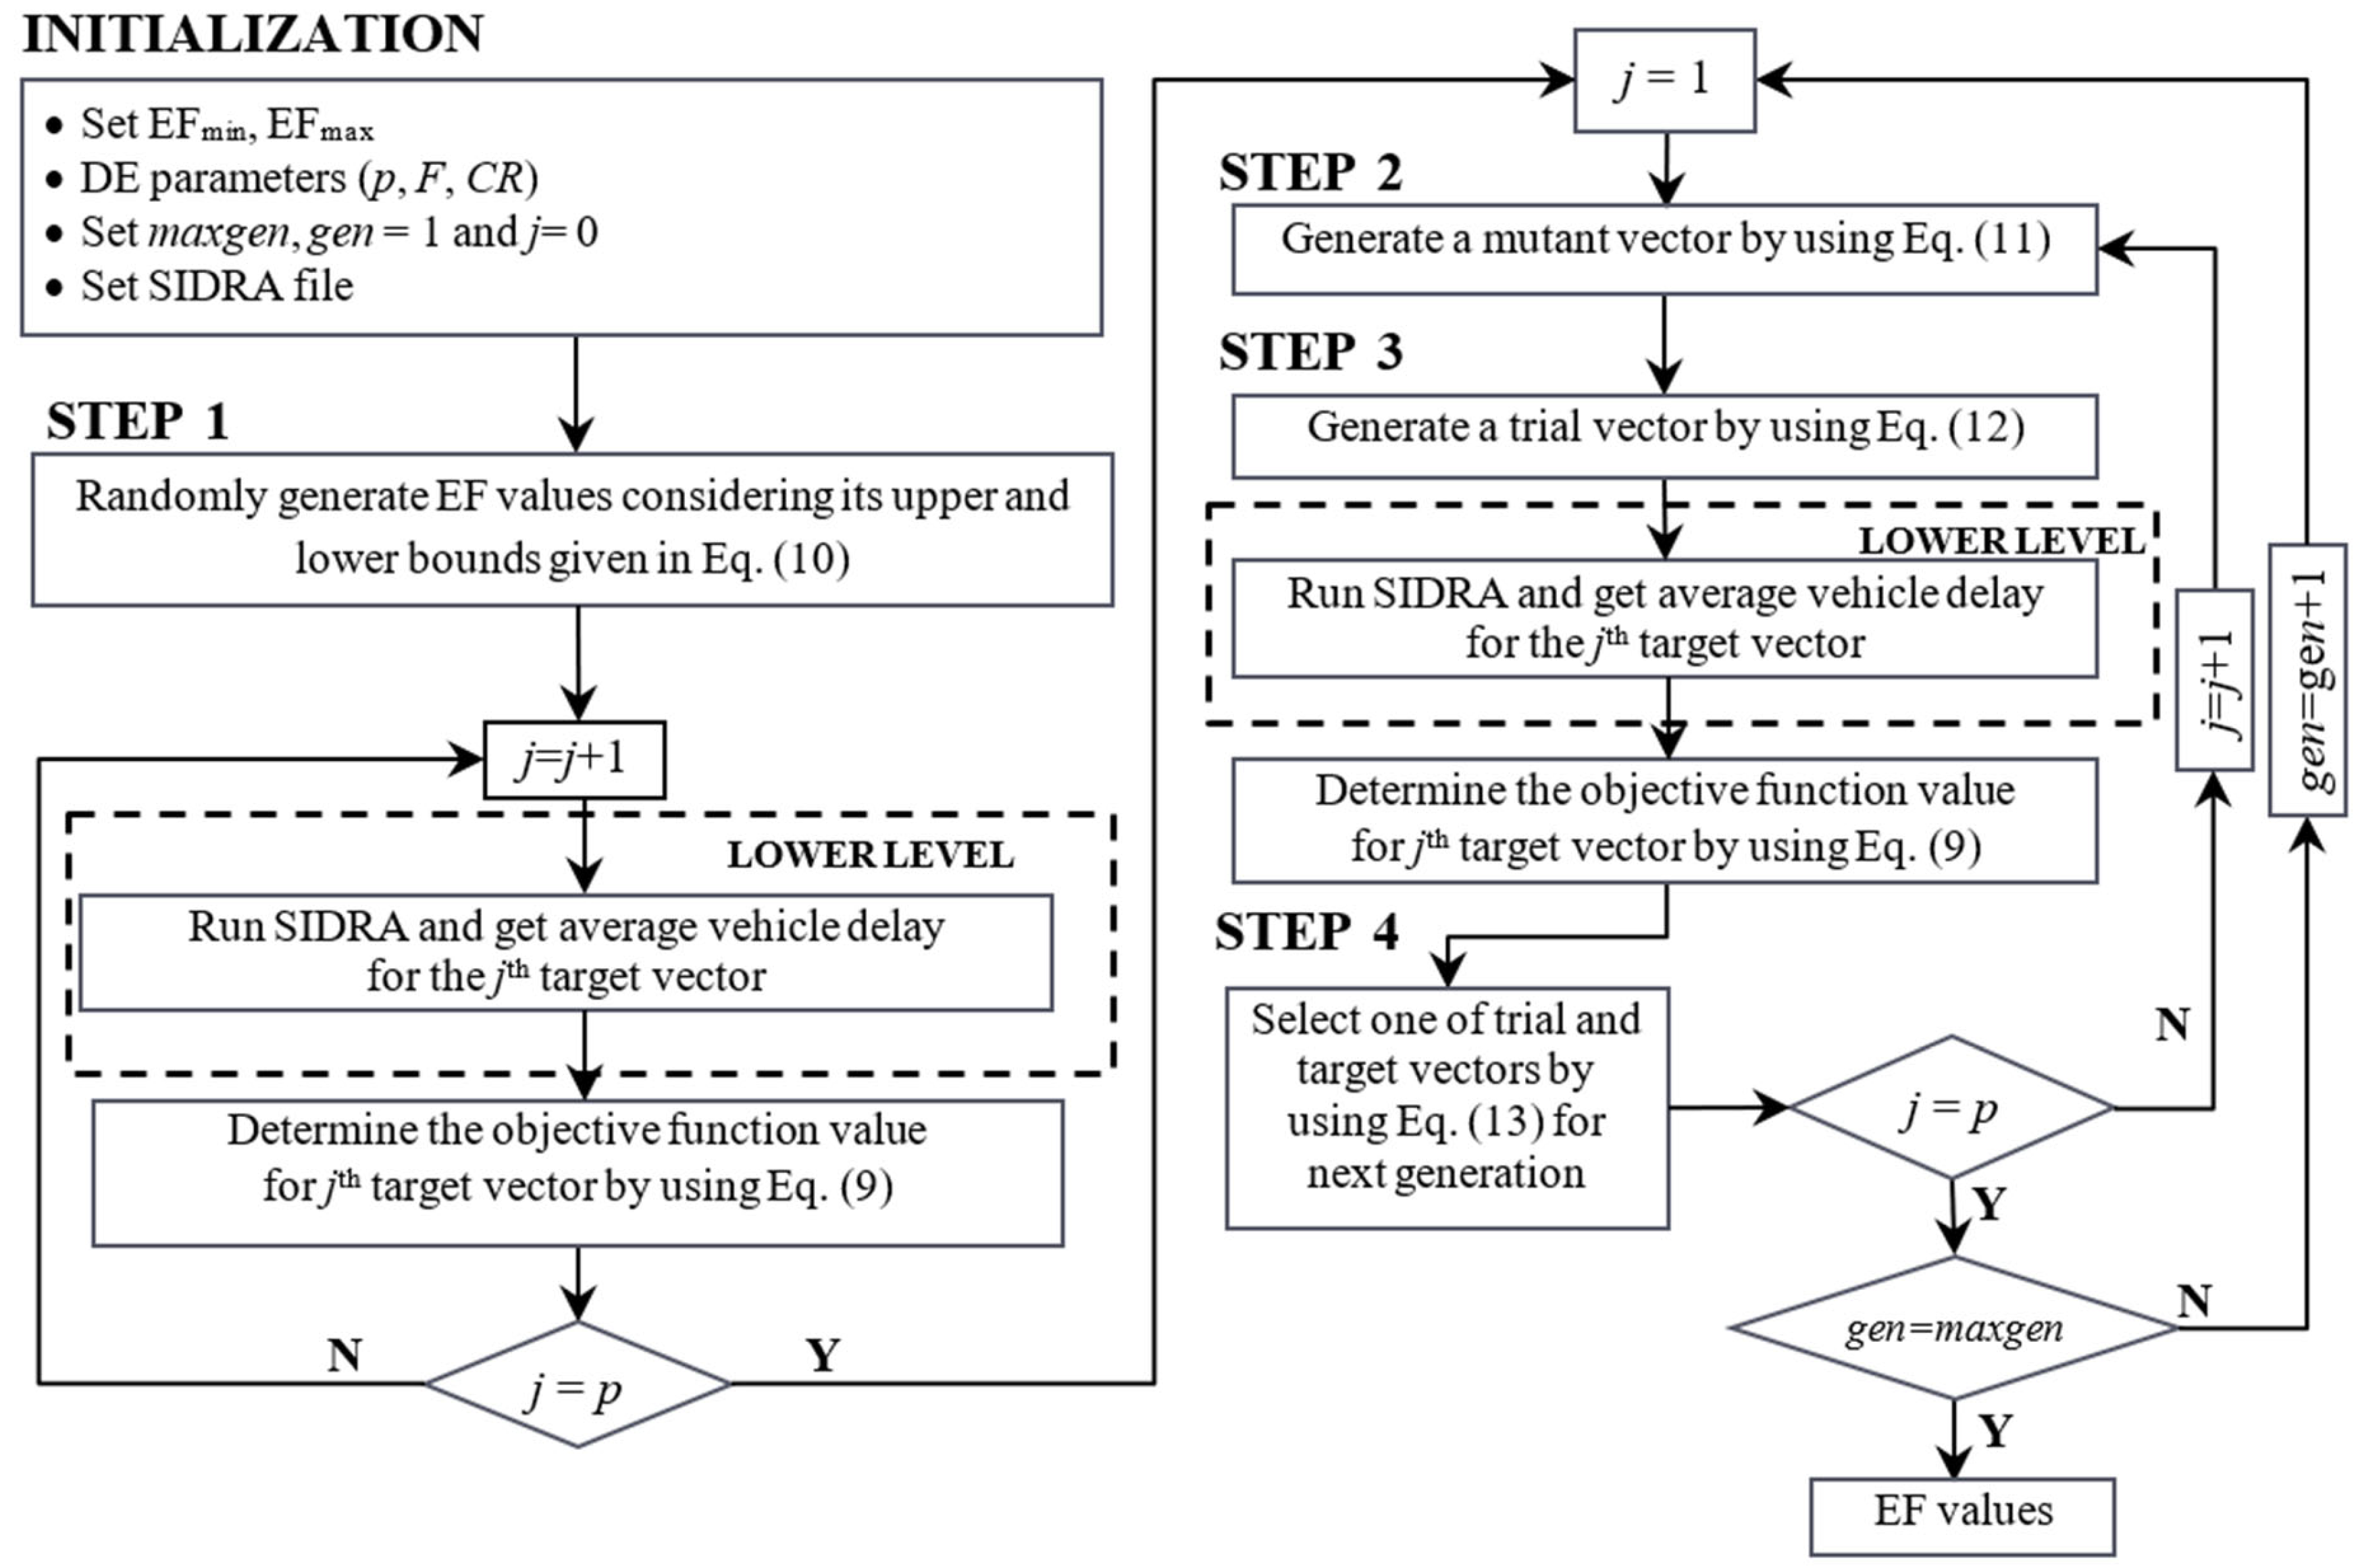
Figure 1. DEBCAM.
Figure 1. DEBCAM.
Sustainability 17 10289 g001
Figure 2. Fundamental geometric parameters of a roundabout.
Sustainability 17 10289 g002
Figure 3. Intersection Drone Images and SIDRA Illustrations.
Sustainability 17 10289 g003aSustainability 17 10289 g003b
Figure 4. SIDRA Approach Road Numbering.
Sustainability 17 10289 g004
Figure 5. Correlation Matrix.
Sustainability 17 10289 g005
Figure 6. Comparison of C-SIDRA and Qc.
Sustainability 17 10289 g006
Table 1. Intersection Data.
Intersection No.Approach
Road
No.
D (m)q (veh/h)ql (%)qr (%)qth (%)phv (%)wa
(m)
wc
(m)
d0 (s)Qe
(veh/h)
113660016107443813.72493
23667234125402.48.518.98707
3369008137903.25816.06764
43654022275103.25817.791074
217911048411503.5825.5960
27984142858282.51027.422002
3799604663053.5818.311042
47917044650473.58.522.56373
31251116191467103722.611131
22549222225603.5721.971547
32588820245653615.56632
425105618414173623.23821
4180118812276133.5917.25505
28094837253833.51025.151061
380100819186343.5920.86916
48036033234403.51023.21263
515086410385233.58.616.34556
250792543610164.2823.55777
35070814107653.58.519.57657
450564343036113.68.522.251194
6157105622255313.59.519.25796
25775641253423.69.824.8966
3578403646043.59.827.08840
457600202654631025.581219
7175109222225604.251122.381149
275156031175255.41122.911162
37568430105074.251025.631649
475100823136424.51118.611181
8175108561034114.5732.37783
27526418226094.5724.72524
3754445811484.5713.29290
47567257538144.5718.21139
Table 2. Average delay values (s).
Intersection No.Approach Road
No.
SIDRA
d s
Observation
d o
Intersection No.Approach Road
No.
SIDRA
d s
Observation
d o
114.5013.72513.1016.34
26.8018.9828.3023.55
36.2016.0633.7019.57
47.3017.7948.2022.25
21145.4025.5617.9019.25
227.7027.4227.9024.8
318.2018.3138.1027.08
47.5022.5648.2025.58
31121.1022.61717.8022.38
217.6021.9727.9022.91
39.0015.5639.7025.63
416.0023.2348.0018.61
414.6017.258117.7032.37
27.6025.15214.2024.72
36.4020.8639.4013.29
46.7023.2416.6018.21
Table 3. Optimized EF Values.
Intersection No.Approach Road No.EFIntersection No.Approach Road No.EF
111.71511.74
21.5121.40
31.3331.80
41.4241.50
210.83611.32
20.7821.49
30.8031.48
41.3541.40
310.84711.25
21.0121.24
31.2831.34
41.1041.34
411.59812.00
21.3222.00
31.3931.74
41.9141.86
Table 4. Comparison of average delay values.
Intersection No.Approach Road No. d o d s _ c Intersection No.Approach Road No. d o d s _ c
1113.72 13.705116.3416.30
218.98 19.00223.5523.60
316.06 16.10319.5719.80
417.79 17.80422.2522.30
2125.5025.506119.2519.30
227.4227.40224.8024.80
318.3118.30327.0827.10
422.5622.60425.5825.60
3122.6122.607122.3822.40
221.9722.00222.9122.90
315.5615.60325.6325.60
423.2323.20418.6118.60
4117.2514.908132.3724.10
225.1521.10224.7219.00
320.8618.20313.2913.30
423.2021.10418.2118.60
Table 5. GEH statistics values.
Intersection No.Approach Road No.GEHIntersection NoApproach Road No.GEH
110.005510.001
20.00420.010
30.01030.052
40.00240.011
210.000610.012
20.00420.000
30.00230.004
40.00840.004
310.002710.004
20.00620.002
30.01030.006
40.00640.002
410.586811.556
20.84221.223
30.60230.003
40.44640.090
Table 6. Comparison of SIDRAST and C-SIDRA capacity values.
Intersection No.Model Capacity (veh/h)
SouthEastNorthWest
Left LaneRight Lane Left LaneRight Lane Left LaneRight Lane Left LaneRight Lane
1SIDRAST124278699012731031141115631183
C-SIDRA371297431436454678761686
2SIDRAST83664123123154478910821354
C-SIDRA10641058236236588869919966
3SIDRAST5355394535278551034698826
C-SIDRA738631405477568792569742
4SIDRAST10911416790112381311757021032
C-SIDRA727730535608577644284284
5SIDRAST114414458768511111921820647
C-SIDRA353839477606434458368401
6SIDRAST437761466523374432336360
C-SIDRA642673456468511505413361
7SIDRAST7521070108510855347637691066
C-SIDRA57669610551055368439578654
8SIDRAST124278699012731031141115631183
C-SIDRA371297431436454678761686
Disclaimer/Publisher’s Note: The statements, opinions and data contained in all publications are solely those of the individual author(s) and contributor(s) and not of MDPI and/or the editor(s). MDPI and/or the editor(s) disclaim responsibility for any injury to people or property resulting from any ideas, methods, instructions or products referred to in the content.