Abstract
Understanding the directionality of the relationship between artificial light at night (ALAN) and economic activity is crucial for evidence-based policymaking aimed at accelerating and sustaining development. In particular, this knowledge may help to ensure that ALAN does not serve just a proxy for economic activity, when information is unavailable, but may also become a meaningful development indicator on its own. However, the question remains about the directionality of the GDP–ALAN relationship: Does an increase in GDP simply leads to more nighttime light emissions, while the reverse link is negligible, or is this relationship two-directional, with ALAN affecting economic development as well. The present study attempts to answer this question by applying the Granger directionality test to time series panel data available for 1300+ EU NUTS-3 regions over the period of 2001–2021. The study aims to determine the directionality of the relationship between GDP and ALAN in European NUTS-3 regions, distinguishing between Western and Eastern Europe and between different measurement eras (DMSP-OLS vs. VIIRS). The analysis reveals a complex and bidirectional relationship that varies in strength. In particular, for the years 2001–2013, the analysis showed that GDP led to more ALAN emissions, while the reverse link was much weaker and negative. However, after 2013, this relationship has become unidirectional, with GDP continuing to lead to more ALAN emissions, but not vice versa. These findings highlight the importance of considering long-term trends when interpreting ALAN emissions as an indicator of economic development, which is widely used in empirical studies at present.
1. Introduction
Establishing the link between economic activity and measurable environmental factors, such as light emissions, is essential for evidence-based policymaking, as it allows decision makers to justify investments in lighting while optimizing energy efficiency [1,2].
Artificial Light at Night (ALAN) has become a widely used indicator of economic performance, especially in regions where traditional indicators, such as GDP or PPP, are unavailable or unreliable. Despite its popularity, significant gaps remain in our understanding of the causality of relationship between ALAN and economic development. In particular, the temporal and regional variability of this interaction remains underexplored, raising concerns about potential endogeneity and misinterpretation of results in empirical studies.
Previous studies have shown that ALAN can reflect economic activity on the ground, particularly in developing regions, and has therefore been widely used to predict GDP, monitor urbanization, and assess infrastructure development (e.g., [3,4,5]). However, these studies often treat ALAN as a one-way proxy, without exploring its potential feedback effects or how its link with GDP evolves over time and across different contexts [6,7]. Understanding the two-way connection is not only a methodological concern but also a practical one. If ALAN is used as an indicator of economic performance without accounting for its potential feedback effects, it can lead to biased interpretations of development trends and misinform policy decisions, particularly in regions undergoing rapid structural or technological change.
The present study aims to address two key research objectives: (1) to examine the direction and strength of the relationship between GDP and ALAN, and (2) to assess how this interaction varies across time periods and regional contexts. To carry out the study, Granger directionality tests were used for panel data [8]. This method allows for testing temporal precedence and potential causality in both directions across multiple regions, making it particularly suitable for evaluating dynamic and bidirectional relationships such as those between GDP and ALAN on the NUTS-3 level. The analysis was based on time series data available for European NUTS-3 regions and examined the links between GDP and ALAN for two separate periods: 2001–2013, covered by the Defence Meteorological Satellite Programme (DMSP-OLS), and the period between 2013 and 2021, covered by the Visible Infrared Imaging Radiometer Suite (VIIRS) programme. Fixed effects panel regressions were used to assess long-term trends.
Theoretical mechanisms underlying this relationship include the lighting saturation effect, where economic growth in developed regions no longer leads to increased light emissions due to infrastructure maturity and energy-saving technologies [2,9]. On the contrary, in developing regions, economic expansion often results in increased lighting due to growth and electrification of the infrastructure. Improvements in energy efficiency, such as the adoption of LED lighting and smart systems, further complicate this relationship by decoupling light emissions from economic output [10].
The conceptual model, presented in the study, provides the theoretical framework for the empirical analysis and interpretation of findings, particularly in relation to the bidirectional causality and potential endogeneity that may arise when ALAN is used as a proxy for GDP. The study also discusses the implications of using separate satellite datasets (DMSP and VIIRS) and the limitations associated with each, further contributing to the understanding of ALAN as a development indicator.
2. The Use of ALAN in Development Studies
The growing availability of ALAN data offered a way of examining socioeconomic and environmental dynamics at a subnational level [2,3,11,12]. However, understanding and interpreting the relationship between ALAN and economic growth is more important rather than simply acknowledging it [2,13,14]. In addition, the possibility of a reverse influence is critical. If increases in GDP lead to greater nighttime light emissions, while the impact of nighttime light on stimulating economic activity is limited, then using ALAN as a proxy for GDP could be accurate. However, if ALAN emission significantly affects GDP as well, such an approximation can be misleading, resulting in an endogeneity bias [15,16].
As widely acknowledged, ALAN, emitted by human-made sources during night, provides a consistent and continuous proxy for human presence and activity [17]. In addition, ALAN becomes a potent indicator of territorial development, particularly in contexts where conventional socioeconomic data is scarce or aggregated at scales being too broad for generating detailed insights [18].
In recent empirical studies, ALAN is commonly employed as a proxy for economic output, helping to track growth, identifying periods of stagnation, and evaluating the efficacy of policy interventions [3,5,19,20]. It also helps to delineate urban footprints [1,21], monitors urban sprawl [22], and pinpoint emerging urban centers [23].
Furthermore, ALAN data help to shed light on regional energy consumption patterns, help assess efficiency, and identify areas heavily affected by light pollution [24]. During crises, shifts in ALAN can swiftly signal the impact of natural disasters or conflicts on human settlements and infrastructure, facilitating rapid damage assessment and recovery monitoring [25]. Moreover, the intensity of ALAN often correlates with population density, allowing for more accurate growth estimations in areas where traditional census data may be infrequent or unreliable [26].
However, despite these advantages, the use of ALAN is beset by significant challenges. A primary concern revolves around data quality issues, which historically included sensor saturation in brightly illuminated areas, blooming effects, and difficulties with inter-satellite calibration [27].
While newer generations of ALAN sensors largely mitigate these problems, they remain crucial considerations in data interpretation [7,21,27]. The relationship between ALAN and economic development is often non-linear and can be time-varying and possibly bidirectional [2]. This inherent complexity introduces the critical risk of endogeneity bias when ALAN is used to infer economic conditions without explicitly accounting for potential reverse effects [4,16].
Other contextual factors, such as the urban–rural divide, sectoral specialization, and the overall level of development, also play a role in shaping the consistency and strength of the ALAN–economic activity linkage [2,6,10,23,28].
It should also be noted that the effect of economic development on ALAN emissions is supported by solid empirical evidence (see, e.g., [3,10,29,30]), while the empirical evidence about the reverse effect appears to be limited [7,29]. Furthermore, as empirical studies show, the relationship between nighttime lights and economic indicators is shaped by several exogenous factors:
- Urban–rural divide: the impact of ALAN on economic development appears to be stronger in urban areas than in the rural hinterland [3,29].
- Development levels: An increase in ALAN emission on economic growth appears to be stronger in developing economies than elsewhere, and tends to decrease in places with higher development levels [2,5,7,10].
- Population density tends to be negatively associated with ALAN emissions in already densely populated urban regions showing smaller marginal increases in ALAN relative to GDP growth [6].
- Sectoral differences: The intensities of ALAN emission appear to be stronger in the regions specializing on services, and weaker in the primary (agriculture) sector [10,30].
- Temporal stability: ALAN is a robust proxy for long-term economic growth [31].
- Type and quality: VIIRS data consistently show more robust results than the DMSP source [19,29].
Limitations associated with the use of ALAN emission and economic development proxies are also consistently reported in the literature, such as data noise and saturation issues, especially for the data available before 2013 [27]; considerable variation in model fit and estimates across urban and rural areas [3,29]; insufficiently accurate capturing of informal and agricultural activities [10,30].
As several studies also show, while ALAN reflects GDP growth, it does not necessarily drive it, as in developed economies, where lighting saturation has been reached [2,10]. As a result, an increase in ALAN does not necessarily increase proportionally with economic expansion, and, as a result, nighttime light emissions become less predictive of real economic dynamics, thus warranting further investigation.
3. Conceptual Model
Figure 1 below aims to conceptualize the complex interaction between economic development and ALAN. It focusses on two main paths. The first pathway describes how GDP affects ALAN, and the second pathway describes the inverse link.
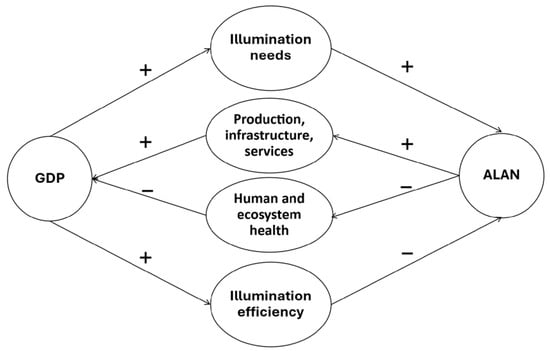
Figure 1.
Conceptual diagram describing the relationship between GDP and ALAN.
According to the first pathway, when economic activities (e.g., “Production, Infrastructure, and Services”) increase, more ALAN is emitted. A sizable part of these light emissions escape into outdoor space and is captured by satellite sensors [3]. The relationship between GDP and ALAN is expected to be generally positive because economic growth results in increased demand for light (“Illumination Needs”). However, it may also become negative, as stakeholders, especially in developed economies, recognize the value of energy efficiency and might afford larger investments in ALAN improvements (“Illumination Efficiency”) by implementing technical innovations, such as focused and efficient lighting or improved infrastructure. As a result, this relationship is not expected to be constant at all stages of economic development. In advanced economies, additional economic growth could lead only to marginal increases in ALAN due to already extensive illumination infrastructure [2,10], while in developing economies, economic growth may produce a rapid and visible increase in nighttime illumination, driven by expanding infrastructure, industrialization, and increased access to electricity. As income levels increase and urban areas grow, the demand for public lighting, commercial activity, and residential illumination increases, resulting in a strong positive link between GDP and ALAN.
The second pathway describes how ALAN might influence GDP: increased nighttime illumination could have a positive effect on the economy, as people can work longer and engage more in commerce and entertainment after dark, which in turn may boost “Production, Infrastructure, and Services.” However, excessive ALAN, if not managed well, can cause problems, such as circadian disturbance, obesity, cancer, and poor sleep [24,32]. These associated environmental and health costs might, in turn, hurt long-term productivity of workers, and, in turn, slow down economic growth.
4. Research Hypotheses
Building on the gaps identified in the literature and the objectives of the study, we propose the following three hypotheses to guide the empirical analysis.
As previous studies show, the association between ALAN and economic growth appears to be unidirectional, with economic growth found to be increase nighttime light emissions, but not necessarily the opposite [3,4], while empirical evidence for the reverse effect of ALAN on economic growth appears to be limited [3,7,29]. Therefore, our first hypothesis is that the association between GDP and ALAN is unidirectional: GDP –> ALAN (H1).
The existing literature also highlights that the relationship between ALAN and GDP is not uniform across geographic space and exhibits considerable variation in different geographical and economic settings. In particular, empirical studies have consistently detected differences in the ALAN–GDP links for urban vs. rural areas, as well as differences attributed to sectoral specialization—e.g., agriculture vs. services [3,6,28,29]. Therefore, our second hypothesis is that the association between GDP and ALAN depends on regional setting, that is, responding to development differences between different regions, e.g., between Western and Eastern Europe (H2).
The quality and characteristics of satellite data used for ALAN measurements are also well established [27]. As we previously noted, the DMSP data, available for 1992–2013, suffered from limitations such as coarse spatial resolution, sensor saturation in brightly lit urban areas, lack of onboard calibration, and blurring effects [7,27,33]. On the contrary, the VIIRS satellite observations that became available since 2012 offer substantial improvements, including much finer resolution, higher radiometric sensitivity, and better calibration [21]. As a result, the choice of satellite data source (also called ‘measurement era’) could be critical to the accuracy and consistency of the findings. Therefore, we hypothesize that the association between GDP and ALAN should vary between different input sources of information used (H3).
It should be noted that the relationship between ALAN and economic activity can be shaped by many additional factors, including differences in settlement patterns, industrial composition, and demographic density. In this research, the analysis focuses specifically on three aspects—directionality, regional development level, and measurement era—as these dimensions best reflect the structural and temporal diversity underlying variations in the ALAN–GDP connection.
5. Data Sources and Methodology
The ALAN data for the study were obtained from the Earth Observation Group at the NOAA National Geophysical Data Centre that provides long-term nightlight composites from the DMSP-OLS and VIIRS sensors [34]. In particular, we used DMSP-OLS data for the period 2001–2013, and VIIRS data for the period 2013–2021 obtained as annual composites. DMSP-OLS provides annual composites with a spatial resolution of approximately 2.7 × 2.7 km at the nadir and reports relative values (0–63) rather than absolute radiometric ones [27,33]. Concurrently, VIIRS data have a much finer spatial resolution of approximately 500 × 500 m at nadir, with daily observations aggregated into monthly or annual composites; VIIRS also offers calibrated radiance values (ηW/cm2/sr), resulting in a much wider dynamic range and improved sensitivity to low light, thus significantly reducing saturation issues, and features better on-board calibration with lower noise [34].
To make the data consistent and reduce possible measurement errors, both the DMSP-OLS and VIIRS nightlight datasets were cleaned and adjusted before analysis. In particular, the DMSP-OLS data, which are recorded as relative brightness values (from 0 to 63), were standardized for each year to correct for differences between satellites and to reduce the effects of light saturation [27]. Concurrently, the VIIRS data, which provide actual radiance values (in nW/cm2/sr), were cleaned by removing stray light and negative readings using quality masks from the Earth Observation Group [34].
Because the two datasets use different measurement units and calibration methods, they were not combined into a single series. Instead, we analyzed them separately as two distinct periods: 2001–2013 for DMSP and 2013–2021 for VIIRS. This approach keeps each dataset internally consistent and avoids artificial jumps between the two data sources. Because the DMSP-OLS and VIIRS sensors differ fundamentally in their spatial resolution, radiometric calibration, and measurement scales, we chose to analyze them separately rather than merging them into a single continuous series. Combining these datasets directly could introduce inconsistencies and artificial discontinuities, potentially biasing the results. Although harmonized products such as the Simulated VIIRS Nighttime Light (SVNL) dataset have been developed to merge DMSP and VIIRS data into a unified long-term series [35], such model-based datasets may propagate errors due to interpolation and calibration. For this reason, we preferred to rely on the original satellite observations and perform the analysis for separate periods (2001–2013 for DMSP and 2013–2021 for VIIRS). Nonetheless, future studies could explore harmonized datasets like SVNL to further validate and extend the analysis of the ALAN–GDP relationship.
These satellite products were downloaded in raster format and processed using ArcGISPro v3.x software in the following three steps: (1) extracting raster values for NUTS-3 boundaries using the ‘mask’ tool; (2) converting the extracted raster values to points using the ‘raster-to-point’ tool, and (3) spatial aggregation of points to calculate the average ALAN values per NUTS for each year under analysis.
In parallel, GDP data, area, and population size data were obtained for NUTS3 regions from the EU statistical office [36]. From these data, we calculated annual GDP values per capita and per km2 for each NUTS-3 region for each year, between 2001 and 2021. Although GDP per capita can offer insight into individual welfare and consumption patterns, GDP per km2 (economic density) provides an important alternative for a comparison with ALAN data, as the calculation of economic density is considered to be a more relevant comparison for ALAN-based analysis in which ALAN values were also calculated as NUTS-3 averages for areal units, that is, per pixel.
To perform the analysis, we constructed panel datasets separately for the DMSP (2001–2013) and VIIRS (2013–2021) periods. The original dataset included 1314 NUTS-3 regions of the EU. However, due to missing observations in either GDP or ALAN for certain years and to ensure consecutive data across the full period of analysis, we had to drop regions with incomplete time series to meet the requirements of the Granger directionality test [8].
As some regions showed inconsistent or non-consecutive time coverage, such regions were omitted from the analysis. As a result, we retained 903 NUTS-3 regions for the DMSP period and 1223 regions for the VIIRS period. These efforts included removing NUTS-3 regions with missing or non-consecutive observations in either GDP or ALAN variables, ensuring that each region had a complete time series for the full period under analysis. This step was necessary to meet the requirements of the Granger directionality test and to avoid bias from uneven data coverage. Table 1 provides descriptive statistics to summarize the distribution and variation in the key variables: GDP per km2 and ALAN for the DMSP (2001–2013) and VIIRS (2013–2021) periods.

Table 1.
Descriptive statistics of research variables by year and ALAN data source.
The selection of DMSP-OLS and VIIRS datasets was guided by their temporal coverage and established use in economic and environmental research. DMSP-OLS provides consistent historical data from 2001 to 2013, while VIIRS offers improved spatial resolution and radiometric accuracy from 2013 onwards. These characteristics make them particularly suitable for analyzing long-term trends and regional variations in ALAN emissions across European NUTS-3 regions. However, both datasets have limitations. DMSP-OLS suffers from sensor saturation and lacks on-board calibration, while VIIRS, despite its improvements, may still be affected by atmospheric conditions and stray light. These limitations were addressed by separating the analysis into two distinct periods and applying consistent pre-processing techniques.
Data Analysis
In the study, fixed-effects panel regressions on log values of the variables were used to estimate long-term relationships. Fixed-effects panel regressions were selected because they control for unobserved, time-invariant heterogeneity across regions, which is essential when analyzing spatially diverse units like NUTS-3 regions. This method improves the reliability of causal inference by isolating within-region variation over time and therefore, reducing the risk of omitted variable bias and clarifying the temporal sequence of effects [16]. Granger causality tests were used to assess the temporal directionality of the relationship between GDP and ALAN, allowing us to evaluate whether changes in one variable preceded changes in the other, which is central to our research objectives.
These models make it possible to control unobserved, time-invariant heterogeneity that may be correlated with independent variables [16]. The models were estimated in restricted and unrestricted forms, with the restricted model (1) estimated the values of a dependent variable based only on its own lagged values, while the unrestricted model (2) estimated the dependent variable based on its own lagged values and the lagged values of the independent variable:
where Y and X are log (ALAN) or log (GDP); and is team means of log (ALAN) or log (GDP).
In line with the annual frequency of the data and the relatively short time frame of the panel (13 years for DMSP and 9 years for VIIRS), the lag order in the Granger directionality tests was restricted to one year (t − 1). Including higher-order lags (for example, t − 2) would have significantly reduced the number of effective observations and degrees of freedom, leading to unstable parameter estimates and potential bias. Thus, a single-lag structure represents a balanced approach between capturing short-run temporal dependencies and preserving sufficient data for robust estimation, consistent with standard practice in macro-panel Granger testing [8,37].
The Wald test was run to compare the comparison between restricted and unrestricted versions of these models. The modelling was performed using plm() and waldtest() in open-source R software [38]. The fixed effects modelling method was applied separately to the data from the DMSP (2001–2013) and VIIRS (2013–2021) satellites, providing insights into long-run dynamics.
Although Granger-type panel models do not fully resolve endogeneity, the use of lagged variables and separate models in both directions (ALAN GDP and GDP ALAN) helps to mitigate the risk of simultaneity [39]. By estimating fixed effects, we further accounted for unobserved time-invariant heterogeneity and dynamic structure, reducing the risk of omitted variable bias and clarifying the temporal sequence of effects [16].
6. Results
6.1. General Trends
Figure 2 illustrates the mean and standard error values of the illuminance emitted from the EU NUTS3 regions calculated using DMSP and VIIRS data. The analysis shows a marked discontinuity between the two data sources that occurred around 2013. Although the DMSP (2001–2013) data, measured in digital numbers (DN), exhibit a generally upward trend, with ALAN peaking sharply around 2010, the VIIRS data (2013–2021), measured in ηWatts/cm2/sr, begin at substantially lower values but remain stable and gradually increasing. Furthermore, the DMSP values fluctuate moderately over the years, with a previously noted spike in 2010. In contrast, VIIRS provides more consistent measurements, probably because of higher spatial resolution and better radiometric performance.
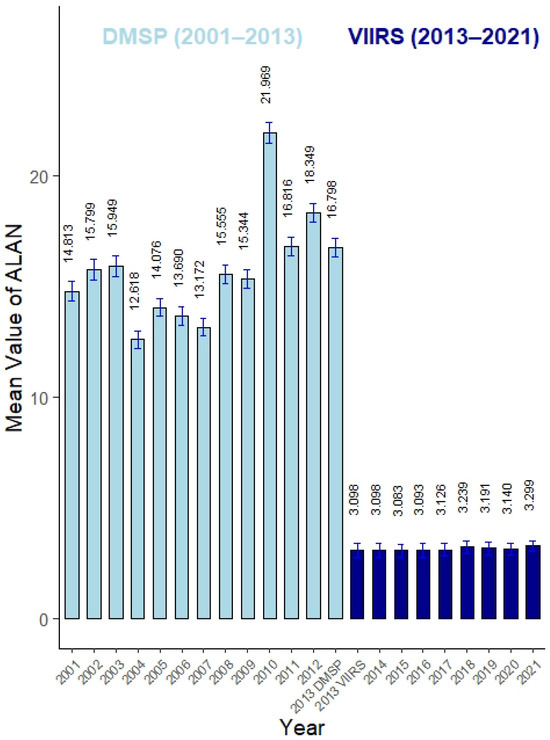
Figure 2.
Mean and SD values of illuminance by EU NUTS-3 region estimated from the DMSP satellite database for 2001–2013 (digital numbers) and VIIRS satellite database for 2013–2021 (nW/cm2/sr).
Concurrently, Figure 3 illustrates the standardized mean values of the GDP and ALAN for the EU NUTS3 regions. In particular, Figure 3A shows the standardized trends of ALAN and GDP during the DMSP-OLS satellite period, while Figure 3B displays the standardized trends of ALAN and GDP for the period covered by VIIRS data.
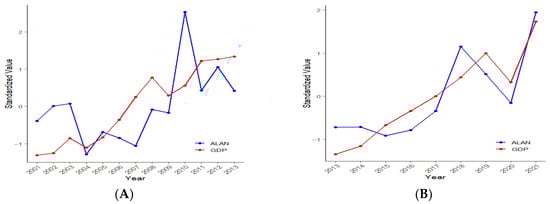
Figure 3.
Change in GDP vs. ALAN by year (A)—time period covered by DSMP satellite data, (B)—time period covered by VIIRS satellite data. (Note: the graphs feature z-standardized averages calculated for the NUTS-3 regions under analysis).
As this figure shows, from 2001 to 2004, both ALAN and GDP show a general decline, with standardized values of ALAN dropping below those of GDP in 2004. Although the overall alignment between ALAN and GDP is noticeable, ALAN appears to be more volatile and exhibits more pronounced fluctuations, exhibiting a sharp peak around 2010 and a subsequent drop; from 2013 onwards, GDP increases steadily. ALAN also increases, albeit with some minor fluctuations before a notable dip for both ALAN and GDP around 2020 that is likely to correspond to the period of the COVID-19 pandemic. This dip is followed by a sharp recovery and a surge in both indicators in 2021. The visual alignment between ALAN and GDP appears stronger and more consistent compared to Figure 3A, especially in the later years (2017–2021) and during the 2020 downturn and subsequent rebound.
Figure 4 illustrates the spatial distribution of economic density (GDP per km2) in European NUTS-3 regions for the years 2001 (Figure 4A) and 2021 (Figure 4B). The maps reveal a persistent core–periphery pattern, with the highest GDP concentrations located in western and Central Europe—especially in regions that include major metropolitan areas such as Paris, Amsterdam, northern Italy, and southern Germany. However, the overall spatial structure of economic density remains highly uneven, demonstrating the long-term stability of Europe’s economic geography and the dominance of established urban–industrial regions.
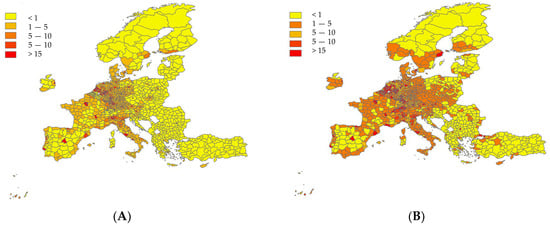
Figure 4.
GDP per capita (A,B) estimated for NUTS-3 regions. (A) GDP in 2001 (Million € per km2) (B)—GDP in the year 2021 (Million € per km2).
Figure 5 shows the spatial pattern ALAN for the same periods as in Figure 4, based on DMSP (Figure 5A,B) data (2001–2013) and VIIRS (Figure 5C,D) data (2013–2021). The distribution of light closely mirrors the geography of GDP, with the brightest (close to yellow) regions corresponding to the most economically developed areas of western and Central Europe. During the DMSP era, light expansion was evident around large metropolitan centers and coastal zones, indicating continued urbanization and infrastructure growth. In the later VIIRS period, improved sensor resolution highlights finer spatial contrasts: light intensity appears to increase in many eastern European regions undergoing electrification and industrial modernization. These patterns suggest that the dynamics of ALAN increasingly reflect both technological improvements and regional differences in the development trajectories.
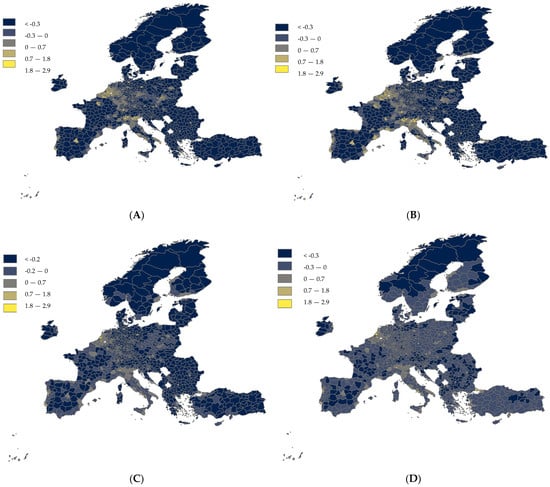
Figure 5.
ALAN averages (A–D) estimated for NUTS-3 regions. (A) ALAN averages in 2002 (digital numbers); (B) ALAN averages in 2013 (digital numbers); (C) ALAN averages in 2014 (nW/cm2/sr); (D) ALAN averages in 2021 (nW/cm2/sr).
6.2. Fixed-Effect Regressions
Table 2 reports Granger directionality tests of the association between GDP and ALAN estimated using different parametric specifications: GDP–>ALAN and ALAN–>GDP. As Table 2 shows, the models for both the DMSP and VIIRS periods demonstrate highly significant F-statistics (p < 0.01) and a reasonable high explanatory power, with R2 values ranging from 0.267 to 0.870, that suggests a moderate-to-good fit. As the models also show, in the DMSP period (2001–2013), lagged GDP values are significantly and positively associated with ALAN (Model 1: GDPn−1 t-stat = 33.702, p < 0.01), while the reverse effect of ALAN on GDP is also statistically significant but is smaller and negative (Model 2: ALANn−1 t-stat = −5.593, p < 0.05). Currently, for the VIIRS period (2013–2021), the statistically significant and positive influence of GDP on ALAN remains (Model 3: t-stat = 27.453, p < 0.01), while ALAN does not show statistical significance in the models estimated for GDP (ALANn−1 t-stat = 0.048 ns).
Table 2.
Granger test of the association between GDP and ALAN (Method: Panel linear regressions with Wald test; separate models estimated for the DMSP and VIIRS data; input variables are represented by logarithmically transformed values).
6.3. Regional Differences
Table 3 further reports the results of the Granger directionality tests that examine the association between GDP and ALAN, estimated using VIIRS data separately for western and Eastern Europe.
Table 3.
Granger test of the association between GDP and ALAN (Method: panel linear regressions with Wald test; separate models estimated for western and Eastern Europe; input variables are represented by logarithmically transformed values, VIIRS data only).
As this table shows, the estimated models have highly significant F-stats (p < 0.01), and generally exhibit good explanatory power, with R2 values ranging from 0.314 to 0.745. For Western Europe (2013–2021 VIIRS data), the results indicate that lagged GDP is significantly and positively associated with ALAN (Model 5: t-statistic = 25.240; p < 0.01), while if GDP is used as dependent variable (Model 6), lagged ALAN is also statistically significant and positively predicts GDP (t-statistic = 6.033; p < 0.05). For Eastern Europe, when ALAN is the dependent variable (Model 7), lagged GDP is significantly and positively related to ALAN (t-stat = 15.757; p < 0.01). However, when GDP is used as the dependent variable (Model 8), the lagged ALAN shows its statistically significant but negative effect on GDP (t-statistic = −2.988; p < 0.05). Wald F tests for all the models are generally significant, indicating that the addition of lagged GDP or ALAN variables significantly improves the model fit.
7. Discussion
This study examines how the relationship between ALAN and economic development, measured as economic density (GDP per km2), evolved in the European NUTS-3 regions over the past decades. The analysis used Granger tests estimated long-term trends in panel regressions. Our findings appear to challenge an overly simplistic interpretation of directionality of the ALAN–GDP nexus. In particular, our analysis reveals that the association between GDP and ALAN is not unidirectional over the entire study period, but time-varying, which leads to the rejection of our initial hypothesis (H1) that assumes a unidirectional relationship. In particular, as the study shows, in an earlier period covered by the DMSP data (2001–2013), GDP generally led to increased ALAN emissions, while the reverse link was much weaker and negative. However, in the later period (2013–2021), the relationship became unidirectional, with GDP continuing to be a Granger-cause of ALAN, but not the opposite. These conclusions support the existing literature that economic growth drives ALAN, but the reverse effect is limited, especially as economies develop and the lighting infrastructure becomes saturated [2,3,4,9,10,40]. These effects can be explained by lighting saturation, improvements in energy efficiency, and a sectoral transition toward service and knowledge-based industries [2,9,10]. Therefore, these findings demonstrate that the relationship between GDP and ALAN is dynamic and not strictly one-way, thereby rejecting our initial hypothesis (H1) that assumed a unidirectional causal link from GDP to ALAN.
The results highlight the fact that the ALAN–GDP relationship is shaped not only by the economic structure and development level, but also by the quality and sensitivity of satellite data. In this respect, the superior technical performance of the VIIRS sensor, particularly its enhanced spatial resolution, radiometric calibration, and dynamic range, may reduce a random measurement noise and improve temporal consistency, thereby mitigating potential sources of endogeneity that can arise from measurement errors. These technical improvements significantly reduce potential endogeneity bias compared to DMSP data by minimizing random noise, sensor saturation, and calibration drift [34]. Moreover, the enhanced spatial resolution ensures a more reliable correspondence between observed light intensity and economic activity on the ground, as emphasized by, e.g., Yu et al., 2023; Duerler et al., 2023; and Cheng et al., 2024 [19,28,34]. Consequently, more stable relationships between GDP and ALAN, observed in the VIIRS period, may reflect both real economic dynamics and methodological improvements in data quality. This underscores the importance of accounting for effects when interpreting the ALAN–GDP relationship and demonstrates that enhanced data precision can substantially reduce bias in causal inference [27,29].
The study also shows that the association between GDP and ALAN depends on the regional setting, specifically between Western and Eastern Europe. In particular, in Western Europe, a positive bidirectional relationship was observed, where lagged GDP significantly predicted ALAN, and lagged ALAN also significantly and positively predicted GDP, suggesting that in more developed Western Europe, increased economic activity leads to more lighting, and increased lighting contributes to economic productivity, potentially by extending working hours or enhancing commerce and safety. In contrast, in Eastern Europe, while GDP lags are positively and significantly associated with ALAN, lagged ALAN exhibits a statistically significant but negative association with GDP.
This unexpected relationship could reflect different development trajectories, with potential impacts from rapid industrial restructuring, wasteful energy policies, and saturation effects compared to Western Europe [20,40]. Beyond structural economic change, several policy processes can help explain the negative association observed in Eastern Europe. Following EU accession, many countries in the region adopted ambitious energy efficiency and modernization programs aimed at reducing electricity use and upgrading public lighting systems. These initiatives, often supported by the EU cohesion and energy directives, led to widespread installation of LED technology and stricter control of nighttime illumination [41,42]. Consequently, light emissions declined even as GDP continued to grow, producing an apparent negative correlation. In parallel, the shift from energy-intensive industries to service-orientated sectors reduced the intensity of the illumination of economic activity, while demographic decline and urban shrinkage in smaller towns further reduced overall light output. These patterns, consistent with recent analyses of postindustrial transition and uneven development in eastern Europe [9,40,43], highlight how regional and policy dynamics can weaken or reverse the typical positive ALAN–GDP linkage. Therefore, these findings underscore the necessity of accounting for varying development levels when analyzing the ALAN–GDP nexus, effectively supporting our H2.
These findings suggest that ALAN is a reliable proxy for economic activity primarily in the earlier stages of development, but its utility diminishes in saturated lighting environments. This reinforces the need for context-aware interpretation when using ALAN in empirical studies and policy evaluations. These regional differences may reflect broader structural and institutional disparities. In Western Europe, mature infrastructure, stable energy systems, and diversified economies can allow nighttime lighting to reflect and support economic activity. On the contrary, the unidirectional and sometimes negative relationship of eastern Europe may be due to transitional economies, inefficient energy use, or uneven development, where increased lighting does not necessarily translate into productivity gains. It should also be noted that while H2 also referenced other contextual factors such as urban–rural differences and sectoral specialization, the empirical analysis focused on the level of regional development (Western vs. Eastern Europe) due to the availability of consistent and comparable data in NUTS-3 regions. Other factors were discussed in the literature review but could not be tested directly due to data limitations. The study also examined the association between GDP and ALAN to find that it varies between different input sources of information. Our analysis clearly demonstrated this variation, as evidenced by the distinct results obtained for the DMSP (2001–2013) and VIIRS (2013–2021) data periods which supports our H3.
Misinterpreting ALAN as a universal proxy may lead to flawed policy decisions, especially in high-income regions where the lighting infrastructure is already saturated. This could result in overestimating economic performance or misallocating development resources. In particular, the role of the energy sector is critical in the European context. Recent studies highlight that fluctuations in energy demand and security strongly influence both nighttime luminosity and economic output [1,41,42,44]. Periods of energy crisis or rapid demand growth can alter the intensity of lighting independently of GDP, producing short-term divergences in the ALAN–GDP relationship. Recognizing this link underscores the need to integrate energy efficiency and energy security indicators when interpreting luminosity-based measures of economic performance.
We should acknowledge that this study has several limitations. Although efforts were made to clean and balance the panel data, the omission of regions with inconsistent or incomplete time coverage could have introduced a selection bias, potentially excluding more volatile different trends. Second, the models employed in the study primarily focus on the direct relationship between ALAN and GDP, thereby omitting other potential drivers of economic activity, such as demographic change, industrial composition, or technological transformation.
The strength and directionality of these two pathways are critically influenced by mediating factors. Technology and policy, for example, govern illumination efficiency, where the adoption of energy-saving technologies (like LEDs) and environmental regulations (such as EU directives) can lead to light saturation, a phenomenon where economic growth continues while ALAN intensity stabilizes or decreases, particularly in developed economies. Additionally, climate, weather, and social factors introduce noise or short-term variation, such as temporary luminosity drops due to extreme weather or shifts in energy consumption patterns.
Finally, the analysis was limited to linear specifications, which may not fully capture complex non-linear or threshold effects that could better represent the real-world interaction between ALAN and economic growth. Future research should thus explore these possibilities through dynamic non-linear modelling, sector-specific disaggregation, and broader international comparisons to deepen the understanding of how artificial light interacts with diverse economic structures and development paths. These constraints limit the generalizability of the findings to regions with consistent and high-quality ALAN and GDP data. Moreover, the reliance on linear models may overlook threshold effects or non-linear dynamics that could be critical in certain contexts.
Although several contextual factors, such as urban–rural differences, sectoral specialization, and population density, can influence the ALAN–GDP relationship, the study focusses, as previously mentioned, on directionality, regional development level, and measurement era only, while other factors require more specific data could be considered in future investigations.
8. Conclusions and Implications
This study provides new evidence on the dynamic and context-dependent relationship between nighttime light emissions and economic growth, using panel data from over 1300 EU NUTS-3 regions. By applying Granger-type models across two satellite datasets, we show that GDP generally leads to increased ALAN, but the reverse effect is limited and varies by region and development level. These findings refine the understanding of ALAN as a development indicator and highlight its limitations in saturated lighting environments.
The study contributes to the growing body of research on the use of nightlight emissions as a proxy for economic activity. By applying Granger-type panel models to a large dataset of EU NUTS-3 regions, we found that the relationship between GDP and ALAN is dynamic, context-dependent, and influenced by both regional development levels and the type of satellite data used. Our findings confirm that, while GDP generally leads to increased ALAN, the reverse effect is limited and varies over space and time.
In terms of practical implications, the findings of this study have several implications for policymakers and researchers. First, ALAN remains a useful proxy for economic activity, particularly in data-scarce regions, but its interpretation must consider regional development levels and measurement periods. Second, the weakening of the ALAN–GDP link in developed regions suggests that relying solely on light emissions may lead to biased conclusions in high-income contexts. Finally, the choice of satellite data source (DMSP vs. VIIRS) significantly affects the results, highlighting the need for careful selection and calibration when using ALAN in empirical research and policy evaluation. Thus, for policymakers, this means that nighttime light data should be interpreted with caution and in context. In developed regions, ALAN may serve as a stable proxy, while in transitional or rapidly changing regions, it may misrepresent economic dynamics unless combined with other indicators. Policymakers should consider regional development levels and lighting saturation when using ALAN data to guide investment decisions, urban planning, or sustainability assessments. For example, in western Europe, where ALAN and GDP show a bidirectional relationship, nighttime light data can be used to monitor both economic performance and infrastructure efficiency. On the contrary, in eastern Europe, where the relationship is weaker or negative, ALAN should be used with caution and supplemented with other indicators such as employment or energy consumption.
The study thus leads to the conclusion that policymakers should interpret ALAN data with caution, especially in high-income regions, and consider integrating it with other indicators such as energy efficiency, infrastructure expansion, or social well-being, while future research could explore the relationship with additional socioeconomic factors, including education, health, or inequality, to better assess its role in monitoring sustainable development.
Beyond these general implications, several specific policy pathways emerge from our findings. First, national and regional authorities could integrate ALAN data into existing development monitoring systems (such as Eurostat’s regional dashboards or EU cohesion policy frameworks), to track spatial inequality and infrastructure performance in near real time. Second, municipalities can use ALAN maps to identify over- or under-illuminated and design targeted energy-efficiency interventions, such as LED retrofitting programmes or adaptive ‘smart lighting’ policies that balance safety and sustainability. In addition, regions that show persistently weak or negative ALAN–GDP links could be prioritized for investment in modern energy infrastructure or innovation funding to stimulate balanced development. Finally, linking ALAN-based indicators with environmental and economic policies can improve cross-sector coordination—ensuring that lighting, energy, and economic goals are pursued together within sustainable regional development strategies.
Author Contributions
Conceptualization, B.A.P.; methodology, R.S. and B.A.P.; software, R.S. and B.A.P.; validation, R.S. and B.A.P.; formal analysis, R.S.; investigation, R.S. and B.A.P.; resources, R.S. and B.A.P.; data curation, R.S. and B.A.P.; writing—original draft preparation, R.S. and B.A.P.; writing—review and editing, R.S. and B.A.P.; visualization, R.S. and B.A.P.; supervision, B.A.P.; project administration, B.A.P.; funding acquisition, R.S. and B.A.P. All authors have read and agreed to the published version of the manuscript.
Funding
This research received no external funding.
Institutional Review Board Statement
Not applicable.
Informed Consent Statement
Not applicable.
Data Availability Statement
The data presented in this study are openly available in https://ec.europa.eu/eurostat/data/database and in https://eogdata.mines.edu/products/vnl/.
Conflicts of Interest
The authors declare no conflict of interest.
References
- Zhao, M.; Zhou, Y.; Li, X.; Cao, W.; He, C.; Yu, B.; Li, X.; Elvidge, C.D.; Cheng, W.; Zhou, C. Applications of Satellite Remote Sensing of Nighttime Light Observations: Advances, Challenges, and Perspectives. Remote Sens. 2019, 11, 1971. [Google Scholar] [CrossRef]
- Gibson, J.; Boe-Gibson, G. Nighttime Lights and County-Level Economic Activity in the United States: 2001 to 2019. Remote Sens. 2021, 13, 2741. [Google Scholar] [CrossRef]
- Henderson, J.V.; Storeygard, A.; Weil, D.N. Measuring Economic Growth from Outer Space. Am. Econ. Rev. 2012, 102, 994–1028. [Google Scholar] [CrossRef]
- Chen, X.; Nordhaus, W.D. Using Luminosity Data as a Proxy for Economic Statistics. Proc. Natl. Acad. Sci. USA 2011, 108, 8589–8594. [Google Scholar] [CrossRef]
- Beyer, R.C.M.; Hu, Y.; Yao, J. Measuring Quarterly Economic Growth from Outer Space; World Bank: Washington, DC, USA, 2022. [Google Scholar]
- Bluhm, R.; McCord, G.C. What Can We Learn from Nighttime Lights for Small Geographies? Measurement Errors and Heterogeneous Elasticities. Remote Sens. 2022, 14, 1190. [Google Scholar] [CrossRef]
- Hamman, N.; Phiri, A. Using Nighttime Luminosity as a Proxy for Economic Growth in Africa: Is It a Bright Idea? Manag. Glob. Transit. 2022, 20, 139–165. [Google Scholar] [CrossRef]
- Dumitrescu, E.-I.; Hurlin, C. Testing for Granger non-causality in heterogeneous panels. Econ. Model. 2012, 29, 1450–1460. [Google Scholar] [CrossRef]
- Jakobsen, S.-E.; Uyarra, E.; Njøs, R.; Fløysand, A. Policy Action for Green Restructuring in Specialized Industrial Regions. Eur. Urban Reg. Stud. 2022, 29, 312–331. [Google Scholar] [CrossRef]
- Prakash, A.; Shukla, A.K.; Bhowmick, C.; Beyer, R.C.M. Night-Time Luminosity: Does It Brighten Understanding of Economic Activity in India? Reserve Bank. India Occas. Pap. 2019, 40, 1–24. Available online: https://www.rbi.org.in/Scripts/bs_viewcontent.aspx?Id=3741 (accessed on 6 November 2025).
- Gibson, J. Better Night Lights Data, For Longer. Oxf. Bull. Econ. Stat. 2021, 83, 770–791. [Google Scholar] [CrossRef]
- Proville, J.; Zavala-Araiza, D.; Wagner, G. Night-Time Lights: A Global, Long Term Look at Links to Socio-Economic Trends. PLoS ONE 2017, 12, e0174610. [Google Scholar] [CrossRef]
- Addison, D.; Stewart, B. Nighttime Lights Revisited: The Use of Nighttime Lights Data as a Proxy for Economic Variables (English). Policy Research Working Paper. 2015. Available online: https://documents.worldbank.org/en/publication/documents-reports/documentdetail/613891468195568648 (accessed on 6 November 2025).
- Hadjimichalis, C. Uneven Geographical Development and Socio-Spatial Justice and Solidarity: European Regions after the 2009 Financial Crisis. Eur. Urban Reg. Stud. 2011, 18, 254–274. [Google Scholar] [CrossRef]
- Petrova, S. Illuminating Austerity: Lighting Poverty as an Agent and Signifier of the Greek Crisis. Eur. Urban Reg. Stud. 2018, 25, 360–372. [Google Scholar] [CrossRef] [PubMed]
- Wooldridge, J.M. Econometric Analysis of Cross Section and Panel Data; The MIT Press: Cambridge, MA, USA, 2010. [Google Scholar]
- Ghosh, T.; Anderson, S.; Elvidge, C.; Sutton, P. Using Nighttime Satellite Imagery as a Proxy Measure of Human Well-Being. Sustainability 2013, 5, 4988–5019. [Google Scholar] [CrossRef]
- Andries, A.; Morse, S.; Murphy, R.J.; Sadhukhan, J.; Martinez-Hernandez, E.; Amezcua-Allieri, M.A.; Aburto, J. Potential of Using Night-Time Light to Proxy Social Indicators for Sustainable Development. Remote Sens. 2023, 15, 1209. [Google Scholar] [CrossRef]
- Yu, T.; Ye, Y.; Fan, Z. Estimating GDP Growth Using VIIRS Night-Time Light Data. Int. J. Remote Sens. 2024, 45, 7939–7958. [Google Scholar] [CrossRef]
- Crawley, A.; Pickernell, D. An Appraisal of the European Cluster Observatory. Eur. Urban Reg. Stud. 2012, 19, 207–211. [Google Scholar] [CrossRef]
- Small, C.; Elvidge, C.D.; Balk, D.; Montgomery, M. Spatial Scaling of Stable Night Lights. Remote Sens. Environ. 2011, 115, 269–280. [Google Scholar] [CrossRef]
- Huang, Q.; Yang, X.; Gao, B.; Yang, Y.; Zhao, Y. Application of DMSP/OLS Nighttime Light Images: A Meta-Analysis and a Systematic Literature Review. Remote Sens. 2014, 6, 6844–6866. [Google Scholar] [CrossRef]
- Servillo, L.; Atkinson, R.; Russo, A.P. Territorial Attractiveness in EU Urban and Spatial Policy: A Critical Review and Future Research Agenda. Eur. Urban Reg. Stud. 2012, 19, 349–365. [Google Scholar] [CrossRef]
- Grubisic, M.; Haim, A.; Bhusal, P.; Dominoni, D.M.; Gabriel, K.M.A.; Jechow, A.; Kupprat, F.; Lerner, A.; Marchant, P.; Riley, W.; et al. Light Pollution, Circadian Photoreception, and Melatonin in Vertebrates. Sustainability 2019, 11, 6400. [Google Scholar] [CrossRef]
- Zang, J.; Zhang, T.; Chen, L.; Li, L.; Liu, W.; Yuan, L.; Zhang, Y.; Liu, R.; Wang, Z.; Yu, Z.; et al. Optimization of Modelling Population Density Estimation Based on Impervious Surfaces. Land 2021, 10, 791. [Google Scholar] [CrossRef]
- Elvidge, C.D.; Baugh, K.; Zhizhin, M.; Hsu, F.C.; Ghosh, T. VIIRS night-time lights. Int. J. Remote Sens. 2017, 38, 5860–5879. [Google Scholar] [CrossRef]
- Pérez-Sindín, X.S.; Chen, T.-H.K.; Prishchepov, A.V. Are Night-Time Lights a Good Proxy of Economic Activity in Rural Areas in Middle and Low-Income Countries? Examining the Empirical Evidence from Colombia. Remote Sens. Appl. 2021, 24, 100647. [Google Scholar] [CrossRef]
- Duerler, R.; Cao, C.; Xie, B.; Huang, Z.; Chen, Y.; Wang, K.; Xu, M.; Lu, Y. Cross Reference of GDP Decrease with Nighttime Light Data via Remote Sensing Diagnosis. Sustainability 2023, 15, 6900. [Google Scholar] [CrossRef]
- Galimberti, J.K. Forecasting GDP Growth from the Outer Space 2017; KOF Working Papers 17-427; KOF Swiss Economic Institute: Zürich, Switzerland; ETH Zurich: Zürich, Switzerland, 2017. [Google Scholar] [CrossRef]
- Mushunje, L.; Mashasha, M. Non-Banking Sector Development Effect on Economic Growth. A Nighttime Light Data Approach. Cogent Econ. Financ. 2024, 12, 2351374. [Google Scholar] [CrossRef]
- Haim, A.; Portnov, B.A. Light Pollution as a New Risk Factor for Human Breast and Prostate Cancers; Springer: Dordrecht, The Netherlands, 2013; ISBN 978-94-007-6219-0. [Google Scholar]
- Elvidge, C.D.; Baugh, K.E.; Kihn, E.A.; Kroehl, H.W.; Davis, E.R. Mapping City Lights with Nighttime Data from the DMSP Operational Linescan System. Photogramm. Eng. Remote Sens. 1997, 63, 727–734. [Google Scholar]
- Elvidge, C.D.; Zhizhin, M.; Ghosh, T.; Hsu, F.-C.; Taneja, J. Annual Time Series of Global VIIRS Nighttime Lights Derived from Monthly Averages: 2012 to 2019. Remote Sens. 2021, 13, 922. [Google Scholar] [CrossRef]
- Cheng, T.; Wang, J.; Sui, J.; Song, F.; Fu, H.; Wang, T.; Guo, X. Simulation and Prediction of Water Temperature in a Water Transfer Channel during Winter Periods Using a New Approach Based on the Wavelet Noise Reduction-Deep Learning Method. J. Hydrol. Hydromech. 2024, 72, 49–63. [Google Scholar] [CrossRef]
- Hu, Y.; Yao, J. Illuminating economic growth. J. Econom. 2022, 228, 359–378. [Google Scholar] [CrossRef]
- Eurostat Database. Available online: https://ec.europa.eu/eurostat/data/database (accessed on 1 April 2023).
- Croissant, Y.; Millo, G. Panel Data Econometrics in R: The Plm Package. J. Stat. Softw. 2008, 27, 1–43. [Google Scholar] [CrossRef]
- Greene, W.H. Econometric Analysis, 8th ed.; Pearson: London, UK, 2018; ISBN 978-0134461366. [Google Scholar]
- Calegari, E.; Ferrara, A.R.; Freo, M.; Reggiani, A. The Heterogeneous Effect of European Union Cohesion Policy on Regional Well-Being. Eur. Urban Reg. Stud. 2023, 30, 311–318. [Google Scholar] [CrossRef]
- Capello, R.; Ciappei, S.; Lenzi, C. EU Cohesion Policies and Interregional Inequalities in Disruptive Times. Eur. Urban Reg. Stud. 2025, 32, 124–145. [Google Scholar] [CrossRef]
- Tóth, G.; Sebestyén Szép, T. Spatial Evolution of the Energy and Economic Centers of Gravity. Resources 2019, 8, 100. [Google Scholar] [CrossRef]
- Raźniak, P.; Dorocki, S.; Winiarczyk-Raźniak, A. Economic Resilience of the Command and Control Function of Cities in Central and Eastern Europe. Acta Geogr. Slov. 2020, 60, 95–105. [Google Scholar] [CrossRef]
- Trippl, M.; Fastenrath, S.; Isaksen, A. Rethinking Regional Economic Resilience: Preconditions and Processes Shaping Transformative Resilience. Eur. Urban Reg. Stud. 2024, 31, 101–115. [Google Scholar] [CrossRef]
- Keiner, D.; Gulagi, A.; Breyer, C. Energy Demand Estimation Using a Pre-Processing Macro-Economic Modelling Tool for 21st Century Transition Analyses. Energy 2023, 272, 127199. [Google Scholar] [CrossRef]
Disclaimer/Publisher’s Note: The statements, opinions and data contained in all publications are solely those of the individual author(s) and contributor(s) and not of MDPI and/or the editor(s). MDPI and/or the editor(s) disclaim responsibility for any injury to people or property resulting from any ideas, methods, instructions or products referred to in the content. |
© 2025 by the authors. Licensee MDPI, Basel, Switzerland. This article is an open access article distributed under the terms and conditions of the Creative Commons Attribution (CC BY) license (https://creativecommons.org/licenses/by/4.0/).