Abstract
The maritime sector, responsible for approximately 3% of global greenhouse gas (GHG) emissions, is under growing pressure to transition toward climate-neutral operations. Significant progress has been made in developing sustainable fuels and propulsion systems to meet these demands. Although electric propulsion and fuel cells are highlighted as key technologies for achieving net-zero carbon targets, they remain an immature solution for large-scale maritime use, particularly in long-distance shipping. Therefore, modifying internal combustion engines and employing alternative fuels emerge as more feasible transition strategies, especially in short-sea shipping and port applications such as tugboat operations. Among alternative fuels, hydrogen (H2) and ammonia (NH3) have emerged as the most prominent fuels in recent years due to their carbon-free nature and compatibility with existing marine compression ignition (CI) engines with only minor modifications. This study explores the viability of hydrogen and ammonia as alternative fuels for CI engines in terms of technological, economic, and environmental aspects. Also, using a life cycle assessment (LCA) framework, this study examines the environmental impacts and feasibility of gray, blue, and green hydrogen and ammonia production pathways. The analysis is conducted from both well-to-tank (WtT) and tank-to-wake (TtW) perspectives. The results demonstrate that green fuel production pathways significantly reduce emissions but lead to higher economic costs, while intermediate blends offer a balanced trade-off between environmental and financial performance. Moreover, the combustion stage analysis indicates that H2 and NH3 provide substantial environmental benefits by significantly reducing harmful emissions. Consequently, a Multi-Criteria Decision Making (MCDM) approach is employed to determine the optimal blending strategy, revealing that a 24% hydrogen and 76% marine diesel oil (MDO) energy share yields the most favorable outcome among the evaluated alternatives.
Keywords:
port operations; sustainability; life cycle assessment; hydrogen; ammonia; fuel blend; MCDM 1. Introduction
Maritime transportation is a major contributor to climate change, accounting for around 3% of global greenhouse gas (GHG) emissions. The International Maritime Organization (IMO), the key decision maker for the industry, has set ambitious targets to cut and eradicate GHGs. The target is to reduce emissions by 20% by 2030, 70% by 2040, and reach net-zero emissions around 2050, comparable to 2008 levels. To achieve these targets, feasible infrastructure, regulatory changes, long-term technological advancements, and short- to medium-term transitional solutions are needed.
The maritime industry seeks alternative solutions such as using hydrogen (H2), ammonia (NH3), methanol (CH3OH), liquefied natural gas (LNG), and biofuels to cut GHGs. However, each alternative fuel option has its own advantages and disadvantages. Among alternative fuels, hydrogen and ammonia stand out due to their carbon-neutral combustion, compatibility with internal combustion engines, and compliance with stringent environmental regulations. Ammonia offers higher energy density, global distribution, and a well-established infrastructure, while hydrogen stands out for its higher thermal efficiency. However, the high production costs, safety concerns, and lack of a widespread, developed supply infrastructure continue to hinder their widespread adoption. Furthermore, large-scale use of these fuels in long-distance maritime transport is unlikely in the short term. However, the use of hydrogen and ammonia in port operations creates opportunities for early adoption for enabling both sustainable port management and significant reductions in shipping emissions.
Although there are various emission sources in the port area, such as vessels, cranes, forklifts, trucks, and tugboats, they represent the high-impact focal area of port operations in terms of emission production due to their frequent berthing operations. The fuel-intensive berthing cycles cause high emissions despite tugboats’ relatively small size compared to other ship types during port operations. The blending of hydrogen and ammonia in tugboat engines is a promising option to overcome this issue, which would provide both local emissions reductions and broader systemic benefits by linking port decarbonization to improved urban air quality in adjacent coastal cities. Recent developments show that low-carbon tug operations are moving from concept to practice. The IMO has adopted a new 2023 GHG Strategy and life-cycle (well-to-wake) guidelines, providing a common basis to compare marine fuels [1]. A critical analysis of the strategy indicated that it consists of ambitious and concrete goals but it is crucial to focus on life cycle cost (LCC) calculations for economic measures [2]. In addition, a recent study stated that a sustainable strategy should be led by alignment with policies, incentives, and innovation [3]. To achieve the goals and strategies, studies from a regionally comparative perspective is also recommended [4].
Recent developments show that low-carbon tug boat operations shift from concept to practice. The IMO has adopted a new 2023 GHG Strategy and life-cycle (well-to-wake) guidelines, providing a common basis to compare marine fuels [1]. On the pilot side, NYK’s ammonia-fueled tug Sakigake completed a three-month trial in Tokyo Bay [5], the Hydrotug 1 started hydrogen dual-fuel operations in Port of Antwerp [6]. These steps strengthen the real-world and policy context for evaluating diesel–H2–NH3 pathways in port duty.
Hydrogen and ammonia have been investigated to reduce emissions in several studies from different perspectives. Life cycle assessment (LCA) applications indicate that these fuels significantly reduce GHGs, particulate matter (PM), and black carbon (BC) [7,8]. However, production efficiency, energy requirements, and storage constraints remain key challenges [9]. Comparative evaluations highlight ammonia’s advantage in long-term energy storage due to its higher energy density [9], while hydrogen-enriched LNG presents a transitional pathway with notable emission reductions [10]. Despite promising GHG reduction potential, high production costs hinder widespread adoption, necessitating policy support such as carbon pricing and subsidies [10,11]. Furthermore, methodological inconsistencies in LCA studies underscore the need for standardization to enhance comparability and policy relevance [12]. Advances in electro-ammonia and biofuels show potential for decarbonization, though scalability and infrastructure challenges persist [13,14]. Research on innovative hydrogen production methods, such as underground coal gasification and methane-assisted fuel cells, suggests promising efficiency improvements, though water and resource constraints [15].
Addressing these challenges through technological advancements and regulatory interventions is essential for the viable integration of hydrogen and ammonia in maritime applications. Previous studies experienced methodological variation that restricts comparison. Common issues include inconsistent system boundaries, mismatched functional units, uneven treatment of non-CO2 climate forcers (CH4, N2O), varying grid-mix/credit-allocation assumptions, and TEA boundary choices that neglect mid-life replacements. We use a harmonized WtW–GWP100 basis with per-kWh engine-level normalization, accounting for CO2/CH4/N2O and uncertainty/robustness tests to resolve variations.
Also, several studies have extensively explored ammonia and hydrogen as alternative fuels in internal combustion engines, focusing on their combustion characteristics, performance, and emissions. Ammonia–hydrogen co-combustion has been investigated in both compression and spark-ignition engines, demonstrating improvements in thermal efficiency and combustion stability. Pyrc et al. [16] found that a 12% hydrogen energy share enhanced efficiency but increased nitrogen oxides (NOx) emissions. Stefano [17] observed that hydrogen addition improved ammonia’s ignition and combustion rate, though performance remained lower than gasoline-fueled operation. Compression ratio adjustments have also been shown to optimize efficiency. Dual-fuel studies highlight ammonia’s potential for emission reduction, though challenges remain. Liu et al. [18] observed that increasing ammonia energy share up to 60% in diesel engines suppressed combustion, delayed pressure rise, and reduced NOx and CO2 emissions, but elevated unburned NH3 and N2O. Yousefi et al. [19] reported a 58% NOx reduction with a 40% ammonia blend, though thermal efficiency slightly declined. In contrast, Jamrozik et al. [20] found that 42% ammonia energy share optimized efficiency while reducing CO2 and soot emissions.
Although there are many studies examining the blending of both hydrogen and ammonia fuels with diesel fuel, most of them concentrate either on production pathways using LCA or on combustion and cost performance through techno-economic assessment. Few have attempted to integrate these perspectives, and comprehensive frameworks combining LCA, techno-economic assessment, and structured decision-making tools are scarce. Moreover, research on the usage of tri-fuel remains limited to a small number of engine studies, highlighting a clear gap in port-duty, well-to-wake LCA/TEA/MCDM assessments [21].
The IMO’s 2023 GHG Strategy and well-to-wake guidance set clear decarbonization goals, but the port-duty literature lacks an integrated assessment. Tugboat studies rarely integrate LCA–TEA–MCDM under realistic duty cycles or quantify safety/storage and retrofit restrictions within costs and rankings. This study addresses the remaining gaps by conducting a holistic evaluation of hydrogen–ammonia–diesel tri-fuel co-combustion in a tugboat engine. Specifically, it contributes by (i) assessing gray, blue, and green hydrogen and ammonia production pathways through LCA, (ii) modelling dual-fuel and tri-fuel engine scenario based on the Wärtsilä 9L20DF engine, (iii) quantifying economic performance using life-cycle cost (LCC), capital expenditure (CAPEX), and operational expenditure (OPEX) analysis, and (iv) applying multi-criteria decision-making (MCDM) methods, including CRITIC (CRiteria Importance Through Intercriteria Correlation), and TOPSIS (Technique for Order Preference by Similarity to Ideal Solution), to identify optimal fuel blending strategies. The study combines scientific rigor with practical applicability, providing findings that support the IMO’s well-to-wake framework, guiding effective carbon pricing systems, and advising policymakers and industry stakeholders on sustainable port operations.
2. Materials and Methods
2.1. Hydrogen and Ammonia Production
Hydrogen can be categorized based on its production pathways:
- Gray hydrogen is derived from fossil fuels, contributing to high CO2 emissions through steam-methane reforming (SMR) and underground/surface coal gasification (UCG-SCG).
- Blue hydrogen integrates carbon capture and storage (CCS) technologies, reducing emissions by up to 70% ((SMR, UCG-SCG) + CCS).
- Green hydrogen is produced from renewable energy, offering a near-zero-carbon alternative but facing scalability and economic challenges (electrolysis).
The ammonia category is defined by the hydrogen production route used in synthesis. Accordingly: green ammonia denotes renewable electrolytic H2 combined with Haber–Bosch; blue ammonia denotes SMR H2 with CO2 capture; and grey ammonia denotes SMR H2 without capture. Hydrogen and ammonia production parameters are shown in Table 1, and levelized cost of hydrogen (LCOH) and levelized cost of ammonia (LCOA) values are shown in Table 2.
2.1.1. Steam-Methane Reforming
SMR is the most widely used and cost-effective method for hydrogen production, contributing to approximately 50% of the world’s hydrogen supply [22,23]. This process involves the reaction of methane from natural gas with steam (H2O) to produce H2 and CO [24]. The overall reaction is endothermic, requiring significant heat input, which is traditionally supplied by burning fossil fuels, leading to high CO2 emissions [25].
The environmental impact of traditional SMR, being highly carbon-intensive, can be mitigated through CCS to produce “blue hydrogen,” though this increases overall costs [26].
2.1.2. Electrolysis
Green hydrogen refers to hydrogen produced using renewable energy sources through environmentally friendly methods. Unlike conventional hydrogen production processes, green hydrogen generation emits zero GHG, making it a key technology in the transition to a low-carbon economy. This process uses electricity from renewable energy sources such as solar, wind, hydro, and geothermal to split water into hydrogen and oxygen [27].
The production of green hydrogen faces several challenges and considerations. High production costs, driven by expensive materials and technologies required for efficient electrolysis, remain a significant barrier. Infrastructure development also requires substantial investment to support hydrogen production, storage, and transportation, particularly for offshore and large-scale projects [28]. Economic viability and widespread adoption further depend on comprehensive techno-economic analyses and supportive policies to make green hydrogen competitive with conventional fuels across various sectors [29,30].
2.1.3. Haber-Bosch Process
The Haber-Bosch process is a groundbreaking chemical method for synthesizing ammonia from nitrogen (N2) and H2 under high pressure and temperature [31].
It is highly energy-intensive, accounting for approximately 1–2% of global energy consumption, and is a significant source of CO2 emissions due to its reliance on fossil fuels for hydrogen production [32]. Additionally, the centralized nature of the process limits accessibility in remote areas, driving research into small-scale, decentralized production technologies that can bring ammonia synthesis closer to end-use locations while addressing sustainability concerns [32].

Table 1.
Hydrogen and ammonia production parameters and inventory analysis for LCA.
Table 1.
Hydrogen and ammonia production parameters and inventory analysis for LCA.
| SMR | Electrolysis | ||||
|---|---|---|---|---|---|
| Parameters | Quantity | Ref. | Parameters | Quantity | Ref. |
| Natural Gas | 4.5–5 kg/kg-H2 | [33,34] | Electricity | 50–55 kWh/kg-H2 | [35,36,37] |
| Water | 9–12 L/kg-H2 | [38] | Water | 9 L/kg-H2 | [37,39] |
| Heat | 206–220 MJ/kg-H2 | [33,40] | Haber-Bosch | ||
| CO2 emissions | 9–12 kg/kg-H2 | [41] | Parameters | Quantity | Ref. |
| Electricity for CCS | 0.278–0.5 kWh/kg-H2 | [42] | N2 | 0.82 kg/kg-NH3 | [43] |
| CCS CO2 | 8.55–11.4 kg/kg-H2 | [33,44] | H2 | 0.18 kg/kg NH3 | [43] |
| Electricity | 12.1 kWh/kg-NH3 | [45] | |||
| Heat | 32 MJ/kg-NH3 | [43] | |||
| CO2 emissions | 2.16 kg/kg-NH3 | [46] | |||
Table 2.
LCOH/LCOA level of hydrogen and ammonia.
Table 2.
LCOH/LCOA level of hydrogen and ammonia.
| Production Method | LCOH/LCOA Range | Key Points | Ref. |
|---|---|---|---|
| (SMR) | USD 2.5–USD 2.8/kgH2 | SMR is currently the most common method but has high CO2 emissions. Costs increase when CCS is included. | [47,48] |
| Coal Gasification | USD 10.07–USD 11.45/kgH2 | Economically competitive but high in CO2 emissions. Costs increase with CCS integration. | [49] |
| Electrolysis | USD 2.66–USD 38.42/kgH2 | Electrolysis using renewable energy can be expensive, especially at modest capacity factors. Costs can be reduced in regions with low electricity prices or high-capacity factors. | [47,49,50] |
| Nuclear-Assisted Electrolysis | USD 1.7–USD 4.85/kgH2 | Costs vary based on reactor type and electrolysis method. High-temperature steam electrolysis is more cost-effective. | [51] |
| Haber-Bosch | USD 396–USD 687/tonNH3 | Since the process depends on the type of hydrogen used, it is directly linked to hydrogen production processes and economics. | [52,53] |
2.2. Combustion Assessment
The combustion performance of ammonia and hydrogen varies significantly according to energy share ratios. Co-combustion of ammonia with diesel enhances thermal efficiency, reduces specific energy consumption, and lowers emissions, CO2, and soot, with peak indicated thermal efficiency observed at around 40% ammonia energy share ratio [20]. Similarly, hydrogen co-combusted with diesel achieves high efficiency and stable operation, with the optimal hydrogen energy share identified at around 24% [54]. However, hydrogen poses risks such as backfiring and knocking in internal combustion engines, while ammonia is highly toxic and has low reactivity, both leading to potential NOx emissions.
Integrating hydrogen and ammonia as supplementary fuels into a CI engine with manifold/port injection requires specific modifications and additional components to ensure efficient and safe operation. This hybrid fuel approach aims to improve combustion efficiency, reduce emissions, and enhance fuel economy while maintaining engine performance. To implement such a system successfully, adjustments to the air intake, fuel injection system, engine control unit (ECU), and safety mechanisms are essential to accommodate the unique properties of hydrogen and ammonia.
Essential Equipment and Modifications:
- Hydrogen and ammonia storage and supply system;
- Manifold/port injection system;
- Engine control unit adjustments;
- Air intake and exhaust system adjustments;
- Safety and monitoring systems;
- Cooling and lubrication considerations.
2.3. Life Cycle Assessment of Gray-Blue-Green Hydrogen and Ammonia Production
LCA is a quantitative, iterative, and holistic approach that is scientifically based on a life cycle perspective, allowing for a broad environmental impact analysis. The idea of LCA began to develop in the 1960s and is now widely used by different industries to analyze a wide range of product systems. LCA is based on a holistic and comparative study of the total environmental impact of a product system, starting from its components. LCA enables the assessment of multiple environmental midpoint and endpoint categories using different methods. LCA practices are based on the ISO 14040 standard and consist of four main processes: (1) Goal and Scope Definition; (2) Inventory Analysis; (3) Impact Assessment; (4) Interpretation. The goal and scope of this study are to examine the GHG impacts of gray, blue, and green hydrogen and ammonia from a life cycle perspective.
Inventory analysis is presented in Table 1. Impact assessment and interpretation are presented in the Results and Discussion section. The functional unit is 1 kg of fuel, i.e., ammonia and hydrogen. System boundaries include production of each fuel type, consisting of inputs from natural sources, materials/fuels, and electricity/heat. Gray, blue, and green hydrogen are used to produce gray, blue, and green ammonia, respectively. Transportation is not included as it is not correctly determined.
In this study, IPCC 2021 GWP 100 was used as the calculation method. IPCC 2021 GWP 100 is the successor of the IPCC 2013 method, which was developed by the Intergovernmental Panel on Climate Change. It contains the Global Warming Potential (GWP) climate change factors of IPCC with a timeframe of 100 years. Note that the GWP 100 factors are recommended as default by https://eplca.jrc.ec.europa.eu/glam.html, accessed on 31 October 2025, and the GWP20 and GTP100 factors for sensitivity analysis. This method is the final version of the IPCC report ‘AR6 Climate Change 2021: The Physical Science Basis’. The method includes carbon cycle response but does not include indirect formation of dinitrogen monoxide from nitrogen emissions, indirect effects of CO emissions, and radiative forcing due to emissions of Near-Term Climate Forcers, i.e., NOx, CO, volatile organic compounds (VOCs), BC, organic carbon (OC), and SOx.
2.4. Economic Assessment
In this section, a comprehensive financial assessment of integrating hydrogen and ammonia as supplementary fuels in a CI marine engine is conducted. The analysis is focused on evaluating the economic feasibility of alternative fueling strategies. To provide a holistic financial outlook, both CAPEX and OPEX are calculated. Additionally, an LCC analysis is performed to compare the long-term financial implications of conventional diesel operation versus hybrid diesel–hydrogen–ammonia fueling. The results could help determine the economic viability and competitiveness of adopting hydrogen and ammonia in marine CI engines from a total cost perspective. CAPEX represents the fixed annual installment that evenly distributes the initial investment cost (IC) over the investment’s lifespan (n), considering a specified discount rate for CAPEX (R). It can be determined using the following equation.
The operation of a ship’s propulsion system incurs three primary cost components: fuel consumption cost (FCC), which includes expenses for both liquid and gaseous fuels used in combustion engines; lubricating oil consumption cost (LOC), associated with the lubrication of mechanical components; and maintenance cost (MC), covering all system components. OPEX can be determined using the following equation.
The Annual Fuel Consumption Cost,
The Annual Lubrication Oil Consumption Cost for all configurations,
The Annual Maintenance Cost for all configurations,
The LCC encompasses both CAPEX and OPEX over the economic lifespan of a ship. The OPEX values are first calculated and then discounted to their present value using an appropriate discounting function over the operational period (t), and the discount rate (r). These discounted operational costs are subsequently combined with the CAPEX to derive the life cycle cost indicator, as expressed in the following equation.
where
- FP: Fuel Price [USD/kg]
- LOP: Lubrication Oil Price [USD/liter]
- ME: Main Engine
- OT: Operating Time [hours]
- P: Power [kW]
- SFC: Specific Fuel Consumption [kg/kWh]
- SLOC: Specific Lubrication Oil Consumption [liter/kWh]
- SMC: Specific Maintenance Cost [USD/kWh]
2.5. Multi-Criteria Decision-Making
2.5.1. TOPSIS Method for Ranking Alternatives
The TOPSIS methodology assesses the relative proximity of each alternative to the ideal solution by simultaneously considering both ideal and anti-ideal reference points. TOPSIS facilitates the comprehensive comparison and prioritization of alternatives based on aggregated performance measures by establishing a structured evaluation framework. Moreover, TOPSIS serves as a robust and widely applicable MCDM technique. The TOPSIS method is implemented by following steps:
Step 1. In the first step, the decision matrix created shows how each alternative performs in relation to each criterion.
Step 2. The decision matrix is normalized by calculating as follows:
where rij is the normalized decision matrix and xij is the performance value of alternative i on criterion j.
Step 3. In this step, the weighted normalized decision matrix (vᵢⱼ) is constructed, wherein criterion weights are incorporated according to their relative significance, as defined by Equation (10).
Step 4. Next, the positive (A+) and negative ideal solutions (A−) are determined. The negative ideal solution denotes the least favorable performance attainable, while the ideal solution embodies the most favorable performance for each criterion.
Step 5. Next, the Euclidean distances between each alternative and the positive ideal solution and negative ideal solution are calculated.
where Si+ is the distance of the alternative from the positive ideal solution and Si− is the distance of the alternative from the negative ideal solution.
Step 6. The relative closeness of each alternative to the ideal solution is calculated. The relative closeness of each alternative to the ideal solution is quantified by the ratio of its distance from the negative ideal solution to the sum of its distances from both the ideal and negative ideal solutions, expressed as Ci in Equation (15).
Step 7: The final step involves ranking the alternatives. The alternatives are ranked based on their relative closeness values, with higher values indicating better performance.
2.5.2. CRITIC
The CRITIC method is developed by Diakoulaki et al. in 1995 [55]. The method is one of the MCDM techniques used to calculate the objective weight coefficients of criteria. The method algorithm calculates the standard deviations of the criteria and the interaction relationships between them.
The procedure of the CRITIC method is as follows [55]:
Step 1: Decision matrix
Step 2: Normalized decision matrix
Step 3: Symmetric linear correlation matrix
Step 4: Calculation of criteria coefficients
pjk is correlation coefficient between two criteria of standard error of criteria
3. Case Study
This study focused on the widely used dual-fuel Wärtsilä 9L20DF platform due to the lack of commercially operating ammonia–hydrogen marine engines. Currently, directly comparable real-engine tri-fuel (diesel–H2–NH3) datasets are unavailable, and existing experiments are engine-specific (hardware, calibration, operating map). Therefore, our study is bounded by model-based assumptions rather than engine-based empirical validation. While the resulting framework is intended to serve as a transparent baseline that informs experimental design and guides future engine-specific validation efforts. The properties of the tugboat are shown in Table 3. Moreover, the Wärtsilä 9L20DF, installed on the reference tugboat, is widely deployed in port-duty service; its platform can be extended with a second gaseous line to enable tri-fuel operation. This allows for consistent CAPEX/OPEX accounting and enhances the external validity of the case study. The tugboat engine is originally designed to operate on dual fuels and can be adapted with minimal modifications to accommodate hydrogen–ammonia fuel mixtures. The components required for the combustion of these fuels are illustrated in Figure 1. Given that this system closely resembles a conventional dual-fuel system and that no commercially available engine currently operates on an ammonia–hydrogen fuel blend, all calculations in this study have been conducted based on the existing Wärtsilä 9L20DF engine. This engine is a suitable reference both technologically and economically for evaluating the combustion of the ammonia–hydrogen–diesel fuel blends.
Table 3.
Properties of the tugboat.
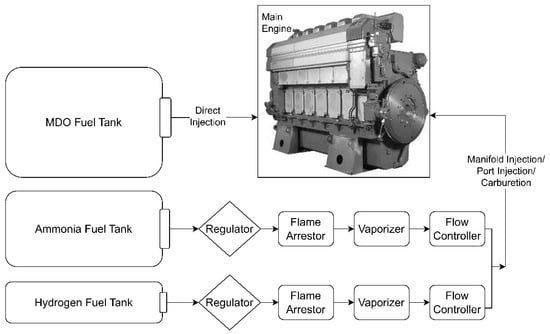
Figure 1.
Tri-Fuel Combustion.
In this study, an economic comparison is conducted between a conventional CI marine engine and a gas-fuel-assisted CI marine engine. To facilitate this comparison, the impact of operating the Wärtsilä 9L20DF engine with different fuel ratios on OPEX will be examined, along with the effect of the required modifications for combustion on CAPEX. For clarity, the conventional CI engine will be denoted as C-CIE, the dual-fuel CI engine as DF-CIE, and the tri-fuel CI engine as TF-CIE. Since the primary engine under consideration is the Wärtsilä 9L20DF, all calculations will be based on the modifications applied to this engine. Consequently, calculations for the C-CIE mode involve removing specific components from the original DF-CIE. In contrast, calculations for the TF-CIE mode are based on the addition of specific components to the existing DF-CIE engine configuration.
To facilitate configurations, engine-level performance, emissions, and cost parameters are normalized per-kW and per-kWh. Operational profile, space/weight ratio, and integration limitations (hazard zoning/ventilation, bunkering interface, permissions) determine vessel-level suitability. Thus, engine-level findings are informative and need vessel-specific screening for correct applicability.
To calculate CAPEX values, it is essential to determine the engine’s initial investment cost. Since the engine considered in this study is a DF engine, achieving the C-CIE mode requires the removal of components necessary for LNG fuel usage from the engine system. Similarly, to enable the simultaneous use of hydrogen and ammonia fuels—thereby transitioning to TF-CIE mode—additional components must be integrated into the DF engine to facilitate the combustion of a second gaseous fuel. Based on the values provided in the literature, CI engine first investment cost is 310 USD/kW, and dual-fuel power system first investment cost is between 1250–1450 USD/kW [56,57], the initial investment costs have been calculated separately for each of the three operational modes. These calculations have been conducted considering a 20-year lifespan (n) and a fixed 10% discount rate (R) [57]. In DF mode, gas fuel consumption is quite high, thus causing too much storage cost. However, in this study, low gas fuel ratios are considered, so it is considered that TF-CIE mode will be similar to DF-CIE mode in terms of cost. In addition, the infrastructure required for the first gas fuel can be used by the second gas fuel line with a small number of components. It is considered that the first investment costs of C-CIE, DF-CIE, and TF-CIE are 310 USD/kW [58], 1250 USD/kW [56], and 1450 USD/kW [59], respectively. The investment costs and CAPEX values of C-CIE, DF-CIE, and TF-CIE modes are calculated as USD 516,150, USD 2,081,250, and USD 2,414,250, and USD 60,623, USD 244,450, USD 283,562, respectively.
MDO prices were sourced from Ship&Bunker, while the prices of gray, blue, and green hydrogen were obtained from literature data, as seen in Table 4. OPEX values have been calculated separately for each fuel energy share ratio, as presented in Table 5, within the limits that ensure efficient combustion and low emissions. For instance, the ammonia ratio has been constrained to a maximum of 50%, as higher concentrations lead to reduced combustion efficiency and NH3 leakage. Similarly, H2 content has been limited to 24%, as exceeding this threshold increases NOx emissions and the risk of knocking [54]. The selection of energy share ratios of fuels is based on combustion efficiency, emissions, knocking propensity, and storage challenges. Additionally, recommendations from the literature were considered to ensure the feasibility and reliability of the selected energy share ratios. After determining the energy share ratios, the fuel consumption rates for marine diesel oil (MDO) were obtained from the engine’s catalog data [60]. The specified SFC values in g/kWh are then converted to kJ/kWh, considering the lower heating value (LHV) of each fuel. Subsequently, based on the energy share ratios, the SFC values for hydrogen, ammonia, and MDO were determined for each operational scenario. For the calculation of annual fuel consumption costs, Equation (3) and (4) are applied. For comparison, only the conditions in which the engine operates at full load have been considered. It is assumed that the engines operate at full load for 3000 h per year with 1665 kW power [57].
Table 4.
Fuel prices.
Table 5.
Annual FCC and OPEX values.
To calculate annual lubrication oil costs, Equation (5) was utilized. The LOP value is assumed to be USD 3.5 per liter, and the specific lubrication oil consumption rate for the selected engine is considered to be 0.4 g/kWh [57]. The annual LOC value is calculated as USD 7867 for all cases. For maintenance and repair costs, the specific maintenance cost was assumed to be 0.0022 USD/kWh for the C-CIE mode and 0.0033 USD/kWh for the DF-CIE mode [65]. To calculate annual MR costs Equation (6) is utilized. The annual MR costs for C-CIE and DF-TF-CIE modes are USD 10,989 and USD 16,483, respectively.
A 20-year LCC analysis was conducted using a 3% discount rate to account for cost escalation and the time value of money as presented in Table 6. This approach provides a comprehensive financial assessment, balancing inflationary effects with discounting to evaluate the economic feasibility of alternative fuel strategies in marine propulsion systems.
Table 6.
LCC values of the case study.
4. Results and Discussion
4.1. Combustion Emissions Assessment
In the previous sections, consumables and emissions during the production stages of ammonia and hydrogen were assessed. In this section, combustion emissions of these two fuels are discussed (TtW). The combustion of MDO, ammonia, and hydrogen fuels together is quite complex. The end-combustion emissions of each engine depend on the engine’s own specifications and the type of fuel used. Since the fuel used in this study is determined as MDO, NH3, and H2, the exact emissions of these fuels can be determined with complete accuracy by conducting experiments for each specific engine separately. As this study seeks to explore how these three fuels influence emission trends, applying emission factors reported in the literature is sufficient to capture the overall combustion emission profile of MDO–H2–NH3 fuel blends. Table 7 shows the emissions factor of selected fuels, and Table 8 shows the total combustion emissions of a Wärtsilä9L20DF engine according to each mode. In the literature, end-of-combustion emission factors for the fuels considered were determined based on experimental data and field measurements, considering stoichiometric and real combustion conditions. Thus, a consistent and comparable assessment of the emission performance of different fuels is provided [66]. Calculations are performed based on the determined fuel consumption rates and emission factors.
Table 7.
Emissions Factors [66].
Table 8.
Total combustion emissions.
4.2. Life Cycle Assessment
The LCA results are presented below for hydrogen and ammonia in Figure 2.
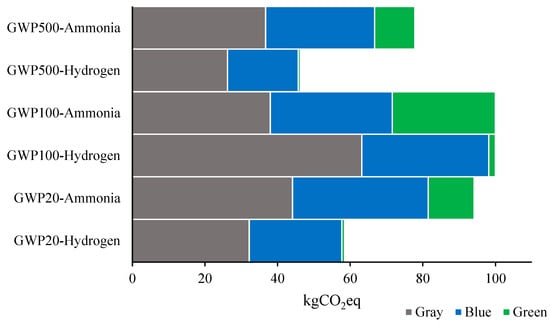
Figure 2.
LCA results with IPCC 20-100-500 GWP 20-100-500 methods for different types of hydrogen and ammonia.
Figure 2 shows that life cycle GHG emissions according to the IPCC methodology are minimal in green hydrogen and green ammonia production, as expected. The most important reason for the low level of GHG emissions in green fuels is that the electricity used is generated from wind energy. GWP100 in the figures refers to the greenhouse gas impact for 100 years. GWP refers to the combined effect of CO2, CH4, and N2O. Upstream NOx associated with hydrogen and ammonia synthesis is very low in modern plants owing to low-NOx burners, tight combustion control, and tail-gas abatement so we do not model a separate production-stage NOx term; its exclusion does not affect our conclusions. For transparency, we report combustion phase NOx. The 100 years is preferred as a medium-term default value and is used to approximate a human lifespan. Accordingly, green hydrogen and green ammonia produce the least GHG impact over 100 years, while gray hydrogen and gray ammonia have the most significant impact. The analysis evaluates twelve different fuel mix modes (C-CIE, DF-CIE, TF-CIE) based on their H2, NH3, and MDO energy shares. It assesses the associated emissions from both fuel production and combustion. Under GWP100, hydrogen pathways for green H2 = 1.83 kgCO2eq, blue H2 = 34.96 kgCO2eq, gray H2 = 63.20 kgCO2eq; ammonia pathways for green NH3 = 28.41 kgCO2eq, blue NH3 = 33.58 kgCO2eq, gray NH3 = 38 kgCO2eq.
Figure 3 shows the total CO2 emissions of each mode, which consist of production and combustion stages. The dashed line on all graphs shows the reference emissions according to conventional diesel production and combustion mode (1-C-CIE). Combustion-related CO2 emissions dominate in fuel modes with high MDO content (e.g., Mode 1-C-CIE with 100% MDO), resulting in total emissions close to 0.9 kg/kWh (based on 33% production and 67% combustion). A significant reduction in combustion emissions is observed in modes with increased shares of ammonia and hydrogen, particularly from Mode 6-TF-CIE onwards, where MDO content drops below 50% (~1.97 kg/kWh, based on 87% gray production and 13% combustion; ~0.75 kg/kWh for 66% blue production and 34% combustion; and ~0.51 kg/kWh for 50% green production and 50% combustion). In contrast, the production-based CO2 emissions vary considerably depending on the source of hydrogen and ammonia. Gray production routes consistently yield the highest emissions across all modes, with Mode 12-TF-CIE showing the highest total CO2 footprint due to its heavy reliance on gray hydrogen and ammonia, despite low combustion emissions (~2.1 kg/kWh, based on 93% gray production and 8% combustion; ~0.66 kg/kWh for 77% blue production and 23% combustion; and ~0.37 kg/kWh for 58% green production and 42% combustion). Green production pathways demonstrate significant environmental benefits, reducing total emissions by approximately 30–50% depending on the mode.
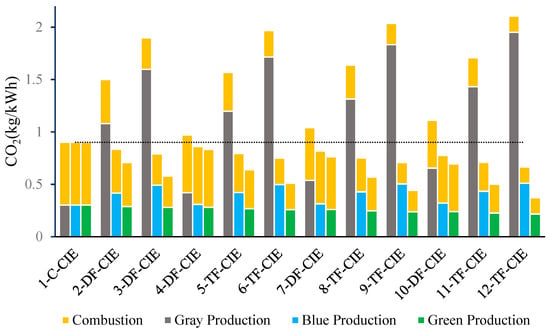
Figure 3.
CO2 emissions (kg/kWh).
Figure 4 shows the total production and combustion-based N2O emissions, which are another great contributor to GWP. The corresponding N2O emissions reveal a complex relationship between fuel type and N2O generation. Combustion emissions are the dominant source of N2O in all modes, with particularly high values observed in ammonia-rich configurations (Modes 3, 6, 9, and 12). This is consistent with literature indicating that NH3 combustion in sub-optimal conditions can lead to incomplete decomposition and promote N2O formation as a byproduct of thermal and prompt NOx pathways.
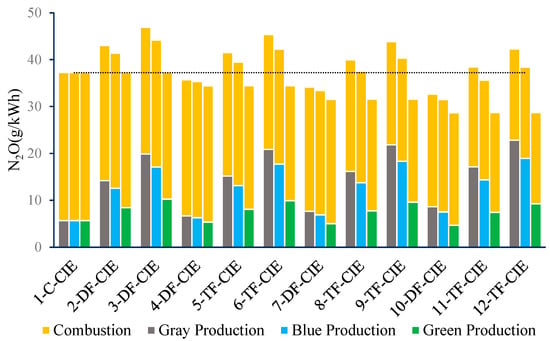
Figure 4.
N2O emissions (g/kWh).
The CH4 emissions could be seen in Figure 5. The analysis of CH4 reveals that upstream production emissions—mainly from gray and blue hydrogen/ammonia—dominate the overall methane footprint, reaching up to ~5.5 g/kWh in high H2/NH3 modes (e.g., Modes 11 and 12). In contrast, green production pathways significantly reduce CH4 emissions (to ~0.5–1.2 g/kWh), highlighting their advantage in minimizing methane leakage. Combustion-related CH4 emissions remain minimal (<0.013 g/kWh) and relatively unaffected by fuel mix, with slightly higher values in MDO-heavy modes.
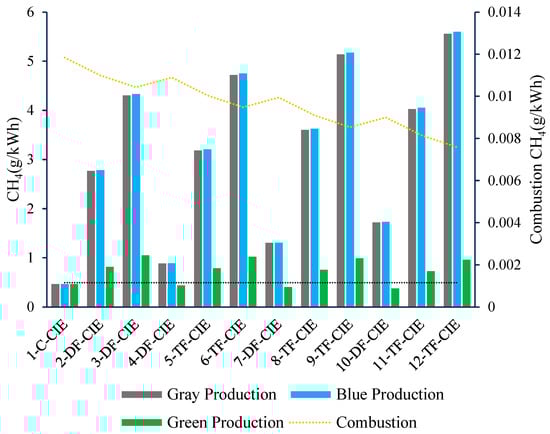
Figure 5.
CH4 emissions (g/kWh).
Figure 6 shows the LCC (nominal and present value) of each mode at a 20-year life span. Results are presented at 3% and 5% discount rates to evaluate financing assumptions and analyze the impact of discounting on LCC levels and rankings across modes. For 3% discount rate, LCC analysis reveals that costs increase with higher shares of hydrogen and ammonia, especially when sourced from green pathways. While Mode 1-C-CIE (100% MDO) has the lowest LCC (~USD 10 M nominal, ~USD 8 M PV), green-intensive modes like Mode 12-TF-CIE reach over USD 30 M nominal and USD 25 M PV due to the cost of renewable fuel production. At a 5% discount rate, PV costs fall further for all modes relative to 3%, while the cost ordering remains robust (grey < blue < green). The PV–nominal gap widens and the dispersion across modes contracts modestly because a higher rate down-weights fuel outlays in later years. Green-intensive options therefore experience a somewhat larger proportional PV reduction than at 3%, yet they remain the highest-cost set (e.g., Mode 12-TF-CIE still exceeds ~USD 25 M PV). A clear cost hierarchy is observed grey fuels lowest, blue moderate, green highest reflecting the role of renewable electricity. Present-value costs are consistently lower than nominal. Importantly, policy instruments can shift these outcomes: CAPEX subsidies lower the capital portion of LCC approximately in line with the grant level, compressing the gap for capital-heavy green options, whereas a carbon price increases LCC in line with well-to-wake CO2 intensity, disadvantaging grey routes and improving the relative position of green/blue pathways. Carbon credits or CfD-style mechanisms act in the opposite direction on operating costs for low-carbon fuels. Thus, policy design has a first-order influence on LCC and the comparative ranking across modes.
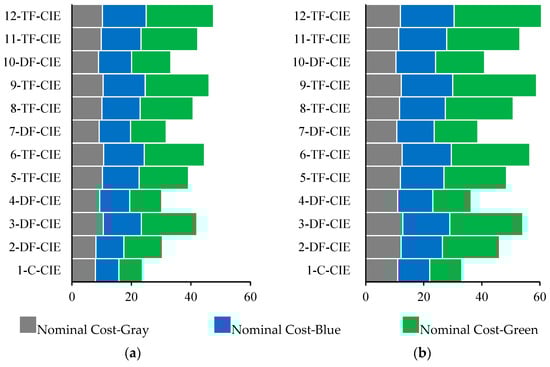
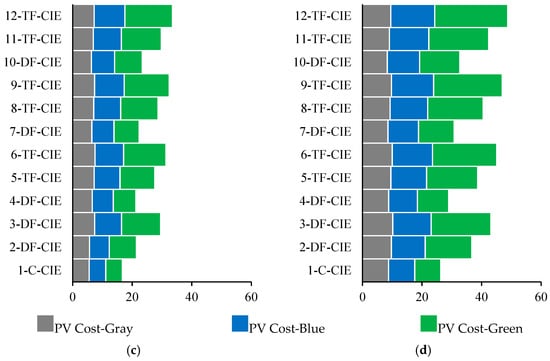
Figure 6.
Life cycle costs (a) Nominal Cost with 3% discount rate (b) Nominal Cost with 5% discount rate (c) PV Cost with 3% discount rate (d) PV Cost with 5% discount rate (USD M).
In this study, the environmental and economic impacts of 12 fuel modes with different ammonia and hydrogen energy ratios were evaluated and interpreted in comparison with the findings in the literature. Especially in the scenarios with MDO ratios falling below 50%, CO2 emissions decreased by approximately 30–50% from 1 kg/kWh to 0.55–0.77 kg/kWh. This finding is parallel to the results of Jin et al. [67], where CO2 emissions decreased from 400 g/kWh to 150 g/kWh with a 50% ammonia ratio. Similarly, an increase in NOx emissions was observed in high H2 content. In this study, the effect of MDO on NOx is approximately 55% of the effect of H2, and this was the case according to Jamrozik and Tutak [20]. Also, Karagöz et al. [68], this is consistent with the 58.8% increase in NOx reported. On the other hand, as reported in other studies [54,69,70] the addition of hydrogen increases both the in-cylinder pressure and thermal efficiency and reduces CO2 and CO emissions, but increases NOx emissions at full load. These findings are consistent with the increased efficiency and reduced carbon-based emissions observed in the high hydrogen ratios scenarios in our study.
From an economic perspective, the LCC values for green production fuel modes in our study appear to reach USD 25–30M PV levels, while Schreuder et al. [71] predicted a total cost of ownership increase of up to 25% with the use of green ammonia. Similarly, Mojarrad et al. [72] stated that the cost-effectiveness of ferry systems retrofitted with hydrogen can only be achieved through rigorous energy optimization. Munoz et al. [73] and Rout et al. [74] have also shown that the cost advantage of hydrogen heavy vehicles is possible in the long term and with political support.
As a result, this study reveals that the integration of ammonia and hydrogen into CI engines can provide significant environmental gains in both emission and cost dimensions with careful fuel ratio selection and production method choices. However, the cost-effectiveness of low-carbon production methods and post-combustion emission management remains critical.
4.3. MCDM
This study conducts a comprehensive re-evaluation of eleven alternative operating modes following the removal of the “1-C-CIE” alternative from a prior integrated analysis. A robust set of 27 criteria predicts the evaluation. It is employed 27 evaluation criteria to compare 11 operational modes, providing a robust methodological approach to addressing the complex nature of the decision problem. The framework facilitates a comprehensive assessment of alternatives by incorporating both short- and long-term economic factors alongside direct and indirect environmental impacts. The approach improves the depth of analysis and validity of the decision-making process, ensuring that all critical factors influencing outcomes are considered. The primary objective is to determine the optimal operational mode from the remaining set of alternatives. A hybrid CRITIC-TOPSIS methodology is utilized for the ranking process. Finally, the robustness and reliability of the findings are confirmed through a sensitivity analysis employing the Simple Additive Weighting (SAW), Multi-Objective Optimization based on Ratio Analysis (MOORA), and Monte Carlo approaches.
4.3.1. Determining Criterion Weights with CRITIC
The new standard deviation (STDV) values for each criterion are calculated across the 11 alternatives, are presented in Table 9.
Table 9.
Standard Deviation Values of Criteria.
The final objective criterion weights (W) are calculated using these standard deviations and inter-criteria correlations as shown in Table 10. The closeness of the resulting weights does not signify a methodological limitation; rather, it demonstrates the consistent numerical properties of the criteria and the fundamental framework of the dataset.
Table 10.
Criterion Weights (CRITIC Method).
4.3.2. Ranking of Alternatives with TOPSIS
Following the weighting step, the Euclidean distances (S+ and S−) of each alternative to the Positive Ideal Solution (A+) and Negative Ideal Solution (A−) are calculated. The final performance scores (C) and ranking based on these distances are summarized in Table 11.
Table 11.
Euclidean Distances, Performance Scores, and Final Ranking (TOPSIS).
With the exclusion of “1-C-CIE”,10-DF-CIE, 7-DF-CIE, and 4-DF-CIE are found as the top three ranks. This indicates that these three alternatives offer the best overall performance among the remaining options.
4.3.3. Comparison of Results
The SAW and MOORA methods were also applied to test the consistency of the TOPSIS ranking. The results are compared in Table 12.
Table 12.
Comparison of Method Ranking Results.
All methods (TOPSIS, SAW, MOORA) provided the exact same ranking. This indicates that the new ranking is highly consistent and reliable.
4.3.4. Sensitivity Analysis
A Monte Carlo simulation with 2000 scenarios is conducted to test the robustness of the new ranking. The results are summarized in Table 13.
Table 13.
Monte Carlo Simulation Results (2000 Scenarios).
The MCDM results confirm that 10-DF-CIE is the best choice among the remaining alternatives. The alternative has an average rank of 1.621 and a 55.95% probability of being ranked first. 7-DF-CIE and 4-DF-CIE alternatives are also powerful competitors that appear in the top 3 in over 90% of all scenarios. This clearly distinguishes them as stable and top-performing choices.
5. Conclusions
This study provides a comprehensive evaluation of fuel blend modes incorporating varying shares of hydrogen, ammonia, and MDO, focusing on their environmental performance—through combustion and production emissions—and economic feasibility via LCC analysis. The results clearly demonstrate that increasing the share of hydrogen and ammonia leads to significant reductions in combustion-related GHG emissions across CO2, N2O, and CH4 gases examined.
However, upstream emissions from gray and blue production pathways, especially for CH4 and N2O, can offset part of the environmental gains, highlighting the critical importance of clean fuel sourcing. Although nitrogen oxide emissions released during ammonia production are not included in the scope of this study due to a lack of data, it is intended to complete the data set in future studies due to the environmental risks caused by these gases. Among all options, green production consistently offers the lowest emissions, but incurs the highest LCC, often doubling the cost of conventional fossil-based pathways. While modes with high green fuel content (e.g., Modes 10–12) achieve the best environmental outcomes, their financial burden underscores the need for strong policy support, including carbon pricing, subsidies, and infrastructure development. Intermediate modes (e.g., Modes 5–8), which balance moderate shares of hydrogen and ammonia, emerge as promising transitional solutions by offering substantial emission reductions at more manageable cost levels.
However, the findings from the MCDM analysis indicated that optimal performance could be achieved with maximal hydrogen and minimal ammonia concentrations when all parameters were assessed collectively. The calorific value of hydrogen, almost thrice that of MDO, significantly decreased fuel consumption. Furthermore, its absence of carbon resulted in a substantial decrease in CO2 emissions. Due to efficient production techniques, emissions associated with production are notably minimal. The poor calorific value of ammonia increased fuel consumption, while its nitrogen concentration augmented NOx emissions. Moreover, owing to limitations in storage capacity and safety hazards, scenarios involving simultaneous utilization of both fuels are seen as more advantageous for the industry. Ultimately, the findings underscore that a successful maritime energy transition must holistically address both environmental and economic dimensions. Advancing green fuel technologies, reducing production costs, and optimizing engine systems for low-emission combustion will be essential to meet long-term decarbonization goals in the shipping sector. Tri-fuel is a flexible approach for harbor tugs, allowing operators to increase H2/NH3 usage when conditions allow, reducing emissions, and maintaining diesel availability for starts and peak tasks, while aligning with policy goals as low-carbon fuels become more accessible.
As a challenging and long-term process, maritime decarbonization can only be achieved through the successful alignment of multiple components and stakeholders. Although the implementation of MEPC 83 decisions has been decided to be adjourned in MEPC ES.2, which was held in 14–17 October 2025, they opened a new door into maritime decarbonization and provided a basis for the introduction of global market-based measurements (MBMs). As IMO adopts WtW and LCA approaches for realistic carbon pricing as well as for calculating the environmental impacts of fuels, preliminary studies are needed more than ever to guide future work. In this context, the findings of this study provide an important contribution to the efforts for maritime decarbonization, and it is planned to focus on carbon pricing calculations with WtW in the future.
Port authorities should consider transparent procurement with GHG intensity thresholds and safety gates. Pilot programs should be phased, with safety gates and screening metrics. Infrastructure and zoning plans should consider storage layout, ventilation, gas detection, spill containment, and standardized bunkering windows. Economic instruments like CAPEX grants, carbon pricing, and CfD/credit pass-throughs can be used to ease capital costs. An MRV framework and anonymized data can facilitate learning and procurement. Targeted training and joint HAZID/HAZOP drills can support workforce readiness and emergency preparedness.
A bench-scale tri-fuel (diesel–H2–NH3) test rig is planned for future work to monitor in-cylinder pressure and measure emissions (e.g., NOx, N2O, NH3 slip). Upon successful installation, it will be carried out validation campaigns to calibrate the combustion, efficiency, and emissions sub-models and verify the tri-fuel operating framework. The datasets will refine model parameters, uncertainty bounds, and update techno-economic and life-cycle results. In further stages, the test-rig results will be compared with real tugboat operational data obtained in port. As another future work, the harmonized WtW LCA–TEA–MCDM framework can be expanded to include methanol and LNG, as well as hybrid configurations where applicable, offering relevant benchmarks for policy analysis. Also, the LCA system boundary will be expanded to include transport-to-bunker stages as harmonized, high-resolution datasets for ammonia and hydrogen transportation become available—covering liquefied and compressed pathways, maritime/road/pipeline modes, terminal handling, conditioning (compression, liquefaction), boil-off, and venting. The expanded boundary will adopt uniform data structures and allocation rules to enhance comparability with future studies.
Author Contributions
M.U.B.: Conceptualization, Methodology, Formal analysis, Writing; L.B.: Supervision, Writing—review and editing; S.A.: Supervision, Writing—review and editing; Ü.A.: Methodology, Writing, Investigation; V.Ç.: Supervision, Investigation. All authors have read and agreed to the published version of the manuscript.
Funding
This research was funded by the European Climate, Infrastructure and Environment Executive Agency (CINEA) under the European Commission grant agreement No. 101124818—GREEN MARINE MED—EMFAF-2023-PIA-FLAGSHIP. Additional support was provided by the Scientific Research Projects Unit (BAP) of Ankara Yildirim Beyazit University, Project No. 2760.
Institutional Review Board Statement
Not applicable.
Informed Consent Statement
Not applicable.
Data Availability Statement
The original contributions presented in this study are included in the article. Further inquiries can be directed to the corresponding author.
Conflicts of Interest
The authors declare that they have no known competing financial interests or personal relationships that could have appeared to influence the work reported in this paper.
Nomenclature
| Abbreviations | |||
| CAPEX | Capital Expenditure | SMR | Steam-Methane Reforming |
| CCS | Carbon Capture and Storage | TF-CIE | Tri-Fuel CI Engine |
| CI | Compression Ignition | TOPSİS | Technique for Order Preference by Similarity to Ideal Solution |
| C-CIE | Conventional CI Engine | TtW | Tank-To-Wake |
| CRITIC | CRiteria Importance Through Intercriteria Correlation | SAW | Simple Additive Weighting |
| DF-CIE | Dual-Fuel CI Engine | SCG | Surface Coal Gasification |
| ECU | Engine Control Unit | STDV | Standard Deviation |
| FCC | Fuel Consumption Cost | UCG | Underground Coal Gasification |
| FP | Fuel Price | WtT | Well-to-Tank |
| GHG | Greenhouse Gas | WtW | Well-to-Wake |
| IC | Initial Investment Cost | ||
| IMO | International Maritime Organization | Symbols | |
| LCA | Life Cycle Assessment | BC | Black Carbon |
| LCC | Life Cycle Cost | CH4 | Methane |
| LHV | Lower Heating Value | CO2 | Carbon Dioxide |
| LNG | Liquified Natural Gas | H2 | Hydrogen |
| LOC | Lubricating Oil Consumption Cost | H2O | Steam |
| LOP | Lubrication Oil Price | n | Lifespan |
| MC | Maintenance Cost | N2 | Nitrogen |
| MCDM | Multi-Criteria Decision-Making | N2O | Nitrous Oxide |
| MDO | Marine Diesel Oil | NH3 | Ammonia |
| ME | Main Engine | OC | Organic Carbon |
| MEPC | Marine Environment Protection Committee | P | Power |
| MOORA | Multi-Objective Optimization based on Ratio Analysis | PM | Particulate Matter |
| OPEX | Operation Expenditure | r | Discount Rate |
| OT | Operating Time | R | Discount Rate for CAPEX |
| SFC | Specific Fuel Consumption | SOx | Sulfur Oxide |
| SLOC | Specific Lubrication Oil Consumption | t | Operational Period |
| SMC | Specific Maintenance Cost | W | Weights |
References
- IMO. 2023 IMO Strategy on Reduction of GHG Emissions from Ships. Available online: https://www.imo.org/en/ourwork/environment/pages/2023-imo-strategy-on-reduction-of-ghg-emissions-from-ships.aspx (accessed on 6 May 2025).
- Bilgili, L.; Ölçer, A.I. IMO 2023 strategy-Where are we and what’s next? Mar. Policy 2024, 160, 105953. [Google Scholar] [CrossRef]
- Zincir, B.A. Transitioning to sustainable shipping: A multidimensional analysis of maritime emission strategies. Ocean Coast. Manag. 2025, 269, 107823. [Google Scholar] [CrossRef]
- Urban, F.; Nurdiawati, A.; Harahap, F.; Morozovska, K. Decarbonizing maritime shipping and aviation: Disruption, regime resistance and breaking through carbon lock-in and path dependency in hard-to-abate transport sectors. Environ. Innov. Soc. Transit. 2024, 52, 100854. [Google Scholar] [CrossRef]
- NYK. World’s First Commercial-Use Ammonia-Fueled Tugboat Completes Three-Month Demonstration Voyage. Available online: https://www.nyk.com/english/news/2025/20250328_02.html (accessed on 6 June 2025).
- Port of Antwerp Bruges. Hydrotug 1: The Very First Hydrogen-Powered Tug. Available online: https://www.portofantwerpbruges.com/en/hydrotug-1-very-first-hydrogen-powered-tug (accessed on 17 September 2025).
- Dong, D.T.; Schönborn, A.; Christodoulou, A.; Ölcer, A.I.; González-Celis, J. Life cycle assessment of ammonia/hydrogen-driven marine propulsion. Proc. Inst. Mech. Eng. Part M J. Eng. Marit. Environ. 2024, 238, 531–542. [Google Scholar] [CrossRef]
- Karvounis, P.; Theotokatos, G.; Boulougouris, E. Environmental-economic sustainability of hydrogen and ammonia fuels for short sea shipping operations. Int. J. Hydrogen Energy 2024, 57, 1070–1080. [Google Scholar] [CrossRef]
- Müller, M.; Pfeifer, M.; Holtz, D.; Müller, K. Comparison of green ammonia and green hydrogen pathways in terms of energy efficiency. Fuel 2024, 357, 129843. [Google Scholar] [CrossRef]
- Lee, K.; Murakami, S.; Ölҫer, A.I.; Dong, T.; Estebanez, G.; Schönborn, A. Hydrogen enriched LNG fuel for maritime applications—A life cycle study. Int. J. Hydrogen Energy 2024, 78, 333–343. [Google Scholar] [CrossRef]
- Kanchiralla, F.M.; Brynolf, S.; Malmgren, E.; Hansson, J.; Grahn, M. Life-cycle assessment and costing of fuels and propulsion systems in future fossil-free shipping. Environ. Sci. Technol. 2022, 56, 12517–12531. [Google Scholar] [CrossRef]
- Roux, M.; Lodato, C.; Laurent, A.; Astrup, T. A review of life cycle assessment studies of maritime fuels: Critical insights, gaps, and recommendations. Sustain. Prod. Consum. 2024, 50, 69–86. [Google Scholar] [CrossRef]
- Zincir, B. Environmental and economic evaluation of ammonia as a fuel for short-sea shipping: A case study. Int. J. Hydrogen Energy 2022, 47, 18148–18168. [Google Scholar] [CrossRef]
- Tomos, B.A.D.; Stamford, L.; Welfle, A.; Larkin, A. Decarbonising international shipping—A life cycle perspective on alternative fuel options. Energy Convers. Manag. 2024, 299, 117848. [Google Scholar] [CrossRef]
- Liu, H.; Liu, S. Life cycle energy consumption and GHG emissions of hydrogen production from underground coal gasification in comparison with surface coal gasification. Int. J. Hydrogen Energy 2021, 46, 9630–9643. [Google Scholar] [CrossRef]
- Pyrc, M.; Gruca, M.; Tutak, W.; Jamrozik, A. Assessment of the co-combustion process of ammonia with hydrogen in a research VCR piston engine. Int. J. Hydrogen Energy 2023, 48, 2821–2834. [Google Scholar] [CrossRef]
- Frigo, S.; Gentili, R. Analysis of the behaviour of a 4-stroke Si engine fuelled with ammonia and hydrogen. Int. J. Hydrogen Energy 2013, 38, 1607–1615. [Google Scholar] [CrossRef]
- Liu, J.; Wang, X.; Zhao, W.; Sun, P.; Ji, Q. Effects of ammonia energy fraction and diesel injection parameters on combustion stability and GHG emissions characteristics in a low-loaded ammonia/diesel dual-fuel engine. Fuel 2024, 360, 130544. [Google Scholar] [CrossRef]
- Yousefi, A.; Guo, H.; Dev, S.; Liko, B.; Lafrance, S. Effects of ammonia energy fraction and diesel injection timing on combustion and emissions of an ammonia/diesel dual-fuel engine. Fuel 2022, 314, 122723. [Google Scholar] [CrossRef]
- Jamrozik, A.; Tutak, W.; Pyrc, M.; Grab-Rogaliński, K. Experimental study on ammonia-diesel co-combustion in a dual-fuel compression ignition engine. J. Energy Inst. 2024, 115, 101711. [Google Scholar] [CrossRef]
- Matsunaga, D.; Tentora, T.; Hiraoka, K.; Toshinaga, K. A Study on Combustion and Emission Characteristics of Ammonia, Hydrogen and Diesel Tri-Fuel Engines. SAE Int. J. Adv. Curr. Pract. Mobil. 2023, 6, 1583–1589. [Google Scholar]
- Iulianelli, A.; Liguori, S.; Wilcox, J.; Basile, A. Advances on methane steam reforming to produce hydrogen through membrane reactors technology: A review. Catal. Rev. 2016, 58, 1–35. [Google Scholar] [CrossRef]
- Bahadori, A.; Kashiwao, T. Modeling and analysis of hydrogen production in steam methane reforming (SMR) process. Pet. Sci. Technol. 2019, 37, 1425–1435. [Google Scholar] [CrossRef]
- Bridges, A.; Gagliano, M.; Siefert, J.; Dalal, M.; Penso, J. Challenges in the life management of steam methane reformer (SMR) components. In Proceedings of the Pressure Vessels and Piping Conference, Atlanta, GA, USA, 16–21 July 2023; American Society of Mechanical Engineers: New York, NY, USA, 2023; Volume 87486, p. V005T06A058. [Google Scholar]
- Hsu, E.; Peters, D.; Çıtmacı, B.; Chheda, P.; Cui, X.; Wang, Y.; Morales-Guio, C.G.; Christofides, P.D. Modeling and design of a combined electrified steam methane reforming-pressure swing adsorption process. Chem. Eng. Res. Des. 2024, 209, 111–131. [Google Scholar] [CrossRef]
- Pinto, D.D.D.; Limpach, J.M.; Knuutila, H.K. Simulation-based assessment of the potential of offshore blue hydrogen production with high CO2 capture rates with optimised heat recovery. Gas Sci. Eng. 2024, 121, 205177. [Google Scholar] [CrossRef]
- Li, X.; Raorane, C.J.; Xia, C.; Wu, Y.; Tran, T.K.N.; Khademi, T. Latest approaches on green hydrogen as a potential source of renewable energy towards sustainable energy: Spotlighting of recent innovations, challenges, and future insights. Fuel 2023, 334, 126684. [Google Scholar] [CrossRef]
- Dzhusupova, R.; Vis, R. Exploring the Potential of Offshore Green Hydrogen Production: A Concept Study for a Large-Scale Installation. In Proceedings of the Abu Dhabi International Petroleum Exhibition and Conference, Abu Dhabi, United Arab Emirates, 2–5 October 2023; p. D041S141R003. [Google Scholar]
- Naqvi, S.R.; Kazmi, B.; Taqvi, S.A.A.; Chen, W.-H.; Juchelková, D. Techno economic analysis for advanced methods of green hydrogen production. Curr. Opin. Green Sustain. Chem. 2024, 48, 100939. [Google Scholar] [CrossRef]
- Gerloff, N. Comparative Life-Cycle-Assessment analysis of three major water electrolysis technologies while applying various energy scenarios for a greener hydrogen production. J. Energy Storage 2021, 43, 102759. [Google Scholar] [CrossRef]
- Erfani, N.; Baharudin, L.; Watson, M. Recent advances and intensifications in Haber-Bosch ammonia synthesis process. Chem. Eng. Process. Process. Intensif. 2024, 204, 109962. [Google Scholar] [CrossRef]
- Li, B.; Zhu, Y.; Guo, W. Recent advances of metal oxide catalysts for electrochemical NH3 production from nitrogen-containing sources. Inorg. Chem. Front. 2023, 10, 5812–5838. [Google Scholar] [CrossRef]
- Ingale, G.U.; Kwon, H.-M.; Jeong, S.; Park, D.; Kim, W.; Bang, B.; Lim, Y.-I.; Kim, S.W.; Kang, Y.-B.; Mun, J.; et al. Assessment of greenhouse gas emissions from hydrogen production processes: Turquoise hydrogen vs. steam methane reforming. Energies 2022, 15, 8679. [Google Scholar] [CrossRef]
- Muradov, N. Low-carbon production of hydrogen from fossil fuels. In Compendium of Hydrogen Energy; Elsevier: Amsterdam, The Netherlands, 2015; pp. 489–522. [Google Scholar]
- Shin, Y.; Oh, J.; Shin, D. Analysis of the total energy consumption through hydrogen compression for the operating pressure optimization of an alkaline water electrolysis system. Korean J. Chem. Eng. 2023, 40, 2800–2814. [Google Scholar] [CrossRef]
- Łosiewicz, B. Technology for green hydrogen production: Desk analysis. Energies 2024, 17, 4514. [Google Scholar] [CrossRef]
- Rohilla, T.; Kumar, M. Challenges with Sustainable Green Hydrogen Production: Role of Materials, Design, Multi-scale Modeling, and Up-Scaling. In Challenges and Opportunities in Green Hydrogen Production; Springer: Berlin/Heidelberg, Germany, 2024; pp. 455–490. [Google Scholar]
- Olaitan, D.; Bertagni, M.; Porporato, A. The water footprint of hydrogen production. Sci. Total Environ. 2024, 927, 172384. [Google Scholar] [CrossRef]
- Al Gharibi, O.; Pawar, D. Analysis and Assessment of Green Hydrogen Development for the Future of Oman. In Proceedings of the 2024 6th International Conference on Energy, Power and Environment (ICEPE), Shillong, India, 20–22 June 2024; pp. 1–8. [Google Scholar]
- Antzaras, A.N.; Lemonidou, A.A. Recent advances on materials and processes for intensified production of blue hydrogen. Renew. Sustain. Energy Rev. 2022, 155, 111917. [Google Scholar] [CrossRef]
- Marchionna, M. Hydrogen production and conversion to chemicals: A zero-carbon puzzle? Pure Appl. Chem. 2024, 96, 465–470. [Google Scholar] [CrossRef]
- Noh, W.; Park, S.; Kim, Y.; Lee, J.; Kim, J.; Lee, I. Systems design and techno-economic analysis of a novel cryogenic carbon capture process integrated with an air separation unit for autothermal reforming blue hydrogen production system. J. Clean. Prod. 2024, 457, 142341. [Google Scholar] [CrossRef]
- Klaas, L.; Guban, D.; Preisner, N.; Lachmann, B.; Petersen, S.; Roeb, M.; Sattler, C. Sustainable Thermochemical High-Purity Nitrogen Production Using Redox Oxides. In Proceedings of the 2020 Virtual AIChE Annual Meeting, Virtual, 16–20 November 2020. AIChE. [Google Scholar]
- Li, Y.; Ren, J.; Ma, H.; Campbell, A.N. Technical and economic performance assessment of blue hydrogen production using new configuration through modelling and simulation. Int. J. Greenh. Gas Control 2024, 134, 104112. [Google Scholar] [CrossRef]
- Munasinghe-Arachchige, S.P.; Nirmalakhandan, N. Nitrogen-fertilizer recovery from the centrate of anaerobically digested sludge. Environ. Sci. Technol. Lett. 2020, 7, 450–459. [Google Scholar] [CrossRef]
- Ghavam, S.; Vahdati, M.; Wilson, I.A.G.; Styring, P. Sustainable ammonia production processes. Front. Energy Res. 2021, 9, 580808. [Google Scholar] [CrossRef]
- Nguyen, T.; Abdin, Z.; Holm, T.; Mérida, W. Grid-connected hydrogen production via large-scale water electrolysis. Energy Convers. Manag. 2019, 200, 112108. [Google Scholar] [CrossRef]
- Lee, H.; Lee, B.; Byun, M.; Lim, H. Comparative techno-economic analysis for steam methane reforming in a sorption-enhanced membrane reactor: Simultaneous H2 production and CO2 capture. Chem. Eng. Res. Des. 2021, 171, 383–394. [Google Scholar] [CrossRef]
- Tang, Y.; Li, Y. Comparative analysis of the levelized cost of hydrogen production from fossil energy and renewable energy in China. Energy Sustain. Dev. 2024, 83, 101588. [Google Scholar] [CrossRef]
- Ulleberg, Ø.; Hancke, R. Techno-economic calculations of small-scale hydrogen supply systems for zero emission transport in Norway. Int. J. Hydrogen Energy 2020, 45, 1201–1211. [Google Scholar] [CrossRef]
- Soja, R.J.; Gusau, M.B.; Ismaila, U.; Garba, N.N. Comparative analysis of associated cost of nuclear hydrogen production using IAEA hydrogen cost estimation program. Int. J. Hydrogen Energy 2023, 48, 23373–23386. [Google Scholar] [CrossRef]
- Gado, M.G. Techno-economic-environmental assessment of green hydrogen and ammonia synthesis using solar and wind resources for three selected sites in Egypt. e-Prime Adv. Electr. Eng. Electron. Energy 2024, 10, 100780. [Google Scholar] [CrossRef]
- Dahani, A.; Benqlilou, C.; Holz, M.; Scott, C. Land Suitability Analysis for Green Ammonia Unit Implementation in Morocco Using the Geographical Information System–Analytic Hierarchy Process Approach. Processes 2024, 12, 1991. [Google Scholar] [CrossRef]
- Jamrozik, A.; Tutak, W. The impact of ammonia and hydrogen additives on the combustion characteristics, performance, stability and emissions of an industrial DF diesel engine. Appl. Therm. Eng. 2024, 257, 124189. [Google Scholar] [CrossRef]
- Diakoulaki, D.; Mavrotas, G.; Papayannakis, L. Determining objective weights in multiple criteria problems: The critic method. Comput. Oper. Res. 1995, 22, 763–770. [Google Scholar] [CrossRef]
- Molitor, E.; Bakosch, A.; Forsman, B. Feasibility Study on LNG Fuelled Short Sea and Coastal Shipping in the Wider Caribbean Region; SSPA Sweden AB: London, UK, 2012. [Google Scholar]
- Karaçay, Ö.E.; Özsoysal, O.A. Techno-economic investigation of alternative propulsion systems for tugboats. Energy Convers. Manag. X 2021, 12, 100140. [Google Scholar] [CrossRef]
- Koenhardono, E.S. Comparative of feasibility study between diesel mechanical propulsion system and combination of diesel engine and electric motor propulsion system on Offshore Patrol Vessel (OPV) 80 m. MATEC Web Conf. 2018, 177, 01011. [Google Scholar] [CrossRef][Green Version]
- Faber, J.; Nelissen, D.; Ahdour, S.; Harmsen, J.; Toma, S.; Lebesque, L. Study on the Completion of an EU Framework on LNG-fuelled Ships and its Relevant Fuel Provision Infrastructure. Analysis of the LNG market development in the EU. European Commission. Directorate-General for Mobility and Transport. 2015. Available online: https://transport.ec.europa.eu/system/files/2017-11/2015-12-lng-lot3.pdf (accessed on 31 October 2025).
- Wartsila. Find the Right Ship Engine for You. Available online: https://www.wartsila.com/marine/engine-configurator (accessed on 7 October 2025).
- Shipandbunker. Ship&Bunker. Available online: https://shipandbunker.com/prices (accessed on 24 August 2025).
- Tjahjono, M.; Stevani, I.; Siswanto, G.A.; Adhitya, A.; Halim, I. Assessing the feasibility of gray, blue, and green ammonia productions in Indonesia: A techno-economic and environmental perspective. Int. J. Renew. Energy Dev. 2023, 12, 1030–1040. [Google Scholar] [CrossRef]
- Bhuiyan, M.M.H.; Siddique, Z. Hydrogen as an alternative fuel: A comprehensive review of challenges and opportunities in production, storage, and transportation. Int. J. Hydrogen Energy 2025, 102, 1026–1044. [Google Scholar] [CrossRef]
- Yagüe, L.; Linares, J.I.; Arenas, E.; Romero, J.C. Levelized cost of biohydrogen from steam reforming of biomethane with carbon capture and storage (golden hydrogen)—Application to Spain. Energies 2024, 17, 1134. [Google Scholar] [CrossRef]
- Trivyza, N.L.; Rentizelas, A.; Theotokatos, G. A novel multi-objective decision support method for ship energy systems synthesis to enhance sustainability. Energy Convers. Manag. 2018, 168, 128–149. [Google Scholar] [CrossRef]
- Zincir, B.A.; Arslanoglu, Y. Comparative life cycle assessment of alternative marine fuels. Fuel 2024, 358, 129995. [Google Scholar] [CrossRef]
- Jin, S.; Wu, B.; Zi, Z.; Yang, P.; Shi, T.; Zhang, J. Effects of fuel injection strategy and ammonia energy ratio on combustion and emissions of ammonia-diesel dual-fuel engine. Fuel 2023, 341, 127668. [Google Scholar] [CrossRef]
- Karagöz, Y.; Sandalcı, T.; Yüksek, L.; Dalkılıç, A. Engine performance and emission effects of diesel burns enriched by hydrogen on different engine loads. Int. J. Hydrogen Energy 2015, 40, 6702–6713. [Google Scholar] [CrossRef]
- Qi, Y.; Liu, W.; Liu, S.; Wang, W.; Peng, Y.; Wang, Z. A review on ammonia-hydrogen fueled internal combustion engines. eTransportation 2023, 18, 100288. [Google Scholar] [CrossRef]
- Zhang, Z.; Hu, J.; Yang, D.; Yin, Z.; Lu, K.; Tan, D. A comprehensive assessment over the environmental impact and combustion efficiency of using ammonia/ hydrogen/diesel blends in a diesel engine. Energy 2024, 303, 131955. [Google Scholar] [CrossRef]
- Schreuder, W.; Slootweg, J.C.; van der Zwaan, B. Techno-economic assessment of low-carbon ammonia as fuel for the maritime sector. Appl. Energy Combust. Sci. 2025, 22, 100330. [Google Scholar] [CrossRef]
- Mojarrad, M.; Thorne, R.J.; Rødseth, K.L. Technical and cost analysis of zero-emission high-speed ferries: Retrofitting from diesel to green hydrogen. Heliyon 2024, 10, e27479. [Google Scholar] [CrossRef]
- Muñoz, P.; Franceschini, E.A.; Levitan, D.; Rodriguez, C.R.; Humana, T.; Perelmuter, G.C. Comparative analysis of cost, emissions and fuel consumption of diesel, natural gas, electric and hydrogen urban buses. Energy Convers. Manag. 2022, 257, 115412. [Google Scholar] [CrossRef]
- Rout, C.; Li, H.; Dupont, V.; Wadud, Z. A comparative total cost of ownership analysis of heavy duty on-road and off-road vehicles powered by hydrogen, electricity, and diesel. Heliyon 2022, 8, e12417. [Google Scholar] [CrossRef] [PubMed]


Disclaimer/Publisher’s Note: The statements, opinions and data contained in all publications are solely those of the individual author(s) and contributor(s) and not of MDPI and/or the editor(s). MDPI and/or the editor(s) disclaim responsibility for any injury to people or property resulting from any ideas, methods, instructions or products referred to in the content. |
© 2025 by the authors. Licensee MDPI, Basel, Switzerland. This article is an open access article distributed under the terms and conditions of the Creative Commons Attribution (CC BY) license (https://creativecommons.org/licenses/by/4.0/).