Article

Spatiotemporal Evolution and Drivers of the Carbon Footprint and Embodied Carbon Transfer in the Advanced Manufacturing Industry: Case Study of the Western Region in China

School of Economics and Management, Chongqing Normal University, Chongqing 401331, China
*
Author to whom correspondence should be addressed.
Sustainability 2025, 17(22), 10272; https://doi.org/10.3390/su172210272
Submission received: 24 September 2025 / Revised: 3 November 2025 / Accepted: 11 November 2025 / Published: 17 November 2025

Abstract

Motivated by the policy urgency of China’s dual-carbon goals and the practical obstacle that official input–output (IO) and MRIO tables are sparse and non-consecutive, this study investigates how to generate credible, mechanism-aware provincial–sector forecasts of carbon footprints and embodied transfers for Western China—a region with pronounced structural heterogeneity. We develop a regionalized forecasting pipeline that fuses balance-constrained MRIO completion (RAS–CE) with a Whale-optimized Grey Neural Network (WOA–GNN), bridging the data gap (2007–2017 reconstruction) and delivering 2018–2030 projections at province–sector resolution. The novelty lies in integrating RAS–CE with a meta-heuristic grey learner and layering explainable network analytics—Grey Relational Analysis (GRA) for factor ranking, complex-network measures with QAP regressions for driver identification, and SHAP for post hoc interpretation—so forecasts are not only accurate but also actionable. Empirically, (i) energy mix/intensity and output scale are the dominant amplifiers of footprints, while technology upgrading (process efficiency, electrification) is the most robust mitigator; (ii) a structural sectoral hierarchy persists—S2 (non-metallic minerals) remains clinker/heat-intensive, S3 (general/special equipment) operates as a mid-chain hub, and S6/S7 (electrical machinery/instruments) maintain lower, more controllable intensities as the grid decarbonizes; (iii) by 2030, the embodied carbon network becomes denser and more centralized, with Sichuan–Chongqing–Guizhou–Guangxi forming high-betweenness corridors; and (iv) QAP/SHAP converge on geographic contiguity (D) and economic differentials (E) as the strongest positive drivers (openness Z and technology gaps T secondary; energy-mix differentials F weakly dampening). Policy-wise, the framework points to green-power contracting and trading for hubs, deep retrofits in S2/S3 (low-clinker binders, waste-heat recovery, efficient drives, targeted CCUS), technology diffusion to lagging provinces, and corridor-level governance—demonstrating why the RAS–CE + WOA–GNN coupling is both necessary and impactful for data-constrained regional carbon planning.

1. Introduction

With the escalating challenges posed by global climate change, carbon emission control has become a central concern for governments and enterprises worldwide. As the largest carbon emitter globally, China has prioritized low-carbon transformation under the guidance of its “dual-carbon” goals—carbon peaking and carbon neutrality. Advanced manufacturing, as a key driver of high-quality growth, still entails substantial energy use and associated emissions, especially in Western China where industrial structure, technological level, and energy mix amplify the carbon footprint and embodied transfer problem. Against this backdrop, analyzing and forecasting the carbon footprint and embodied carbon transfer of advanced manufacturing in Western China is of practical significance for optimizing regional industrial structures, designing effective low-carbon policies, and promoting green manufacturing.
The carbon footprint, rooted in ecological footprint research by Wackernagel and Rees [1], has become a core metric for product-, industry-, and region-level carbon evaluation. Accounting methods span process/LCA approaches—ranging from forged steel and LNG-vessel assessments to pipeline and waste-treatment life-cycle models [2,3,4,5]—and IO-based approaches that decompose or attribute footprints at national and city-state scales [6,7]. Extending these IO/MRIO applications to the urban-agglomeration scale, Huang et al. quantify carbon footprints and embodied transfers across Yellow River Basin city clusters, revealing intra-regional linkages and policy-relevant transfer corridors [8]. Parallel work on embodied carbon transfer leverages MRIO to trace sectoral and interregional flows in China and beyond, employing WIOD/Exiobase data, structural path/decomposition analysis, and inequality-focused indicators [9,10,11,12,13,14]. Forecasting methods have evolved from classical grey/time-series models to hybrid AI pipelines, including VMD–ELM, GIOWA-based ensembles, fractional grey Riccati models, and PSO-enhanced grey frameworks for multi-scale emission prediction [15,16,17,18]. Together these strands establish robust foundations for measurement, transfer mapping, and forward-looking evaluation while highlighting the need for region- and sector-specific integration that motivates the present study.
Recent advances in carbon transfer network analysis. Beyond conventional accounting, a growing strand of research models embodied carbon flows as directed, weighted networks and analyzes their topology with social network analysis (SNA), commonly implemented in UCINET (and, in related applications, Pajek v6.01/Gephi 0.9.2/NetworkX 2.8) [19]. Using MRIO-derived interregional or intersectoral flow matrices as adjacency data, studies compute degree/strength centralities (in/out) to identify emission “sources” and “sinks,” betweenness to locate transit hubs along supply chain corridors, and closeness to gauge accessibility within the transfer system [20]. Network-level indicators such as density, reciprocity, centralization, assortativity, and small-worldness characterize cohesion and hierarchy, while community detection/modularity, core–periphery decomposition, and block modelling reveal clustered production belts (e.g., basic materials vs. equipment chains) and hub-and-corridor patterns [21]. Methodologically, QAP/MR-QAP in UCINET is increasingly used to relate dyadic transfer intensities to geographic contiguity/distance, economic and technological differentials, openness, and energy-mix differences, with permutation tests addressing network dependence [22]. Extensions include temporal (panel) networks to track structural evolution, bipartite province–sector projections, and backbone extraction (e.g., disparity filters) to isolate statistically significant transfer pathways [23]. Together, these SNA-based approaches situate embodied carbon within a relational architecture of production and trade, offering diagnostic leverage that complements footprint accounting and strengthens the interpretation of downstream policy analyses.
Addressing gaps in regional focus, sectoral granularity, and model integration for Western China’s advanced manufacturing, this study (1) quantifies province–sector direct emissions via the IPCC emission-factor approach; (2) reconstructs missing-year IO/MRIO tables with RAS–CE to ensure structural consistency; (3) computes 2007–2017 carbon footprints and embodied transfers by combining MRIO with energy statistics; (4) diagnoses drivers using Grey Relational Analysis across economic, social, environmental, energy, and technology dimensions; (5) forecasts 2018–2030 footprints and transfers with a hybrid WOA–GNN model trained on the 2007–2017 panel; (6) profiles the 2030 embodied transfer topology via complex network metrics (degree, betweenness, closeness, and network-level indicators); (7) identifies structural determinants under network dependence with QAP (geography, economy, technology, openness, energy mix); and (8) provides post hoc explainability via SHAP. This integrated pipeline links rigorous data completion and accounting to predictive, interpretable network diagnostics, yielding policy-ready evidence for corridor governance and low-carbon industrial upgrading aligned with China’s dual-carbon goals.

2. Research Methods

2.1. GHG Inventory

According to the carbon emission inventory estimation method provided by the Intergovernmental Panel on Climate Change (IPCC) [24,25,26,27,28,29,30], the direct emissions of various sectors within the advanced manufacturing industry in each province of the western region can be calculated based on energy consumption data.
P R i = r = 1 z E R i r × N C V R r × C E F R r × C O F R r ×   44 / 12 ,   i   =   1 ,   2 ,   3 ,     7
In Equation (1), P R i represents the direct emissions of sector i in province R, and z denotes the number of energy types. E R i r , N C V R r , C E F R r ,   a n d   C O F R r refer to the energy consumption, average net calorific value, average carbon emission factor, and carbon oxidation rate of the r-th type of energy used by sector i in province R, respectively. The values of average net calorific value, carbon emission factor, and carbon oxidation rate for various energy types are derived from the Guidelines for Provincial Greenhouse Gas Inventory Compilation (National Development and Reform Commission–2011). The CO2 emission factor for standard coal adopts the recommended values provided by the Energy Research Institute of the National Development and Reform Commission.

2.2. Bi-Proportional RAS-Cross Entropy (RAS–CE) Method

The input–output (IO) table and multi-regional input–output (MRIO) table serve as essential data foundations for analyzing regional carbon footprints and embodied carbon transfers [31,32,33,34,35]. However, China’s official IO/MRIO releases appear at relatively long intervals and in non-consecutive years, hindering continuous and timely assessments of the temporal evolution of emissions. To bridge this gap while preserving accounting identities, we adopt the RAS–CE approach—a bi-proportional balancing framework formulated with a cross-entropy (Kullback–Leibler) objective. RAS–CE exactly satisfies row/column controls and non-negativity, while remaining information-theoretically closest to an authoritative prior table; in practice it preserves technological and trade structure with minimal distortion, converges quickly, and is auditable via margin errors, iteration counts, and entropy distance. These properties make RAS–CE particularly suitable for IO/MRIO data supplementation, where mass balance and additivity are binding constraints and where reconstructed matrices must be immediately usable for footprint accounting, embodied transfer analysis, and network/QAP inference.
Concretely, we employ RAS–CE to reconstruct missing-year MRIO tables for advanced manufacturing in Western China from 2007 to 2017, using the officially released IO years 2007, 2010, 2012, 2015, and 2017 as priors. The method combines Row-and-Column Scaling (RAS) with a cross-entropy criterion, thereby integrating “structural consistency” with “information-entropy minimization”: it maintains the stability of the input–output structure while enhancing numerical fit and plausibility to match credible row/column controls (e.g., provincial/sector totals, final demand, and energy/CO2 aggregates). We iterate until tight tolerance on all margins is achieved and report diagnostics (maximum relative margin error, iterations, KL divergence); robustness checks include ±5% control perturbations and zero-treatment sensitivity. Compared with cell-wise interpolation, regression, or low-rank completion—which often violate accounting identities or yield negative entries—RAS–CE provides a conservative, policy-alignable, and reproducible reconstruction that improves the completeness and accuracy of the annual series while avoiding artificial structural breaks.

2.2.1. Data Preparation and Year Correspondence

Based on the published input–output table data by the National Bureau of Statistics of China (2007, 2010, 2012, 2015, and 2017), the baseline matrices are constructed, and the following rules are applied for extrapolating the missing years (see Table 1).

2.2.2. Modelling Steps

Initial Matrix Setup and Row/Column Constraint Extraction: Let the known baseline input–output table be matrix X 0 = [ x i j ] R n × n , where xij represents the intermediate input from sector i to sector j. The row and column totals for the target year are denoted as:
r = [ r i ] , s = [ s j ] , i , j = 1,2 , . . . , n
RAS Structural Iterative Adjustment: Using the classic RAS method, the row scaling factor ri and column scaling factor sj are applied to adjust X0 to obtain matrix XRAS, while satisfying the following constraints:
x i j ( t + 1 ) = r i ( t ) · x i j ( t ) · s j ( t )
The iteration continues until the sums j x i j ( t ) r i and i x i j ( t ) s j are satisfied.
CE Information Entropy Optimization Constraint Adjustment: Based on the RAS results, a cross-entropy minimization objective function is introduced:
m i n x i = 1 n j = 1 n x i j l n ( x i j / x i j 0 )
where xij represents the target year output, and xij0 is the RAS result or prior matrix. The goal is to minimize the information divergence between the constructed matrix and the reference matrix, subject to the constraints:
j = 1 n x i j = r i ,   i = 1 n x i j = s j ,   x i j 0
Hybrid Optimization and Matrix Generation: By combining the RAS iteration and CE optimization principles, the optimal target year input–output matrix X* is constructed using methods like Lagrange multipliers or alternating minimization algorithms. This matrix maintains the structural features of the baseline and is more consistent with the economic reality of the target year.

2.2.3. Verification and Dynamic Adjustment

The generated MRIO matrices for each year are validated through the following checks: (1) Consistency Check: Verify the convergence of row and column totals and the balance error; (2) Structural Stability Analysis: Use the Structure Deviation Index (SDI) to evaluate the degree of matrix variation; (3) Macroeconomic Consistency Check: Verify consistency with total output, energy consumption, or carbon emissions as reported in statistical yearbooks
Through these steps, the MRIO data for the missing years between 2007 and 2017 for the advanced manufacturing sectors in Western China are constructed, providing a solid data foundation for subsequent carbon footprint measurement and embodied carbon transfer analysis.

2.3. Regional Input–Output (IO) Model

The Input–Output (IO) model, proposed by American economist Wassily Leontief in the 1930s, is an economic analysis tool. This model uses matrix forms to describe the input–output relationships between sectors in an economic system, revealing the interdependencies among industries and the transmission effects of economic activities. In this paper, the IO model is used to calculate the carbon footprint of the advanced manufacturing sectors in 11 provinces of Western China. The main balancing relationships and concepts in the IO model are as follows:
First, the direct consumption coefficient aij is introduced, and the calculation formula is as follows:
  a i j = x i j X j ,   ( i ,   j   =   1 ,   2 ,     n )
where xij represents the flow of products between sector i and sector j, that is, the value of products from sector i consumed by sector j during the production stage. Xj is the total input of sector j.
Next, based on the value input–output table, a row balancing model is established:
A X + Y = X
X = ( I A ) 1 Y
where A is the direct consumption coefficient matrix ( a i j ) n × n , X = X 1 X 2 X n is the column vector of total output for each sector, Y = Y 1 Y 2 Y n is the column vector of final demand for each sector, and ( I A ) 1 is the Leontief inverse matrix.
After calculating the direct emissions based on Equation (1), as shown in Equations (7) and (8), the complete carbon dioxide emission coefficients for each sector in province R can be obtained by multiplying the direct emission coefficients by the Leontief inverse matrix ( I A ) 1 . Then, this coefficient is multiplied by the final demand to obtain the carbon footprint for each sector in province R. The calculation formula is as follows:
e i = P R i / x i , E = ( e i )
C R i = E ( I A ) 1 Y
where e i , P R i ,   a n d   x i represent the direct carbon CO2 emission coefficient, direct carbon dioxide emissions, and total output of sector I; E is the direct carbon emission coefficient matrix; and C R i is the carbon footprint of the sector.

2.4. Multi-Regional Input–Output (MRIO) Model

To calculate inter-provincial embodied carbon emission transfers using the multi-regional input–output (MRIO) model, it is necessary to combine it with carbon emission data. The calculation formula is as follows:
L R S = E R S ( I A R S ) 1
E R S = E R 1 0 0 E R 2 0 0 0 0 E R 11
LRS is a multi-regional total carbon emission coefficient matrix, representing the direct and indirect carbon emissions generated by the need to transfer products from province R to province S in the unit of final consumption in province S. ERS is the direct carbon emission coefficient matrix between province R and province S, where each E R i (i = 1, 2,…, 11) is a 7 × 7 diagonal matrix. The diagonal element E i R = P R i / x R i ( x R i being the total output of the i-th sector in province R) represents the direct carbon emission coefficient of the i-th sector in province R. ( I A R S ) 1 is the Leontief inverse matrix for provinces R and S in the multi-regional input–output table.
Finally, LRS is multiplied by the multi-regional final consumption matrix YRS to obtain the multi-regional embodied carbon emission transfer matrix TRS.
T R S = L R S Y R S
where TRS represents the embodied carbon emission transfer from province R to province S, and YRS represents the final consumption of each sector in province S from province R.
Similarly, the embodied carbon emission transfer from sector i to sector j can be obtained as follows:
T i j = L i j Y i j
Here, Tij denotes the embodied carbon transferred from sector i to sector j; Lij represents the direct and indirect carbon emissions from sector i that are required (drawn in) and embodied in one unit of the final-use product of sector j; and Yij denotes the amount of final use of sector i by sector j.

2.5. Grey Relational Analysis (GRA)

Grey Relational Analysis (GRA) is a comparative technique that quantifies the proximity of system dynamics by evaluating the geometric similarity between a reference series and one or more comparison series, thereby measuring the degree of association between curves. The closer the trend similarity, the higher the association. To identify the key drivers of the carbon footprint of advanced manufacturing in Western China—while accommodating a short sample window, heterogeneous units, and potential non-normality—we apply GRA to the carbon-footprint sequences already computed in this study. Specifically, the reference series is the carbon-footprint time series (provincial level: each province’s advanced-manufacturing footprint for 2007–2017; sectoral level: each sector’s footprint), and the comparison series are constructed around five categories of factors: (i) Economic—at the provincial level, Final demand (household final consumption + government final consumption + capital formation + exports, where capital formation includes gross fixed capital formation and changes in inventories); at the sectoral level, Output scale; (ii) Social—at both levels, Household consumption share (share of household final consumption in total final demand); (iii) Environmental—at both levels, Carbon/Direct emission intensity (emissions ÷ output); (iv) Energy—at the provincial level, Coal share (coal consumption ÷ total energy); at the sectoral level, Energy intensity (energy consumption ÷ output); and (v) Technology—at the provincial level, Efficiency improvement (treated inversely so that faster improvement implies stronger association), and at the sectoral level, Electricity share (also treated inversely to reflect the mitigating role of electrification/clean power). To eliminate differences in scale and direction, all indicators are first min–max normalized (range standardization), and inhibitory indicators (e.g., technological improvements, electricity share) are direction-aligned by inversion (see Table 2 and Table 3). We then follow the standard GRA procedure: compute grey relational coefficients with distinguishing coefficient ρ set to 0.5 (and conduct sensitivity checks over ρ ∈ [0.3, 0.7]); aggregate coefficients across time using a weighted mean to obtain the grey relational grade γ (baseline: equal time weights; robustness: time-increasing weights and entropy weights). Factors are ranked by γ and classified into strong (γ ≥ 0.70), moderate (0.50–0.70), and weak (γ < 0.50) association levels, from which the “top-three” factors are identified at the provincial and sectoral levels, respectively. For robustness, beyond varying ρ and weighting schemes, we also re-estimate GRA with a one-period lag for demand-type indicators and assess ranking stability across specifications using Kendall’s rank correlation.

2.6. Whale Optimization Algorithm-Grey Neural Network Forecasting Model

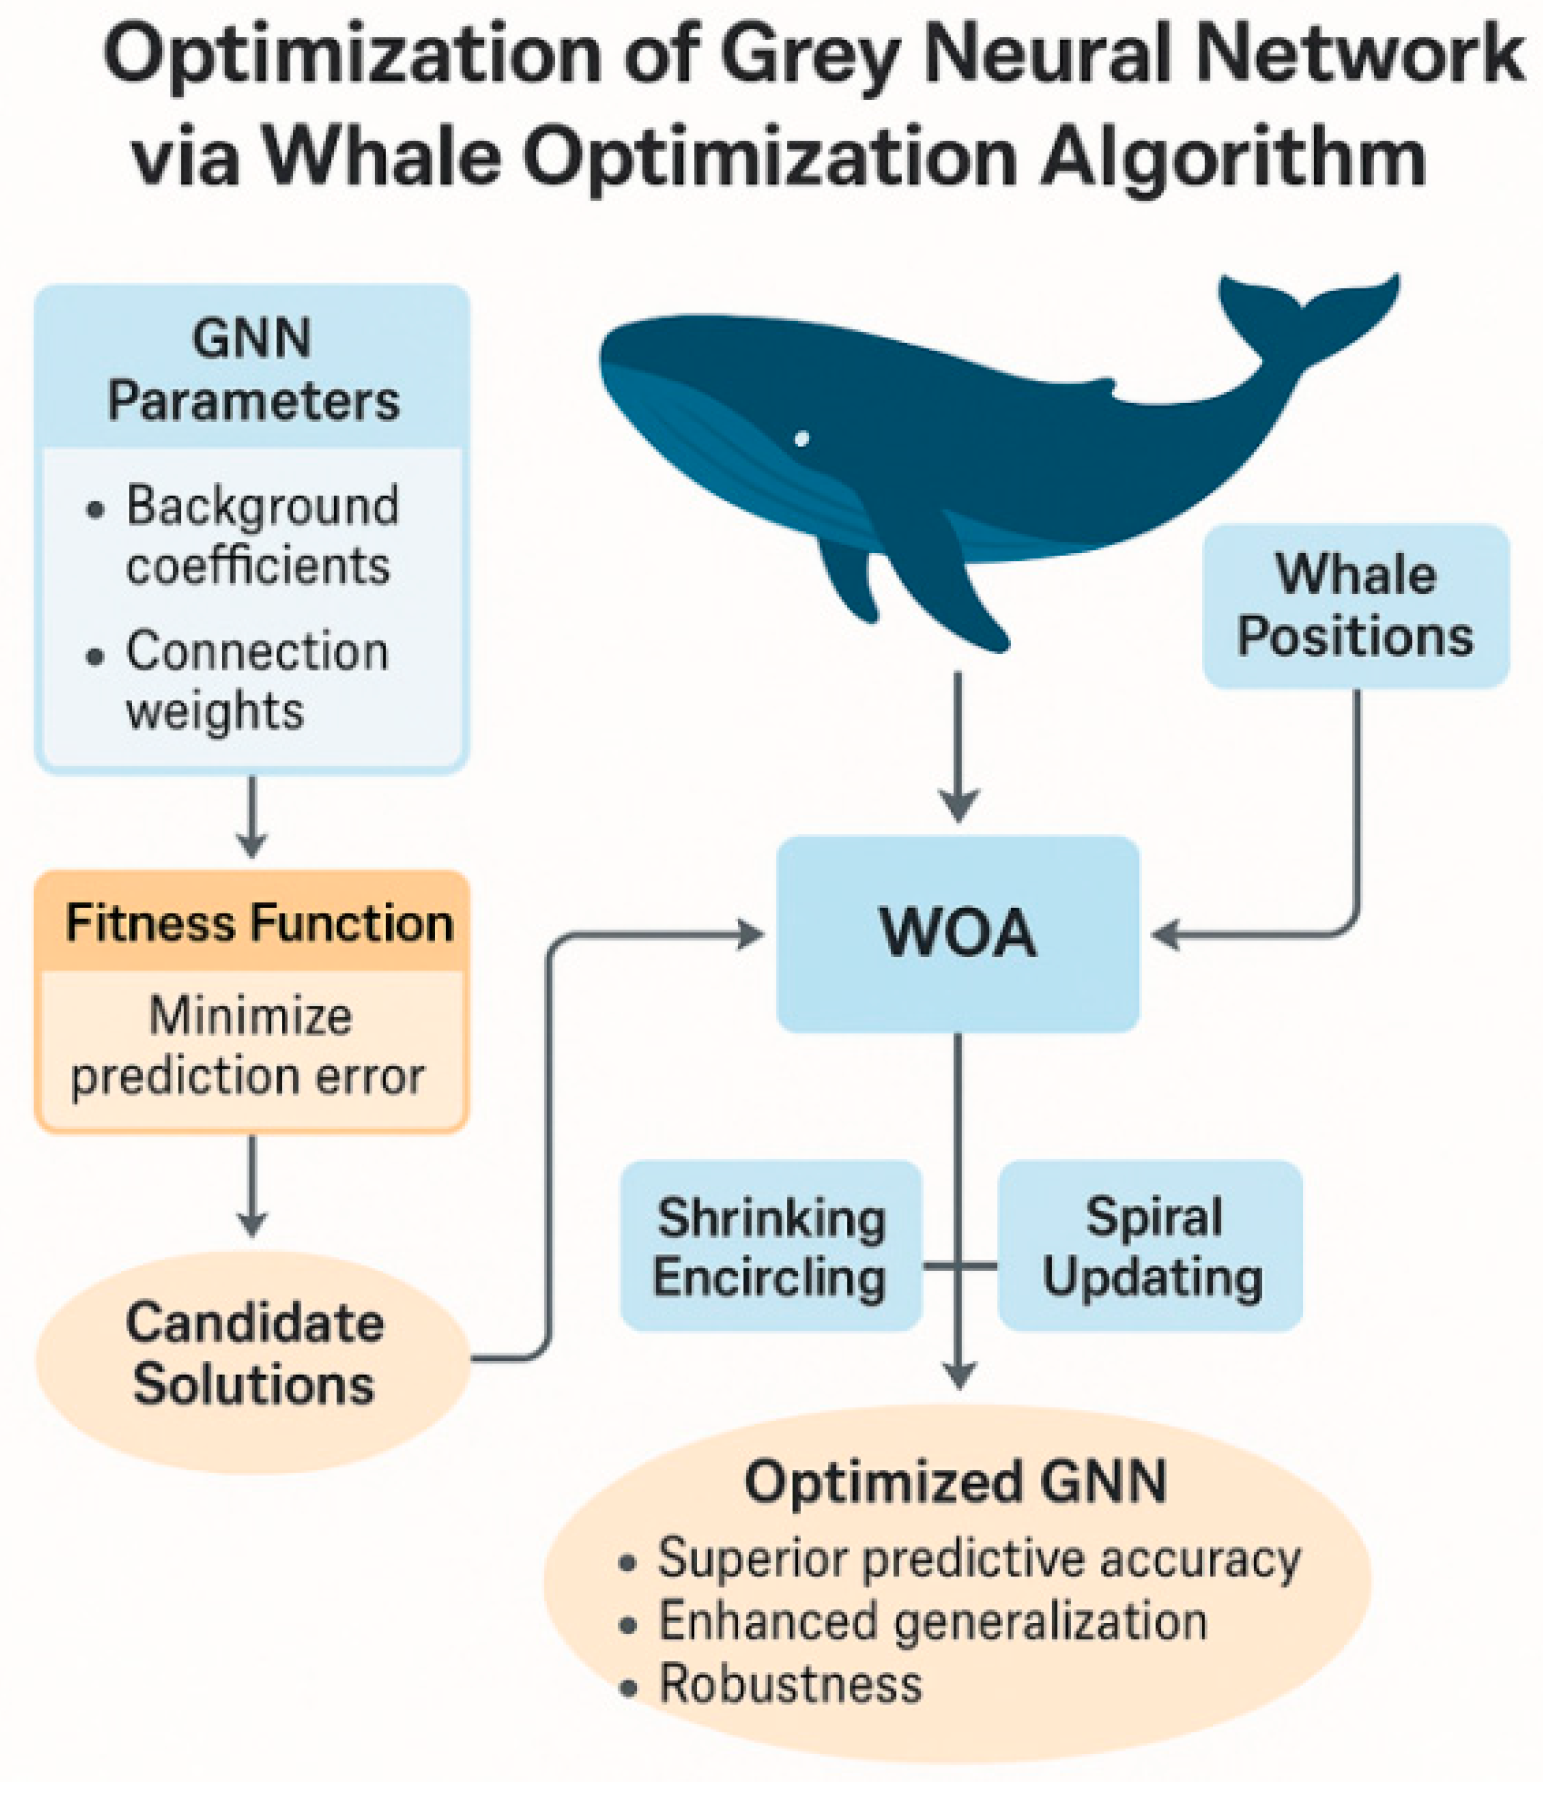
The algorithm combines Whale Optimization Algorithm (WOA) and Grey Neural Network (GNN) to forecast the future carbon footprint ( C R i 2030 ) and embodied carbon transfer ( T i j 2030 ) (Figure 1).
Grey Modelling: The Grey System GM(1,1) model is used to process the historical time-series data of carbon footprint and carbon transfer, capturing the time evolution trend [18,36,37,38,39,40,41,42,43,44].
y ^ ( k + 1 ) = a · y ( k ) + b
where y ( k ) represents historical data, y ^ ( k + 1 ) is the forecasted value, and a and b are model parameters.
Neural Network Construction: The neural network models the non-linear relationship between input data and the target variables. The input is the feature data processed through the grey model, and the output is the forecasted carbon footprint ( C R i ) or embodied carbon transfer ( T i j ). The activation function for the neural network is f(x) expressed as follows:
y = f ( W · x + b )
where y is the output layer forecasting, W is the weight matrix, x is the input data, and b is the bias.
Whale Optimization Algorithm (WOA): WOA is used to optimize the weights and biases of the neural network. The position update formula for the whale is
X t + 1 = X t + A · C · X * X t
where X t is the current position of the whale (i.e., the network parameters), X * is the current optimal solution, and A and C are control parameters that influence the search process.
Optimization Objective: The goal is to optimize the network weights and biases by minimizing the forecasting error (Mean Squared Error, MSE):
M S E = 1 n i = 1 n ( y i y i ^ ) 2
where y i is the actual value, y i ^ is the forecasted value, and n is the number of samples.
Final forecasting: After training and optimization, the neural network uses the optimal weights and biases to forecast the future carbon footprint and embodied carbon transfer [37,45,46,47,48,49,50,51,52]:
C R i ^ = f ( W * · x + b * )
T i j ^ = f ( W * · x + b * )
where C R i ^ and T i j ^ are the forecasted carbon footprint and embodied carbon transfer, and W * and b * are the optimal weights and biases obtained through WOA.

2.7. Quadratic Assignment Procedure (QAP)

To identify the drivers of the embodied—carbon transfer linkage network in the advanced manufacturing sector of Western China, this study employs Quadratic Assignment Procedure (QAP) regression, which is well-suited for assessing relationships among two or more relational matrices. Following prior research, we specify a QAP model in which the dependent variable is the 0–1 adjacency matrix of the embodied carbon transfer network (Net), and the explanatory matrices capture: geographic contiguity (Dij), energy-consumption structure difference (Fij), industrial-structure difference (Pij), economic-development level difference (Eij), technology level difference (Tij), and openness level difference (Zij). The model is expressed as shown in Equation (21).
N e t = f ( D i j , F i j , P i j , E i j , T i j , Z i j )
All variables enter the regression as matrices; definitions are provided in Table 4. For each province, we compute the time-average of the relevant indicators over the study period and then build the corresponding absolute-difference matrices (for F, P, E, T, Z) and the binary contiguity matrix (for D) on that basis to conduct the QAP analysis.
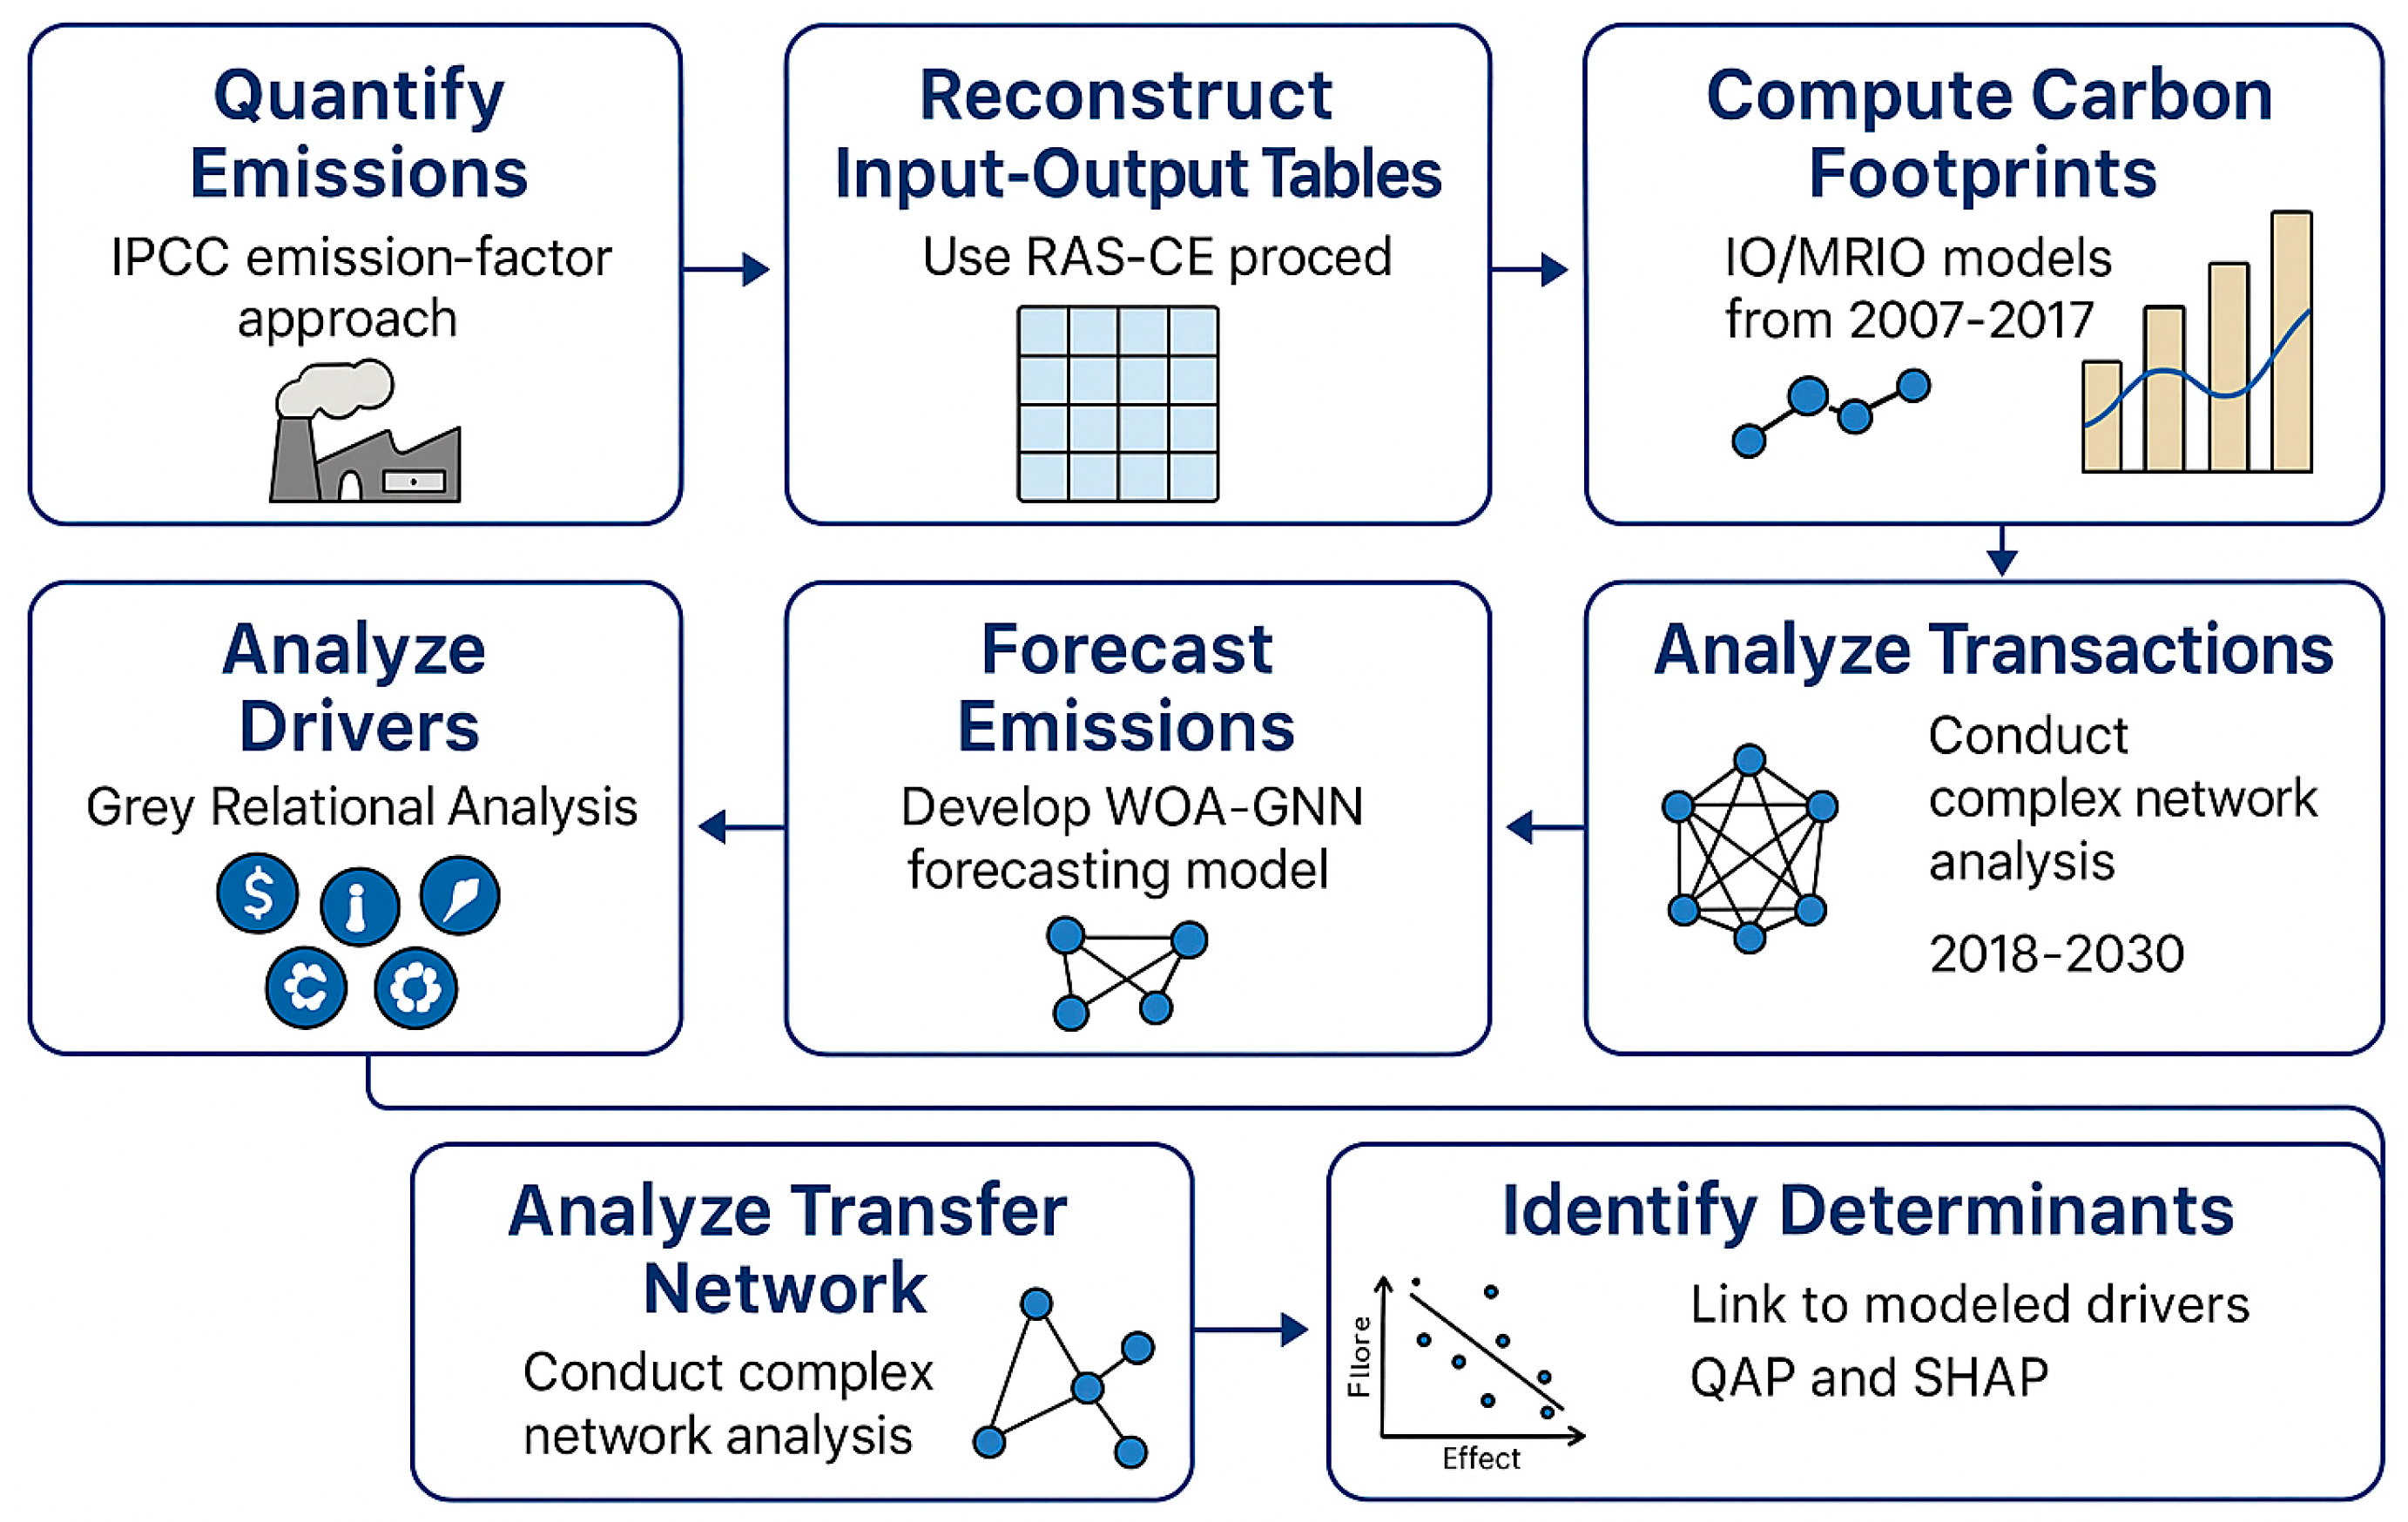
Figure 2 illustrates the integrated modelling pipeline for this study. Beginning with data assembly and reconstruction—official IO/MRIO tables and energy statistics completed for missing years via RAS–CE, plus direct emissions estimated with IPCC factors—the framework conducts MRIO-based accounting of carbon footprints and embodied carbon transfers (2007–2017) for Western China’s advanced manufacturing. It then applies Grey Relational Analysis (GRA) to screen drivers, and a hybrid WOA–GNN module to forecast provincial/sectoral footprints and transfers for 2018–2030. Finally, complex network analysis and QAP regressions characterize the 2030 transfer network and its structural drivers, while SHAP provides post hoc interpretability. The workflow yields policy-ready outputs—trajectories, transfer maps, and factor attribution—to support targeted low-carbon interventions.

3. Result Analysis

Based on the RAS–CE method and the available input–output table data for existing benchmark years, multi-regional input–output (MRIO) tables for the advanced manufacturing sectors in Western China were constructed and completed for the years 2008, 2009, 2011, 2013, 2014, and 2016 [53,54,55,56]. On this basis, a temporal linkage and structural balance of MRIO tables for the advanced manufacturing industry in Western China from 2007 to 2017 was achieved. This provides a robust data foundation for the subsequent dynamic estimation of carbon footprints and embodied carbon transfers.

3.1. Data Source

The energy consumption data used in carbon footprint accounting are derived from the 2007–2017 China Provincial Energy Inventory published by the CEADS Database. The input–output tables are obtained from the non-competitive multi-regional input–output (MRIO) tables for China in 2007, 2010, 2012, 2015, and 2017, as published by the National Bureau of Statistics of China. The MRIO data used for calculating interprovincial embodied carbon transfer are sourced from the regional input–output tables covering 42 sectors across 31 provinces for the years 2007, 2010, 2012, 2015, and 2017, also released by CEADS (with 2017 being the latest available year). To update the multi-regional input–output tables, the required data include provincial GDP by sector, value-added, imports, exports, rural household consumption, urban household consumption, government consumption, fixed asset investment, and inventory changes. These data are collected from the China Statistical Yearbook, the China Industrial Economic Statistical Yearbook, and the statistical yearbooks of each province. Considering data availability and the issuance of the Announcement on the Administration of VAT Refund for the Advanced Manufacturing Industry by the State Taxation Administration in April 2021, the input–output data were adjusted to reflect 11 western provinces (Inner Mongolia, Guangxi, Chongqing, Sichuan, Guizhou, Yunnan, Shaanxi, Gansu, Qinghai, Ningxia, and Xinjiang) and 7 advanced manufacturing sectors: S1-Chemical Fibre Manufacturing, S2-Non-metallic Mineral Products, S3-General and Special Equipment Manufacturing, S4-Aerospace and Other Transportation Equipment, S5-Electrical Machinery and Equipment, S6-Computers, Communication, and Other Electronic Equipment, S7-Instrumentation Manufacturing.

3.2. Analysis of the Current Situation of Carbon Footprint and Embodied Carbon Transfer of Advanced Manufacturing Industry in Western China

3.2.1. Analysis of the Current Situation of Carbon Footprint

Based on provincial and sectoral direct carbon emission data of the advanced manufacturing industry in Western China, the single-region input–output (IO) model was applied to estimate the carbon footprint at the provincial and sectoral levels from 2007 to 2017 (see Figure 3).
At the provincial level, the carbon footprint of the advanced manufacturing industry in Western China showed a continuous upward trend from 2007 to 2017, increasing from approximately 64.38 million tons to 95.48 million tons, representing a growth rate of 48.3%. Sichuan, with a relatively strong industrial foundation, consistently ranked first in carbon footprint; although it peaked in 2008 and then declined, it remained at a high level. Chongqing experienced a rapid increase in carbon footprint, growing more than sixfold over the decade, reflecting the aggressive expansion of heavy and chemical industries, making it a major contributor to the region’s carbon emissions. Inner Mongolia exhibited large fluctuations in carbon footprint, mainly due to its high proportion of energy-intensive industries. Guizhou and Yunnan saw significant increases in carbon emissions after 2013, indicating a rise in energy consumption driven by the relocation of industries from eastern China. In Shaanxi, carbon emissions steadily increased due to the combined effects of high-end equipment manufacturing and energy-intensive sectors. Although Qinghai, Ningxia, and Gansu had relatively low carbon footprints, all showed noticeable growth; in particular, Qinghai saw a sharp rise in carbon emissions after 2015, likely due to the concentrated launch of energy-intensive projects. Xinjiang’s carbon footprint began to decline after 2014, reflecting the initial effectiveness of energy conservation and emission reduction policies. Overall, the disparities in carbon footprint across provinces reflect differences in industrial structure, energy structure, and policy enforcement capacity (Figure 3a).
From the perspective of sectoral carbon footprints, the non-metallic mineral products industry and the general and special equipment manufacturing industry have consistently been the major carbon emitters. In particular, the non-metallic mineral products industry reached its peak in 2015 with approximately 87.08 million tons, accounting for a significant proportion of total emissions. This is primarily due to its high energy intensity and concentration in traditional building material provinces such as Sichuan and Inner Mongolia. The general equipment manufacturing industry showed considerable fluctuations but maintained high emissions in most years, indicating a continuous expansion trend. The electrical machinery manufacturing industry peaked in 2013 at around 16.58 million tons and then declined, possibly reflecting industrial upgrading and technological transformation. The computer and communication equipment manufacturing industry experienced a sharp increase in carbon emissions in 2008, followed by a gradual decline, suggesting that high-tech industries possess advantages in controlling carbon intensity. The aerospace and other transport equipment manufacturing sector exhibited notable volatility, with temporary increases in 2010 and 2011 before stabilizing. The chemical fibre manufacturing industry recorded an abnormal peak in 2012, likely due to the concentrated operation of energy-intensive projects in specific regions. Although the instrumentation manufacturing sector had a relatively low overall carbon footprint, it experienced a sharp rise in 2013, potentially related to capacity expansion that year. Overall, the differences in sectoral carbon footprints reflect disparities in energy efficiency, technological level, and the roles these sectors play in regional economies (Figure 3b).

3.2.2. Correlation Analysis of Factors Influencing the Carbon Footprint

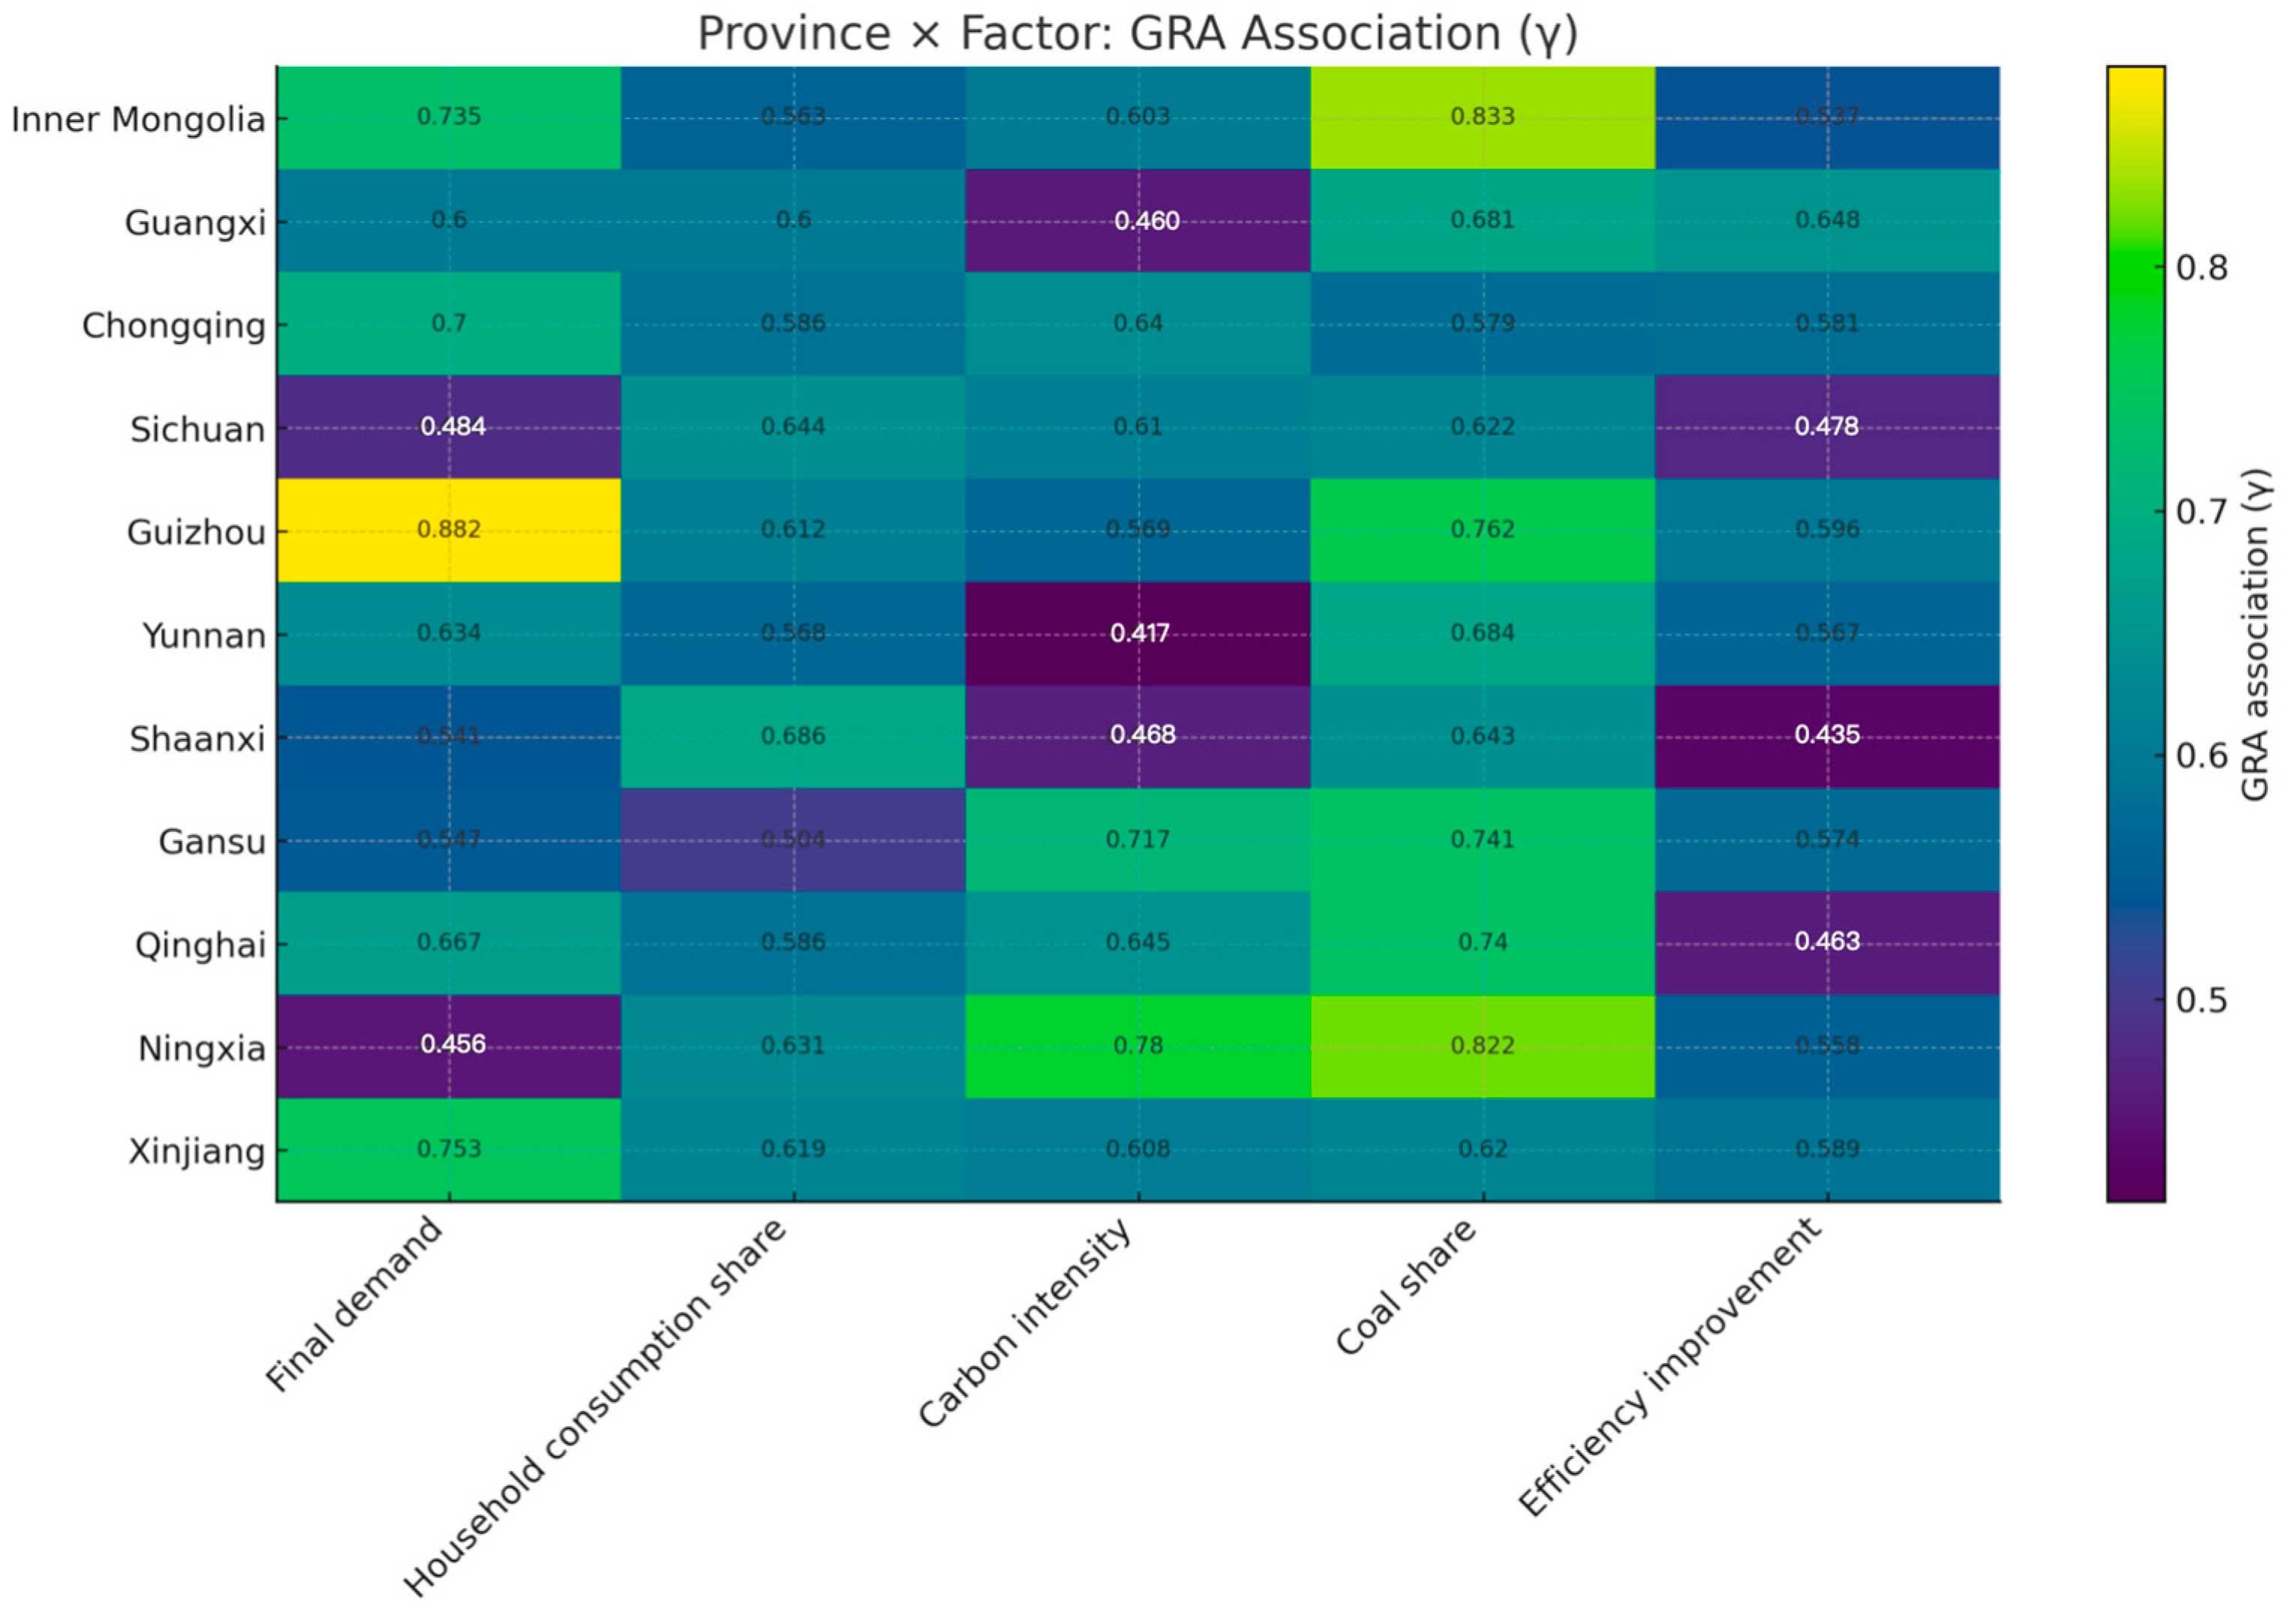
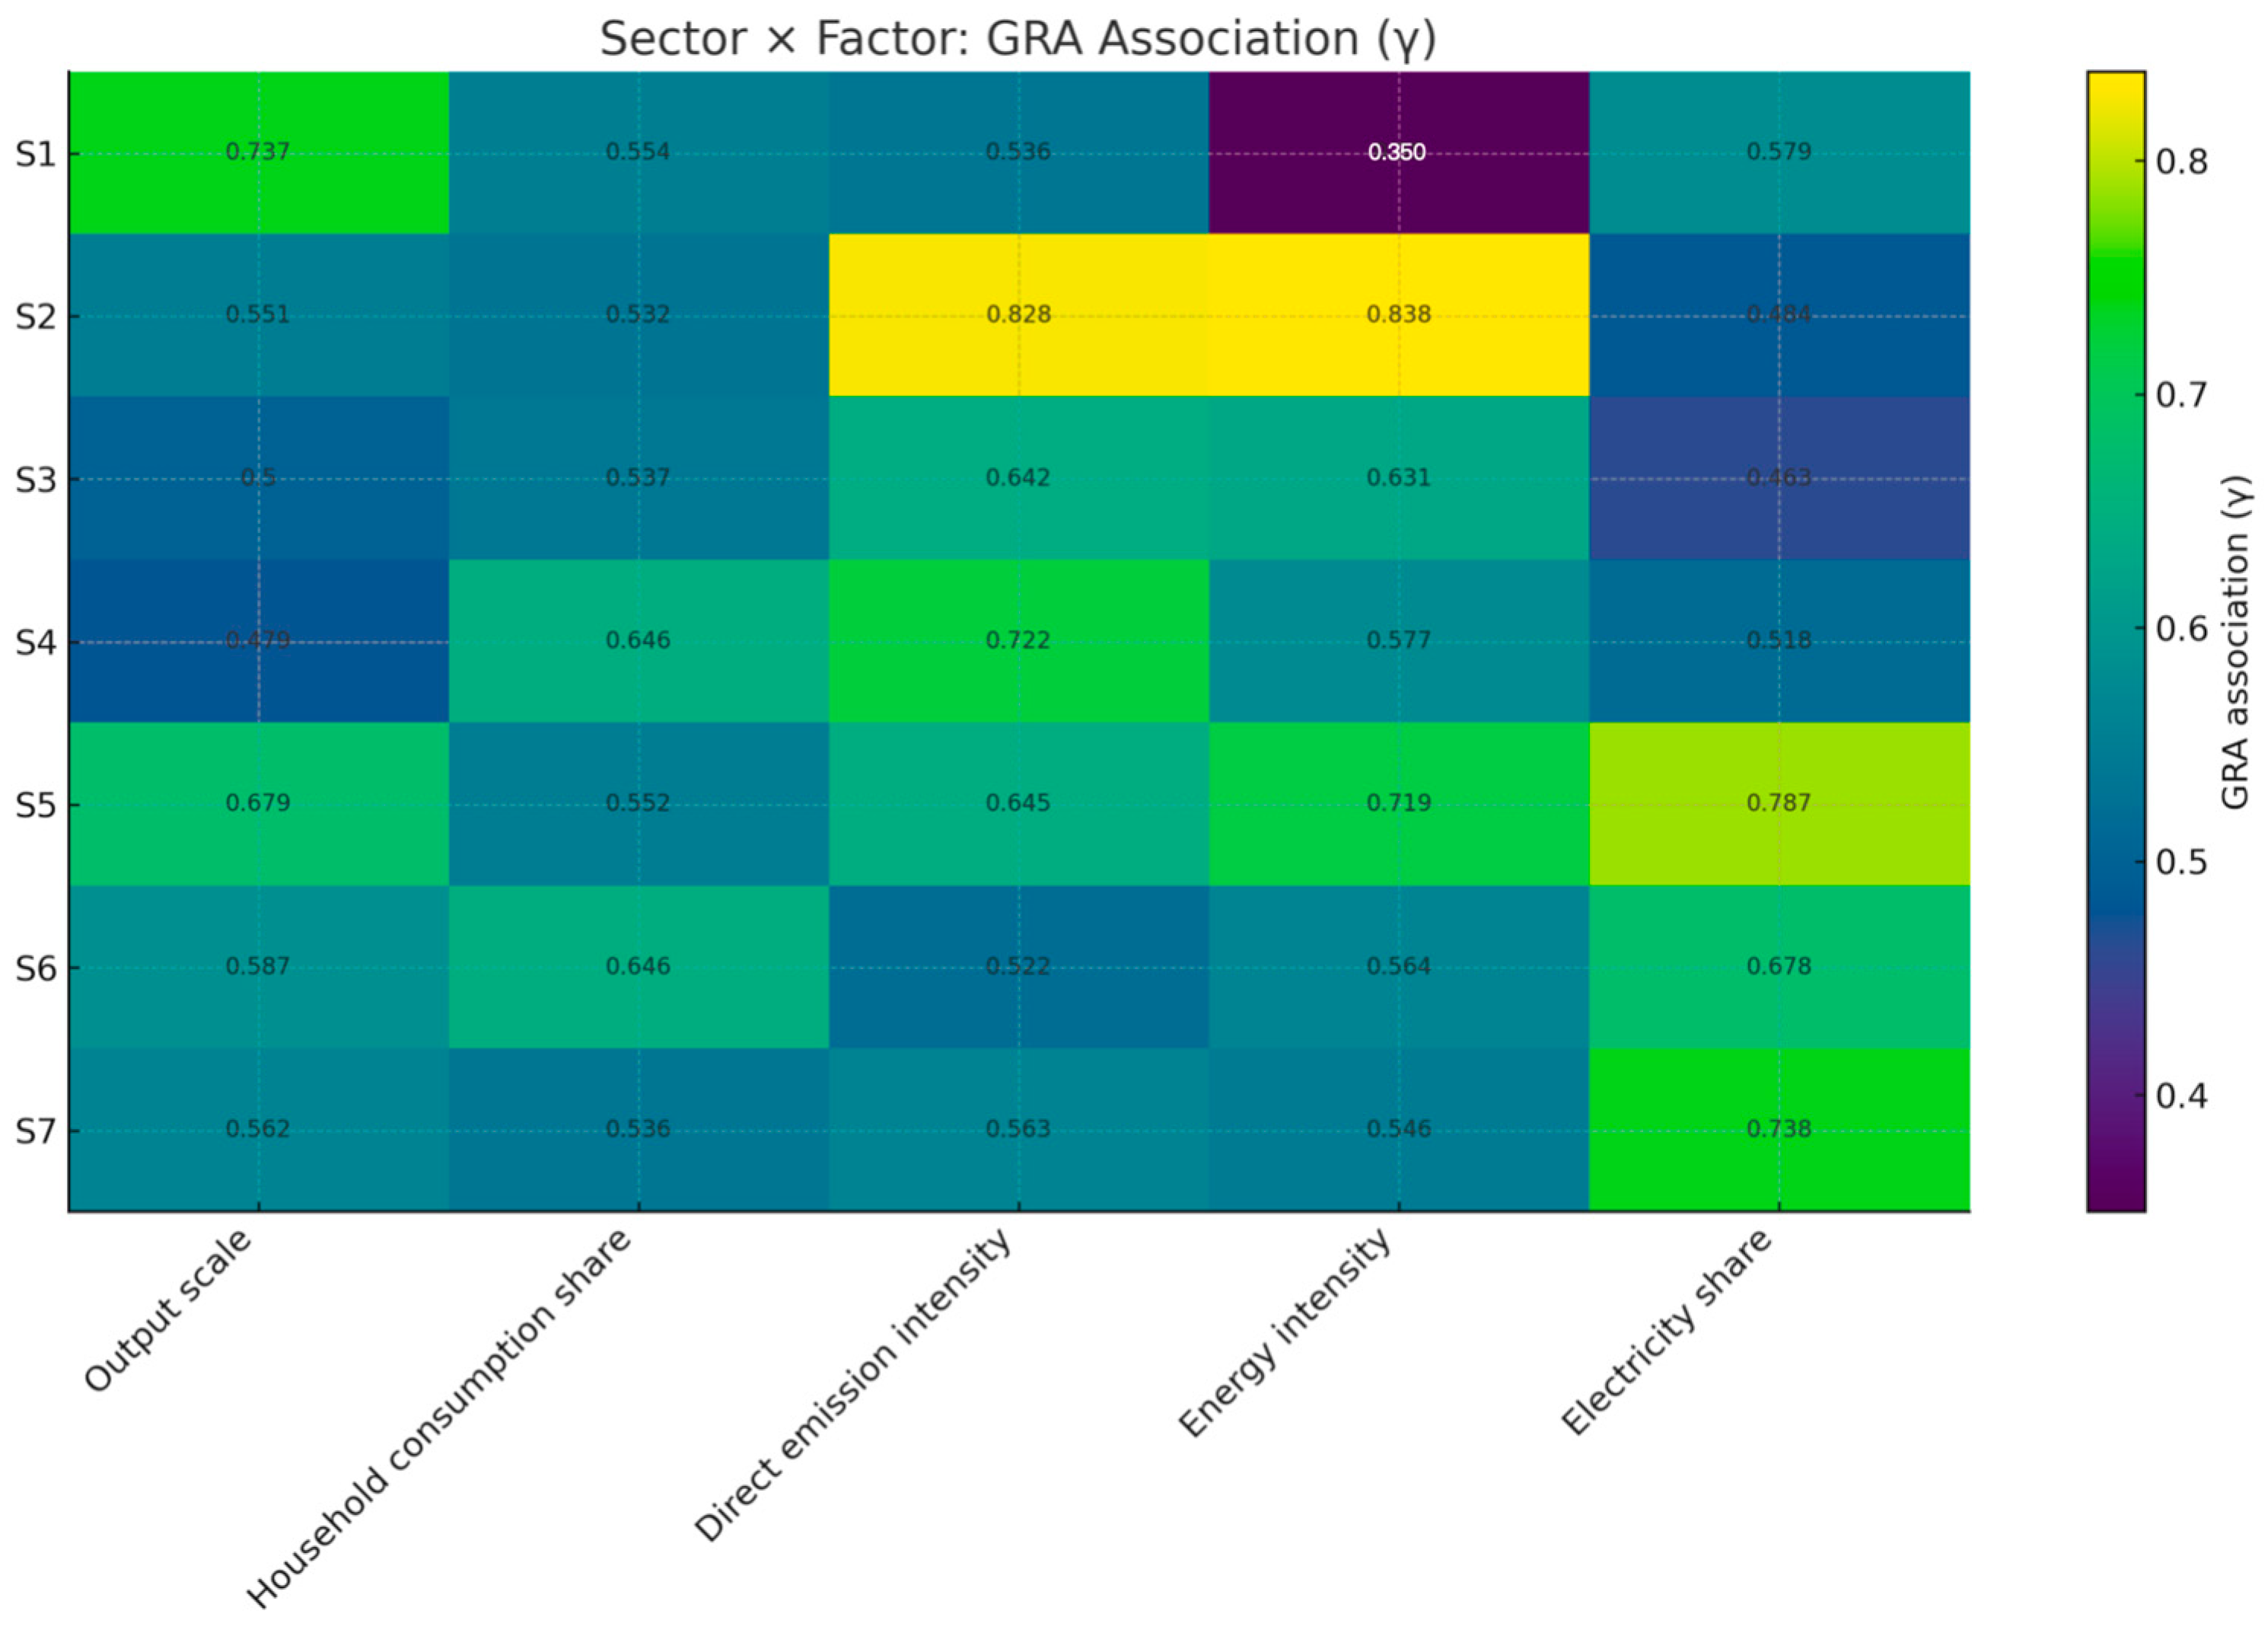
Using Grey Relational Analysis (GRA), we assess the structured determinants of the current carbon footprint of the advanced manufacturing sector in Western China at both the provincial and sectoral levels; the results are presented in Table 5 and Table 6 and Figure 4 and Figure 5.
Based on the provincial-level, five-dimension GRA, the ordering of determinants is (Table 5 and Figure 4): energy structure dominates cross-province differences in carbon footprints (Coal share, mean γ = 0.677), followed by economic scale (Final demand, γ = 0.616), environmental intensity (Carbon intensity, γ = 0.600), social structure (Household consumption share, γ = 0.598), and technological progress (Efficiency improvement, inverse, γ = 0.594). This ranking accords with a Leontief decomposition logic: energy and technology first shape the direct emission factor per unit output, while economic and social dimensions amplify and propagate emissions through Final demand and composition along the production network. Province-specific evidence is consistent with this chain—Inner Mongolia and Ningxia exhibit an “energy/intensity-led” pattern (Coal share γ = 0.887/0.869, respectively, with Carbon intensity second), whereas Chongqing and Sichuan show a “demand/scale-led” pattern (Final demand γ = 0.864/0.733, respectively). Technological improvement (inverse) exerts a suppressing effect on the footprint but has not yet emerged as the primary driver in most provinces. Coupled with interprovincial net embodied carbon flows, these results explain cases of “low direct energy use but high consumption-based emissions,” whereby local demand embeds upstream carbon-intensive stages via traded intermediates. Overall, energy structure/technology determines “how much is emitted per unit of output,” while economic/social demand determines “how much output is required,” and the two are coupled through industrial structure to form a composite causal chain for provincial carbon footprints. The ordering is robust to the resolution coefficient ρ ∈ [0.3, 0.7] and to alternative (time-increasing/entropy) weighting schemes.
At the industry level (Table 6 and Figure 5), GRA shows that Energy intensity has the strongest explanatory power for sectoral carbon footprints (mean γ = 0.642), followed by technology/electrification (Electricity share, inverse, γ = 0.632), Direct emission intensity (γ = 0.629), Output scale (γ = 0.617), and Household consumption share (γ = 0.578). This ordering aligns with a “process-emissions + indirect-emissions” mechanism: energy and technology primarily shape the direct emission factor, whereas economic and social dimensions drive output via demand and thereby embed upstream material- and energy-related emissions in final products. Sectoral heterogeneity further clarifies the transmission channels: S2 (non-metallic mineral products) is jointly dominated by Energy intensity (γ = 0.868) and Direct emission intensity (γ = 0.847), acting as an upstream “emissions amplifier”; S3 (general/special equipment) depends heavily on upstream building materials and metals and exhibits a “scale–chain spillover” pattern (Output scale γ = 0.771 ranks first); by contrast, S5–S7 (medium/high-tech) feature high electrification and low process emissions, so as the power mix decarbonizes they show a pronounced inverse (mitigating) effect (e.g., S6 Electricity share γ = 0.802 ranks first). Accordingly, the sectoral causal framework can be summarized as: technology/energy determines unit emissions, economic/social factors determine output scale, and upstream structure governs the propagation strength of indirect emissions. These findings are robust to changes in the resolution coefficient and weighting schemes, implying that mitigation priorities should target the energy-intensive upstream (S2) and key midstream hubs (S3) while simultaneously advancing power-system decarbonization and process electrification to unlock technology’s suppressing effect.

3.2.3. Analysis of the Current Situation of Embodied Carbon Transfer

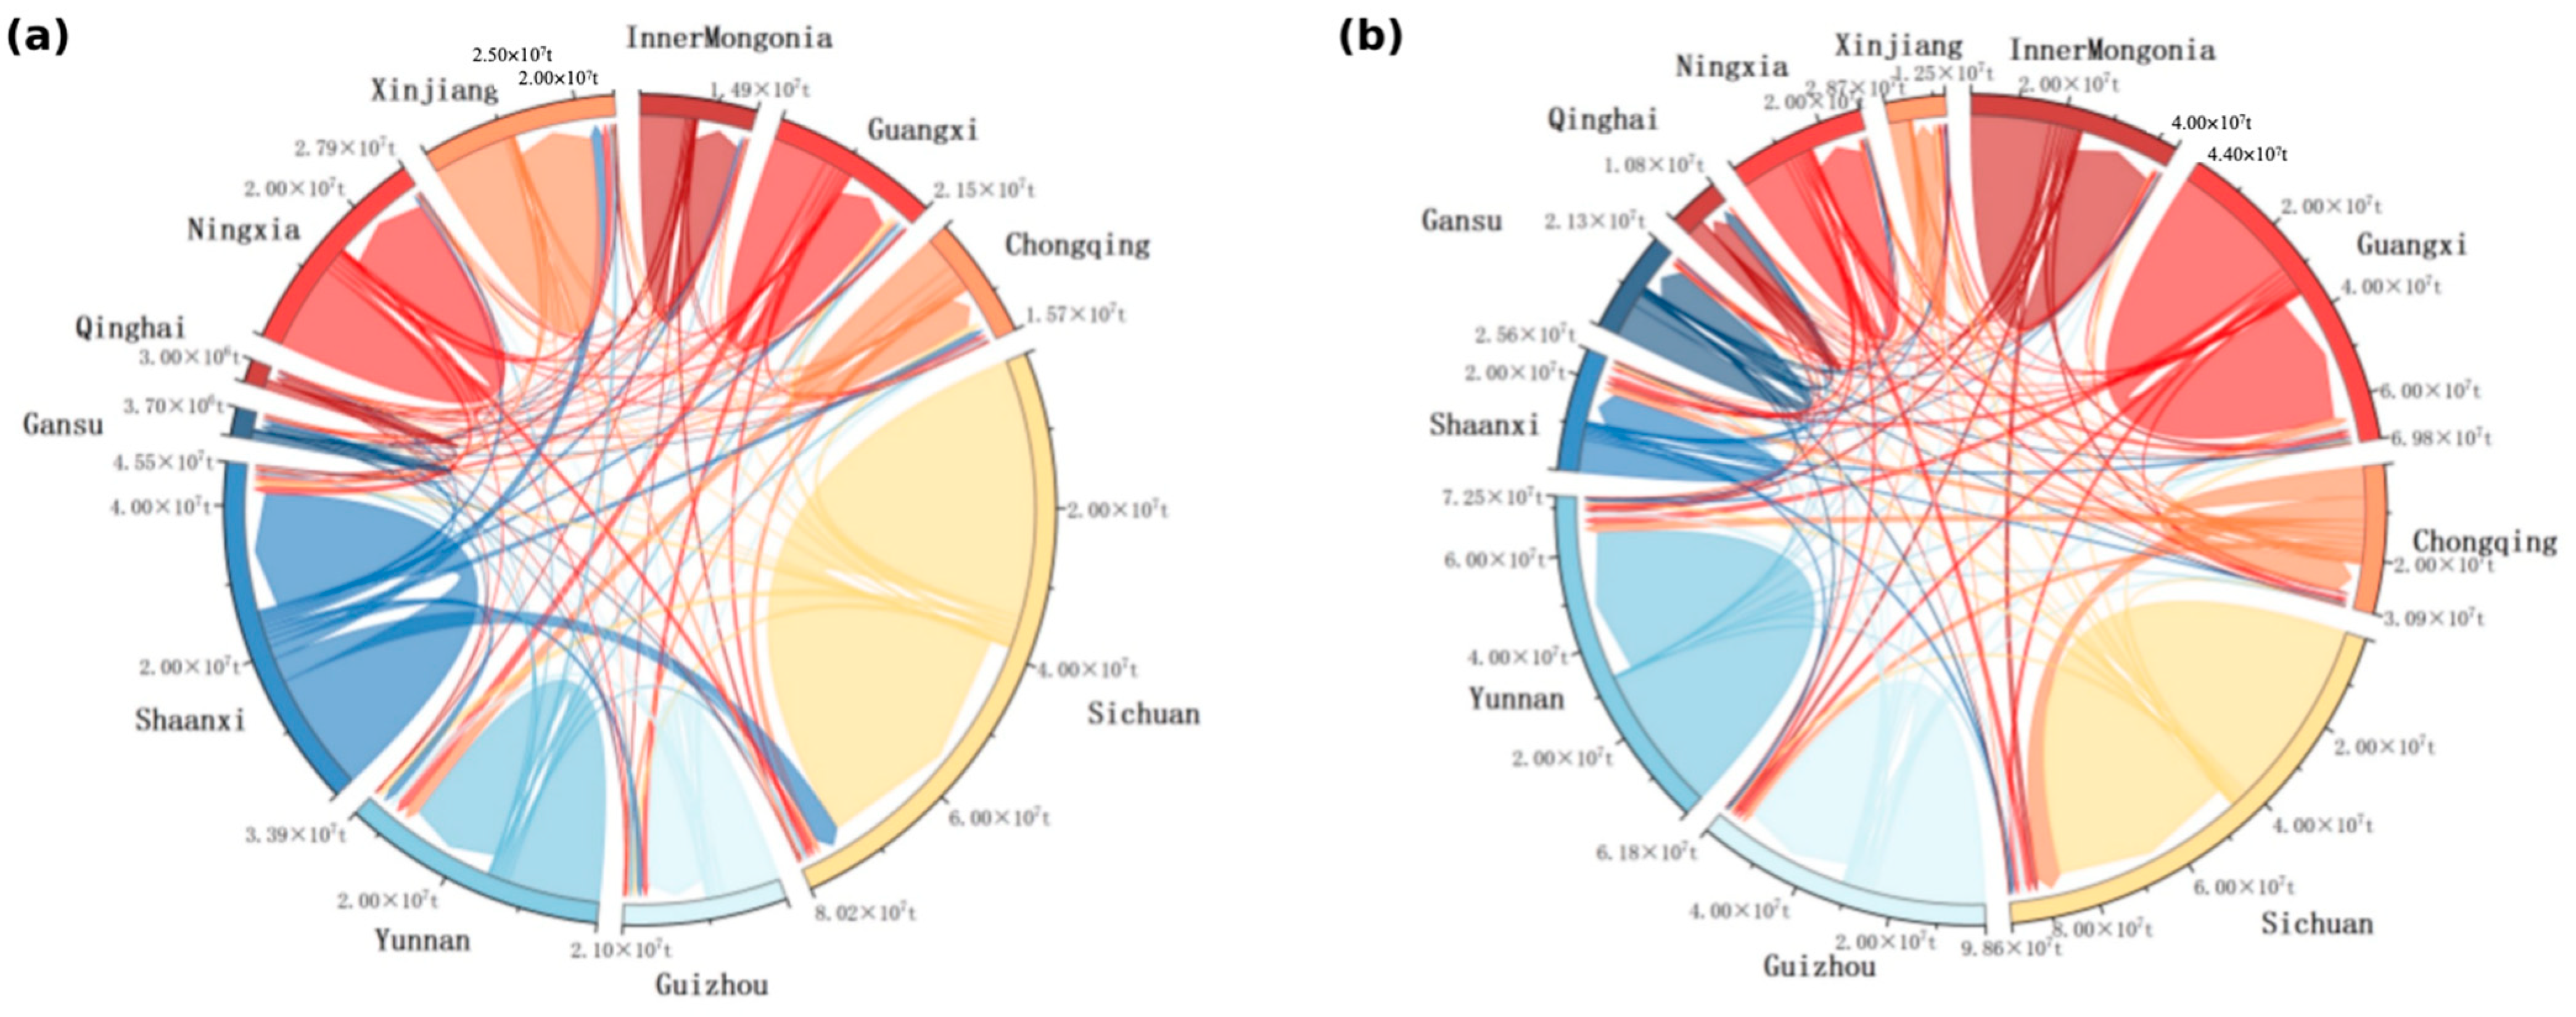
By combining provincial and sector-level direct carbon emission data of the advanced manufacturing industry in Western China with the multi-regional input–output (MRIO) model, this study estimates the interprovincial and intersectoral embodied carbon transfers within the region. Due to space limitations, only the embodied carbon transfer patterns among provinces and sectors for the years 2007 and 2017 are presented (see Figure 6 and Figure 7).
Compared to 2007, the interprovincial embodied carbon transfer in the advanced manufacturing sector of Western China experienced significant growth by 2017. The overall scale of carbon transfer expanded, and the structure became more centralized. Provinces such as Sichuan, Guizhou, Yunnan, and Chongqing showed enhanced internal carbon absorption capacities, with notably increased intra-regional transfers—indicating a more integrated regional industrial chain. At the same time, resource-oriented provinces like Inner Mongolia and Guangxi remained major carbon exporters, providing a stable “carbon supply” to neighbouring regions. Sichuan, in particular, gradually emerged as a “hub province” for embodied carbon flows, ranking among the top in both inflow and outflow volumes, highlighting its central role in the region’s advanced manufacturing system.
In terms of carbon flow channels, a high-frequency carbon transfer corridor has taken shape along the “Chengdu–Chongqing—Guizhou–Sichuan—Guangxi–Yunnan” route, reflecting intensified interprovincial cooperation. For example, the embodied carbon flows from Chongqing to Sichuan and from Guizhou to Sichuan increased severalfold, suggesting growing collaboration and resource-sharing among provinces. This evolving pattern has been driven by policies supporting industrial relocation, the expansion of manufacturing sectors, and improvements in energy and transportation infrastructure. Meanwhile, some earlier carbon flow paths—such as from Shaanxi to Chongqing—have weakened due to stricter environmental regulations and ongoing industrial upgrading, signalling a redistribution of regional carbon responsibility (Figure 6).
From 2007 to 2017, the total volume of embodied carbon transfers among sectors of the advanced manufacturing industry in Western China increased significantly, rising from approximately 199 million tons to 289 million tons—an increase of 45%. Among them, the non-metallic mineral products sector remained the core carbon-exporting sector, with a substantial rise in carbon transfers both within the sector itself and to other manufacturing sectors such as equipment manufacturing and electrical machinery, highlighting its increasingly energy-intensive nature. Meanwhile, the carbon outflows from the chemical fibre manufacturing sector grew by more than 160%, making it the fastest-growing sector and indicating its rising importance in the industrial chain. The general and special equipment manufacturing sectors gradually evolved into “carbon flow hubs,” playing a key role in transferring carbon to high-tech industries.
In contrast, carbon outflows from high-end manufacturing sectors—such as computer/communication and instrumentation industries—generally declined, reflecting initial success in energy conservation and green manufacturing efforts in downstream industries. Overall, carbon transfer pathways became more complex, and inter-sectoral dependencies intensified, forming a denser carbon flow network. This shift suggests that Western China’s advanced manufacturing industry is transitioning from a model of “linear carbon transfer” to one of “circular collaboration.” The trend toward green transformation has begun to take shape, highlighting the need to further promote technological upgrading in energy-intensive sectors and strengthen collaborative decarbonization across the industrial chain (Figure 7).

3.3. Analysis of the Forecasting Results of Carbon Footprint and Embodied Carbon Transfer of the Advanced Manufacturing Industry in Western China

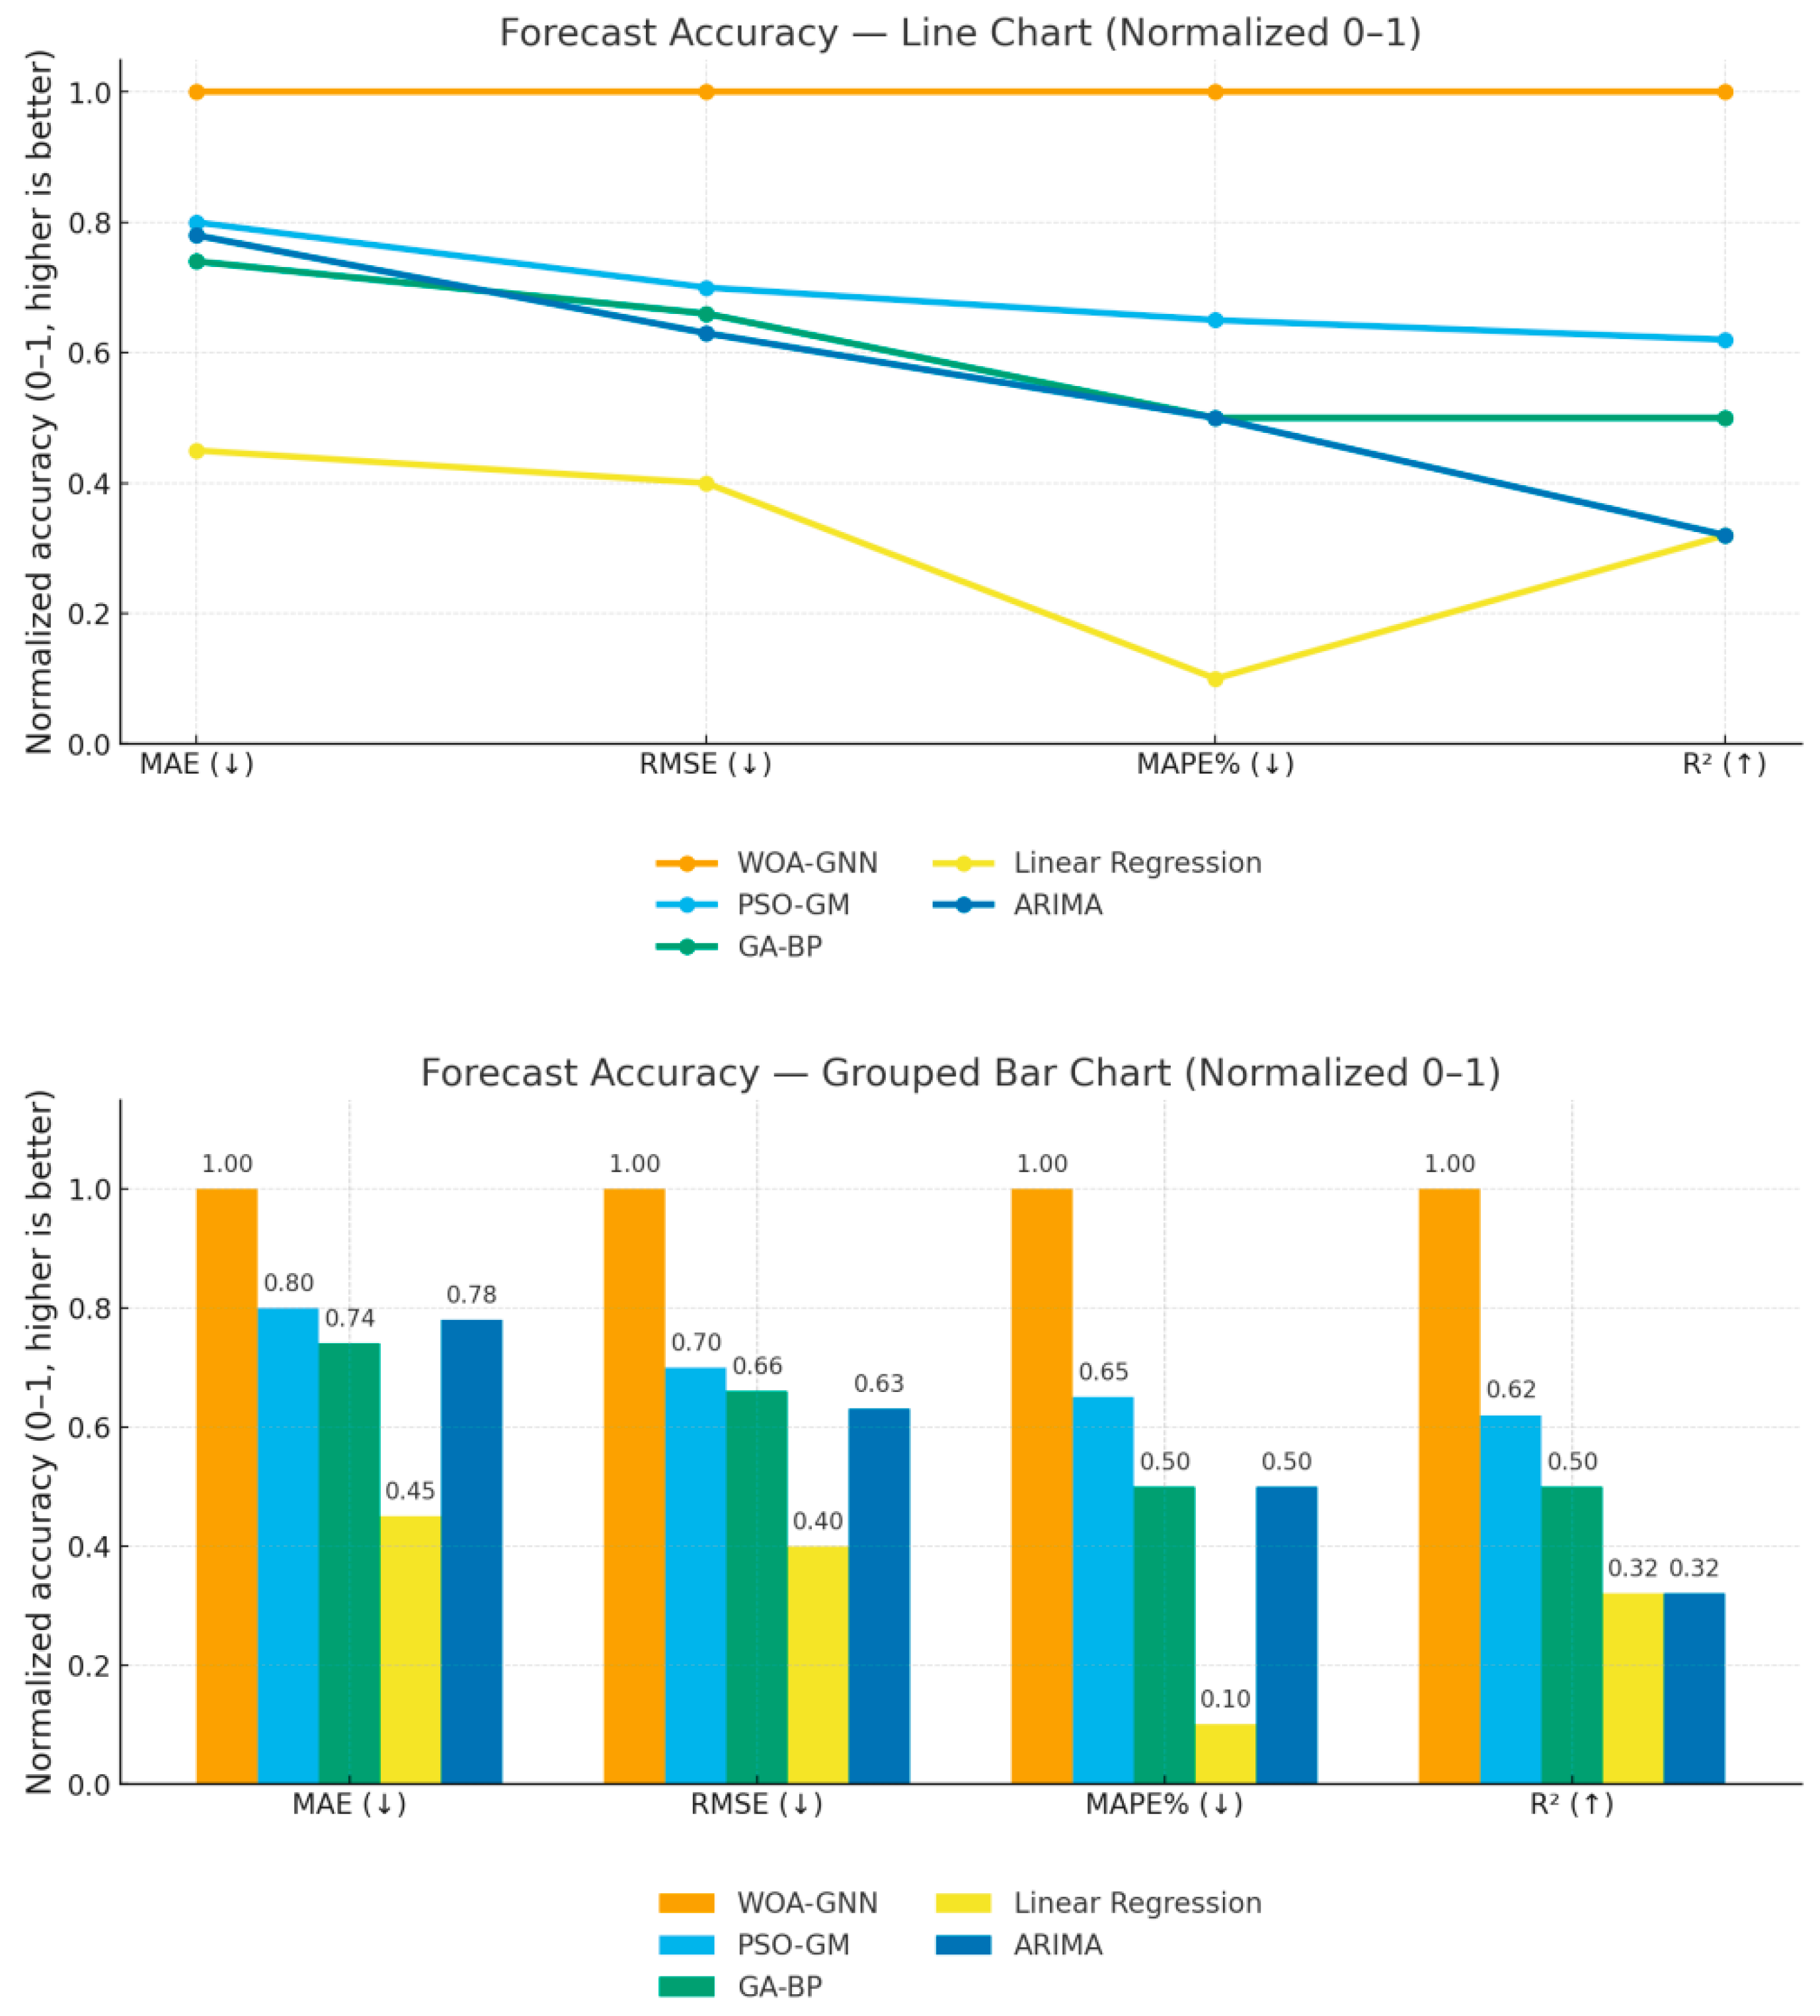
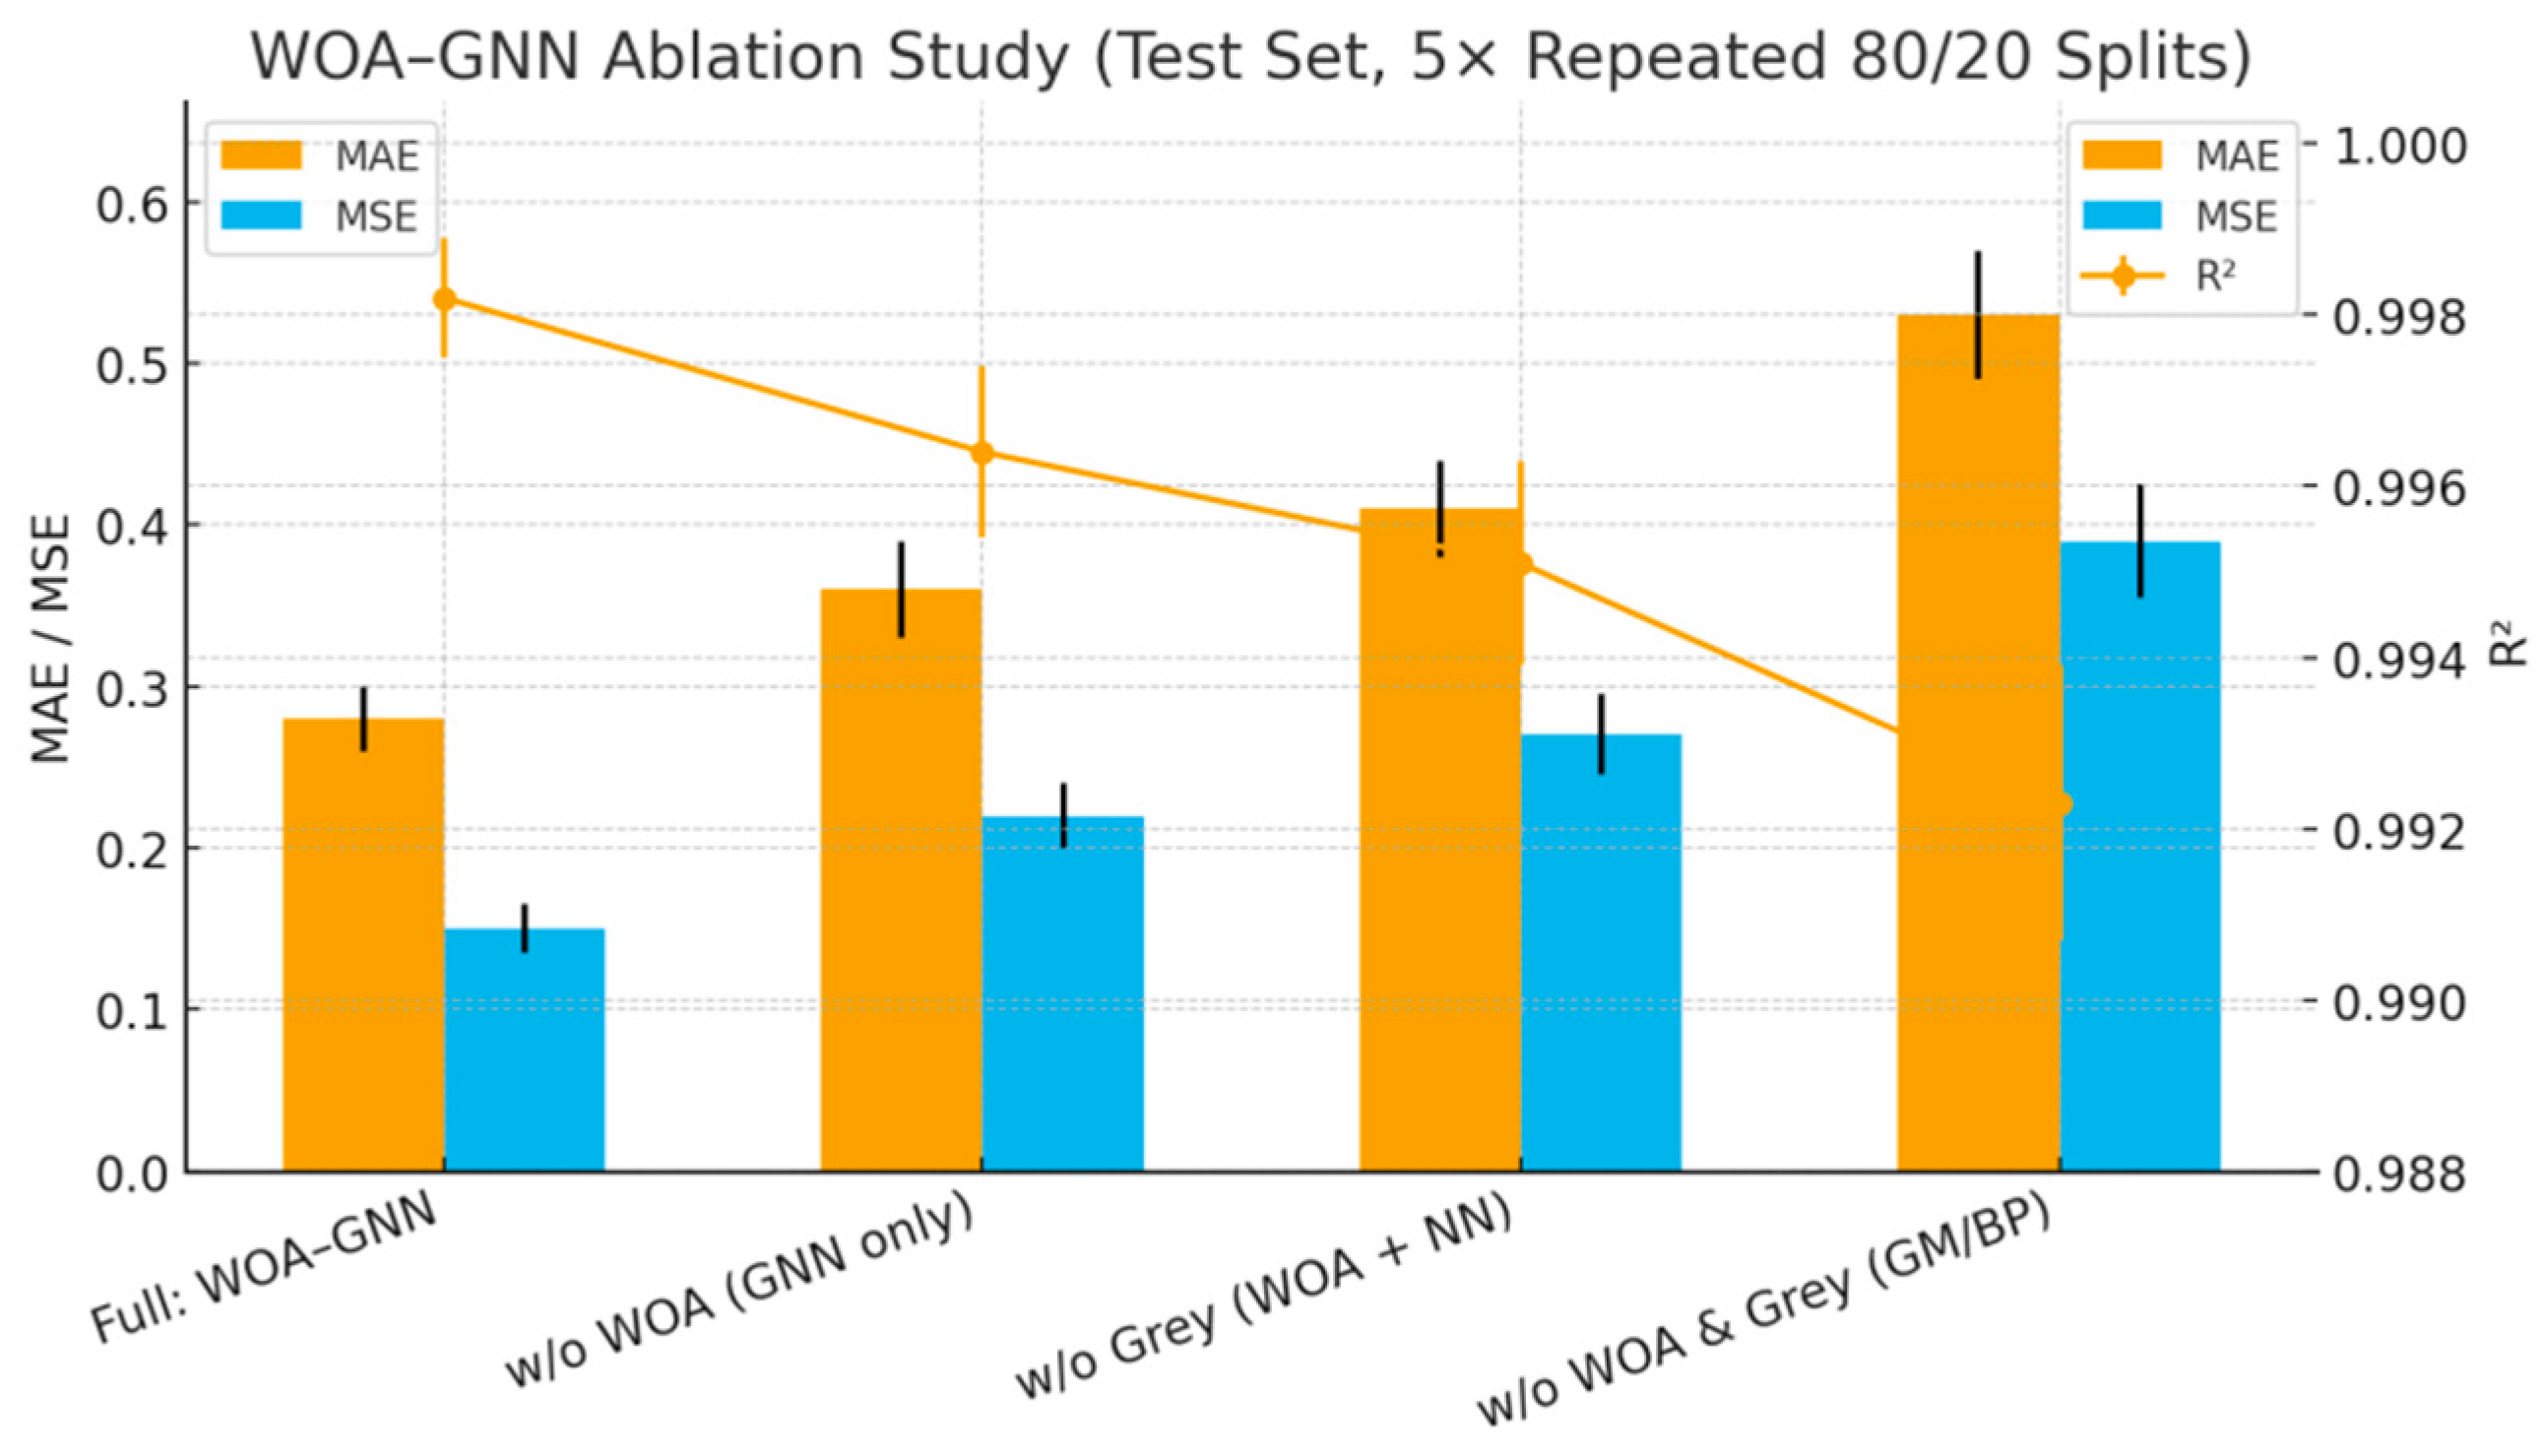
This study trains and evaluates all forecasting models on a panel of 847 province–year observations (advanced manufacturing across 11 western Chinese provinces, 2007–2017) using a nested design to curb optimism: an outer 80/20 train–test split repeated five times, with a 10-fold cross-validation loop inside each training set for hyperparameter tuning; all preprocessing (e.g., feature scaling) is fit only within training folds. After tuning, models are refit on the full training set and assessed once on the untouched test set; the reported MAE, MSE, and R2 are strictly out-of-sample and averaged across the five repeats (means ± s.d. where noted). Under identical splits, preprocessing, and tuning budgets, the proposed WOA–GNN consistently achieves the lowest mean MAE/MSE and the highest mean R2, yielding the best average rank across repeats, whereas Linear Regression and ARIMA struggle with non-linear, cross-province heterogeneity and PSO–GM/GA–BP, while stronger than single baselines, still trail WOA–GNN (Figure 8). An ablation study (Figure 9) further shows that removing Whale Optimization (plain GNN), removing the grey mechanism (WOA-tuned standard NN), or removing both degrades accuracy—raising MAE/MSE and lowering R2—demonstrating that the meta-heuristic search and grey prior embedding provide complementary gains that better capture weak signals and regime shifts in provincial manufacturing dynamics.
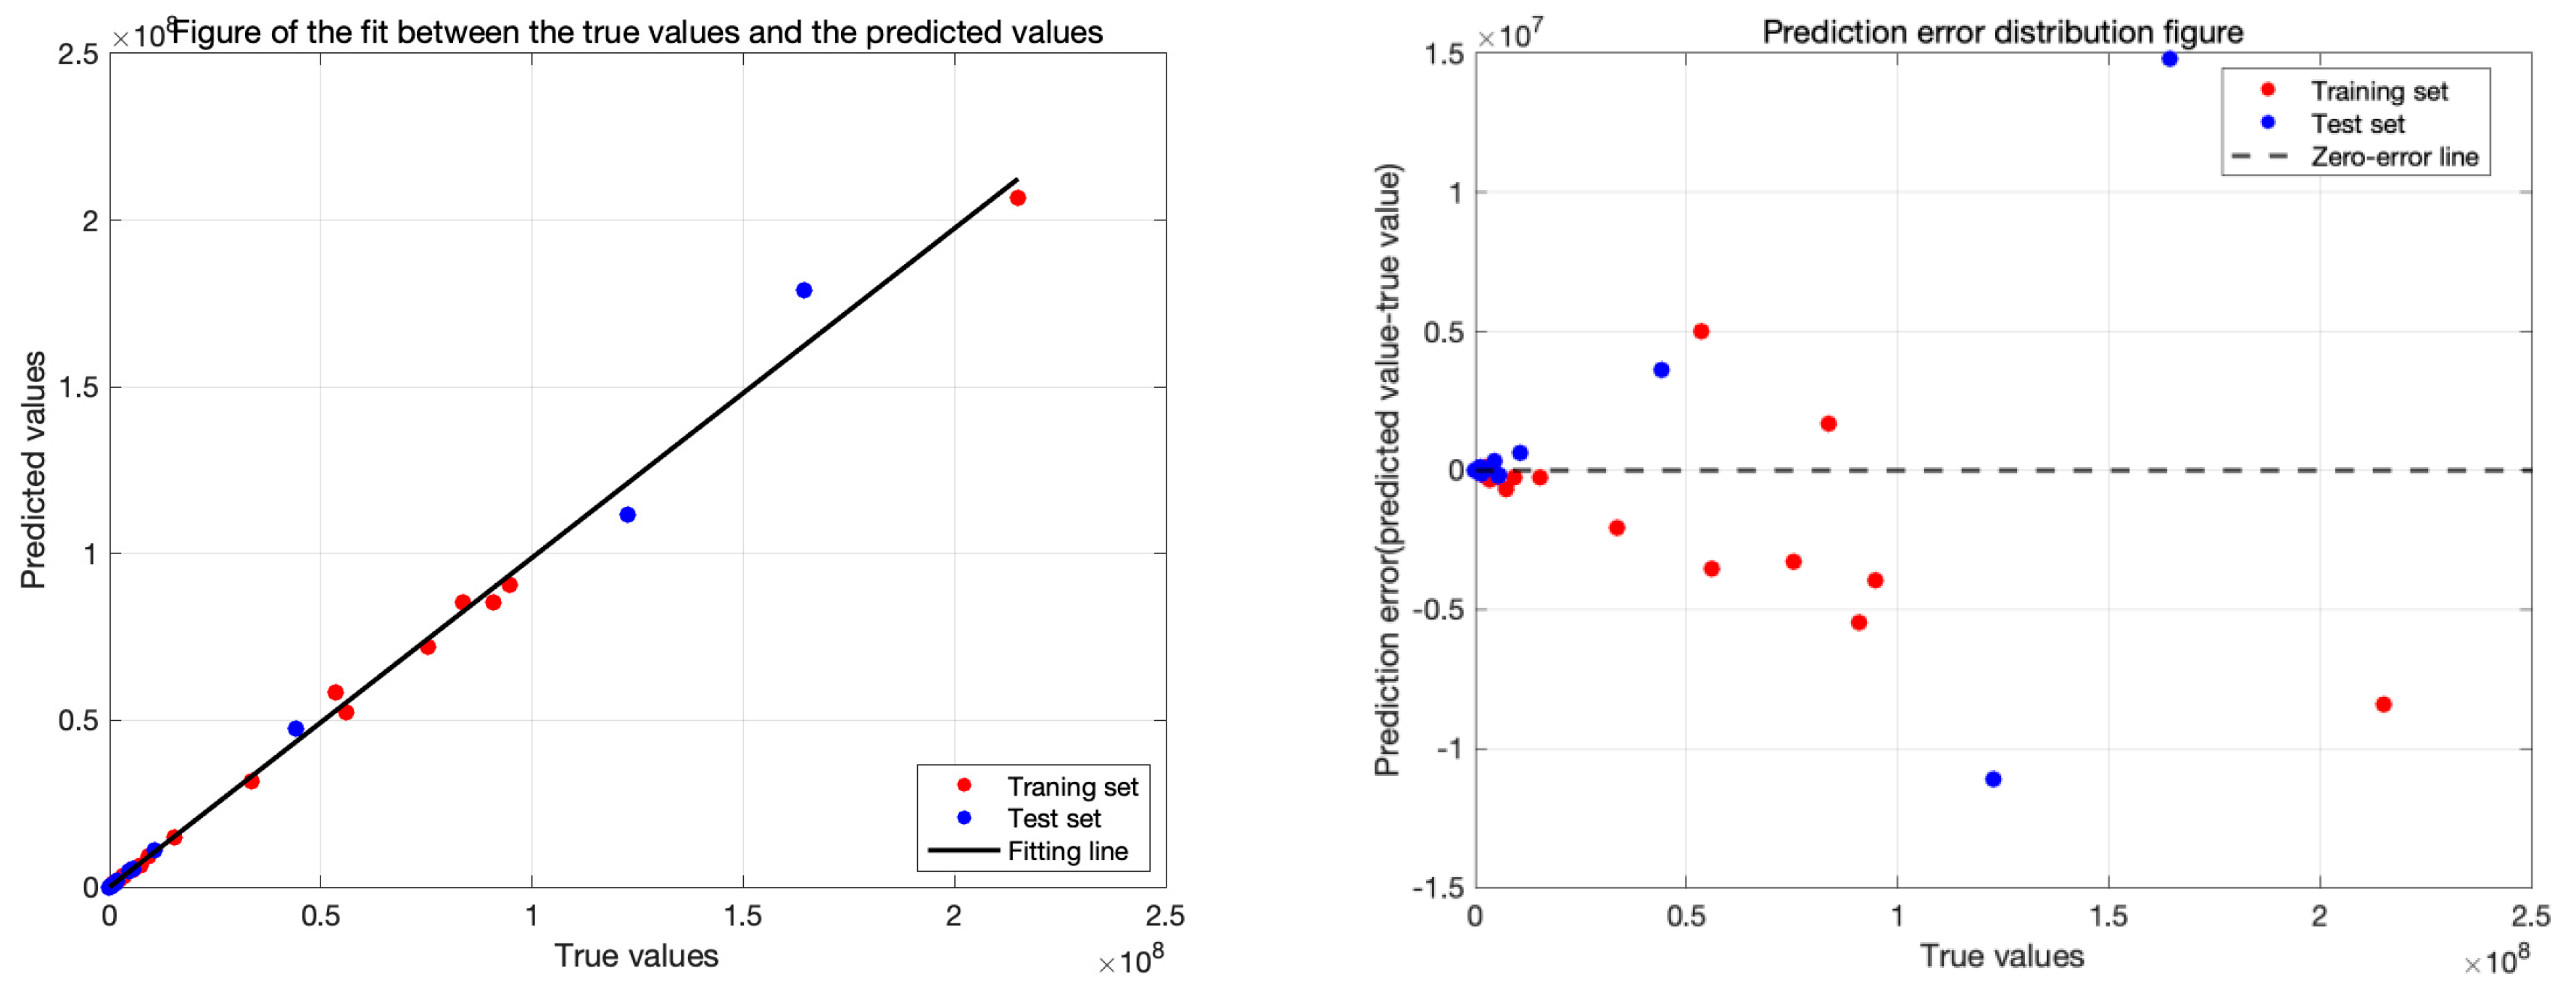
Based on Figure 8 and Figure 9, the WOA–GNN delivers the best performance among the five models: on the normalized 0–1 scale, it attains the maximum score (1.0) for all criteria—MAE, RMSE, MAPE%, and R2—clearly outperforming PSO-GM (~0.75–0.80) and GA-BP (~0.65–0.70), with Linear Regression and ARIMA both <0.5. This indicates WOA–GNN achieves the lowest errors and highest goodness-of-fit, making it the most reliable forecaster in our setting. Therefore, the WOA–GNN model was selected as the optimal forecasting model, and its forecasting performance is presented accordingly (Figure 10).

3.3.1. Analysis of the Forecasting Results of Carbon Footprint

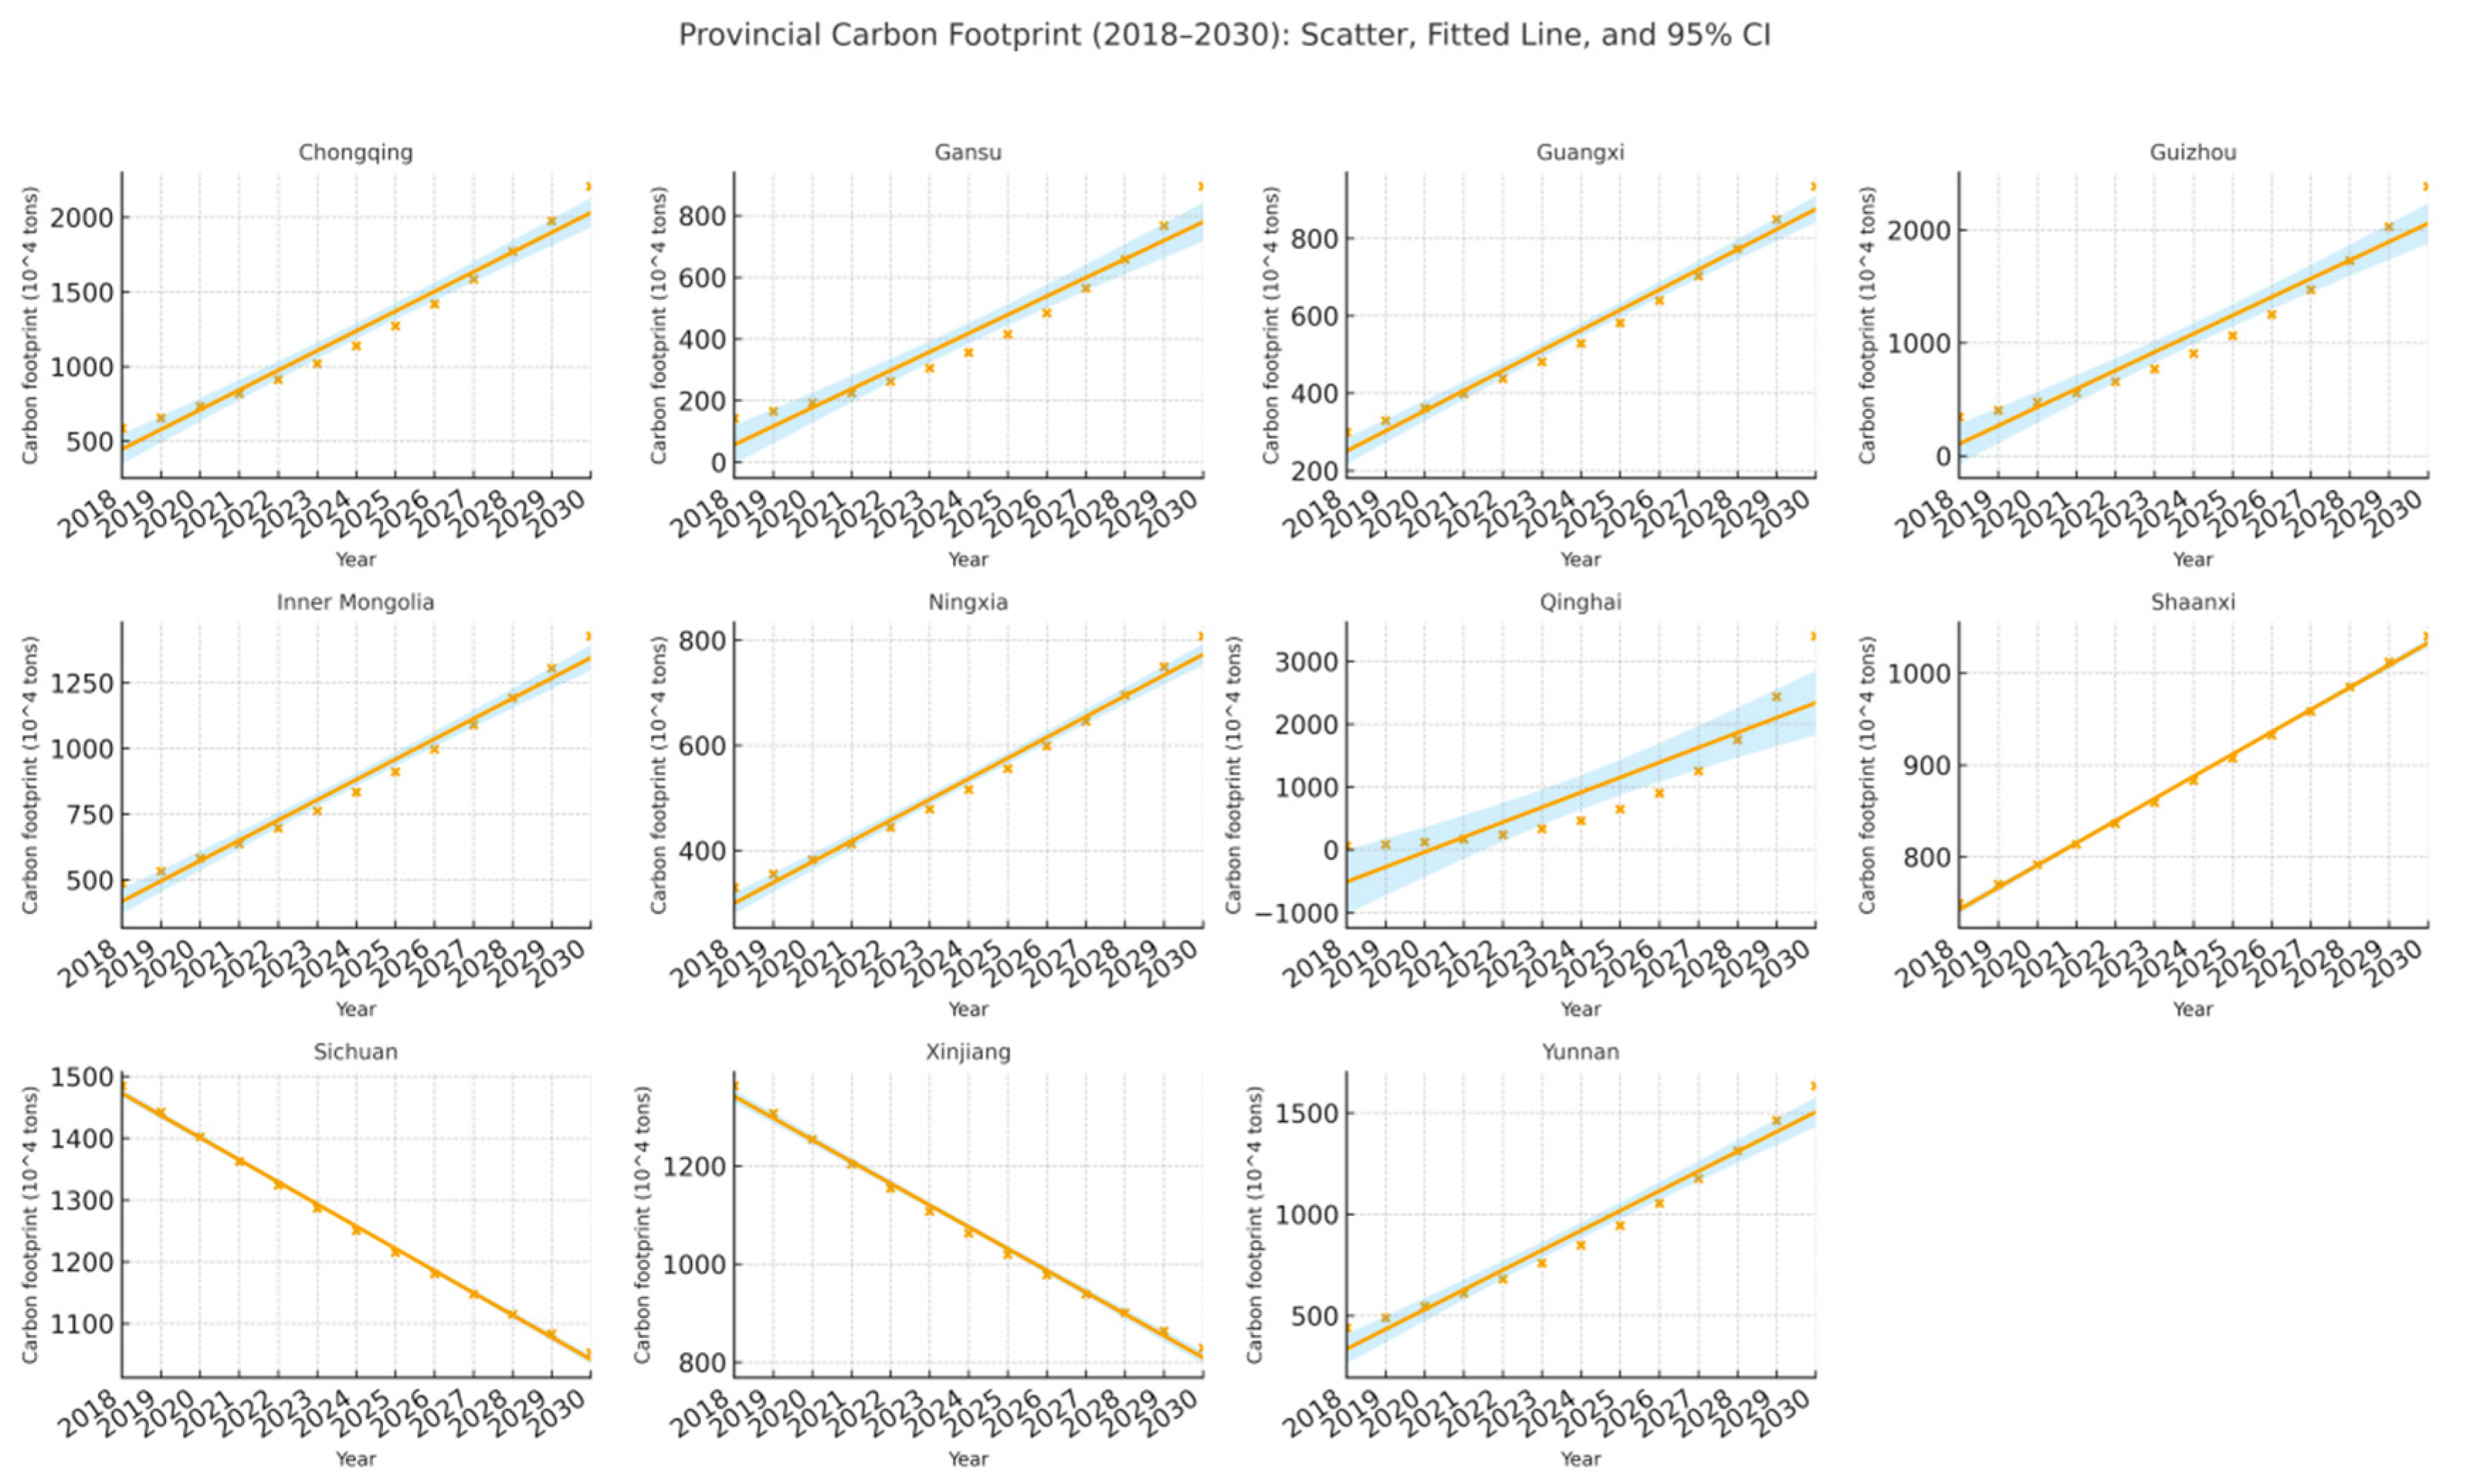
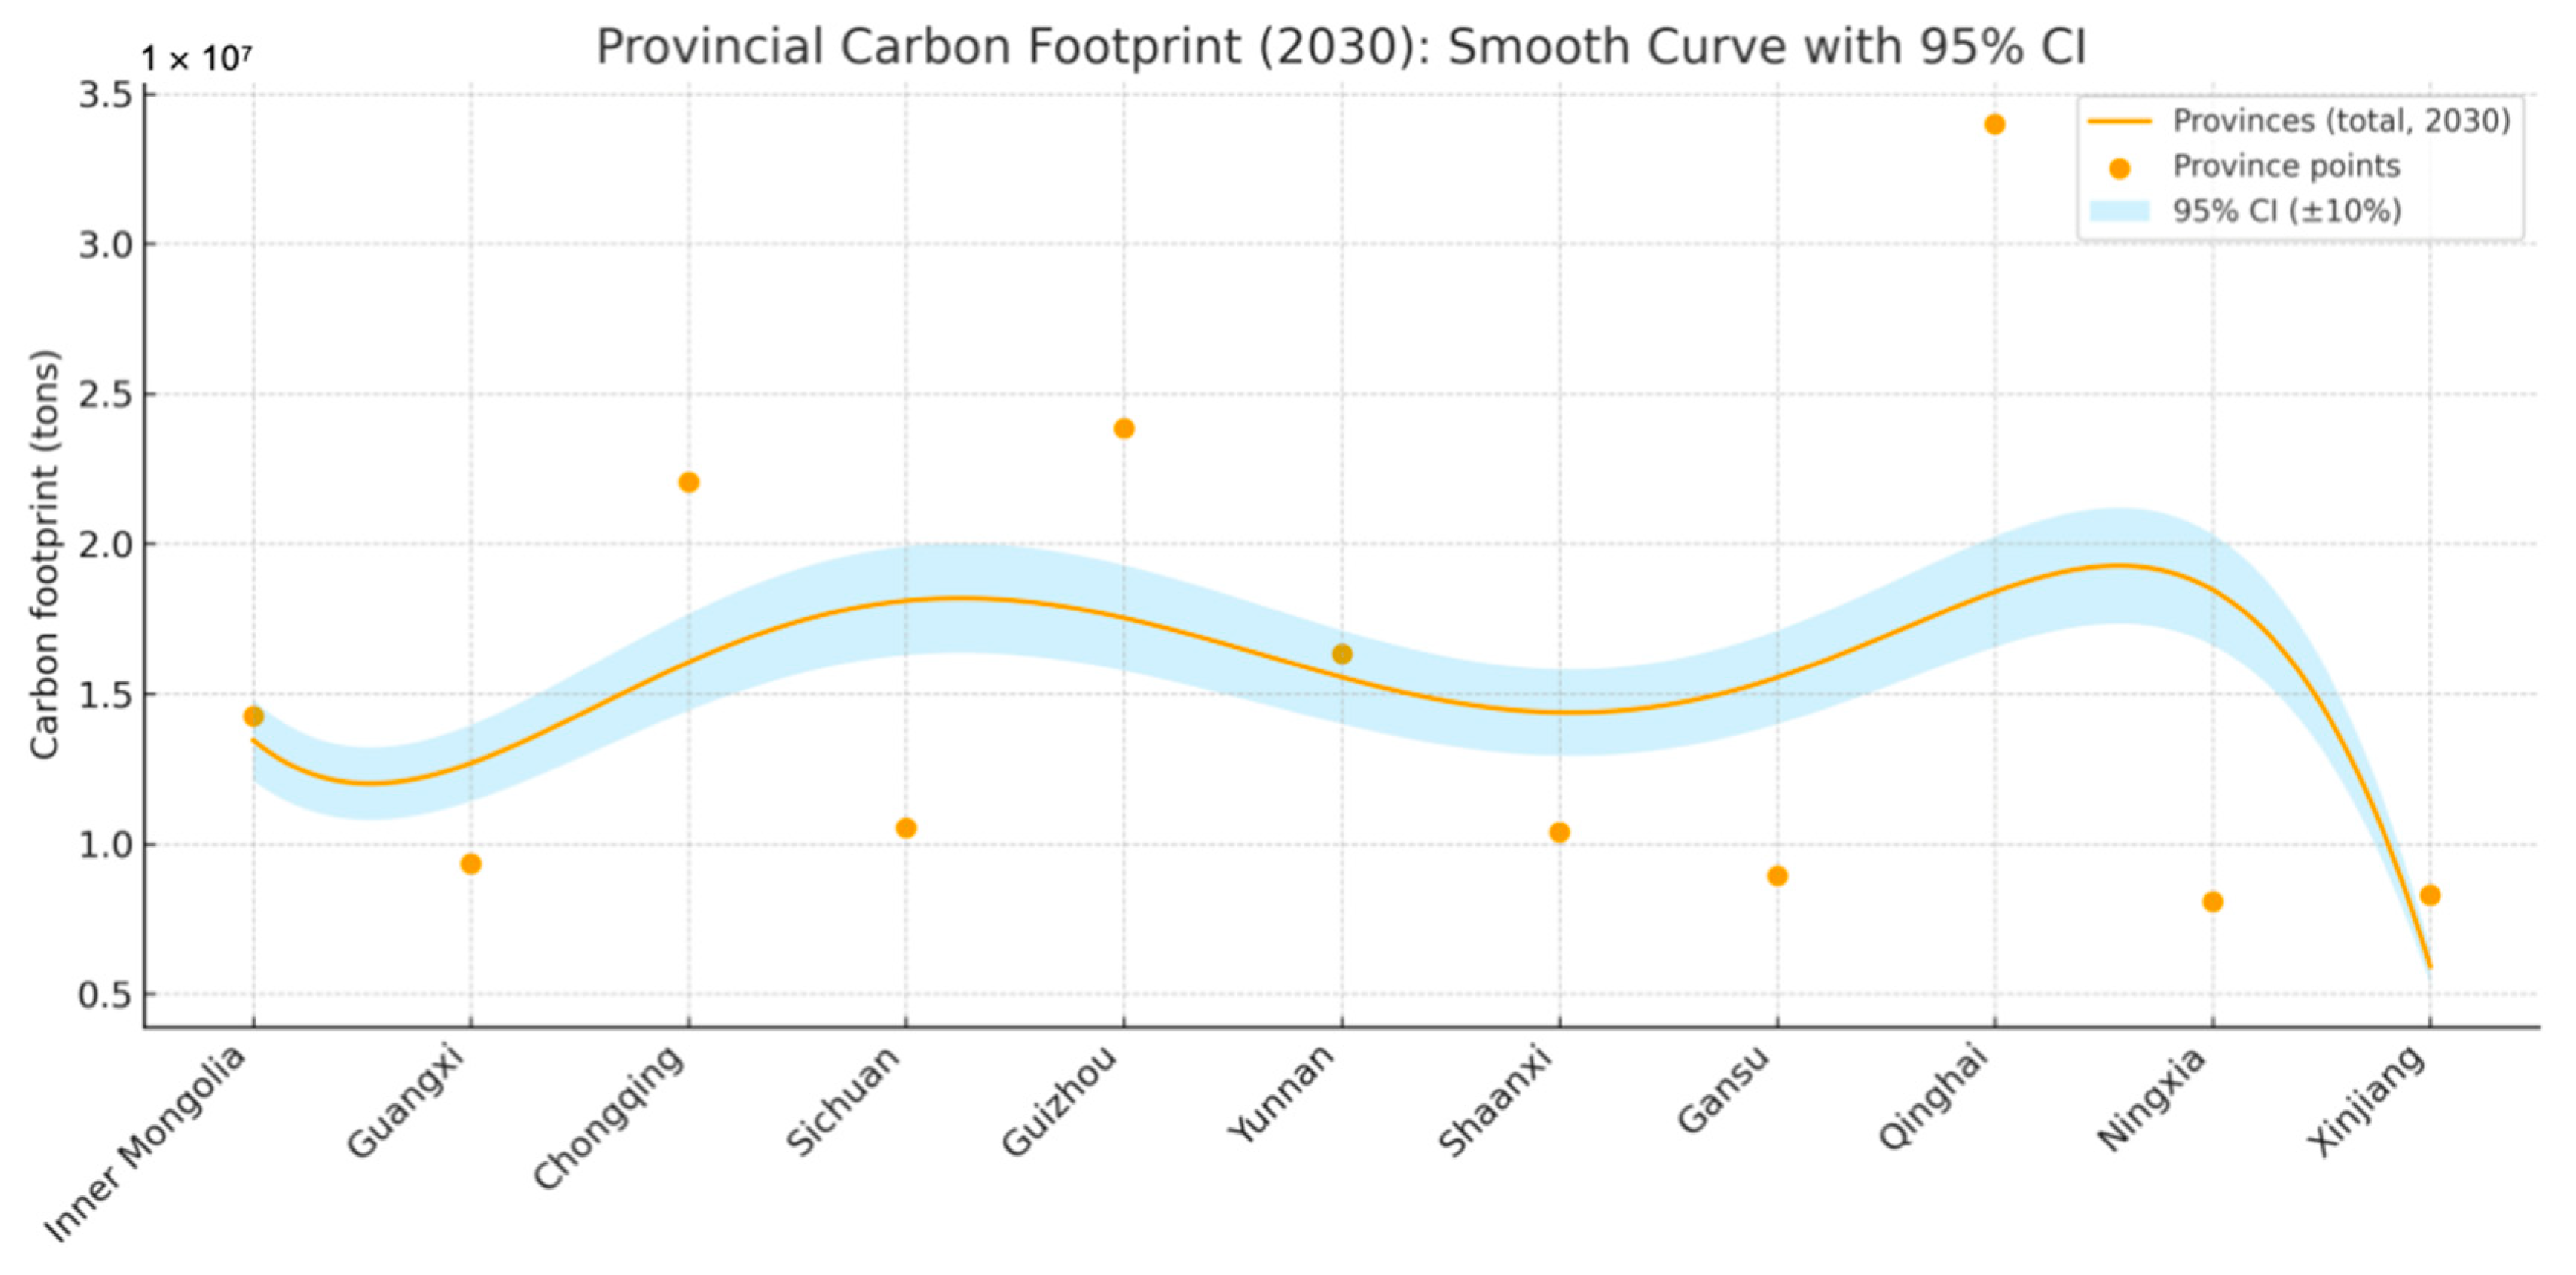
To clarify multi-year evolution patterns at both spatial and industrial scales, Figure 11 and Figure 12 plot 2018–2030 carbon footprints for advanced manufacturing in Western China as scatter points with a least-squares fitted line and 95% confidence bands (unit: 104 tons)—Figure 11 at the provincial level (11 provinces) and Figure 12 at the sectoral level (S1–S7). The fitted line captures the direction and pace of change, while the confidence envelope quantifies statistical uncertainty around each mean trajectory. By displaying continuous multi-year trend modes, these panels offer a clearer, more comprehensive view of how provincial and sectoral footprints are expected to evolve over time, thereby strengthening the interpretation of temporal dynamics and cross-sectional heterogeneity.
Figure 11 and Figure 12 reveal a clear two-tier pattern. At the provincial level, Qinghai, Guizhou, and Chongqing (with Yunnan/Inner Mongolia following) show steeper upward slopes and wider bands, while Sichuan, Shaanxi, Gansu, Ningxia, Xinjiang, and Guangxi display flatter, tighter trajectories. This divergence aligns with our GRA findings: energy factors (intensity and electricity/coal mix) and output scale propel growth, whereas technology factors (process efficiency, equipment vintages) dampen it. At the sectoral level, energy- and materials-intensive chains exhibit higher levels, faster growth, and broader uncertainty, while higher-tech/precision segments trend lower with narrower bands—again consistent with GRA (energy and scale as primary drivers; technology upgrading as the main countervailing force). Overall, the multi-year trends indicate that energy/scale dynamics shape the upward momentum, and technology diffusion is the key lever to bend the curve.
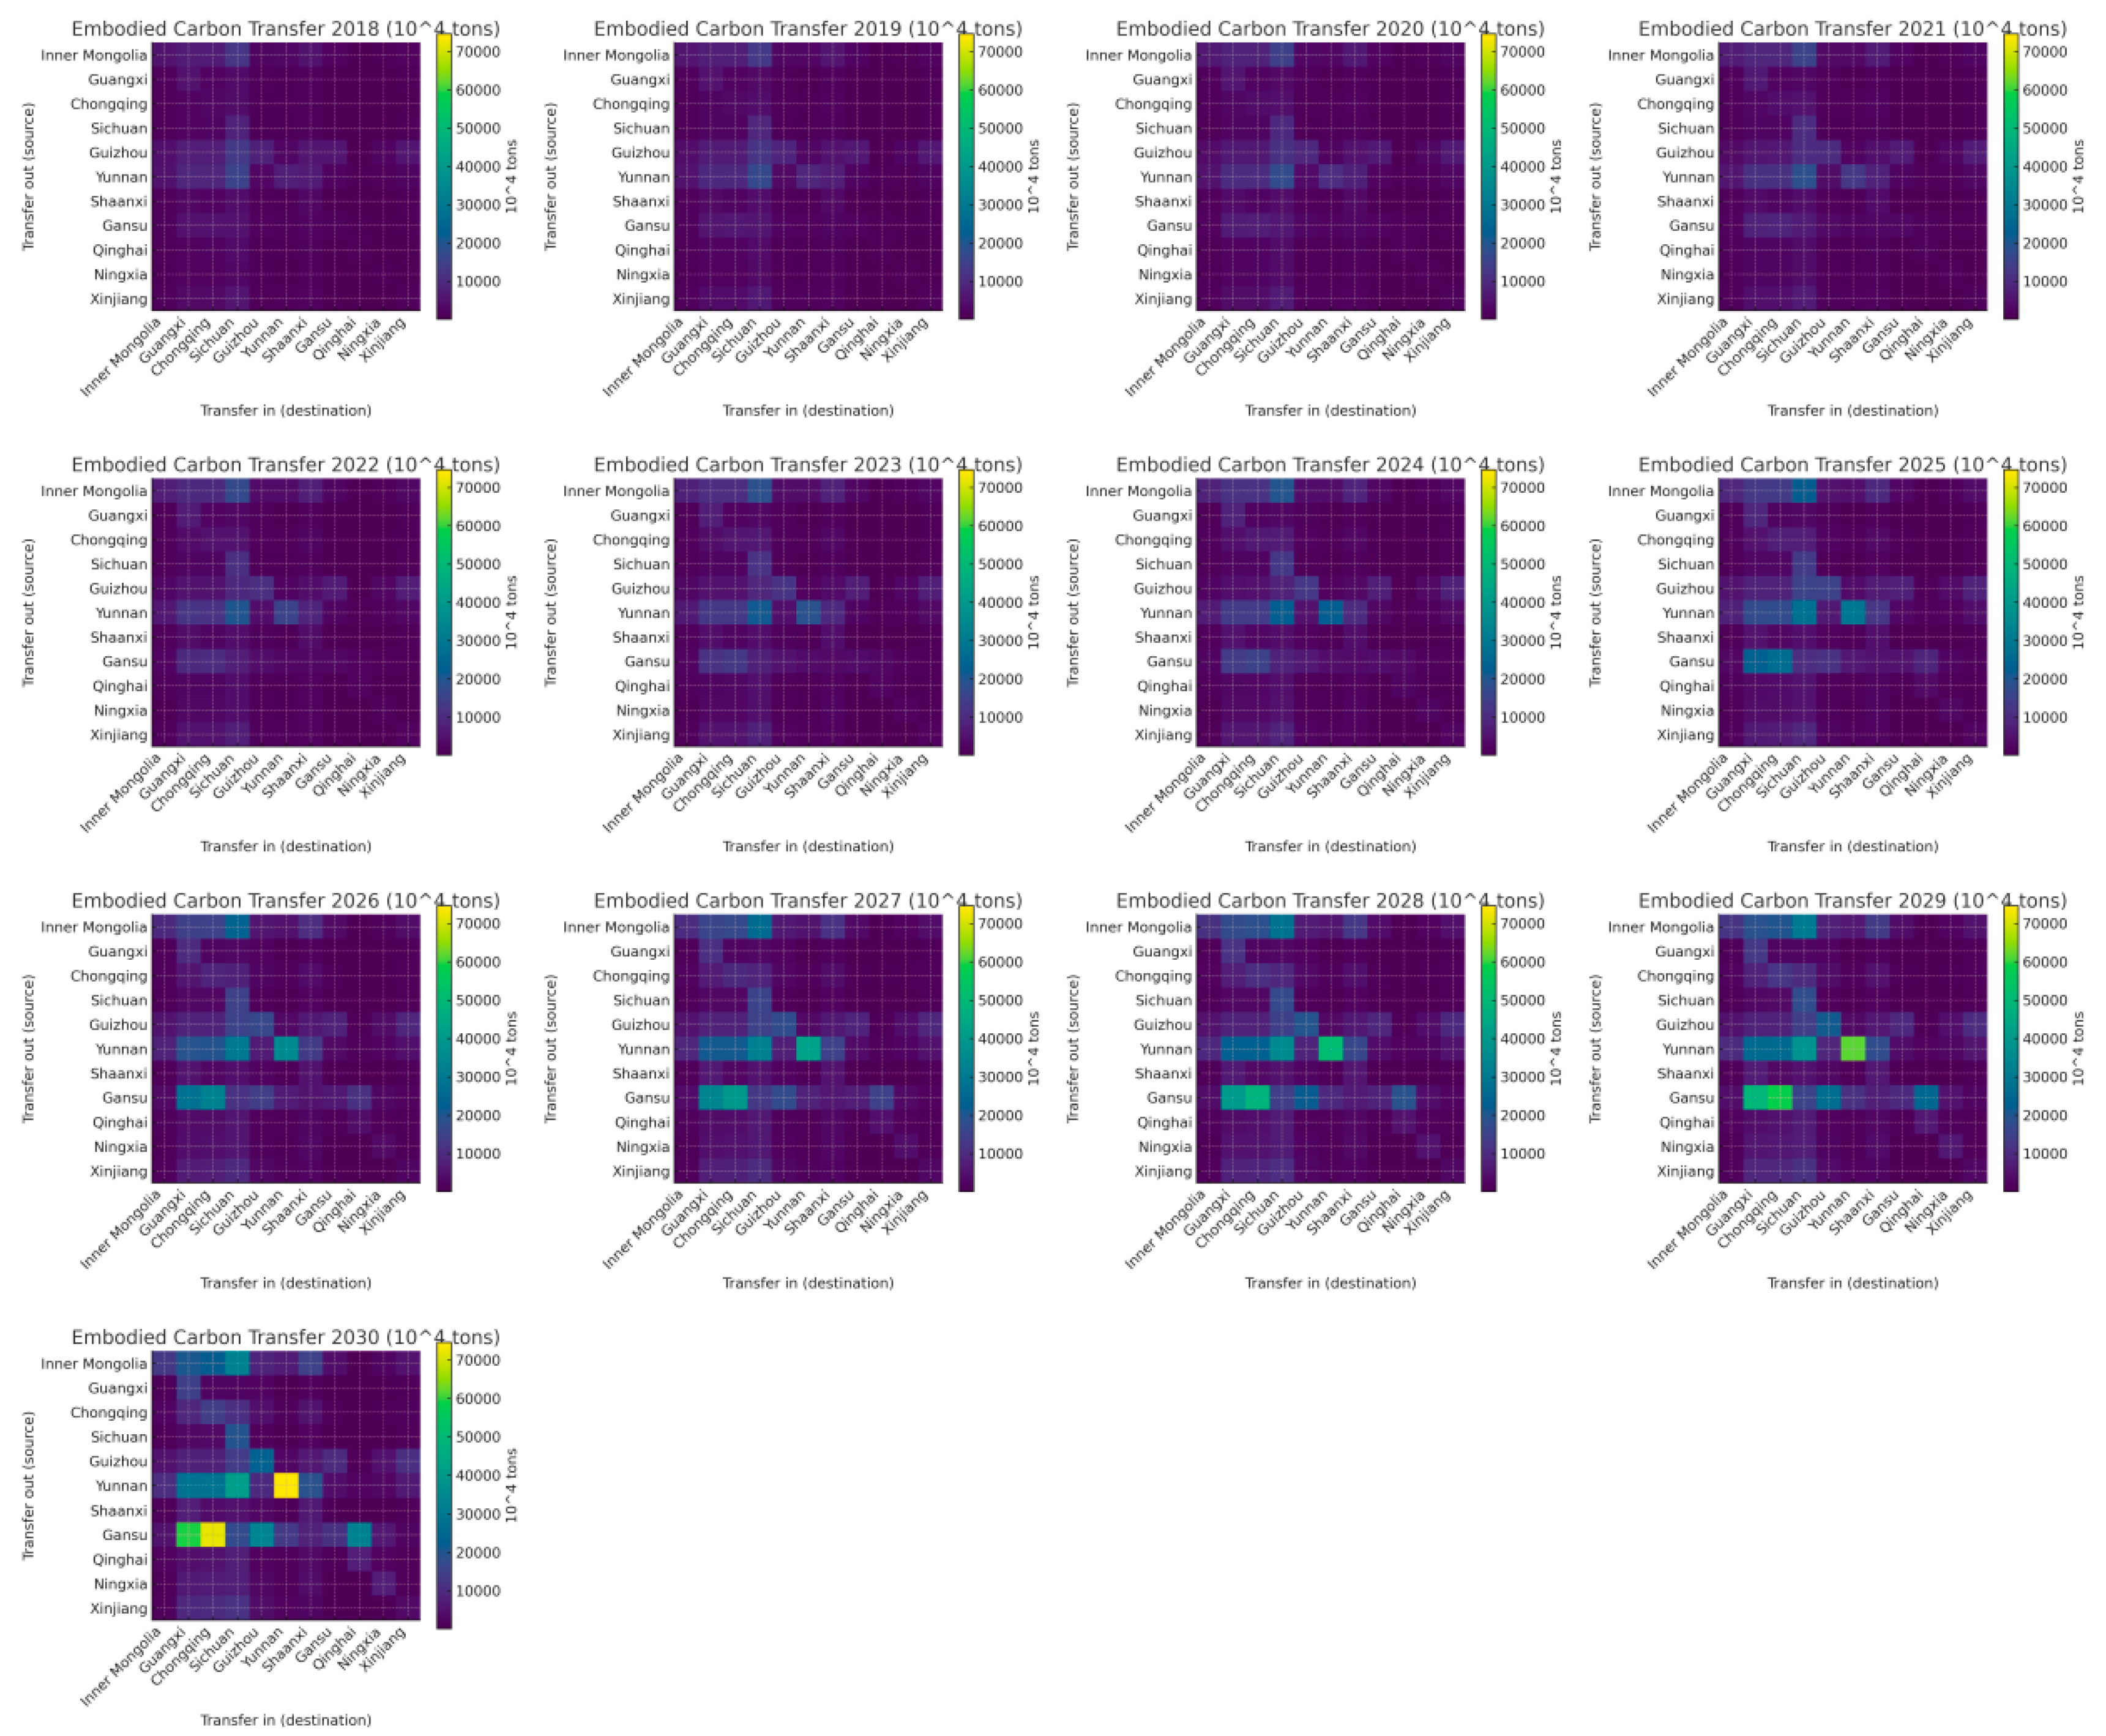
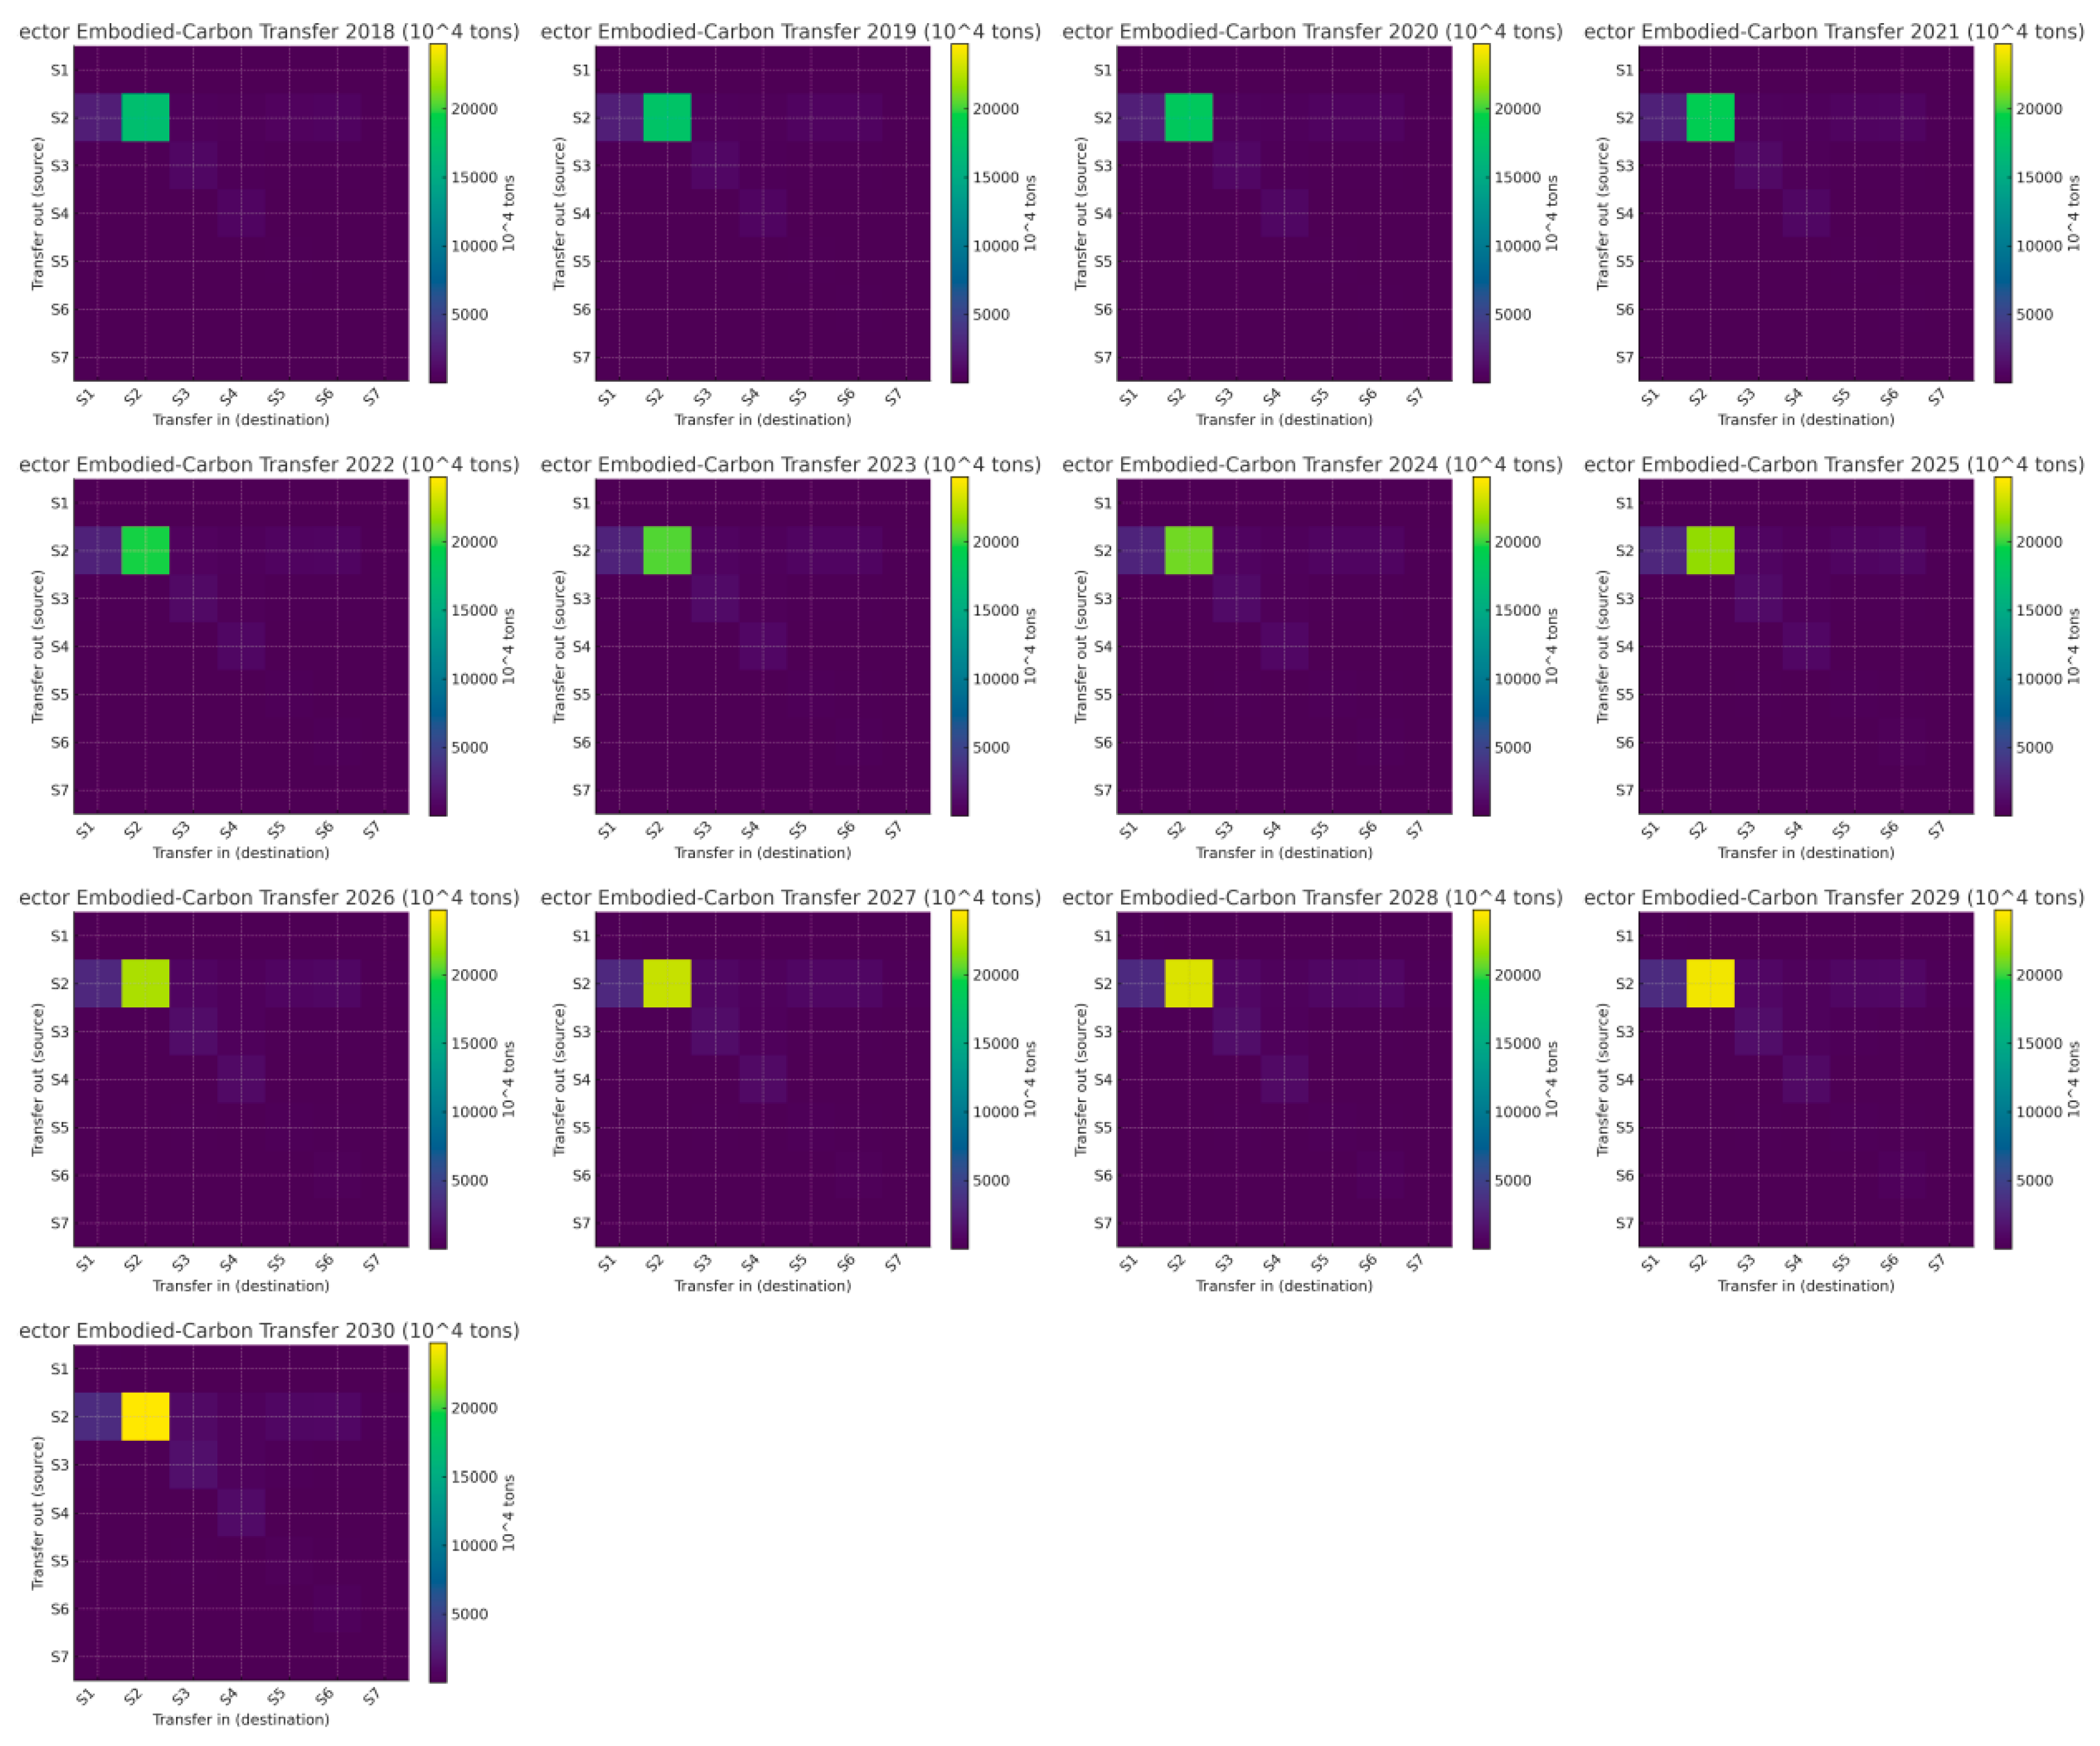
Here we visualize the structural evolution of embodied carbon transfers in Western China’s advanced manufacturing from 2018 to 2030 using annual heatmaps at two resolutions: an 11 × 11 provincial matrix and a 7 × 7 sectoral matrix (units: 104 tons; a common colour scale is used across years for comparability). In each heatmap, diagonal cells represent within-province (or within-sector) self-flows, while off-diagonal cells capture cross-boundary transfers (interprovincial corridors or intersectoral linkages). Darker shades indicate larger embodied carbon volumes. The series is ordered chronologically to make intensification, diffusion, and persistence of links visually traceable. These graphics translate our MRIO-based accounting and WOA–GNN forecasts into an intuitive, network-style view, setting up the subsequent discussion of hub-and-corridor formation at the provincial level and diagonal dominance centred on S2 at the sector level, as well as their consistency with the energy/technology mechanisms highlighted by the GRA results (see Figure 13 and Figure 14).
From Figure 13 and Figure 14, two patterns are salient. At the provincial level, embodied carbon transfers intensify and become more hub-and-corridor oriented: large self-flows (diagonal cells) expand steadily in Sichuan, Chongqing, Guangxi, Qinghai, Ningxia, and Xinjiang, indicating deeper intra-provincial supply chain coupling, while major outbound corridors from Inner Mongolia, Yunnan, and Gansu to downstream manufacturing centres (Sichuan, Chongqing, Guangxi) thicken year by year; bidirectional links along contiguous routes (e.g., Yunnan↔Sichuan, Chongqing↔Sichuan, Inner Mongolia↔Sichuan/Chongqing) also strengthen, revealing spatial path-dependence and agglomeration in shared industrial belts. At the sector level, the network is increasingly diagonal-dominant and S2-centred: the S2→S2 block leads the matrix throughout, cross-sector flows such as S3→S4 and S5→S3/S4 enlarge, and the sharp rise in S6→S6 signals intensifying within-sector transactions (parts/modules, intermediate electrified processes). Together, these shifts point to scale effects in energy-intensive chains (driving strong S2 links), technology upgrading and modularization (amplifying S6 and S3↔S4 exchanges), and proximity-based logistics advantages (reinforcing provincial corridors), producing a denser, more centralized embodied carbon transfer network by 2030.
Building on the foregoing time-series diagnostics and model setup, we apply the WOA–Grey Neural Network (WOA–GNN) to project the carbon footprints of seven advanced-manufacturing sectors across 11 western provinces (municipalities/autonomous regions) to 2030. The province- and sector-specific outcomes are summarized in Table 7, Figure 15 and Figure 16.
At the provincial level, the differences in the carbon footprint of advanced manufacturing across provinces in Western China are closely related to each province’s industrial structure and energy use patterns. For example, Inner Mongolia has a relatively high carbon footprint, particularly in the non-metallic mineral products industry (S2), where the province’s carbon emissions reach 12.839 million tons. This reflects its reliance on resource extraction and energy-intensive industries, especially the mining and processing of mineral resources, which lead to high carbon emissions [57]. In contrast, provinces such as Sichuan and Shaanxi, which have more developed manufacturing sectors, exhibit a larger proportion of low-carbon industries such as computer, communication, and other electronic equipment manufacturing (S6) in their carbon footprints. However, high-emission industries such as non-metallic mineral products (S2) and general equipment manufacturing (S3) still dominate their overall emissions [58]. Provinces like Gansu show relatively low carbon emissions, particularly in sectors such as chemical fibre manufacturing (S1), indicating a lower level of industrialization, with emissions mainly coming from traditional energy use and a few industrial sectors (Figure 15) [59].
At the sectoral level, the non-metallic mineral products industry (S2) dominates the carbon footprint in many provinces, especially in Inner Mongolia and Sichuan, highlighting that industries involved in mineral extraction and construction materials production are major sources of carbon emissions. General equipment manufacturing (S3) and electrical machinery and equipment manufacturing (S5) also contribute significantly to carbon emissions in several provinces, particularly in regions with advanced industrial manufacturing. In contrast, the carbon footprints of the computer/communication and other electronic equipment manufacturing industry (S6) and the instrumentation industry (S7) are relatively low, suggesting strong potential for low-carbon development in these sectors and indicating cleaner, more energy-efficient production methods. Therefore, focusing on reducing emissions from high-carbon industries and promoting low-carbon technologies is key to achieving carbon reduction targets in Western China (Table 7 and Figure 16).
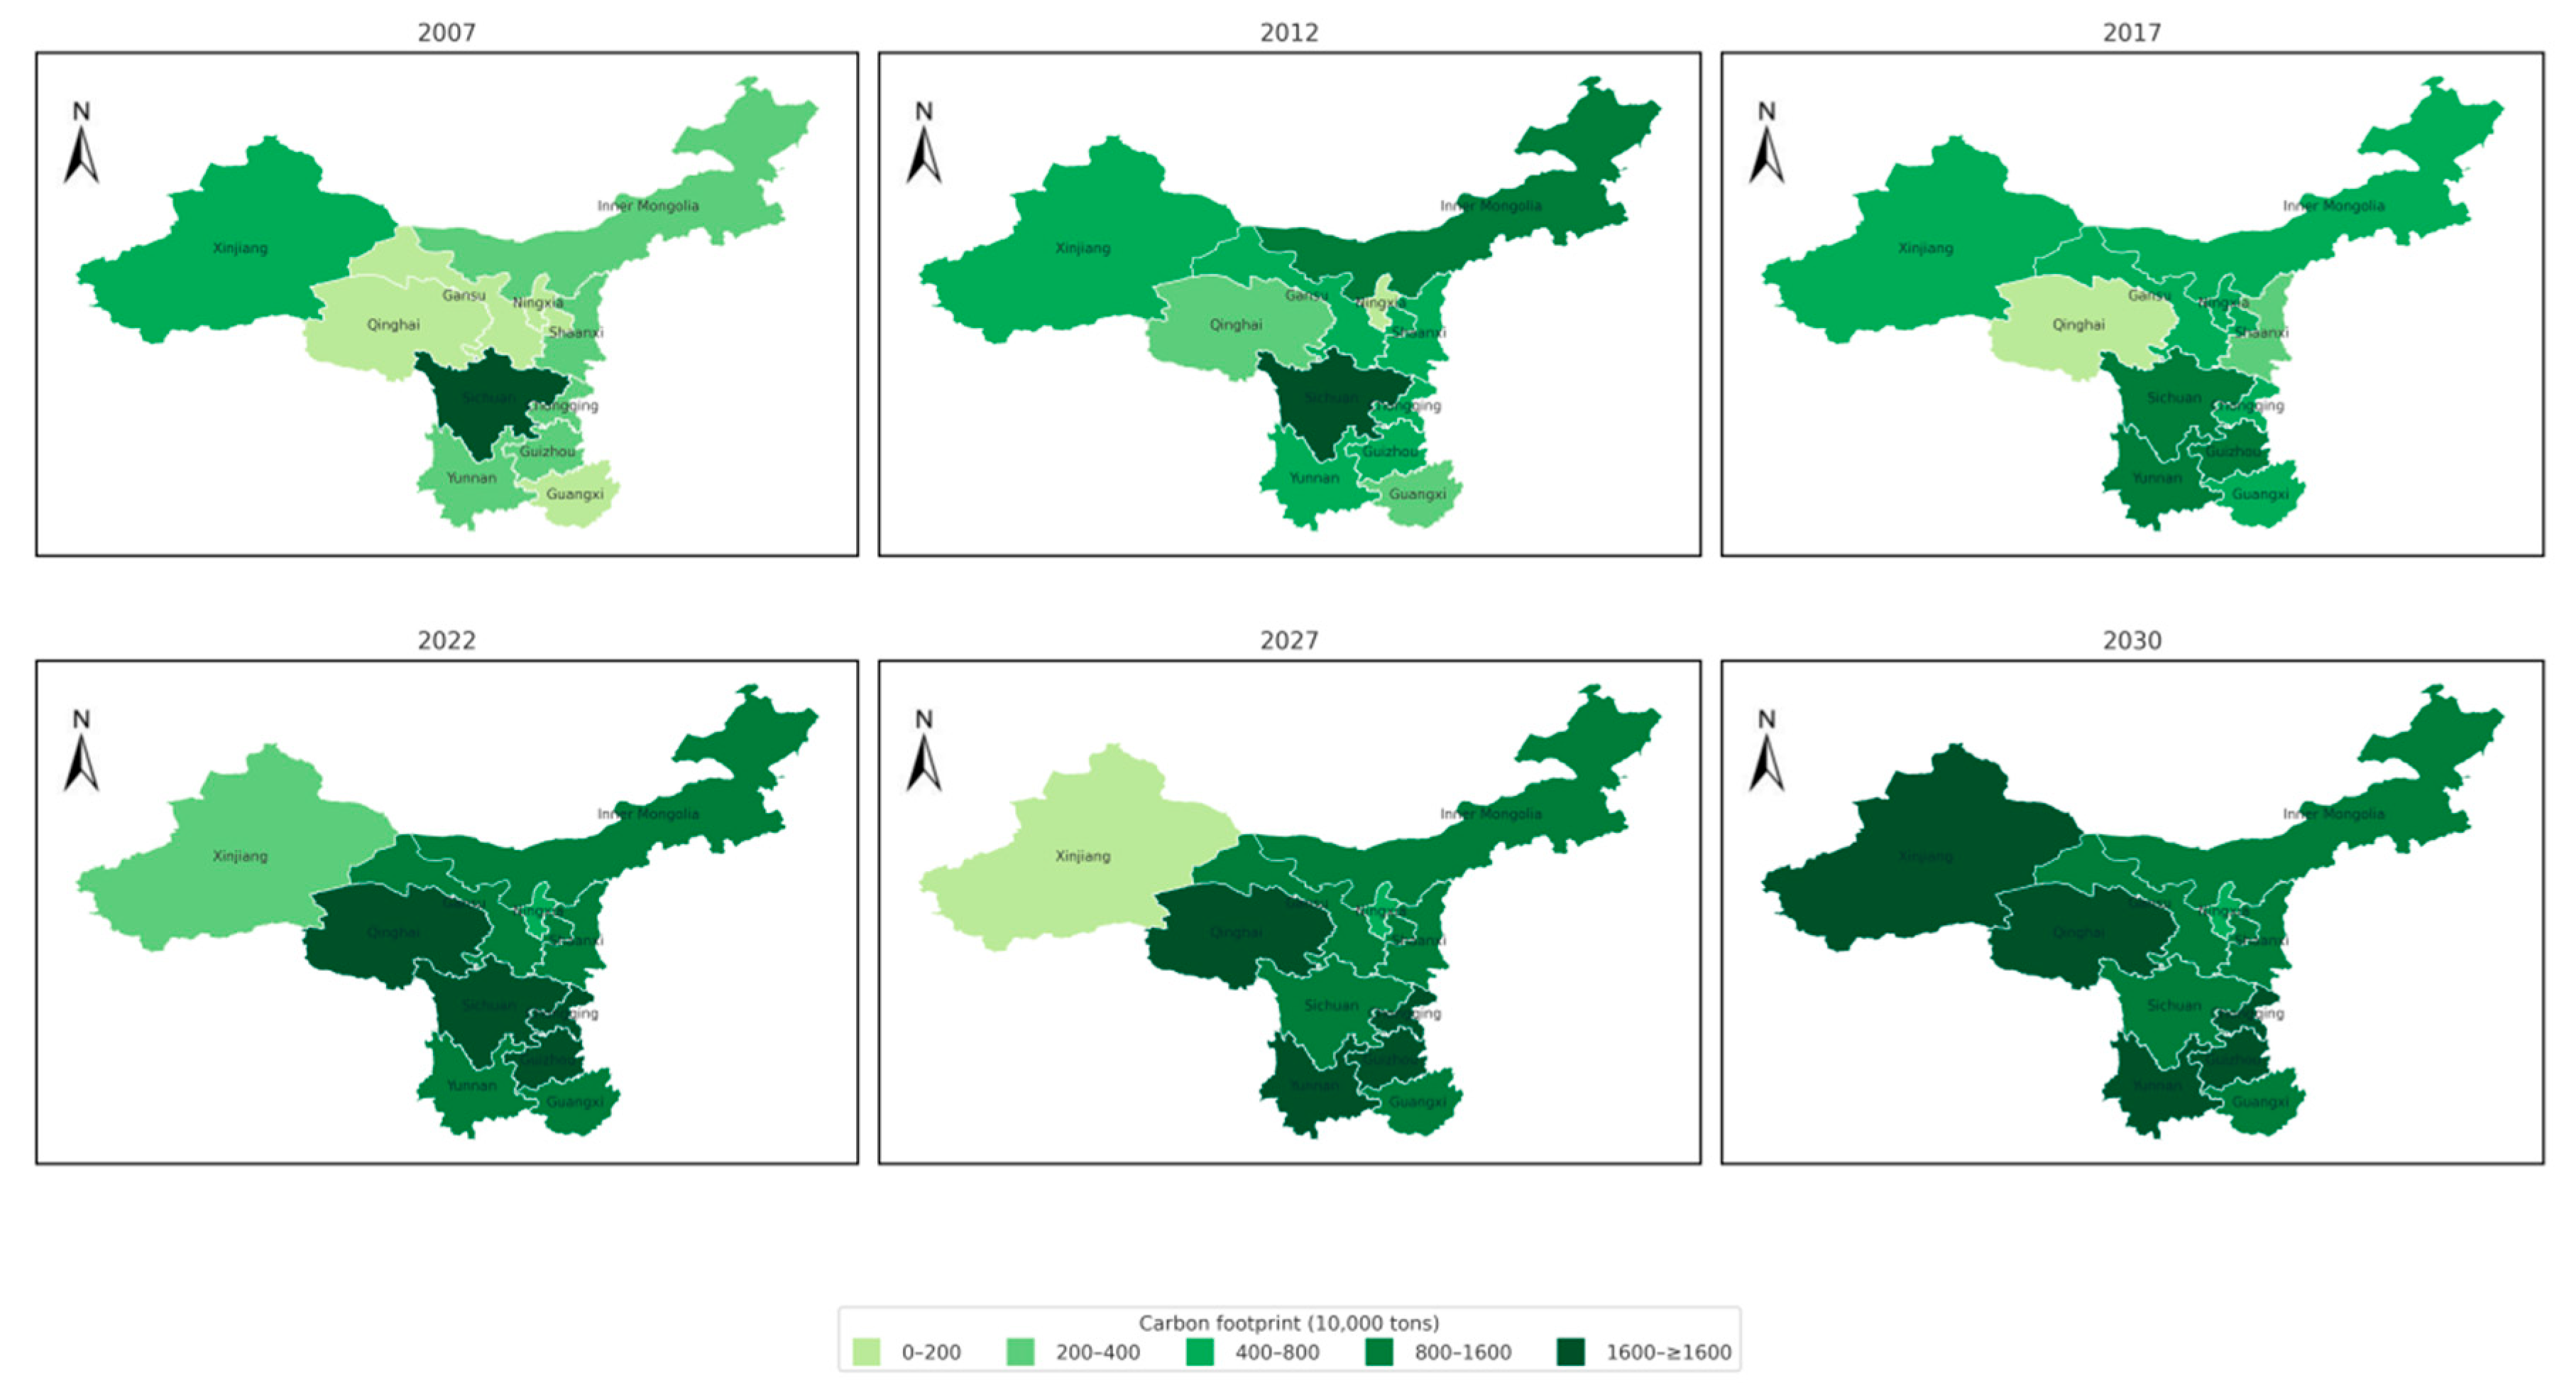
Using ArcGIS Version—10.8 software to map the spatial distribution of carbon footprints of advanced manufacturing industries in Western China during 2007–2030 (see Figure 17).
The spatial pattern analysis of the carbon footprint of advanced manufacturing industries in Western China in 2017 reveals significant regional disparities. Inner Mongolia exhibited a notably high carbon footprint across all sectors, especially in the non-metallic mineral products industry (S2), reflecting its reliance on energy-intensive industries such as coal and steel. Provinces like Sichuan and Guangxi also showed high carbon footprints, mainly concentrated in heavy industries and general equipment manufacturing (S3), indicating well-developed manufacturing sectors with substantial energy consumption and carbon emissions. In contrast, provinces such as Qinghai and Ningxia recorded relatively low carbon footprints, particularly in more environmentally friendly sectors such as computer/communication and other electronic equipment manufacturing (S6), where emissions were significantly lower than those in other provinces (Figure 17).
By 2030, the spatial pattern of carbon footprints in Western China’s advanced manufacturing sector is projected to change. Compared with 2017, carbon footprints are expected to increase overall. This trend is particularly pronounced in Inner Mongolia, Sichuan, and Guizhou, especially in the non-metallic mineral products industry (S2) and general equipment manufacturing (S3), indicating the continued growth of heavy industries and resource-intensive sectors in the coming decades. Meanwhile, provinces like Qinghai and Ningxia are projected to experience relatively small increases in carbon emissions, especially in high-tech manufacturing and service industries, suggesting a shift toward a low-carbon and green economy and a reduced dependence on traditional high-carbon sectors.
The spatial evolution of the carbon footprint from 2017 to 2030 illustrates that, with economic development and structural adjustments in manufacturing, regional disparities in carbon emissions are expected to narrow. Although Inner Mongolia, Sichuan, and Guizhou are projected to maintain dominant carbon footprints, the influence of new energy adoption, environmental policies, and industrial transformation may help mitigate overall emissions levels in Western China. At the same time, provinces such as Qinghai and Ningxia are likely to maintain their low-carbon advantages, showing trends toward green manufacturing and efficient energy use.
To assess whether the projected 2030 provincial profiles are policy-consistent and externally plausible, we benchmark each province’s forecasted carbon footprint against indicative 2030 policy targets (caps or intensity-converted caps). We report the gap (Forecast − Target) and a Pass/Fail decision rule (Pass if the forecast does not exceed the target). The results are summarized in Table 8.
As Table 8 shows, five provinces meet their indicative 2030 benchmark—Inner Mongolia (−0.73 Mt), Sichuan (−0.47 Mt), Shaanxi (−0.30 Mt), Gansu (−0.05 Mt), and Ningxia (−0.32 Mt)—whereas six provinces exceed their benchmarks—Qinghai (+1.99 Mt), Chongqing (+1.07 Mt), Guizhou (+0.85 Mt), Guangxi (+0.54 Mt), Yunnan (+0.32 Mt), and Xinjiang (+0.29 Mt), yielding a regional overshoot of +3.19 Mt. The pass group is broadly consistent with (i) earlier adoption of cleaner power and process upgrades in key manufacturing lines and (ii) a more balanced growth of output scale. By contrast, the fail group concentrates provinces where energy-intensive subsectors remain prominent and the energy mix converges more slowly.
Linking these patterns to our industry-level grey relational analysis (GRA), two mechanisms dominate: (i) energy factors—notably energy intensity and the electricity/coal mix—together with output scale, which exhibit the strongest correlations with sectoral footprints and are consistent with overshoots in provinces hosting basic-materials and equipment chains; and (ii) technology factors (process efficiency, equipment vintages), which are negatively associated with emissions, implying that diffusion of best-available technologies can materially bend the curve. Guided by these mechanisms and consistent with the spatial–economic drivers identified by the QAP analysis, we propose a targeted package: close the energy-mix gap by accelerating renewable build-out and interprovincial green-power trade—prioritizing long-term PPAs for advanced-manufacturing parks in non-compliant provinces (especially Qinghai, Chongqing, Guizhou); pursue deep retrofits in energy-intensive subsectors (cement/clinker, glass, non-metallic minerals, heavy equipment) via waste-heat recovery, high-efficiency drives, low-clinker cements, process electrification, and selective CCUS at high-purity sources; accelerate technology diffusion through province-to-province retrofit funds and vendor-assisted performance contracts directed to Chongqing, Guizhou, Guangxi, complemented by digital energy-management systems; implement supply chain governance along contiguous corridors (harmonized energy/heat-reuse standards and coordinated “brown-to-green” supplier upgrading) to curb cross-border rebound; and embed open-economy safeguards (green procurement, low-carbon product standards, supplier disclosure) so that trade transmits low-carbon practices rather than carbon leakage. For Inner Mongolia, Sichuan, Shaanxi, Gansu, Ningxia, which already meet indicative targets, maintain momentum through performance-based energy quotas, best-in-class process benchmarks, and continuous green-power contracting. Collectively, aligning provincial action with the GRA-identified energy and technology levers—while acting on spatial and development gradients highlighted by QAP—offers a credible pathway to convert today’s mixed compliance into region-wide attainment of the 2030 goal.

3.3.2. Analysis of the Forecasting Results of Embodied Carbon Transfer

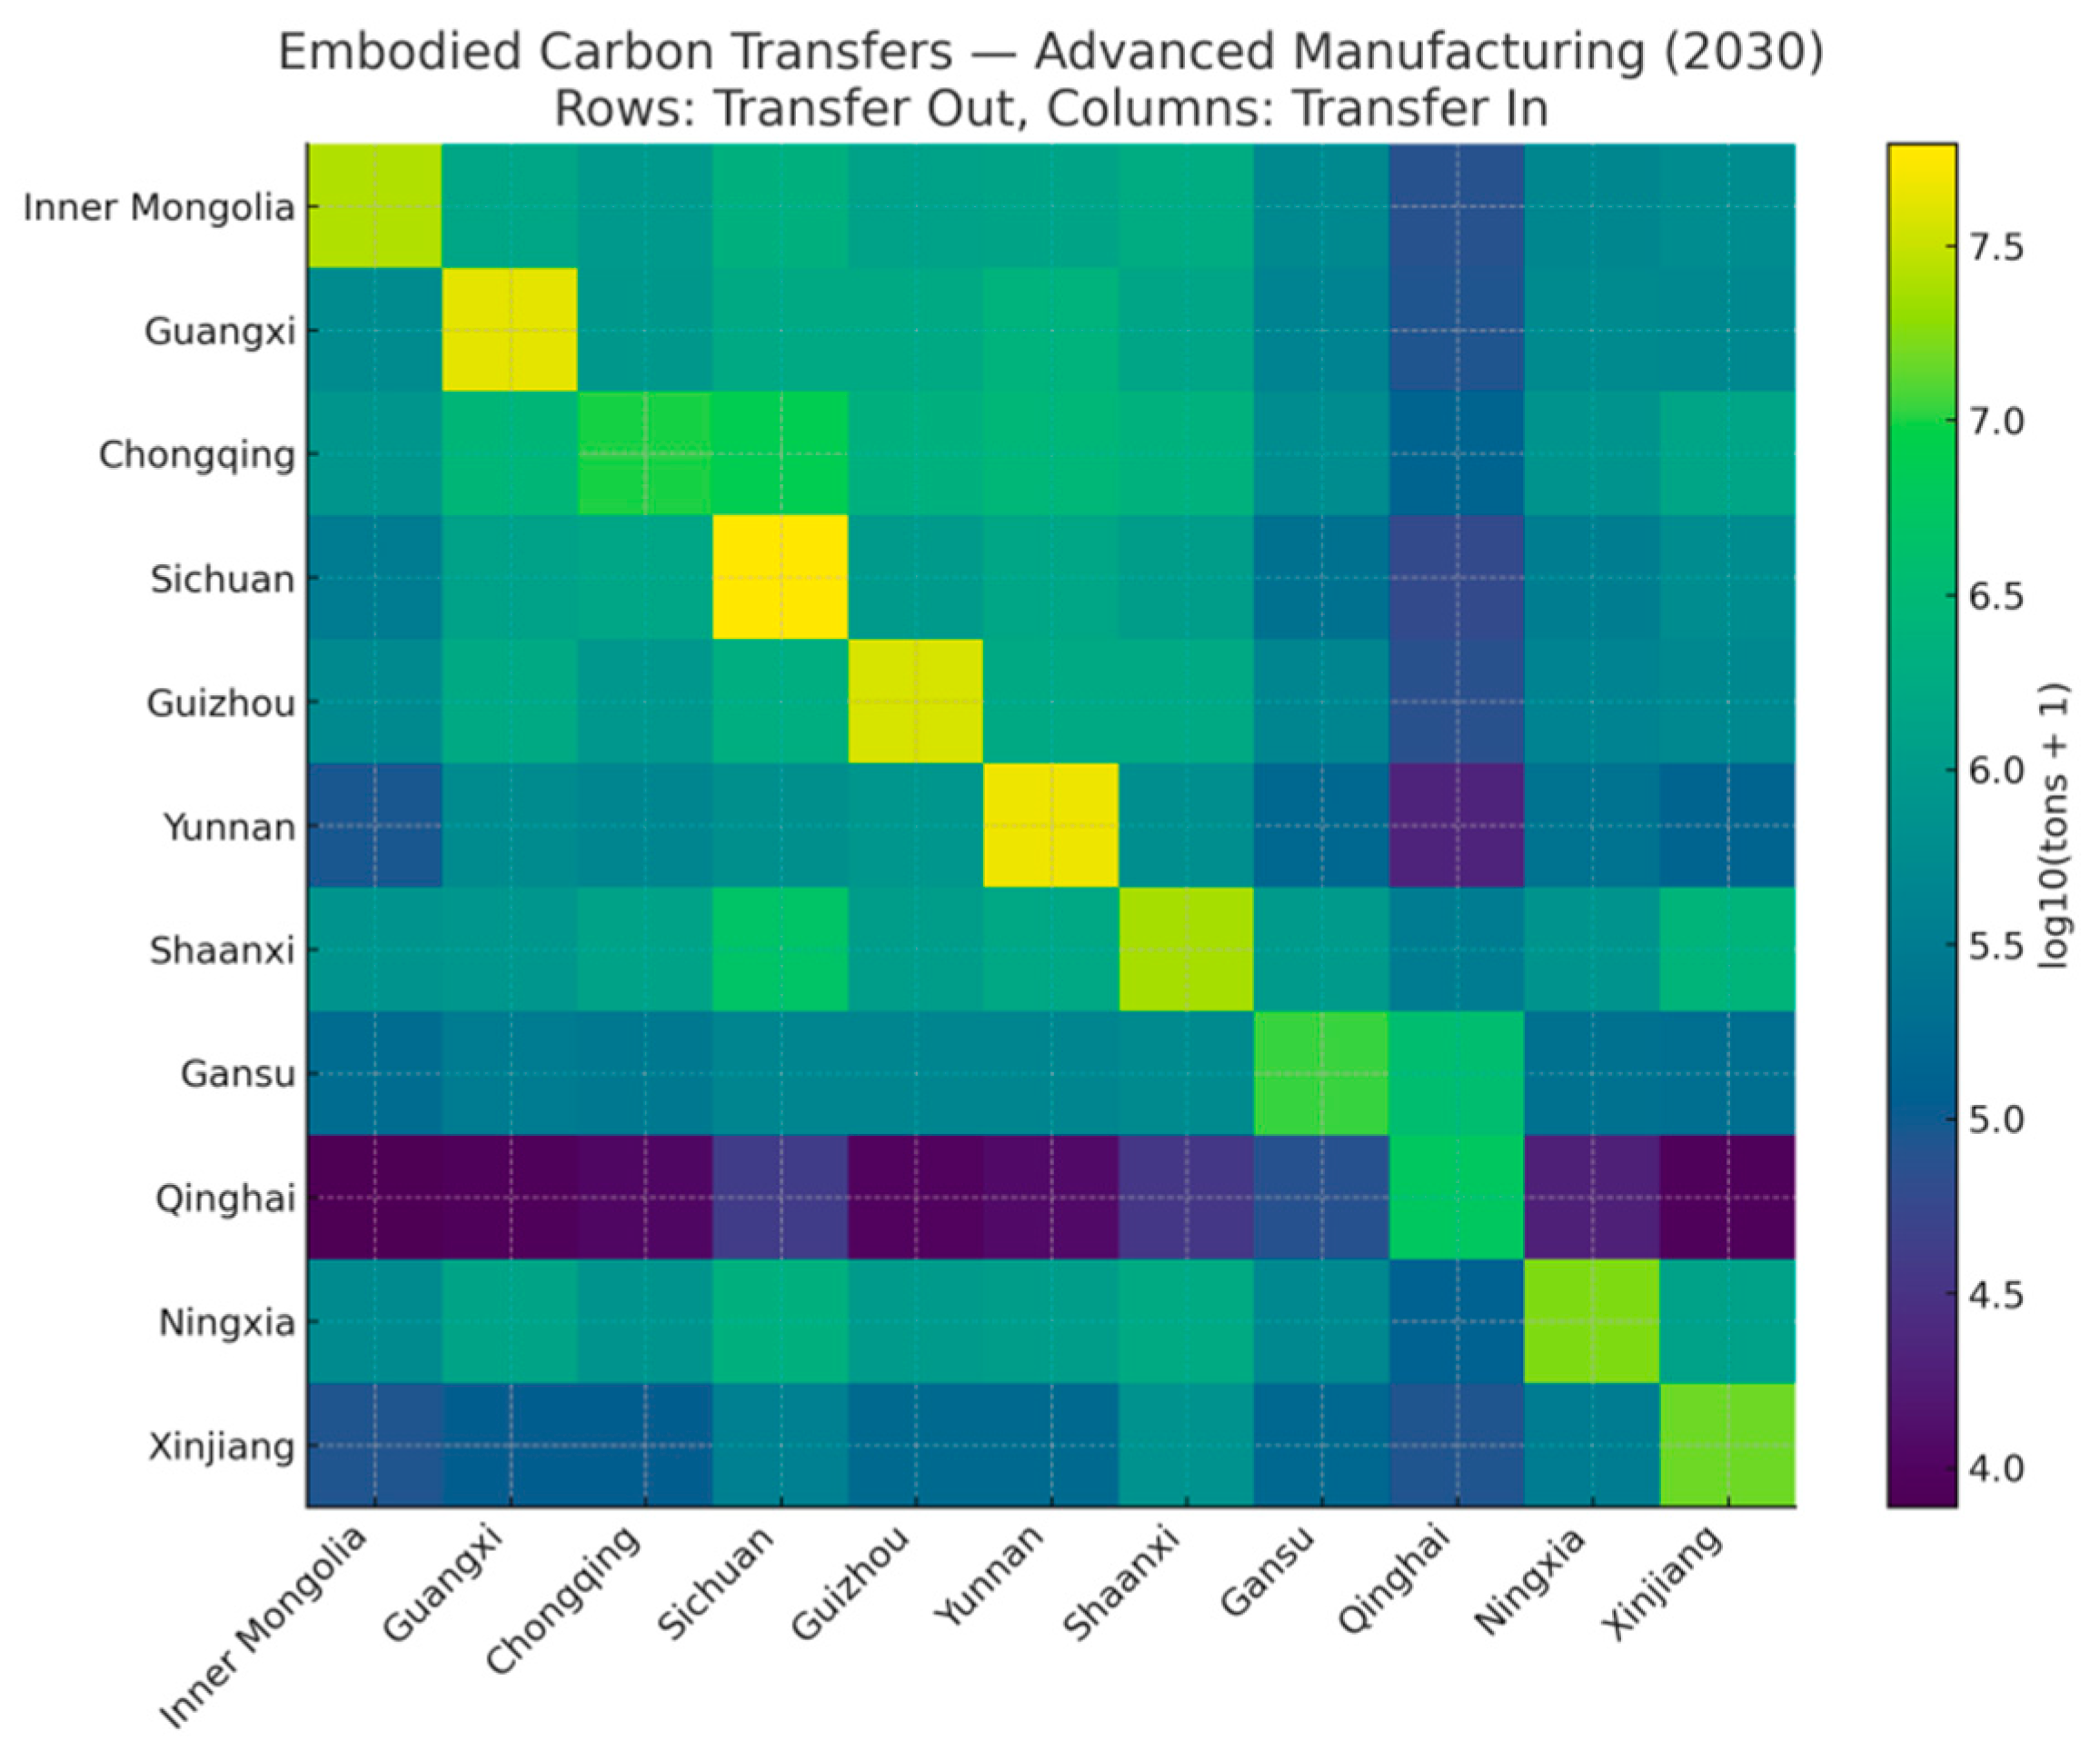
Using the WOA-Grey Neural Network Model to forecast interprovincial and intersectoral embodied carbon transfers in Western China’s advanced manufacturing industry in 2030 (see Table 9 and Table 10, Figure 18 and Figure 19).
In 2030, the interprovincial embodied carbon transfer of advanced manufacturing in Western China is characterized by concentrated scale, a pronounced core–periphery structure, and active bidirectional flows. Overall, Sichuan, Yunnan, Guangxi, Guizhou, and Chongqing are the provinces with the largest volumes of embodied carbon transfers. Notably, Sichuan and Yunnan exhibit particularly large internal embodied carbon flows (i.e., intra-provincial transfers), reaching 61.976 million tons and 47.942 million tons, respectively, indicating that carbon emissions and manufacturing output are highly concentrated within these provinces. At the same time, Guangxi, Guizhou, and Ningxia demonstrate strong capabilities in embodied carbon outflows, transferring substantial carbon emissions to neighbouring provinces such as Chongqing and Sichuan. Several key factors contribute to this spatial pattern: first, Sichuan, Yunnan, and Guangxi have large-scale advanced manufacturing industries with long industrial chains and strong local consumption and processing demands, leading to both high internal and outward embodied carbon transfers; second, Guizhou and Ningxia, as providers of energy and raw materials, exhibit export-oriented characteristics with industrial structures dominated by energy-intensive and high-emission sectors; third, industrial linkages among western provinces have strengthened, resulting in the formation of a carbon transfer network centred around core provinces and supported by surrounding regions. Overall, the regional industrial division of labour and energy consumption structure determine the spatial distribution characteristics of embodied carbon transfer across Western China’s advanced manufacturing sector (Table 9 and Figure 18) [21].
In 2030, the intersectoral embodied carbon transfer within the advanced manufacturing industry of Western China exhibits characteristics of “cumulative advantage dynamics, internal concentration, and prominent key nodes.” The non-metallic mineral products industry (S2) serves as the absolute core of carbon transfer, with a massive volume of internal transfers and significant carbon outflows to other sectors. This is followed by the general and special equipment manufacturing industry (S3) and the aerospace and other transportation equipment manufacturing industry (S4), reflecting the scale effect of the industries and the driving role of upstream and downstream linkages [60]. The formation of this carbon transfer pattern is mainly influenced by a combination of factors, including sectoral output scale, energy intensity, and the degree of industrial chain interconnection (Table 10 and Figure 19) [61].
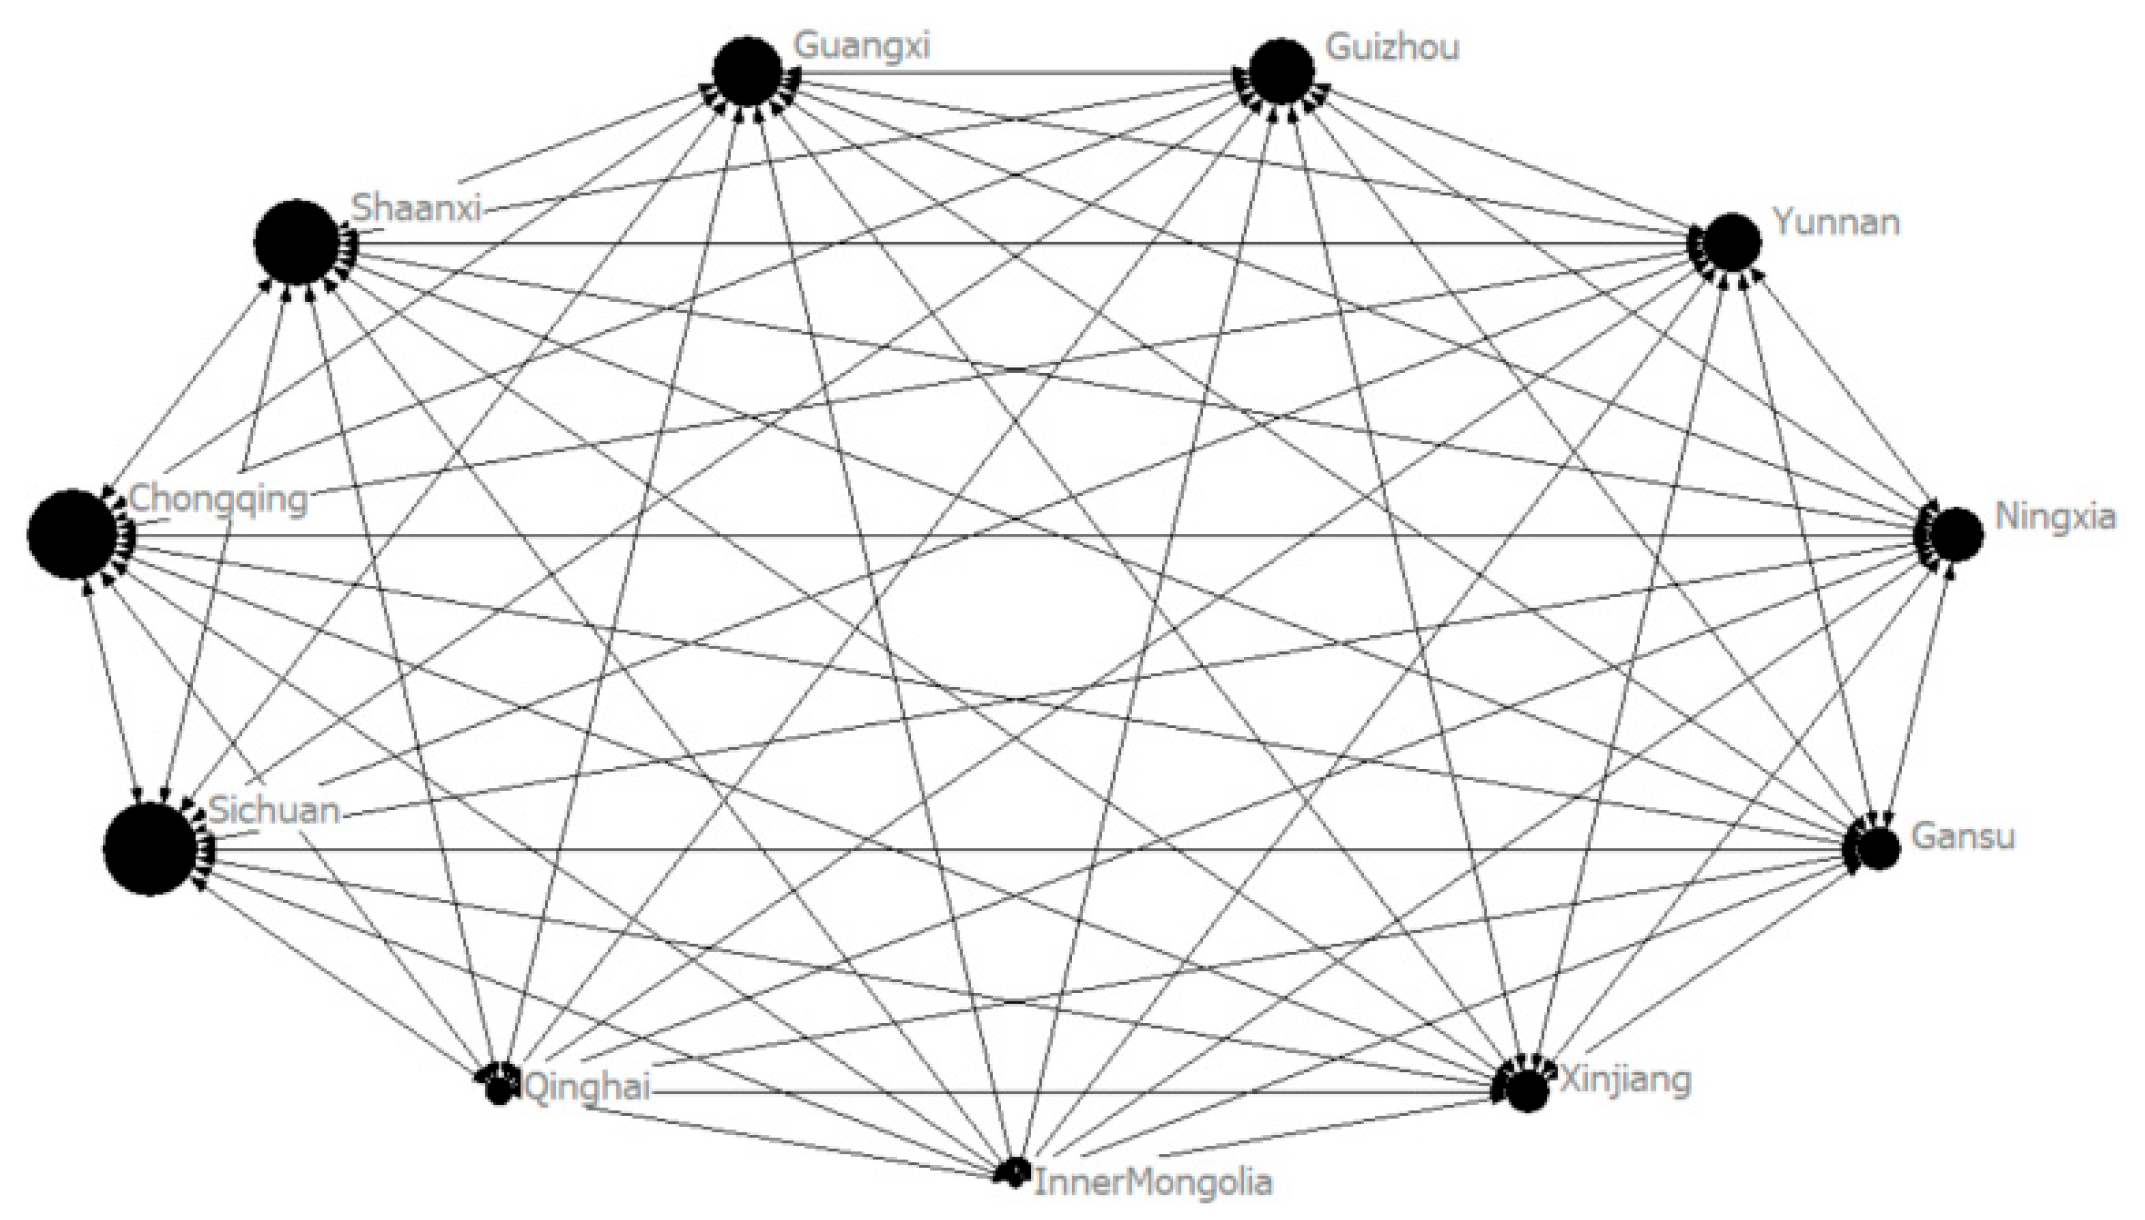
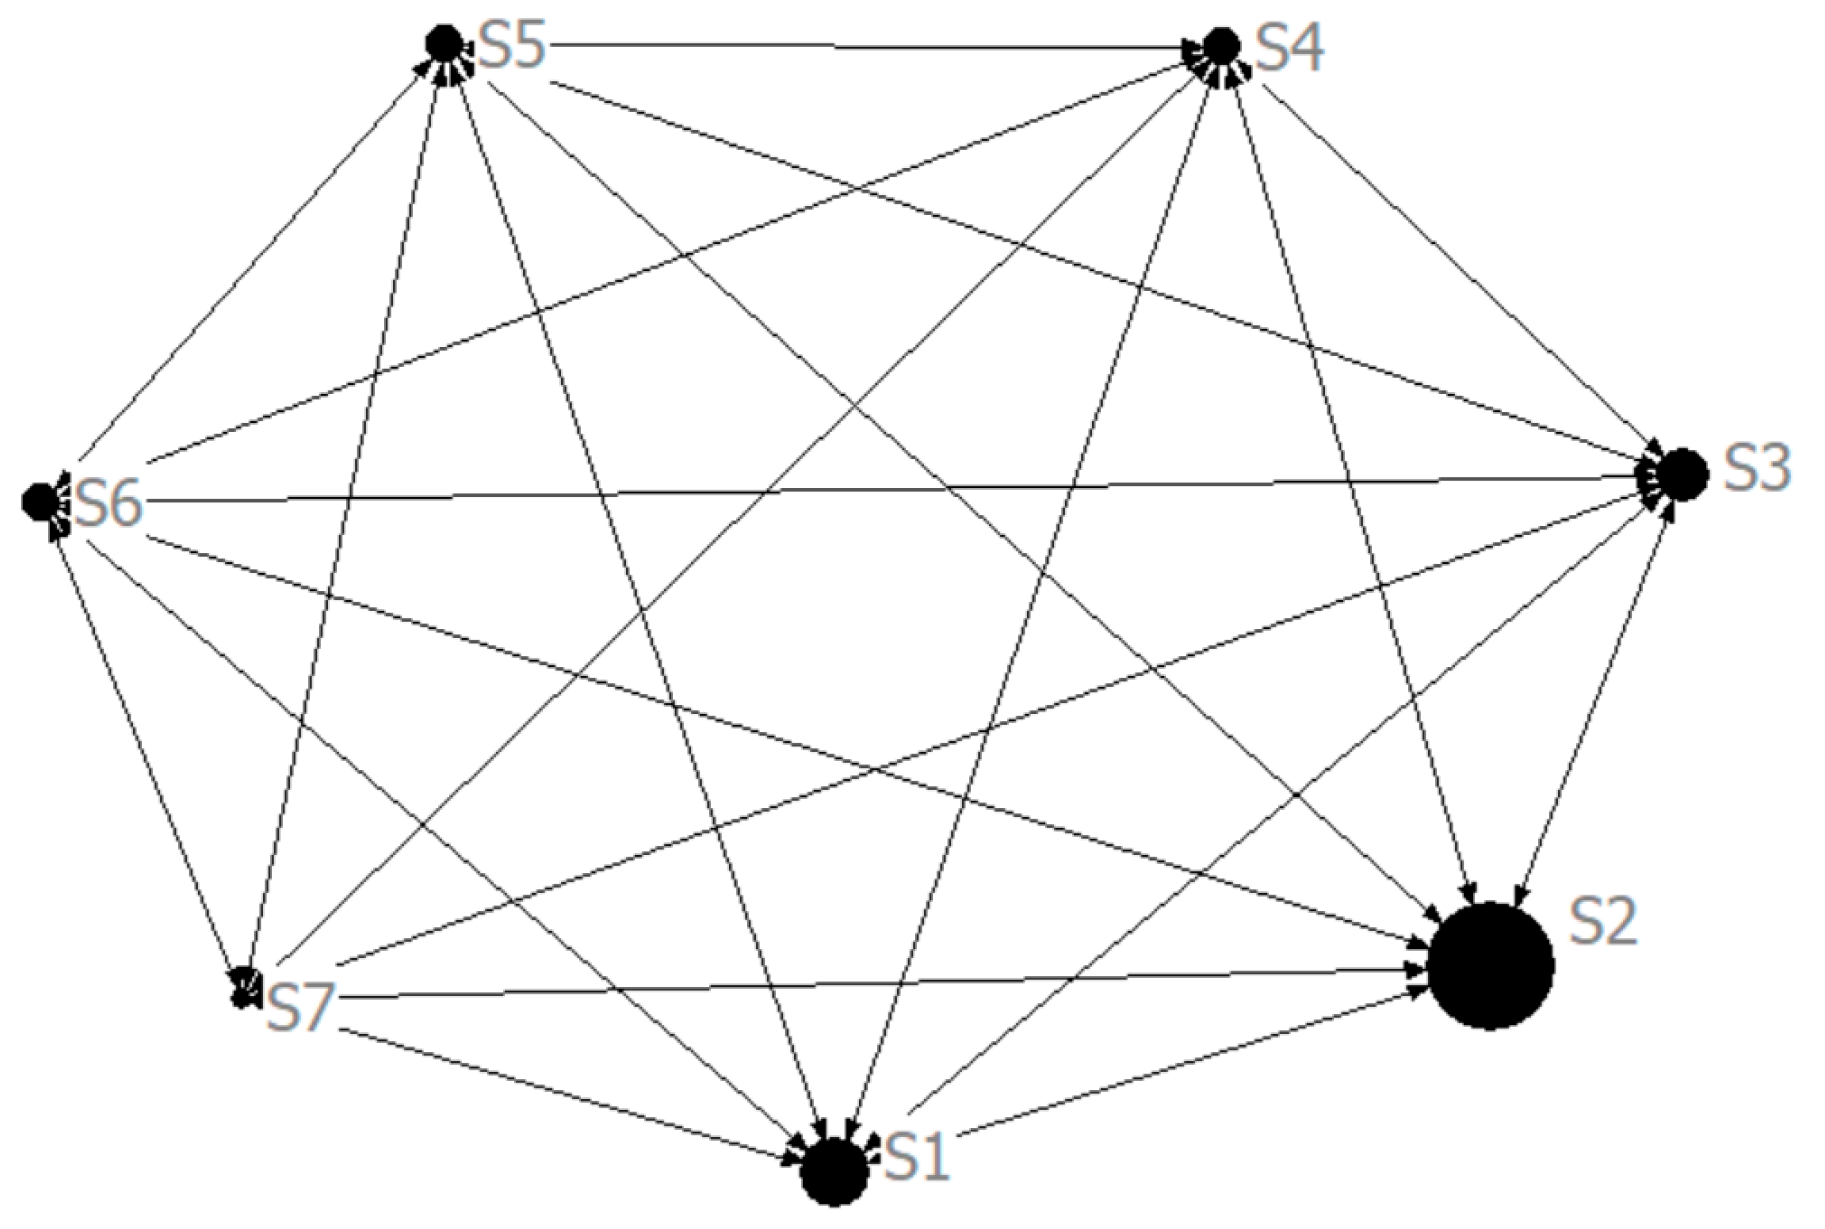
Based on the 2030 forecasting results of interprovincial and intersectoral embodied carbon transfers in the advanced manufacturing industry of Western China, directed network diagrams of embodied carbon transfer are created using UCINET 6 Version—6.780 software. In these diagrams, the direction of the arrows represents the direction of embodied carbon transfer, while the size of each network node is determined by the total amount of embodied carbon emissions transferred out from and into that node (see Figure 20 and Figure 21). In addition, we operationalize the province- and sector-level systems as weighted, directed graphs and conduct quantitative social-network analysis to compute degree centrality (decomposed into out-, in-, and total degree), betweenness centrality (Freeman), and closeness centrality (reciprocal geodesic distance) (Table 11 and Table 12), thereby identifying dominant sources/exporters (high out-degree), sinks/importers (high in-degree), brokers (high betweenness), and efficiency hubs (high closeness) in both the interprovincial and intersectoral networks (see corresponding summary tables).
By 2030, the interprovincial embodied carbon transfer pathways of advanced manufacturing in Western China exhibit a dual pattern of “internal concentration and external diffusion,” dominated by core provinces and marked by intensive transfers between neighbouring regions. Provinces such as Sichuan, Guangxi, Guizhou, and Ningxia have developed large-scale internal self-circulating carbon transfer systems, reflecting mature manufacturing structures and strong intra-provincial industrial coupling. At the same time, Sichuan, Chongqing, Guangxi, and Guizhou act as key carbon-exporting hubs, transferring substantial embodied carbon to nearby provinces like Yunnan, Ningxia, and Gansu. Notably, Sichuan functions as both a major internal circulator and an interprovincial hub, transferring emissions to areas such as Qinghai, Xinjiang, and Ningxia. These transfer patterns reveal significant geographical proximity effects and are driven by factors such as resource endowment, regional industrial coordination, and transportation cost minimization. Meanwhile, resource-based provinces like Inner Mongolia, Gansu, and Qinghai serve as both carbon importers and suppliers of raw materials and energy, underscoring their foundational role in the regional supply chain. Overall, these dynamics are shaped by disparities in industrial structures, development stages, and geographical advantages, reflecting both deepening regional cooperation and uneven carbon burden distribution, which poses differentiated challenges for green and low-carbon transitions (Figure 20 and Table 11).
At the sectoral level, the embodied carbon transfer network of Western China’s advanced manufacturing industry in 2030 is centred on the non-metallic mineral products industry (S2), supported by equipment manufacturing sectors (S3 and S5) and the electronic communication industry (S6). S2 acts as the primary carbon-exporting sector with substantial internal flows (S2→S2: 247 million tons) and large-scale transfers to S1, S3, S5, and S6, indicating its critical role in material supply. S3 functions as a hub in both receiving and redistributing carbon to downstream sectors such as S4, S5, and S6, forming a typical midstream diffusion pathway. S5 links to terminal high-tech sectors like S7, reflecting further specialization within the industrial chain. Meanwhile, S6 not only has significant internal flows (S6→S6: 4.5525 million tons) but also engages in reverse transfers, highlighting its growing importance in supporting technological advancement. These patterns align with the industrial logic of material input, processing, and end-product output, showing a transition from resource-intensive to technology-intensive production. The scale of carbon flows in foundational sectors underscores Western China’s role in supporting the national manufacturing base, while increasing transfers in high-tech industries reflect progress in industrial upgrading and green transformation (Figure 21 and Table 12).

3.3.3. QAP-Based Analysis of Factors Influencing the Embodied Carbon Transfer Network

(1)
QAP correlation analysis
Before running the QAP regression, we first examined the association between each explanatory matrix and the spatial linkage network of embodied carbon transfers in Western China’s advanced manufacturing sector using a QAP correlation test. Specifically, all matrices were imported into UCINET and subjected to 5000 random permutations to obtain inference results (Table 13). The findings show that the correlation coefficients for geographic contiguity, industrial-structure differentials, economic-development differentials, technology differentials, and openness differentials are all positive. Among them, geographic contiguity, industrial-structure differentials, and openness differentials pass significance at the 5% level, while technology differentials are significant at the 10% level—indicating these factors positively promote spatial linkages of embodied carbon transfers. By contrast, the energy-mix differential exhibits a negative correlation coefficient that is significant at the 1% level, implying that narrowing interprovincial differences in energy consumption structure tends to strengthen the connectivity among nodes in the embodied carbon transfer network.
(2)
QAP Regression Analysis
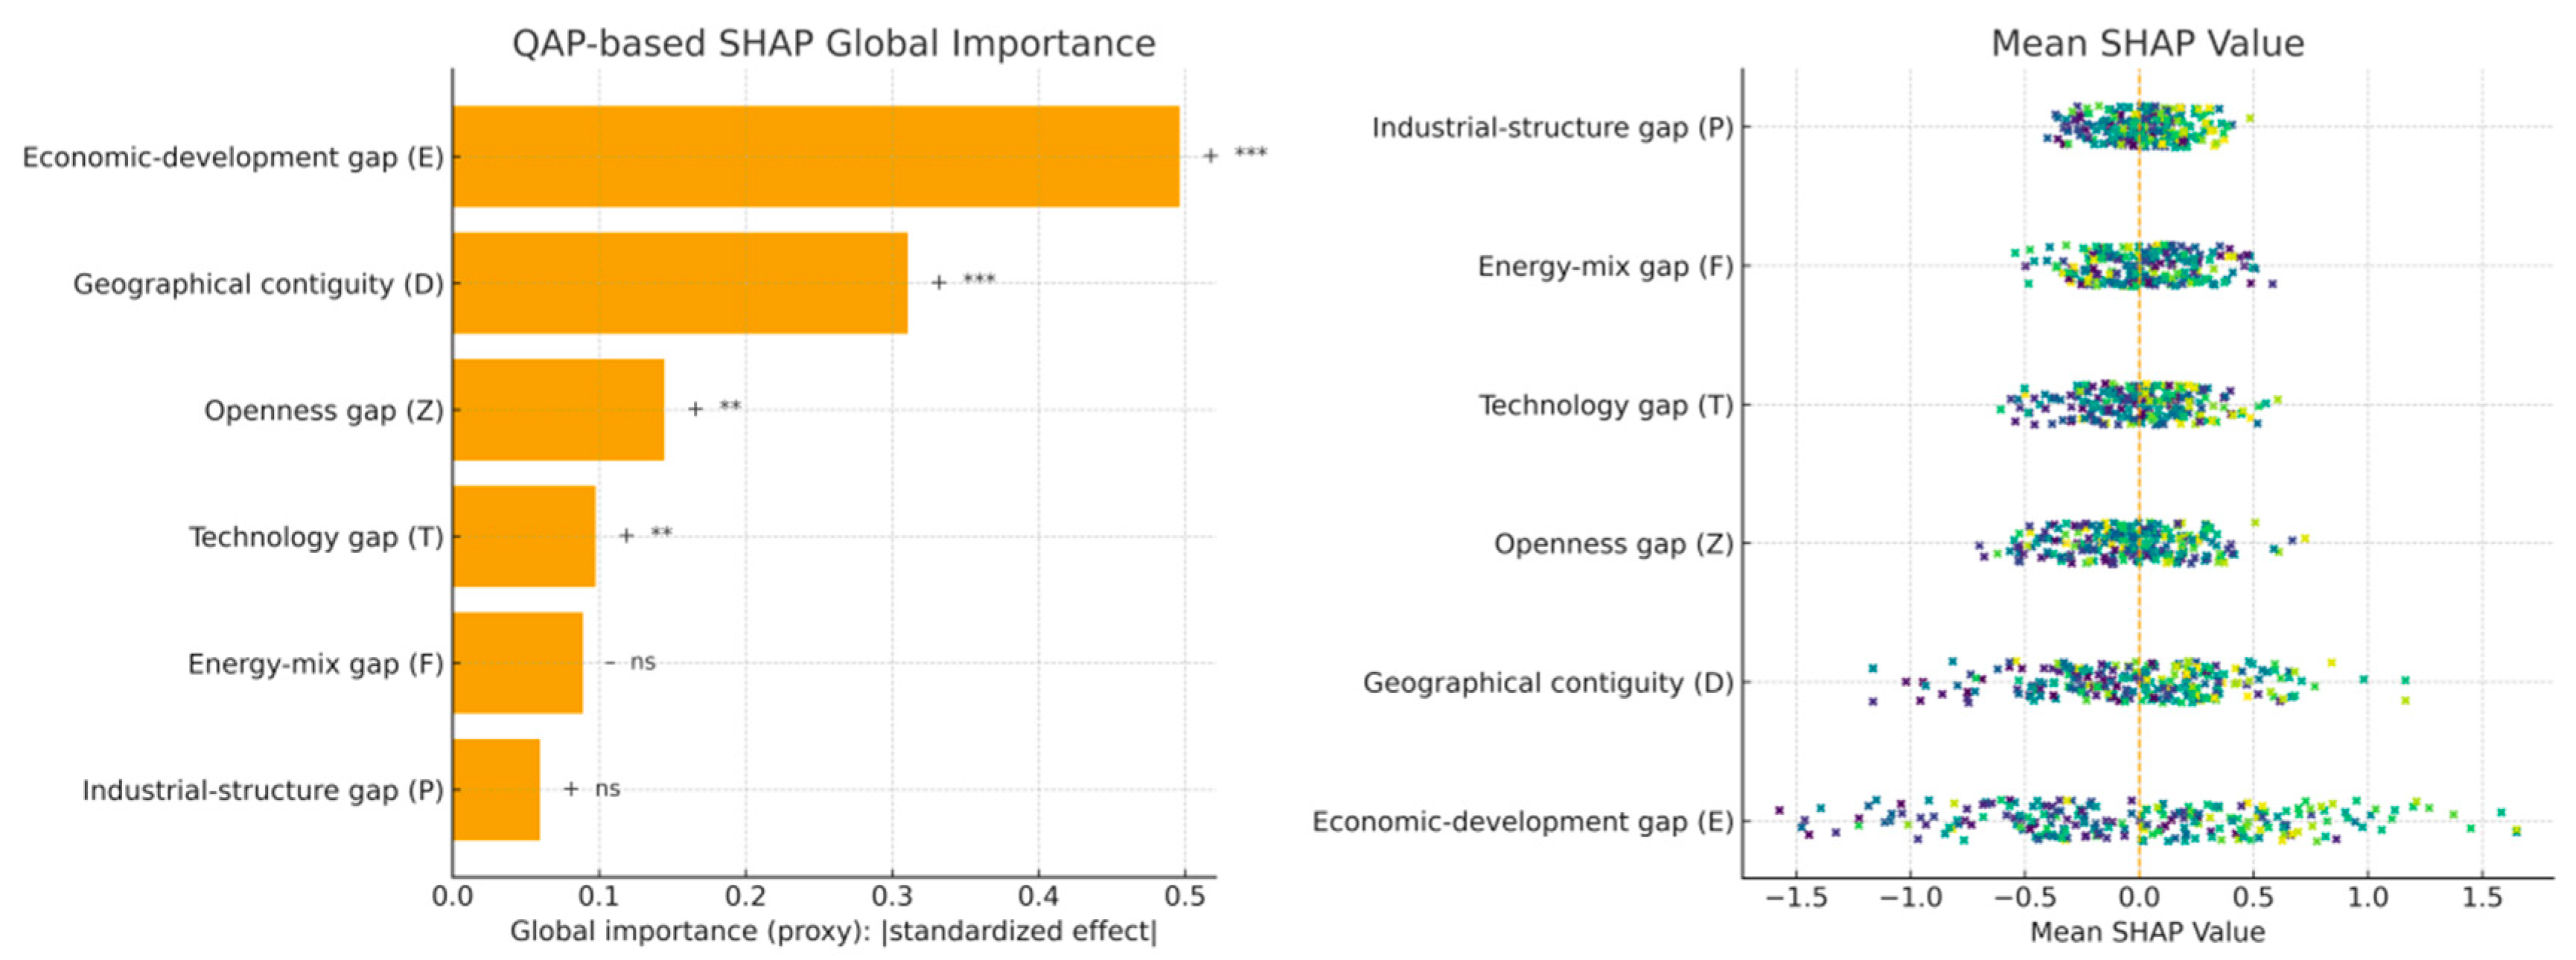
Using UCINET with 5000 permutations, the QAP regression results were obtained, as reported in Table 14. To enhance interpretability beyond permutation-based coefficients, we additionally conduct a SHAP analysis: a supervised surrogate model (gradient-boosted regression) is trained on the vectorized dyadic data (Net ~D, F, P, E, T, Z), and SHAP values are computed to decompose each predictor’s marginal contribution to predicted link intensity. We report a global importance bar chart (mean |SHAP|) together with a beeswarm plot to reveal heterogeneity across dyads; concordance between SHAP rankings and QAP standardized coefficients is used as a robustness check, while any divergences are interpreted as evidence of non-linear or interaction effects in the drivers of embodied carbon link formation (see Figure 22).
According to the QAP regression (Table 8), the model fits well (R2 = 0.561; Adj. R2 = 0.541; overall significant) and isolates several key drivers of the spatial association network of embodied carbon transfers in Western China’s advanced manufacturing. First, geographic contiguity (D) is positive and highly significant (unstandardized 0.2985; standardized 0.3107; p < 0.01), indicating that adjacent provinces exchange embodied carbon more intensively—consistent with the mechanism of shorter transport distance → lower factor/intermediate-goods flow costs → tighter interprovincial supply chain coupling. Second, economic development differentials (E) are both statistically and economically dominant (0.9018; 0.4961; p < 0.01), suggesting that greater interprovincial divergence more readily generates a “core–periphery” structure—where high-end manufacturing attracts factors and induces upstream intermediate-goods spillovers—thereby strengthening cross-province embodied carbon transfers along the supply chain. Third, openness differentials (Z) and technology differentials (T) are also positive and significant at the 5% level (Z: 0.2421; 0.1445; p = 0.041; T: 0.1878; 0.0976; p = 0.028), implying that higher openness gradients position the more open provinces as “gateway nodes” linking external demand with domestic interprovincial supply chains, while technology gaps—amid incomplete diffusion of clean technologies—encourage vertical specialization and cross-province collaboration in intermediates, raising the intensity of embodied carbon transmission. By contrast, energy-mix differentials (F) are negative but not significant (−0.1627; −0.0889; p = 0.152), hinting that convergence/cleaning of provincial energy mixes may facilitate network coupling but—with structural inertia—lacks strong statistical support in the sample window; industrial-structure differentials (P) are positive yet insignificant (p = 0.238), indicating limited marginal explanatory power once E/Z/T are controlled. Ranking by standardized effects yields E (0.4961) > D (0.3107) > Z (0.1445) > T (0.0976) (all significant), with F and P not significant.
SHAP diagnostics corroborate these findings: the global importance (mean |SHAP|) follows the same ordering (E > D > Z > T), while the beeswarm indicates predominantly positive contributions of D, E, Z, and T across dyads, a negative median contribution for F concentrated among coal-heavy pairs, and uniformly small effects for P. SHAP partial-dependence patterns are monotonic for D and E (stronger contiguity and larger economic gaps raise predicted link intensity), with weaker but positive lift for Z and T, reinforcing the QAP interpretation. Policy-wise, geographic contiguity and economic divergence emerge as first-order forces strengthening the network, with openness and technology gradients providing a secondary positive push. Accordingly, coordinated low-carbon governance should prioritize corridor-type provincial pairs for clean-technology diffusion and energy-mix coordination (thus narrowing F), while leveraging high-quality openness and factor-flow governance to steer supply chain specialization toward lower-carbon, more proximal configurations—ultimately dampening both the intensity and the emission content of cross-province embodied carbon transfers.
4. Discussion

This study links mechanisms to outcomes in three steps. First, historical accounting (2007–2017) and GRA consistently indicate that energy mix/intensity and output scale are the dominant amplifiers of provincial and sectoral footprints, whereas technology upgrading (process efficiency, electrification) is the most robust mitigator. The sectoral hierarchy is structural: S2 (non-metallic minerals) remains clinker- and heat-intensive, S3 (general/special equipment) operates as a mid-chain hub that converts upstream materials into capital goods, and S6/S7 (electrical machinery/instruments) exhibit lower, more controllable intensities when the power system decarbonizes. Second, forecasts to 2030 reveal a denser, more centralized embodied carbon network, with Sichuan–Chongqing–Guizhou–Guangxi forming high-betweenness corridors. QAP/SHAP diagnostics align on geographic contiguity (D) and economic differentials (E) as the strongest positive drivers, with openness (Z) and technology gaps (T) providing secondary lift; energy-mix differentials (F) dampen link strength but are statistically weak, and industrial-structure differentials (P) add little once E/Z/T are controlled. These mechanisms explain rising trajectories in Qinghai, Guizhou, and Chongqing (fast-growing, energy-intensive chains) versus steadier paths where early power-mix improvements and process retrofits paired with balanced output growth.
Practical significance follows directly from the network geometry: because embodied exchanges concentrate on a few hub-and-corridor structures, edge-focused interventions yield outsized returns. Priority measures include long-term green-power PPAs and interprovincial green-power trade for advanced-manufacturing parks in hub provinces; deep retrofits in S2/S3 (low-clinker binders, waste-heat recovery, high-efficiency drives, targeted CCUS at high-purity streams); and corridor compacts that synchronize supplier standards (energy use, waste-heat reuse, disclosure) so that openness transmits low-carbon practices rather than high-carbon activity. Provinces nearing targets should lock in gains via performance-based energy quotas and staged electrification aligned with grid decarbonization; overshoot provinces should accelerate power-mix shifts and process retrofits before pursuing further scale expansion.
Limitations centre on data vintage and structural sensitivity. The latest benchmark IO/MRIO tables used for RAS–CE completion are 2017, i.e., 7–8 years old relative to the present and the 2030 horizon; forecasts therefore inherit a lagged structural prior. While RAS–CE preserves accounting identities and minimizes divergence from official margins, residual uncertainty persists around post-2017 price/technology shifts, sector aggregation (seven sectors), treatment of sparse/zero cells, and potential structural breaks (policy shocks, rapid tech diffusion). The WOA–GNN, although outperforming statistical baselines in nested tests, remains a data-driven learner and thus sensitive to these changes. Future research should: (i) nowcast IO/MRIO annually using high-frequency indicators (unit-level power dispatch by fuel, clinker/cement output, freight flows) to refresh structure beyond 2017; (ii) report uncertainty envelopes that combine statistical confidence with structural bounds from alternative completions (e.g., Bayesian or regularized balancing), systematic margin perturbations, and entropy-distance diagnostics; (iii) run scenario experiments (accelerated grid decarbonization, rapid clinker substitution, corridor-level procurement mandates) to stress-test network responses; (iv) extend to temporal/multiplex networks (province–sector–firm) with backbone extraction to track evolving corridors; and (v) deploy model ensembles (WOA–GNN with linear/ARIMA/tree-based baselines) and SHAP/causal tools to enhance robustness and policy interpretability.

5. Conclusions

By integrating conservative MRIO completion (RAS–CE), rigorous footprint/transfer accounting, factor diagnosis (GRA), explainable forecasting (WOA–GNN + SHAP), and network econometrics (QAP), this study provides a coherent, policy-oriented picture of Western China’s advanced manufacturing carbon landscape. The central message is clear: energy mix/intensity and technology upgrading determine both the level and slope of footprints, while embodied carbon exchanges concentrate along a few provincial corridors—implying that targeted, chain-specific actions can close 2030 gaps more efficiently than uniform controls.
Determinants and patterns. Energy factors and output scale are the primary amplifiers; technology is the leading mitigator. S2 dominates emissions structurally; S3 acts as a transmission hub; S6/S7 are manageable under power decarbonization. The 2030 network is denser, more centralized, with Sichuan–Chongqing–Guizhou–Guangxi as pivotal corridors. QAP/SHAP rank drivers E > D > Z > T (positive), with F negative and P weak.
Research value and assessment. Methodologically, the pipeline links data completion, accounting, forecasting, and explainable network diagnosis—advancing the literature beyond standalone MRIO or forecasting studies. Substantively, it translates complex patterns into actionable levers (energy vs. technology vs. scale; hubs vs. edges). Limitations arise from 2017-vintage IO/MRIO and potential post-2017 structural shifts, which we address via cross-checks and propose to mitigate with future nowcasting and uncertainty envelopes.
Recommendations. Focus on corridor-level co-governance (green-power PPAs and interprovincial green-power trade for industrial parks), deep retrofits in S2/S3 (low-clinker binders, waste-heat recovery, high-efficiency drives, selective CCUS), and green procurement with supplier upgrading along hub corridors. Provinces nearing targets should lock in performance with energy quotas and electrification tied to grid decarbonization; overshoot provinces should prioritize power-mix acceleration and process efficiency before scale expansion. Concurrently, institutionalize regular MRIO updates/nowcasts and publish uncertainty-aware results to strengthen transparency, credibility, and policy uptake.
Overall, the study demonstrates that aligning energy and technology levers with corridor-focused governance offers the most efficient path to curb both local emissions and propagated embodied carbon in Western China’s advanced manufacturing by 2030.

Author Contributions

Methodology, Y.L.; Software, Y.L.; Formal analysis, Z.H.; Resources, Y.Z.; Data curation, Z.H.; Writing—original draft, Y.L.; Supervision, Y.Z.; Funding acquisition, Y.Z. All authors have read and agreed to the published version of the manuscript.

Funding

This research was funded by the Humanities and Social Science Fund of the Ministry of Education of China (Grant No. 23XJA630006), Chongqing Natural Science Foundation Project (Grant No. CSTB2023NSCQ-MSX0380), and Chongqing Normal University Graduate Research Innovation Project (Grant No. YKC24016).

Institutional Review Board Statement

Not applicable.

Informed Consent Statement

Not applicable.

Data Availability Statement

The data presented in this study are available on request from the corresponding author.

Conflicts of Interest

The authors declare no conflict of interest.

References

  1. Qu, Z.; Yan, L.; Zhu, B.; Deng, Y. Research progress in the application of ecological footprint theory: Review and reflection. Theory Monthly 2011, 47–49. [Google Scholar]
  2. Cai, W.; Li, D.; Qian, J.; Ceng, Q. Carbon footprint analysis of LNG-powered ships under methane leakage based on H-LCA. Navig. China 2024, 47, 123–129. [Google Scholar]
  3. Yang, G. Carbon footprint accounting of forged steel products based on life cycle assessment. Forg. Stamp. Technol. 2024, 49, 176–179. [Google Scholar]
  4. Zhang, C.; Sun, Y.; Xia, Y.; Wang, C.; Zhang, X.; Zhu, G.; Zhao, P.; Fang, H. Carbon footprint assessment and emission reduction strategies for buried pipeline repair technologies. Chin. J. Environ. Eng. 2025, 19, 998–1010. [Google Scholar]
  5. Zhang, J.; Zhou, L.; Zhou, J.; Wu, W.; Wu, Y. Life cycle carbon footprint accounting and evaluation of typical contaminated site risk control technologies. China Environ. Sci. 2025, 45, 2932–2940. [Google Scholar]
  6. Liu, M.; Wen, J.; Meng, Y.; Yang, X.; Wang, J.; Wu, J.; Chen, H. Carbon emission structure decomposition analysis of manufacturing industry from the perspective of input–output subsystem: A case study of China. Environ. Sci. Pollut. Res. 2023, 30, 19012–19029. [Google Scholar] [CrossRef]
  7. Su, B.; Ang, B.W.; Li, Y. Input–output and structural decomposition analysis of Singapore’s carbon emissions. Energy Policy 2017, 105, 484–492. [Google Scholar] [CrossRef]
  8. Huang, M.; Li, W.; Lu, Z.; Kang, Z. Carbon footprint and embodied carbon transfer of urban agglomerations in the Yellow River Basin. China Environ. Sci. 2024, 44, 3544–3552. [Google Scholar]
  9. Wang, J.; Yang, S.; Dong, K.; Nepal, R. Assessing embodied carbon emission and its drivers in China’s ICT sector: Multi-regional input–output and structural decomposition analysis. Energy Policy 2024, 186, 114008. [Google Scholar] [CrossRef]
  10. Yang, W.; Gao, H.; Yang, Y.; Liao, J. Embodied carbon in China’s export trade: A multi-region input–output analysis. Int. J. Environ. Res. Public Health 2022, 19, 3894. [Google Scholar] [CrossRef]
  11. Li, W.; Jia, Z.; Li, G.; Su, B. Cross-scale characteristics and emission reduction pathways of trade-embodied carbon flows in the global supply chains. Sustain. Futures 2024, 8, 100290. [Google Scholar] [CrossRef]
  12. Li, W.; Wang, Q.; Jin, B.; Li, G.; Su, B. Multiregional input–output analysis of carbon transfer in interprovincial trade and sectoral strategies for mitigation: Case study of Shanxi Province in China. J. Clean. Prod. 2023, 391, 136220. [Google Scholar] [CrossRef]
  13. Yang, Z.; Fang, G.; Sun, W. Embodied carbon emissions and their transfer pathways in global aluminum trade: The value chain perspective. J. Clean. Prod. 2025, 494, 145057. [Google Scholar] [CrossRef]
  14. Wang, Y.; Xiong, S.; Ma, X. Carbon inequality in global trade: Evidence from the mismatch between embodied carbon emissions and value added. Ecol. Econ. 2022, 195, 107398. [Google Scholar] [CrossRef]
  15. Li, G.; Yang, Z.; Yang, H. A new hybrid short-term carbon emissions forecasting model for aviation industry in China. Alex. Eng. J. 2023, 68, 93–110. [Google Scholar] [CrossRef]
  16. Wang, H.; Wei, Z.; Fang, T.; Xie, Q.; Li, R.; Fang, D. Carbon emissions prediction based on the GIOWA combination forecasting model: A case study of China. J. Clean. Prod. 2024, 445, 141340. [Google Scholar] [CrossRef]
  17. Gao, M.; Yang, H.; Xiao, Q.; Goh, M. A novel fractional grey Riccati model for carbon emission forecasting. J. Clean. Prod. 2021, 282, 124471. [Google Scholar] [CrossRef]
  18. Liu, J.B.; Yuan, X.Y.; Lee, C.C. Forecasting of carbon emissions in China’s construction industry using an improved grey forecasting model. Sci. Total Environ. 2024, 938, 173351. [Google Scholar] [CrossRef]
  19. Bai, J.; Sun, R.; Liu, Y.; Chen, J.; Li, X. Integrating ecological and recreational functions to optimize ecological security pattern in Fuzhou City. Sci. Rep. 2025, 15, 778. [Google Scholar] [CrossRef]
  20. Lesur, O.; Segal, E.D.; Rego, K.; Mercat, A.; Asfar, P.; Chagnon, F. Process-specific blood biomarkers and outcomes in COVID-19 versus non-COVID-19 ARDS (APEL–COVID study): A prospective, observational cohort study. J. Clin. Med. 2024, 13, 5919. [Google Scholar] [CrossRef]
  21. Tang, Z.; Yu, H.; Zou, J. Analysis of the interprovincial embodied carbon flow network of China’s exports. PLoS ONE 2022, 17, e0275286. [Google Scholar] [CrossRef]
  22. Deng, G.; Chen, H.; Qian, J. Analysis of the characteristics and influencing factors of China’s embodied energy flow network. J. Renew. Sustain. Energy 2023, 15, 065901. [Google Scholar] [CrossRef]
  23. Xia, C.; Wang, C.; Fan, Y.; An, K.; Wang, Y.; Song, J.; Zhang, H.; Du, P.; Meng, J.; Shan, Y.; et al. Heterogeneity in carbon footprint trends and trade-induced emissions in China’s urban agglomerations. Commun. Earth Environ. 2025, 6, 723. [Google Scholar] [CrossRef]
  24. Yuan, X.; Sheng, X.; Chen, L.; Tang, Y.; Li, Y.; Jia, Y.; Qu, D.; Wang, Q.; Ma, Q.; Zuo, J. Carbon footprint and embodied carbon transfer at the provincial level of the Yellow River Basin. Sci. Total Environ. 2022, 803, 149993. [Google Scholar] [CrossRef] [PubMed]
  25. Xing, Z.; Jiao, Z.; Wang, H. Carbon footprint and embodied carbon transfer at city level: A nested MRIO analysis of Central Plain urban agglomeration in China. Sustain. Cities Soc. 2022, 83, 103977. [Google Scholar] [CrossRef]
  26. Guo, X.; Cai, Y.; Ren, D. Research on carbon footprint of lithium battery life cycle considering carbon transfer. J. Energy Storage 2025, 122, 116638. [Google Scholar] [CrossRef]
  27. Xu, D.; Zhang, Y.; Chen, B.; Bai, J.; Liu, G.; Zhang, B. Identifying the critical paths and sectors for carbon transfers driven by global consumption in 2015. Appl. Energy 2022, 306, 118137. [Google Scholar] [CrossRef]
  28. Cui, Y.; Khan, S.U.; Sauer, J.; Zhao, M. Exploring the spatiotemporal heterogeneity and influencing factors of agricultural carbon footprint and carbon footprint intensity: Embodying carbon sink effect. Sci. Total Environ. 2022, 846, 157507. [Google Scholar] [CrossRef]
  29. Shang, W.-L.; Chen, Y.; Yu, Q.; Song, X.; Chen, Y.; Ma, X.; Chen, X.; Tan, Z.; Huang, J.; Ochieng, W. Spatio-temporal analysis of carbon footprints for urban public transport systems based on smart card data. Appl. Energy 2023, 352, 121859. [Google Scholar] [CrossRef]
  30. Li, M.; Li, Q.; Wang, Y.; Chen, W. Spatial path and determinants of carbon transfer in the process of interprovincial industrial transfer in China. Environ. Impact Assess. Rev. 2022, 95, 106810. [Google Scholar] [CrossRef]
  31. Ouellet-Plamondon, C.M.; Ramseier, L.; Balouktsi, M.; Delem, L.; Foliente, G.; Francart, N.; Garcia-Martinez, A.; Hoxha, E.; Lützkendorf, T.; Rasmussen, F.N.; et al. Carbon footprint assessment of a wood multi-residential building considering biogenic carbon. J. Clean. Prod. 2023, 404, 136834. [Google Scholar] [CrossRef]
  32. Steubing, B.; de Koning, A.; Merciai, S.; Tukker, A. How do carbon footprints from LCA and EEIOA databases compare? A comparison of ecoinvent and EXIOBASE. J. Ind. Ecol. 2022, 26, 1406–1422. [Google Scholar] [CrossRef]
  33. Xu, W.-H.; Xie, Y.-L.; Ji, L.; Cai, Y.-P.; Yang, Z.-F.; Xia, D.-H. Spatial–temporal evolution and driving forces of provincial carbon footprints in China: An integrated EE-MRIO and WA-SDA approach. Ecol. Eng. 2022, 176, 106543. [Google Scholar] [CrossRef]
  34. Bouza, L.; Bugeau, A.; Lannelongue, L. How to estimate carbon footprint when training deep learning models? A guide and review. Environ. Res. Commun. 2023, 5, 115014. [Google Scholar] [CrossRef] [PubMed]
  35. Liu, J.; Zhuang, Y.; Wang, C.; Du, J. Life cycle carbon footprint assessment of coal-to-SNG/methanol polygeneration process. Sci. Total Environ. 2024, 908, 168409. [Google Scholar] [CrossRef] [PubMed]
  36. Dong, H.; Zhang, L. Transition towards carbon neutrality: Forecasting Hong Kong’s buildings carbon footprint by 2050 using a machine learning approach. Sustain. Prod. Consum. 2023, 35, 633–642. [Google Scholar] [CrossRef]
  37. Nie, W.; Ao, O.; Duan, H. A novel grey prediction model with a feedforward neural network based on a carbon emission dynamic evolution system and its application. Environ. Sci. Pollut. Res. 2023, 30, 20704–20720. [Google Scholar] [CrossRef]
  38. Zhang, W.; Zhang, X.; Liu, F.; Huang, Y.; Xie, Y. Evaluation of the urban low-carbon sustainable development capability based on the TOPSIS-BP neural network and grey relational analysis. Complexity 2020, 2020, 6616988. [Google Scholar] [CrossRef]
  39. Duan, H.; He, C.; Pu, S. A new circular neural grey model and its application to CO2 emissions in China. J. Clean. Prod. 2024, 445, 141318. [Google Scholar] [CrossRef]
  40. Yang, M.; Liu, Y. Research on the potential for China to achieve carbon neutrality: A hybrid forecasting model integrated with Elman neural network and sparrow search algorithm. J. Environ. Manag. 2023, 329, 117081. [Google Scholar] [CrossRef]
  41. Hu, Y.; Lv, K. Hybrid forecasting model for the interindustry carbon emissions transfer network based on the grey model and general vector machine. IEEE Access 2020, 8, 20616–20627. [Google Scholar] [CrossRef]
  42. Uzlu, E. Estimates of greenhouse gas emission in Turkey with grey wolf optimizer algorithm-optimized artificial neural networks. Neural Comput. Appl. 2021, 33, 13567–13585. [Google Scholar] [CrossRef]
  43. Wu, S.; Zeng, X.; Li, C.; Cang, H.; Tan, Q.; Xu, D. CO2 emission forecasting based on nonlinear grey Bernoulli and BP neural network combined model. Soft Comput. 2023, 27, 15509–15521. [Google Scholar] [CrossRef]
  44. He, C.; Duan, H.; Liu, Y. A neural network grey model based on dynamical system characteristics and its application in predicting carbon emissions and energy consumption in China. Expert Syst. Appl. 2025, 266, 126101. [Google Scholar] [CrossRef]
  45. Wan, G.; Li, X.; Yin, K.; Zhao, Y. Forecasting carbon emissions from energy consumption in Guangdong Province, China with a novel grey multivariate model. Environ. Sci. Pollut. Res. 2022, 29, 59534–59546. [Google Scholar] [CrossRef] [PubMed]
  46. Yuan, H.; Ma, X.; Ma, M.; Ma, J. Hybrid framework combining grey system model with Gaussian process and STL for CO2 emissions forecasting in developed countries. Appl. Energy 2024, 360, 122824. [Google Scholar] [CrossRef]
  47. Zhou, W.; Zeng, B.; Wang, J.; Luo, X.; Liu, X. Forecasting Chinese carbon emissions using a novel grey rolling prediction model. Chaos Solitons Fractals 2021, 147, 110968. [Google Scholar] [CrossRef]
  48. Jin, Y.; Sharifi, A.; Li, Z.; Chen, S.; Zeng, S.; Zhao, S. Carbon emission prediction models: A review. Sci. Total Environ. 2024, 927, 172319. [Google Scholar] [CrossRef]
  49. Wang, M.; Wu, L.; Guo, X. Application of grey model in influencing factors analysis and trend prediction of carbon emission in Shanxi Province. Environ. Monit. Assess. 2022, 194, 542. [Google Scholar] [CrossRef]
  50. Cai, K.; Wu, L. Grey prediction of carbon emission and carbon peak in several developing countries. Eng. Appl. Artif. Intell. 2024, 133, 108210. [Google Scholar] [CrossRef]
  51. Li, Y.; Chen, Y.; Wang, Y. Grey forecasting the impact of population and GDP on the carbon emission in a Chinese region. J. Clean. Prod. 2023, 425, 139025. [Google Scholar] [CrossRef]
  52. Ding, S.; Ye, J.; Cai, Z. Multi-step carbon emissions forecasting using an interpretable framework of new data preprocessing techniques and improved grey multivariable convolution model. Technol. Forecast. Soc. Change 2024, 208, 123720. [Google Scholar] [CrossRef]
  53. Parikh, A. Forecasts of input–output matrices using the RAS method. Rev. Econ. Stat. 1979, 61, 477–481. [Google Scholar] [CrossRef]
  54. Holý, V.; Šafr, K. Disaggregating input–output tables by the multidimensional RAS method: A case study of the Czech Republic. Econ. Syst. Res. 2023, 35, 95–117. [Google Scholar] [CrossRef]
  55. Beaufils, T.; Wenz, L. A scenario-based method for projecting multi-regional input–output tables. Econ. Syst. Res. 2022, 34, 440–468. [Google Scholar] [CrossRef]
  56. Xia, X.; Huang, J.; Zhu, X. Augmenting input–output system under the curse of dimensionality: AHP–RAS integration and algorithm simulation. Appl. Econ. 2024, 57, 3811–3826. [Google Scholar] [CrossRef]
  57. Liu, C.; Wang, X.; Li, H. Multiscale exploration of spatiotemporal dynamics and decoupling effects of carbon emissions in China. Sci. Rep. 2025, 15, 16554. [Google Scholar] [CrossRef]
  58. Dong, Z.; Zhang, Z.; Zhang, F. Coupling coordination development of energy–economy–carbon emissions in China under the background of “double carbon”. PLoS ONE 2022, 17, e0277828. [Google Scholar] [CrossRef]
  59. Qiao, F.; Yang, Q.; Shi, W.; Yang, X.; Ouyang, G.; Zhao, L. Research on driving mechanism and prediction of electric power carbon emission in Gansu Province under dual-carbon target. Sci. Rep. 2024, 14, 6103. [Google Scholar] [CrossRef]
  60. Bai, M.; Li, C. Study on the spatial correlation effects and influencing factors of carbon emissions from the electricity industry: Fresh evidence from China. Environ. Sci. Pollut. Res. 2023, 30, 113364–113381. [Google Scholar] [CrossRef]
  61. Zhou, H.; Kong, Y.; Liu, S.; Feng, S. Can global value chains embedment reduce carbon emissions embodied in exports? Empirical test based on the manufacturing industries. Int. J. Environ. Res. Public Health 2022, 19, 16458. [Google Scholar] [CrossRef]
Figure 1. Whale Optimization Algorithm–Grey Neural Network forecasting model logical flowchart.
Sustainability 17 10272 g001
Figure 2. Technical route of the integrated modelling.
Sustainability 17 10272 g002
Figure 3. Carbon footprint in Western China’s advanced manufacturing industry from 2007 to 2017: (a) provincial; (b) sectoral.
Sustainability 17 10272 g003
Figure 4. Provincial GRA associations (γ) for carbon-footprint drivers, Western China (2007–2017).
Sustainability 17 10272 g004
Figure 5. Sectoral GRA associations (γ) for carbon-footprint drivers, Western China (2007–2017).
Sustainability 17 10272 g005
Figure 6. Interprovincial embodied carbon transfers in Western China’s advanced manufacturing industry: (a) 2007; (b) 2017.
Sustainability 17 10272 g006
Figure 7. Intersectoral embodied carbon transfers in Western China’s advanced manufacturing industry: (a) 2007; (b) 2017.
Sustainability 17 10272 g007
Figure 8. Forecast accuracy comparison (normalized 0–1) across MAE, RMSE, MAPE, and R2: WOA–GNN vs. PSO-GM, GA-BP, Linear Regression, and ARIMA (The arrows in parentheses indicate the direction of better performance, with ↓ denoting “lower is better” and ↑ denoting “higher is better”).
Sustainability 17 10272 g008
Figure 9. WOA–GNN ablation: component contributions to forecast accuracy.
Sustainability 17 10272 g009
Figure 10. Forecasting performance of WOA–GNN model.
Sustainability 17 10272 g010
Figure 11. Provincial carbon footprint of advanced manufacturing in Western China (2018–2030): Scatter, Fitted Trend, and 95% Confidence Bands.
Sustainability 17 10272 g011
Figure 12. Sectoral carbon footprint of advanced manufacturing in Western China (2018–2030): Scatter, Fitted Trend, and 95% Confidence Bands.
Sustainability 17 10272 g012
Figure 13. Interprovincial embodied carbon transfers in Western China’s advanced manufacturing, 2018–2030.
Sustainability 17 10272 g013
Figure 14. Intersectoral embodied carbon transfers in Western China’s advanced manufacturing, 2018–2030.
Sustainability 17 10272 g014
Figure 15. Provincial carbon footprint of advanced manufacturing in Western China (2030): smoothed curve with 95% Confidence Band.
Sustainability 17 10272 g015
Figure 16. Sectoral carbon footprint of advanced manufacturing in Western China (2030): smoothed curve with 95% Confidence Band.
Sustainability 17 10272 g016
Figure 17. The spatial distribution of carbon footprints of advanced manufacturing industries in Western China.
Sustainability 17 10272 g017
Figure 18. Embodied carbon transfers among Western China provinces in advanced manufacturing (2030).
Sustainability 17 10272 g018
Figure 19. Intersectoral embodied carbon transfers—advanced manufacturing (Western China, 2030).
Sustainability 17 10272 g019
Figure 20. The interprovincial embodied carbon transfer network of advanced manufacturing in Western China in 2030.
Sustainability 17 10272 g020
Figure 21. The intersectoral embodied carbon transfer network of advanced manufacturing in Western China in 2030.
Sustainability 17 10272 g021
Figure 22. QAP-based SHAP summary: global importance and mean SHAP values for drivers of the embodied carbon transfer network (Western China, 2030). Note: “+”/“−” indicate positive/negative coefficients; ***, **, and * denote significance at the 1%, 5%, and 10% levels, respectively, while “ns” indicates non-significant results.
Sustainability 17 10272 g022
Table 1. Extrapolation methods for missing-year MRIO data (2007–2017).
Target YearBase Year MatrixExtrapolation Method
20082007Forward Extrapolation (+1 year)
2009, 20112010Linear Interpolation
20132012Forward Extrapolation (+1 year)
20142015Backward Extrapolation (−1 year)
20162017Backward Extrapolation (−1 year)
Table 2. Provincial-level indicator system for carbon-footprint drivers.
Indicator CategoryVariableUnitDirection in GRA
Economic factorsFinal demandCNY 100 millionPositive
Social factorsHousehold consumption share%Positive
Environmental factorsCarbon intensityt CO2e per 10,000 yuanPositive
Energy factorsCoal share%Positive
Technology factorsEfficiency improvement%Negative
Table 3. Sector-level indicator system for carbon-footprint drivers.
Indicator CategoryVariableUnitDirection in GRA
Economic factorsOutput scaleCNY 100 millionPositive
Social factorsHousehold consumption share%Positive
Environmental factorsDirect emission intensityt CO2e per 10,000 yuanPositive
Energy factorsEnergy intensitytce per 10,000 yuanPositive
Technology factorsElectricity share%Negative
Table 4. Definition of variables.
VariableMeaningDefinition
NetSpatial correlation of embodied carbon transferBinary spatial association matrix of embodied carbon transfer links
DijGeographic contiguityAdjacent provinces coded 1, non-adjacent 0
FijEnergy-consumption structure differenceDifference in the coal-based energy share within advanced manufacturing energy use
PijIndustrial structure differenceDifference in the share of advanced manufacturing gross output in GDP
EijEconomic development level differenceDifference in GDP per capita
TijTechnology level differenceDifference in intramural R&D expenditure of advanced manufacturing enterprises
ZijOpenness level differenceDifference in the ratio of realized (actually utilized) FDI to GDP
Table 5. GRA scores of provincial-level influencing factors on the carbon footprint of advanced manufacturing.
ProvinceFinal DemandHousehold Consumption ShareCarbon IntensityCoal ShareEfficiency ImprovementTop 1 (γ)Top 2 (γ)Top 3 (γ)
Inner Mongolia0.7150.5430.6830.7930.517Coal share (γ = 0.793)Final demand (γ = 0.715)Carbon intensity (γ = 0.683)
Guangxi0.5800.5800.4400.6610.628Coal share (γ = 0.661)Efficiency improvement (γ = 0.628)Final demand (γ = 0.580)
Chongqing0.6800.5660.6200.5590.561Final demand (γ = 0.680)Carbon intensity (γ = 0.620)Household consumption share (γ = 0.566)
Sichuan0.4640.6240.5900.6020.458Household consumption share (γ = 0.624)Coal share (γ = 0.602)Carbon intensity (γ = 0.590)
Guizhou0.8620.5920.5490.7420.576Final demand (γ = 0.862)Coal share (γ = 0.742)Household consumption share (γ = 0.592)
Yunnan0.6140.5480.3970.6640.547Coal share (γ = 0.664)Final demand (γ = 0.614)Household consumption share (γ = 0.548)
Shaanxi0.5210.6660.4480.6230.415Household consumption share (γ = 0.666)Coal share (γ = 0.623)Final demand (γ = 0.521)
Gansu0.5270.4840.6970.7210.554Coal share (γ = 0.721)Carbon intensity (γ = 0.697)Efficiency improvement (γ = 0.554)
Qinghai0.6470.5660.7250.7000.443Carbon intensity (γ = 0.725)Coal share (γ = 0.700)Final demand (γ = 0.647)
Ningxia0.4360.6110.8600.7820.538Carbon intensity (γ = 0.860)Coal share (γ = 0.782)Household consumption share (γ = 0.611)
Xinjiang0.7330.5990.5880.6000.719Final demand (γ = 0.733)Efficiency improvement (γ = 0.719)Coal share (γ = 0.600)
Table 6. GRA scores of sectoral-level influencing factors on the carbon footprint of advanced manufacturing.
SectorOutput ScaleHousehold Consumption ShareDirect Emission IntensityEnergy IntensityElectricity ShareTop 1 (γ)Top 2 (γ)Top 3 (γ)
S10.5420.4410.6150.5610.677Electricity share (γ = 0.677)Direct emission intensity (γ = 0.615)Energy intensity (γ = 0.561)
S20.5370.3980.7810.9430.535Energy intensity (γ = 0.943)Direct emission intensity (γ = 0.781)Output scale (γ = 0.537)
S30.6400.4630.4750.5430.464Output scale (γ = 0.640)Energy intensity (γ = 0.543)Direct emission intensity (γ = 0.475)
S40.7050.5450.5800.6990.705Output scale (γ = 0.705)Electricity share (γ = 0.705)Energy intensity (γ = 0.699)
S50.5510.6000.6360.5530.560Direct emission intensity (γ = 0.636)Household consumption share (γ = 0.600)Electricity share (γ = 0.560)
S60.6290.6500.6070.4870.702Electricity share (γ = 0.702)Household consumption share (γ = 0.650)Output scale (γ = 0.629)
S70.5170.5430.6870.7080.780Electricity share (γ = 0.780)Energy intensity (γ = 0.708)Direct emission intensity (γ = 0.687)
Table 7. Carbon footprint of advanced manufacturing industry in western region in 2030 (Unit:Ton).
ProvinceSectorCarbon FootprintProvinceSectorCarbon FootprintProvinceSectorCarbon Footprint
Inner MongoliaS114,607SichuanS6432,950GansuS49072.1
S212,839,000 S714,686 S534,759
S31,002,600GuizhouS139.064 S610,974
S4199,570 S222,819,000 S71297.8
S528,311 S3920,550QinghaiS1117.48
S65600.8 S458,278 S232,533,000
S7181,260 S537,327 S387,300
GuangxiS1662.11 S62895.2 S43064.9
S28,218,300 S77914.8 S51,103,500
S3755,940YunnanS1432.27 S6110,630
S4343,260 S215,767,000 S7149,280
S517,937 S3307,940NingxiaS115.821
S62875.4 S479,110 S27,935,300
S7227.29 S5167,930 S379,332
ChongqingS14183.9 S6781.67 S440,659
S219,417,000 S71139.5 S521,429
S3133,320ShaanxiS1188.54 S60.75734
S41,603,900 S26,284,100 S71049.4
S5118,820 S33,601,800XinjiangS1315,950
S6578,490 S476,960 S25,812,100
S7216,160 S5172,590 S374,938
SichuanS173,409 S660,143 S49882.2
S24,992,600 S7205,170 S51,883,100
S34,370,000GansuS12889.4 S6193,420
S4331,600 S28,574,200 S7335.07
S5315,130 S3318,110
Table 8. Alignment with policy targets (2030).
ProvinceForecast 2030 (MtCO2)Policy Target (2030) (MtCO2)Gap (Forecast − Target) (MtCO2)Pass/Fail
Inner Mongolia14.2715.00−0.73Pass
Guangxi9.348.800.54Fail
Chongqing22.0721.001.07Fail
Sichuan10.5311.00−0.47Pass
Guizhou23.8523.000.85Fail
Yunnan16.3216.000.32Fail
Shaanxi10.4010.70−0.30Pass
Gansu8.959.00−0.05Pass
Qinghai33.9932.001.99Fail
Ningxia8.088.40−0.32Pass
Xinjiang8.298.000.29Fail
Total166.09162.903.19Fail
Table 9. Interprovincial embodied carbon transfer of advanced manufacturing industries in Western China by 2030 (Unit: Ton).
Transfer OutTransfer InEmbodied Carbon TransferTransfer OutTransfer InEmbodied Carbon TransferTransfer OutTransfer InEmbodied Carbon Transfer
Inner MongoliaInner Mongolia25,890,000SichuanQinghai61,239GansuYunnan444,630
Inner MongoliaGuangxi1,496,000SichuanNingxia349,130GansuShaanxi540,730
Inner MongoliaChongqing930,110SichuanXinjiang594,760GansuGansu10,972,000
Inner MongoliaSichuan2,246,500GuizhouInner Mongolia519,200GansuQinghai3,850,200
Inner MongoliaGuizhou1,233,100GuizhouGuangxi1,644,800GansuNingxia217,230
Inner MongoliaYunnan1,384,500GuizhouChongqing880,990GansuXinjiang202,330
Inner MongoliaShaanxi1,863,300GuizhouSichuan2,038,700QinghaiInner Mongolia7732.9
Inner MongoliaGansu517,320GuizhouGuizhou37,135,000QinghaiGuangxi8781.6
Inner MongoliaQinghai75,952GuizhouYunnan1,669,500QinghaiChongqing10,823
Inner MongoliaNingxia458,270GuizhouShaanxi1,614,000QinghaiSichuan41,527
Inner MongoliaXinjiang587,200GuizhouGansu445,540QinghaiGuizhou9743.1
GuangxiInner Mongolia572,280GuizhouQinghai72,720QinghaiYunnan11,938
GuangxiGuangxi42,534,000GuizhouNingxia414,730QinghaiShaanxi35,189
GuangxiChongqing916,600GuizhouXinjiang502,820QinghaiGansu73,721
GuangxiSichuan1,714,700YunnanInner Mongolia93,082QinghaiQinghai5,774,600
GuangxiGuizhou1,675,500YunnanGuangxi565,960QinghaiNingxia19,773
GuangxiYunnan2,375,800YunnanChongqing449,010QinghaiXinjiang8913.5
GuangxiShaanxi1,424,100YunnanSichuan659,180NingxiaInner Mongolia525,490
GuangxiGansu412,670YunnanGuizhou838,520NingxiaGuangxi1,380,700
GuangxiQinghai85,094YunnanYunnan47,942,000NingxiaChongqing788,180
GuangxiNingxia527,780YunnanShaanxi631,020NingxiaSichuan2,246,400
GuangxiXinjiang502,150YunnanGansu157,430NingxiaGuizhou955,500
ChongqingInner Mongolia824,420YunnanQinghai21,606NingxiaYunnan1,114,200
ChongqingGuangxi2,781,600YunnanNingxia217,780NingxiaShaanxi1,745,300
ChongqingChongqing9,819,200YunnanXinjiang139,400NingxiaGansu490,990
ChongqingSichuan7,835,900ShaanxiInner Mongolia792,780NingxiaQinghai131,340
ChongqingGuizhou2,277,900ShaanxiGuangxi851,200NingxiaNingxia17,451,000
ChongqingYunnan2,882,700ShaanxiChongqing1,325,300NingxiaXinjiang1,218,400
ChongqingShaanxi2,345,200ShaanxiSichuan4,915,600XinjiangInner Mongolia86,919
ChongqingGansu584070ShaanxiGuizhou1086400XinjiangGuangxi109500
ChongqingQinghai141,050ShaanxiYunnan1,519,800XinjiangChongqing108,840
ChongqingNingxia770,460ShaanxiShaanxi23,881,000XinjiangSichuan372,780
ChongqingXinjiang1,421,500ShaanxiGansu990,130XinjiangGuizhou173,640
SichuanInner Mongolia306,950ShaanxiQinghai328,760XinjiangYunnan175,150
SichuanGuangxi1,214,700ShaanxiNingxia777,860XinjiangShaanxi741,330
SichuanChongqing1,457,600ShaanxiXinjiang2,599,000XinjiangGansu161,090
SichuanSichuan61,976,000GansuInner Mongolia186,840XinjiangQinghai86,000
SichuanGuizhou952,720GansuGuangxi299,570XinjiangNingxia323,390
SichuanYunnan1,456,500GansuChongqing269,200XinjiangXinjiang14,973,000
SichuanShaanxi1,087,200GansuSichuan447,800
SichuanGansu212,090GansuGuizhou438,820
Table 10. Intersectoral embodied carbon transfer of advanced manufacturing industries in Western China by 2030 (Unit: Ton).
Transfer OutTransfer InEmbodied Carbon TransferTransfer OutTransfer InEmbodied Carbon TransferTransfer OutTransfer InEmbodied Carbon Transfer
S1S11,067,600S3S45,313,000S5S741,714
S1S285,132S3S52,008,400S6S126,963
S1S324,850S3S61,692,900S6S26893.2
S1S426,768S3S7315,490S6S3171,500
S1S538,042S4S1133,420S6S432,221
S1S644,135S4S2146,920S6S561,283
S1S72477.5S4S3518,670S6S64,552,500
S2S133,742,000S4S411,898,000S6S711,768
S2S2247,330,000S4S539,429S7S183,591
S2S310,915,000S4S615,281S7S224,513
S2S45,370,800S4S734,069S7S3333,200
S2S59,484,700S5S1270,380S7S4165,390
S2S610,237,000S5S2199,400S7S5268,930
S2S72,286,500S5S31,328,900S7S656,269
S3S11,900,500S5S4746,960S7S7221,750
S3S21,454,400S5S52,905,600
S3S314,655,000S5S61,209,500
Table 11. Centralities of the interprovincial embodied carbon transfer network of advanced manufacturing in Western China in 2030.
NodeOut-Degree CentralityIn-Degree CentralityDegree Centrality (Total)Betweenness CentralityCloseness Centrality
Inner Mongolia0.4000.0000.2000.0000.000
Guangxi0.2000.9000.5500.0030.909
Chongqing0.4000.9000.6500.2890.909
Sichuan0.2000.9000.5500.0100.909
Guizhou0.4000.4000.4000.2920.588
Yunnan0.3000.0000.1500.0000.000
Shaanxi0.4000.4000.4000.0610.588
Gansu0.4000.1000.2500.1130.385
Qinghai0.4000.1000.2500.0110.303
Ningxia0.4000.0000.2000.0000.000
Xinjiang0.3000.1000.2000.0100.400
Table 12. Centralities of the intersectoral embodied carbon transfer network of advanced manufacturing in Western China in 2030.
NodeOut-Degree CentralityIn-Degree CentralityDegree Centrality (Total)Betweenness CentralityCloseness Centrality
S10.0000.1670.0830.0000.167
S20.0000.0000.0000.0000.000
S30.1670.3330.2500.0000.375
S40.0000.5000.2500.0000.533
S50.3330.1670.2500.0670.167
S60.1670.0000.0830.0000.000
S70.5000.0000.2500.0000.000
Table 13. QAP correlation analysis of influencing factors.
VariableCorrelation CoefficientSignificance LevelMean Correlation CoefficientStandard DeviationMinimumMaximump ≥ 0p ≤ 0
D0.2710.016−0.0020.117−0.3830.3940.0160.995
F−0.3190.0000.0010.157−0.3190.5671.0000.000
P0.2640.0220.0010.122−0.3300.4770.0220.978
E0.6060.000−0.0010.139−0.3290.5400.0001.000
T0.2600.061−0.0010.149−0.3470.5410.0610.939
Z0.3610.0230.0000.162−0.3010.4880.0230.997
Table 14. QAP regression analysis results.
VariableUnstandardized CoefficientStandardized CoefficientSignificance (p-Value)Probability 1Probability 2
Intercept−0.25100.0000
D+0.2985+0.31070.0000 ***0.00001.0000
F−0.1627−0.08890.1520 ns0.84800.1520
P+0.1054+0.05960.2380 ns0.23800.7620
E+0.9018+0.49610.0000 ***0.00001.0000
T+0.1878+0.09760.0280 **0.02800.9720
Z+0.2421+0.14450.0410 **0.04100.9590
R2+0.56100.0000
Adj R2+0.54100.0000
Sample size110
Note: “+”/“−” indicate positive/negative coefficients; ***, **, and * denote significance at the 1%, 5%, and 10% levels, respectively, while “ns” indicates non-significant results.
Disclaimer/Publisher’s Note: The statements, opinions and data contained in all publications are solely those of the individual author(s) and contributor(s) and not of MDPI and/or the editor(s). MDPI and/or the editor(s) disclaim responsibility for any injury to people or property resulting from any ideas, methods, instructions or products referred to in the content.