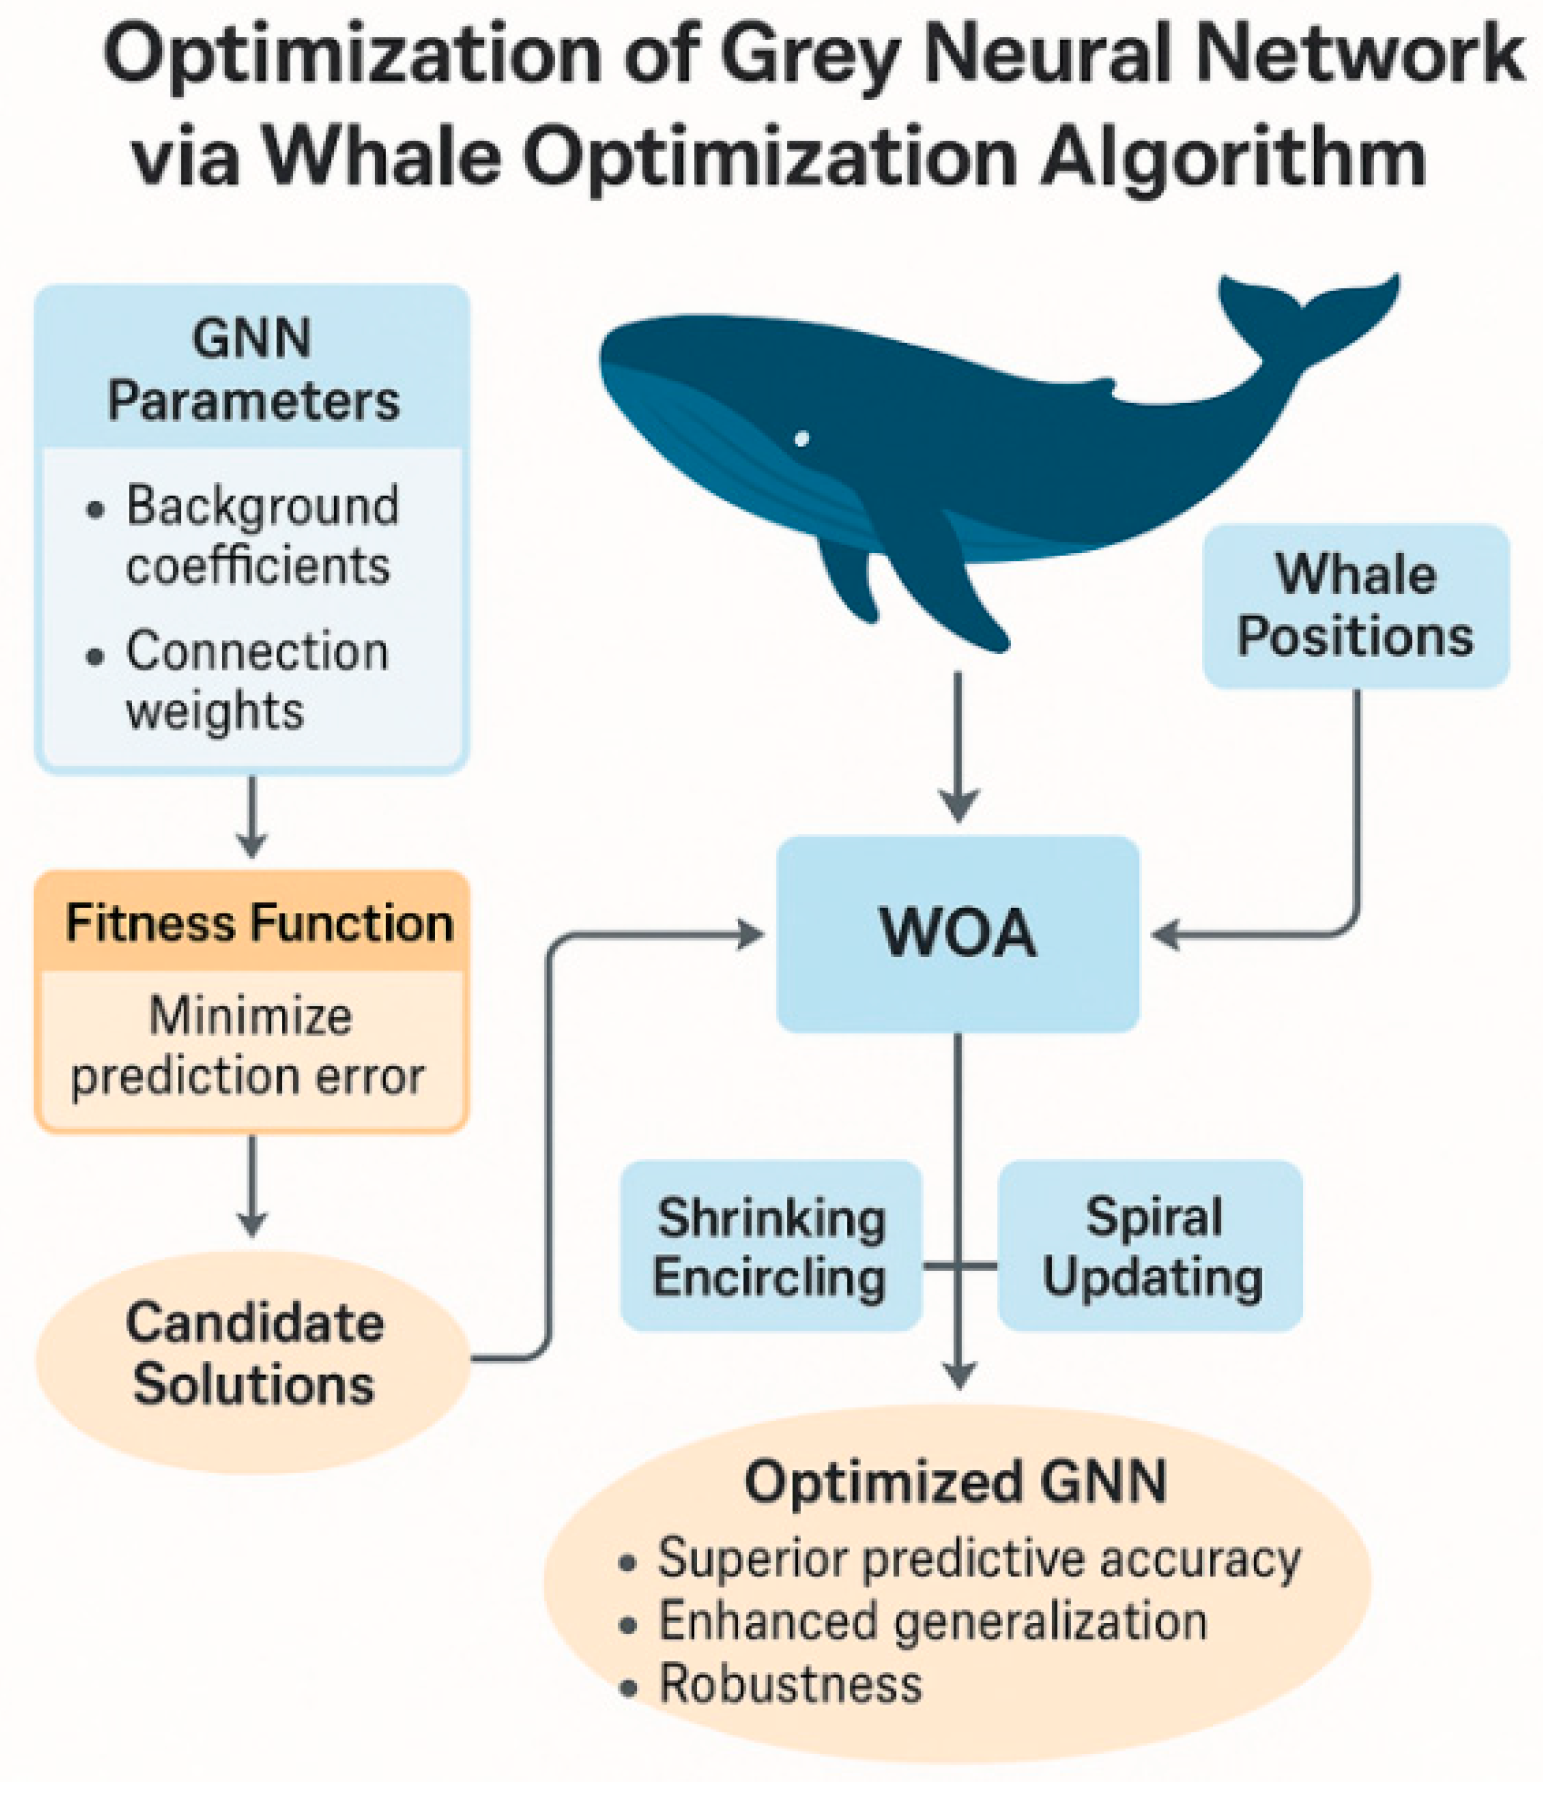
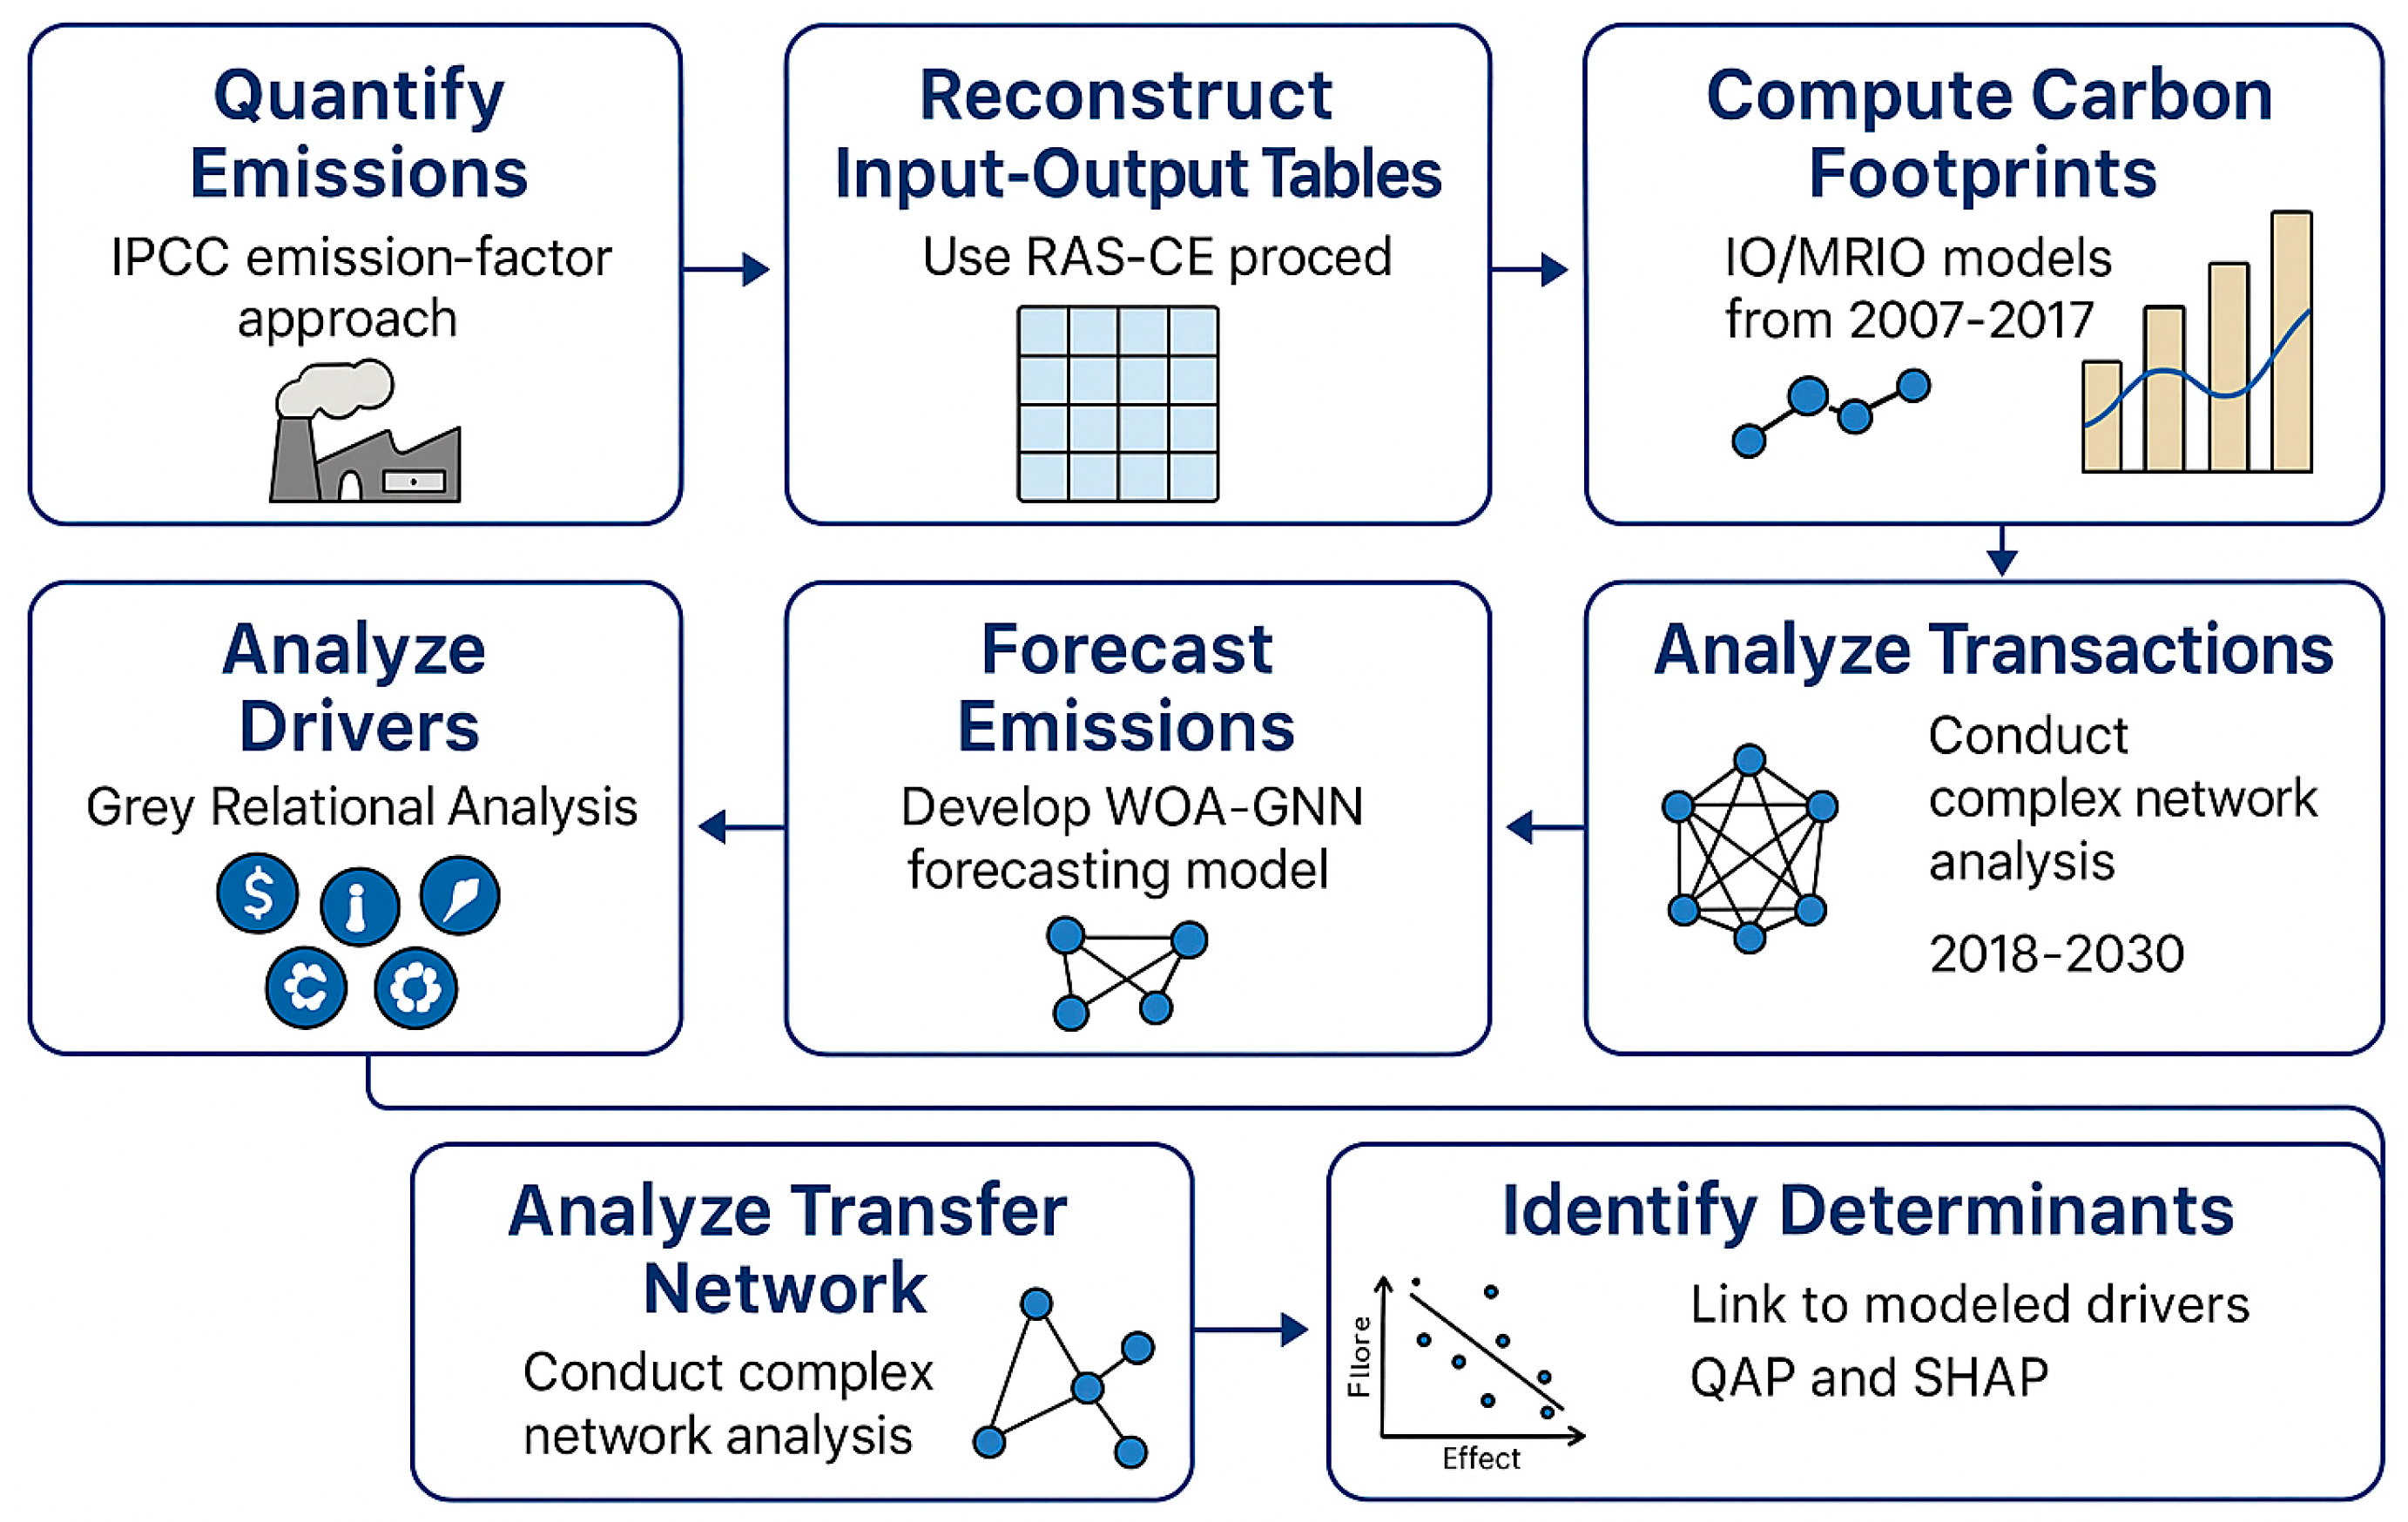
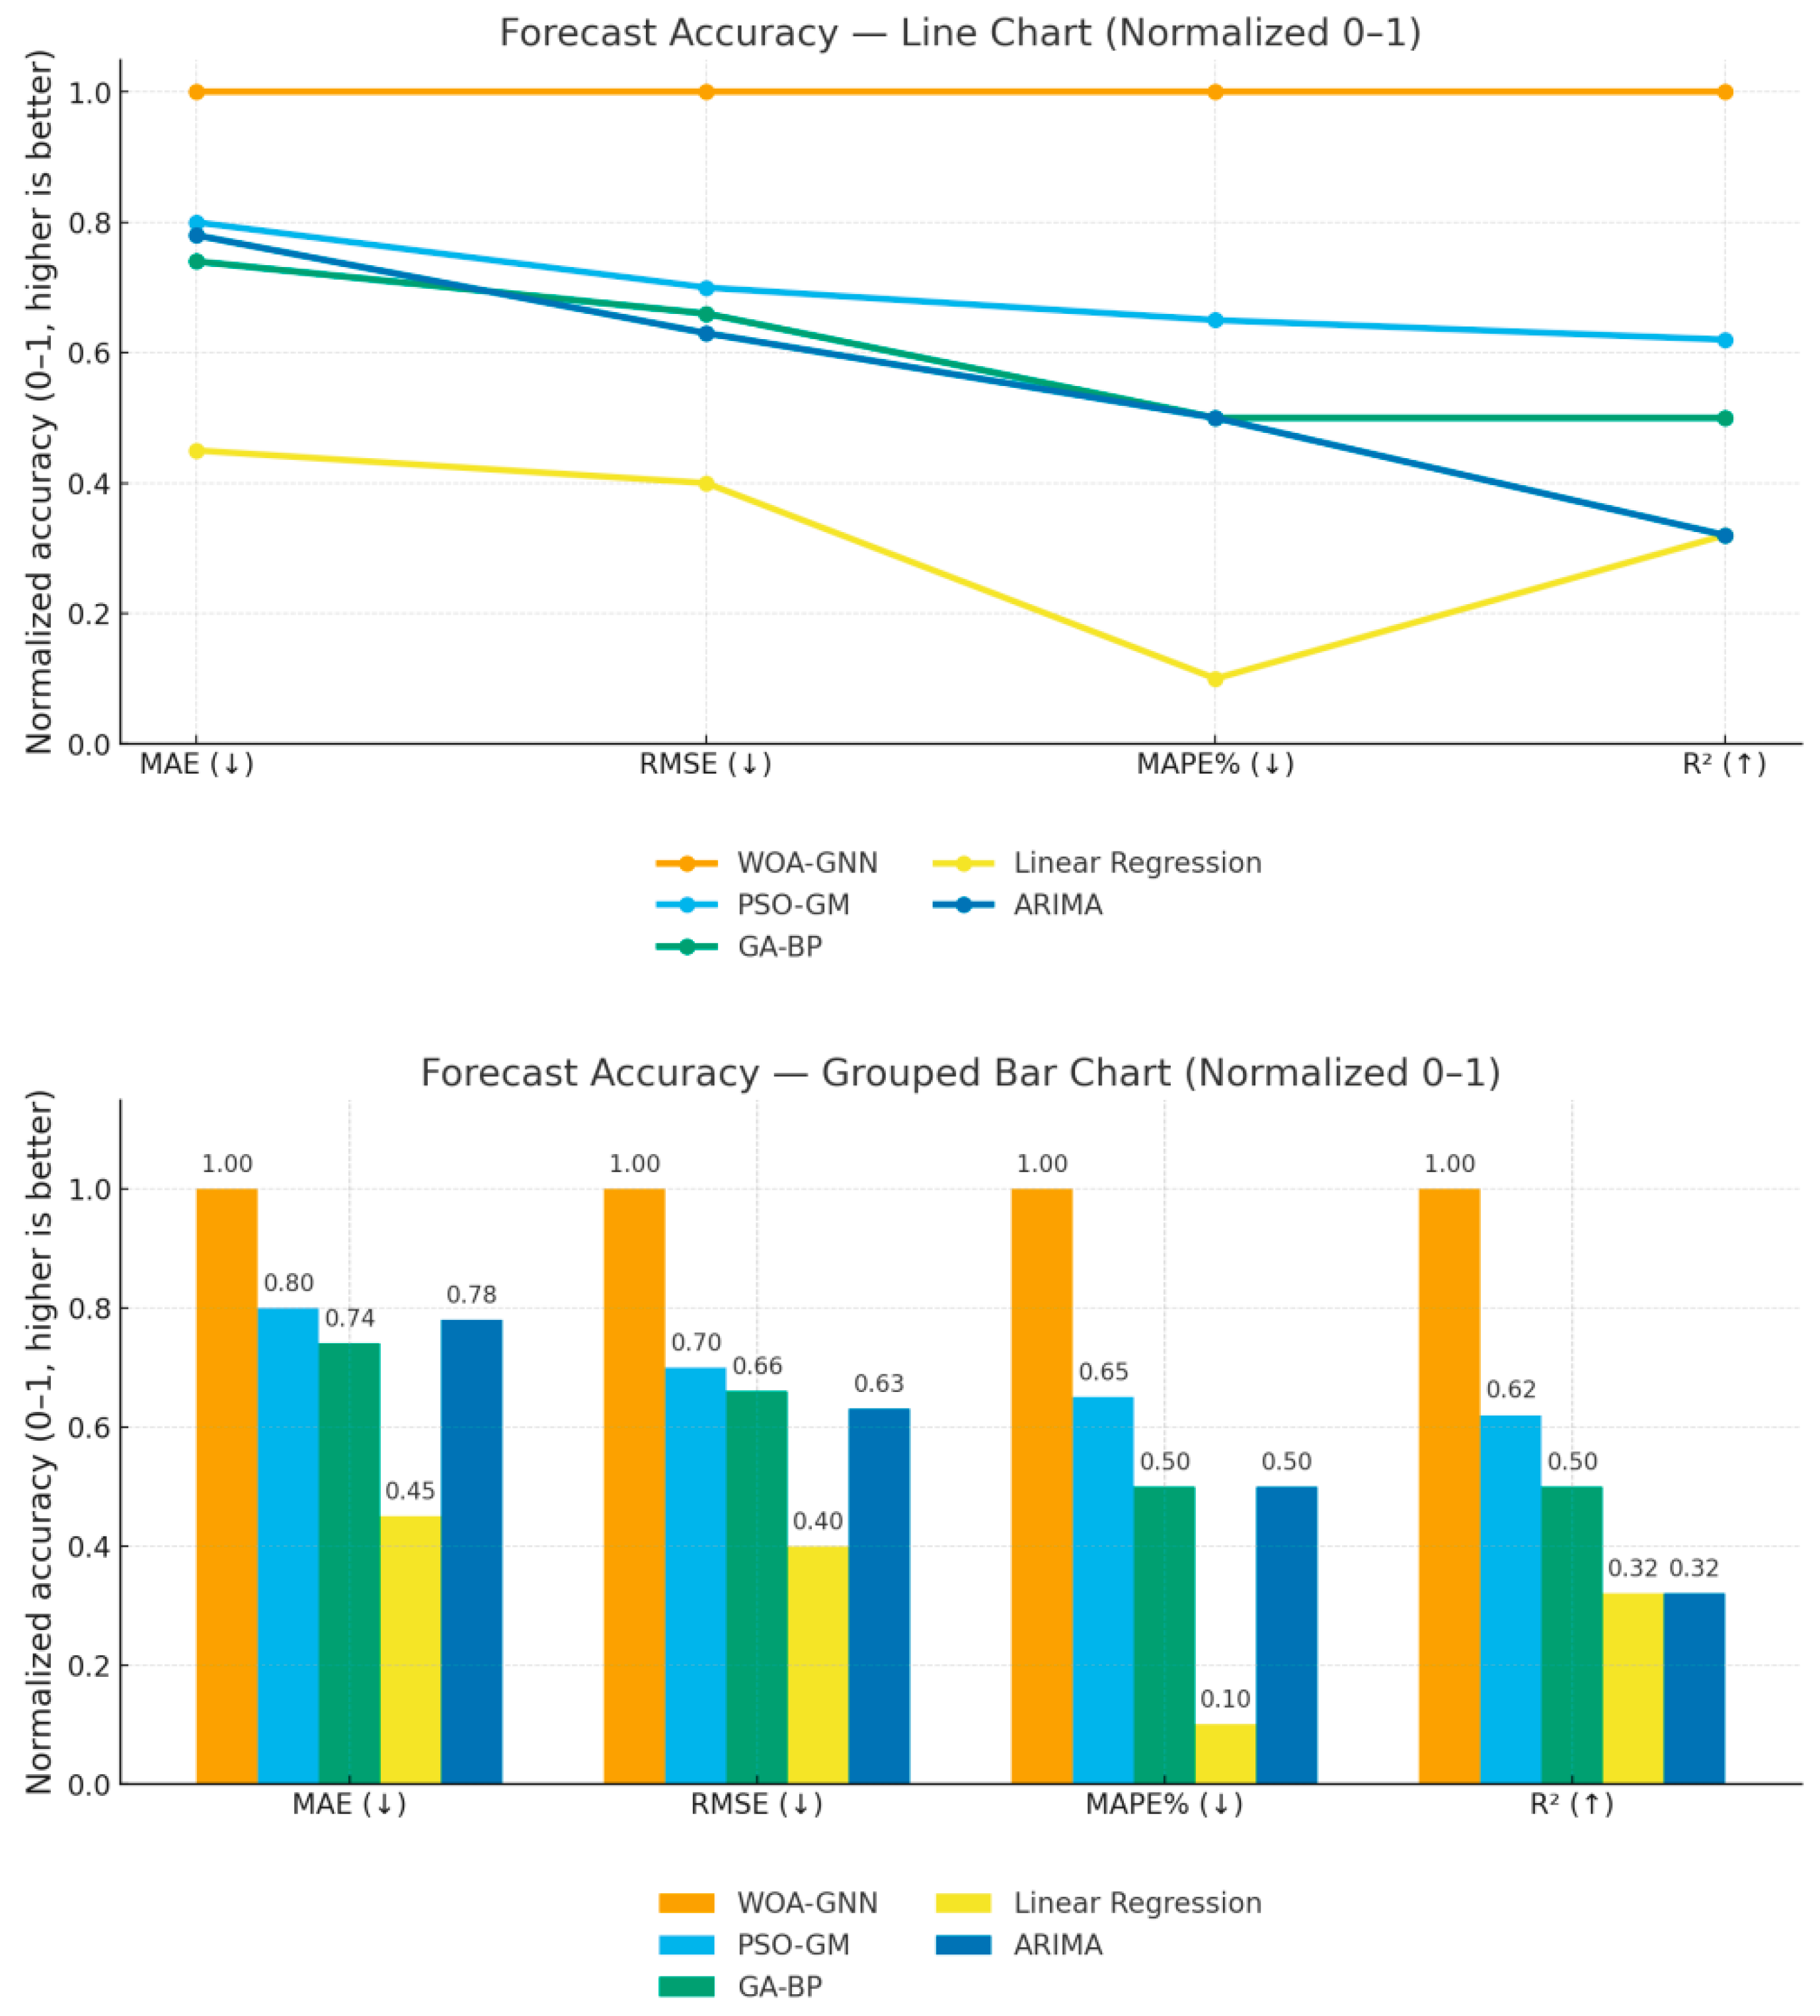
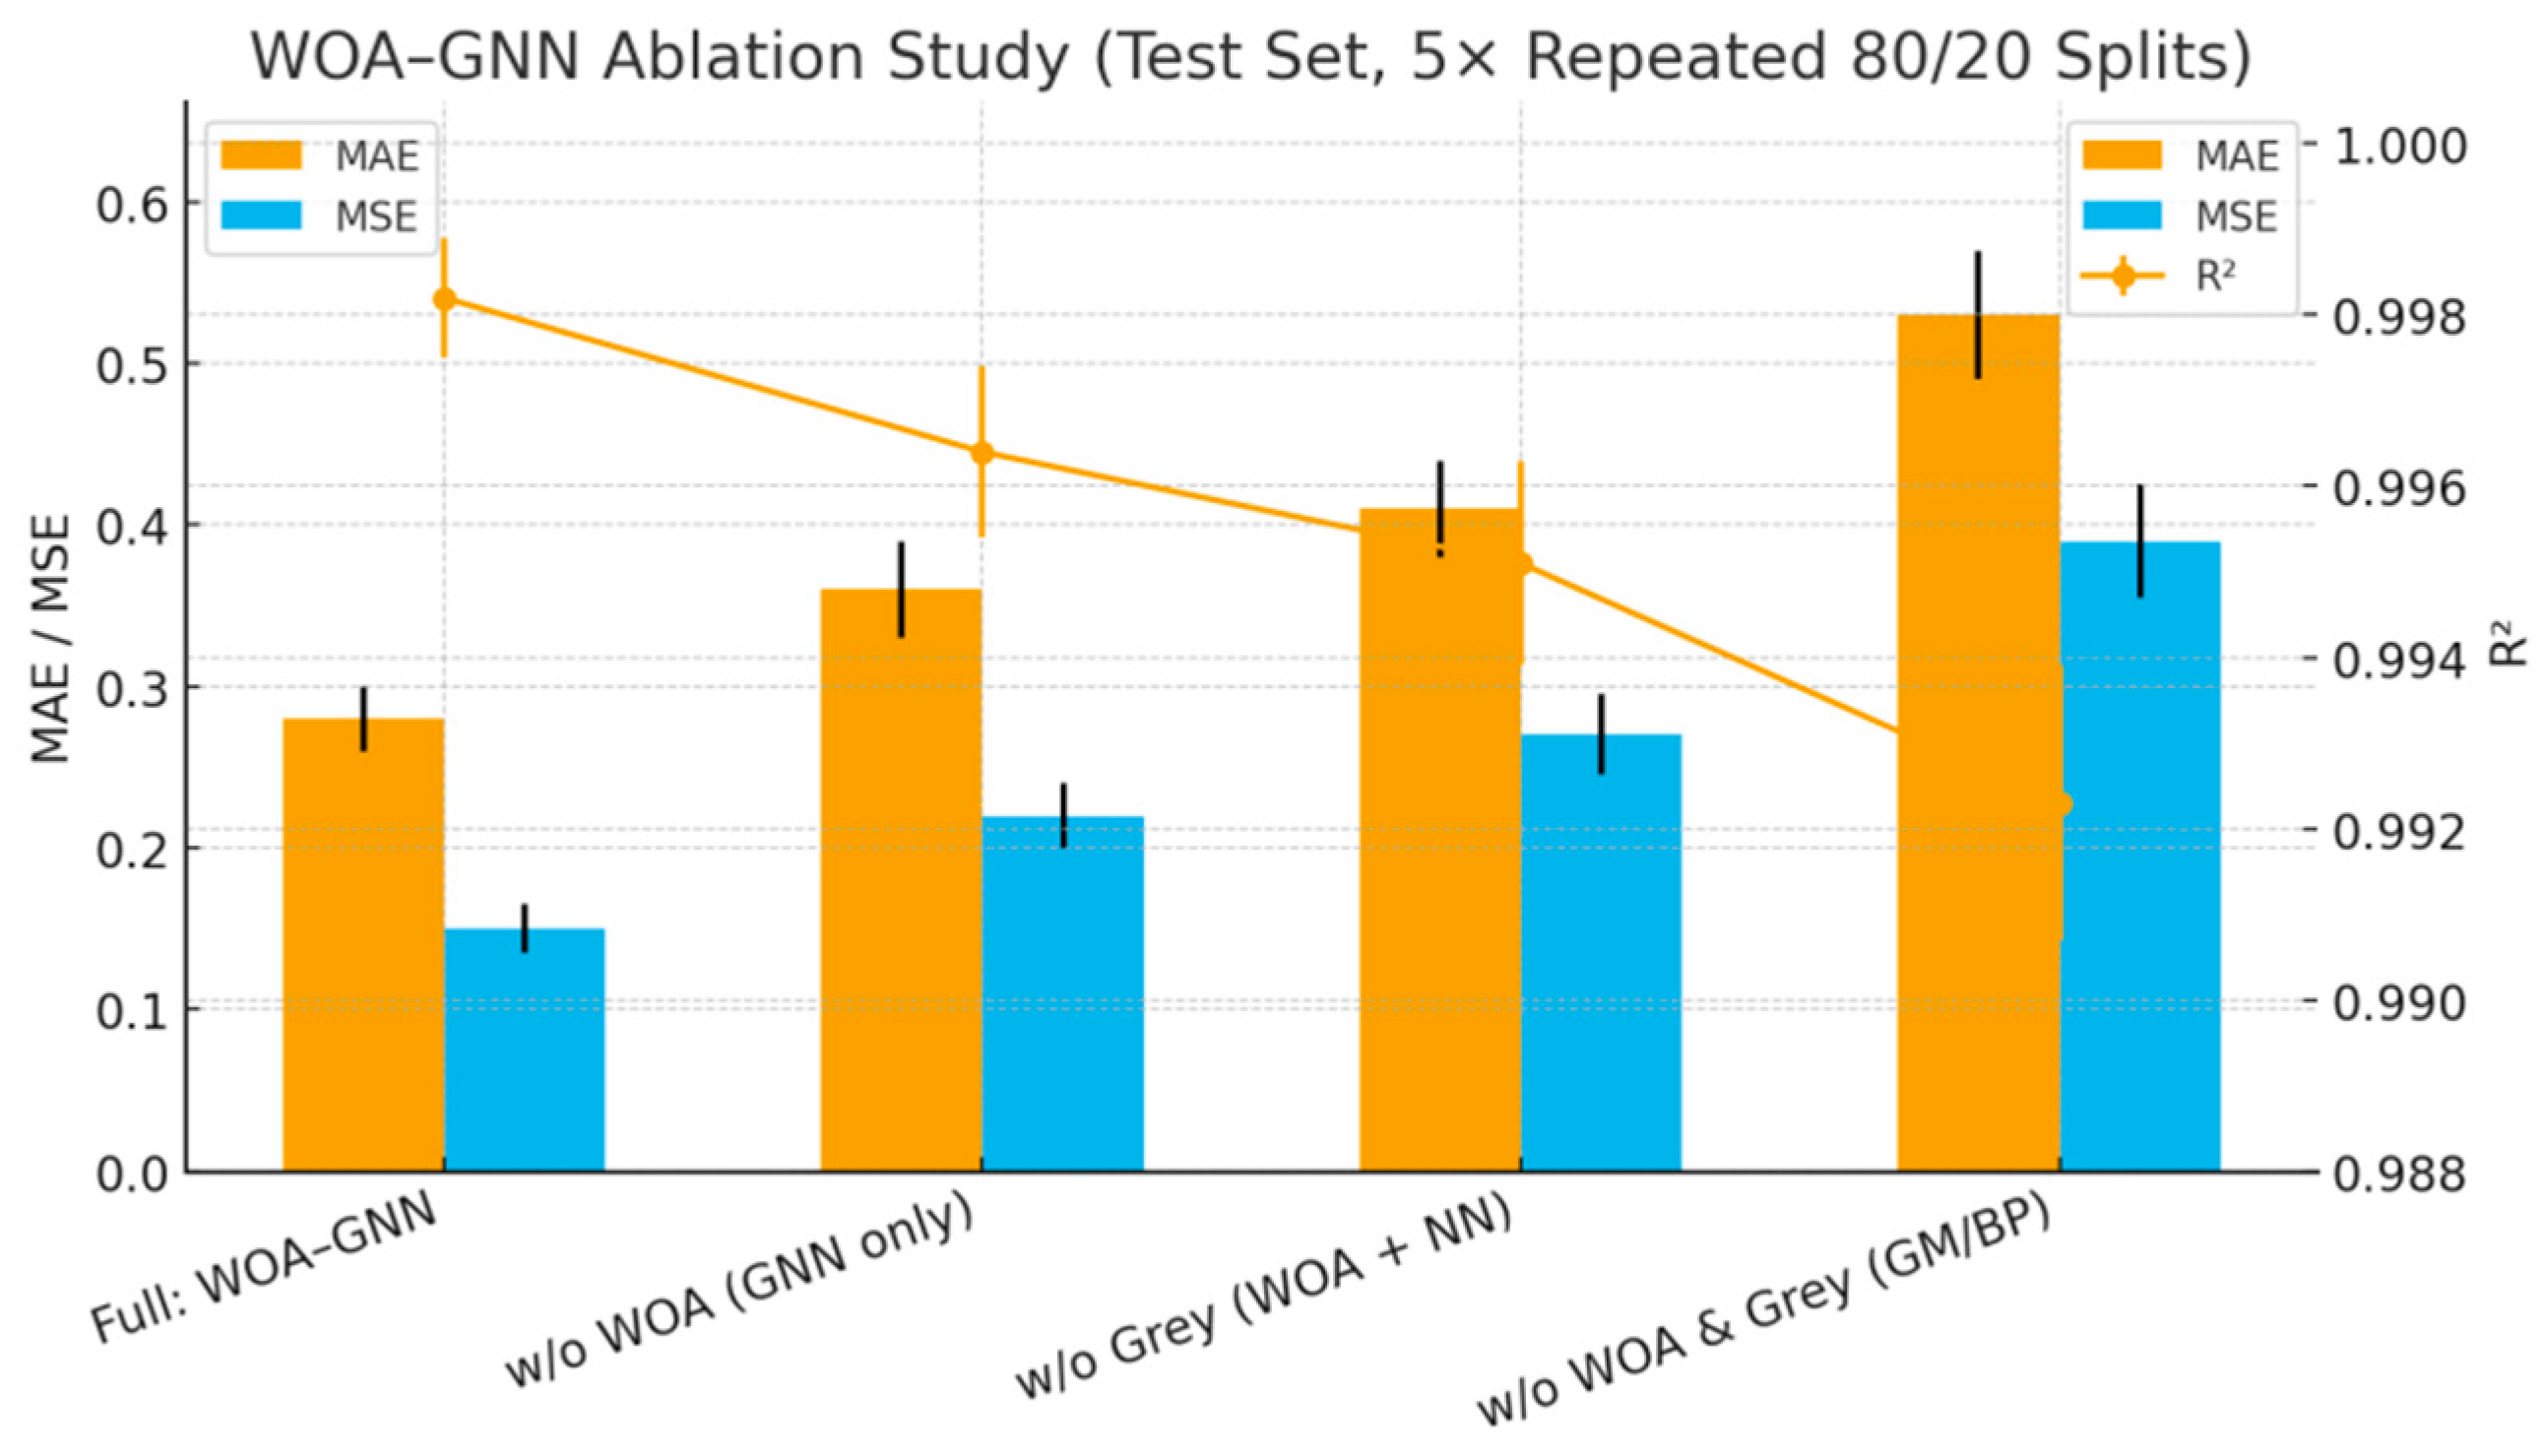
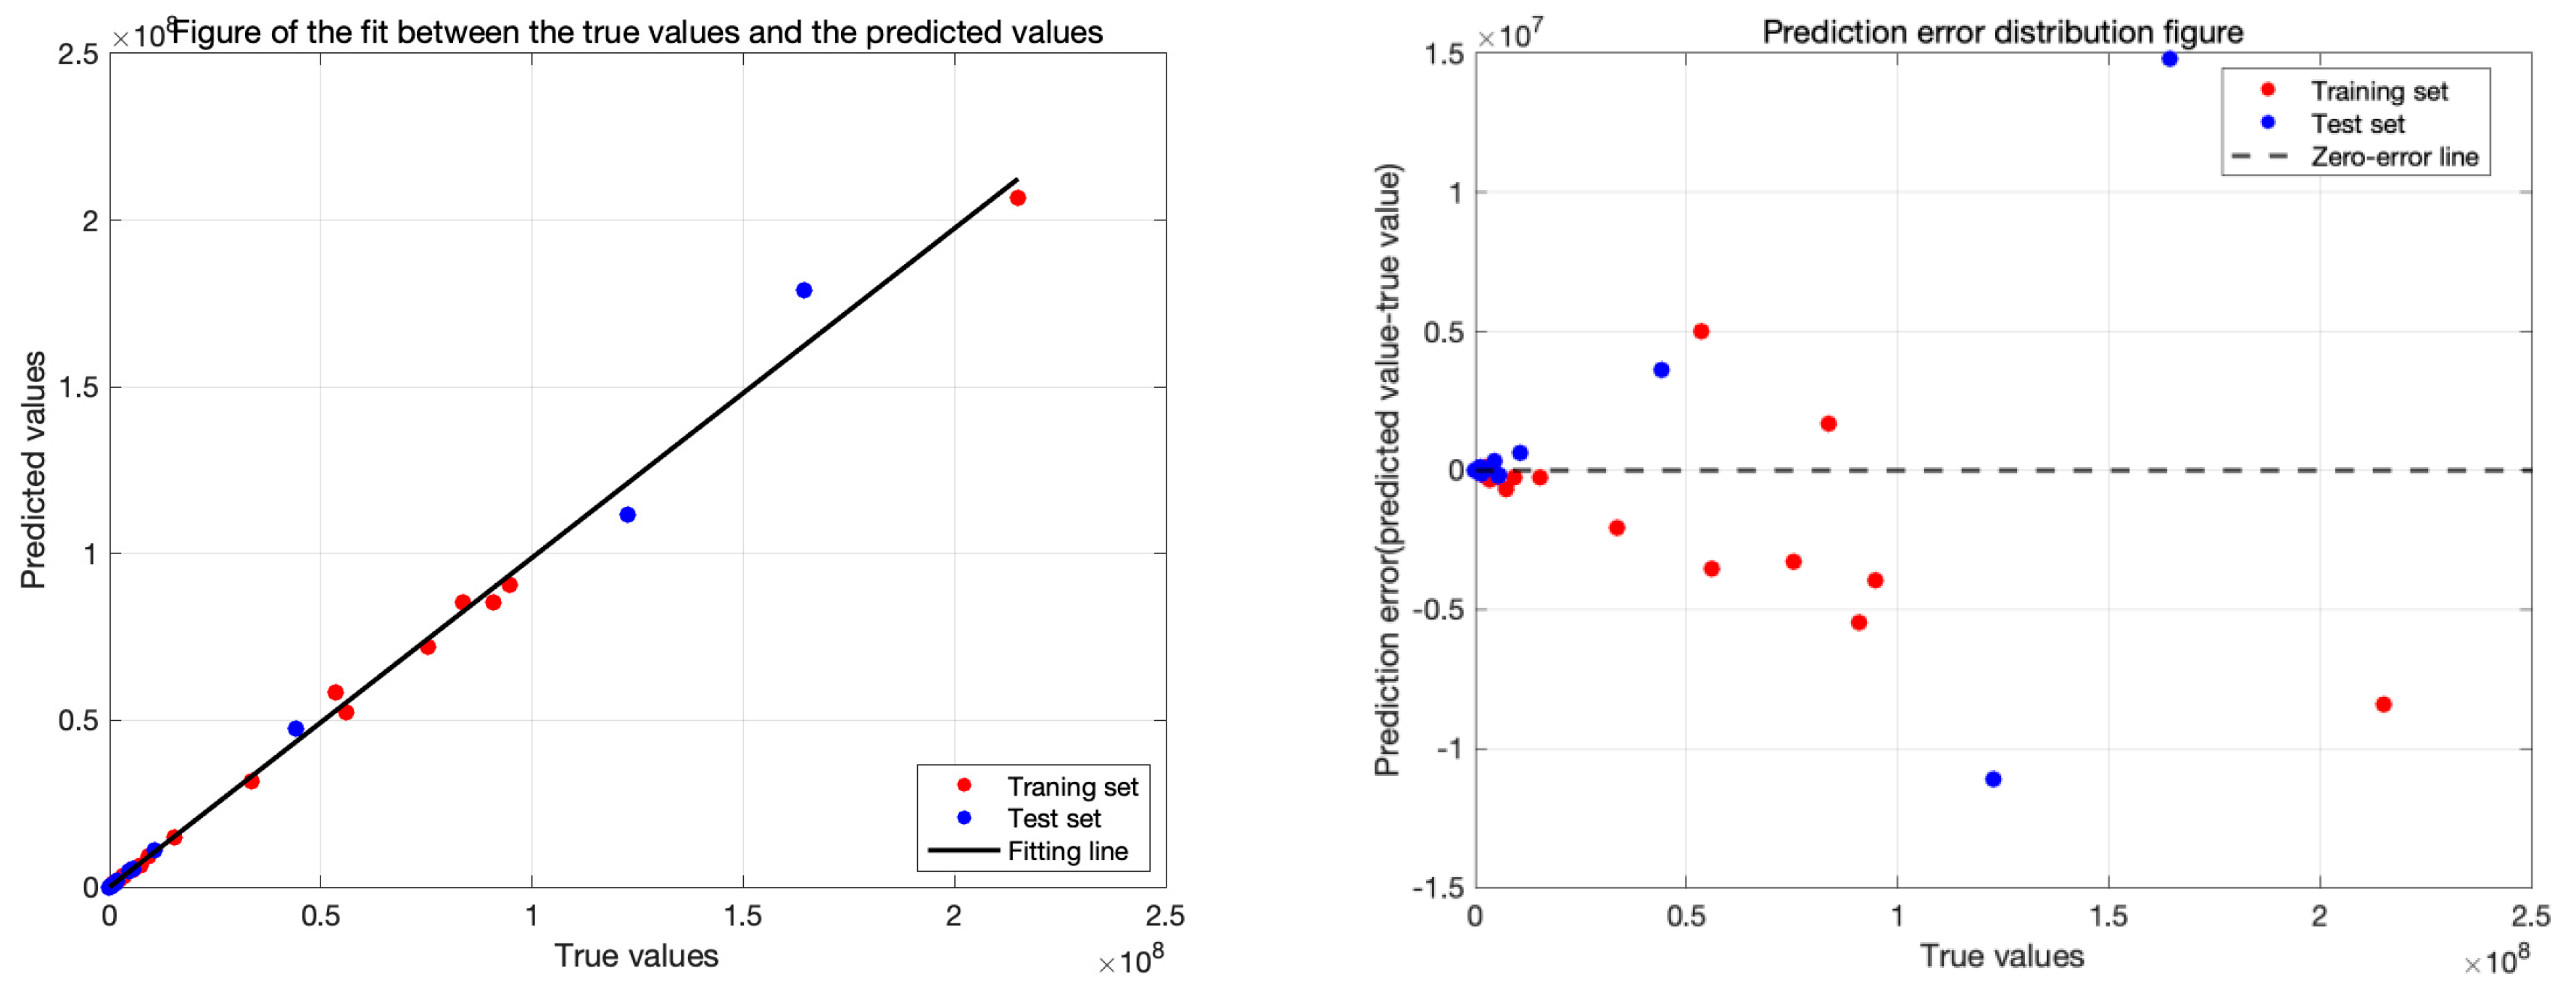
This study trains and evaluates all forecasting models on a panel of 847 province–year observations (advanced manufacturing across 11 western Chinese provinces, 2007–2017) using a nested design to curb optimism: an outer 80/20 train–test split repeated five times, with a 10-fold cross-validation loop inside each training set for hyperparameter tuning; all preprocessing (e.g., feature scaling) is fit only within training folds. After tuning, models are refit on the full training set and assessed once on the untouched test set; the reported MAE, MSE, and R
2 are strictly out-of-sample and averaged across the five repeats (means ± s.d. where noted). Under identical splits, preprocessing, and tuning budgets, the proposed WOA–GNN consistently achieves the lowest mean MAE/MSE and the highest mean R
2, yielding the best average rank across repeats, whereas Linear Regression and ARIMA struggle with non-linear, cross-province heterogeneity and PSO–GM/GA–BP, while stronger than single baselines, still trail WOA–GNN (
Figure 8). An ablation study (
Figure 9) further shows that removing Whale Optimization (plain GNN), removing the grey mechanism (WOA-tuned standard NN), or removing both degrades accuracy—raising MAE/MSE and lowering R
2—demonstrating that the meta-heuristic search and grey prior embedding provide complementary gains that better capture weak signals and regime shifts in provincial manufacturing dynamics.
3.3.1. Analysis of the Forecasting Results of Carbon Footprint
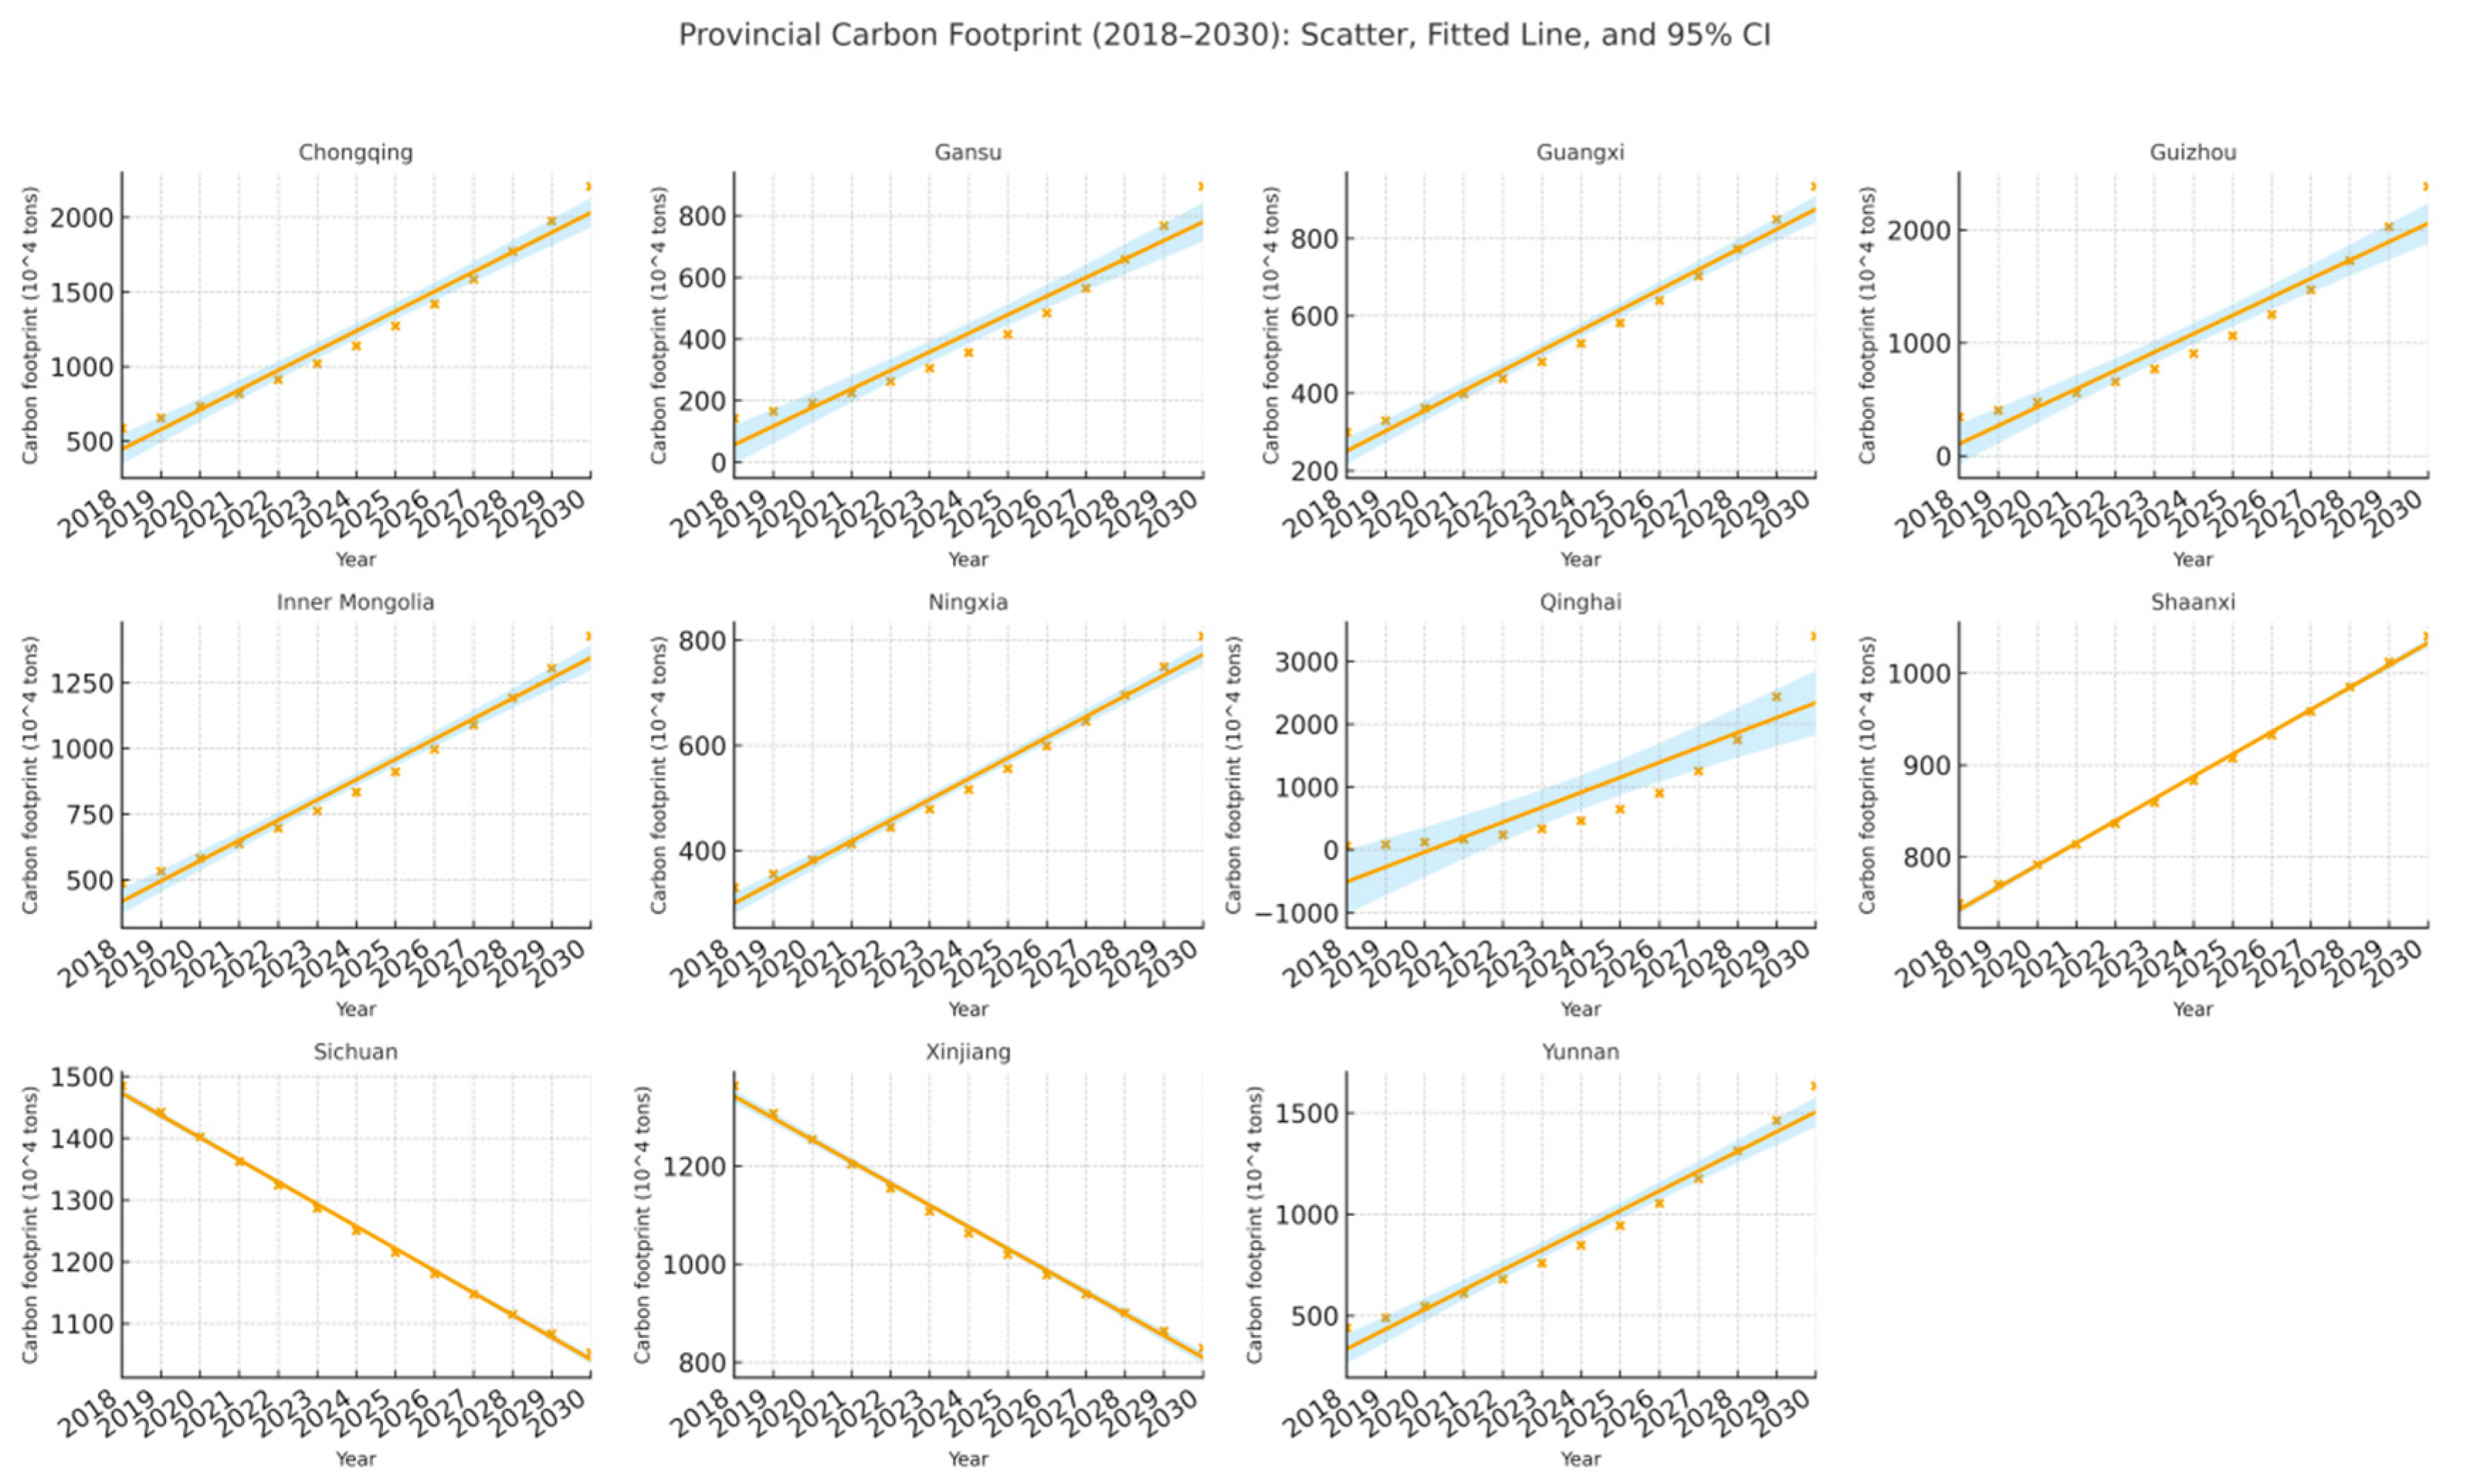
To clarify multi-year evolution patterns at both spatial and industrial scales,
Figure 11 and
Figure 12 plot 2018–2030 carbon footprints for advanced manufacturing in Western China as scatter points with a least-squares fitted line and 95% confidence bands (unit: 10
4 tons)—
Figure 11 at the provincial level (11 provinces) and
Figure 12 at the sectoral level (S1–S7). The fitted line captures the direction and pace of change, while the confidence envelope quantifies statistical uncertainty around each mean trajectory. By displaying continuous multi-year trend modes, these panels offer a clearer, more comprehensive view of how provincial and sectoral footprints are expected to evolve over time, thereby strengthening the interpretation of temporal dynamics and cross-sectional heterogeneity.
Figure 11 and
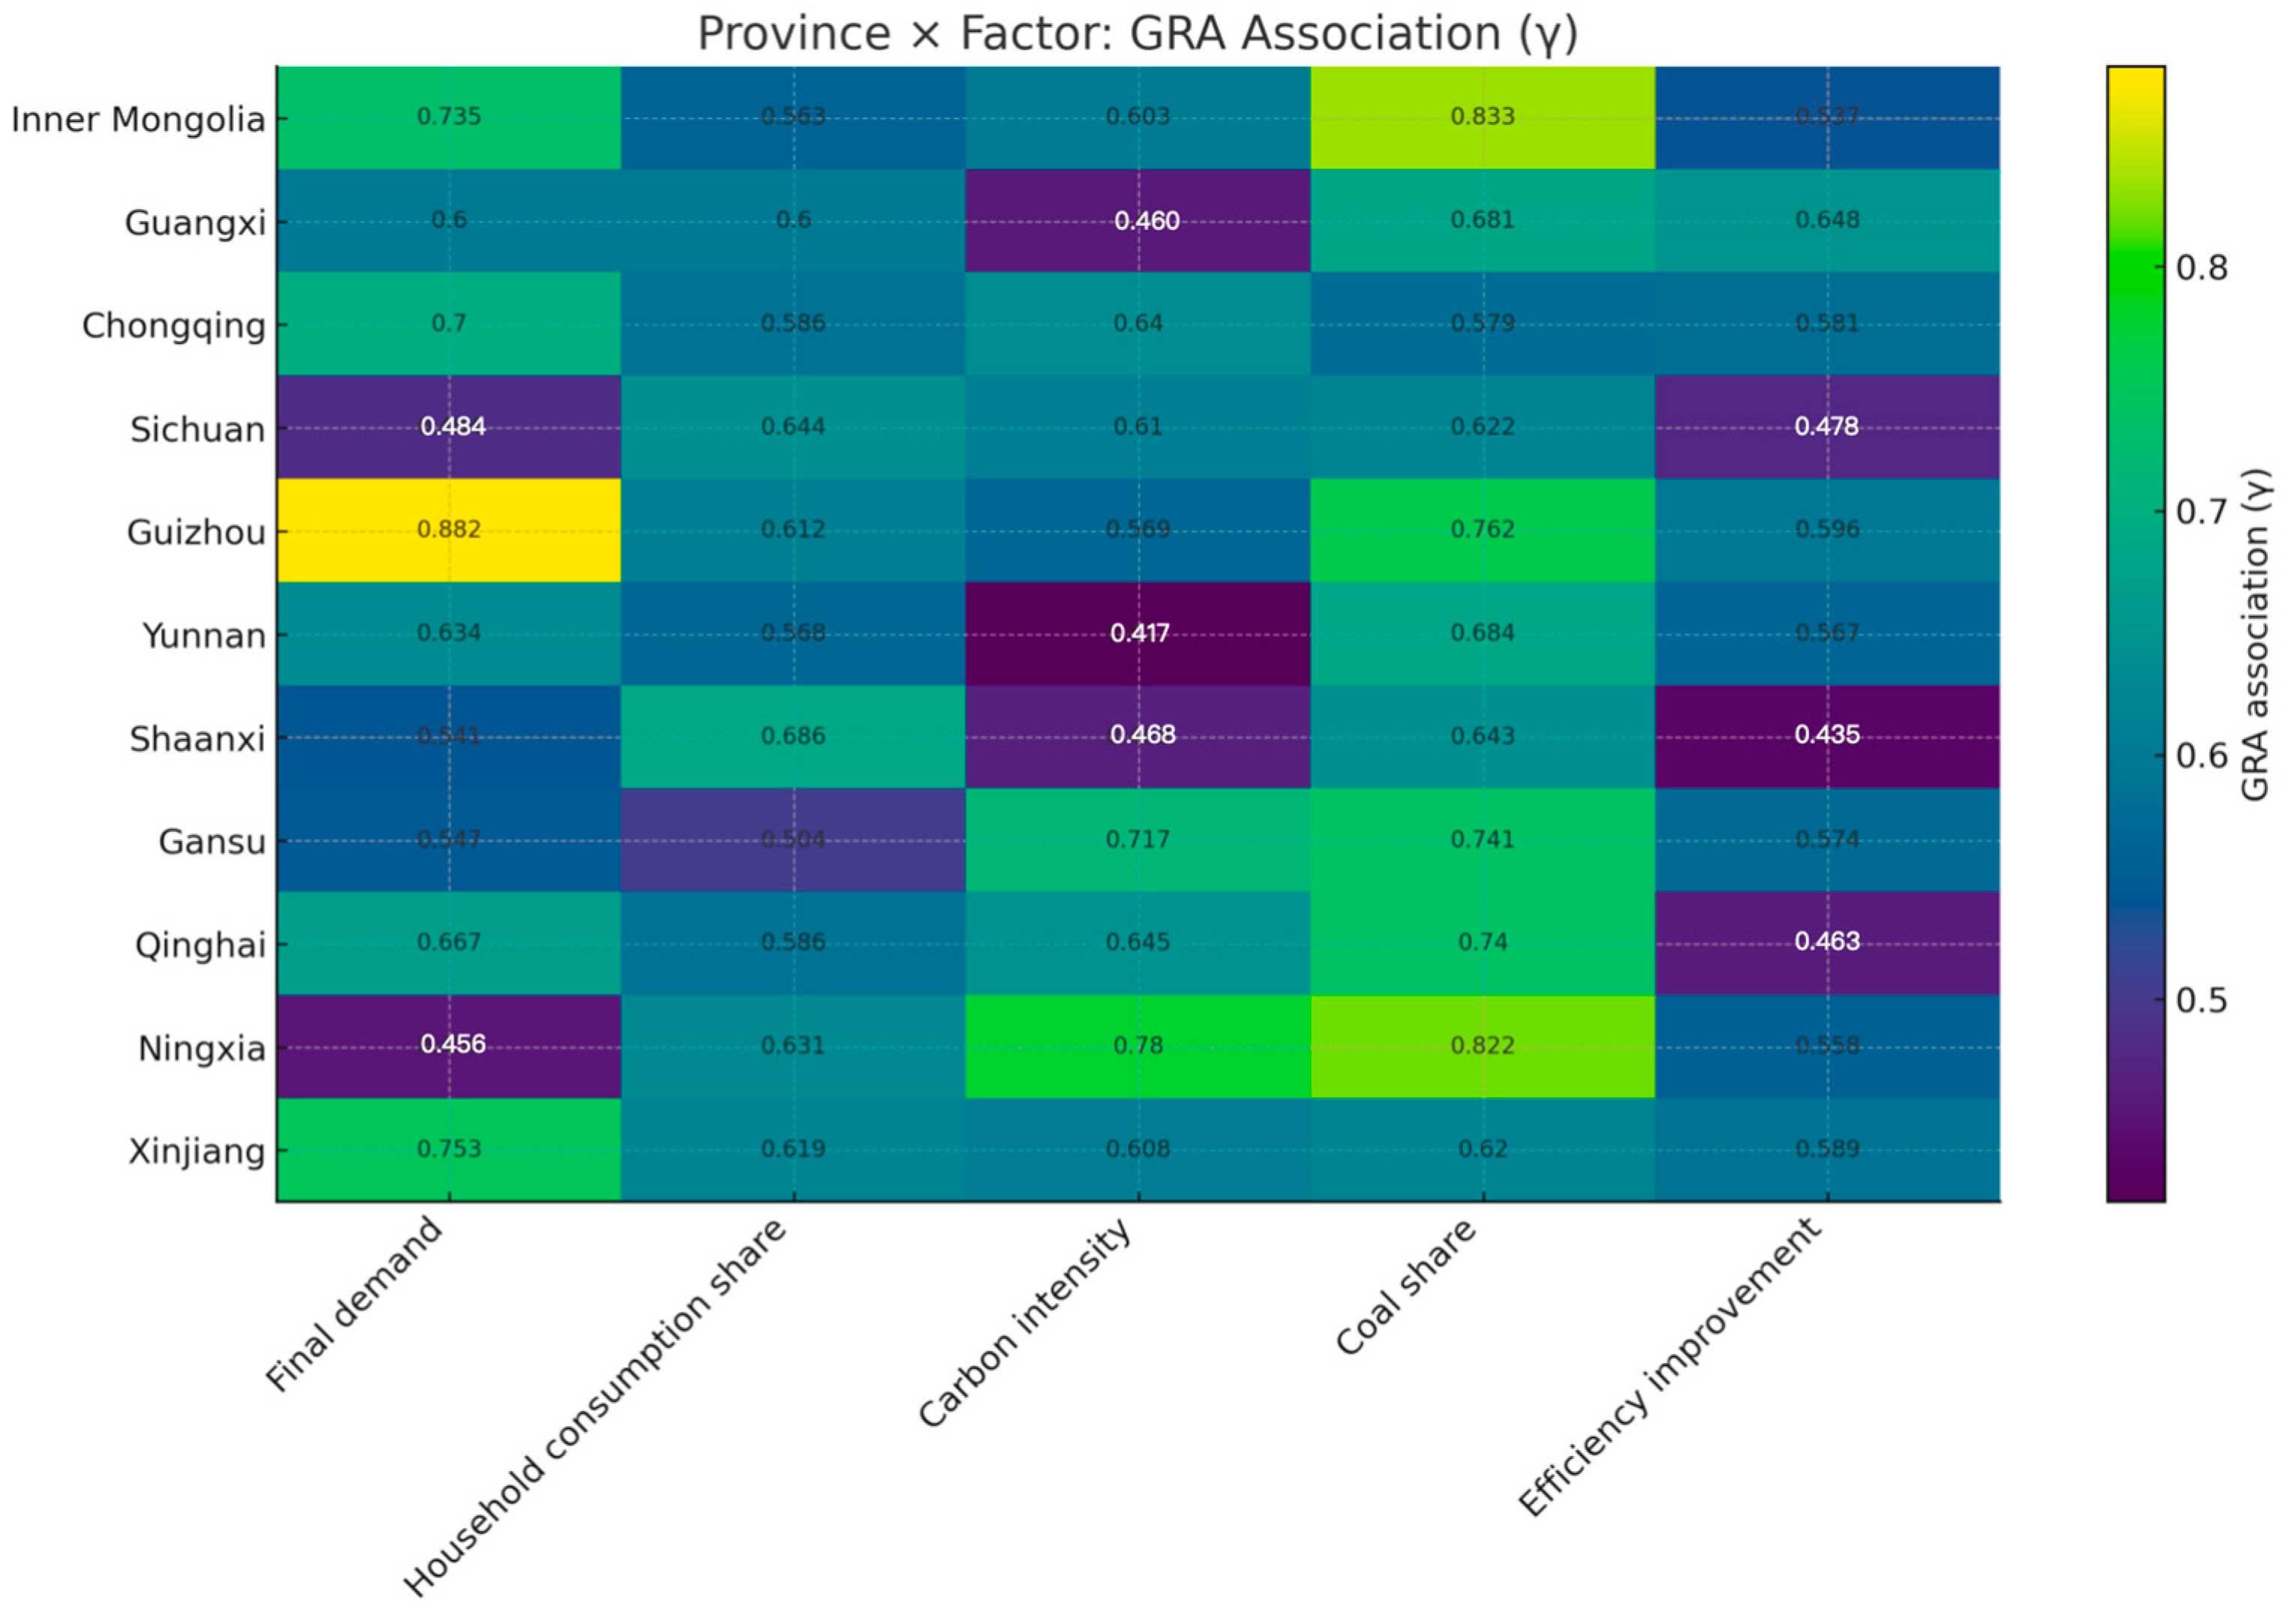
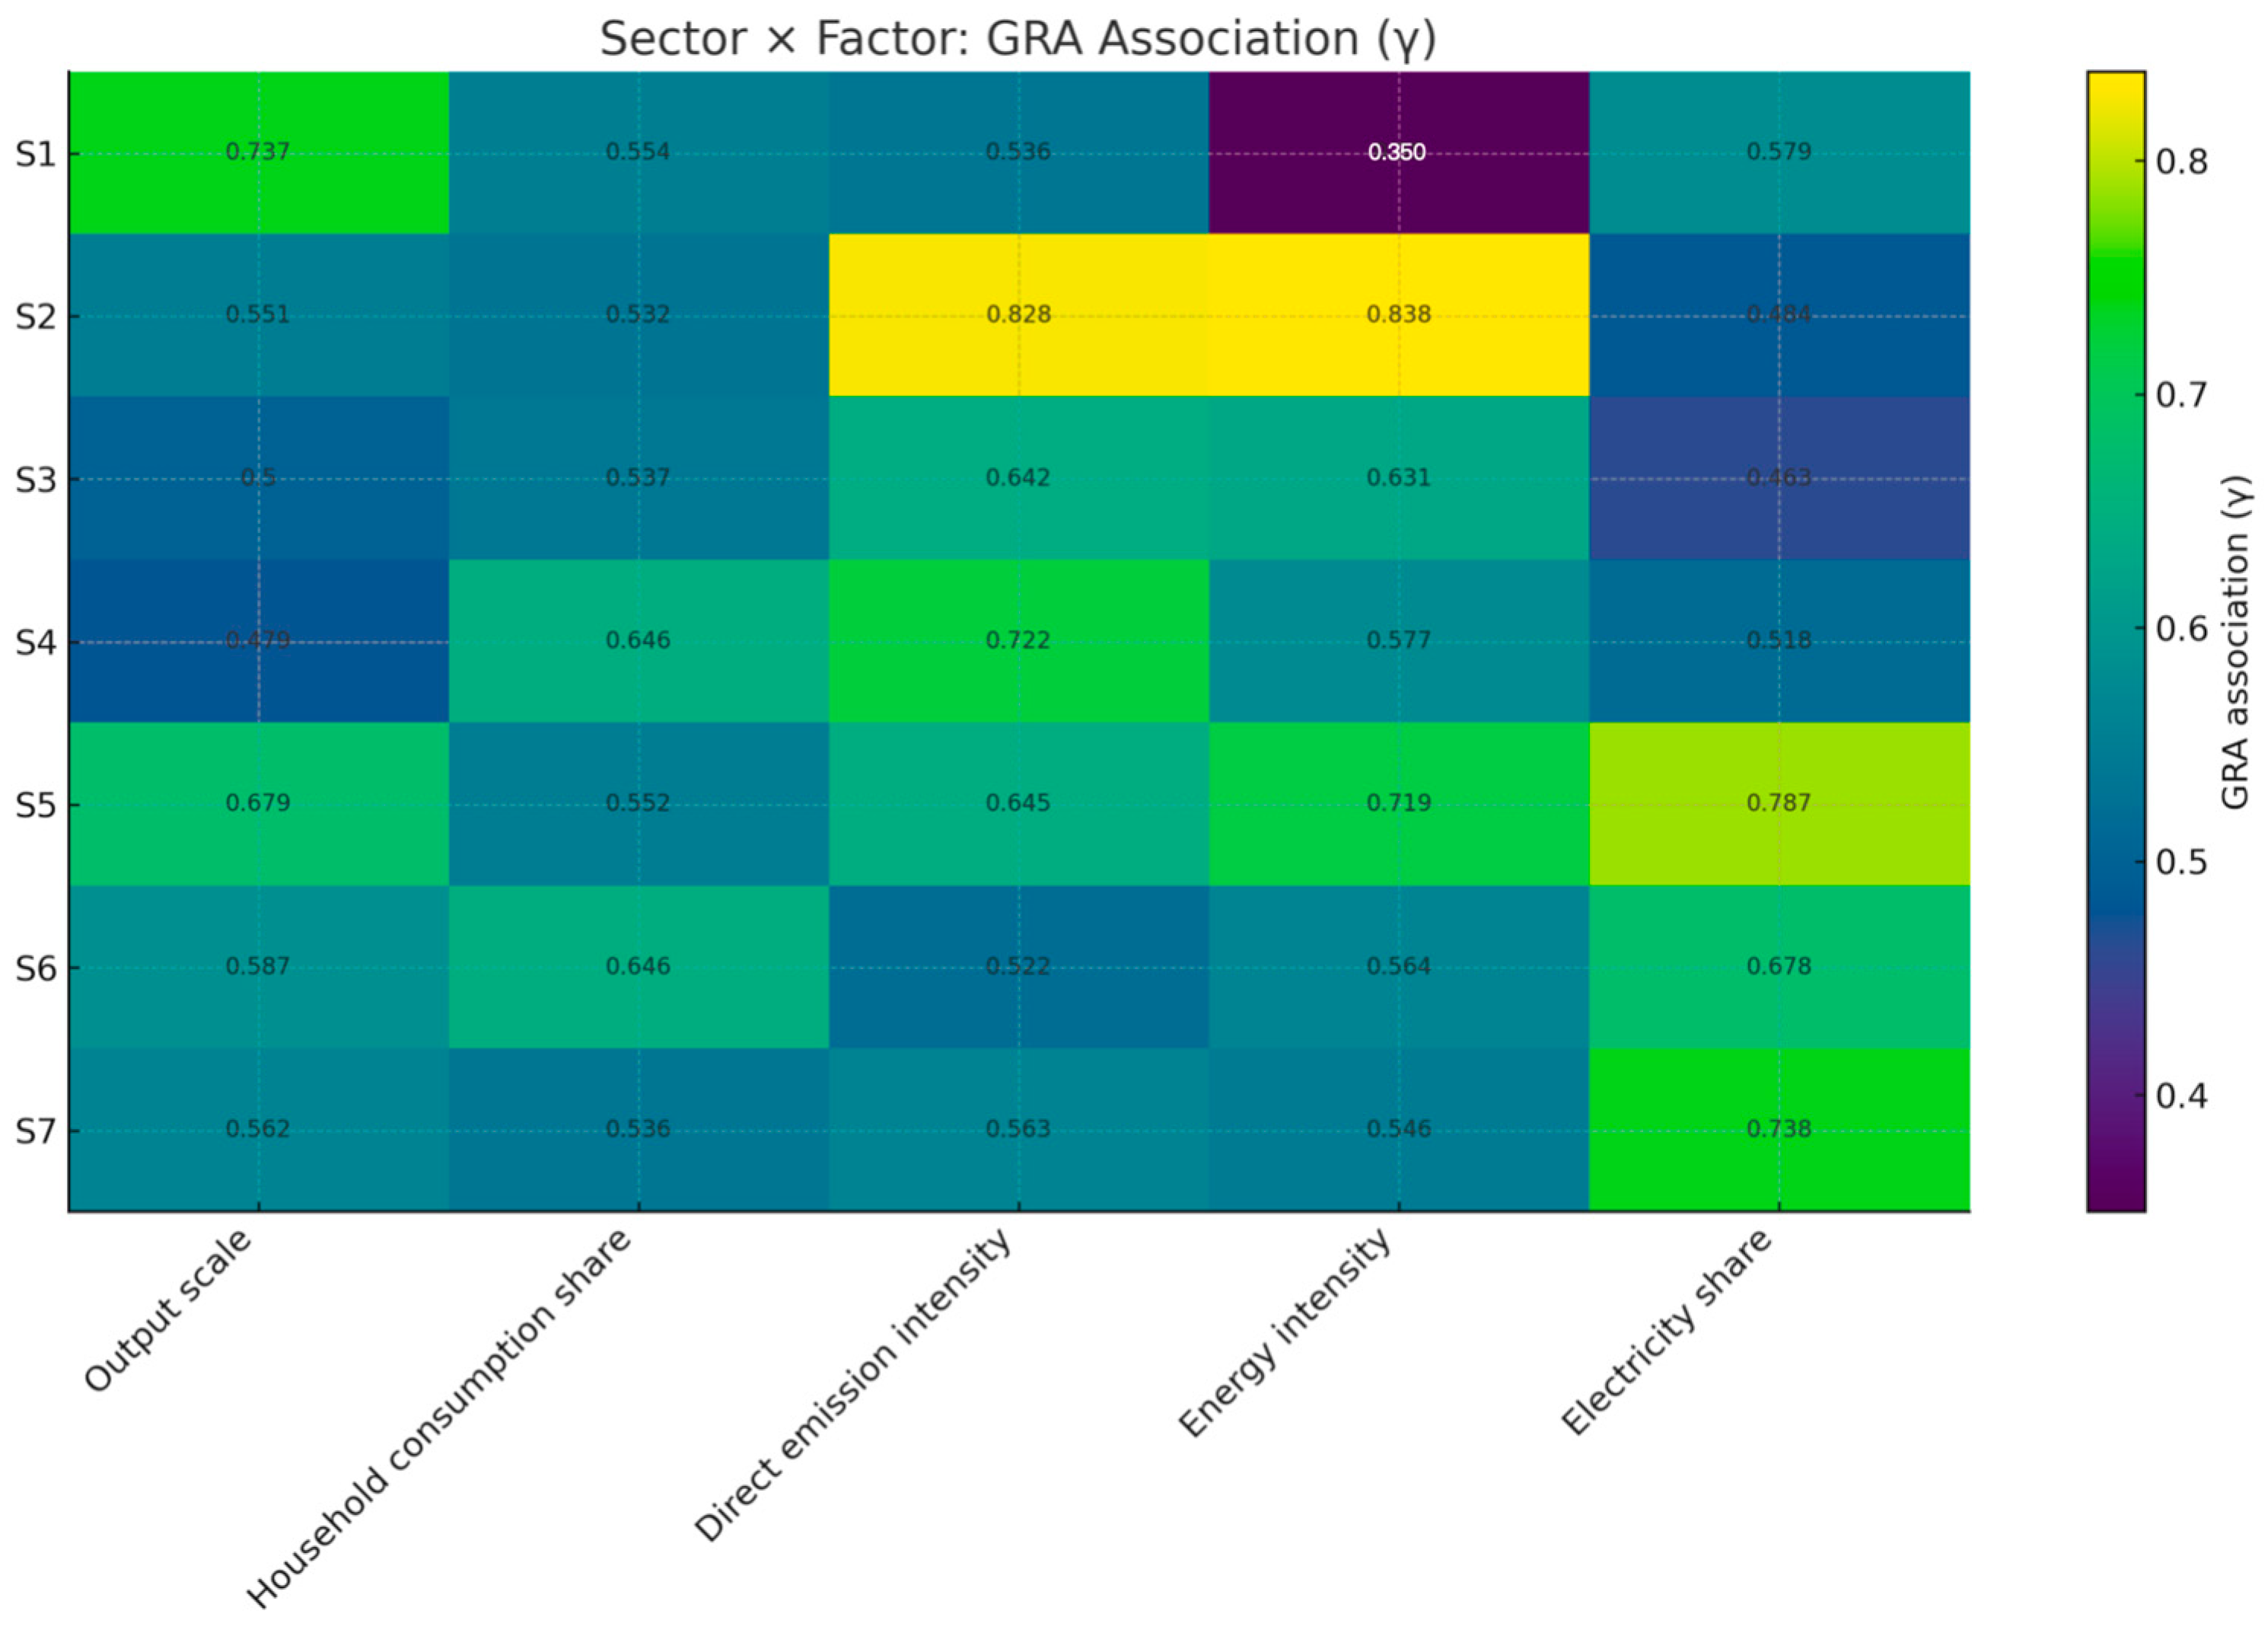
Figure 12 reveal a clear two-tier pattern. At the provincial level, Qinghai, Guizhou, and Chongqing (with Yunnan/Inner Mongolia following) show steeper upward slopes and wider bands, while Sichuan, Shaanxi, Gansu, Ningxia, Xinjiang, and Guangxi display flatter, tighter trajectories. This divergence aligns with our GRA findings: energy factors (intensity and electricity/coal mix) and output scale propel growth, whereas technology factors (process efficiency, equipment vintages) dampen it. At the sectoral level, energy- and materials-intensive chains exhibit higher levels, faster growth, and broader uncertainty, while higher-tech/precision segments trend lower with narrower bands—again consistent with GRA (energy and scale as primary drivers; technology upgrading as the main countervailing force). Overall, the multi-year trends indicate that energy/scale dynamics shape the upward momentum, and technology diffusion is the key lever to bend the curve.
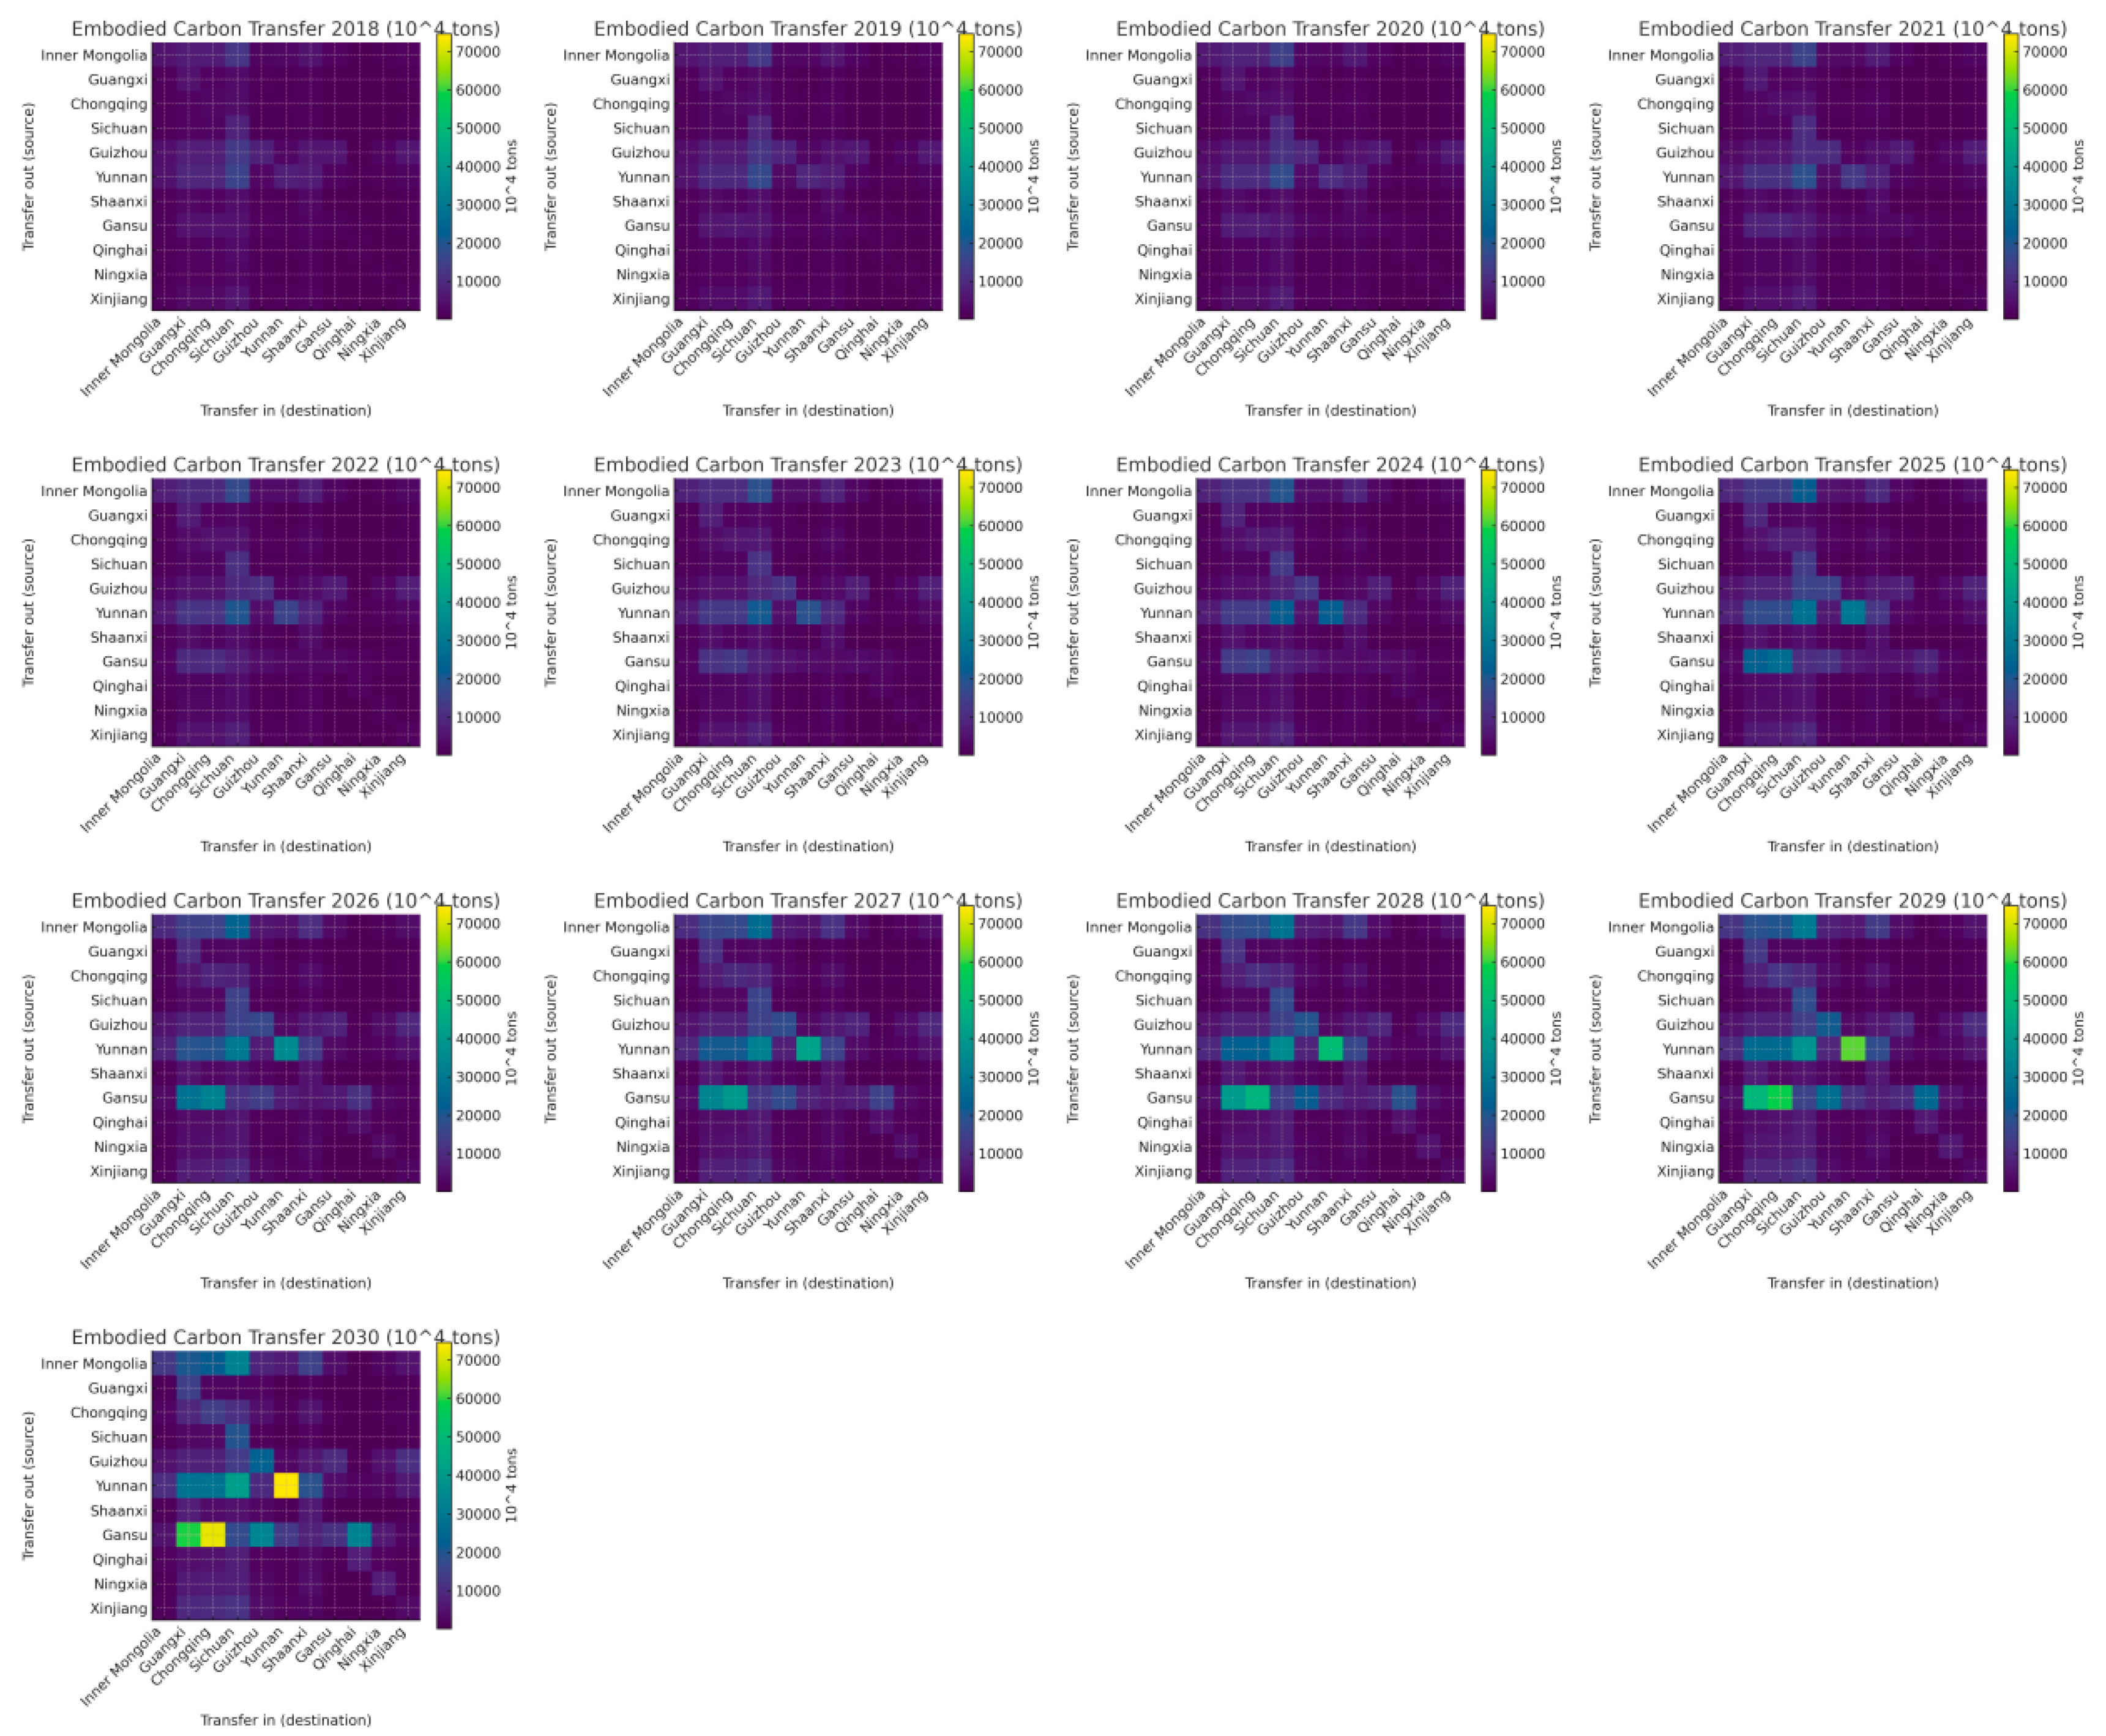
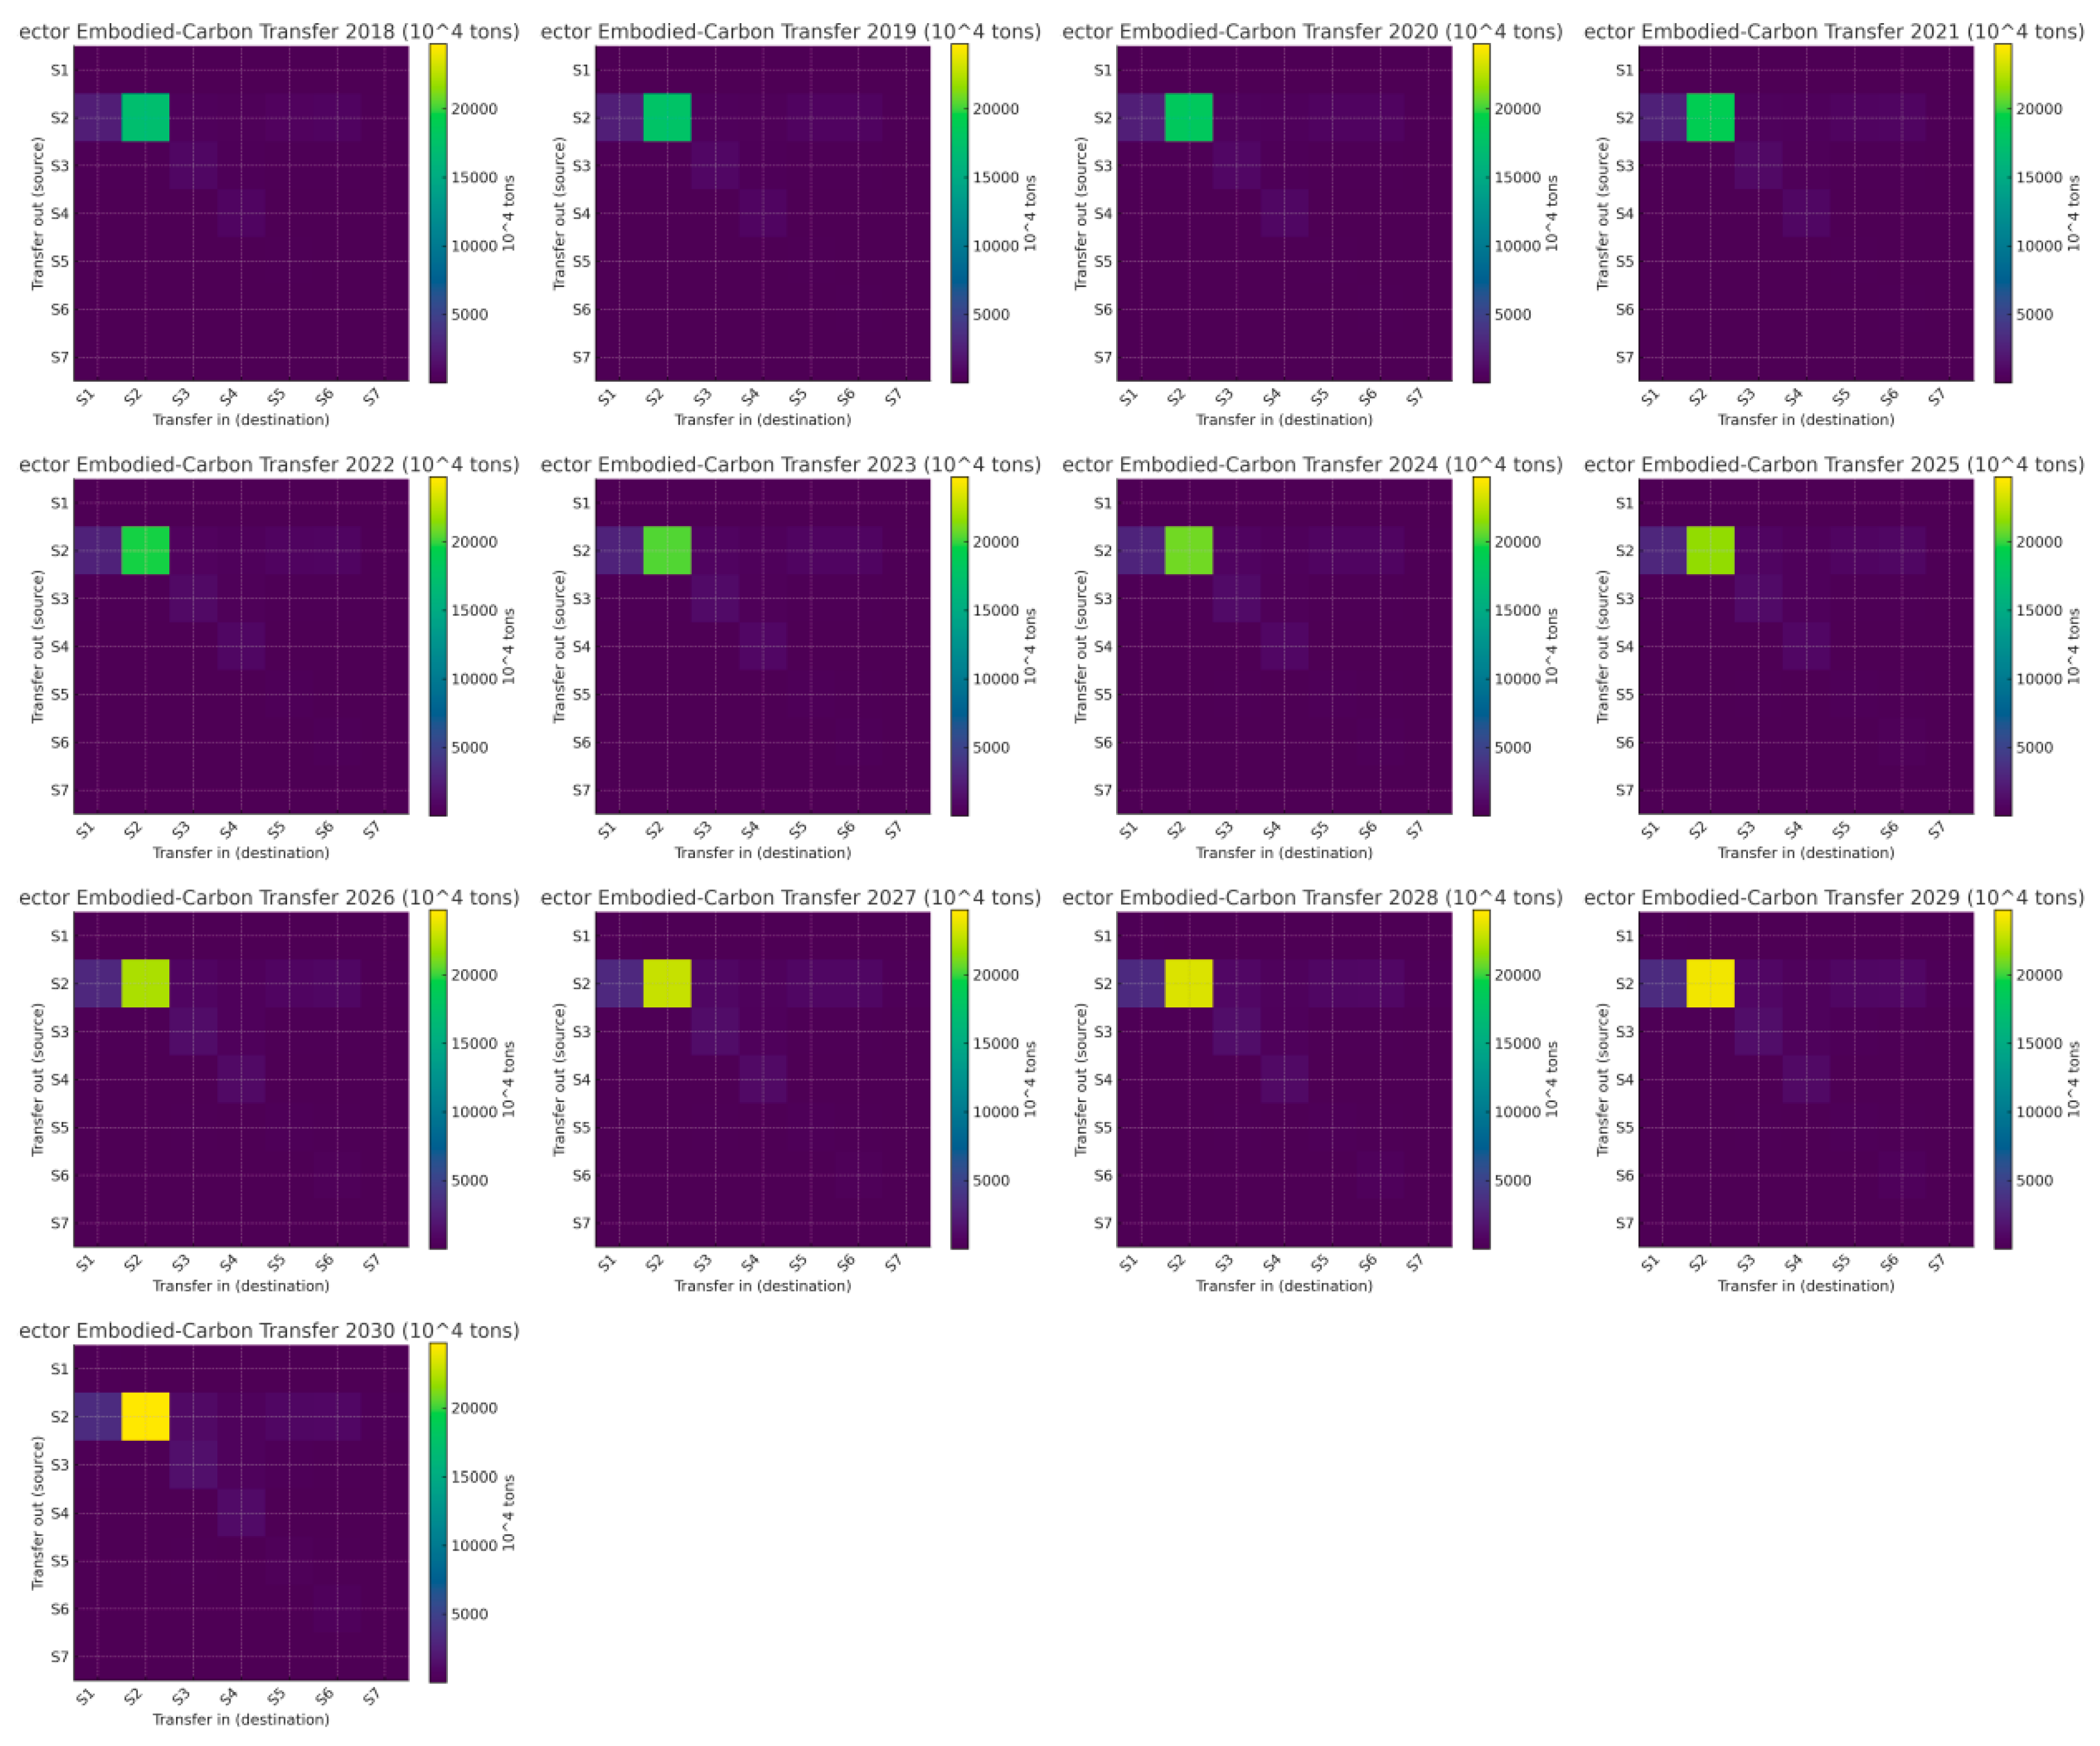
Here we visualize the structural evolution of embodied carbon transfers in Western China’s advanced manufacturing from 2018 to 2030 using annual heatmaps at two resolutions: an 11 × 11 provincial matrix and a 7 × 7 sectoral matrix (units: 10
4 tons; a common colour scale is used across years for comparability). In each heatmap, diagonal cells represent within-province (or within-sector) self-flows, while off-diagonal cells capture cross-boundary transfers (interprovincial corridors or intersectoral linkages). Darker shades indicate larger embodied carbon volumes. The series is ordered chronologically to make intensification, diffusion, and persistence of links visually traceable. These graphics translate our MRIO-based accounting and WOA–GNN forecasts into an intuitive, network-style view, setting up the subsequent discussion of hub-and-corridor formation at the provincial level and diagonal dominance centred on S2 at the sector level, as well as their consistency with the energy/technology mechanisms highlighted by the GRA results (see
Figure 13 and
Figure 14).
From
Figure 13 and
Figure 14, two patterns are salient. At the provincial level, embodied carbon transfers intensify and become more hub-and-corridor oriented: large self-flows (diagonal cells) expand steadily in Sichuan, Chongqing, Guangxi, Qinghai, Ningxia, and Xinjiang, indicating deeper intra-provincial supply chain coupling, while major outbound corridors from Inner Mongolia, Yunnan, and Gansu to downstream manufacturing centres (Sichuan, Chongqing, Guangxi) thicken year by year; bidirectional links along contiguous routes (e.g., Yunnan↔Sichuan, Chongqing↔Sichuan, Inner Mongolia↔Sichuan/Chongqing) also strengthen, revealing spatial path-dependence and agglomeration in shared industrial belts. At the sector level, the network is increasingly diagonal-dominant and S2-centred: the S2→S2 block leads the matrix throughout, cross-sector flows such as S3→S4 and S5→S3/S4 enlarge, and the sharp rise in S6→S6 signals intensifying within-sector transactions (parts/modules, intermediate electrified processes). Together, these shifts point to scale effects in energy-intensive chains (driving strong S2 links), technology upgrading and modularization (amplifying S6 and S3↔S4 exchanges), and proximity-based logistics advantages (reinforcing provincial corridors), producing a denser, more centralized embodied carbon transfer network by 2030.
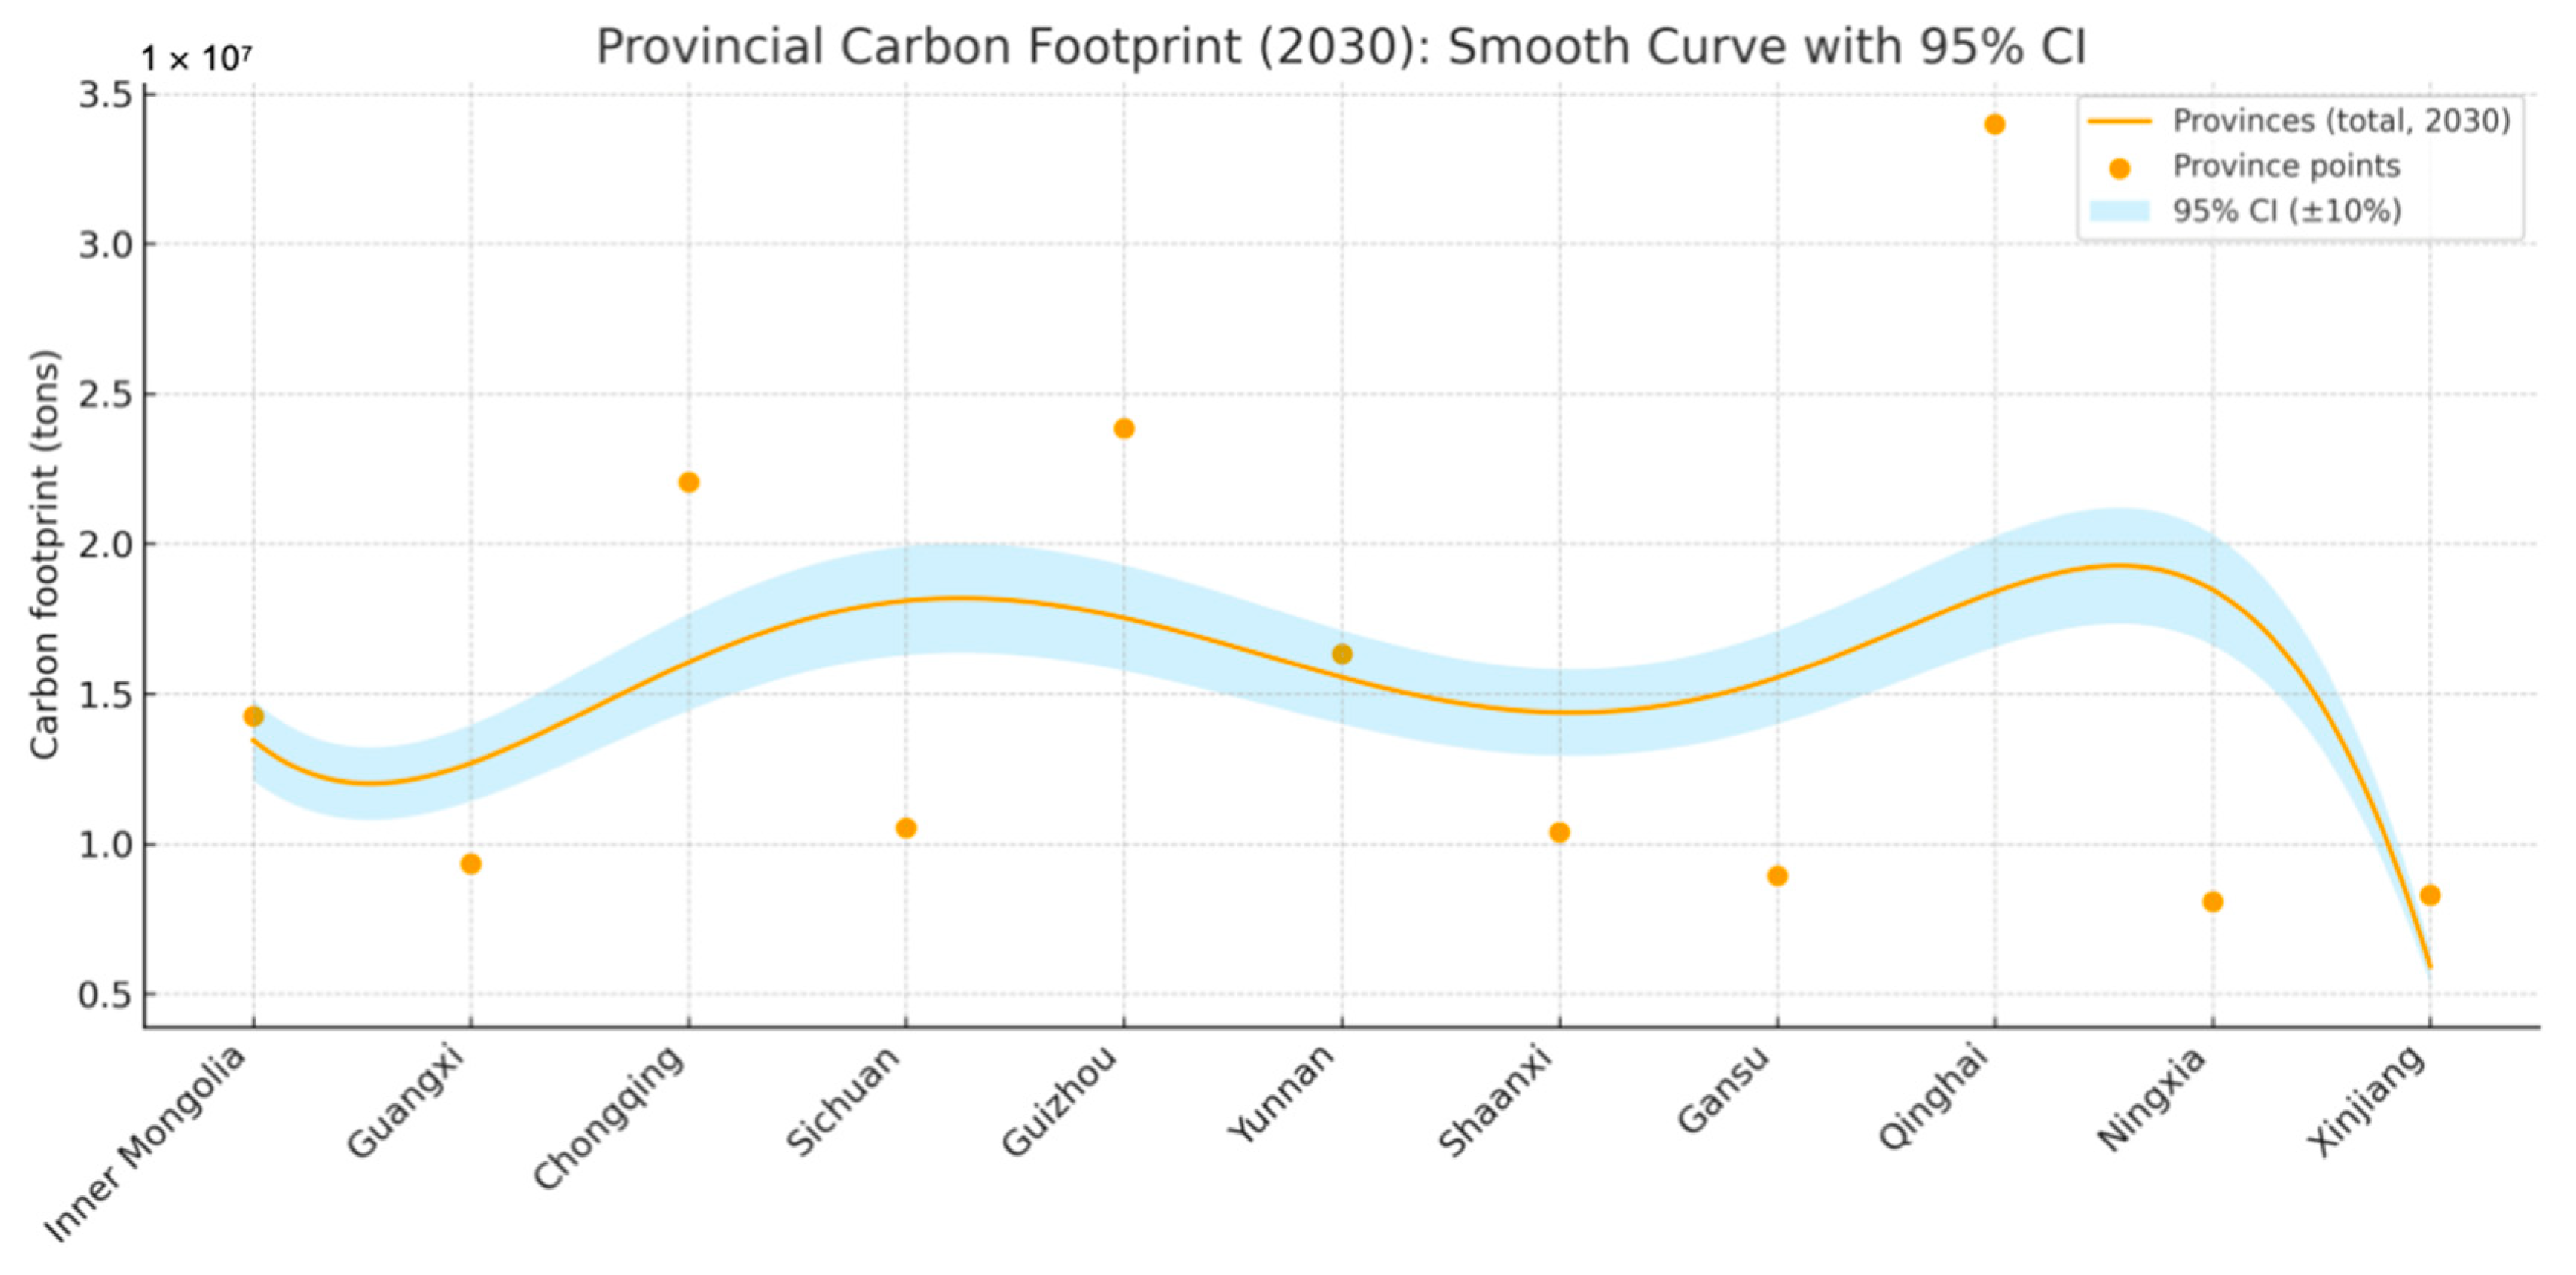
Building on the foregoing time-series diagnostics and model setup, we apply the WOA–Grey Neural Network (WOA–GNN) to project the carbon footprints of seven advanced-manufacturing sectors across 11 western provinces (municipalities/autonomous regions) to 2030. The province- and sector-specific outcomes are summarized in
Table 7,
Figure 15 and
Figure 16.
At the provincial level, the differences in the carbon footprint of advanced manufacturing across provinces in Western China are closely related to each province’s industrial structure and energy use patterns. For example, Inner Mongolia has a relatively high carbon footprint, particularly in the non-metallic mineral products industry (S2), where the province’s carbon emissions reach 12.839 million tons. This reflects its reliance on resource extraction and energy-intensive industries, especially the mining and processing of mineral resources, which lead to high carbon emissions [
57]. In contrast, provinces such as Sichuan and Shaanxi, which have more developed manufacturing sectors, exhibit a larger proportion of low-carbon industries such as computer, communication, and other electronic equipment manufacturing (S6) in their carbon footprints. However, high-emission industries such as non-metallic mineral products (S2) and general equipment manufacturing (S3) still dominate their overall emissions [
58]. Provinces like Gansu show relatively low carbon emissions, particularly in sectors such as chemical fibre manufacturing (S1), indicating a lower level of industrialization, with emissions mainly coming from traditional energy use and a few industrial sectors (
Figure 15) [
59].
At the sectoral level, the non-metallic mineral products industry (S2) dominates the carbon footprint in many provinces, especially in Inner Mongolia and Sichuan, highlighting that industries involved in mineral extraction and construction materials production are major sources of carbon emissions. General equipment manufacturing (S3) and electrical machinery and equipment manufacturing (S5) also contribute significantly to carbon emissions in several provinces, particularly in regions with advanced industrial manufacturing. In contrast, the carbon footprints of the computer/communication and other electronic equipment manufacturing industry (S6) and the instrumentation industry (S7) are relatively low, suggesting strong potential for low-carbon development in these sectors and indicating cleaner, more energy-efficient production methods. Therefore, focusing on reducing emissions from high-carbon industries and promoting low-carbon technologies is key to achieving carbon reduction targets in Western China (
Table 7 and
Figure 16).
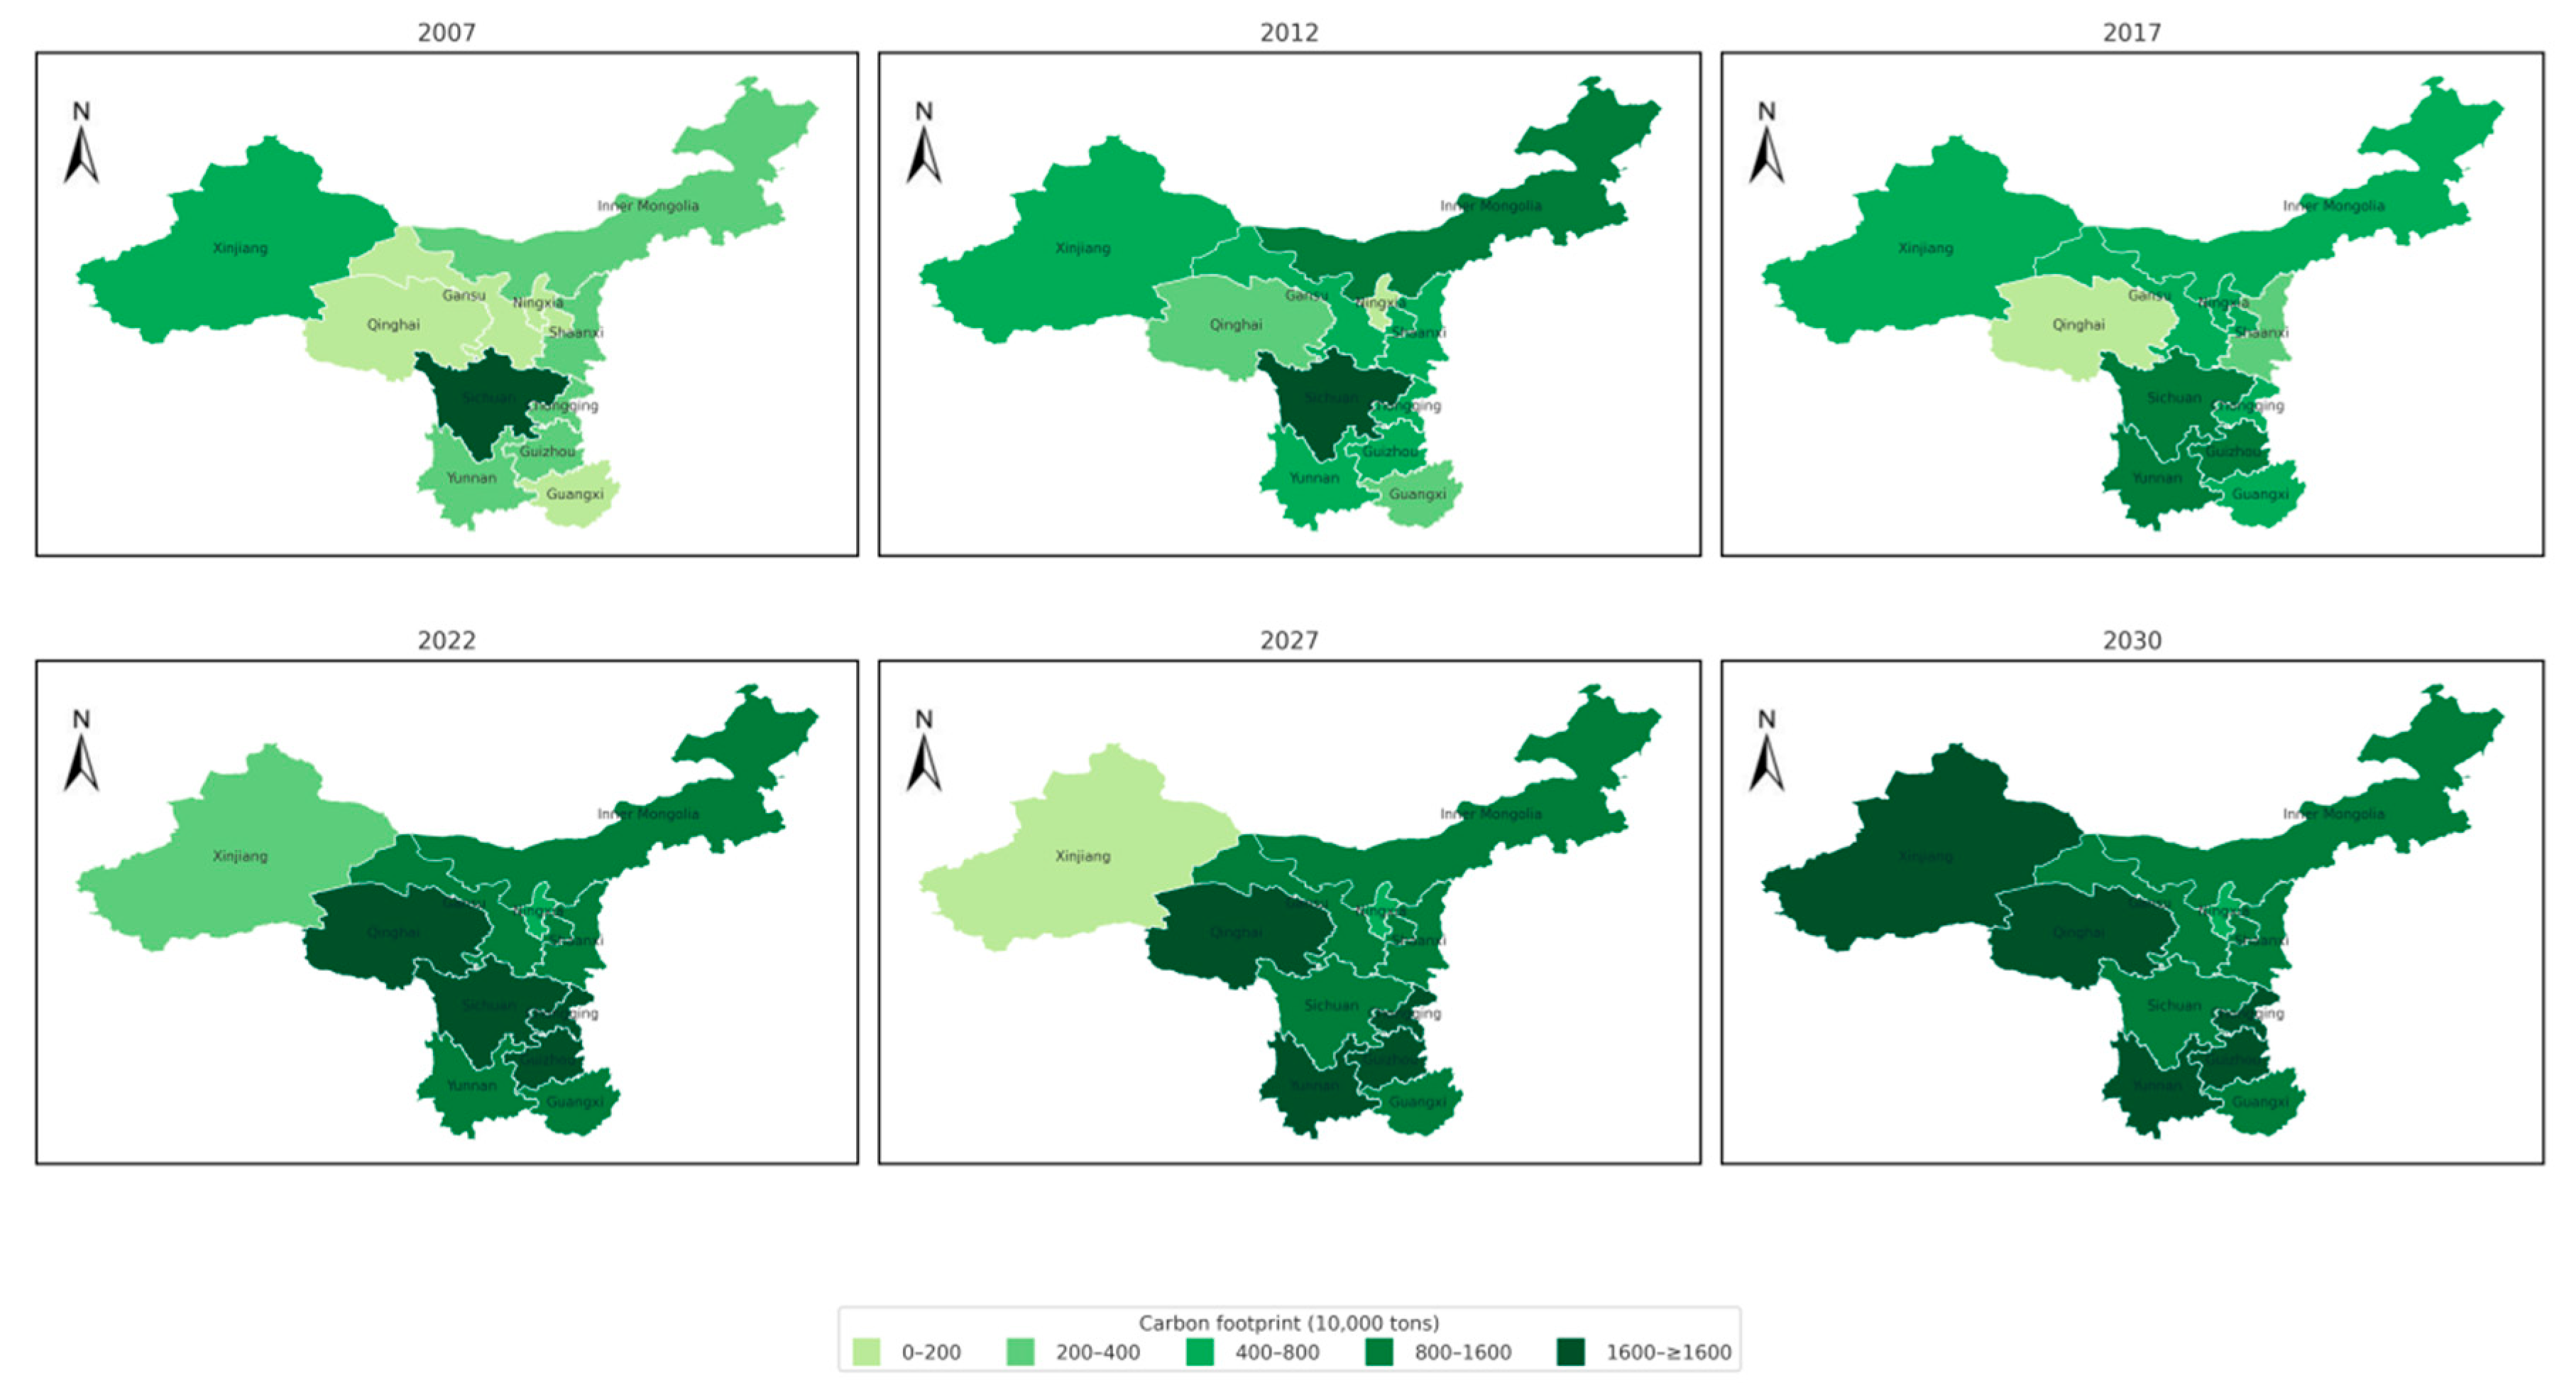
Using ArcGIS Version—10.8 software to map the spatial distribution of carbon footprints of advanced manufacturing industries in Western China during 2007–2030 (see
Figure 17).
The spatial pattern analysis of the carbon footprint of advanced manufacturing industries in Western China in 2017 reveals significant regional disparities. Inner Mongolia exhibited a notably high carbon footprint across all sectors, especially in the non-metallic mineral products industry (S2), reflecting its reliance on energy-intensive industries such as coal and steel. Provinces like Sichuan and Guangxi also showed high carbon footprints, mainly concentrated in heavy industries and general equipment manufacturing (S3), indicating well-developed manufacturing sectors with substantial energy consumption and carbon emissions. In contrast, provinces such as Qinghai and Ningxia recorded relatively low carbon footprints, particularly in more environmentally friendly sectors such as computer/communication and other electronic equipment manufacturing (S6), where emissions were significantly lower than those in other provinces (
Figure 17).
By 2030, the spatial pattern of carbon footprints in Western China’s advanced manufacturing sector is projected to change. Compared with 2017, carbon footprints are expected to increase overall. This trend is particularly pronounced in Inner Mongolia, Sichuan, and Guizhou, especially in the non-metallic mineral products industry (S2) and general equipment manufacturing (S3), indicating the continued growth of heavy industries and resource-intensive sectors in the coming decades. Meanwhile, provinces like Qinghai and Ningxia are projected to experience relatively small increases in carbon emissions, especially in high-tech manufacturing and service industries, suggesting a shift toward a low-carbon and green economy and a reduced dependence on traditional high-carbon sectors.
The spatial evolution of the carbon footprint from 2017 to 2030 illustrates that, with economic development and structural adjustments in manufacturing, regional disparities in carbon emissions are expected to narrow. Although Inner Mongolia, Sichuan, and Guizhou are projected to maintain dominant carbon footprints, the influence of new energy adoption, environmental policies, and industrial transformation may help mitigate overall emissions levels in Western China. At the same time, provinces such as Qinghai and Ningxia are likely to maintain their low-carbon advantages, showing trends toward green manufacturing and efficient energy use.
To assess whether the projected 2030 provincial profiles are policy-consistent and externally plausible, we benchmark each province’s forecasted carbon footprint against indicative 2030 policy targets (caps or intensity-converted caps). We report the gap (Forecast − Target) and a Pass/Fail decision rule (Pass if the forecast does not exceed the target). The results are summarized in
Table 8.
As
Table 8 shows, five provinces meet their indicative 2030 benchmark—Inner Mongolia (−0.73 Mt), Sichuan (−0.47 Mt), Shaanxi (−0.30 Mt), Gansu (−0.05 Mt), and Ningxia (−0.32 Mt)—whereas six provinces exceed their benchmarks—Qinghai (+1.99 Mt), Chongqing (+1.07 Mt), Guizhou (+0.85 Mt), Guangxi (+0.54 Mt), Yunnan (+0.32 Mt), and Xinjiang (+0.29 Mt), yielding a regional overshoot of +3.19 Mt. The pass group is broadly consistent with (i) earlier adoption of cleaner power and process upgrades in key manufacturing lines and (ii) a more balanced growth of output scale. By contrast, the fail group concentrates provinces where energy-intensive subsectors remain prominent and the energy mix converges more slowly.
Linking these patterns to our industry-level grey relational analysis (GRA), two mechanisms dominate: (i) energy factors—notably energy intensity and the electricity/coal mix—together with output scale, which exhibit the strongest correlations with sectoral footprints and are consistent with overshoots in provinces hosting basic-materials and equipment chains; and (ii) technology factors (process efficiency, equipment vintages), which are negatively associated with emissions, implying that diffusion of best-available technologies can materially bend the curve. Guided by these mechanisms and consistent with the spatial–economic drivers identified by the QAP analysis, we propose a targeted package: close the energy-mix gap by accelerating renewable build-out and interprovincial green-power trade—prioritizing long-term PPAs for advanced-manufacturing parks in non-compliant provinces (especially Qinghai, Chongqing, Guizhou); pursue deep retrofits in energy-intensive subsectors (cement/clinker, glass, non-metallic minerals, heavy equipment) via waste-heat recovery, high-efficiency drives, low-clinker cements, process electrification, and selective CCUS at high-purity sources; accelerate technology diffusion through province-to-province retrofit funds and vendor-assisted performance contracts directed to Chongqing, Guizhou, Guangxi, complemented by digital energy-management systems; implement supply chain governance along contiguous corridors (harmonized energy/heat-reuse standards and coordinated “brown-to-green” supplier upgrading) to curb cross-border rebound; and embed open-economy safeguards (green procurement, low-carbon product standards, supplier disclosure) so that trade transmits low-carbon practices rather than carbon leakage. For Inner Mongolia, Sichuan, Shaanxi, Gansu, Ningxia, which already meet indicative targets, maintain momentum through performance-based energy quotas, best-in-class process benchmarks, and continuous green-power contracting. Collectively, aligning provincial action with the GRA-identified energy and technology levers—while acting on spatial and development gradients highlighted by QAP—offers a credible pathway to convert today’s mixed compliance into region-wide attainment of the 2030 goal.
3.3.2. Analysis of the Forecasting Results of Embodied Carbon Transfer
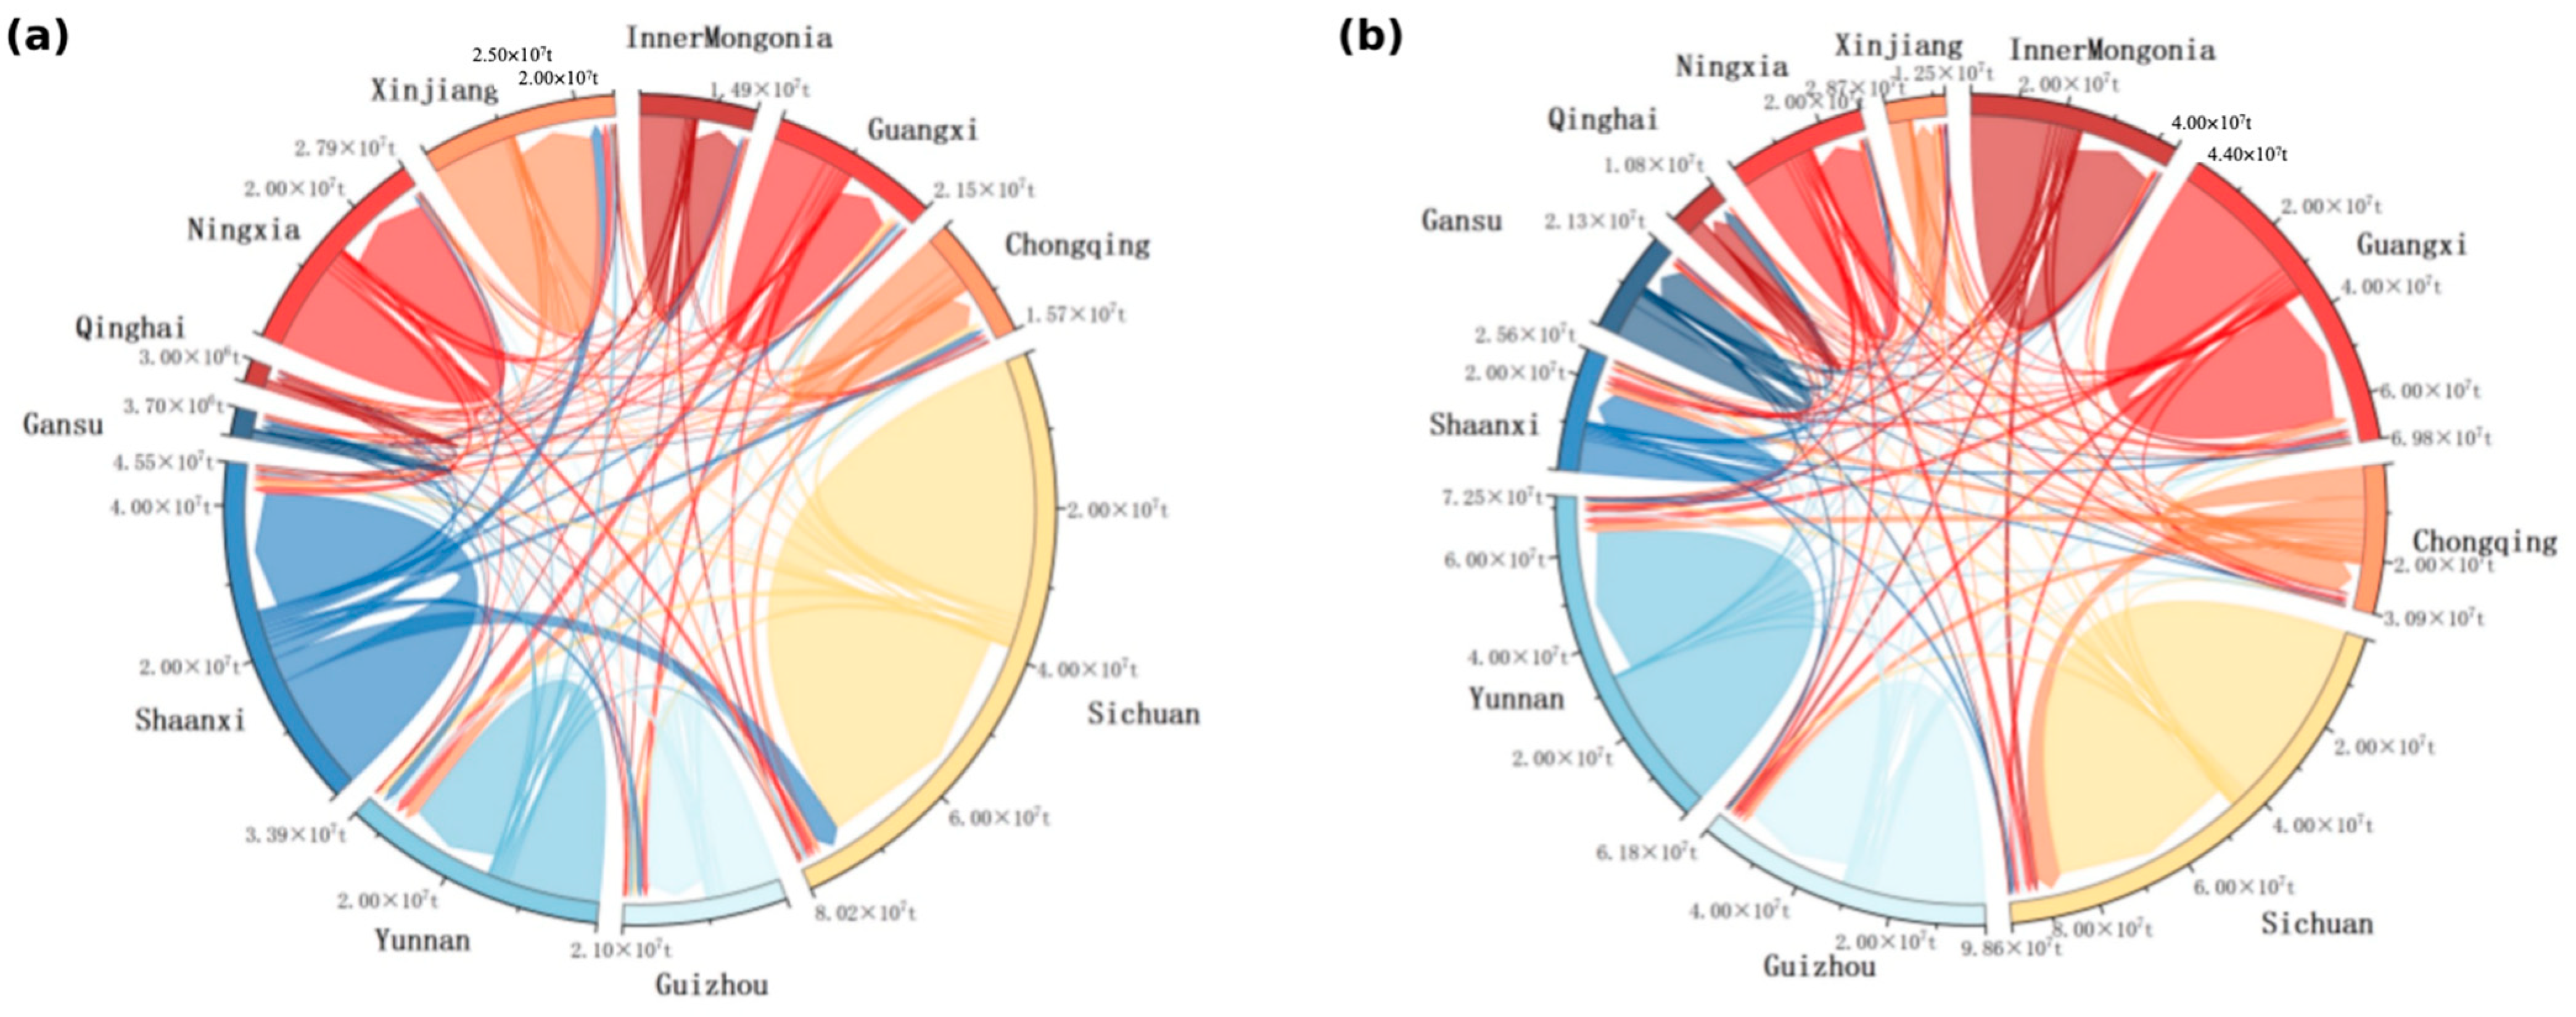
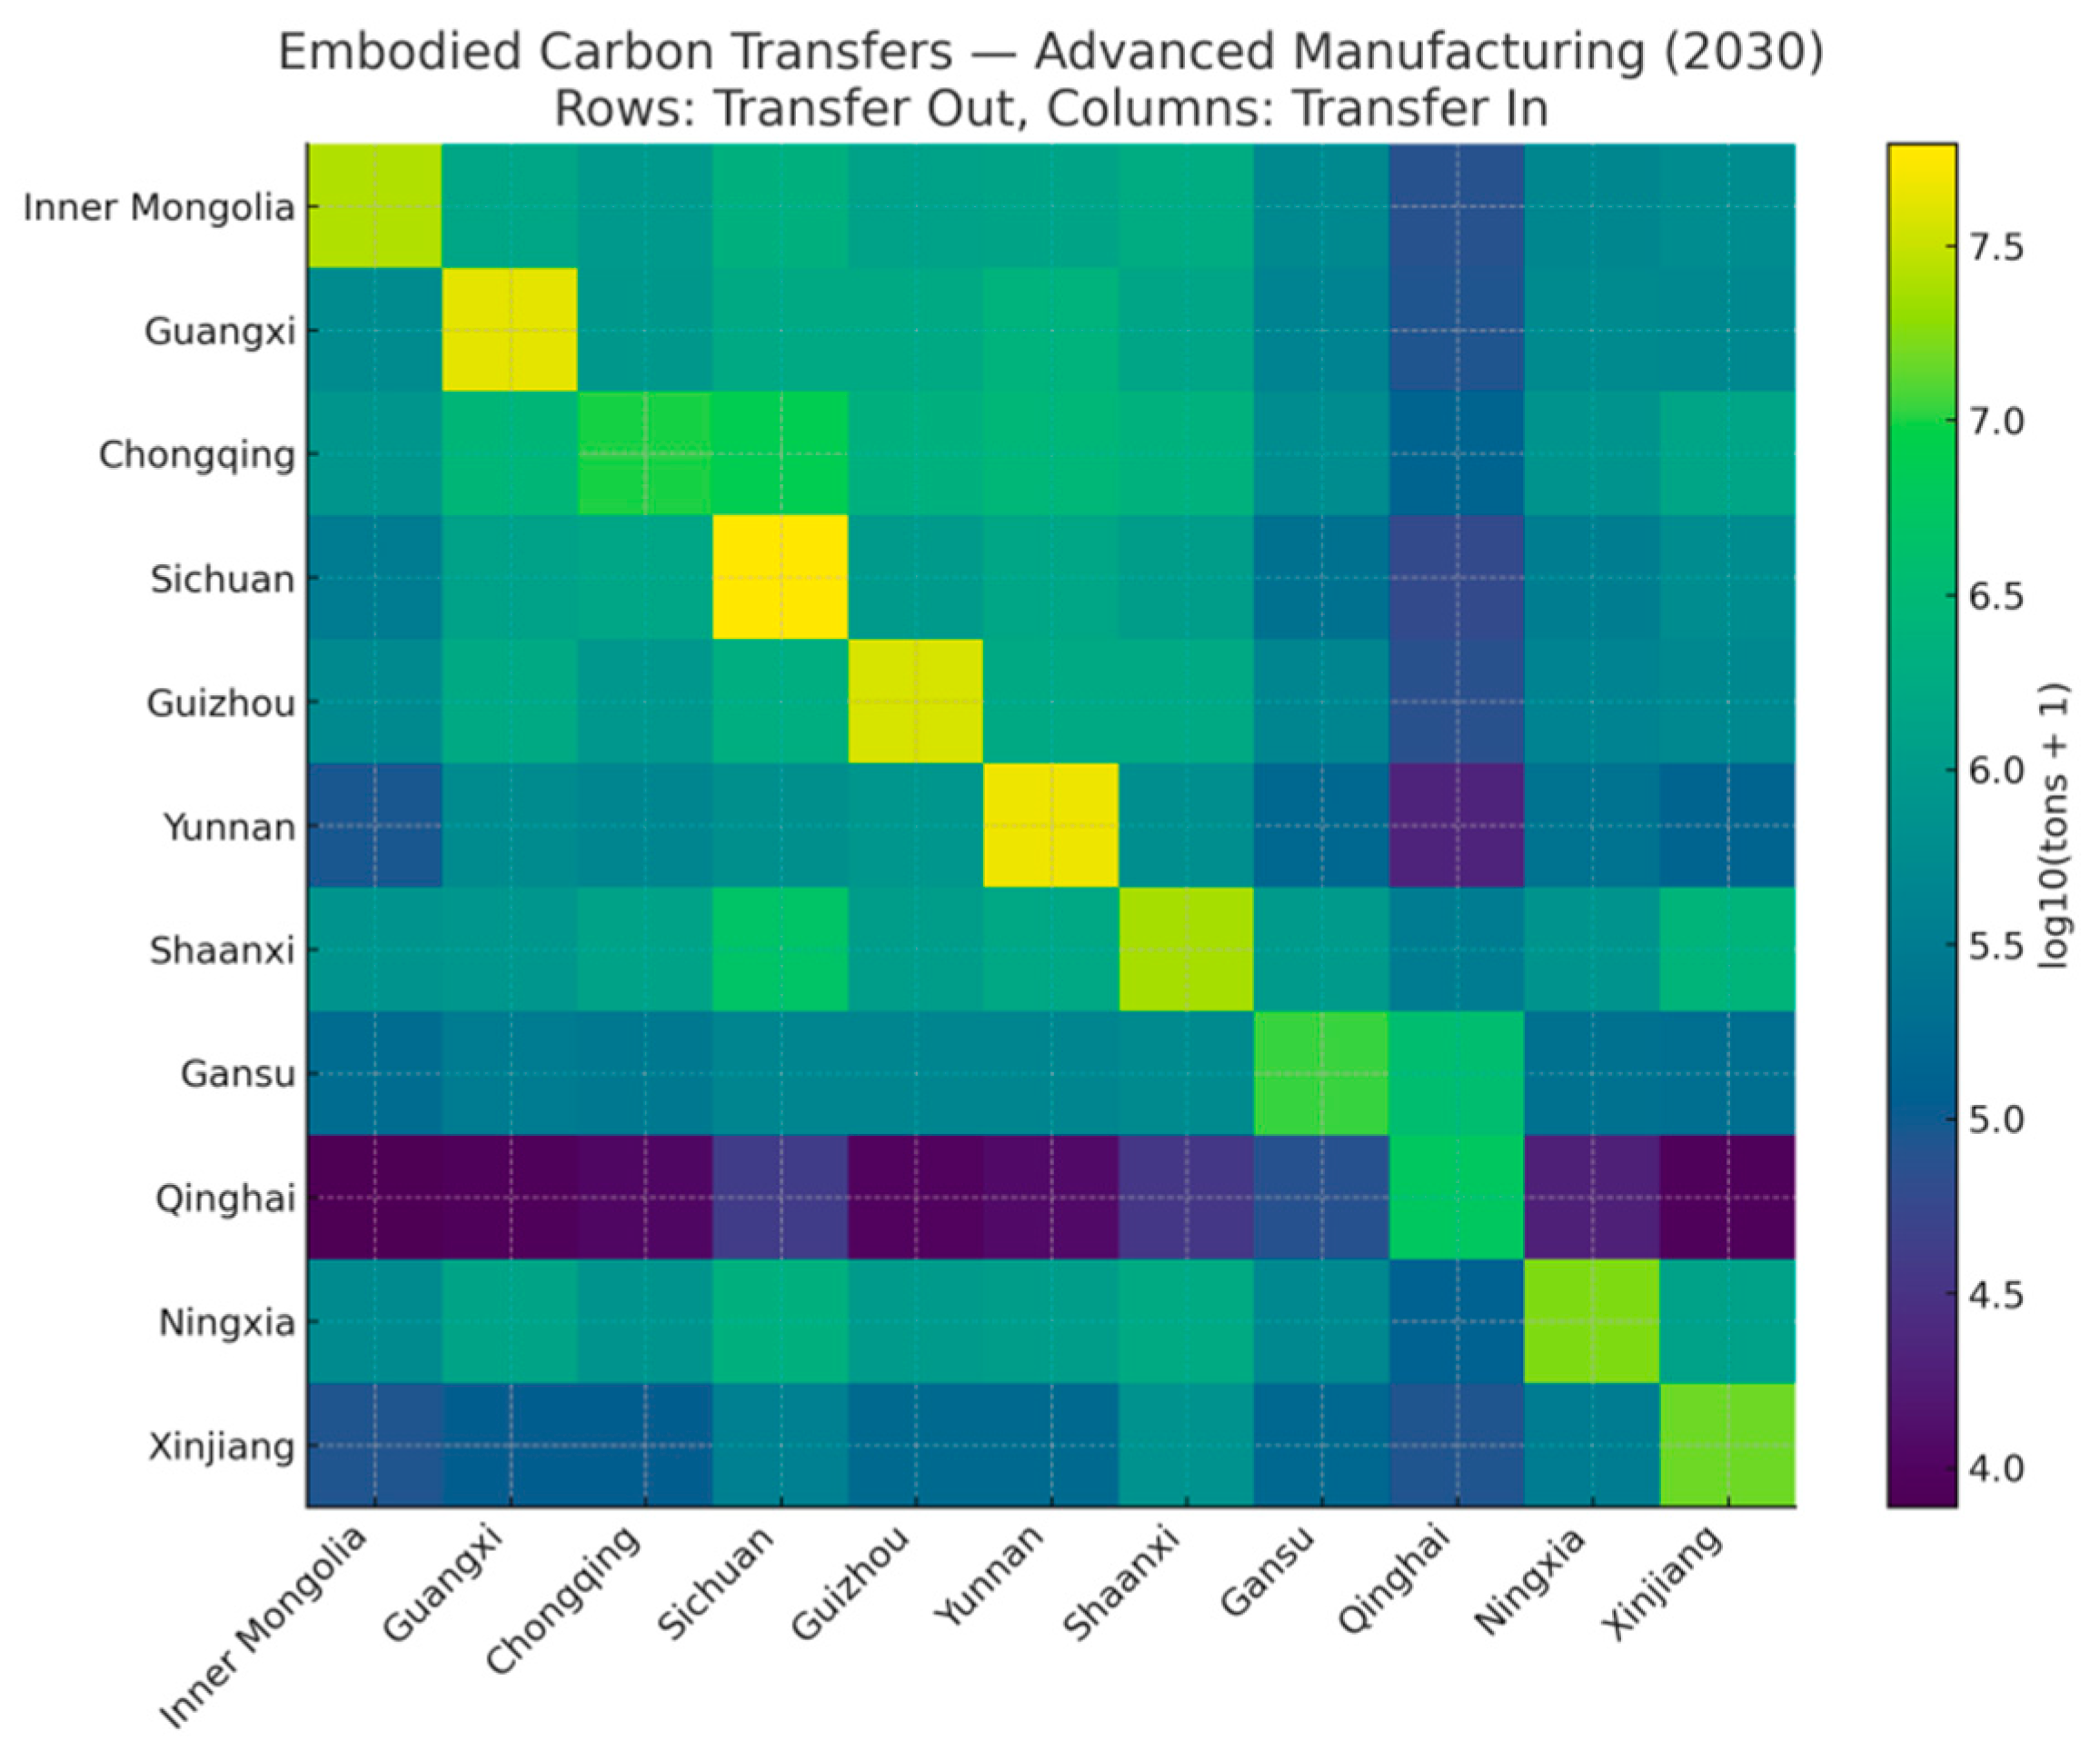
Using the WOA-Grey Neural Network Model to forecast interprovincial and intersectoral embodied carbon transfers in Western China’s advanced manufacturing industry in 2030 (see
Table 9 and
Table 10,
Figure 18 and
Figure 19).
In 2030, the interprovincial embodied carbon transfer of advanced manufacturing in Western China is characterized by concentrated scale, a pronounced core–periphery structure, and active bidirectional flows. Overall, Sichuan, Yunnan, Guangxi, Guizhou, and Chongqing are the provinces with the largest volumes of embodied carbon transfers. Notably, Sichuan and Yunnan exhibit particularly large internal embodied carbon flows (i.e., intra-provincial transfers), reaching 61.976 million tons and 47.942 million tons, respectively, indicating that carbon emissions and manufacturing output are highly concentrated within these provinces. At the same time, Guangxi, Guizhou, and Ningxia demonstrate strong capabilities in embodied carbon outflows, transferring substantial carbon emissions to neighbouring provinces such as Chongqing and Sichuan. Several key factors contribute to this spatial pattern: first, Sichuan, Yunnan, and Guangxi have large-scale advanced manufacturing industries with long industrial chains and strong local consumption and processing demands, leading to both high internal and outward embodied carbon transfers; second, Guizhou and Ningxia, as providers of energy and raw materials, exhibit export-oriented characteristics with industrial structures dominated by energy-intensive and high-emission sectors; third, industrial linkages among western provinces have strengthened, resulting in the formation of a carbon transfer network centred around core provinces and supported by surrounding regions. Overall, the regional industrial division of labour and energy consumption structure determine the spatial distribution characteristics of embodied carbon transfer across Western China’s advanced manufacturing sector (
Table 9 and
Figure 18) [
21].
In 2030, the intersectoral embodied carbon transfer within the advanced manufacturing industry of Western China exhibits characteristics of “cumulative advantage dynamics, internal concentration, and prominent key nodes.” The non-metallic mineral products industry (S2) serves as the absolute core of carbon transfer, with a massive volume of internal transfers and significant carbon outflows to other sectors. This is followed by the general and special equipment manufacturing industry (S3) and the aerospace and other transportation equipment manufacturing industry (S4), reflecting the scale effect of the industries and the driving role of upstream and downstream linkages [
60]. The formation of this carbon transfer pattern is mainly influenced by a combination of factors, including sectoral output scale, energy intensity, and the degree of industrial chain interconnection (
Table 10 and
Figure 19) [
61].
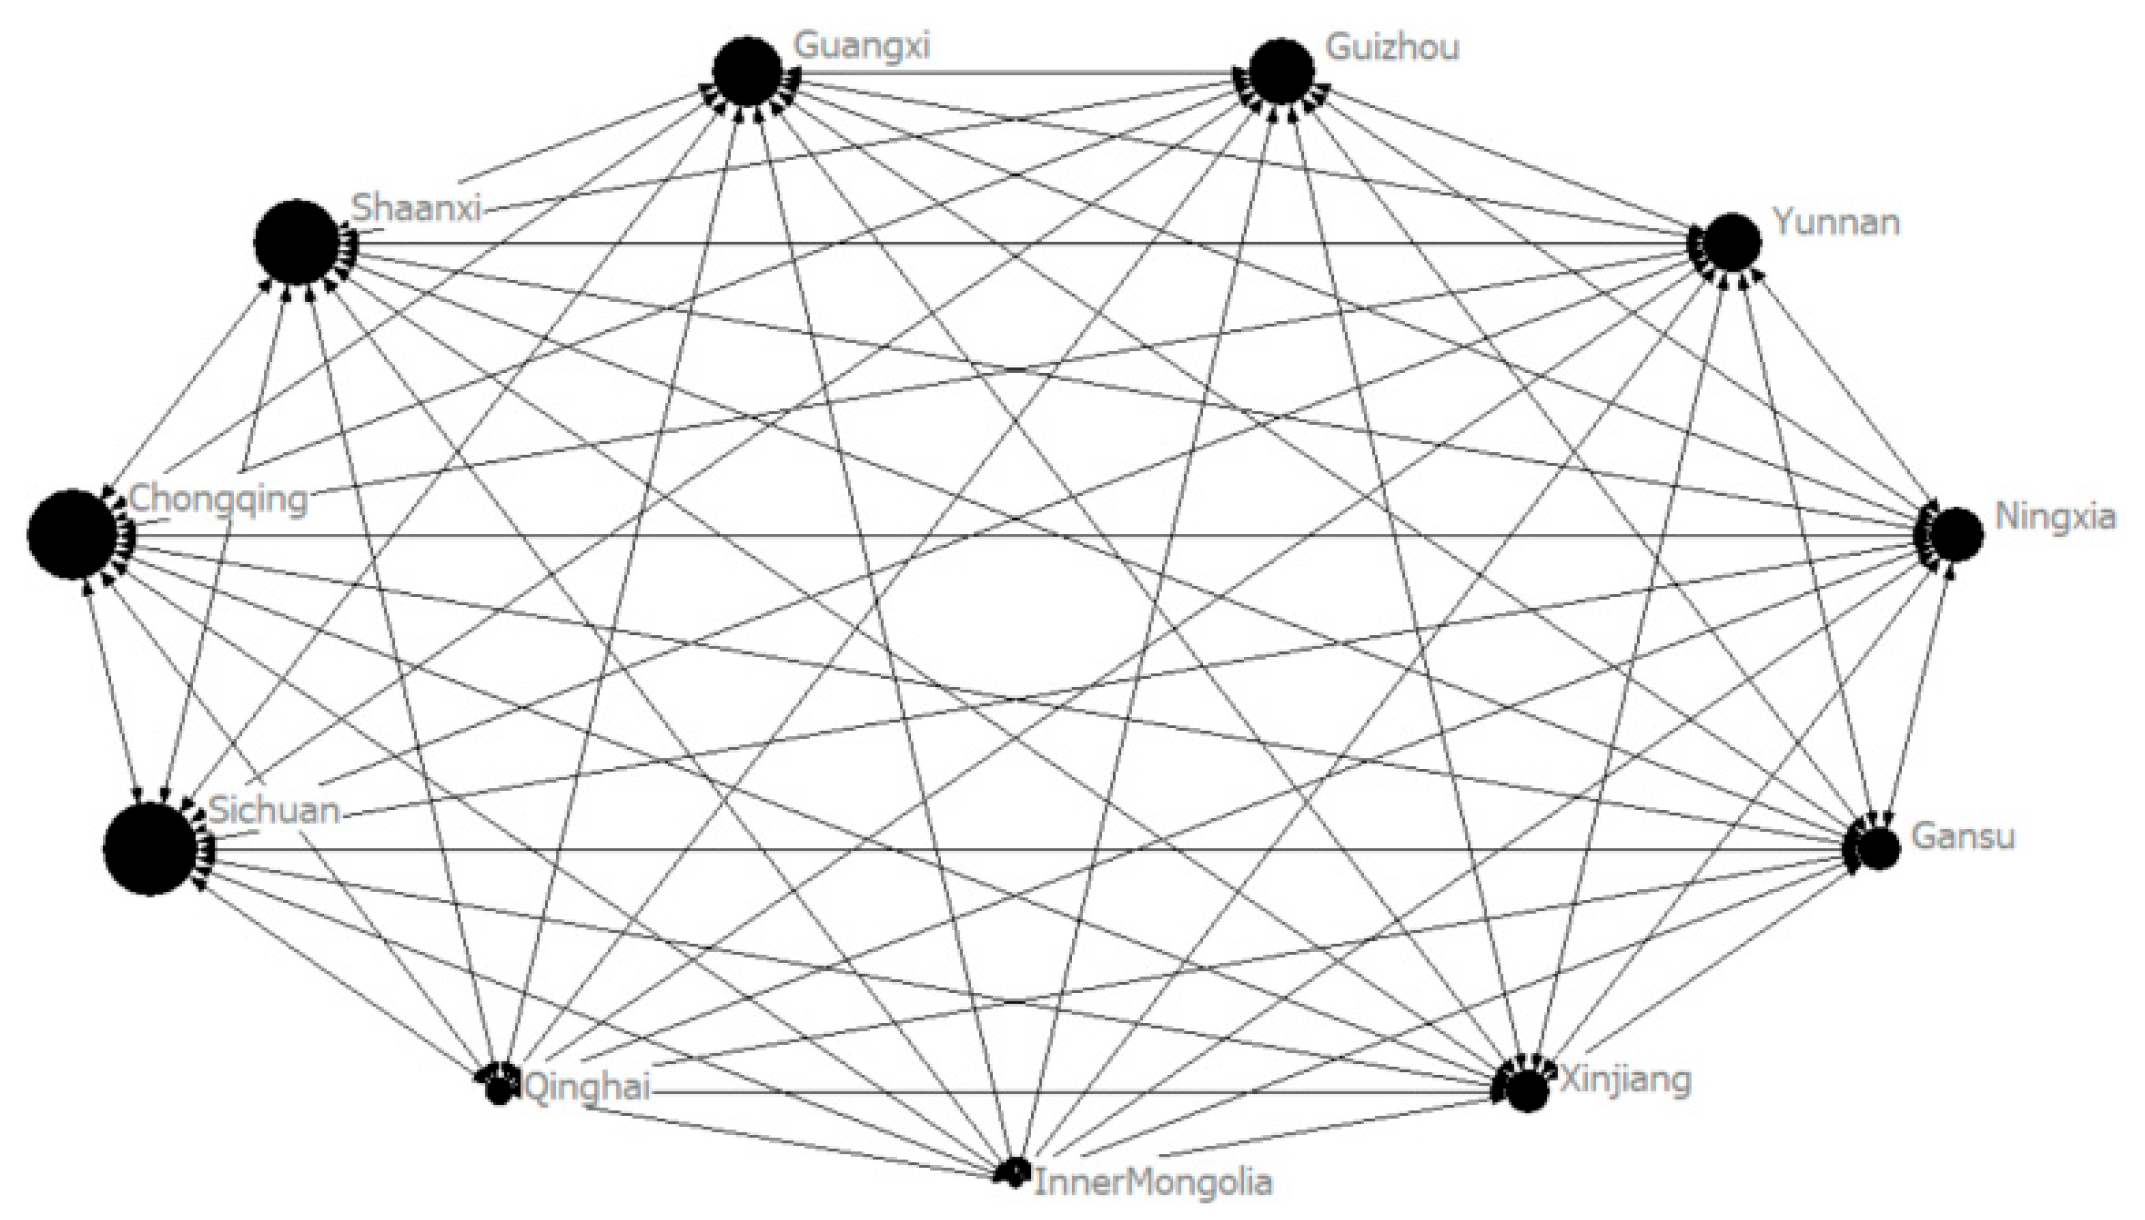
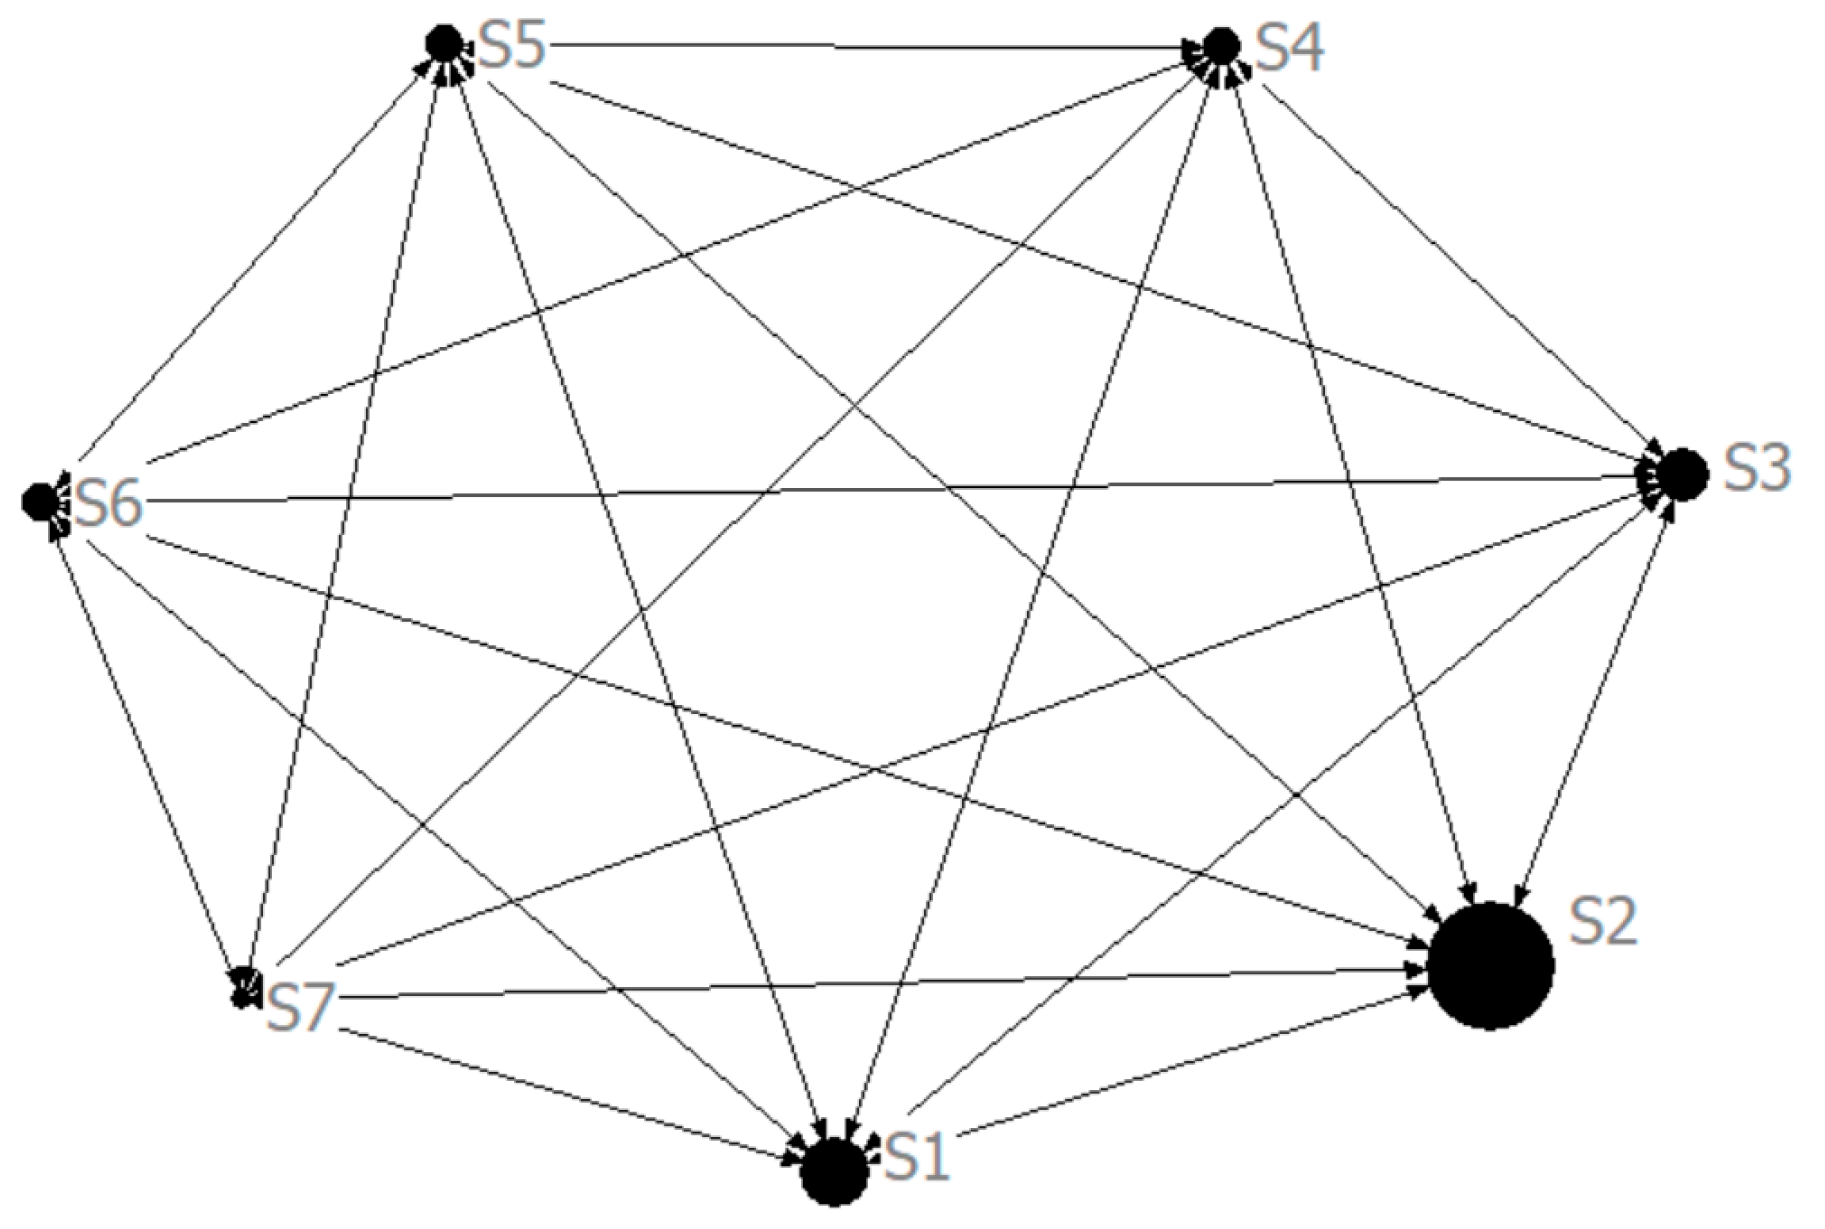
Based on the 2030 forecasting results of interprovincial and intersectoral embodied carbon transfers in the advanced manufacturing industry of Western China, directed network diagrams of embodied carbon transfer are created using UCINET 6 Version—6.780 software. In these diagrams, the direction of the arrows represents the direction of embodied carbon transfer, while the size of each network node is determined by the total amount of embodied carbon emissions transferred out from and into that node (see
Figure 20 and
Figure 21). In addition, we operationalize the province- and sector-level systems as weighted, directed graphs and conduct quantitative social-network analysis to compute degree centrality (decomposed into out-, in-, and total degree), betweenness centrality (Freeman), and closeness centrality (reciprocal geodesic distance) (
Table 11 and
Table 12), thereby identifying dominant sources/exporters (high out-degree), sinks/importers (high in-degree), brokers (high betweenness), and efficiency hubs (high closeness) in both the interprovincial and intersectoral networks (see corresponding summary tables).
By 2030, the interprovincial embodied carbon transfer pathways of advanced manufacturing in Western China exhibit a dual pattern of “internal concentration and external diffusion,” dominated by core provinces and marked by intensive transfers between neighbouring regions. Provinces such as Sichuan, Guangxi, Guizhou, and Ningxia have developed large-scale internal self-circulating carbon transfer systems, reflecting mature manufacturing structures and strong intra-provincial industrial coupling. At the same time, Sichuan, Chongqing, Guangxi, and Guizhou act as key carbon-exporting hubs, transferring substantial embodied carbon to nearby provinces like Yunnan, Ningxia, and Gansu. Notably, Sichuan functions as both a major internal circulator and an interprovincial hub, transferring emissions to areas such as Qinghai, Xinjiang, and Ningxia. These transfer patterns reveal significant geographical proximity effects and are driven by factors such as resource endowment, regional industrial coordination, and transportation cost minimization. Meanwhile, resource-based provinces like Inner Mongolia, Gansu, and Qinghai serve as both carbon importers and suppliers of raw materials and energy, underscoring their foundational role in the regional supply chain. Overall, these dynamics are shaped by disparities in industrial structures, development stages, and geographical advantages, reflecting both deepening regional cooperation and uneven carbon burden distribution, which poses differentiated challenges for green and low-carbon transitions (
Figure 20 and
Table 11).
At the sectoral level, the embodied carbon transfer network of Western China’s advanced manufacturing industry in 2030 is centred on the non-metallic mineral products industry (S2), supported by equipment manufacturing sectors (S3 and S5) and the electronic communication industry (S6). S2 acts as the primary carbon-exporting sector with substantial internal flows (S2→S2: 247 million tons) and large-scale transfers to S1, S3, S5, and S6, indicating its critical role in material supply. S3 functions as a hub in both receiving and redistributing carbon to downstream sectors such as S4, S5, and S6, forming a typical midstream diffusion pathway. S5 links to terminal high-tech sectors like S7, reflecting further specialization within the industrial chain. Meanwhile, S6 not only has significant internal flows (S6→S6: 4.5525 million tons) but also engages in reverse transfers, highlighting its growing importance in supporting technological advancement. These patterns align with the industrial logic of material input, processing, and end-product output, showing a transition from resource-intensive to technology-intensive production. The scale of carbon flows in foundational sectors underscores Western China’s role in supporting the national manufacturing base, while increasing transfers in high-tech industries reflect progress in industrial upgrading and green transformation (
Figure 21 and
Table 12).
3.3.3. QAP-Based Analysis of Factors Influencing the Embodied Carbon Transfer Network
- (1)
QAP correlation analysis
Before running the QAP regression, we first examined the association between each explanatory matrix and the spatial linkage network of embodied carbon transfers in Western China’s advanced manufacturing sector using a QAP correlation test. Specifically, all matrices were imported into UCINET and subjected to 5000 random permutations to obtain inference results (
Table 13). The findings show that the correlation coefficients for geographic contiguity, industrial-structure differentials, economic-development differentials, technology differentials, and openness differentials are all positive. Among them, geographic contiguity, industrial-structure differentials, and openness differentials pass significance at the 5% level, while technology differentials are significant at the 10% level—indicating these factors positively promote spatial linkages of embodied carbon transfers. By contrast, the energy-mix differential exhibits a negative correlation coefficient that is significant at the 1% level, implying that narrowing interprovincial differences in energy consumption structure tends to strengthen the connectivity among nodes in the embodied carbon transfer network.
- (2)
QAP Regression Analysis
Using UCINET with 5000 permutations, the QAP regression results were obtained, as reported in
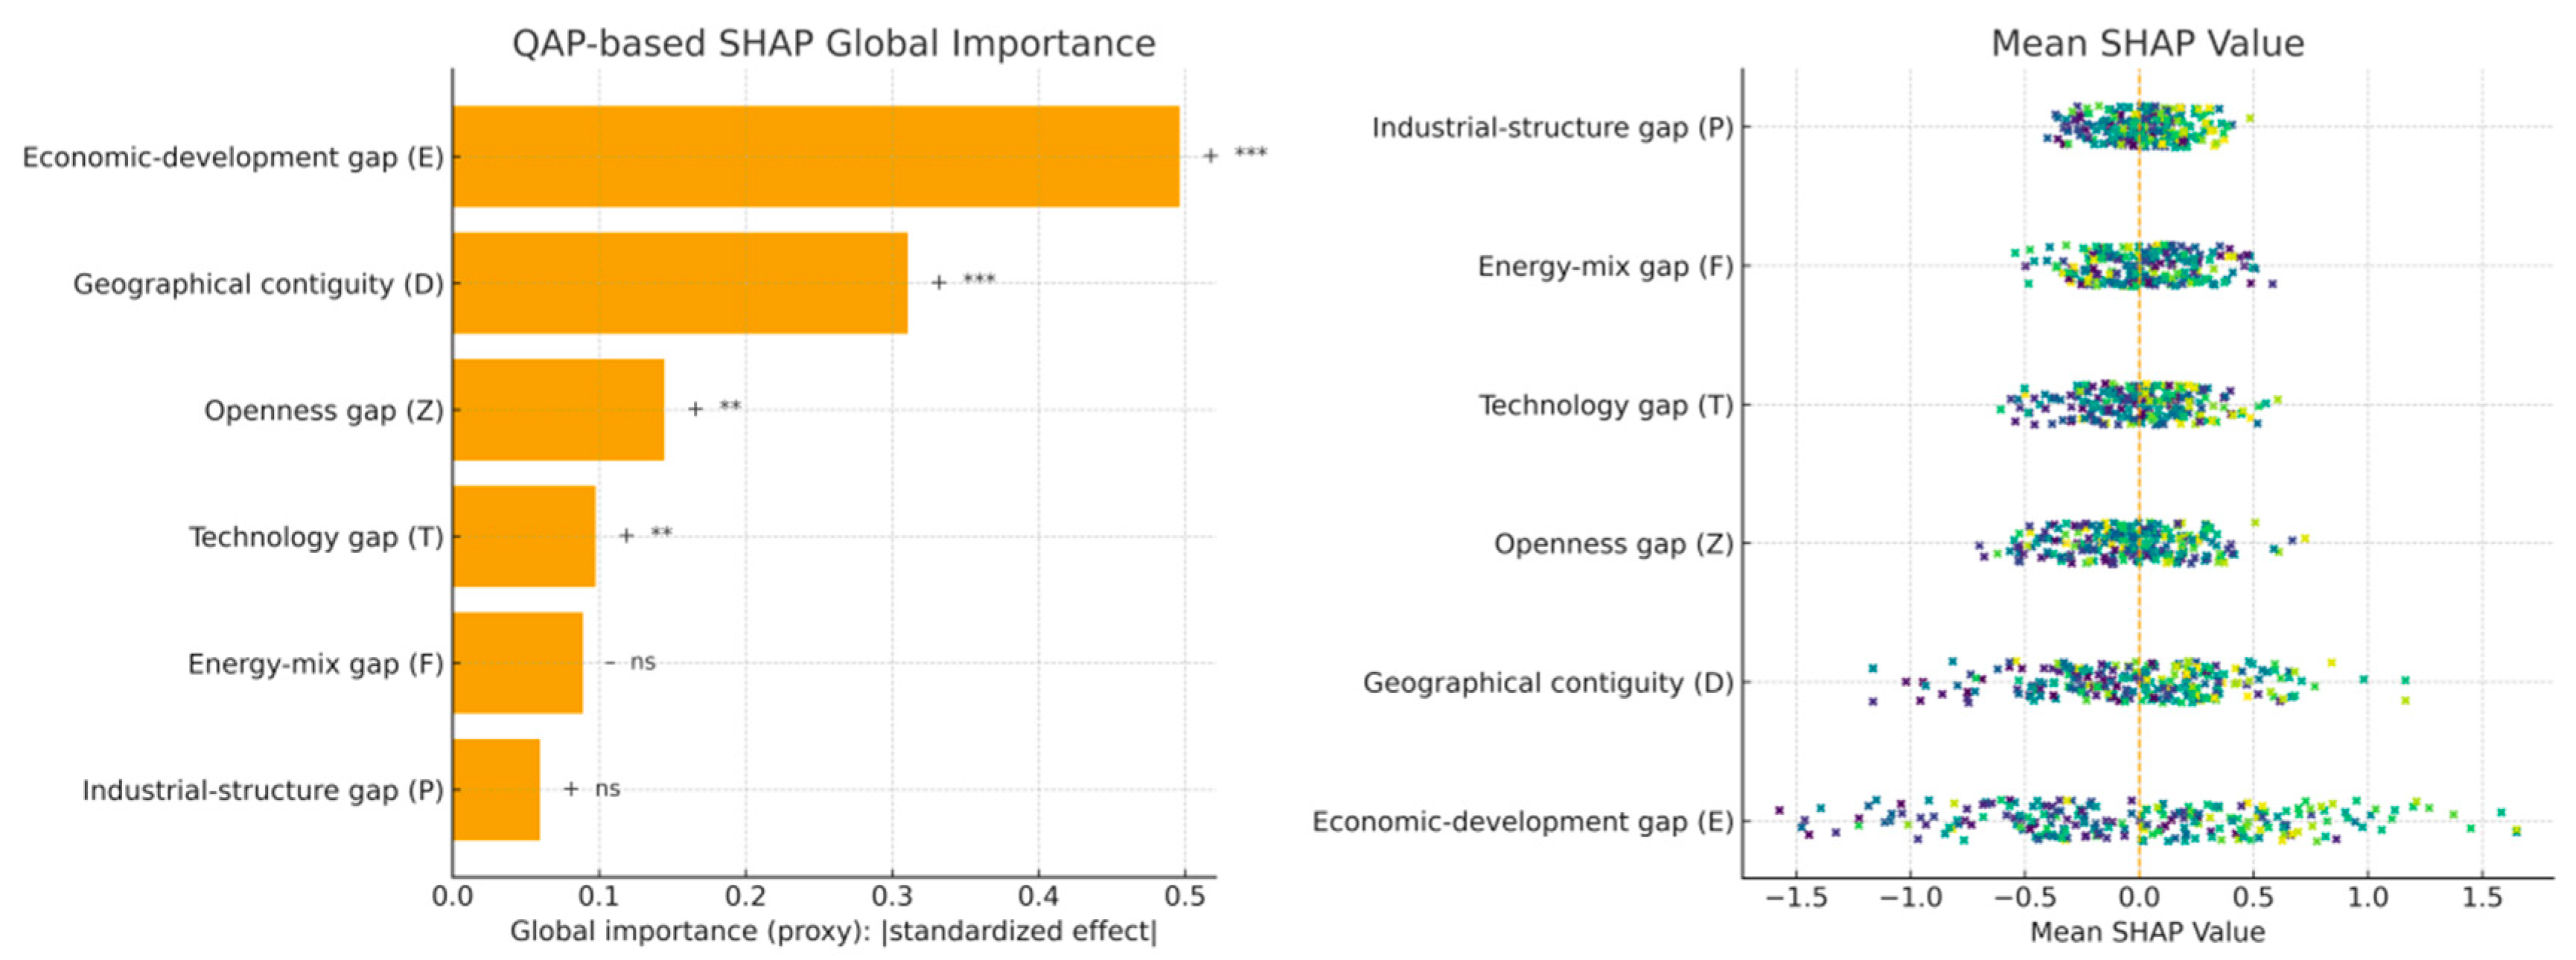
Table 14. To enhance interpretability beyond permutation-based coefficients, we additionally conduct a SHAP analysis: a supervised surrogate model (gradient-boosted regression) is trained on the vectorized dyadic data (Net ~D, F, P, E, T, Z), and SHAP values are computed to decompose each predictor’s marginal contribution to predicted link intensity. We report a global importance bar chart (mean |SHAP|) together with a beeswarm plot to reveal heterogeneity across dyads; concordance between SHAP rankings and QAP standardized coefficients is used as a robustness check, while any divergences are interpreted as evidence of non-linear or interaction effects in the drivers of embodied carbon link formation (see
Figure 22).
According to the QAP regression (
Table 8), the model fits well (R
2 = 0.561; Adj. R
2 = 0.541; overall significant) and isolates several key drivers of the spatial association network of embodied carbon transfers in Western China’s advanced manufacturing. First, geographic contiguity (D) is positive and highly significant (unstandardized 0.2985; standardized 0.3107;
p < 0.01), indicating that adjacent provinces exchange embodied carbon more intensively—consistent with the mechanism of shorter transport distance → lower factor/intermediate-goods flow costs → tighter interprovincial supply chain coupling. Second, economic development differentials (E) are both statistically and economically dominant (0.9018; 0.4961;
p < 0.01), suggesting that greater interprovincial divergence more readily generates a “core–periphery” structure—where high-end manufacturing attracts factors and induces upstream intermediate-goods spillovers—thereby strengthening cross-province embodied carbon transfers along the supply chain. Third, openness differentials (Z) and technology differentials (T) are also positive and significant at the 5% level (Z: 0.2421; 0.1445;
p = 0.041; T: 0.1878; 0.0976;
p = 0.028), implying that higher openness gradients position the more open provinces as “gateway nodes” linking external demand with domestic interprovincial supply chains, while technology gaps—amid incomplete diffusion of clean technologies—encourage vertical specialization and cross-province collaboration in intermediates, raising the intensity of embodied carbon transmission. By contrast, energy-mix differentials (F) are negative but not significant (−0.1627; −0.0889;
p = 0.152), hinting that convergence/cleaning of provincial energy mixes may facilitate network coupling but—with structural inertia—lacks strong statistical support in the sample window; industrial-structure differentials (P) are positive yet insignificant (
p = 0.238), indicating limited marginal explanatory power once E/Z/T are controlled. Ranking by standardized effects yields E (0.4961) > D (0.3107) > Z (0.1445) > T (0.0976) (all significant), with F and P not significant.
SHAP diagnostics corroborate these findings: the global importance (mean |SHAP|) follows the same ordering (E > D > Z > T), while the beeswarm indicates predominantly positive contributions of D, E, Z, and T across dyads, a negative median contribution for F concentrated among coal-heavy pairs, and uniformly small effects for P. SHAP partial-dependence patterns are monotonic for D and E (stronger contiguity and larger economic gaps raise predicted link intensity), with weaker but positive lift for Z and T, reinforcing the QAP interpretation. Policy-wise, geographic contiguity and economic divergence emerge as first-order forces strengthening the network, with openness and technology gradients providing a secondary positive push. Accordingly, coordinated low-carbon governance should prioritize corridor-type provincial pairs for clean-technology diffusion and energy-mix coordination (thus narrowing F), while leveraging high-quality openness and factor-flow governance to steer supply chain specialization toward lower-carbon, more proximal configurations—ultimately dampening both the intensity and the emission content of cross-province embodied carbon transfers.
