Abstract
A significant transition is taking place in China’s urban development, which is moving away from rapid expansion and towards improved quality and efficiency. The distribution of primary education resources is thus experiencing a substantial change: transitioning from a traditional emphasis on merely providing school placements to becoming a systematic effort intricately linked with the functional attributes of adjacent urban environments. Nonetheless, current research has not comprehensively examined the relational dynamics between primary schools and adjacent facilities, nor the discrepancies in these dynamics across various cities. This study analyzes nine major Chinese cities as case studies to investigate the compatibility between elementary schools and adjacent infrastructure. It develops a compatibility model through data gathering, feature selection, and model validation. Significant findings indicate the following: (1) The models trained using several machine learning methods to assess the suitability of primary schools in nine cities for their surrounding facilities all obtained accuracy rates surpassing 72%, with Random Forest displaying the most consistent performance across several cities. (2) Developed cities prioritize spatial coordination among schools, with the SHAP feature representing 20.37% of its significance; conversely, less developed cities exhibit a stronger inclination towards coordinated placement with educational and training facilities, where the SHAP feature constitutes 20.52% of its significance. (3) The compatibility of primary schools with surrounding facilities suggests that Guangzhou, Zhengzhou, and Chongqing possess considerable prospective need for education, whereas the existing distribution in Beijing, Shanghai, and Tianjin is rather well-structured. This study provides a novel, data-driven framework for optimizing educational resource allocation, offering critical insights for achieving sustainable urban development and quality education in China’s cities as they evolve.
1. Introduction
Quality education is a fundamental objective of global sustainable development, and its resource distribution significantly influences the destiny of urban areas [1,2]. As of 2023, 93 cities at the prefecture level and higher in China have been designated as child-friendly cities, representing almost one-third of the national total, indicating that relevant initiatives have progressed to large-scale implementation. To facilitate this advancement, China has methodically established an education system encompassing teacher ethical standards, home-school partnerships, teacher professional growth, and equitable resource distribution [3]. Since 2015, China has sustained an average annual growth rate of 7.7% in expenditures on basic education, which is considered essential for the system’s effective operation [4]. In this context, China’s urban development is transitioning from extensive growth to an emphasis on enhancing the quality and efficiency of current infrastructure [5,6,7]. The enhancement of fundamental educational facilities, particularly primary schools, has emerged as a critical determinant affecting sustainable urban growth and the quality of life for people [8,9,10,11]. The introduction of the objective to create ‘child-friendly cities’ coincides with the strategic positioning mandates for national central cities, which are tasked with occupying critical strategic locations, fulfilling national missions, leading regional development, engaging in international competition, and embodying the national image [12,13,14]. The distribution of educational resources has evolved from merely providing degrees to a systematic initiative intricately linked with urban functions [15,16]. Numerous national center cities have embraced the planning principle of ‘education follows people, with supporting facilities constructed around industries’ to implement comprehensive methods in the coordinated planning of educational institutions and adjacent amenities [17,18,19]. These investigations have uncovered the intricacy and spatial variability of the link between primary schools and adjacent infrastructures, which necessitate scientific tools for assistance.
Primary schools and their adjacent amenities collaboratively facilitate the daily operations of educators and pupils, constituting a tangible manifestation of the constructed environment of primary schools. In conventional planning methodologies, the placement of primary schools and the configuration of adjacent facilities are frequently determined by designers’ expertise and regulatory criteria, augmented by macro factors such as population density and service radius [20,21]. This model frequently overlooks the distinctive environmental base established by prolonged urban development, resulting in homogenization in planning and uncertainty in the rationale for facility configuration decisions.
Recent years have witnessed significant advancements in correlation-based research methodologies within the domains of social sciences, education, and urban planning. Common instances involve quantifying the specific advantages of enhancements to the built environment on designated facilities through the application of Pearson’s correlation coefficient [22,23,24]. Utilizing structural equation modeling (SEM) to assess the influence mechanisms between public service facilities and resident satisfaction [25,26,27]. In geographic information technology, scholars frequently employ traditional spatial autocorrelation or heterogeneity methods to analyze the similarity between the attributes of facilities within a study unit and those in neighboring areas [28,29,30,31,32]. The study employs distance buffers and accessibility analysis to examine the spatial distribution of facilities within a defined range and their relationship with public service facilities [33,34]. Additionally, spatial syntax models are utilized to assess the equity of public service facility usage [35,36]. Numerous researchers utilize geographic time-weighted regression (GTWR) to examine the spatiotemporal evolution effects of renovations in public service facilities [37,38,39].
Existing methods offer valuable insights for optimizing facility environments; however, they encounter two primary limitations. First, research predominantly emphasizes correlation detection in environments with existing target facilities, neglecting the impact mechanisms in areas devoid of such facilities, like regions lacking primary schools. Second, traditional method indicators, including the Moran index, can identify correlations between variables but fail to establish causal relationships. The field of urban planning currently lacks scientific and quantitative decision-support technologies for the arrangement of facilities surrounding primary schools.
Machine learning models provide significant insights into feature interpretation, especially by quantifying the marginal contributions of features, such as through Sharpley Additive exPlanations (SHAP), within a game theory framework [40,41]. Existing research has not systematically assessed the differences among various models regarding interpretability, computational efficiency, and spatial generalization capabilities, which has impeded the transfer of technology to planning practice [42,43,44]. This study integrates three algorithms: Decision Tree, Random Forest, and XGBoost. This is primarily due to the fact that all three utilize decision trees as their foundational models, enabling feature interpretability, and incorporate complementary algorithmic mechanisms. A single decision tree provides optimal interpretability, whereas Random Forest and XGBoost improve robustness and predictive accuracy through ensemble methods [45,46,47]. This study proposes a multi-model ensemble validation framework to meet the dual requirements of feature interpretability depth and model accuracy, thereby mitigating potential real-world losses resulting from incorrect facility relationships. This study employs cross-validation and feature contribution analysis to investigate the relationship between primary schools and their surrounding facilities, offering quantitative evidence to inform scientific planning decisions.
This study attempts to comprehensively examine the spatial compatibility of primary schools and adjacent facilities in nine important cities around China, with the following objectives: (1) Comparing the strengths and weaknesses of different algorithms in exploring the compatibility between primary schools and surrounding facilities to facilitate prioritization for diverse application scenarios; (2) Execute a thorough evaluation of the spatial compatibility between primary and secondary schools and various facilities across diverse cities, employing multiple machine learning models; (3) Based on the compatibility relationships of facilities, offer optimization recommendations and projections for the planning and arrangement of primary schools in various cities.
2. Materials and Methods
2.1. Study Area
By the conclusion of 2024, China’s urbanization rate attained 66.7% [48]. The urbanization process is currently evolving from rapid growth to stable development, with urban development models switching from large-scale expansion to a primary focus on enhancing the quality and efficiency of existing urban areas. Large cities, as pivotal engines of regional development, confront the essential challenge of urban renewal in their future advancement. Nonetheless, the allure of major cities persists, and moderate urban growth will endure [49]. Amidst rising urbanization, the provision of urban public service facilities is often inadequate, a challenge that is especially evident in major cities. Primary schools in China’s major cities, as a crucial element of fundamental public service infrastructure, have two significant challenges: enhancing the quality of educational resources in existing urban regions and guaranteeing sufficient educational facilities in newly developed urban areas.
The role of large cities as engines of regional development has become increasingly significant in the context of globalization. In this context, China has identified nine national central cities: Beijing, Tianjin, Shanghai, Guangzhou, Chongqing, Chengdu, Wuhan, Zhengzhou, and Xi’an (refer to Figure 1 for their locations and Table A1 for their profiles). The development of these nine cities has substantial implications for China’s overall progress, with their construction models serving as benchmarks and examples for other urban areas. Examining the issues of these nine cities is crucial for the sustainable development of urban areas in China. This study examines nine central cities, performing a longitudinal analysis of the universal connections between primary schools and their surrounding facilities. Additionally, it conducts a horizontal comparison of regional differences in the built environment around primary schools, shaped by the developmental processes of various cities, thereby offering empirical evidence for high-quality urban development in China.
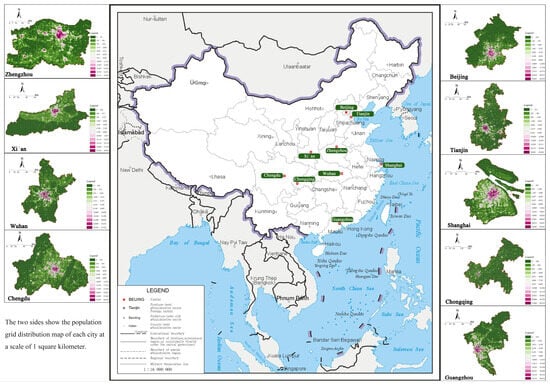
Figure 1.
Study area and population distributions.
2.2. Research Data
This study consistently utilizes 2020 as the reference year for data. This decision is predicated on two principal factors: firstly, 2020 marks a critical point for various statistical initiatives in China, providing data of exceptional integrity and accuracy; secondly, subsequent to the COVID-19 pandemic, the rate of urban infrastructure development in China has predominantly decelerated. Employing cross-sectional data from this year more precisely represents the usual distribution of current facilities, thus successfully mitigating any mistakes stemming from temporal differences in data collection.
The data sources for this study comprise Point of Interest (POI) data from January to December 2020 obtained from the Gaode Open Platform. After removing duplicate points and invalid points (such as road intersections, tourist attractions, etc.), the proportion of valid points accounted for approximately 8.2% (https://lbs.amap.com/), a 100 m grid population dataset from China’s Seventh National Census (https://essd.copernicus.org/), and multi-period land use remote sensing monitoring dataset of China (https://www.resdc.cn/DOI/DOI.aspx?DOIID=54 (accessed on 20 May 2024)). To ensure that the experimental results reflect actual conditions, the points of interest (POI), population grids, and land use data were all taken from 2020 as a unified time point. Additionally, land use data for China in 2000 were selected as a supplement. For all data types, sources included precise descriptions and the research requirements were met. To avoid errors resulting from data merging, all types of data were transformed to the Universal Transverse Mercator (UTM) projected coordinate system.
2.3. Methodology
2.3.1. Technical Approaches
The geographical similarity law posited by recent scholars asserts that “the more similar geographic configurations of two points (areas), the more similar the values (processes) of the target variable at these two points (areas).” [50]. This law’s primary application involves calculating the individual representativeness of known sample points for other points in the study area, thus inferring the target characteristics of unknown points [51,52,53,54]. The long-term evolution of cities has been influenced by the interactive dynamics between primary schools and the surrounding service providers, resulting in a built environment pattern marked by spatial similarity. This stable spatial pattern offers a theoretical basis for examining the adaptive mechanisms between primary schools and their surrounding facilities. This study constructs a multi-machine learning model integration framework, incorporating CART, RF, and XGBoost, to analyze known geographical environmental characteristics. It quantitatively reveals the adaptive relationship between facility elements in the built environment and the spatial layout of primary schools through machine learning algorithms. This method addresses the limitations of traditional correlation studies, which often state that ‘correlation does not imply causation,’ by employing feature importance analysis (e.g., SHAP values) to pinpoint the actual influences of surrounding facilities on primary school site selection. This approach substantially improves the planning and decision-making support derived from the research findings.
Figure 2 illustrates the research framework. The methodological approach is outlined as follows: Initially, in accordance with industry standards and the optimal service radius for primary schools, a fundamental grid unit measuring 1 km by 1 km was established in each city. Data concerning primary school facilities, population, and land use were subsequently collected and integrated into the respective grid units, yielding a spatial feature map consisting of 1 km2 grid units for the nine cities. Utilizing the previously discussed spatial feature map, three machine learning models were developed employing decision trees, random forests (RF), and extreme gradient boosting (XGBoost) algorithms to assess the suitability of an area for establishing a primary school. The models demonstrated the extent of correlation between the spatial distribution (likelihood of presence) of primary schools and the various types and densities of adjacent facilities across diverse urban environments.
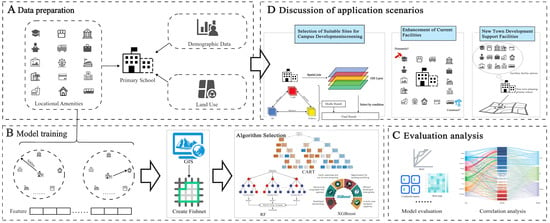
Figure 2.
Workflow of this study.
2.3.2. Establishment of Fundamental Research Units for the Built Environment
- (1)
- Create fishnet.
The Create Fishnet tool in ArcGIS (https://www.esri.com/en-us/arcgis/geospatial-platform/overview, accessed on 20 May 2024) facilitates the generation of standardized spatial units for purposes of spatial analysis, mapping, and data management [55]. The primary function of this tool is to generate a regular polygon grid within a defined geographic region, with a critical step involving the specification of grid cell dimensions. Industry standards and expert consensus indicate that the optimal service diameter for primary schools is generally 1 km [56]. This study established a square grid measuring 1 km by 1000 m in each city, which functioned as the fundamental analytical unit for delineating potential primary school service areas. It is important to acknowledge that while administrative boundaries at city peripheries may result in incomplete grids, we defined any grid intersecting with any portion of an administrative area as a complete base unit of analysis. This method ensures uniformity across the areas of all units. This approach reflects actual conditions, as public facilities situated on city peripheries serve local residents, and their service efficacy transcends administrative boundaries.
- (2)
- Classification of facilities around primary schools
According to field surveys and pertinent research [57,58], facilities around primary schools can be classified into five principal categories: educational and cultural facilities, commercial service facilities, office and residential facilities, and infrastructure. These amenities can be further classified into 16 subsidiary categories (Table 1).

Table 1.
Classification of relevant facilities influencing the layout of primary schools.
- (3)
- Grid unit information matching
Grid unit information matching encompassed population distribution, urbanized areas, and characteristics of facility points. Initially, the 100 m resolution population spatial distribution grid data were transformed into point data, allowing for the calculation of population values at each point. Subsequently, the spatial connectivity function was employed to aggregate data to each grid unit, with specific population statistics assigned accordingly. Secondly, land use data for urban built-up areas from the years 2000 and 2020 were extracted. This facilitated the determination of the association of each grid unit with the urban built-up area at the specified time points.
Each grid unit was aligned with the corresponding information through the aforementioned processes. The completion of grid unit construction established a basis for further calculations.
2.3.3. Model Training
- (1)
- Algorithm selection
This study aims to explore the correlation between primary schools and the distribution of surrounding facilities. To this end, a supervised learning algorithm framework is used to quantify the marginal contribution of features to the prediction results through SHAP values. To reduce model performance fluctuations caused by feature noise and sample randomness, three machine learning methods—decision trees, random forests (RF), and XGBoost—are used to construct the model, and a cross-validation mechanism is introduced to enhance the robustness of the results [59,60,61].
Firstly, the decision tree algorithm CART (Classification and Regression Trees) is an ideal tool for revealing the compatibility between primary schools and their surrounding facilities due to its intuitive visualization characteristics and clear logical process. By maximizing the information entropy, decision trees can reveal patterns and associations. However, the tendency for overfitting and sensitivity to noise limit their generalizability [62]. To address the above limitations, we introduce RF as an integrated learning strategy. By constructing multiple independent decision trees and aggregating their predictions, RF not only improves model robustness but also provides a quantitative assessment of the importance of features, thus ensuring the stability of the model and the accuracy of the predictions [63]. In addition, XGBoost, an optimized gradient boosting framework, effectively suppresses the overfitting phenomenon by minimizing the loss function and combining it with a regularization term to ensure the expressiveness and efficiency of the model on complex datasets [64].
By carefully comparing and analyzing the models constructed using these three algorithms, we explored hidden patterns and trends and elucidated preferred locations that are consistently obtained in all models as a basis for narrowing down candidate sites. This method improves the scientific and rational aspects of decision-making and provides a multi-dimensional and multi-level analytical framework for site selection for public service facilities. It also provides strong guidance for subsequent field visits and final decision-making.
- (2)
- Algorithmic Modeling
(1) Decision Tree (CART)
CART is a decision tree algorithm proposed by Breiman in 1984. Its core idea is to split the dataset in a recursive way, where each split divides the data into two groups based on a feature and a threshold [65]. This process continues until some stopping condition is met, such as the maximum depth of the tree, minimum number of samples in a node, or purity of a node [66,67].
In the classification problem, CART uses Gini impurity to measure the purity of a node with the following formula:
In Equation (1) is the total number of feature categories and denotes the proportion of samples of the -th category within the total samples in the node. A lower Gini impurity indicates a higher node purity (i.e., the samples in the node are more likely to belong to the same class).
(2) Random Forest
Random Forest is an ensemble learning technique derived from decision tree models. A solitary decision tree retains the correlation between spatial data, additional feature variables, and the target variable by developing branches. Random Forest employs several decision trees as fundamental classifiers, randomly picking segments of the training dataset and feature variables to train each decision tree. These stochastic processes reduce the model’s susceptibility to overfitting and enhance its generalization capabilities. Random Forest exhibits insensitivity to multicollinearity and resilience to missing and imbalanced data, indicating a notable degree of robustness [68,69].
Random Forest improves the extrapolation prediction capacity of the integrated classification model by generating varied training sets to augment the diversity among classification models. Upon completion of k training cycles, a series of classification models {h1(X), h2(X), …, hk(X)} is generated, which are subsequently integrated into a multi-classification model system. The ultimate classification outcome of this system is ascertained by a straightforward majority voting mechanism. The ultimate classification determination:
where denotes the combined classification model, is the individual decision classification model, denotes the objective variable, and denotes the schematic function. Equation describes the use of majority decision voting to determine the final categorization.
(3) XGBoost
XGBoost (eXtreme Gradient Boosting) is a machine learning technique based on decision tree ensembles [70,71]. It is an ensemble algorithm that combines numerous weak classifiers (such as CART regression tree models) to build a powerful classifier. In supervised learning, given known samples, each sample has a set of attributes and a known category. By training these data, a classifier can be obtained that can classify and judge fresh samples. This machine learning approach was originally suggested by Dr. Tianqi Chen and often outperforms classic decision tree models, currently frequently employed in data science [72]. Its main idea is to train many decision trees iteratively and eventually enhance the model’s predictive performance by optimizing the goal function. In each iteration, XGBoost generates a new decision tree model utilizing the residuals from the prior round’s predictions and the actual labels. The predictions generated by the new model are subsequently weighted and combined with the findings from prior iterations to get the final composite forecast. The XGBoost model delineating the compatibility relationship between primary schools and adjacent facilities can be expressed as:
where is the number of decision trees, corresponds to the set of all decision trees, and is the -th decision tree generated by the -th iteration.
The resultant loss function can be represented by the predicted values and :
The objective function consists of a loss function for the model and a regular term that reduces the complexity of the model:
Finally, by applying the additive model, an overall XGBoost primary school facility site selection decision model is obtained.
- (3)
- Model training
All three algorithms in this study utilize regional facilities as input variables and primary school facilities as target variables to create a training dataset. The data are analyzed using machine learning techniques for each city, resulting in the development of a self-consistent adaptation model linking primary schools with surrounding facilities in each urban area.
A binary classification method was employed to evaluate the compatibility between primary schools and their surrounding facilities. A character unit that included primary school facilities was classified as a positive case and assigned a value of 1, signifying that the area fulfilled the criteria for establishing a primary school. If the unit lacked a primary school, it was categorized as a negative case and assigned a value of 0.
Positive instances of primary school compatibility with adjacent facilities are very easy to delineate, namely locations where primary schools have been established and functioned consistently over a prolonged duration. The choosing of negative instances necessitates increased vigilance. Locations inappropriate for establishing primary schools predominantly fall into three categories: (1) areas exhibiting considerable safety risks; (2) areas excluded from existing urban and rural planning and development frameworks; (3) established, developed regions marked by elevated property values and substantial obstacles to revitalization.
The initial category has constrained sample sizes, compromising analytical validity. The second group demonstrates inadequate facility integration, lacking spatial compatibility between primary schools and adjacent functions. In contrast, regions created prior to 2000 that lack primary schools, despite significant urbanization in the last twenty years, provide convincing evidence: these locations are generally saturated with various urban functions, with dispersed enrolment needs already satisfied by adjacent schools. Moreover, considering that future urban development is improbable to mirror previous extensive demolition and reconstruction trends, promoting primary school construction in densely populated places at elevated costs exhibits little viability [73] (see Figure 3). Subsequent examination of 1 km2 grids established prior to 2000, without elementary schools, indicated that their land use functions are primarily commercial, industrial, or office-oriented, with negligible residential functions. According to these findings, this study classifies “early-built, persistently devoid of primary schools” locations as bad samples for future compatibility evaluations.
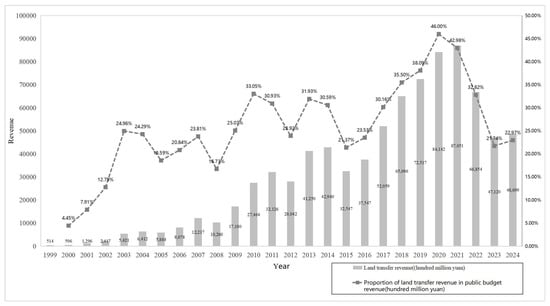
Figure 3.
Proportion of land transfer revenue in local government finances (source: China Land and Resources Statistical Yearbook).
This study utilized boundary SMOTE (Synthetic Minority Over-sampling Technique) during the training phase to over-sample data from several cities, hence alleviating majority bias due to sample imbalance. After implementing over-sampling, a 1:1 ratio of positive to negative samples was attained across all cities, leading to an estimated 10% enhancement in model average accuracy and a 12% increase in F1 score [74]. GridSearchCV was utilized for hyperparameter optimization across all three models, with CART also integrating pruning to reduce overfitting (see to Table 2). The model’s sensitivity to data was validated, with performance metrics (accuracy, recall, F1 score) varying by 5% when trained with various random seeds (e.g., 42, 66, 100, 2024), demonstrating satisfactory model stability. Ultimately, several models were created to examine the compatibility between primary schools and adjacent amenities in different locations.

Table 2.
Configuration parameters for model training.
3. Results
3.1. Spatial Distribution of Facilities
The POI data for each city were obtained by scraping from the Gaode Open Platform. Owing to the huge amount of data included in the Gaode Open Platform, the classifications do not match the experimental objectives, and there was a significant amount of noise. Therefore, it was necessary to clean and classify the POI data. First, noise was removed, including POI data with missing values, outliers, and meaningless data (e.g., road intersections in data for transportation facilities). Next, the POI data were reclassified based on the above categorization of facilities around primary schools. Considering the large volume of POI data, to improve processing efficiency, we first simplified the names of facilities into short numerical codes. Subsequently, these POI points were spatially matched with the grid units based on their locations. This ensured that for each grid unit, code information representing the types of facilities it contained could be obtained. Finally, the POI data for the nine central cities were obtained (see Figure 4).
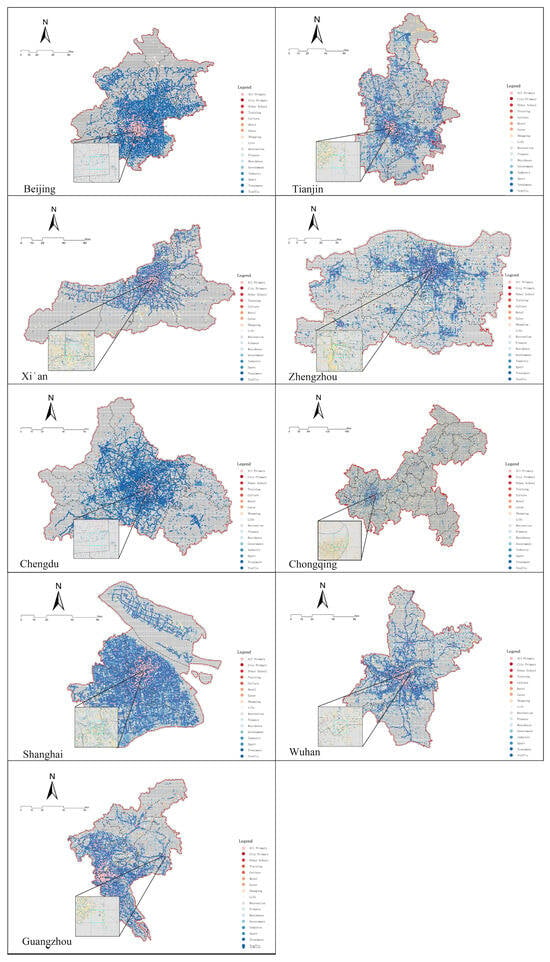
Figure 4.
Distribution of POI points in nine central cities.
The majority of points of interest (POI) in major urban areas are primarily located within the central city. A continuous distribution of band poi points is observed between the satellite cities and the central city. The points primarily represent transport facility locations, signifying effective transport connectivity within the city. This experiment utilized a binary classification method, despite the substantial number of POI points present. The objective of this method was to ascertain the presence of a specific facility within the grid. This method led to a significant decrease in the computational requirements of the model training process, while maintaining the essential characteristics of the specific facility.
3.2. Evaluation of Model Performance
This study constructed a contingency table of classification results to examine the presence of significant heterogeneity in the predictive performance of models trained by three algorithms, focusing on a subset of samples that displayed model prediction inconsistency (i.e., true positives and false negatives). A paired statistical analysis of differences was performed utilizing the McNemar test. Results demonstrate that in all nine cities, the test p-values (Pearson’s asymptotic significance) for models developed using various methods were uniformly below 0.005, indicating that the predicted differences across models are statistically significant (See Figure 5).
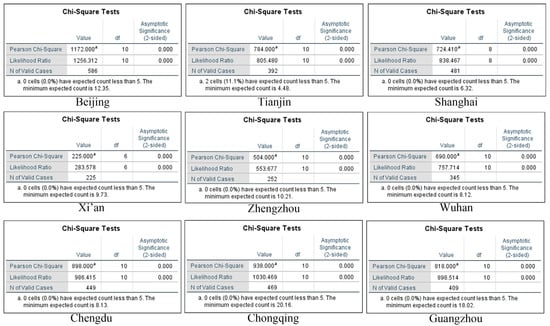
Figure 5.
Chi-Square Tests.
To visually compare the performance of models trained across nine cities using three algorithms, this study produced a comprehensive heatmap (Figure 6). Overall, all models achieved accuracy rates exceeding 72% across different cities, with precision, recall, and F1 scores mostly surpassing 60%. In some cities, multiple metrics even exceeded 90%, reflecting the method’s robust generalization capability. From a city-level analysis, the proposed method performed exceptionally well in cities such as Zhengzhou, Guangzhou, Xi’an, and Chongqing, effectively identifying the compatibility between primary schools and surrounding facilities. Conversely, model performance was relatively weaker in cities like Tianjin, Chengdu, and Wuhan, suggesting potentially more complex influencing mechanisms or variations in data distribution within these regions. Regarding algorithms, XGBoost demonstrated the highest average performance, notably enhancing overall identification of spatial layout patterns in cities like Zhengzhou, Guangzhou, and Xi’an. However, its cross-city performance exhibited significant variability. Random Forest (RF) delivered more balanced and stable results across most cities. Consequently, XGBoost is recommended for achieving optimal performance in specific cities, while RF is preferable for prioritizing robustness and comprehensive performance across diverse urban contexts.
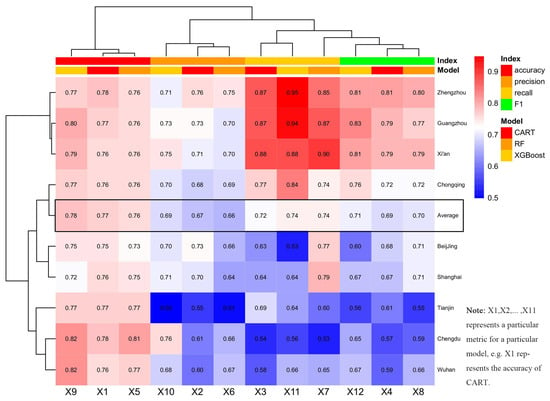
Figure 6.
Heat map of model evaluation indicators.
The receiver operating characteristic (ROC) curve demonstrated the model performance through two parameters, the true positive rate (TPR) and false positive rate (FPR). TPR measures the model’s ability to correctly identify positive classes, while FPR indicates the proportion of negative classes that the model misclassifies as positive. Each point on the ROC curve corresponds to a different classification threshold, showing the balance of sensitivity and specificity of the model at different thresholds. The superior model can be determined based on the positional relationship of their ROC curves. An ROC curve in the top left corner has a high TPR and low FPR, indicating good performance. In addition, the AUC (area under the curve) values for each model were calculated and compared, with larger AUC values indicating a greater overall ability of the model to distinguish between positive and negative samples. In these analyses, the performance differences among models were subtle (see Figure 7). In view of this, rather than using a single model, the predictive output of each model was considered to be of important reference value. Therefore, the predictive results of all models were considered with equal weighting in the synthesis and analysis stage to ensure that the conclusions were comprehensive and accurate.
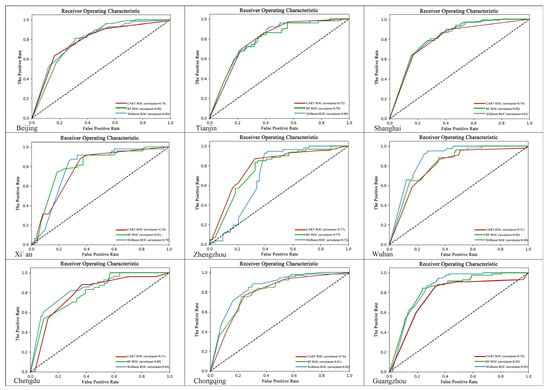
Figure 7.
ROC curves for models for each city.
Research demonstrates that ROC curves for several models within the same city display performance discrepancies. The disparities essentially arise from the interplay of many factors, including model fitting capacity, hyperparameter configurations, stochastic elements, and initialization procedures. XGBoost has superior performance, displaying a pronounced advantage in the ROC curve across most urban regions and reaching optimality more rapidly. Nonetheless, because to its algorithmic attributes, the feature importance distribution of XGBoost is frequently more diffuse, complicating the accurate identification of critical decision factors. Consequently, in assessing the compatibility between primary schools and adjacent facilities, it is essential to utilize the performance benefits of the XGBoost model while integrating the advantages of CART and RF models for a thorough evaluation.
According to the standard deviation study of assessment metrics across various cities for each method (see Table 3), RF had the lowest standard deviation in all four principal metrics: precision, recall, F1 score, and area under the ROC curve. This indicates superior overall stability. The ROC measure, with a standard deviation of 0.0181, exhibited superior stability compared to other models. The CART algorithm displayed the lowest standard deviation in accuracy, indicating superior stability, however it exhibited increased volatility in the other measures. The XGBoost method demonstrated the highest standard deviation across all evaluation criteria, indicating significant variability in model performance and, therefore, reduced stability. XGBoost’s significant heterogeneity in this cross-city validation starkly contradicts with the common expectation of its greater performance. This emphasizes that both conventional and contemporary algorithms necessitate comprehensive validation within specific contexts to ascertain their appropriateness for particular issues.

Table 3.
Standard deviation of indicators for each city model.
If the primary purpose is to maintain consistent model performance across various cities, Random Forest is the suggested option. Another important purpose of this study is to examine how the alignment of primary schools and adjacent facilities affects outcomes. The Random Forest algorithm yielded somewhat dispersed outcomes in the study of feature importance. Therefore, future research will combine feature importance results from several models to further investigate the preferred attributes of primary school layouts in different urban environments.
3.3. The Relationship Between Primary Schools and Surrounding Facilities
The model’s feature importance ranking serves as the principal method for indicating the compatibility between primary schools and adjacent facilities. The distribution of feature scores in a feature significance plot may fluctuate due to multiple variables. Feature importance scores indicate the significance of each feature in the development of the decision tree during model training. The scores are derived from the model’s performance utilizing training data, indicating the degree to which features impact model predictions. Features with elevated scores are utilized more often for partitioning during model development or yield larger information gain, therefore playing a more substantial role in prediction results. In this investigation, standardized SHAP values were allocated to the feature importance of each city’s model (refer to Supplementary Files for the SHAP values). Furthermore, 27 SHAP value tables are preserved in the extra files, illustrating the feature significance of the three models for each city, for the reader’s reference.
Utilizing the SHAP values derived from the integration of three models (CART, RF, and XGBoost), we developed a Sankey diagram to illustrate feature importance (refer to Figure 8). This diagram distinctly illustrates the essential elements affecting the arrangement of primary schools across various cities and their connections to diverse models. In the analysis of 15 features, the importance of ‘other schools’ and ‘training institutions’ was notably higher compared to the other features. Medical, sports, cultural exhibition, and entertainment facilities closely followed, highlighting their significant influence on the selection of primary school sites.
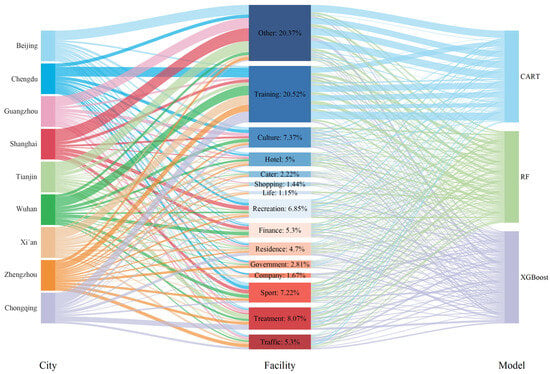
Figure 8.
Feature importance chord diagram.
Analysis of the dependency of various models on facility characteristics across nine locations revealed that the CART model demonstrates a pronounced reliance on feature concentration, particularly on the ‘other schools’ and ‘sports training’ attributes. The feature dependencies of the Random Forest and XGBoost models are comparatively more balanced and distributed. This disparity arises from the fundamental mechanics of the models: as a basic decision tree, CART often selects features that yield the highest information gain or reduce impurity, rendering it susceptible to overfitting in certain situations. Conversely, Random Forest and XGBoost employ ensemble learning techniques (such as bagging and boosting) to proficiently reduce overfitting, attaining an improved equilibrium between model efficacy and generalization ability.
An in-depth investigation of many urban factors helps enhance comprehension of the compatibility between primary school design and adjacent facilities:
Concentration of educational assets. The relationship between primary schools and nearby ‘other schools’ is notably pronounced in Beijing, Guangzhou, Shanghai, and Tianjin, illustrating the concentration effect and the mutual benefits of educational resources that facilitate the concentrated advancement of high-quality educational assets. This is largely attributable to the robust developmental foundations of these cities, particularly their ample higher education resources, which have led to the establishment of several connected elementary schools associated with prestigious universities.
Augmented extracurricular tutoring. The relationship between elementary schools and ‘tutoring institutions’ is particularly strong in Chengdu, Wuhan, Xi’an, Zhengzhou, and Chongqing, with Chongqing exhibiting the most substantial link. This illustrates the fierce competition within the local education system, where extracurricular tutoring has emerged as a crucial method for pupils to enhance their academic performance. Contributing elements may encompass comparatively lower levels of economic growth, leading households to depend more significantly on educational avenues to ensure developmental prospects for their children.
Besides the major links noted above, each city demonstrates distinct relationships with other institutions: primary schools in Shanghai and Wuhan have a specific correlation with ‘financial’ facilities. Primary schools in Chengdu, Wuhan, and Chongqing exhibit a more robust association with sports facilities. Primary schools in Tianjin and Chongqing exhibit a stronger correlation with “medical” facilities. Primary schools in Zhengzhou exhibit a greater degree of connectivity with transportation amenities than those in other cities. These trends suggest that primary schools in many cities have cultivated unique architectural environments throughout their developmental cycles. Cities with comparable economic development levels may display analogous relationships between elementary schools and adjacent facilities.
It is noteworthy that several facilities generally regarded as closely associated with primary schools, such as accommodation, catering, and everyday services, exhibit comparatively low feature significance in the model. This is mainly attributable to the model’s screening mechanism, which iteratively assesses distinctive criteria that significantly impact the existence or non-existence of primary schools. Fundamental supporting facilities, commonly seen as universally available, may lack distribution features adequate to meaningfully differentiate between regions with and without elementary schools. Nonetheless, this does not suggest that these facilities lack significance; they form the essential foundation for the existence of primary schools. The salient elements found by the model more precisely represent the unique ‘urban imagery’ created during the development of various cities, acting as crucial markers of the diverse traits and disparities across elementary schools in different metropolitan areas.
4. Discussion
4.1. Application of Research Results
This study Our analysis reveals a clear dichotomy in the spatial logic of primary school placement across China’s major cities. Economically developed metropolises like Beijing and Shanghai exhibit a pattern of educational agglomeration, where primary schools thrive in clusters with other educational institutions. In contrast, rapidly developing cities like Chongqing and Zhengzhou show a stronger affinity for supplemental education hubs, co-locating with private training centers. This fundamental distinction, uncovered through our machine learning models, forms the basis for the following practical applications and policy discussions.
4.1.1. Enhance the Current Surroundings of Primary Schools
As China’s urbanization rate stabilizes and shifts towards a quality-oriented urban renewal strategy, the optimization of existing primary school environments has become a priority. Our compatibility model provides a quantitative, diagnostic framework to move beyond generic standards and conduct targeted assessments of the built environment surrounding established schools. The feature importance rankings derived from SHAP values (Figure 8, Table A2) can function as a site-specific evaluation checklist.
For instance, the model reveals that in developed cities like Beijing and Shanghai, the presence of ‘other schools’ is a highly significant feature. Therefore, a primary school in these cities located in an area with a low density of other educational institutions might be identified as being in a sub-optimally integrated educational zone. Enhancement strategies for such a school could focus on creating formal collaboration networks with nearby secondary schools or universities for resource sharing, rather than solely upgrading its immediate physical infrastructure.
Conversely, in developing metropolises like Chongqing and Zhengzhou, where ‘training institutions’ show the highest compatibility, an existing school surrounded by few such facilities might indicate a lack of supplemental educational ecosystem. Planners could respond by incentivizing the development of qualified, well-regulated tutoring centers in the vicinity, or alternatively, by integrating similar specialized skill-development programs (e.g., STEAM workshops) directly into the school’s own extended curriculum to fulfill this latent demand.
This diagnostic application of our model allows urban planners and educational authorities to move from a one-size-fits-all approach to a precision-oriented strategy. It enables the identification of specific facility deficits in the environs of existing primary schools, thereby offering a scientific basis for targeted investments, strategic partnerships, and, in extreme cases of incompatibility, informed decisions regarding school consolidation or relocation.
4.1.2. Coordinated Development of New Elementary Schools and Amenities
This study encompasses nine major cities, all experiencing population increase, economic development, and urban expansion. The primary objective of urbanization in these places is progressively transitioning towards the optimization of existing spatial resources and the meticulous expansion of spatial limits. The future extension of urban limits will be executed with increased prudence. Informed by the long-established compatibility relationship between primary schools and surrounding facilities, the planning scheme for new city development should concurrently integrate the arrangement of adjacent facilities that exhibit greater compatibility when determining primary school locations. This approach is crucial for assuring the sustainable development of newly constructed primary schools and promoting their rapid incorporation into the urban development framework.
4.1.3. Optimization of Primary School Site Selection in Existing Spaces
The machine learning methodology employed in this study is fundamentally a classification prediction technique. Consequently, it can further identify regions devoid of primary schools yet possessing advantageous surrounding facilities, based on the correlation between primary schools and surrounding amenities established by the model. Nevertheless, as the model solely evaluates the compatibility of primary schools and their adjacent facilities when determining school locations, this methodology is relatively limited and leads to an overwhelming quantity of appropriate sites. To refine the potential appropriate locations inside the urban region, it is essential to thoroughly evaluate aspects such population distribution, land utilization, and the NIMBY phenomenon [75,76]. The methodology for integrating population variables adheres to industry standards that mandate the establishment of a primary school in communities exceeding 10,000 residents, thereby excluding low-density regions. Additionally, it accounts for land utilization to omit predictive outcomes from urban areas developed prior to 2000, as these regions have matured significantly over the past two decades of intensive urban development, making the identification of available land for new educational facilities challenging. Nonetheless, other NIMBY variables necessitate more comprehensive field investigations, which have not been incorporated into this study at present. Upon removing current primary schools and regions with conflicting findings from the three models, the definitive maps indicating new primary school locations for various cities were produced (refer to Figure 9). To quantitatively evaluate the classification prediction findings across cities, a comparison map illustrating the number of facilities designated for primary schools in areas with populations above 10,000 was generated (see Figure 10).
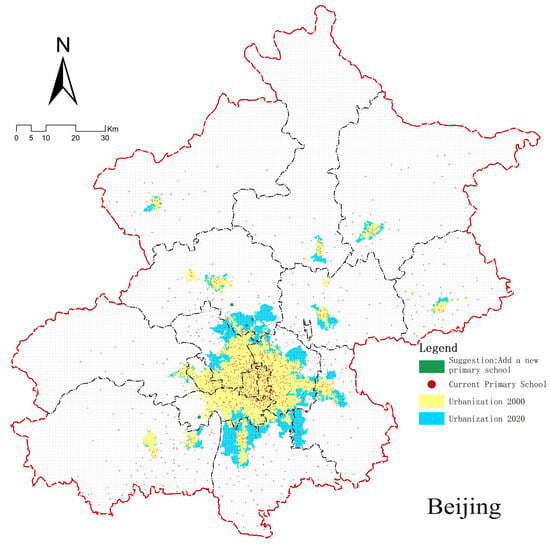
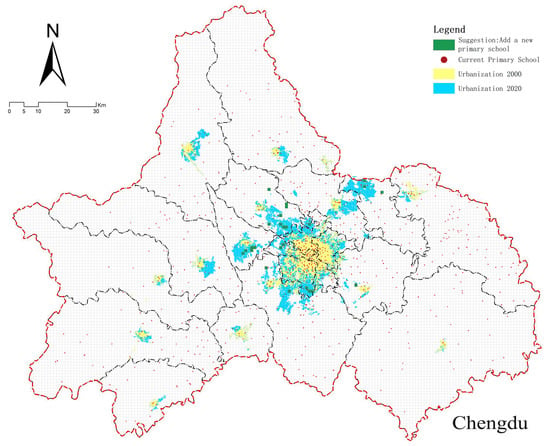
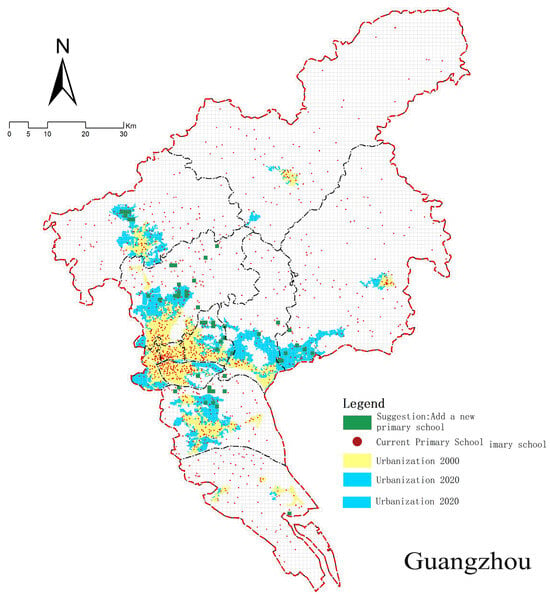
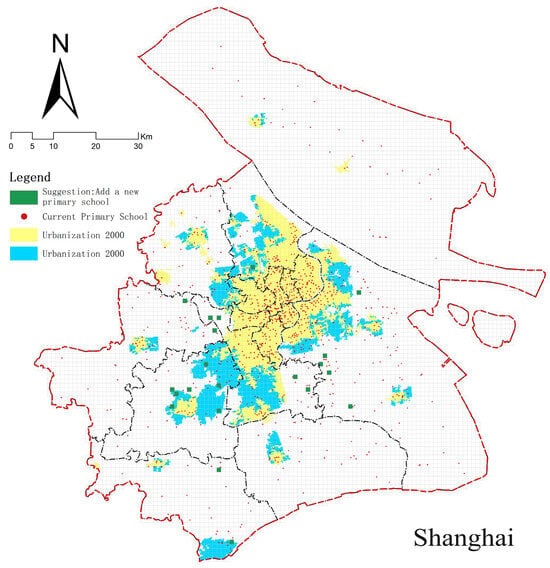
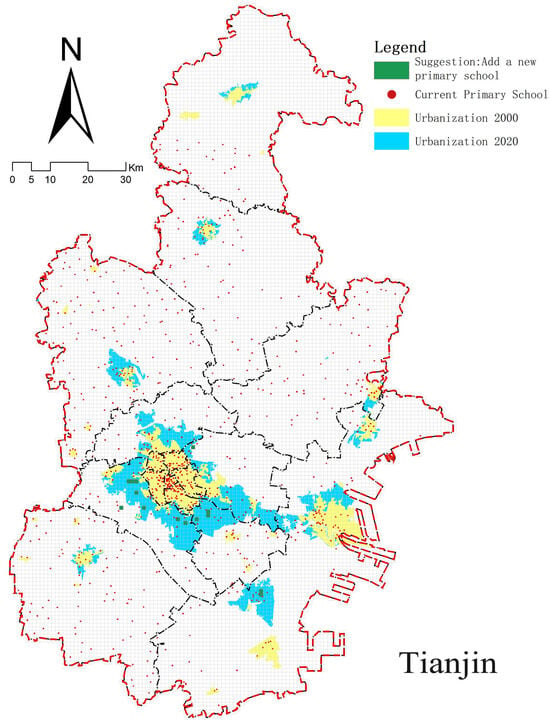
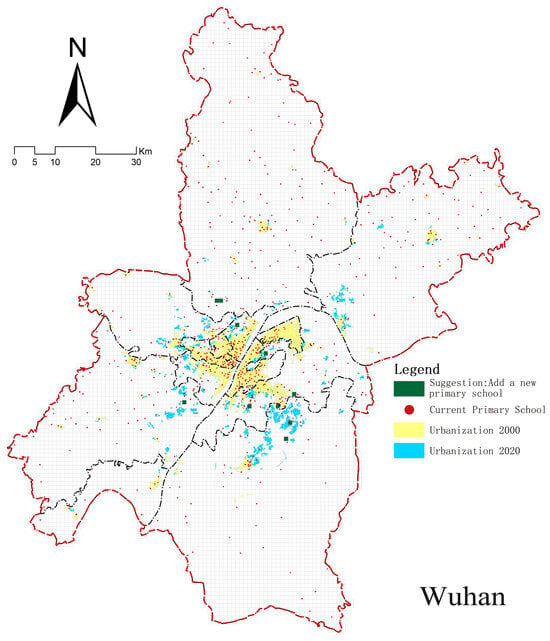
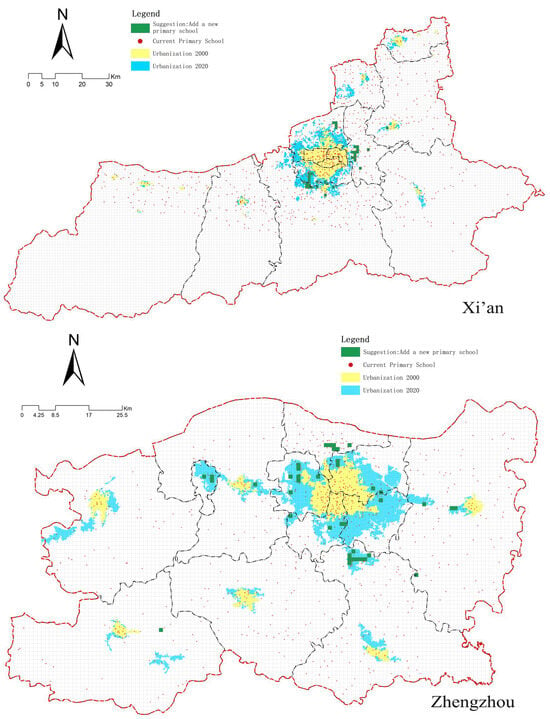
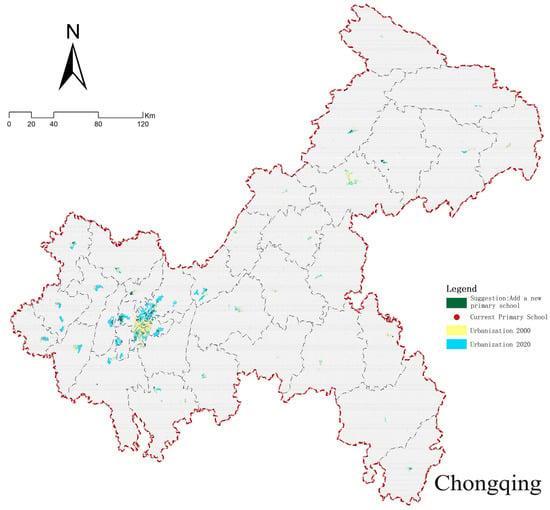
Figure 9.
Recommendations for site selection.
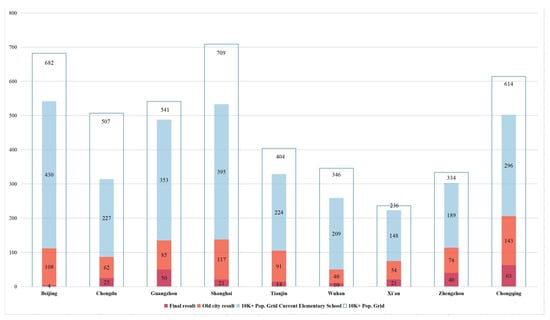
Figure 10.
Comparison of the number of facilities allocated to primary schools in regions with more than 10,000 inhabitants.
Based on the predictive findings regarding the alignment between primary schools and surrounding facilities, the distribution of primary schools across major Chinese cities exhibits significant imbalances. Significantly, Guangzhou, Zhengzhou, and Chongqing have considerable deficiencies in elementary school availability, with unmet latent demand persisting. Conversely, Beijing, Shanghai, and Tianjin exhibit a notable congruence between current provision and demand, sustaining a more equilibrated supply-demand dynamic. The analysis indicates a significant structural inadequacy in Chengdu, where elementary schools include less than 50% of the facilities in densely populated regions. This discrepancy threatens to create a significant misalignment between educational resources and population distribution. Thus, future educational infrastructure planning must prioritize spatial alignment between population distribution and elementary school resources to improve resource allocation efficiency.
4.2. Primary School Layout as a Mirror of Urban Development Trajectories
The distinct compatibility patterns uncovered in this study reveal that the spatial logic of primary school placement is not arbitrary but is deeply embedded within a city’s specific economic, social, and developmental trajectory. Our findings suggest the emergence of two dominant, contrasting models of educational space in Chinese metropolises, each with significant implications for urban development and social equity.
These divergent models underscore that a one-size-fits-all national policy for primary school planning is untenable. For developed cities, the policy focus should shift from mere quantity to managing the qualitative and equity impacts of educational agglomeration. This could involve fostering resource-sharing mechanisms between clustered schools and other urban communities to mitigate enclave effects. For developing cities, the urgent need is to integrate the vitality of the supplemental training sector into a more coherent educational strategy. This involves regulating and guiding these institutions towards complementing rather than merely supplementing public education, and proactively creating new synergies—for example, by developing public–private partnerships in STEAM education—to build a more robust and equitable educational ecosystem.
Ultimately, the configuration of primary schools and their adjacent facilities is a powerful lens through which to view a city’s developmental priorities, its inequalities, and the lived experience of its citizens. Acknowledging these distinct spatial signatures is the first step towards formulating nuanced, context-sensitive urban policies that align educational infrastructure with broader goals of sustainable and inclusive urban development.
4.3. Research Contributions
This study contributes to the fields of urban planning, educational geography, and sustainable development through methodological innovation and novel empirical findings. Our primary contributions are threefold:
- (1)
- Methodological Contribution: A Novel Analytical Framework for Facility Compatibility.
Moving beyond traditional correlation-based analyses, this study develops and validates a multi-model machine learning framework integrated with SHAP value interpretation. This framework introduces a critical advancement by systematically incorporating negative samples—areas where schools are logically absent—into the training process. This approach overcomes the limitation of conventional studies that only analyze locations where facilities already exist, thereby providing a more robust and causal-suggestive understanding of the factors driving primary school placement. Furthermore, our comparative analysis of CART, Random Forest, and XGBoost algorithms offers practical guidance for model selection, prioritizing either interpretability (CART), stability (RF), or peak predictive accuracy (XGBoost) for different planning scenarios.
- (2)
- Empirical Contribution: The First Multi-City Comparative Analysis Revealing Distinct Urban Typologies.
We present the first comparative analysis of primary school compatibility across nine Chinese megacities, revealing two distinct urban typologies: an Educational Agglomeration model in developed cities (e.g., Beijing) and a Supplemental Education Hub model in developing ones (e.g., Chongqing). This challenges the notion of a universal planning standard.
- (3)
- Practical Contribution: Actionable Insights for Sustainable Urban Planning.
The findings are translated into actionable intelligence for urban planners and policymakers. The compatibility models serve as a diagnostic tool for assessing and enhancing the built environment around existing primary schools, allowing for targeted interventions based on city-specific compatibility patterns; A predictive and decision-support system for scientifically identifying optimal sites for new primary schools in growing urban areas, ensuring their sustainable integration into the urban fabric from the outset. A policy foundation for advocating context-sensitive strategies, guiding developed cities to manage the externalities of educational agglomeration and assisting developing cities in strategically integrating supplemental education into a cohesive public system.
4.4. Research Limitations
Nevertheless, this study is subject to several limitations that require further exploration:
- (1)
- Obstacles in enhancing feature engineering.
This study utilized a binary classification method to streamline feature selection, with the developed model exhibiting acceptable effectiveness in forecasting primary school placements. This strategy, however, has difficulties in capturing more subtle environmental influences. Initial efforts to improve the model by the quantification of facility counts resulted in no noticeable enhancement in predicted accuracy. Additionally, due to issues in conceptualization and data quantification related to the NIMBY effect, this study tentatively omitted it from the analytical framework. Future research should concentrate on establishing a more comprehensive framework. This may entail creating multi-tiered buffers to measure NIMBY issues such as noise, traffic patterns, and closeness to pollution sources, thus elucidating the complex interaction between primary schools and their constructed surroundings in greater detail.
- (2)
- Constraints in the dimensions of spatial grids.
This study employs the ‘15 min city’ planning idea, defining a 1 km2 grid (1 km × 1 km) as the fundamental analytical unit to correspond with the daily service radius promoted by this model. Despite China’s deliberate promotion of this philosophy in long-term planning, notable discrepancies remain in the actual service regions of various primary schools due to differing practical circumstances. Methodologically, delineating varied catchment areas according to actual school districts or utilizing spatial gravity models may more precisely represent the correlation between primary schools and their adjacent built surroundings. While this approach sacrifices some precision in depicting the actual influence zones of primary schools, it offers a comparative macro-level perspective for systematically evaluating the practical effectiveness of the ‘15 min city’ concept within Chinese urban planning. This facilitates a holistic examination of the concept’s implementation outcomes in spatial resource allocation.
- (3)
- Limitations in cross-validation among urban areas
A notable disadvantage of this study is the inability to develop a comprehensive forecasting model applicable to all cities. Our preliminary effort to aggregate data from nine cities to develop a global “central city primary school layout model” resulted in performance significantly inferior to that of city-specific models. This result significantly underscores the essential differences among cities in their developmental paths, functional roles, and spatial configurations. These discrepancies largely emerge in various aspects: Cities exist at varying developmental stages, with first-tier cities like Beijing and Shanghai displaying stable spatial patterns, while cities such as Zhengzhou and Xi’an are in periods of expansion and refinement. Secondly, urban design philosophies and historical underpinnings differ significantly; for example, Chongqing’s hilly topography has influenced its unique clustered configuration, in sharp contrast to the grid patterns of flat cities such as Tianjin. The regional diversity of socio-economic factors—such as property values, population structures, and industry distributions—varies significantly among cities, complicating the formulation of a consistent definition for ‘compatibility.’
Thus, although the ‘one city, one model’ methodology employed in this study somewhat constrains the model’s direct extrapolation potential, it offers a more respectful and impartial representation of the intricate, varied realities of contemporary core cities in China. This discovery provides substantial methodological insights: while utilizing data-driven models for planning research over extensive geographical regions, one must be cautious of spatial heterogeneity. Future study ought to concentrate on investigating the integration of urban typology with machine learning. Cities could be systematically classified, followed by the creation of tailored models for each category; alternatively, sophisticated frameworks like transfer learning and meta-learning could be implemented to improve a model’s adaptability across various contexts while maintaining urban attributes.
5. Conclusions
The symbiotic relationship between primary schools and their surrounding facilities is not universal but is shaped by a city’s developmental stage and economic context. In this paper, we used spatial big data, such as POI facility points, population grid distribution, and land use data, to simulate and predict the layout of primary schools in nine national central cities in China based on various machine learning algorithms. The study findings were as follows: (1) In tests assessing the compatibility between primary schools and adjacent facilities, RF shows significant stability, while XGBoost displays increased instability. CART provides a unique benefit in graphically demonstrating the effects of important facilities due to its superior interpretability. (2) There was wide variation in the influence of different facilities on the layout of primary schools. In economically advanced cities, the layout of primary schools tended to be related to the distribution of other educational institutions. In contrast, primary schools were more likely to be co-located with training institutions in less economically developed cities. (3) The compatibility of primary schools with surrounding facilities suggests that Guangzhou, Zhengzhou, and Chongqing possess considerable prospective need for education, whereas the existing distribution in Beijing, Shanghai, and Tianjin is rather well-structured.
Historically, urban expansion has fostered unique symbiotic interactions between elementary schools and adjacent facilities. In the future, we must not only adequately honor these symbiotic relationships but also amend previous errors. This study’s findings suggest that economically prosperous metropolises should persist in utilizing inter-school collaboration methods to improve regional educational quality. Conversely, economically underdeveloped metropolises with few high-quality educational resources should prudently build supplementary extracurricular training institutes under suitable supervision. During this phase, careful preparation and direction for curricula and thematic content are essential to avert inefficient, repetitive ‘educational involution. This calls for a paradigm shift in urban planning from standardized norms to adaptive, evidence-based strategies that respect the unique ‘urban DNA’ of each city.
Supplementary Materials
The following supporting information can be downloaded at https://www.mdpi.com/article/10.3390/su172210263/s1.
Author Contributions
Conceptualization, J.Z. and P.L.; Methodology, J.Z. and P.L.; Software, J.Z., Q.C. and Y.Z.; Validation, Q.C. and Y.Z.; Formal analysis, J.Z., M.R. and P.L.; Investigate, J.Z. and Q.C.; Resources, J.Z. and P.L.; Data curation, J.Z. and Q.C.; Writing—original draft, Q.C.; Writing—review and editing, J.Z., Q.C., M.R. and P.L.; Visualization, Q.C.; Supervision, P.L. and Y.Z.; Project administration, J.Z., Y.Z. and P.L.; Funding acquisition, J.Z. and P.L. All authors have read and agreed to the published version of the manuscript.
Funding
This research was funded by the National Natural Science Foundation of China (72541007), the National Key R&D Program of China (2019YFD1100905).
Institutional Review Board Statement
Not applicable.
Informed Consent Statement
Not applicable.
Data Availability Statement
The datasets used and/or analyzed during the current study are available from the corresponding author on reasonable request.
Acknowledgments
The authors thank the lab colleagues and the editors for their assistance with this paper.
Conflicts of Interest
Jianxin Zhang and Qiongze Chen were employed by The Engineering Design Academy of Chang’an University Co., Ltd. The remaining authors declare that the research was conducted in the absence of any commercial or financial relationships that could be construed as a potential conflict of interest.
Appendix A

Table A1.
Profiles of China’s Nine Central Cities.
Table A1.
Profiles of China’s Nine Central Cities.
| Total Area (km2) | Built-Up Area (km2) | Total Population (10,000) | GDP per Capita (CNY) | Average Residential Selling Price (CNY) | Average Population Growth Rate over the Past Five Years (%) | |||||
|---|---|---|---|---|---|---|---|---|---|---|
| 2020 | 2000 | 2020 | 2000 | 2020 | 2000 | 2020 | 2000 | 2020 | 2020–2024 | |
| Beijing | 16,410.54 | 490.11 | 1469 | 1249.9 | 2189.31 | 22,460 | 164,889 | 5647 | 35,905 | 0.01 |
| Chengdu | 11,760.25 | 385.86 | 1170.24 | 970.17 | 1386.6 | 17,993 | 101614 | 2251 | 15,380 | 0.30 |
| Chongqing | 6340.5 | 549.58 | 1237.85 | 1313.12 | 2487.09 | 34,547 | 155,768 | 3422 | 30,677 | 0.01 |
| Guangzhou | 43,263.52 | 324.26 | 1565.61 | 3072.34 | 3205.42 | 5157 | 78,170 | 1377 | 8402 | 0.43 |
| Shanghai | 7434.4 | 430.7 | 1350.4 | 685 | 1874.03 | 34,292 | 133,960 | None | 25,056 | 0.72 |
| Tianjin | 1010.3 | 133.22 | 640.8 | 615.36 | 1262 | 11,227 | 95,257 | 1891 | 9845 | 1.16 |
| Wuhan | 5806.7 | 186.97 | 700.69 | 674.5 | 1296 | 9484 | 77,360 | None | 13,743 | 5.74 |
| Xi’an | 8569.15 | 209.99 | 885.11 | 740.2 | 1244.77 | 14,473 | 126,730 | 1782 | 14,672 | 4.37 |
| Zhengzhou | 3639.81 | 207.81 | 977.12 | 1003.56 | 2094.7 | 13,053 | 84,616 | None | 12,148 | 5.76 |

Table A2.
Standardized SHAP Feature Importance.
Table A2.
Standardized SHAP Feature Importance.
| Feature | Model | Beijing | Chengdu | Guangzhou | Shanghai | Tianjin | Wuhan | Xi’an | Zhengzhou | Chongqing |
|---|---|---|---|---|---|---|---|---|---|---|
| Other | CART | 0.7 | 0.04 | 0.61 | 0.68 | 0.73 | 0.08 | 0.03 | 0.1 | 0.05 |
| RF | 0.17 | 0.13 | 0.28 | 0.24 | 0.25 | 0.09 | 0.05 | 0.12 | 0.05 | |
| XGBoost | 0.08 | 0.16 | 0.12 | 0.34 | 0.11 | 0.11 | 0.1 | 0.08 | 0 | |
| Training | CART | 0.03 | 0.51 | 0.03 | 0 | 0.13 | 0.61 | 0.53 | 0.41 | 0.76 |
| RF | 0.1 | 0.28 | 0.1 | 0.21 | 0.13 | 0.26 | 0.35 | 0.18 | 0.17 | |
| XGBoost | 0.04 | 0.16 | 0.08 | 0.08 | 0.07 | 0.06 | 0.06 | 0.06 | 0.14 | |
| Culture | CART | 0 | 0.08 | 0.13 | 0.05 | 0 | 0.11 | 0.04 | 0.04 | 0.07 |
| RF | 0.17 | 0.07 | 0.1 | 0.05 | 0.01 | 0.11 | 0 | 0.06 | 0.03 | |
| XGBoost | 0.08 | 0.16 | 0.09 | 0.09 | 0.06 | 0.09 | 0.07 | 0.07 | 0.16 | |
| Hotel | CART | 0 | 0.04 | 0.06 | 0 | 0 | 0.02 | 0.06 | 0.02 | 0 |
| RF | 0.05 | 0.06 | 0.07 | 0.04 | 0.05 | 0.09 | 0.15 | 0.07 | 0.08 | |
| XGBoost | 0.13 | 0.06 | 0.04 | 0.04 | 0.01 | 0.09 | 0.06 | 0.06 | 0 | |
| Cater | CART | 0 | 0.01 | 0 | 0 | 0 | 0.02 | 0.03 | 0 | 0 |
| RF | 0.03 | 0.01 | 0.02 | 0 | 0.02 | 0.03 | 0.01 | 0.04 | 0.06 | |
| XGBoost | 0.06 | 0.04 | 0.02 | 0 | 0.03 | 0.01 | 0.07 | 0.07 | 0.02 | |
| Shopping | CART | 0 | 0 | 0 | 0 | 0 | 0 | 0 | 0.03 | 0 |
| RF | 0 | 0 | 0.01 | 0 | 0.01 | 0 | 0.08 | 0.02 | 0.01 | |
| XGBoost | 0 | 0 | 0.11 | 0 | 0.05 | 0 | 0.03 | 0.04 | 0 | |
| Life | CART | 0 | 0.02 | 0 | 0 | 0 | 0 | 0 | 0 | 0 |
| RF | 0 | 0 | 0.01 | 0 | 0 | 0 | 0.14 | 0.02 | 0.01 | |
| XGBoost | 0 | 0 | 0.02 | 0 | 0 | 0 | 0.02 | 0.07 | 0 | |
| Recreation | CART | 0.17 | 0.05 | 0 | 0.14 | 0.02 | 0 | 0.08 | 0.04 | 0 |
| RF | 0.06 | 0.13 | 0.07 | 0.07 | 0.06 | 0.07 | 0.01 | 0.05 | 0.13 | |
| XGBoost | 0.14 | 0.06 | 0 | 0.17 | 0.07 | 0.08 | 0.11 | 0.07 | 0 | |
| Finance | CART | 0 | 0.05 | 0 | 0.1 | 0 | 0.09 | 0.02 | 0 | 0 |
| RF | 0.09 | 0.05 | 0.05 | 0.09 | 0.12 | 0.1 | 0 | 0.05 | 0.03 | |
| XGBoost | 0.09 | 0 | 0.02 | 0.12 | 0.1 | 0.14 | 0.07 | 0.05 | 0 | |
| Residence | CART | 0.06 | 0.03 | 0.04 | 0 | 0 | 0 | 0.04 | 0 | 0 |
| RF | 0.01 | 0.03 | 0.06 | 0.04 | 0.06 | 0.02 | 0.09 | 0.06 | 0.08 | |
| XGBoost | 0.06 | 0.06 | 0.04 | 0 | 0.1 | 0.03 | 0.09 | 0.07 | 0.2 | |
| Government | CART | 0 | 0.03 | 0.02 | 0 | 0.03 | 0 | 0.04 | 0.05 | 0 |
| RF | 0.01 | 0.04 | 0.03 | 0 | 0.01 | 0.01 | 0 | 0.06 | 0.02 | |
| XGBoost | 0.04 | 0.06 | 0.07 | 0 | 0.04 | 0.05 | 0.03 | 0.12 | 0 | |
| Industry | CART | 0 | 0 | 0 | 0 | 0 | 0 | 0 | 0 | 0 |
| RF | 0 | 0 | 0 | 0 | 0 | 0 | 0.05 | 0.01 | 0.01 | |
| XGBoost | 0 | 0.14 | 0.06 | 0 | 0.02 | 0 | 0.09 | 0.01 | 0.06 | |
| Sport | CART | 0 | 0.08 | 0 | 0.03 | 0 | 0.04 | 0.01 | 0.1 | 0 |
| RF | 0.19 | 0.12 | 0.04 | 0.22 | 0.07 | 0.12 | 0.03 | 0.05 | 0.08 | |
| XGBoost | 0.13 | 0.12 | 0.03 | 0.1 | 0.05 | 0.15 | 0.04 | 0.07 | 0.08 | |
| Treatment | CART | 0.01 | 0.03 | 0.08 | 0 | 0.09 | 0.03 | 0.03 | 0.07 | 0.12 |
| RF | 0.08 | 0.04 | 0.13 | 0.03 | 0.19 | 0.1 | 0 | 0.09 | 0.18 | |
| XGBoost | 0.08 | 0 | 0.12 | 0.06 | 0.18 | 0.07 | 0.08 | 0.09 | 0.2 | |
| Traffic | CART | 0.03 | 0.03 | 0.03 | 0 | 0 | 0 | 0.09 | 0.14 | 0 |
| RF | 0.04 | 0.02 | 0.03 | 0.01 | 0.02 | 0 | 0.04 | 0.12 | 0.06 | |
| XGBoost | 0.07 | 0 | 0.18 | 0 | 0.11 | 0.12 | 0.08 | 0.07 | 0.14 |
References
- Monk, D.H. Toward A Multilevel Perspective on the Allocation of Educational Resources. Rev. Educ. Res. 1981, 51, 215–236. [Google Scholar] [CrossRef]
- Hák, T.; Janoušková, S.; Moldan, B. Sustainable Development Goals: A Need for Relevant Indicators. Ecol. Indic. 2016, 60, 565–573. [Google Scholar] [CrossRef]
- Xue, E.; Li, J. Creating a High-Quality Education Policy System: Insights from China; Springer: Berlin/Heidelberg, Germany, 2021; ISBN 9811632766. [Google Scholar]
- Statistical Bulletin on the Development of China’s Education Sector. Available online: http://www.moe.gov.cn/jyb_sjzl/sjzl_fztjgb/ (accessed on 2 October 2025).
- Garriga, C.; Hedlund, A.; Tang, Y.; Wang, P. Rural-Urban Migration, Structural Transformation, and Housing Markets in China. Am. Econ. J. Macroecon. 2023, 15, 413–440. [Google Scholar] [CrossRef]
- Guo, J.; Yu, Z.; Ma, Z.; Xu, D.; Cao, S. What Factors Have Driven Urbanization in China? Environ. Dev. Sustain. 2022, 24, 6508–6526. [Google Scholar] [CrossRef]
- National Bureau of Statistics of the People’s Republic of China. Statistical Bulletin of the People’s Republic of China on National Economic and Social Development. 2023. Available online: https://www.stats.gov.cn/sj/zxfb/202402/t20240228_1947915.html (accessed on 13 July 2024).
- Yıldız, S.; Kıvrak, S.; Gültekin, A.B.; Arslan, G. Built Environment Design—Social Sustainability Relation in Urban Renewal. Sustain. Cities Soc. 2020, 60, 102173. [Google Scholar] [CrossRef]
- Bai, Y.; Wu, S.; Zhang, Y. Exploring the Key Factors Influencing Sustainable Urban Renewal from the Perspective of Multiple Stakeholders. Sustainability 2023, 15, 10596. [Google Scholar] [CrossRef]
- Song, W.; Cao, H.; Tu, T.; Song, Z.; Chen, P.; Liu, C. Jiaoyufication as an Education-Driven Gentrification in Urban China: A Case Study of Nanjing. J. Geogr. Sci. 2023, 33, 1095–1112. [Google Scholar] [CrossRef]
- Peng, Y.; Tian, C.; Wen, H. How Does School District Adjustment Affect Housing Prices: An Empirical Investigation from Hangzhou, China. China Econ. Rev. 2021, 69, 101683. [Google Scholar] [CrossRef]
- Du, K.; Cheng, Y.; Yao, X. Environmental Regulation, Green Technology Innovation, and Industrial Structure Upgrading: The Road to the Green Transformation of Chinese Cities. Energy Econ. 2021, 98, 105247. [Google Scholar] [CrossRef]
- Sun, B.; Zhang, T.; Wang, Y.; Zhang, L.; Li, W. Are Mega-Cities Wrecking Urban Hierarchies? A Cross-National Study on the Evolution of City-Size Distribution. Cities 2021, 108, 102999. [Google Scholar] [CrossRef]
- Cordero-Vinueza, V.A.; Niekerk, F.; van Dijk, T. (Terry) Making Child-Friendly Cities: A Socio-Spatial Literature Review. Cities 2023, 137, 104248. [Google Scholar] [CrossRef]
- Zhan, L.; Wang, S.; Xie, S.; Zhang, Q.; Qu, Y. Spatial Path to Achieve Urban-Rural Integration Development—Analytical Framework for Coupling the Linkage and Coordination of Urban-Rural System Functions. Habitat. Int. 2023, 142, 102953. [Google Scholar] [CrossRef]
- Levinson, M.; Geron, T.; Brighouse, H. Conceptions of Educational Equity. AERA Open 2022, 8, 23328584221121344. [Google Scholar] [CrossRef]
- Li, Z.; He, S.; Su, S.; Li, G.; Chen, F. Public Services Equalization in Urbanizing China: Indicators, Spatiotemporal Dynamics and Implications on Regional Economic Disparities. Soc. Indic. Res. 2020, 152, 1–65. [Google Scholar] [CrossRef]
- Hu, Z.; Zhang, M.; Liu, L.; Wu, H. Spatio-Temporal Analysis of Urban Leisure Consumption Activities Based on Autoencoder and Multi-Source Data: A Case Study of Chongqing, China. IEEE Access 2025, 13, 56112–56128. [Google Scholar] [CrossRef]
- Tian, L.; Liu, J.; Liang, Y.; Wu, Y. A Participatory E-Planning Model in the Urban Renewal of China: Implications of Technologies in Facilitating Planning Participation. Environ. Plan. B Urban. Anal. City Sci. 2023, 50, 299–315. [Google Scholar] [CrossRef]
- Pl ger, J. Urban Planning and Urban Life: Problems and Challenges. Plan. Pract. Res. 2006, 21, 201–222. [Google Scholar] [CrossRef]
- Xiang, L.; Stillwell, J.; Burns, L.; Heppenstall, A. Measuring and Assessing Regional Education Inequalities in China under Changing Policy Regimes. Appl. Spat. Anal. Policy 2020, 13, 91–112. [Google Scholar] [CrossRef]
- Kimelberg, S.M.; Williams, E. Evaluating the Importance of Business Location Factors: The Influence of Facility Type. Growth Change 2013, 44, 92–117. [Google Scholar] [CrossRef]
- Guimaraes, T.; Liska, K. Exploring the Business Benefits of Environmental Stewardship. Bus. Strategy Environ. 1995, 4, 9–22. [Google Scholar] [CrossRef]
- Limstrand, T. Environmental Characteristics Relevant to Young People’s Use of Sports Facilities: A Review. Scand. J. Med. Sci. Sports 2008, 18, 275–287. [Google Scholar] [CrossRef] [PubMed]
- Jang, W.Y.; Baek, S.Y. The Relative Importance of Servicescape in Fitness Center for Facility Improvement. Heliyon 2024, 10, e29562. [Google Scholar] [CrossRef]
- Jiao, J.; Rollo, J.; Fu, B.; Liu, C. Exploring Effective Built Environment Factors for Evaluating Pedestrian Volume in High-Density Areas: A New Finding for the Central Business District in Melbourne, Australia. Land 2021, 10, 655. [Google Scholar] [CrossRef]
- Ochoa Rico, M.S.; Vergara-Romero, A.; Subia, J.F.R.; del Río, J.A.J. Study of Citizen Satisfaction and Loyalty in the Urban Area of Guayaquil: Perspective of the Quality of Public Services Applying Structural Equations. PLoS ONE 2022, 17, e0263331. [Google Scholar] [CrossRef]
- Järv, O.; Tenkanen, H.; Salonen, M.; Ahas, R.; Toivonen, T. Dynamic Cities: Location-Based Accessibility Modelling as a Function of Time. Appl. Geogr. 2018, 95, 101–110. [Google Scholar] [CrossRef]
- Tahmasbi, B.; Mansourianfar, M.H.; Haghshenas, H.; Kim, I. Multimodal Accessibility-Based Equity Assessment of Urban Public Facilities Distribution. Sustain. Cities Soc. 2019, 49, 101633. [Google Scholar] [CrossRef]
- Barbati, M.; Piccolo, C. Equality Measures Properties for Location Problems. Optim. Lett. 2016, 10, 903–920. [Google Scholar] [CrossRef]
- Barbara, M.; Rey, D.; Akbarnezhad, A. Optimizing Location of New Public Schools in Town Planning Considering Supply and Demand. J. Urban Plan Dev. 2021, 147, 04021057. [Google Scholar] [CrossRef]
- Peng, J.; Liu, Y.; Ruan, Z.; Yang, H. Study on the Optimal Allocation of Public Service Facilities from the Perspective of Living Circle—A Case Study of Xiangyang High-Tech Zone, China. J. Urban. Manag. 2023, 12, 344–359. [Google Scholar] [CrossRef]
- Yang, L.; Zhang, S.; Guan, M.; Cao, J.; Zhang, B. An Assessment of the Accessibility of Multiple Public Service Facilities and Its Correlation with Housing Prices Using an Improved 2SFCA Method—A Case Study of Jinan City, China. ISPRS Int. J. Geoinf. 2022, 11, 414. [Google Scholar] [CrossRef]
- Shi, Y.; Yang, J.; Shen, P. Revealing the Correlation between Population Density and the Spatial Distribution of Urban Public Service Facilities with Mobile Phone Data. ISPRS Int. J. Geoinf. 2020, 9, 38. [Google Scholar] [CrossRef]
- Keyimu, M.; Abulikemu, Z.; Abudurexiti, A. Quantitative Evaluation of the Equity of Public Service Facility Layout in Urumqi City for Sustainable Development. Sustainability 2024, 16, 4913. [Google Scholar] [CrossRef]
- Qiu, Z.; Wang, Y.; Bao, L.; Yun, B.; Lu, J. Sustainability of Chinese Village Development in a New Perspective: Planning Principle of Rural Public Service Facilities Based on “Function-Space” Synergistic Mechanism. Sustainability 2022, 14, 8544. [Google Scholar] [CrossRef]
- Ma, X.; Zhang, J.; Ding, C.; Wang, Y. A Geographically and Temporally Weighted Regression Model to Explore the Spatiotemporal Influence of Built Environment on Transit Ridership. Comput. Environ. Urban. Syst. 2018, 70, 113–124. [Google Scholar] [CrossRef]
- Li, T.; Zhao, Y.; Kong, X. Spatio-Temporal Characteristics and Influencing Factors of Basic Public Service Levels in the Yangtze River Delta Region, China. Land 2022, 11, 1477. [Google Scholar] [CrossRef]
- Current, J.; Ratick, S.; ReVelle, C. Dynamic Facility Location When the Total Number of Facilities Is Uncertain: A Decision Analysis Approach. Eur. J. Oper. Res. 1998, 110, 597–609. [Google Scholar] [CrossRef]
- Chen, H.; Covert, I.C.; Lundberg, S.M.; Lee, S.-I. Algorithms to Estimate Shapley Value Feature Attributions. Nat. Mach. Intell. 2023, 5, 590–601. [Google Scholar] [CrossRef]
- Rozemberczki, B.; Watson, L.; Bayer, P.; Yang, H.-T.; Kiss, O.; Nilsson, S.; Sarkar, R. The Shapley Value in Machine Learning. In Proceedings of the Thirty-First International Joint Conference on Artificial Intelligence, Vienna, Austria, 23–29 July 2022; pp. 5572–5579. [Google Scholar]
- Wu, Z.; Zhu, M.; Kang, Y.; Leung, E.L.-H.; Lei, T.; Shen, C.; Jiang, D.; Wang, Z.; Cao, D.; Hou, T. Do We Need Different Machine Learning Algorithms for QSAR Modeling? A Comprehensive Assessment of 16 Machine Learning Algorithms on 14 QSAR Data Sets. Brief Bioinform. 2021, 22, bbaa321. [Google Scholar] [CrossRef]
- Huang, J.-C.; Ko, K.-M.; Shu, M.-H.; Hsu, B.-M. Application and Comparison of Several Machine Learning Algorithms and Their Integration Models in Regression Problems. Neural Comput. Appl. 2020, 32, 5461–5469. [Google Scholar] [CrossRef]
- Yang, L.; Shami, A. On Hyperparameter Optimization of Machine Learning Algorithms: Theory and Practice. Neurocomputing 2020, 415, 295–316. [Google Scholar] [CrossRef]
- Gupta, B.; Rawat, A.; Jain, A.; Arora, A.; Dhami, N. Analysis of Various Decision Tree Algorithms for Classification in Data Mining. Int. J. Comput. Appl. 2017, 163, 15–19. [Google Scholar] [CrossRef]
- Charbuty, B.; Abdulazeez, A. Classification Based on Decision Tree Algorithm for Machine Learning. J. Appl. Sci. Technol. Trends 2021, 2, 20–28. [Google Scholar] [CrossRef]
- Black, J.E.; Kueper, J.K.; Williamson, T.S. An Introduction to Machine Learning for Classification and Prediction. Fam. Pract. 2023, 40, 200–204. [Google Scholar] [CrossRef]
- Bai, X.; Shi, P. China’s Urbanization at a Turning Point—Challenges and Opportunities. Science 2025, 388, eadw3443. [Google Scholar] [CrossRef]
- Li, K.; Hou, Y.; Randall, M.T.; Skov-Petersen, H.; Li, X. The Spatio-Temporal Trade-off between Ecosystem and Basic Public Services and the Urbanization Driving Force in the Rapidly Urbanizing Region. Sustain. Cities Soc. 2024, 111, 105554. [Google Scholar] [CrossRef]
- Zhu, A.; Lu, G.; Liu, J.; Qin, C.; Zhou, C. Spatial Prediction Based on Third Law of Geography. Ann. GIS 2018, 24, 225–240. [Google Scholar] [CrossRef]
- Tobler, W.R. A Computer Movie Simulating Urban Growth in the Detroit Region. Econ. Geogr. 1970, 46, 234. [Google Scholar] [CrossRef]
- Zhu, A.-X.; Turner, M. How Is the Third Law of Geography Different? Ann. GIS 2022, 28, 57–67. [Google Scholar] [CrossRef]
- Song, Y. Geographically Optimal Similarity. Math. Geosci. 2023, 55, 295–320. [Google Scholar] [CrossRef]
- Zhao, F.-H.; Huang, J.; Zhu, A.-X. Spatial Prediction of Groundwater Level Change Based on the Third Law of Geography. Int. J. Geogr. Inf. Sci. 2023, 37, 2129–2149. [Google Scholar] [CrossRef]
- Musiaka, Ł.; Nalej, M. Application of GIS Tools in the Measurement Analysis of Urban Spatial Layouts Using the Square Grid Method. ISPRS Int. J. Geoinf. 2021, 10, 558. [Google Scholar] [CrossRef]
- Steiner, F.R.; Butler, K. Planning and Urban Design Standards; John Wiley & Sons: Hoboken, NJ, USA, 2012; ISBN 1118550765. [Google Scholar]
- Horie, N.; Hagihara, K.; Kimura, F.; Asahi, C. Evaluation of the Educational Role of Urban Facilities and Their Contribution to Regional Sustainability. In Toward Sustainable Regions; Springer: Berlin/Heidelberg, Germany, 2023; pp. 105–131. [Google Scholar]
- Song, T.; Luo, X.; Li, X. Clustering of Basic Educational Resources and Urban Resilience Development in the Central Region of China—An Empirical Study Based on POI Data. Reg. Sci. Environ. Econ. 2024, 1, 46–59. [Google Scholar] [CrossRef]
- Pauw, J.; Gericke, N.; Olsson, D.; Berglund, T. The Effectiveness of Education for Sustainable Development. Sustainability 2015, 7, 15693–15717. [Google Scholar] [CrossRef]
- Herzallah, W.; Faris, H.; Adwan, O. Feature Engineering for Detecting Spammers on Twitter: Modelling and Analysis. J. Inf. Sci. 2018, 44, 230–247. [Google Scholar] [CrossRef]
- Zhang, Y.-P.; Zhang, X.-Y.; Cheng, Y.-T.; Li, B.; Teng, X.-Z.; Zhang, J.; Lam, S.; Zhou, T.; Ma, Z.-R.; Sheng, J.-B.; et al. Artificial Intelligence-Driven Radiomics Study in Cancer: The Role of Feature Engineering and Modeling. Mil. Med. Res. 2023, 10, 22. [Google Scholar] [CrossRef] [PubMed]
- Jordan, M.I.; Mitchell, T.M. Machine Learning: Trends, Perspectives, and Prospects. Science 2015, 349, 255–260. [Google Scholar] [CrossRef] [PubMed]
- Patel, M.; Tan, J.B.; Chou, F.-S. Non-Linear Algorithms in Supervised Classical Machine Learning. Neonatol. Today 2021, 16, 40–43. [Google Scholar] [CrossRef]
- Belkin, M.; Hsu, D.; Ma, S.; Mandal, S. Reconciling Modern Machine-Learning Practice and the Classical Bias–Variance Trade-Off. Proc. Natl. Acad. Sci. USA 2019, 116, 15849–15854. [Google Scholar] [CrossRef]
- Gordon, A.D.; Breiman, L.; Friedman, J.H.; Olshen, R.A.; Stone, C.J. Classification and Regression Trees. Biometrics 1984, 40, 874. [Google Scholar] [CrossRef]
- Chen, M.-S.; Han, J.; Yu, P.S. Data Mining: An Overview from a Database Perspective. IEEE Trans. Knowl. Data Eng. 1996, 8, 866–883. [Google Scholar] [CrossRef]
- Wu, X.; Kumar, V.; Ross Quinlan, J.; Ghosh, J.; Yang, Q.; Motoda, H.; McLachlan, G.J.; Ng, A.; Liu, B.; Yu, P.S.; et al. Top 10 Algorithms in Data Mining. Knowl. Inf. Syst. 2008, 14, 1–37. [Google Scholar] [CrossRef]
- Ho, T.K. Random Decision Forests. In Proceedings of the 3rd International Conference on Document Analysis and Recognition, Montreal, QC, Canada, 14–16 August 1995; pp. 278–282. [Google Scholar]
- Ho, T.K. The Random Subspace Method for Constructing Decision Forests. IEEE Trans. Pattern Anal. Mach. Intell. 1998, 20, 832–844. [Google Scholar] [CrossRef]
- Dhaliwal, S.S.; Nahid, A.-A.; Abbas, R. Effective Intrusion Detection System Using XGBoost. Information 2018, 9, 149. [Google Scholar] [CrossRef]
- Zhang, P.; Jia, Y.; Shang, Y. Research and Application of XGBoost in Imbalanced Data. Int. J. Distrib. Sens. Netw. 2022, 18, 155013292211069. [Google Scholar] [CrossRef]
- Chen, T.; Guestrin, C. XGBoost: A Scalable Tree Boosting System. In Proceedings of the 22nd ACM SIGKDD International Conference on Knowledge Discovery and Data Mining, New York, NY, USA, 13 August 2016; pp. 785–794. [Google Scholar]
- Wang, J.; Zhang, X. Land-Based Urbanization in China: Mismatched Land Development in the Post-Financial Crisis Era. Habitat. Int. 2022, 125, 102598. [Google Scholar] [CrossRef]
- Laue, S.; Blacher, M.; Giesen, J. Optimization for Classical Machine Learning Problems on the GPU. Proc. AAAI Conf. Artif. Intell. 2022, 36, 7300–7308. [Google Scholar] [CrossRef]
- Krueger, A.B.; Lindahl, M. Education for Growth: Why and for Whom? J. Econ. Lit. 2001, 39, 1101–1136. [Google Scholar] [CrossRef]
- Huang, L.; Zheng, W.; Hong, J.; Liu, Y.; Liu, G. Paths and Strategies for Sustainable Urban Renewal at the Neighbourhood Level: A Framework for Decision-Making. Sustain. Cities Soc. 2020, 55, 102074. [Google Scholar] [CrossRef]
Disclaimer/Publisher’s Note: The statements, opinions and data contained in all publications are solely those of the individual author(s) and contributor(s) and not of MDPI and/or the editor(s). MDPI and/or the editor(s) disclaim responsibility for any injury to people or property resulting from any ideas, methods, instructions or products referred to in the content. |
© 2025 by the authors. Licensee MDPI, Basel, Switzerland. This article is an open access article distributed under the terms and conditions of the Creative Commons Attribution (CC BY) license (https://creativecommons.org/licenses/by/4.0/).