GeoShapley-Based Explainable GeoAI for Sustainable Community Satisfaction Assessment: Evidence from Chengdu, China
Abstract
1. Introduction
- Methodological: Uses XGBoost to capture nonlinear relationships between community satisfaction and influencing factors and integrates GeoShapley to quantify the spatial heterogeneity of these relationships—filling the gap of “neglecting spatial effects in interpretable machine learning” in existing studies.
- Mechanism level: Identifies thresholds and interactions of variables on CS from both global and local perspectives.
- Application level: Combines GeoShapley decomposition with the quantified differential contributions of spatial units to propose more targeted community governance optimization strategies.
2. Literature Review
2.1. Theoretical Foundations
2.2. Research Progress and Methodological Limitations in Factors Influencing Community Satisfaction
3. Materials and Methods
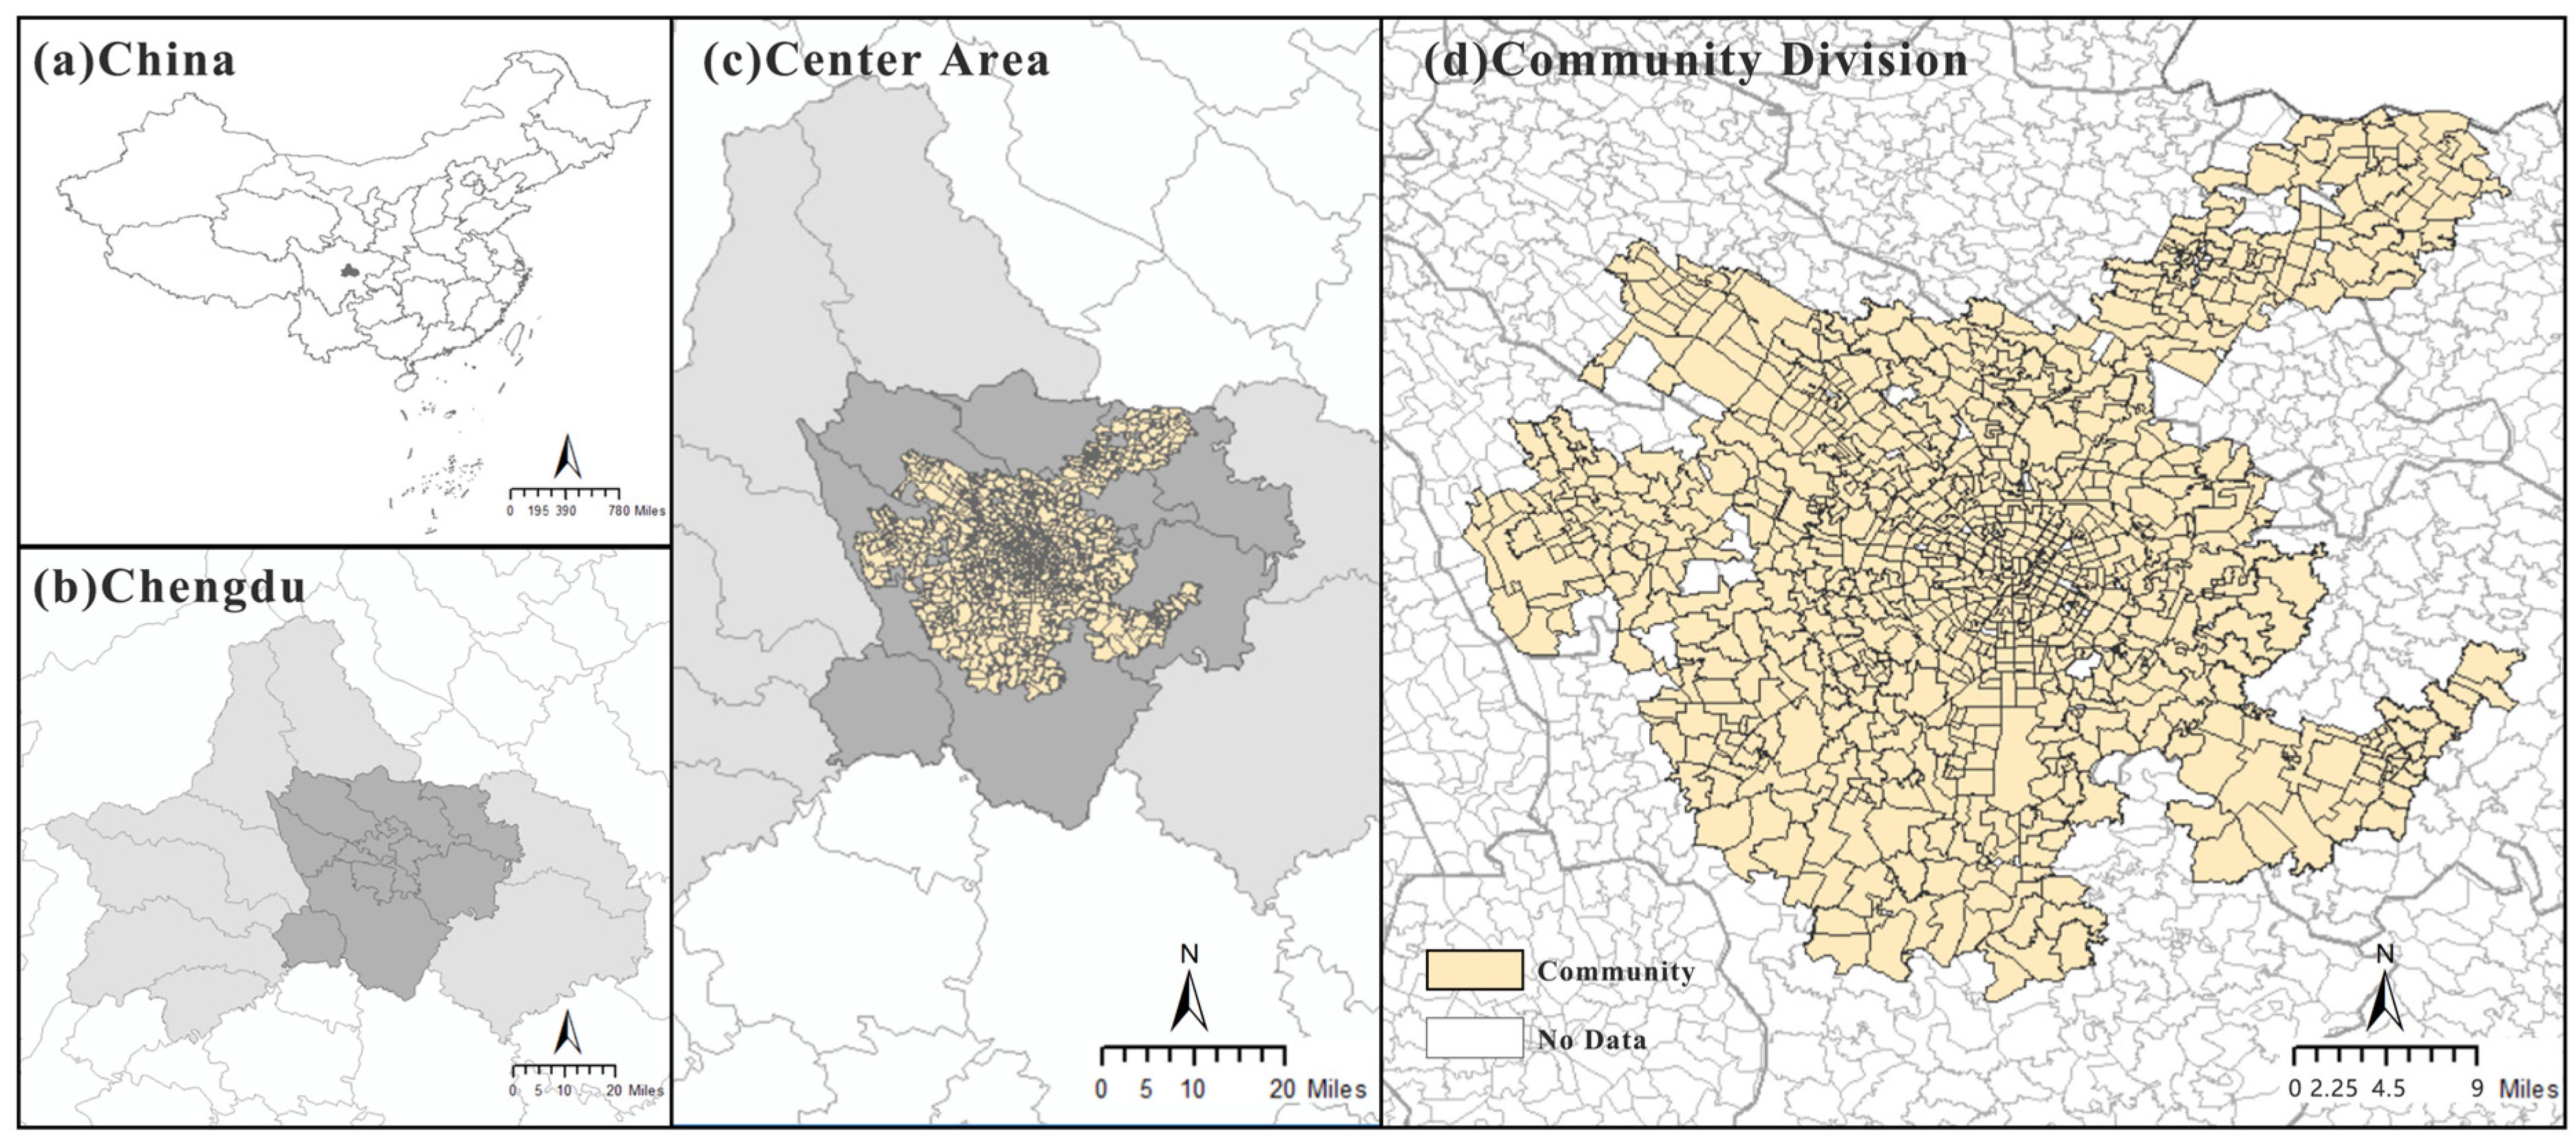
3.1. Study Area
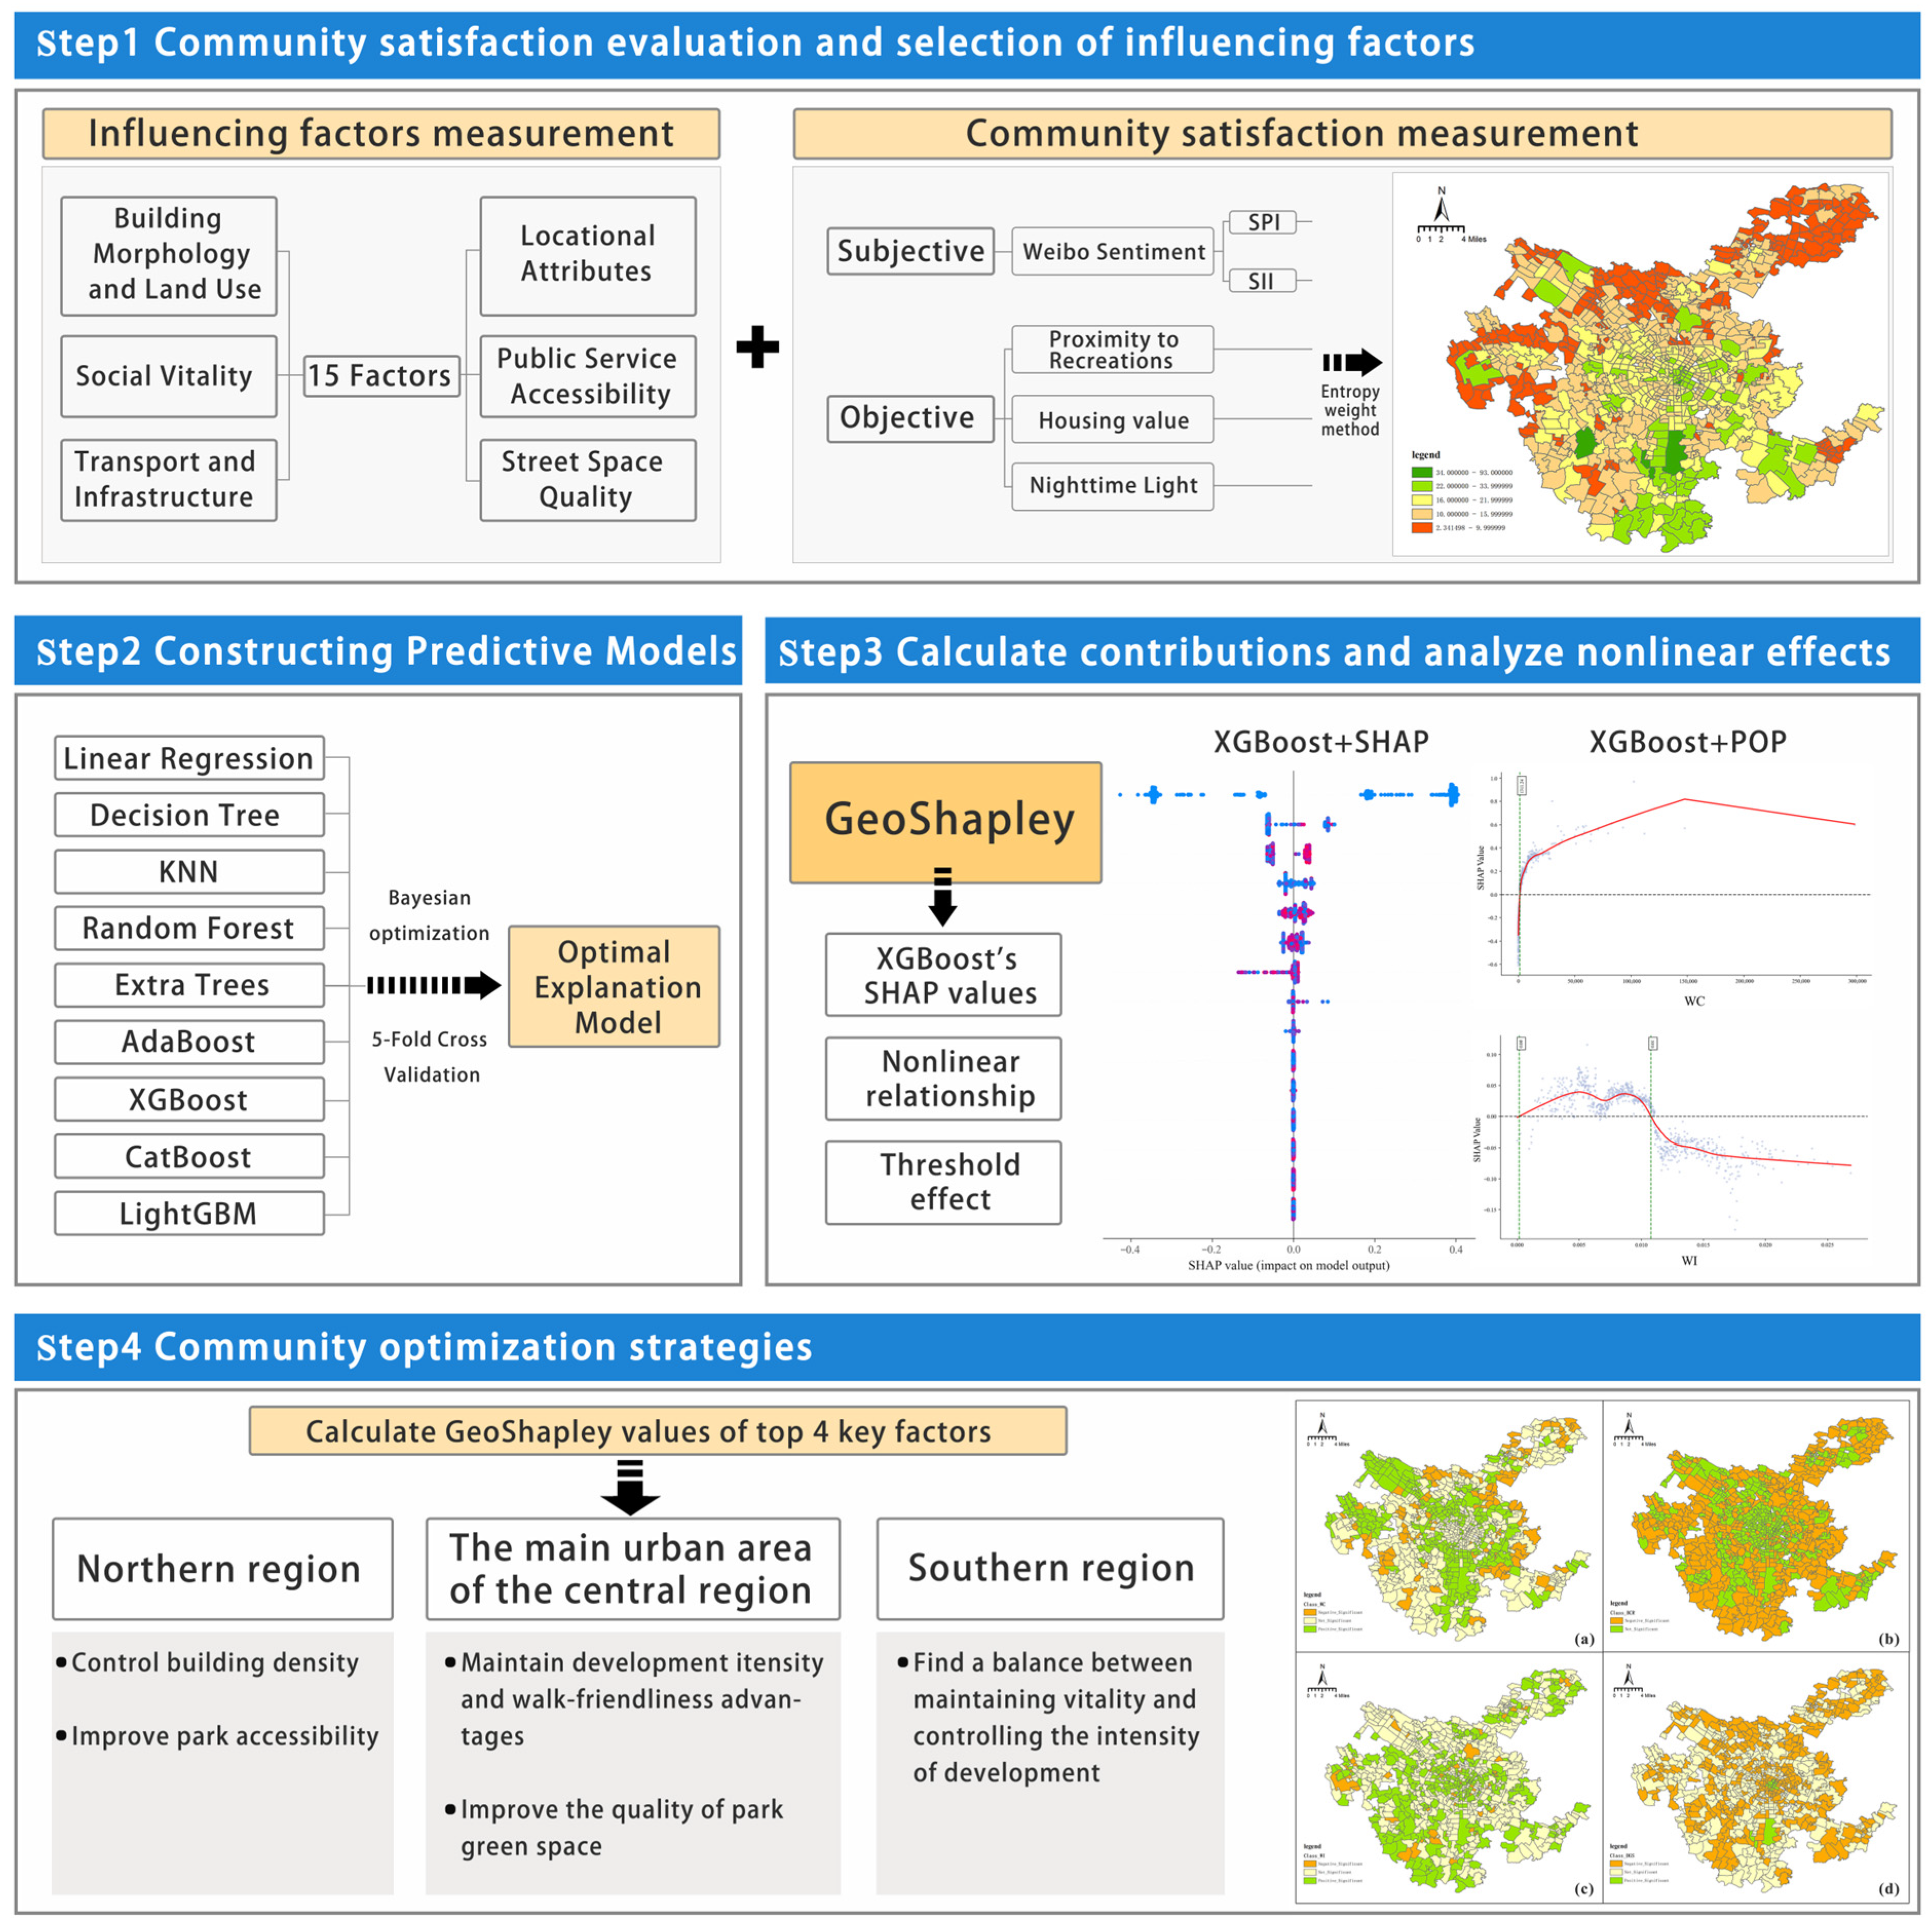
3.2. Research Framework
3.3. Data Sources and Processing
3.3.1. Data and Preprocessing
3.3.2. Community Satisfaction
3.3.3. Influencing Factor Selection
3.4. Machine Learning Models
4. Results
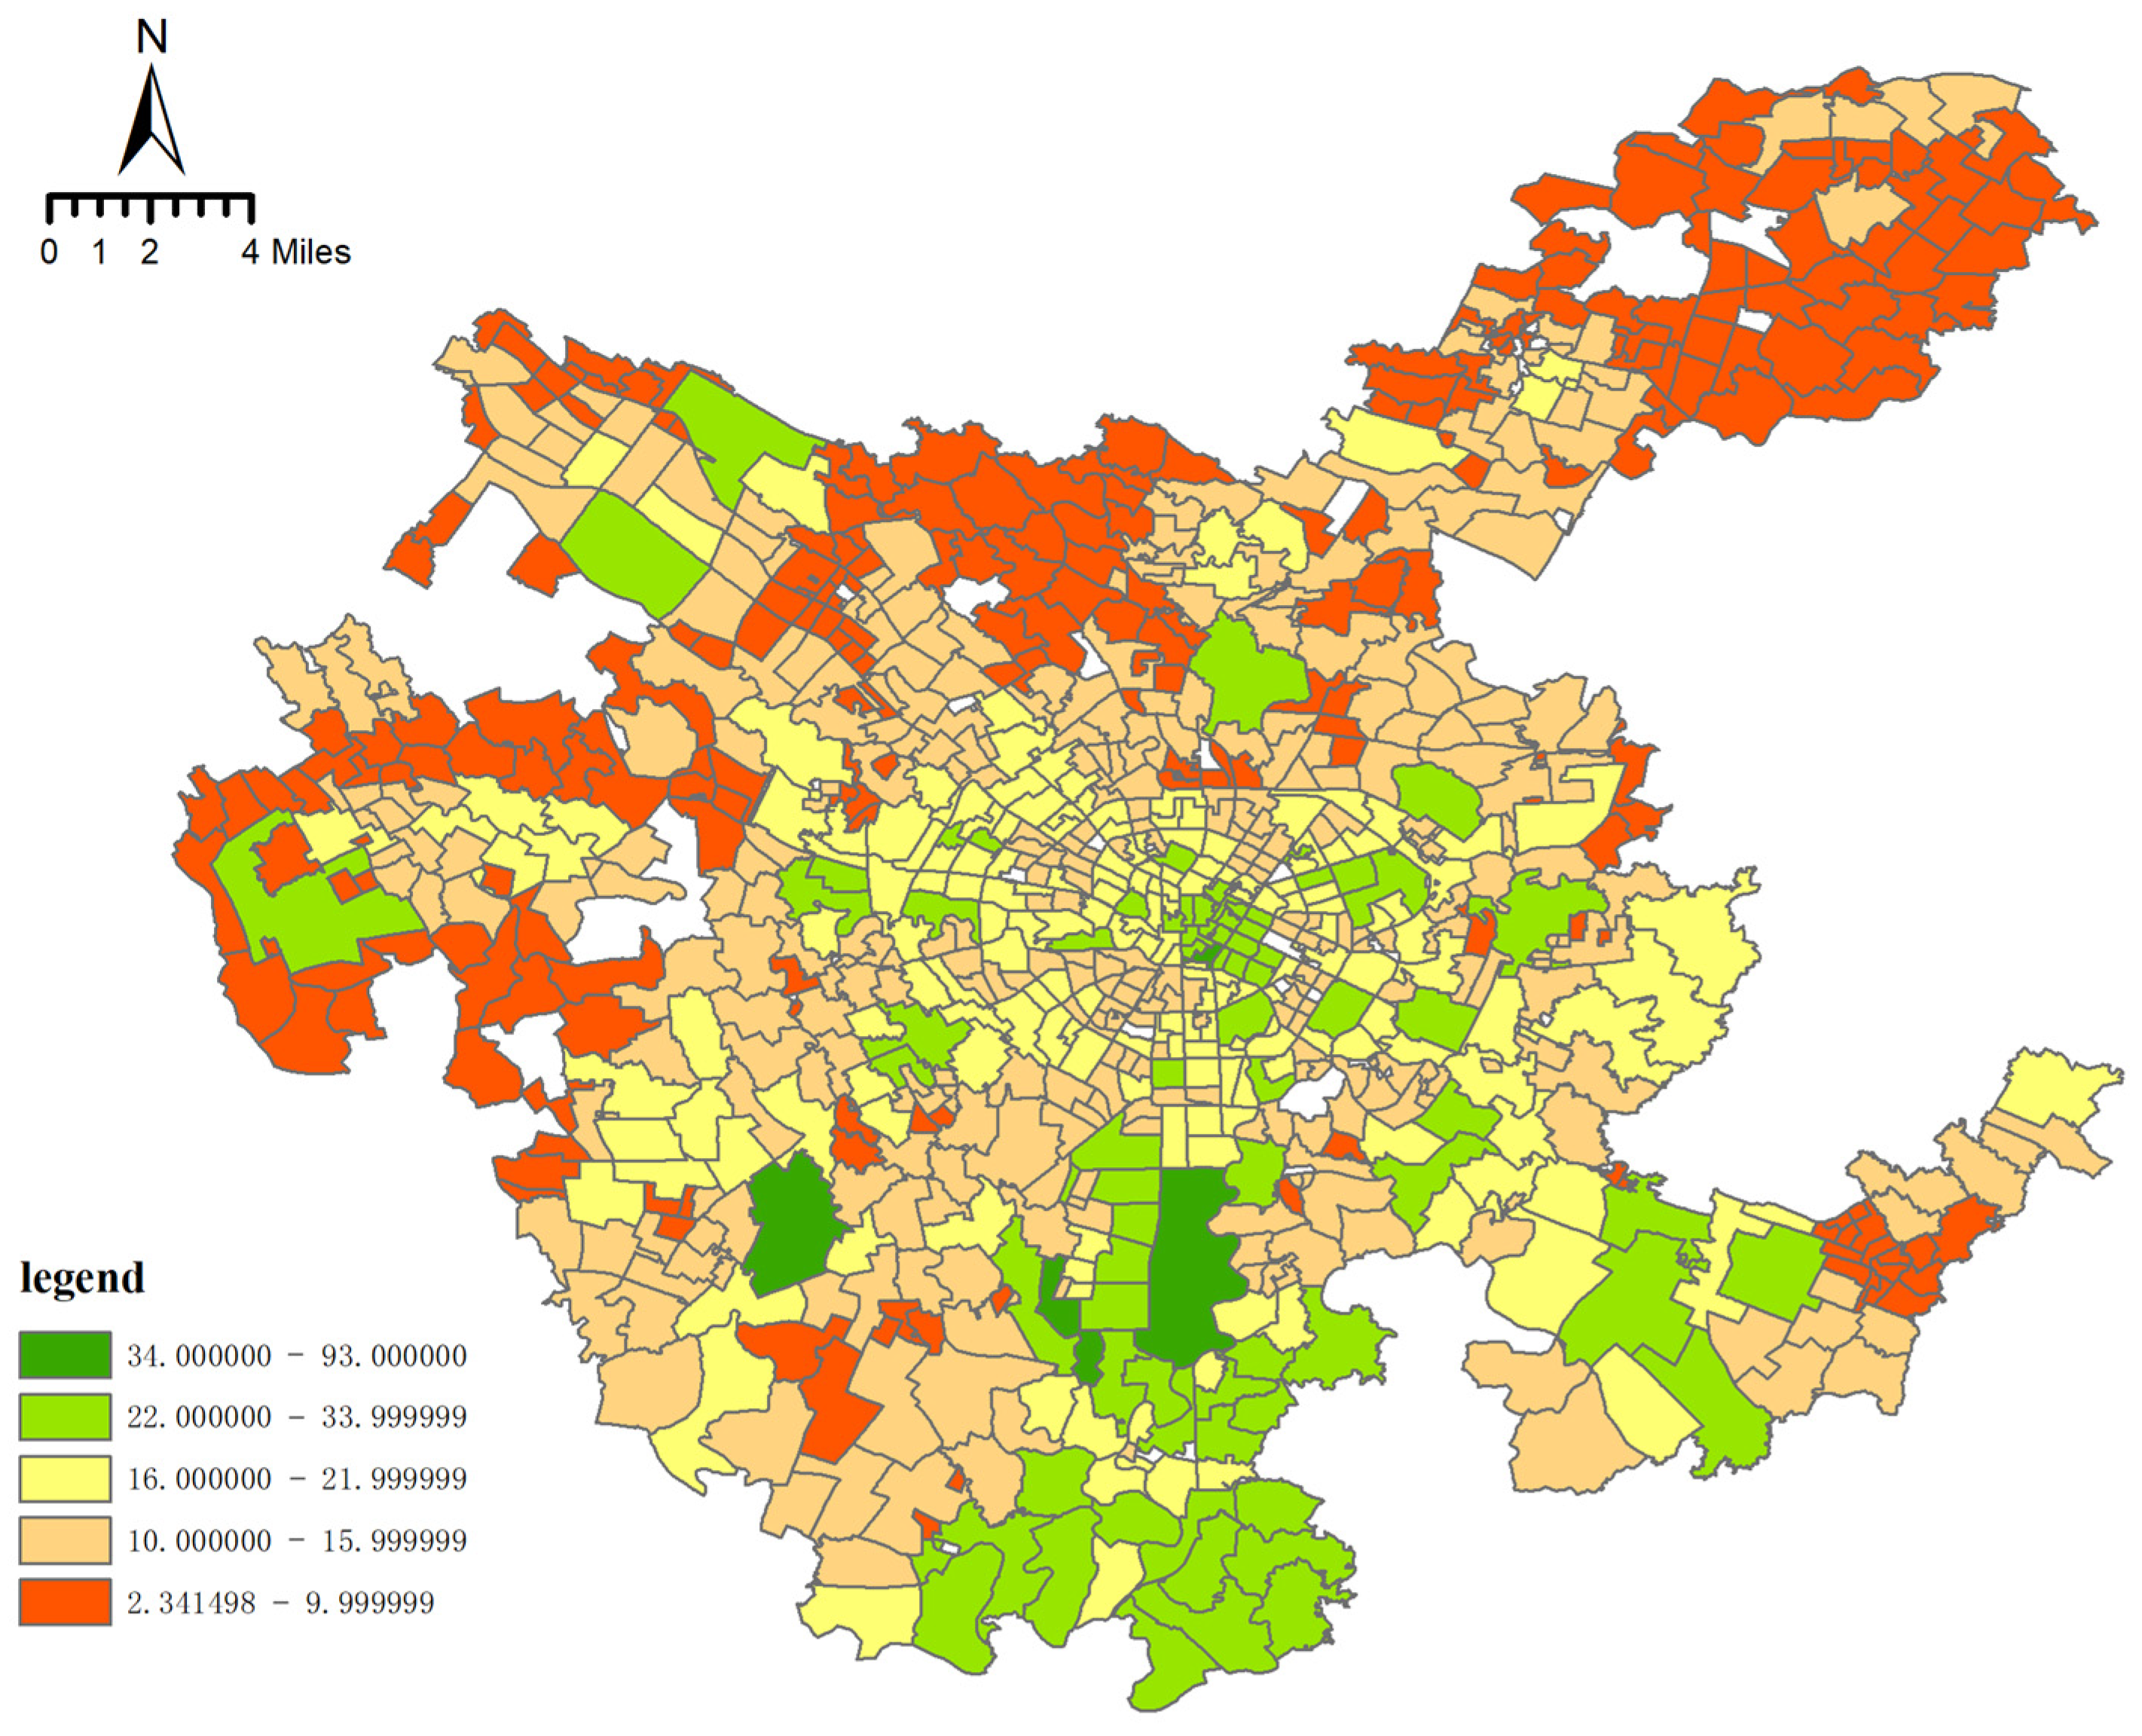
4.1. Distribution Characteristics of CS in Chengdu’s Central Urban Area
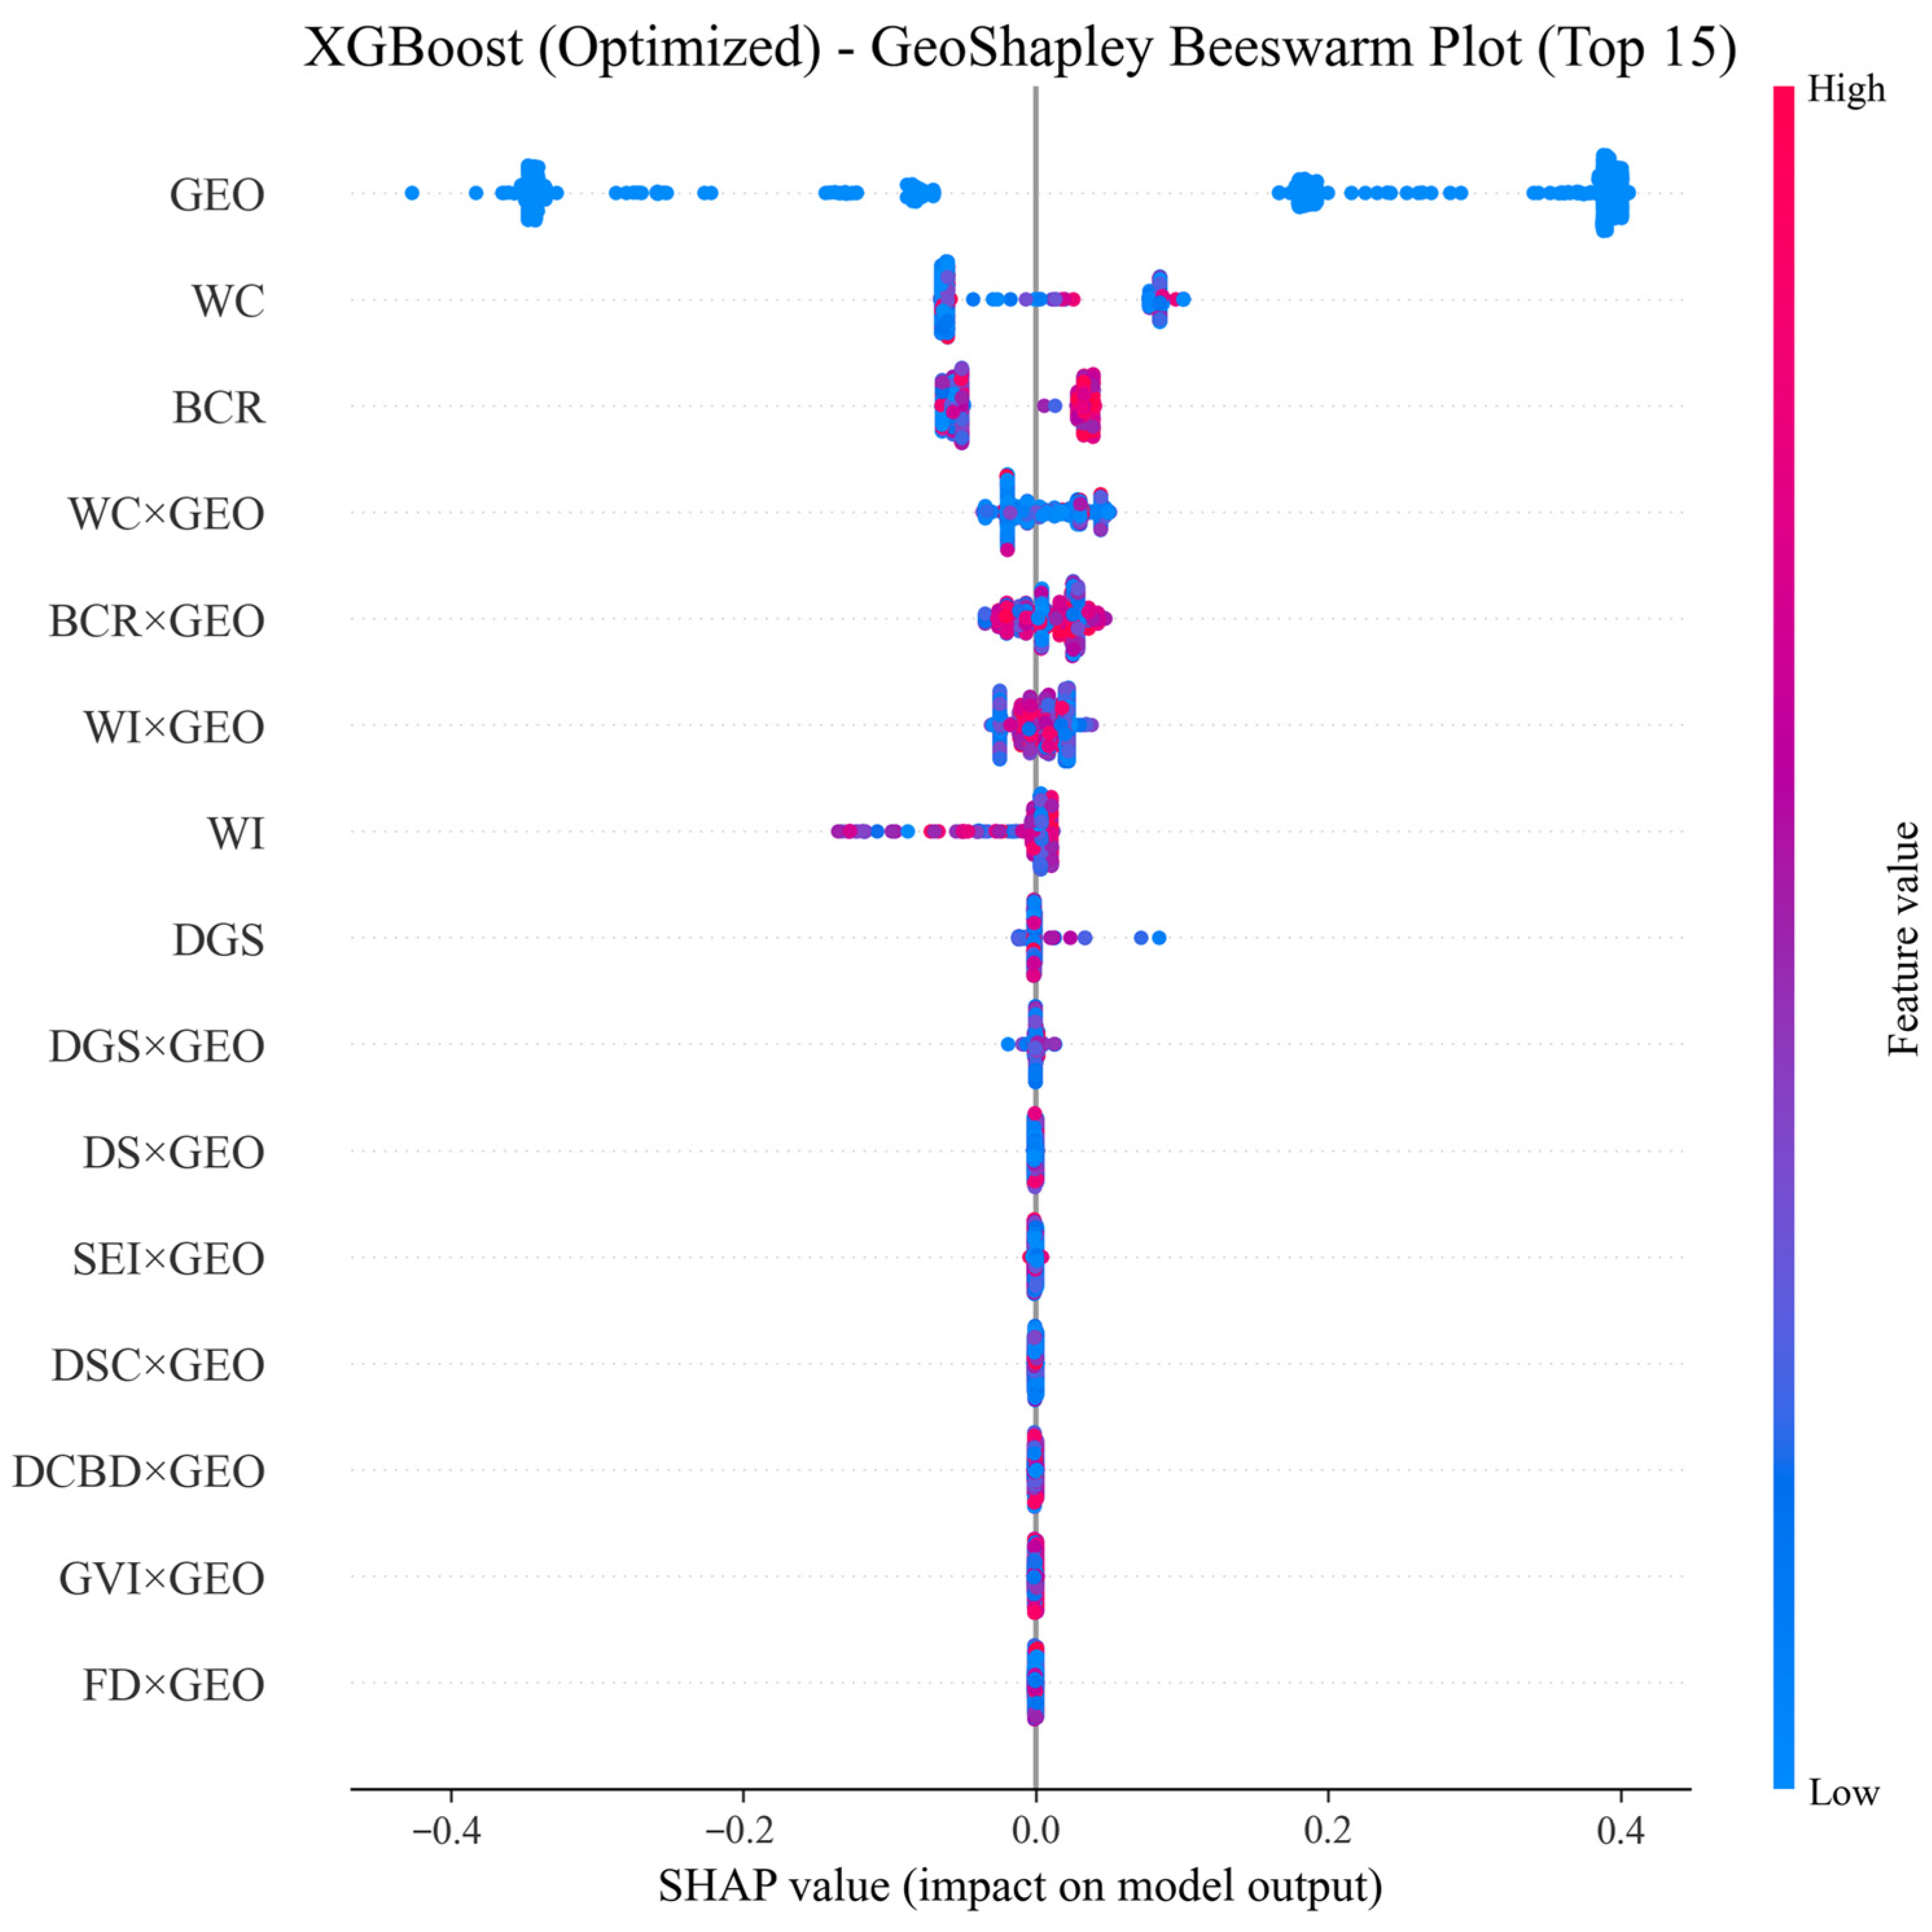
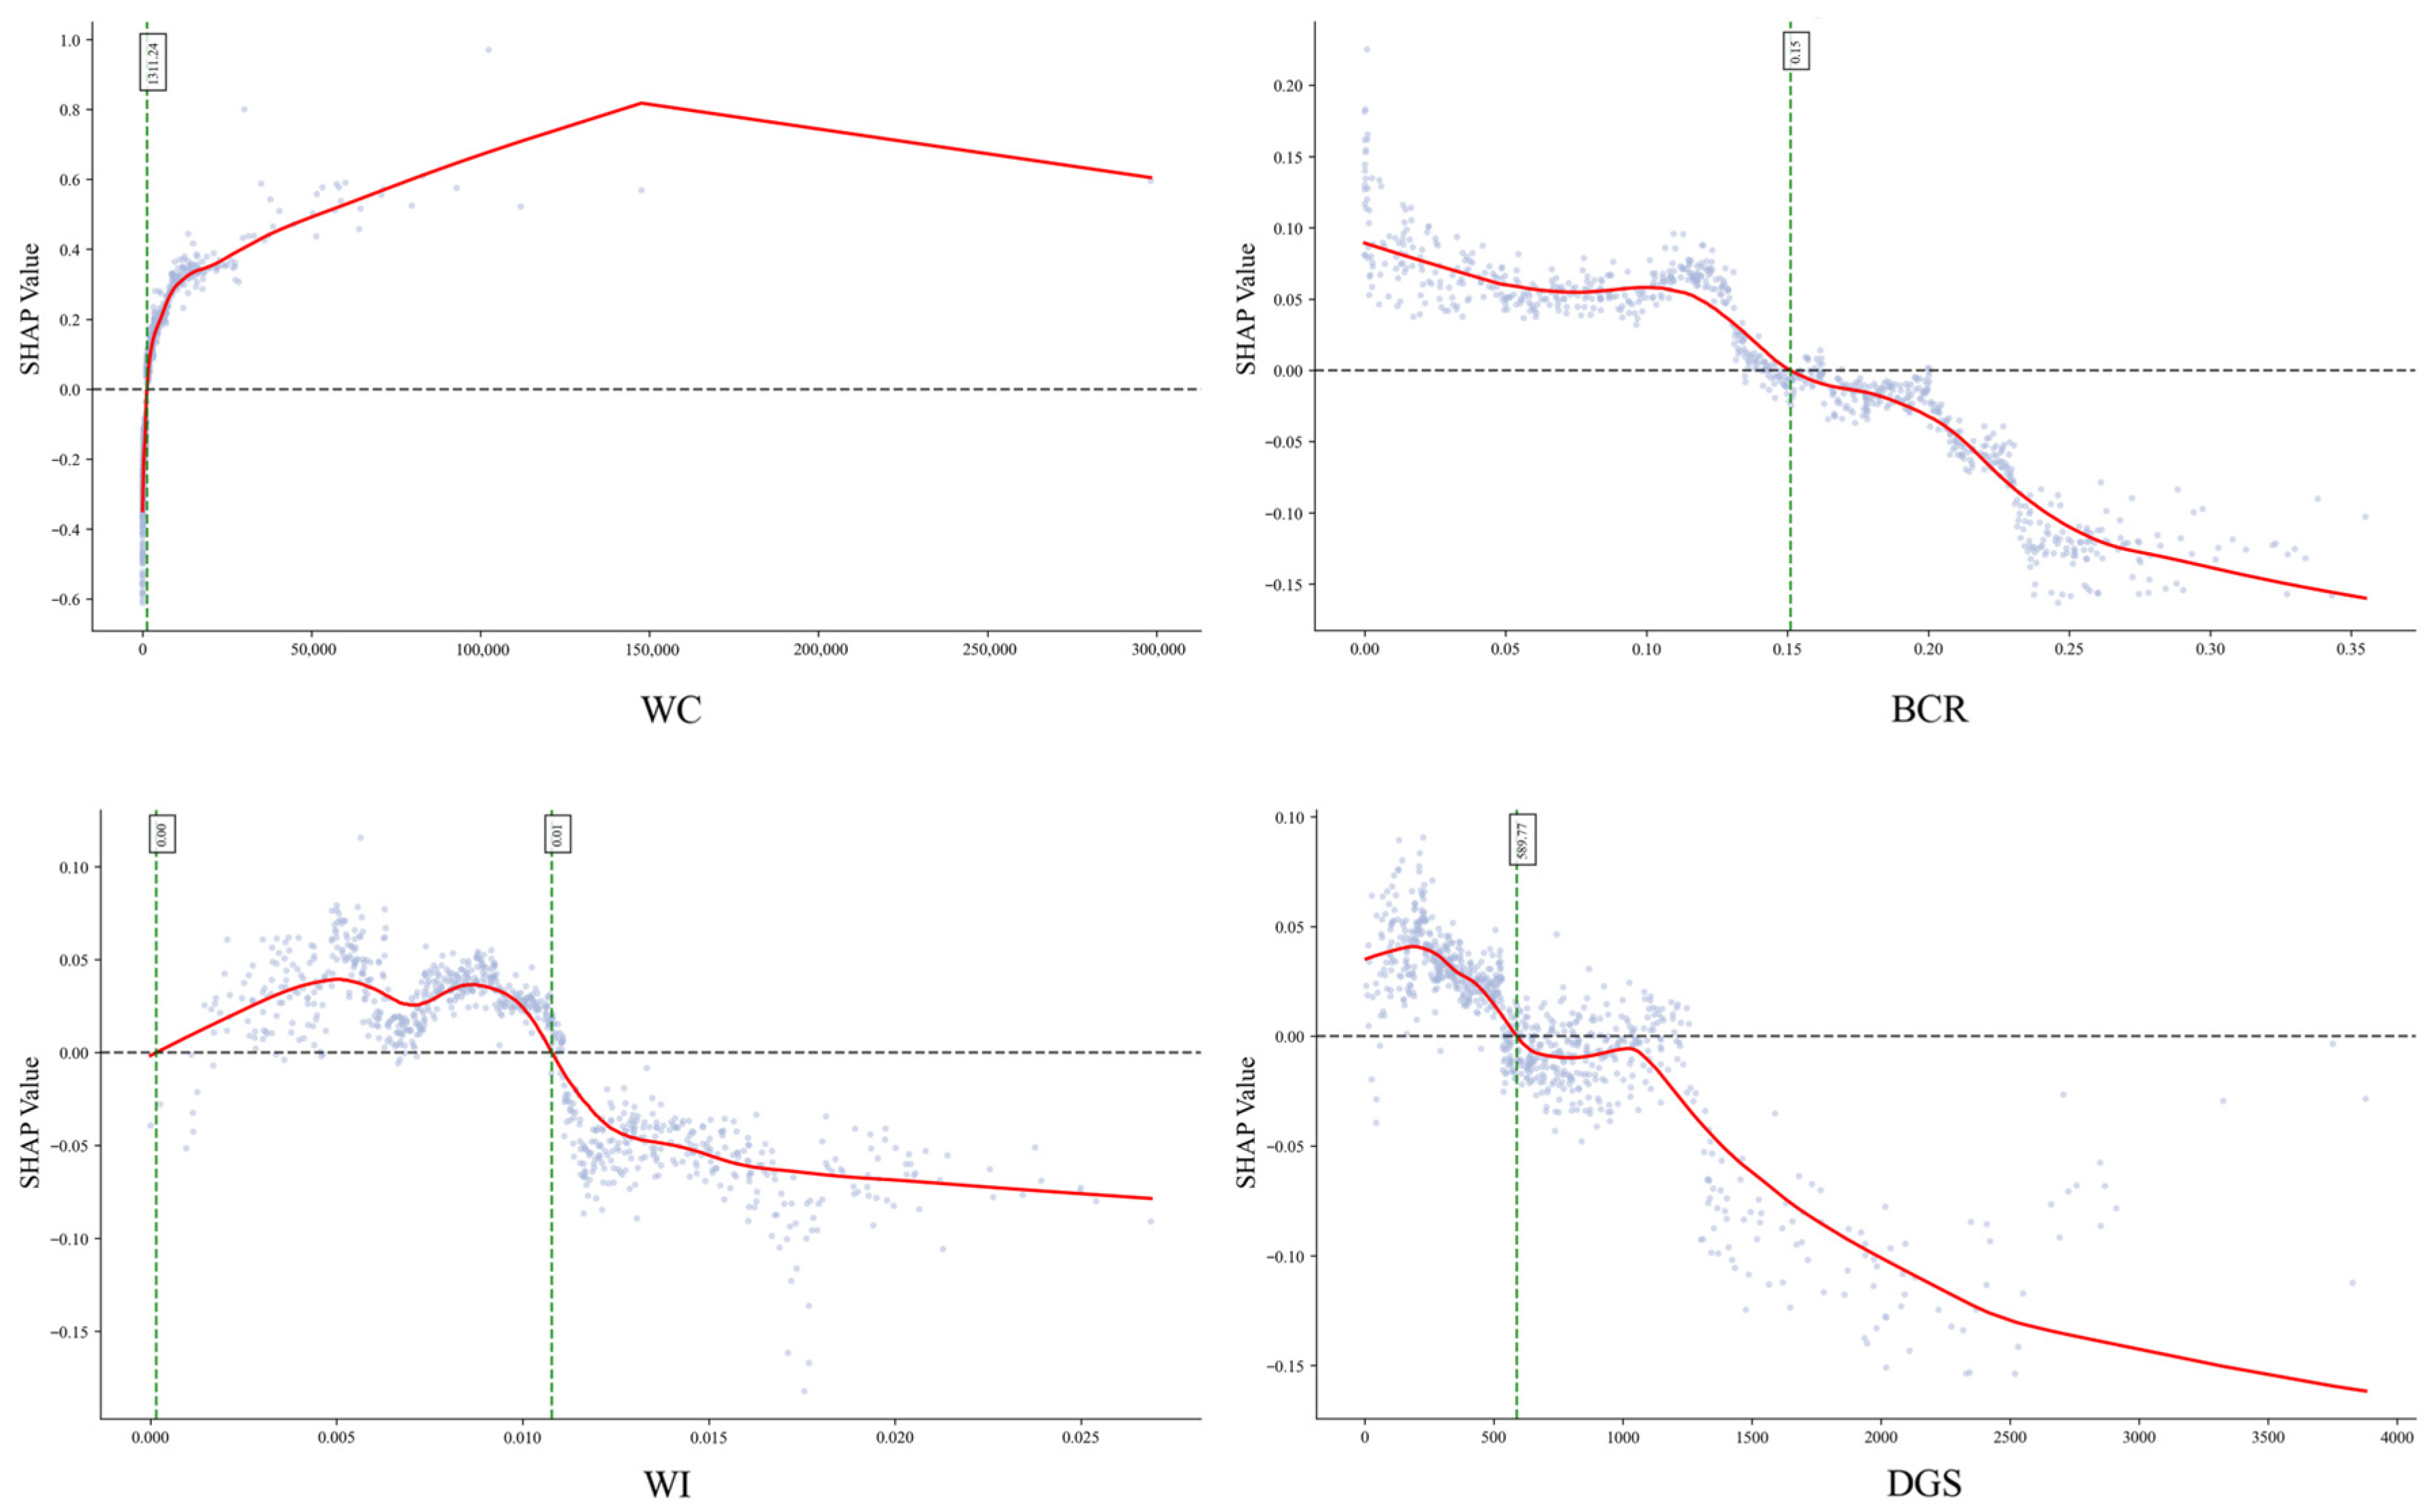
4.2. Global Feature Importance and Nonlinear Effects
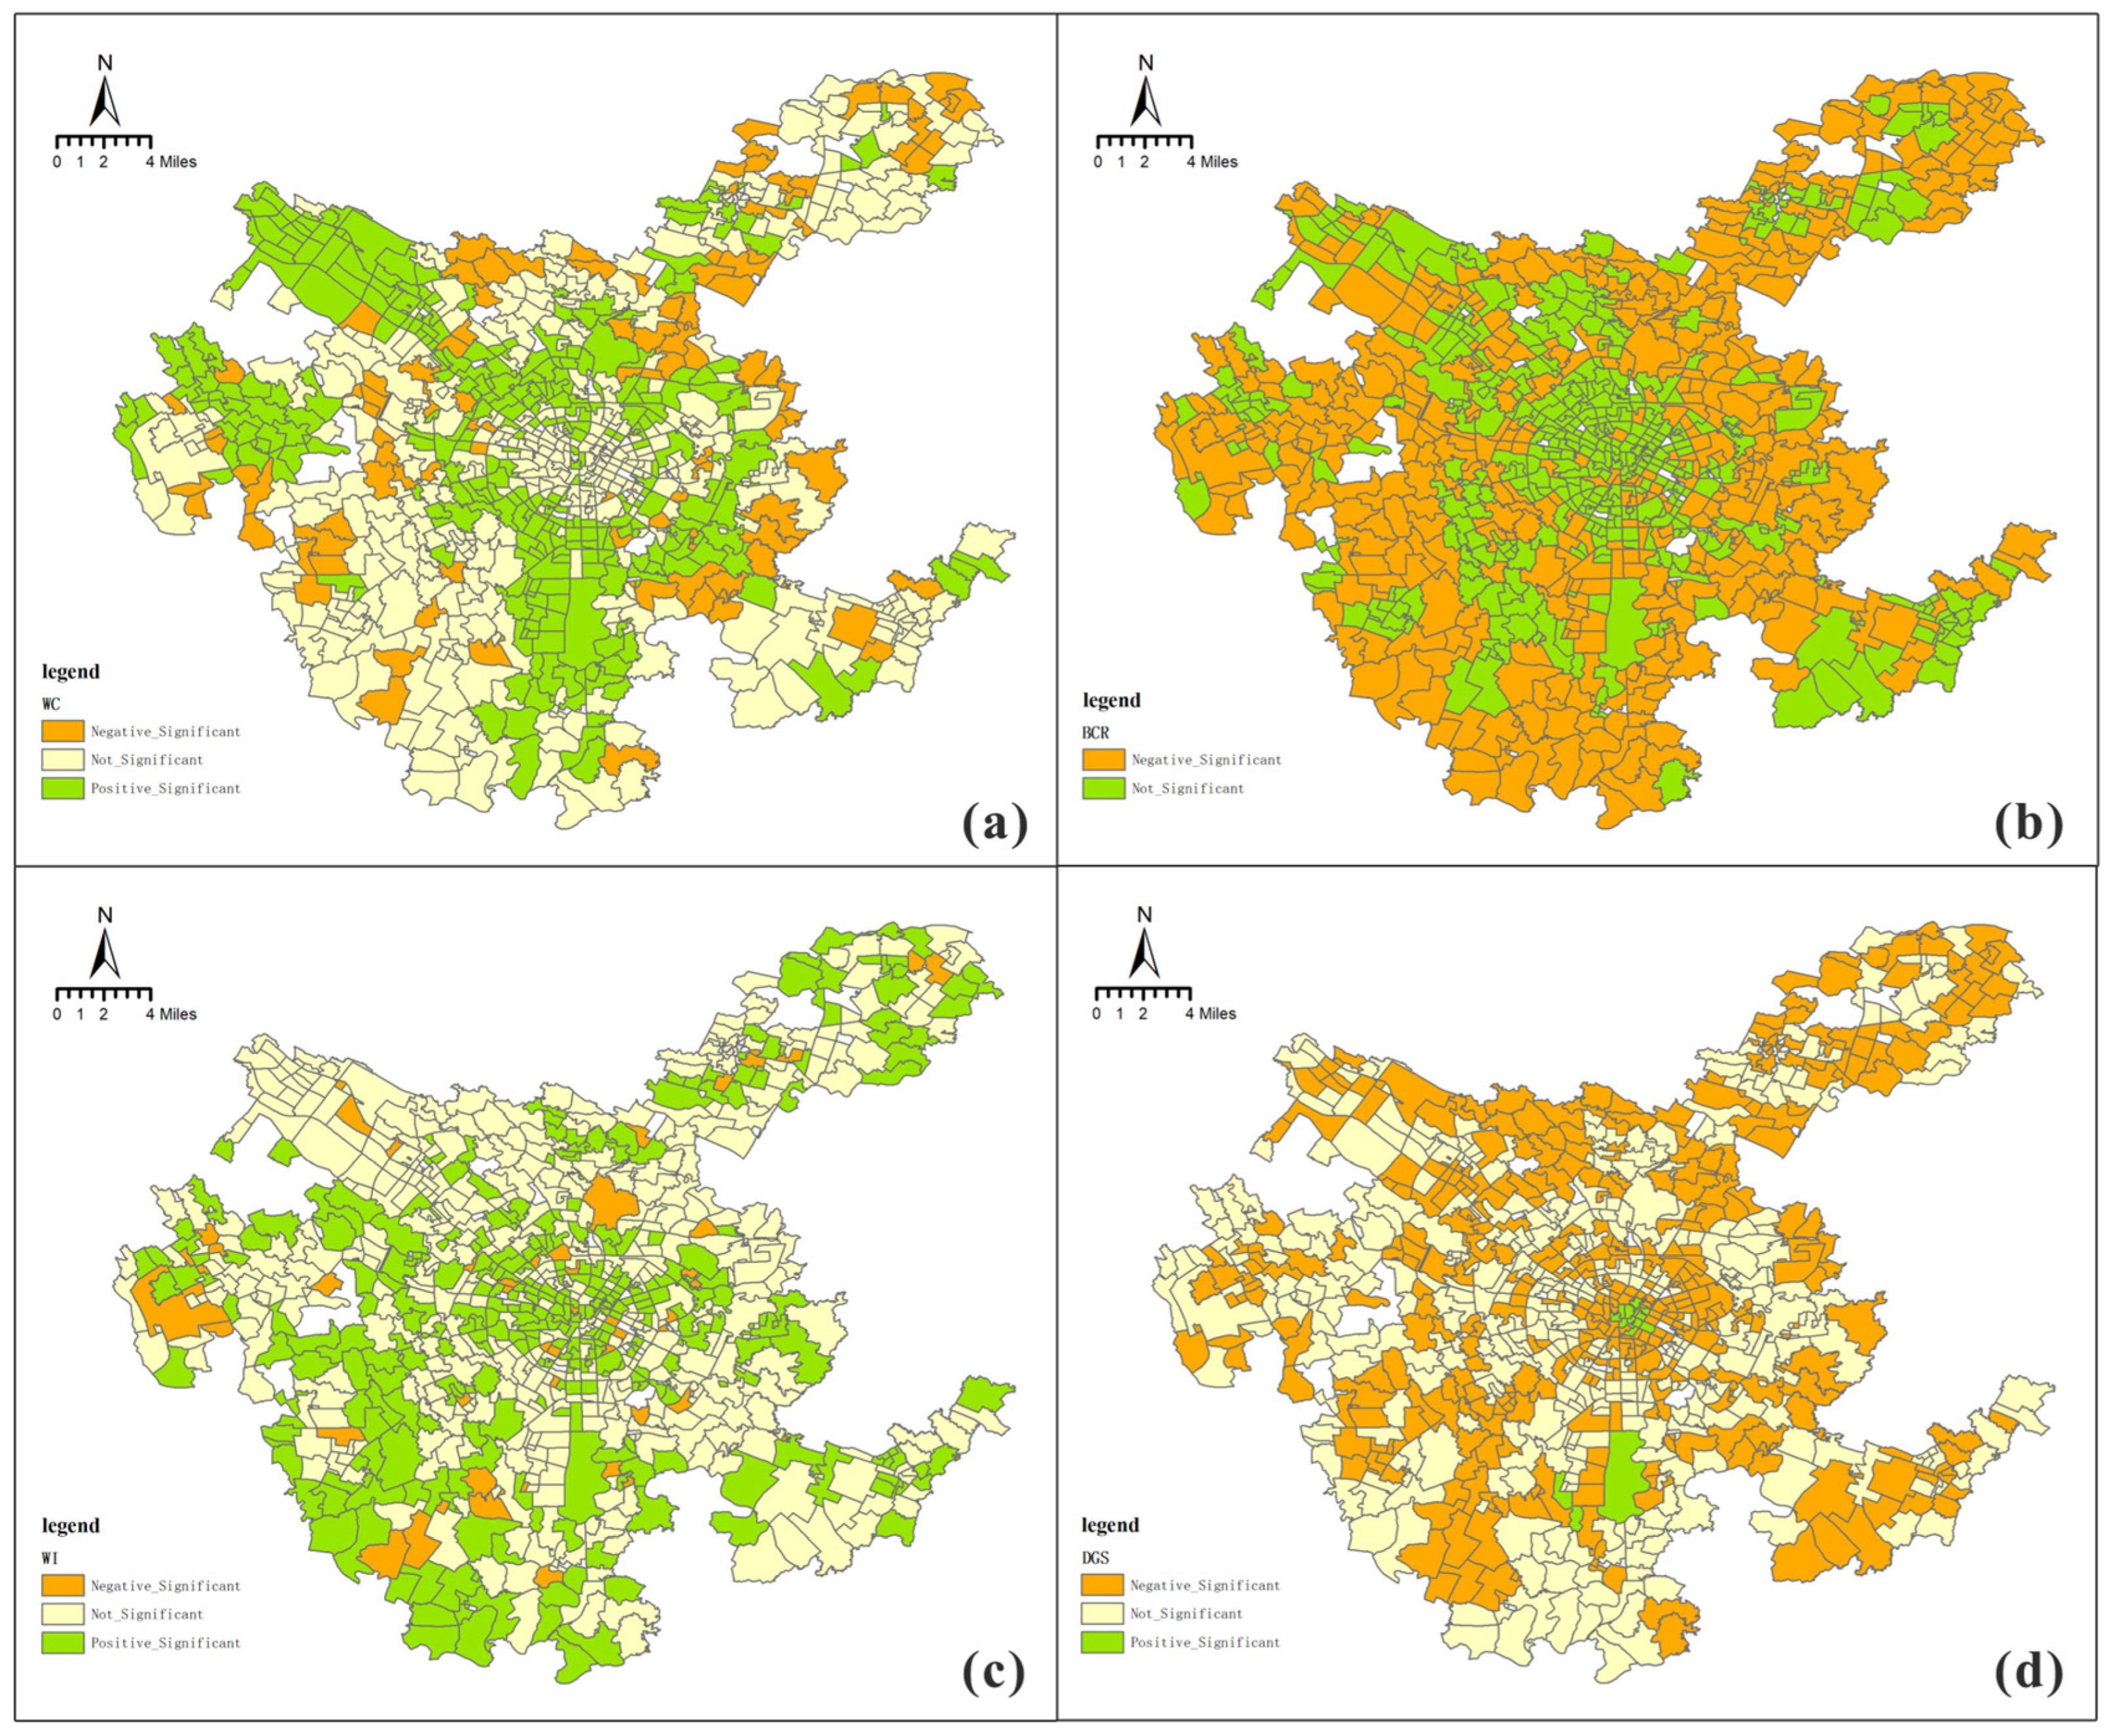
4.3. Heterogeneity in the Importance of Key Features
5. Discussion
5.1. The Dual Pattern of Homogeneous Public Services and Heterogeneous Quality Experiences
5.2. Methodological Implications
5.3. Community Optimization Strategy
5.4. Research Limitations and Future Prospects
6. Conclusions
Author Contributions
Funding
Institutional Review Board Statement
Informed Consent Statement
Data Availability Statement
Acknowledgments
Conflicts of Interest
References
- The 14th Five-Year Plan for National Economic and Social Development of the People’s Republic of China. Available online: http://www.gov.cn/xinwen/2021-03/13/content_5592681.htm (accessed on 25 April 2024).
- The Plan for the Construction of Urban-Rural Community Service Systems. Available online: https://www.gov.cn/zhengce/content/2022-01/21/content_5669663.htm (accessed on 25 April 2024).
- Chen, J.; Gan, W.; Liu, N.; Li, P.; Wang, H.; Zhao, X.; Yang, D. Community Quality Evaluation for Socially Sustainable Regeneration: A Study Using Multi-Sourced Geospatial Data and AI-Based Image Semantic Segmentation. ISPRS Int. J. Geo-Inf. 2024, 13, 167. [Google Scholar] [CrossRef]
- Lian, X.; Li, D.; Di, W.; Oubibi, M.; Zhang, X.; Zhang, S.; Xu, C.; Lu, H. Research on Influential Factors of Satisfaction for Residents in Unit Communities—Taking Ningbo City as an Example. Sustainability 2022, 14, 6687. [Google Scholar] [CrossRef]
- Chen, T.; Luh, D.; Hu, L.; Shan, Q. Exploring Factors Affecting Residential Satisfaction in Old Neighborhoods and Sustainable Design Strategies Based on Post-Occupancy Evaluation. Sustainability 2023, 15, 15213. [Google Scholar] [CrossRef]
- Zheng, W.; Shen, G.Q.; Wang, H.; Hong, J.; Li, Z. Decision support for sustainable urban renewal: A multi-scale model. Land Use Policy 2017, 69, 361–371. [Google Scholar] [CrossRef]
- Chen, M.; Chen, C.; Jin, C.; Li, B.; Zhang, Y.; Zhu, P. Evaluation and obstacle analysis of sustainable development in small towns based on multi-source big data: A case study of 782 top small towns in China. J. Environ. Manag. 2024, 366, 121847. [Google Scholar] [CrossRef]
- Cui, Y.; Zha, G.; Wang, Q.; Dang, Y.; Shi, K.; Duan, X.; Xu, D.; Huang, B. Evaluating the community commercial vitality using multi-source data: A case study of Hangzhou, China. GIScience Remote Sens. 2025, 62, 2451335. [Google Scholar] [CrossRef]
- He, X.; Zhou, Y.; Yuan, X.; Zhu, M. The coordination relationship between urban development and urban life satisfaction in Chinese cities—An empirical analysis based on multi-source data. Cities 2024, 150, 105016. [Google Scholar] [CrossRef]
- Zhang, Y.; Li, Q.; Wang, H.; Du, X.; Huang, H. Community scale livability evaluation integrating remote sensing, surface observation and geospatial big data. Int. J. Appl. Earth Obs. Geoinf. 2019, 80, 173–186. [Google Scholar] [CrossRef]
- Yin, J.; Wang, J.; Wang, C.; Wang, L.; Chang, Z. CRITIC-TOPSIS Based Evaluation of Smart Community Governance: A Case Study in China. Sustainability 2023, 15, 1923. [Google Scholar] [CrossRef]
- Bramley, G.; Dempsey, N.; Power, S.; Brown, C.; Watkins, D. Social sustainability and urban form: Evidence from five British cities. Environ. Plan. A 2009, 41, 2125–2142. [Google Scholar] [CrossRef]
- Wang, Z.; Jie, H.; Fu, H.; Wang, L.; Jiang, H.; Ding, L.; Chen, Y. A social-media-based improvement index for urban renewal. Ecol. Indic. 2022, 137, 108775. [Google Scholar] [CrossRef]
- Li, X.; Liu, H. The Influence of Subjective and Objective Characteristics of Urban Human Settlements on Residents’ Life Satisfaction in China. Land 2021, 10, 1400. [Google Scholar] [CrossRef]
- Rui, J. Green disparities, happiness elusive: Decoding the spatial mismatch between green equity and the happiness from vulnerable perspectives. Cities 2025, 163, 106063. [Google Scholar] [CrossRef]
- Chen, N.; Fang, D. Exploring Public Space Satisfaction in Old Residential Areas Based on Impact-Asymmetry Analysis. Sustainability 2024, 16, 2557. [Google Scholar] [CrossRef]
- Dissart, J.-C.; Kuentz-Simonet, V. Spatial Determinants of Life Satisfaction on the Aquitaine Coast: A Geographically-Weighted Regression Approach. J. Happiness Stud. 2025, 26, 21. [Google Scholar] [CrossRef]
- Hong, X.-C.; Zhang, D.-Y.; Hu, F.-B.; Guo, L.-H.; Liu, J.; Guo, H. Does urban green space form influence the spatial pattern of noise complaints? Sustain. Cities Soc. 2025, 130, 106506. [Google Scholar] [CrossRef]
- Xia, J.; Zhang, G.; Ma, S.; Pan, Y. Spatial Heterogeneity of Driving Factors in Multi-Vegetation Indices RSEI Based on the XGBoost-SHAP Model: A Case Study of the Jinsha River Basin, Yunnan. Land 2025, 14, 925. [Google Scholar] [CrossRef]
- Liu, J.; Cai, Y.; Shen, X. Integrating Machine Learning, SHAP Interpretability, and Deep Learning Approaches in the Study of Environmental and Economic Factors: A Case Study of Residential Segregation in Las Vegas. Land 2025, 14, 957. [Google Scholar] [CrossRef]
- Li, M.; Zhu, Z.; Deng, J.; Zhang, J.; Li, Y. Geospatial Explainable AI Uncovers Eco-Environmental Effects and Its Driving Mechanisms-Evidence from the Poyang Lake Region, China. Land 2025, 14, 1361. [Google Scholar] [CrossRef]
- Li, F.; Nan, T.; Zhang, H.; Luo, K.; Xiang, K.; Peng, Y. Evaluating Ecological Vulnerability and Its Driving Mechanisms in the Dongting Lake Region from a Multi-Method Integrated Perspective: Based on Geodetector and Explainable Machine Learning. Land 2025, 14, 1435. [Google Scholar] [CrossRef]
- Li, C.; Zhou, Y.; Wu, M.; Xu, J.; Fu, X. Exploring Nonlinear Threshold Effects and Interactions Between Built Environment and Urban Vitality at the Block Level Using Machine Learning. Land 2025, 14, 1323. [Google Scholar] [CrossRef]
- Le, T.T.; Sharma, P.; Osman, S.M.; Dzida, M.; Nguyen, P.Q.P.; Tran, M.H.; Cao, D.N.; Tran, V.D. Forecasting energy consumption and carbon dioxide emission of Vietnam by prognostic models based on explainable machine learning and time series. Clean Technol. Environ. Policy 2024, 26, 4405–4431. [Google Scholar] [CrossRef]
- Liu, L. An ensemble framework for explainable geospatial machine learning models. Int. J. Appl. Earth Obs. Geoinf. 2024, 132, 104036. [Google Scholar] [CrossRef]
- Li, Z. GeoShapley: A Game Theory Approach to Measuring Spatial Effects in Machine Learning Models. Ann. Am. Assoc. Geogr. 2024, 114, 1365–1385. [Google Scholar] [CrossRef]
- Zhu, L.; Guo, Y.; Zhang, C.; Meng, J.; Ju, L.; Zhang, Y.; Tang, W. Assessing Community-Level Livability Using Combined Remote Sensing and Internet-Based Big Geospatial Data. Remote Sens. 2020, 12, 4026. [Google Scholar] [CrossRef]
- Wang, Y.; Yan, Y.; Yu, S.; Bai, D. Integrated Environmental Perception and Civic Engagement: The Mediating Role of Residential Satisfaction in Urban Migrants’ Community Participation Intention. Sustainability 2025, 17, 8639. [Google Scholar] [CrossRef]
- Bove, A.; Ghiraldelli, M. Smart but Unlivable? Rethinking Smart City Rankings Through Livability and Urban Sustainability: A Comparative Perspective Between Athens and Zurich. Sustainability 2025, 17, 8901. [Google Scholar] [CrossRef]
- Smith, R.M.; Deb, D.; Blizard, Z.; Midgett, R. A Planner’s quest for identifying spatial (in)justice in local communities: A case study of urban census tracts in North Carolina, USA. Appl. Geogr. 2023, 158, 103030. [Google Scholar] [CrossRef]
- Chen, Y.; Ye, Y.; Liu, X.; Yin, C.; Jones, C.A. Examining the nonlinear and spatial heterogeneity of housing prices in urban Beijing: An application of GeoShapley. Habitat Int. 2025, 162, 103439. [Google Scholar] [CrossRef]
- Mak, H.W.; Coulter, R.; Fancourt, D. Associations between community cultural engagement and life satisfaction, mental distress and mental health functioning using data from the UK Household Longitudinal Study (UKHLS): Are associations moderated by area deprivation? BMJ Open 2021, 11, e045512. [Google Scholar] [CrossRef]
- Tang, F.; Zeng, P.; Wang, L.; Zhang, L.; Xu, W. Urban Perception Evaluation and Street Refinement Governance Supported by Street View Visual Elements Analysis. Remote Sens. 2024, 16, 3661. [Google Scholar] [CrossRef]
- Hao, H.; Yao, E.; Yang, Y.; Liu, S.; Pan, L.; Wang, Y. How to build vibrant communities by utilizing functional zones? A community-detection-based approach for revealing the association between land use and community vibrancy. Cities 2024, 155, 105431. [Google Scholar] [CrossRef]
- Yu, H. Generalized geographically and temporally weighted regression. Comput. Environ. Urban Syst. 2025, 117, 102244. [Google Scholar] [CrossRef]
- Wang, D.; Li, V.J.; Yu, H. Mass Appraisal Modeling of Real Estate in Urban Centers by Geographically and Temporally Weighted Regression: A Case Study of Beijing’s Core Area. Land 2020, 9, 143. [Google Scholar] [CrossRef]
- Tang, Q.; Cao, J.; Yin, C.; Cheng, J. Examining the nonlinear relationships between park attributes and satisfaction with pocket parks in Chengdu. Urban For. Urban Green. 2024, 101, 128548. [Google Scholar] [CrossRef]
- Li, C.; Managi, S. Impacts of community attachment and community livability on environmental activity according to XGBoost and SHAP. Cities 2025, 156, 105559. [Google Scholar] [CrossRef]
- Ma, S.; Wang, B.; Liu, W.; Zhou, H.; Wang, Y.; Li, S. Assessment of street space quality and subjective well-being mismatch and its impact, using multi-source big data. Cities 2024, 147, 104797. [Google Scholar] [CrossRef]
- Roychowdhury, S.; Mazumdar, S.; Thakker, D.; Checco, A.; Lanfranchi, V.; Goodchild, B. Integrating Virtual Walkthroughs for Subjective Urban Evaluations: A Case Study of Neighbourhoods in Sheffield, England. Land 2024, 13, 831. [Google Scholar] [CrossRef]
- Jin, A.; Ge, Y.; Zhang, S. Spatial Characteristics of Multidimensional Urban Vitality and Its Impact Mechanisms by the Built Environment. Land 2024, 13, 991. [Google Scholar] [CrossRef]
- Mitchell, R.J.; Richardson, E.A.; Shortt, N.K.; Pearce, J.R. Neighborhood Environments and Socioeconomic Inequalities in Mental Well-Being. Am. J. Prev. Med. 2015, 49, 80–84. [Google Scholar] [CrossRef]
- Lin, L.; Liu, Q.; Xiao, X.; Luo, Q. Perceived Constraints on Active Recreational Sport Participation among Residents in Urban China. Int. J. Environ. Res. Public Health 2022, 19, 14884. [Google Scholar] [CrossRef]
- Liu, Z.; Ye, J.; Ren, G.; Feng, S. The Effect of School Quality on House Prices: Evidence from Shanghai, China. Land 2022, 11, 1894. [Google Scholar] [CrossRef]
- Elvidge, C.D.; Sutton, P.C.; Ghosh, T.; Tuttle, B.T.; Baugh, K.E.; Bhaduri, B.; Bright, E. A global poverty map derived from satellite data. Comput. Geosci. 2009, 35, 1652–1660. [Google Scholar] [CrossRef]
- Gao, M.; Fang, C. Ripples of blue: Unveiling the influence of urban blue spaces on public happiness through social networking sites. Appl. Geogr. 2025, 179, 103632. [Google Scholar] [CrossRef]
- Huang, Y.; Li, J.; Wu, G.; Fei, T. Quantifying the bias in place emotion extracted from photos on social networking sites: A case study on a university campus. Cities 2020, 102, 102719. [Google Scholar] [CrossRef]
- Zhao, X.; Chen, J.; Li, J.; Wang, H.; Zhang, X.; Yu, F. Unraveling the renewal priority of urban heritage communities via macro-micro dimensional assessment—A case study of Nanjing City, China. Sustain. Cities Soc. 2025, 124, 106317. [Google Scholar] [CrossRef]
- Sheng, J.; He, Y.; Lu, T.; Wang, F.; Huang, Y.; Leng, B.; Zhang, X.; Chen, Y. Unveiling urban vitality and its interactions in mountainous cities: A human behaviour perspective on community-level dynamics. Cities 2025, 159, 105780. [Google Scholar] [CrossRef]
- Peng, Y.; Liu, Q. Plot-scale population estimation modeling based on residential plot form clustering and locational attractiveness analysis. Comput. Environ. Urban Syst. 2025, 118, 102257. [Google Scholar] [CrossRef]
- Pan, Z.; Liu, Y.; Liu, Y.; Huo, Z.; Han, W. Age-friendly neighbourhood environment, functional abilities and life satisfaction: A longitudinal analysis of older adults in urban China. Soc. Sci. Med. 2024, 340, 116403. [Google Scholar] [CrossRef] [PubMed]
- Parola, A.; Marcionetti, J. Career Decision-Making Difficulties and Life Satisfaction: The Role of Career-Related Parental Behaviors and Career Adaptability. J. Career Dev. 2022, 49, 831–845. [Google Scholar] [CrossRef]
- Cervero, R.; Kockelman, K. Travel demand and the 3Ds: Density, diversity, and design. Transp. Res. Part D Transp. Environ. 1997, 2, 199–219. [Google Scholar] [CrossRef]
- Wu, C.; Ye, Y.; Gao, F.Z.; Ye, X.Y. Using street view images to examine the association between human perceptions of locale and urban vitality in Shenzhen, China. Sustain. Cities Soc. 2023, 88, 104291. [Google Scholar] [CrossRef]
- Chen, T.; Guestrin, C. XGBoost: A Scalable Tree Boosting System. In Proceedings of the 22nd ACM SIGKDD International Conference on Knowledge Discovery and Data Mining, San Francisco, CA, USA, 13–17 August 2016; pp. 785–794. [Google Scholar]
- Chen, Y.; Jiao, S.; Gu, X.; Li, S. Decoding the spatiotemporal effects of industrial clusters on carbon emissions in a Chinese river basin. J. Clean. Prod. 2025, 516, 145851. [Google Scholar] [CrossRef]
- Liu, Y.; Li, T.; Zhao, W.; Wang, S.; Fu, B. Landscape functional zoning at a county level based on ecosystem services bundle: Methods comparison and management indication. J. Environ. Manag. 2019, 249, 109315. [Google Scholar] [CrossRef]
- Zhang, X.; Du, L.; Song, X. Identification of Urban Renewal Potential Areas and Analysis of Influential Factors from the Perspective of Vitality Enhancement: A Case Study of Harbin City’s Core Area. Land 2024, 13, 1934. [Google Scholar] [CrossRef]
- Huang, W.; Hu, L.; Xing, Y. Sustainable Renewal Strategies for Older Communities from the Perspective of Living Experience. Sustainability 2022, 14, 2813. [Google Scholar] [CrossRef]
| Type of Data | Data Structure | Source | Description |
|---|---|---|---|
| OSM Road Network | Vector line data | https://www.openstreetmap.org/, accessed on 15 October 2024. | Including spatial information (e.g., latitude and longitude) and road-level information (e.g., motorway, primary, secondary, trunk). |
| POIs | Vector point data | https://lbsyun.baidu.com/index.php?title=webapi/guide/webservice-placeapi, accessed on 23 June 2025. | 2025 data showing geographic locations and categories of public service facilities. |
| Housing Price | Vector point data | https://chengdu.anjuke.com/, accessed on 1 February 2025. | 2025 geolocated point data of housing prices. |
| NPP-VIIRS-Like Nighttime Light | Raster data | https://dataverse.harvard.edu/dataset.xhtml?persistentId=doi:10.7910/DVN/YGIVCD, accessed on 18 August 2025. | 2024 Annual Average Nighttime Light Image, Spatial Resolution: 500 m. |
| Weibo check-in | Vector point data | https://weibo.com, accessed on 10 June 2025. | 486,865 Weibo check-in entries from 2023 to present. |
| Street view images | Images | https://lbs.baidu.com/, accessed on 18 June 2025. | Based on OSM road network data, 168,392 street panoramas were sampled at 50 m intervals. |
| Population | Raster data | https://hub.worldpop.org/geodata/listing?id=95, accessed on 18 August 2025. | The 2024 total population estimate with no constraints, featuring a spatial resolution of 100 m. |
| Building Vector | Vector polygon data | https://doi.org/10.1038/s41597-025-04730-5, accessed on 19 August 2025. | Building data for 2024 including attributes such as building height and number of floors. |
| Park and Greenland | Vector polygon data | https://doi.org/10.1038/s41597-025-04730-5, accessed on 18 December 2024. | 2024 Chengdu Park and Green Space Area Data. |
| Major | Dimensions | Variable | Description | Weight |
|---|---|---|---|---|
| CS | Subjective | WSI | Average of Weibo check-in data sentiment rating within a 1000 m range, WSI = 0.6 × SPI + 0.4 × SII | 0.0223 |
| Objective | PR | Number of recreations within a 1000 m range | 0.3398 | |
| HV | Average housing price | 0.1484 | ||
| NTL | Total lighting within the community | 0.4894 |
| Dimensions | Variable | Abbr. | Description | Type of Data |
|---|---|---|---|---|
| Transport and Infrastructure | Road Density | RD | The ratio of road length to community areas within the community. | OSM Road Network |
| Building Morphology and Land Use | Building Coverage Ratio | BCR | The ratio of the total floor area of all buildings within the community. | Building Vector |
| Social Vitality | Weibo Check-in | WC | Number of Weibo check-in density within a 1000 m range. | Weibo check-in |
| Locational Attributes | Distance to the CBD | DCBD | Euclidean Distance in meters from the Community’s centroid to the Central Business District. | POIs |
| Public Service Accessibility | Facility Density | FD | The ratio of the number of facilities within a community to the community’s area. | POIs |
| Distance to Amenities | DA | Euclidean Distance in meters from the community’s centroid to the nearest amenity. | POIs | |
| Distance to Employment | DE | Euclidean Distance in meters from the community’s centroid to the nearest employment center. | POIs | |
| Distance to Science and Culture | DSC | Euclidean Distance in meters from the community’s centroid to the nearest science and culture facility. | POIs | |
| Distance to School | DS | Euclidean Distance in meters from community’s centroid to the nearest school. | POIs | |
| Distance to Medical | DM | Euclidean Distance in meters from the community’s centroid to the nearest medical facility. | POIs | |
| Distance to Green Space | DGS | Euclidean Distance in meters from the community’s centroid to the nearest green space. | POIs | |
| Proximity to Bus | PB | Number of bus stops within a 1000 m range. | POIs | |
| Street Space Quality | Green View Index | GVI | The ratio of the sum of the areas occupied by vegetation and terrain in the image to the total image area. | Street view images |
| Street Equipment Efficiency Index | SEI | The ratio of the sum of the areas occupied by various street facilities (e.g., barrier, fence, pole, utility pole, traffic sign frame, traffic sign(back), traffic sign(front), traffic light, streetlight) in the image to the total image area. | Street view images | |
| Walkability Index | WI | The ratio of the area occupied by the sidewalk in the image to the total image area. | Street view images |
| Model | R2 | MSE | RMSE | MAE | MAPE (%) |
|---|---|---|---|---|---|
| XGBoost | 0.8200 | 0.1782 | 0.4222 | 0.3235 | 243.9861 |
| CatBoost | 0.8194 | 0.1794 | 0.4236 | 0.3261 | 200.2926 |
| LightGBM | 0.8118 | 0.1865 | 0.4318 | 0.3312 | 231.4794 |
| Random Forest | 0.7877 | 0.2128 | 0.4614 | 0.3449 | 189.7591 |
| Extra Trees | 0.7649 | 0.2358 | 0.4856 | 0.3618 | 190.9237 |
| AdaBoost | 0.7552 | 0.2447 | 0.4947 | 0.3843 | 179.6520 |
| Linear Regression | 0.7201 | 0.2771 | 0.5264 | 0.4112 | 230.5850 |
| Decision Tree | 0.6391 | 0.3597 | 0.5997 | 0.4542 | 258.6609 |
| KNN | 0.5265 | 0.4720 | 0.6870 | 0.5183 | 461.6426 |
Disclaimer/Publisher’s Note: The statements, opinions and data contained in all publications are solely those of the individual author(s) and contributor(s) and not of MDPI and/or the editor(s). MDPI and/or the editor(s) disclaim responsibility for any injury to people or property resulting from any ideas, methods, instructions or products referred to in the content. |
© 2025 by the authors. Licensee MDPI, Basel, Switzerland. This article is an open access article distributed under the terms and conditions of the Creative Commons Attribution (CC BY) license (https://creativecommons.org/licenses/by/4.0/).
Share and Cite
Zhang, W.; Zhang, L.; Li, J.; Guo, S.; Hu, Q.; Zhou, R. GeoShapley-Based Explainable GeoAI for Sustainable Community Satisfaction Assessment: Evidence from Chengdu, China. Sustainability 2025, 17, 10261. https://doi.org/10.3390/su172210261
Zhang W, Zhang L, Li J, Guo S, Hu Q, Zhou R. GeoShapley-Based Explainable GeoAI for Sustainable Community Satisfaction Assessment: Evidence from Chengdu, China. Sustainability. 2025; 17(22):10261. https://doi.org/10.3390/su172210261
Chicago/Turabian StyleZhang, Wennan, Li Zhang, Jinyi Li, Sui Guo, Qixuan Hu, and Rui Zhou. 2025. "GeoShapley-Based Explainable GeoAI for Sustainable Community Satisfaction Assessment: Evidence from Chengdu, China" Sustainability 17, no. 22: 10261. https://doi.org/10.3390/su172210261
APA StyleZhang, W., Zhang, L., Li, J., Guo, S., Hu, Q., & Zhou, R. (2025). GeoShapley-Based Explainable GeoAI for Sustainable Community Satisfaction Assessment: Evidence from Chengdu, China. Sustainability, 17(22), 10261. https://doi.org/10.3390/su172210261


