Abstract
Urban densification intensifies the heat island effect, threatening ecological security. Green spaces, as crucial spatial elements in regulating the urban thermal environment, remain poorly understood in terms of their morphological characteristics and regulatory mechanisms, with a lack of systematic quantification and recognition of diurnal variations. This study, focusing on Shanghai’s main urban area, constructs physiological, physical, and morphological variables of green spaces based on high-resolution remote sensing data and the MSPA landscape morphology analysis framework. By integrating machine learning models with the SHAP interpretation algorithm, it analyses the influence mechanism of green spaces on Land Surface Temperature (LST) and its non-linear characteristics from the perspective of diurnal variation. The results indicate the following: (1) Green spaces exhibit pronounced diurnal variation in LST influence. Daytime cooling is primarily driven by vegetation cover, vegetation activity, and surface albedo through evapotranspiration and shading; night-time cooling depends on soil moisture and green space spatial structure and is achieved via thermal storage-radiative heat dissipation and cold air transport. (2) Green space indicators exhibit pronounced nonlinearity and threshold effects on LST. Optimal cooling efficiency occurs under moderate vegetation activity and moderate humidity conditions, whereas extreme high humidity or high vegetation activity may induce heat retention effects. (3) Day–night thermal regulation mechanisms differ markedly. Daytime cooling primarily depends on vegetation transpiration and shading to suppress surface warming; night-time cooling is dominated by soil thermal storage release, longwave radiation dissipation, and ventilation transport, enabling cold air to diffuse across the city and establishing a stable, three-dimensional nocturnal cooling effect. This study systematically reveals the distinct diurnal cooling mechanisms of high-density urban green spaces, providing theoretical support for refined urban thermal environment management.
1. Introduction
The rapid expansion of urbanisation has driven the evolution of urban spatial structures toward high-density intensification []. The concentration of urban spaces has led to a significant replacement of natural ecological spaces with buildings and impervious surfaces [], drastically altering the urban heat balance and resulting in the accumulation and retention of surface energy [,]. The urban heat island (UHI) effect has become increasingly pronounced, manifested by higher surface or near-surface air temperatures in urban areas compared to surrounding suburban areas []. This high-temperature environment exacerbates heat stress among urban residents, particularly during summer months and at night. Prolonged exposure may adversely affect health, productivity, and urban livability [,,], particularly for vulnerable groups such as the elderly and children, for whom health risks are especially pronounced [,]. Existing research indicates that the UHI not only exacerbates summer heat exposure and heat risks for urban residents [,,] but also significantly increases urban energy consumption and greenhouse gas emissions []. Therefore, determining how to mitigate UHI intensity, reduce surface temperatures, and improve urban thermal environment quality in high-density urban contexts has become a key issue in global urban climate adaptation governance.
Urban green spaces (UGSs) are an important component of the urban system and a vital ecological infrastructure in urban spaces [,]. UGSs mitigate the urban heat island effect through mechanisms such as transpiration, shading effects, and surface albedo regulation [,,,]. Extensive empirical research has shown that green spaces not only effectively reduce surface temperatures in their own areas [,] but also spread the cooling effect to surrounding areas through the cold island effect, forming a certain degree of temperature gradient zones [,]. While urban green spaces can regulate temperatures through physical or physiological effects, their spatial morphology also significantly influences the efficiency of surface temperature regulation [,]. In recent years, morphological spatial description methods, particularly the MSPA (Morphological Spatial Pattern Analysis) model based on image structural principles, have been widely applied to identify different urban green spaces, urban ecological networks, and other urban spatial structures [,]. From a morphological perspective, urban green spaces can be described by two-dimensional attributes such as area, shape complexity, edge density, connectivity, and distribution uniformity [,], as well as the spatial layout and structural role of green spaces []. A deeper exploration of how the morphological structures of different types of green spaces influence surface temperatures from a morphological perspective can help improve climate adaptation planning strategies for green space systems.
Although numerous studies have examined the regulatory effects of urban green spaces on surface temperature, most have focused on annual averages [,,] or monthly or seasonal surface temperature regulation [,]. Systematic research on the differences in the cooling mechanisms of green spaces within the diurnal cycle remains limited. In fact, the mechanisms governing urban surface temperature vary significantly between day and night []. During the day, temperatures are primarily driven by solar shortwave radiation [], while at night, they are significantly influenced by the release of surface longwave radiation and the thermal capacity and insulation properties of surrounding buildings []. Because of this mechanism difference, green spaces primarily depend on transpiration cooling and shading for temperature reduction during the day [,,], while at night, they more heavily depend on surface radiation cooling and heat release processes []. The nighttime urban heat island effect is often more subtle and delayed, especially in high-density built-up areas, where surface temperatures may remain at a relatively high level due to thermal lag effects and slow heat dissipation [], severely impacting residents’ sleep quality and nighttime energy consumption []. Additionally, the activity spaces of urban populations exhibit significant differentiation across different time periods. During the day, activities are concentrated in office and commuting spaces, while at night, residential areas dominate. Green spaces not only fulfil ecological functions in regulating the thermal environment across different time scales but also are closely linked to the well-being and suitability of human activities during different time periods. However, there is currently a lack of systematic exploration into the differentiated mechanisms of thermal regulation by green spaces of different structural types, particularly the structural role and spatial functional division of their nighttime cooling capacity. Therefore, it is essential to conduct an in-depth analysis of the differences and interactive mechanisms in the cooling mechanisms of green spaces across the entire day–night cycle, identify the adaptive response characteristics of key morphological combinations to the heterogeneous thermal environment between day and night, and provide scientific support for urban green space planning tailored to the diverse needs of populations across different time periods.
Clarifying the complex relationship between green space and surface temperature is a key focus of this study. Traditional research has primarily employed methods such as linear regression, spatial regression, or correlation analysis, which can reveal overall trends but remain limited in addressing high-dimensional variables, non-linear responses, and the interactive mechanisms between variables. In recent years, machine learning techniques have demonstrated strong modelling capabilities in urban thermal environment research [,], particularly ensemble learning models such as XGBoost and LightGBM, which have advantages in handling non-linear, multi-variable, and scale-heterogeneous data [,,], enabling more precise identification of the intricate coupling mechanisms between green space patterns and Land Surface Temperature (LST) variations. Among these, certain studies employed algorithms such as Random Forest and XGBoost to elucidate the processes by which green space vegetation coverage, topographical factors, urban density, and climatic variables drive the urban heat island effect. These approaches demonstrated superior interpretability and generalisation capabilities compared to traditional models. For instance, Zhong et al. utilised Random Forest and MSPA models to reveal the reciprocal relationship between urban green spaces and the heat island effect []. Meanwhile, the introduction of model interpretability methods such as SHapley Additive exPlanations (SHAP) has enabled the ‘black box’ results of complex models to be explained in concrete terms [,], effectively quantifying the marginal effects, directionality, and interaction mechanisms of various green space form factors on surface temperature [,]. This study selected Shanghai as a typical case study. Shanghai is one of China’s megacities [] and a typical example of a high-density city. The urban heat island effect resulting from Shanghai’s high urbanisation has significant research implications [], as it not only exhibits a typical urban expansion gradient from the central urban area to the suburbs [] but has also undergone a significant urban heat island enhancement process [], making it an ideal region for studying the coupling mechanisms between urban green space patterns and diurnal thermal environments.
In summary, although numerous studies have explored the mitigating effect of green spaces on urban surface temperatures, most have focused on the average effect of green spaces on LST, lacking an analysis of the dynamic impact of morphological indicators under differing diurnal thermal mechanisms, and neglecting the interactive regulation among morphological elements. Given this, this study takes Shanghai, a megacity in China, as a typical case, leveraging high-resolution land use data and morphological spatial analysis methods, and employs the Machine Learning model and SHAP interpretation algorithm. This study aims to construct a cognitive framework for green space cooling that reflects diurnal thermal process variations, elucidating the mechanisms by which different green space characteristics influence surface temperatures. It seeks to address the following research questions: (1) Does the mechanism by which urban green spaces influence surface temperature variations exhibit diurnal differences? (2) How do interactions among various factors within urban green spaces affect their capacity to regulate diurnal temperatures? The innovations of this study are primarily reflected in the following aspects: (1) This study reveals the dynamic differences in the impact of green space on surface temperature under the transition of diurnal and nocturnal heat transfer mechanisms, addressing the existing research gap in understanding diurnal and nocturnal dynamic mechanisms. (2) By employing the MSPA model, Machine Learning model, and SHAP method, this study analyses the non-linear influence mechanisms of green spaces on surface temperature. (3) This study provide detailed green space layout recommendations and scientific references that accommodate differences in daytime and nighttime human activity to alleviate the urban heat island effect. This research not only enriches the theoretical framework for regulating urban thermal environments but also provides quantitative analytical tools and practical guidance for future green infrastructure planning. It facilitates the development of urban cooling systems that enhance ventilation efficiency, improve heat dissipation transmission, and optimise water and vegetation performance. Consequently, this contributes to elevating urban livability and public safety standards against the backdrop of extreme heat events.
2. Materials and Methods
2.1. Study Area
This study selected the central urban area of Shanghai, China, as the study area, with the Shanghai Ring Expressway (G1503) as the boundary (Figure 1) []. Shanghai, as China’s largest economic hub city, has experienced rapid urbanisation, resulting in a densely built-up urban environment with complex green space distribution, exhibiting typical characteristics of a high-density urban area. The study area encompasses core urban districts such as Pudong New Area, Huangpu District, Xuhui District, Changning District, Jing’an District, Putuo District, Hongkou District, Yangpu District, and Minhang District []. This region exhibits spatial characteristics of densely built-up central urban areas, a well-developed elevated road network, and unevenly distributed green spaces. Additionally, the diurnal temperature difference in the urban heat island intensity of Shanghai’s central urban areas is notably pronounced, making it an ideal case study for investigating the relationship between high-density urban green space morphology and diurnal surface temperature. We then used ArcGIS 10.8.1 to grid the boundaries into 300 m × 300 m grid cells, mapped the grid cells, and by displaying partition statistics in tabular form via GIS, all research data is consolidated into cells using average values. We removed NoData values, resulting in a total of 31,886 grid cells.
Figure 1.
Study area map. The study area is situated in Shanghai, at the Yangtze River estuary in China. Bounded by the Shanghai Ring Expressway (G1501), it encompasses the central urban district and major sub-centres, constituting the most densely built-up core metropolitan zone exhibiting the most pronounced urban heat island effect.
2.2. Land Use Data and Land Surface Temperature
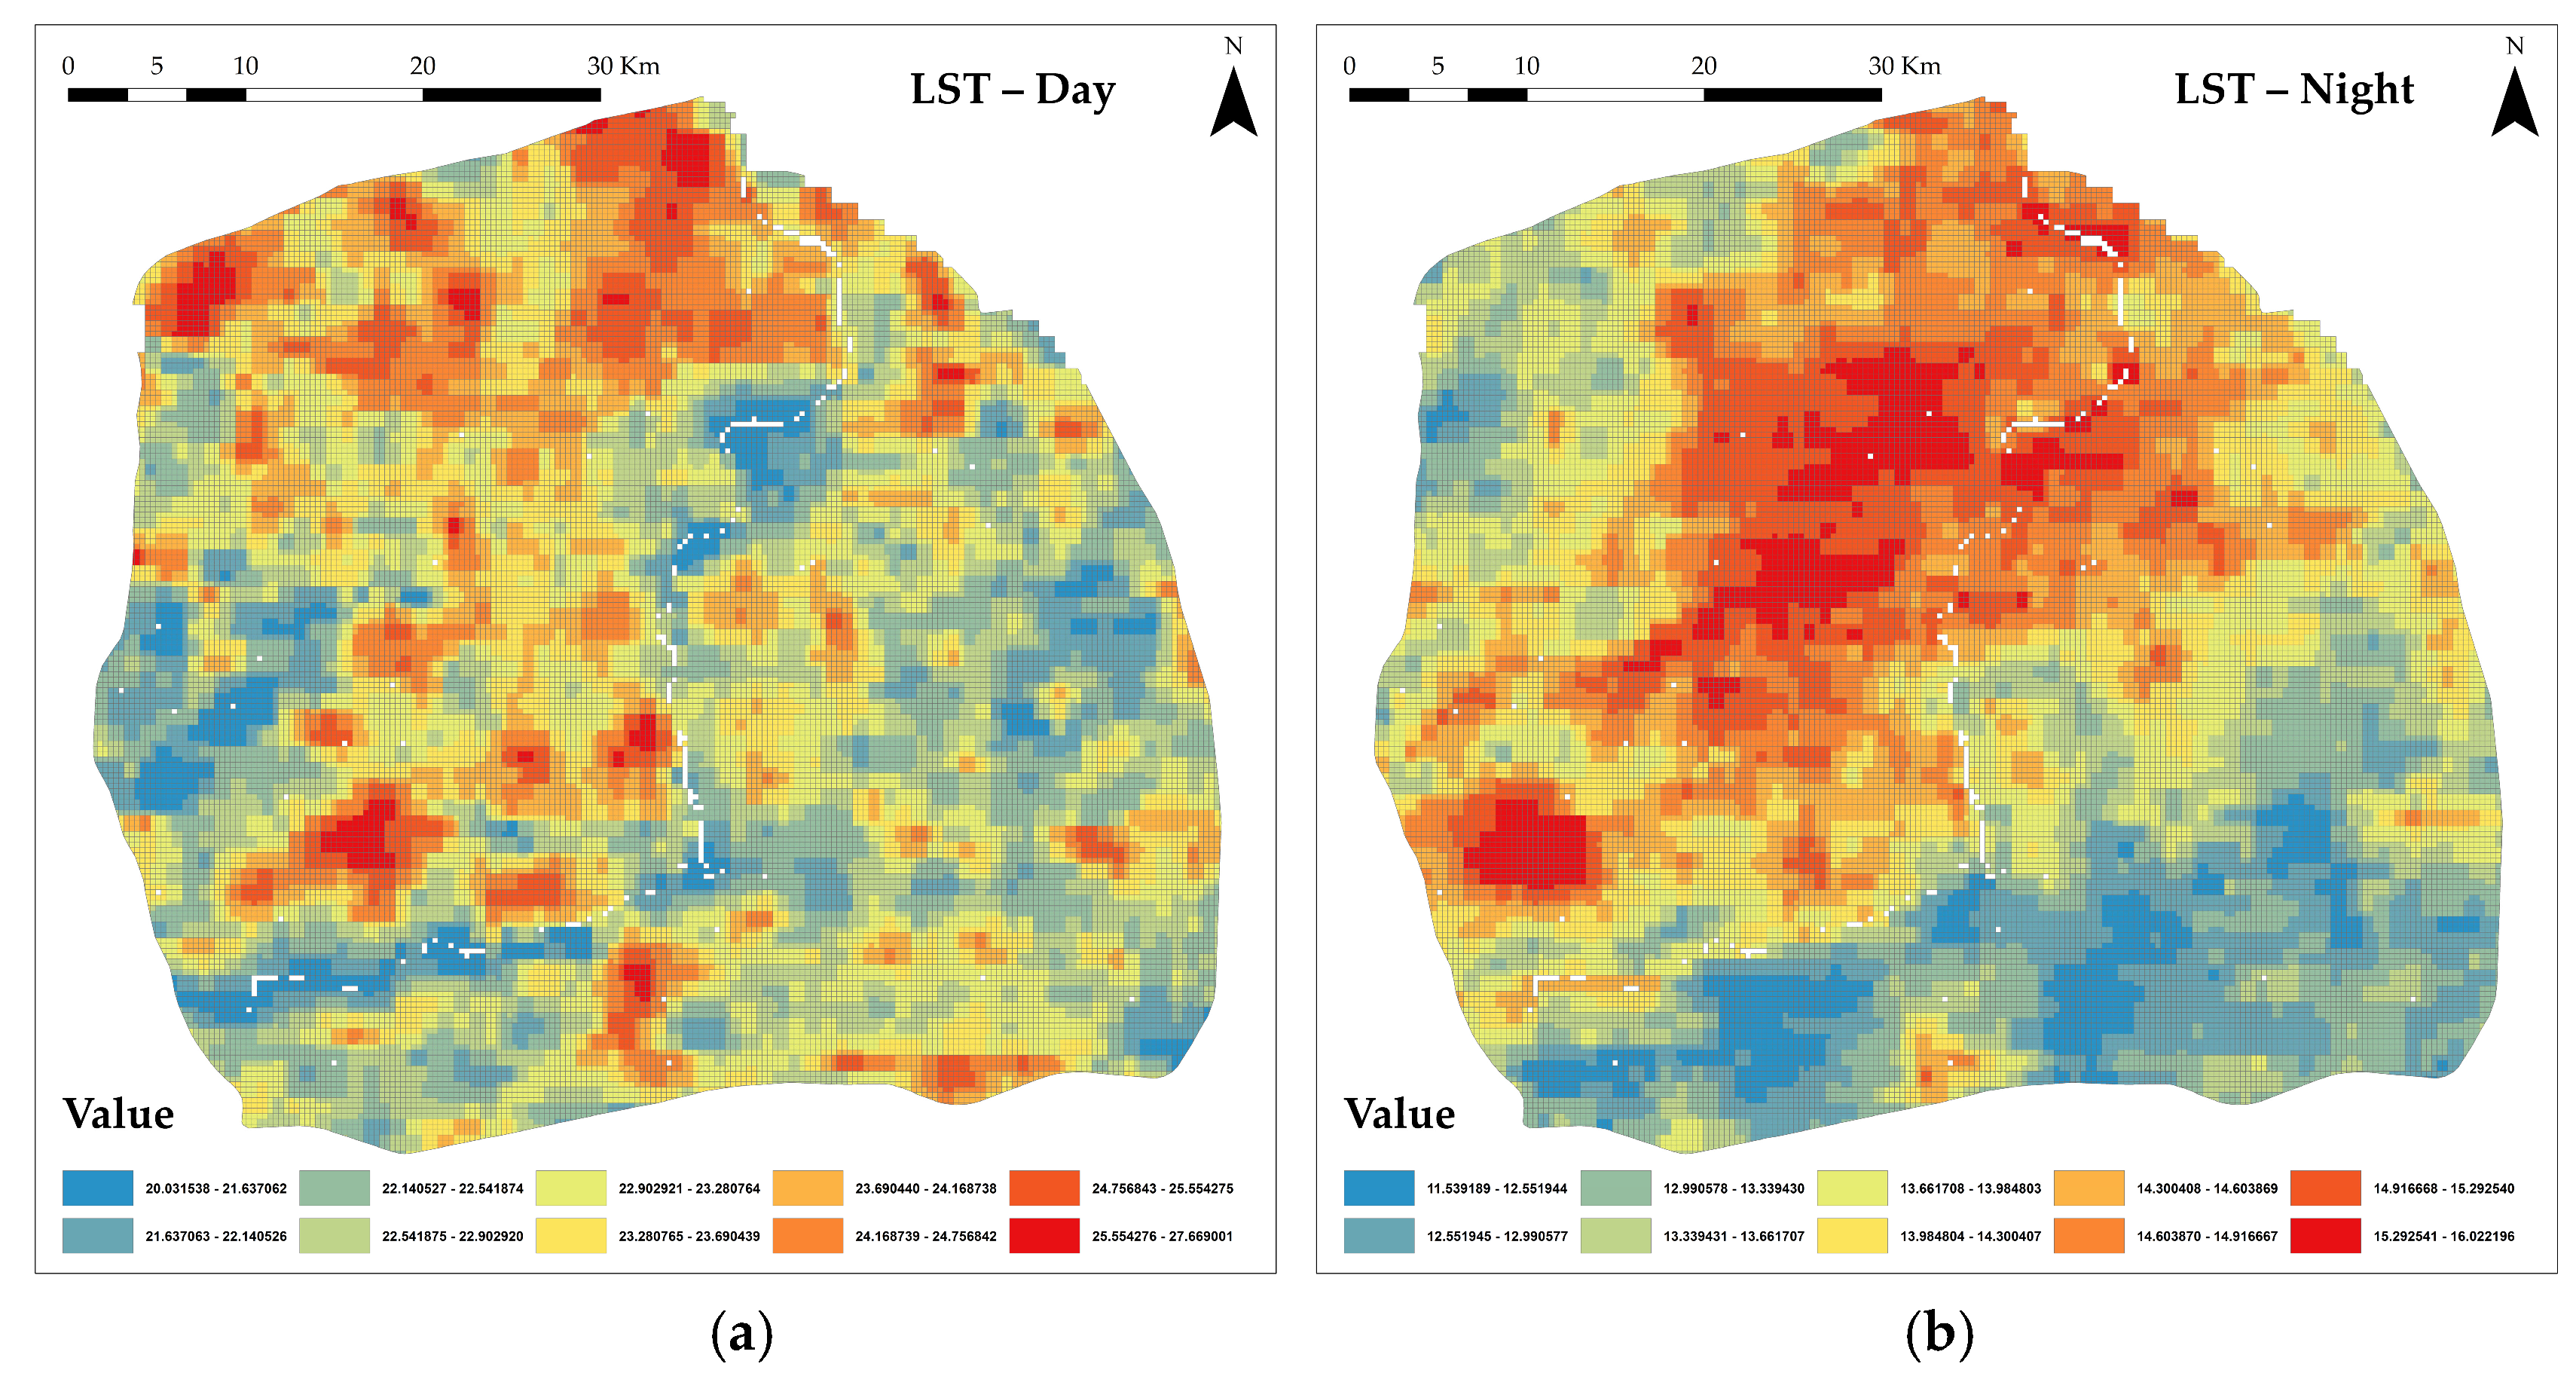
The land use data used in this study were obtained from the first national-scale land use map of China with 1-metre resolution published by Li et al. []. they developed a deep learning framework that used 1-metre Earth images from Google Earth obtained in December 2021, three open-access 10-metre GLC products, and OSM data as input to create the first national-scale land cover map of China with 1-metre resolution, SinoLC-1. This dataset is available on the ZENODO website (https://doi.org/10.5281/zenodo.7707461 (accessed on 10 November 2025)). Surface temperature data utilises the MOD11A2, Version 6.1 product from MODIS satellite data provided by the United States Geological Survey (USGS), covering the year 2023 (Figure 2). Enhanced vegetation index data similarly employs MODIS satellite data from 2023, specifically the MOD13Q1V6.1 product. Soil moisture data draws upon the 2023 TerraClimate product. Vegetation cover data utilises 250 m resolution data from 2023, obtained from the National Qinghai-Tibet Plateau Science Data Centre (https://data.tpdc.ac.cn/ (accessed on 10 November 2025)). Air humidity and surface albedo data are sourced from the ERA5 dataset, dated 2023. ERA5 represents the fifth and most recent global climate reanalysis dataset produced by the European Centre for Medium-Range Weather Forecasts.
Figure 2.
Visualisation of surface temperature data. (a) shows the daytime surface temperatures in the study area, while (b) depicts the night-time surface temperatures in the study area.
2.3. Construction and Validation of Green Space Morphological Indicators
This study constructs a multidimensional indicator system to analyse the impact of green spaces on diurnal LST, based on green space morphology, physiological conditions, and spatial environment. Firstly, green space morphology is determined using the Morphological Spatial Pattern Analysis (MSPA) method. MSPA is an image processing technique based on mathematical morphology [], capable of dividing green space patches into distinct structural units, including Core, Islet, Perforation, Edge, Loop, Bridge, and Branch []. These units reflect the hierarchical and connectivity characteristics of green spaces in space [,], aiding in the in-depth revelation of the relationship between green space morphological structure and ecological function []. We used 1-metre high-resolution land use data for the study calculations to better reveal its spatial heterogeneity. The data includes eight land types in the study area: Wetland, Water body, Sparse grassland, Road, Grassland, Forest, Farmland, and Construction land. We first used ArcGIS to reclassify and binarise the data, dividing it into foreground and background, with foreground values set to 2 and background values set to 1. In our study, Sparse grassland, Grassland, Forest, and Farmland were considered foreground, while the remaining types were background. Subsequently, we used Guidos 3.3 software to perform morphological operations such as erosion and dilation on green space patches [], automatically identifying and extracting the aforementioned seven structural units. The pixel values of each unit are quantified into corresponding spatial morphological indicators, which serve as independent variable inputs for subsequent machine learning models. Table 1 shows the definitions of each category in MSPA.
Table 1.
Definitions of categories in MSPA.
Secondly, in terms of vegetation physiological characteristics, remote sensing parameters reflecting vegetation activity and evapotranspiration potential were selected, including Fractional Vegetation Cover (FVC), Enhanced Vegetation Index (EVI), Soil Moisture, and Air Humidity. FVC measures the extent of vegetation cover within green spaces, EVI reflects photosynthetic efficiency and biomass status, soil moisture serves as a key limiting factor for vegetation water supply and evapotranspiration, while air humidity is closely linked to transpiration efficiency, influencing diurnal water vapour exchange processes. These indicators collectively describe the physiological activity and water-driven mechanisms of green spaces. Furthermore, concerning the surface thermal-hydrological environment, Surface Reflectance is introduced to characterise spectral reflectance properties. Surface reflectance indicates green areas’ capacity to absorb and reflect solar radiation, with its variations directly influencing surface heat accumulation and energy redistribution processes. This parameter is crucial for explaining diurnal thermal response variations. Finally, we constructed 300 m × 300 m grid units via GIS, employing resampling and tabular partition statistics to aggregate all data into grid cells using mean values. It should be noted that different spatial scales yield varying results. Relevant research papers typically select grid resolutions between 100 m and 500 m [,], with no established standard for a fixed grid scale. Consequently, based on existing data and pertinent studies, we selected a 300 m grid for subsequent analysis.
2.4. Model Construction
2.4.1. Machine Learning Models
To precisely elucidate the regulatory mechanisms of green spaces on diurnal and nocturnal surface temperatures, this study selected six mainstream machine learning models: LightGBM, CatBoost, Random Forest, XGBoost, Decision Tree, and Support Vector Regression (SVR). Predictive models were constructed on the Jupyter Notebook 4.2.5 development platform. Model accuracy comparison experiments were conducted separately for daytime and night-time surface temperature data. The coefficient of determination (R2) and root mean square error (RMSE) were employed as core evaluation metrics. Systematically quantifying the predictive performance and stability of different models to provide reliable modelling support for subsequent in-depth analysis of the driving mechanisms behind the green cooling effect.
2.4.2. SHAP Model
To further analyse the prediction results of the machine learning model and the specific impact of each green space form indicator on surface temperature, this study introduced the SHapley Additive exPlanations (SHAP) method. SHAP is based on the Shapley value principle in game theory, calculating the contribution value of each feature to the model output to achieve interpretable analysis of complex ‘black box’ models []. SHAP can quantify the positive and negative contributions of each input variable across different samples, revealing the marginal effects of variables and their non-linear influence directions. Additionally, it can capture the interactions between variables. Compared to traditional feature importance metrics, SHAP provides a more detailed and fair contribution allocation, aiding in understanding how variables collectively drive model prediction results. In this study, based on the best LightGBM model, SHAP values were used to rank and interpret the influence of seven morphological indicators, including green space core areas (Core), edge areas (Edge), and isolated patches (Islet). Through SHAP analysis, the heterogeneous responses of different green space morphological units to diurnal surface temperature and their complex nonlinear regulatory mechanisms were revealed, providing scientific basis for green space optimisation and thermal environment management.
2.5. Technical Framework
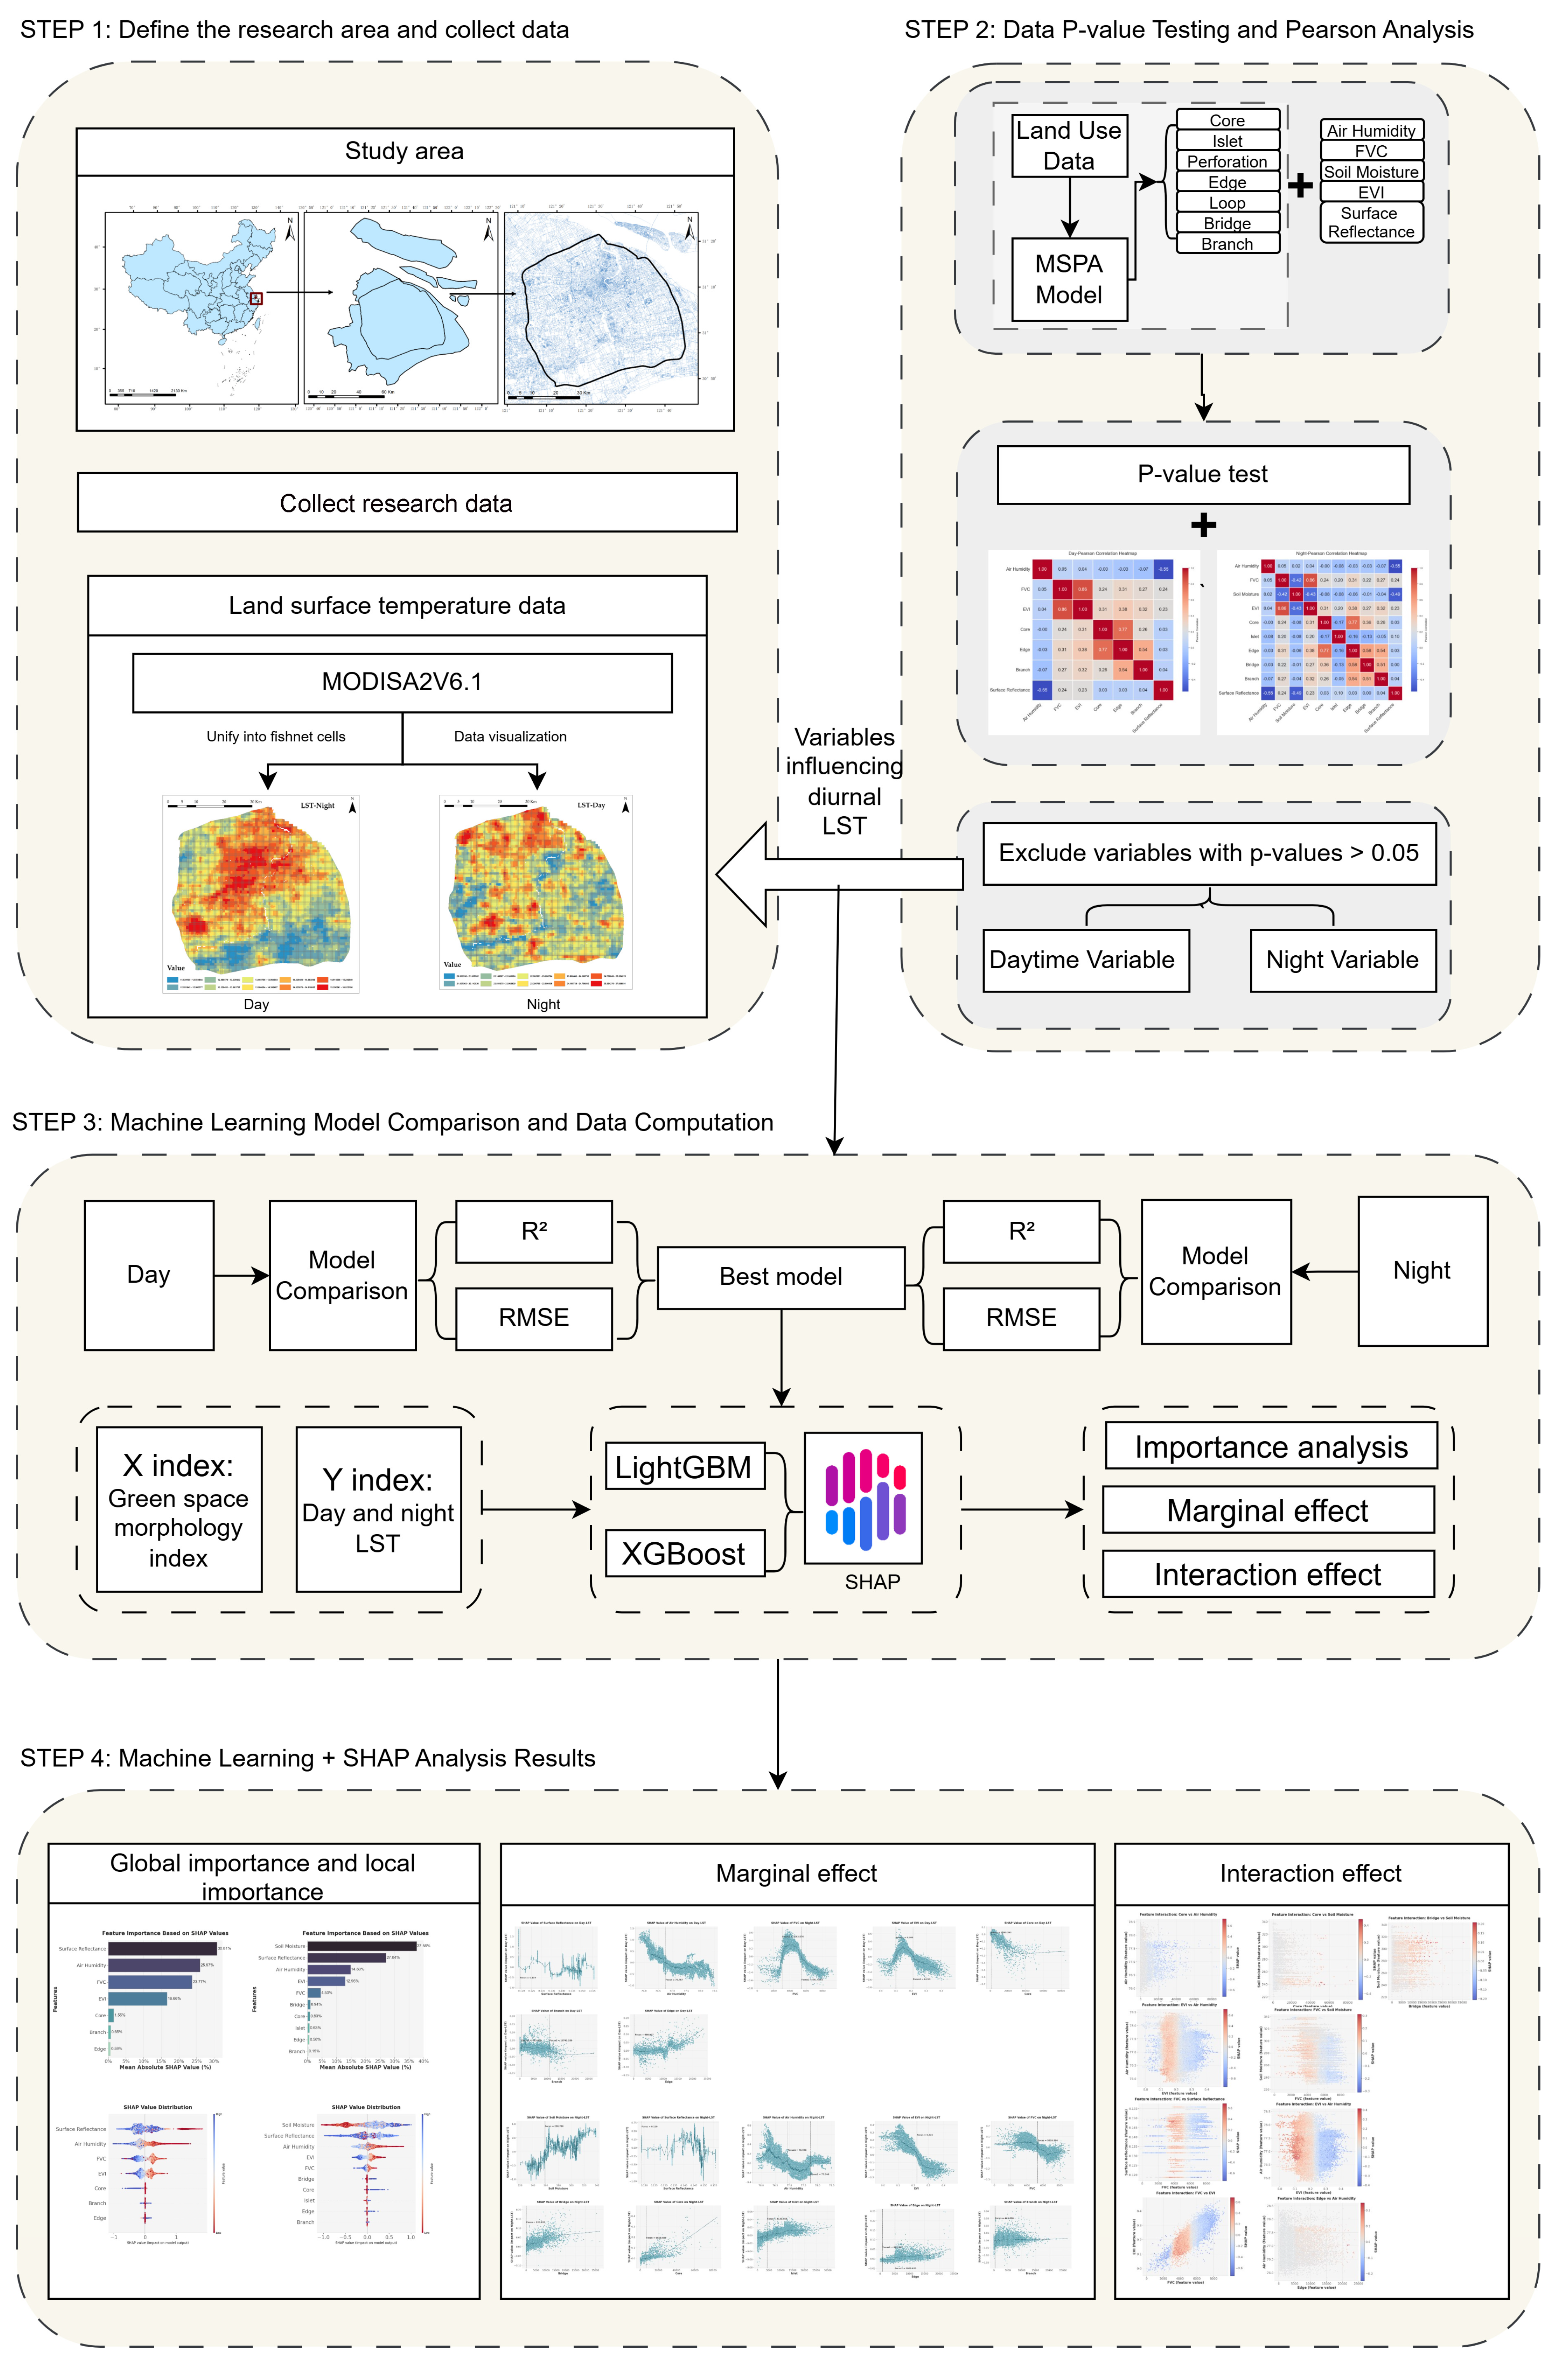
The technical framework of this study is shown in Figure 3. We first selected the central urban area within the Shanghai Ring Expressway as the study case and divided it into 31,886 units. Subsequently, we collected high-precision land use data with 1-metre resolution for the year 2021, along with physiological and physical data pertaining to green spaces and nighttime surface temperature data for Shanghai. We then used Guidos software to perform morphological spatial pattern analysis on the 1-metre land use data, obtaining high-precision 7-category Shanghai urban green space morphology indicator data. This data was aggregated into the study units using ArcGIS and subjected to Variance Inflation Factor and Pearson heatmap verification tests to validate the independence of the indicators; Finally, we employed LightGBM and XGBoost to construct separate daytime and night-time models. By integrating SHAP-based explainable machine learning methodologies, we examined the differential cooling mechanisms of green space morphology on diurnal surface temperatures, alongside threshold relationships and interactive effects. These findings provide refined, scientifically differentiated references for mitigating the urban heat island effect through day–night specific interventions.
Figure 3.
Research framework diagram.
3. Results
3.1. Data Validation and Model Comparison
3.1.1. p-Values, VIF Tests and Pearson Heatmaps
Prior to constructing the machine learning model, to ensure the statistical significance of each variable’s influence on diurnal Land Surface Temperature and to mitigate the impact of multicollinearity on model stability, we conducted p-value significance tests and variance inflation factor (VIF) analyses on all variables (Table 2). The p-value results indicate that in the daytime model, the variables Core, Edge, Air Humidity, FVC, EVI, and Surface Reflectance all yielded p-values below 0.05, indicating a significant relationship with daytime LST. whereas variables such as Islet, Perforation, Loop, Bridge, and Soil Moisture exhibited higher p-values, indicating weaker statistical significance in their correlation with daytime LST. In the night-time model, significant variables included Core, Edge, Bridge, Branch, Air Humidity, FVC, Soil Moisture, EVI, and Surface Reflectance, while Loop and Perforation displayed higher p-values. This indicates that nocturnal LST variations are more readily influenced by the combined effects of humidity and vegetation characteristics. The VIF test results reveal that all variables exhibit VIF values below 10, confirming the absence of severe multicollinearity among independent variables. Among these, EVI (4.374), FVC (3.943), and Edge (4.198) exhibited relatively higher VIF values, though still within the acceptable range (VIF < 5). This indicates that while these variables possess a certain degree of correlation, they do not significantly compromise the model’s explanatory power or stability.
Table 2.
p-values and VIF calculations for green space variables.
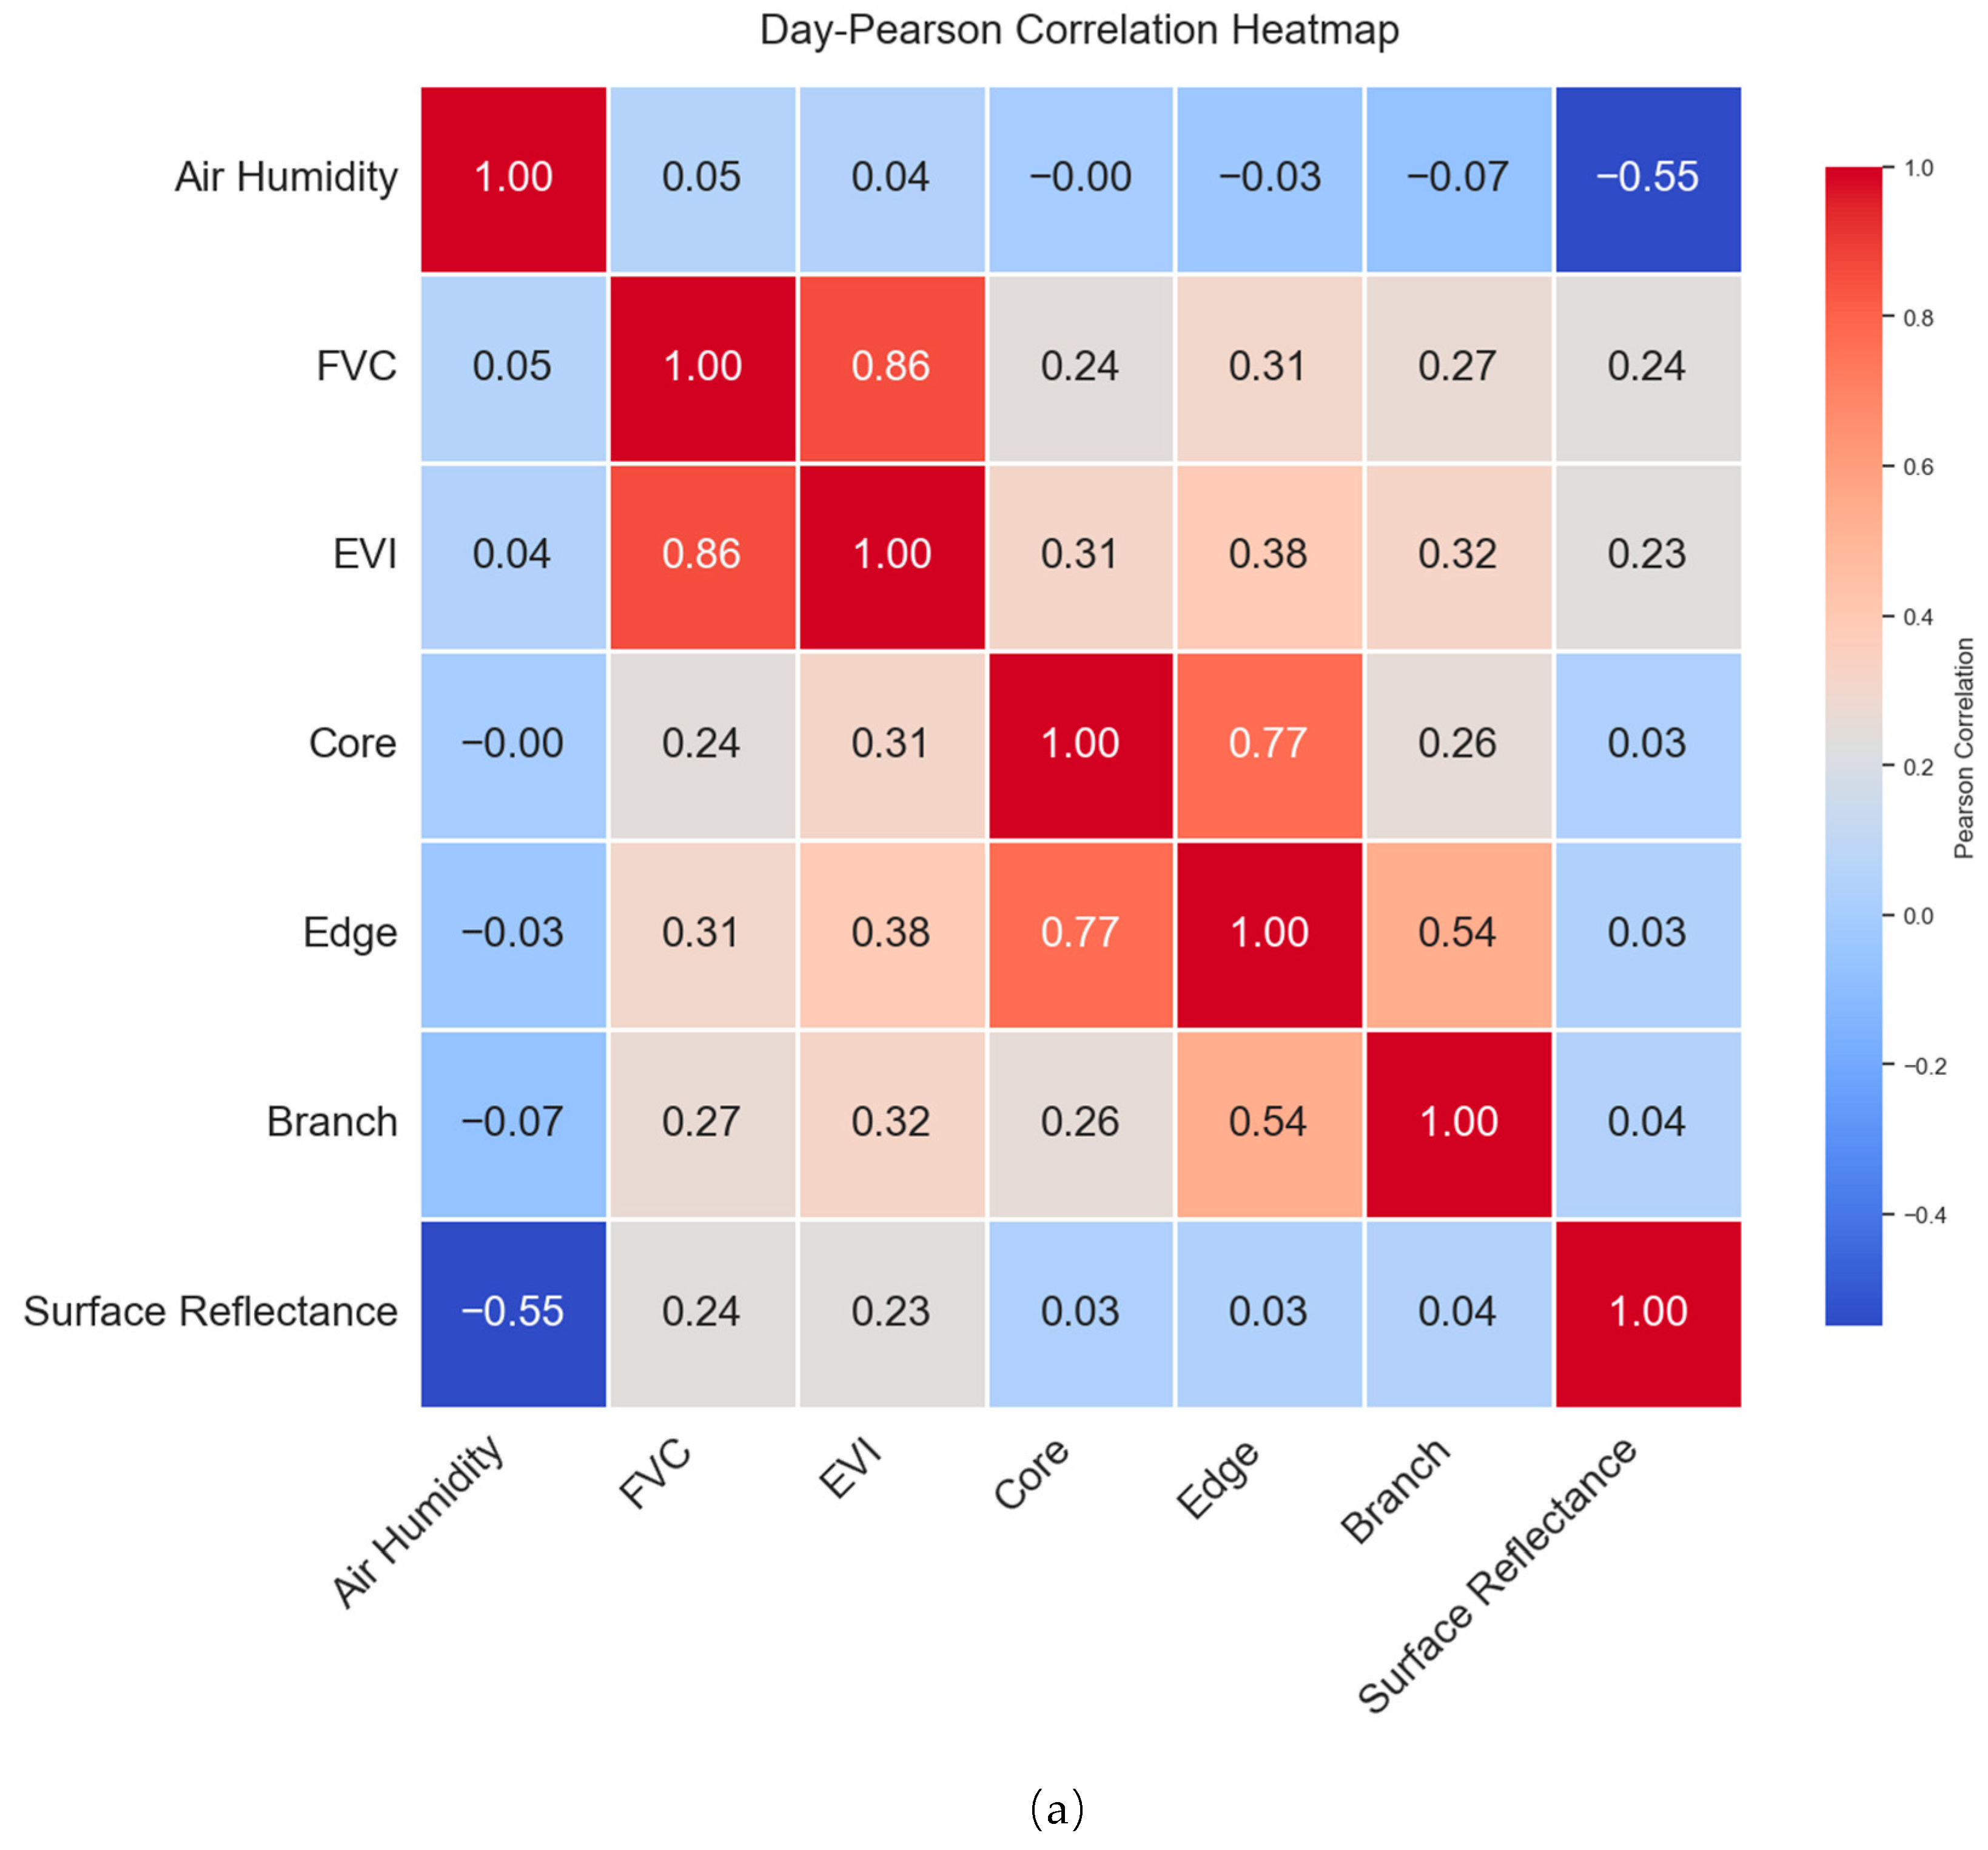
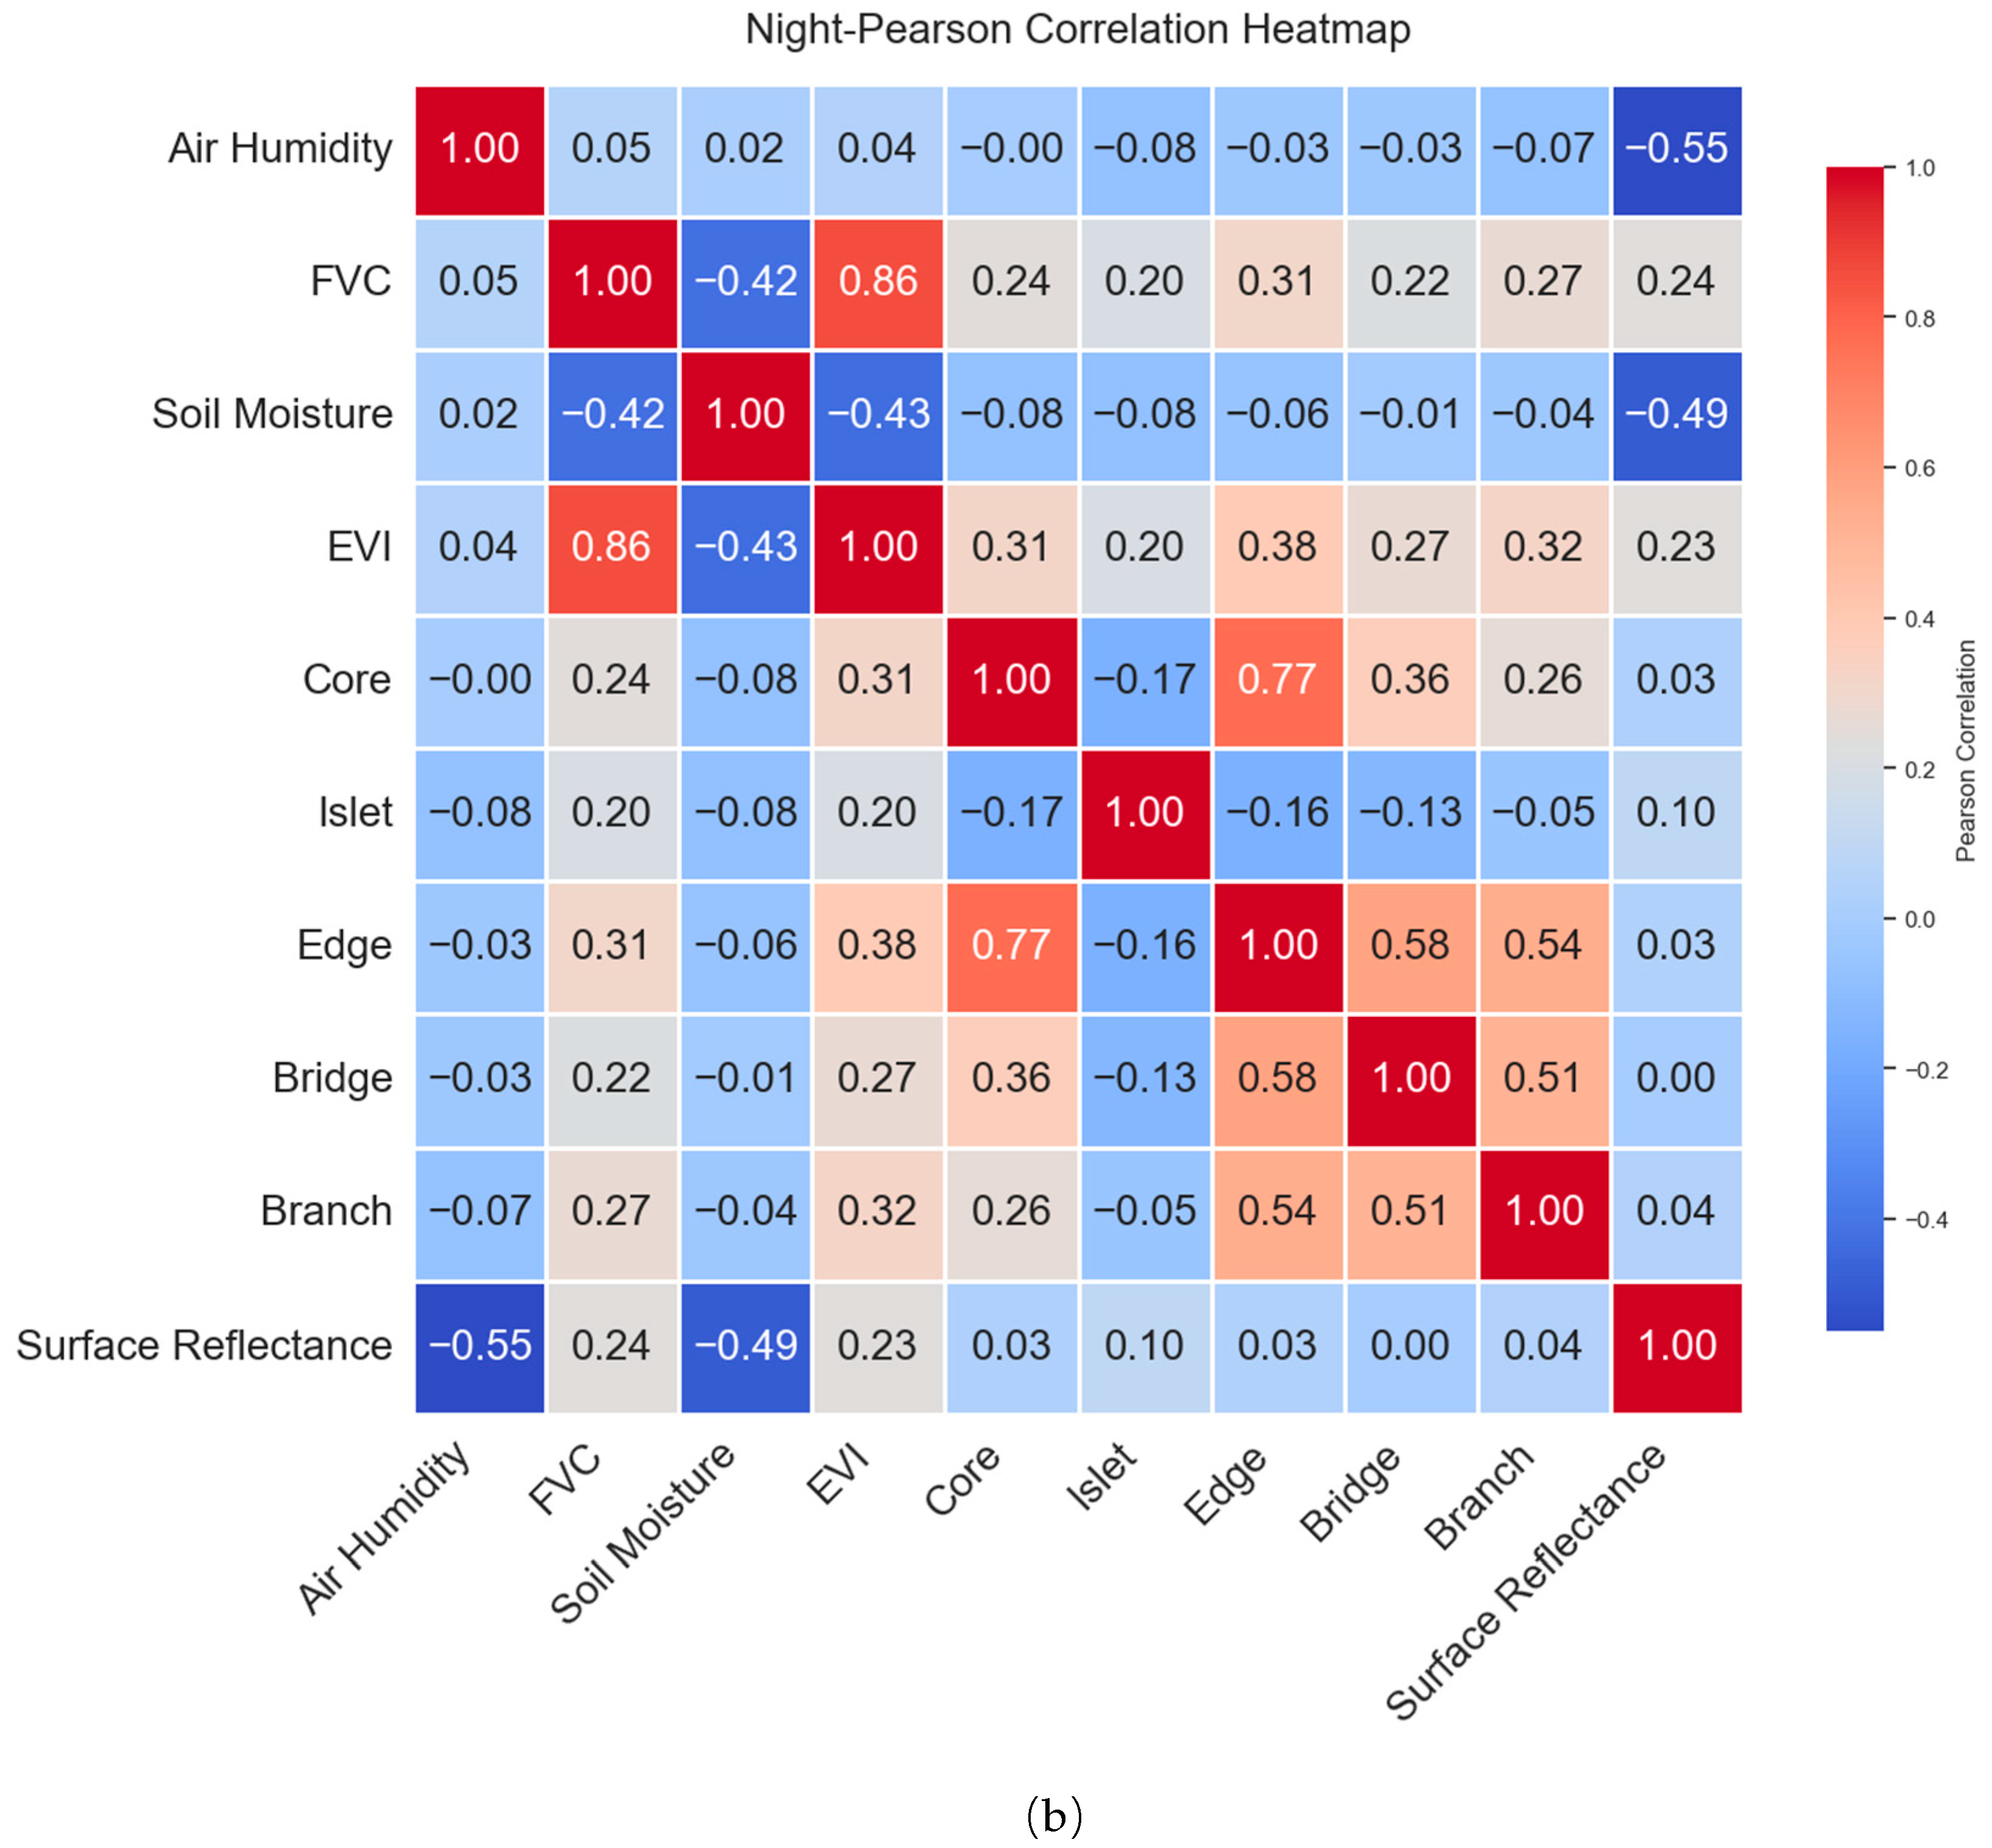
After excluding variables with higher p-values and weaker significance, Pearson correlation tests were conducted on the remaining variables. Results indicate (Figure 4) that most variables exhibited low correlations, with daytime coefficients ranging from −0.55 to 0.54 and nighttime coefficients from −0.55 to 0.58. Notably, FVC and EVI showed a correlation coefficient of 0.86, while Core and Edge correlated at 0.77, both demonstrating strong positive associations. Given that FVC and EVI respectively reflect vegetation cover and activity, while Core and Edge represent internal and peripheral characteristics of green spaces, these variables retain ecological distinctiveness despite high correlations and are thus retained for subsequent analysis. Overall, no significant multicollinearity exists among variables, permitting their continued use in subsequent model construction and SHAP interpretation.

Figure 4.
Pearson analysis of daytime and night-time indicators, where red denotes high values and blue denotes low values. The figures in the diagram represent the Pearson correlation coefficients between the two indicators. (a) shows the Pearson heatmap of indicators after excluding green space variables with p > 0.05 during daytime periods, while (b) presents the Pearson heatmap of indicators after excluding green space variables with p > 0.05 during night-time periods.
3.1.2. Comparison of Machine Learning Models
To evaluate the performance of different machine learning models in predicting daytime and night-time Land Surface Temperature (LST), this study constructed six models: LightGBM, XGBoost, CatBoost, Random Forest, Decision Tree, and SVR. The coefficient of determination (R2) and root mean square error (RMSE) were employed as performance metrics (Table 3). Results indicate that daytime models generally exhibit poorer overall fit compared to night-time models. For daytime predictions, the LightGBM model performed best (R2 = 0.590, RMSE = 0.620), marginally outperforming XGBoost (R2 = 0.587, RMSE = 0.622). For night-time predictions, the XGBoost model achieved the highest accuracy (R2 = 0.859, RMSE = 0.319), followed by LightGBM (R2 = 0.857, RMSE = 0.321). In contrast, CatBoost, Random Forest, and Decision Tree models demonstrated relatively lower prediction accuracy, while the SVR model performed the worst.
Table 3.
Model Comparison Table detailing R2 and RMSE values for six models across daytime and night-time periods.
Overall, gradient boosting models (particularly XGBoost and LightGBM) demonstrated high fitting capability and stability in both daytime and night-time LST models, effectively capturing the complex nonlinear relationships between green space morphology and environmental factors influencing surface temperature. Consequently, LightGBM was selected as the optimal model for daytime analysis, while XGBoost was chosen for night-time analysis in this study. These models were subsequently employed for SHAP interpretation and impact mechanism analysis.
3.2. The Relative Importance of Green Space Variables
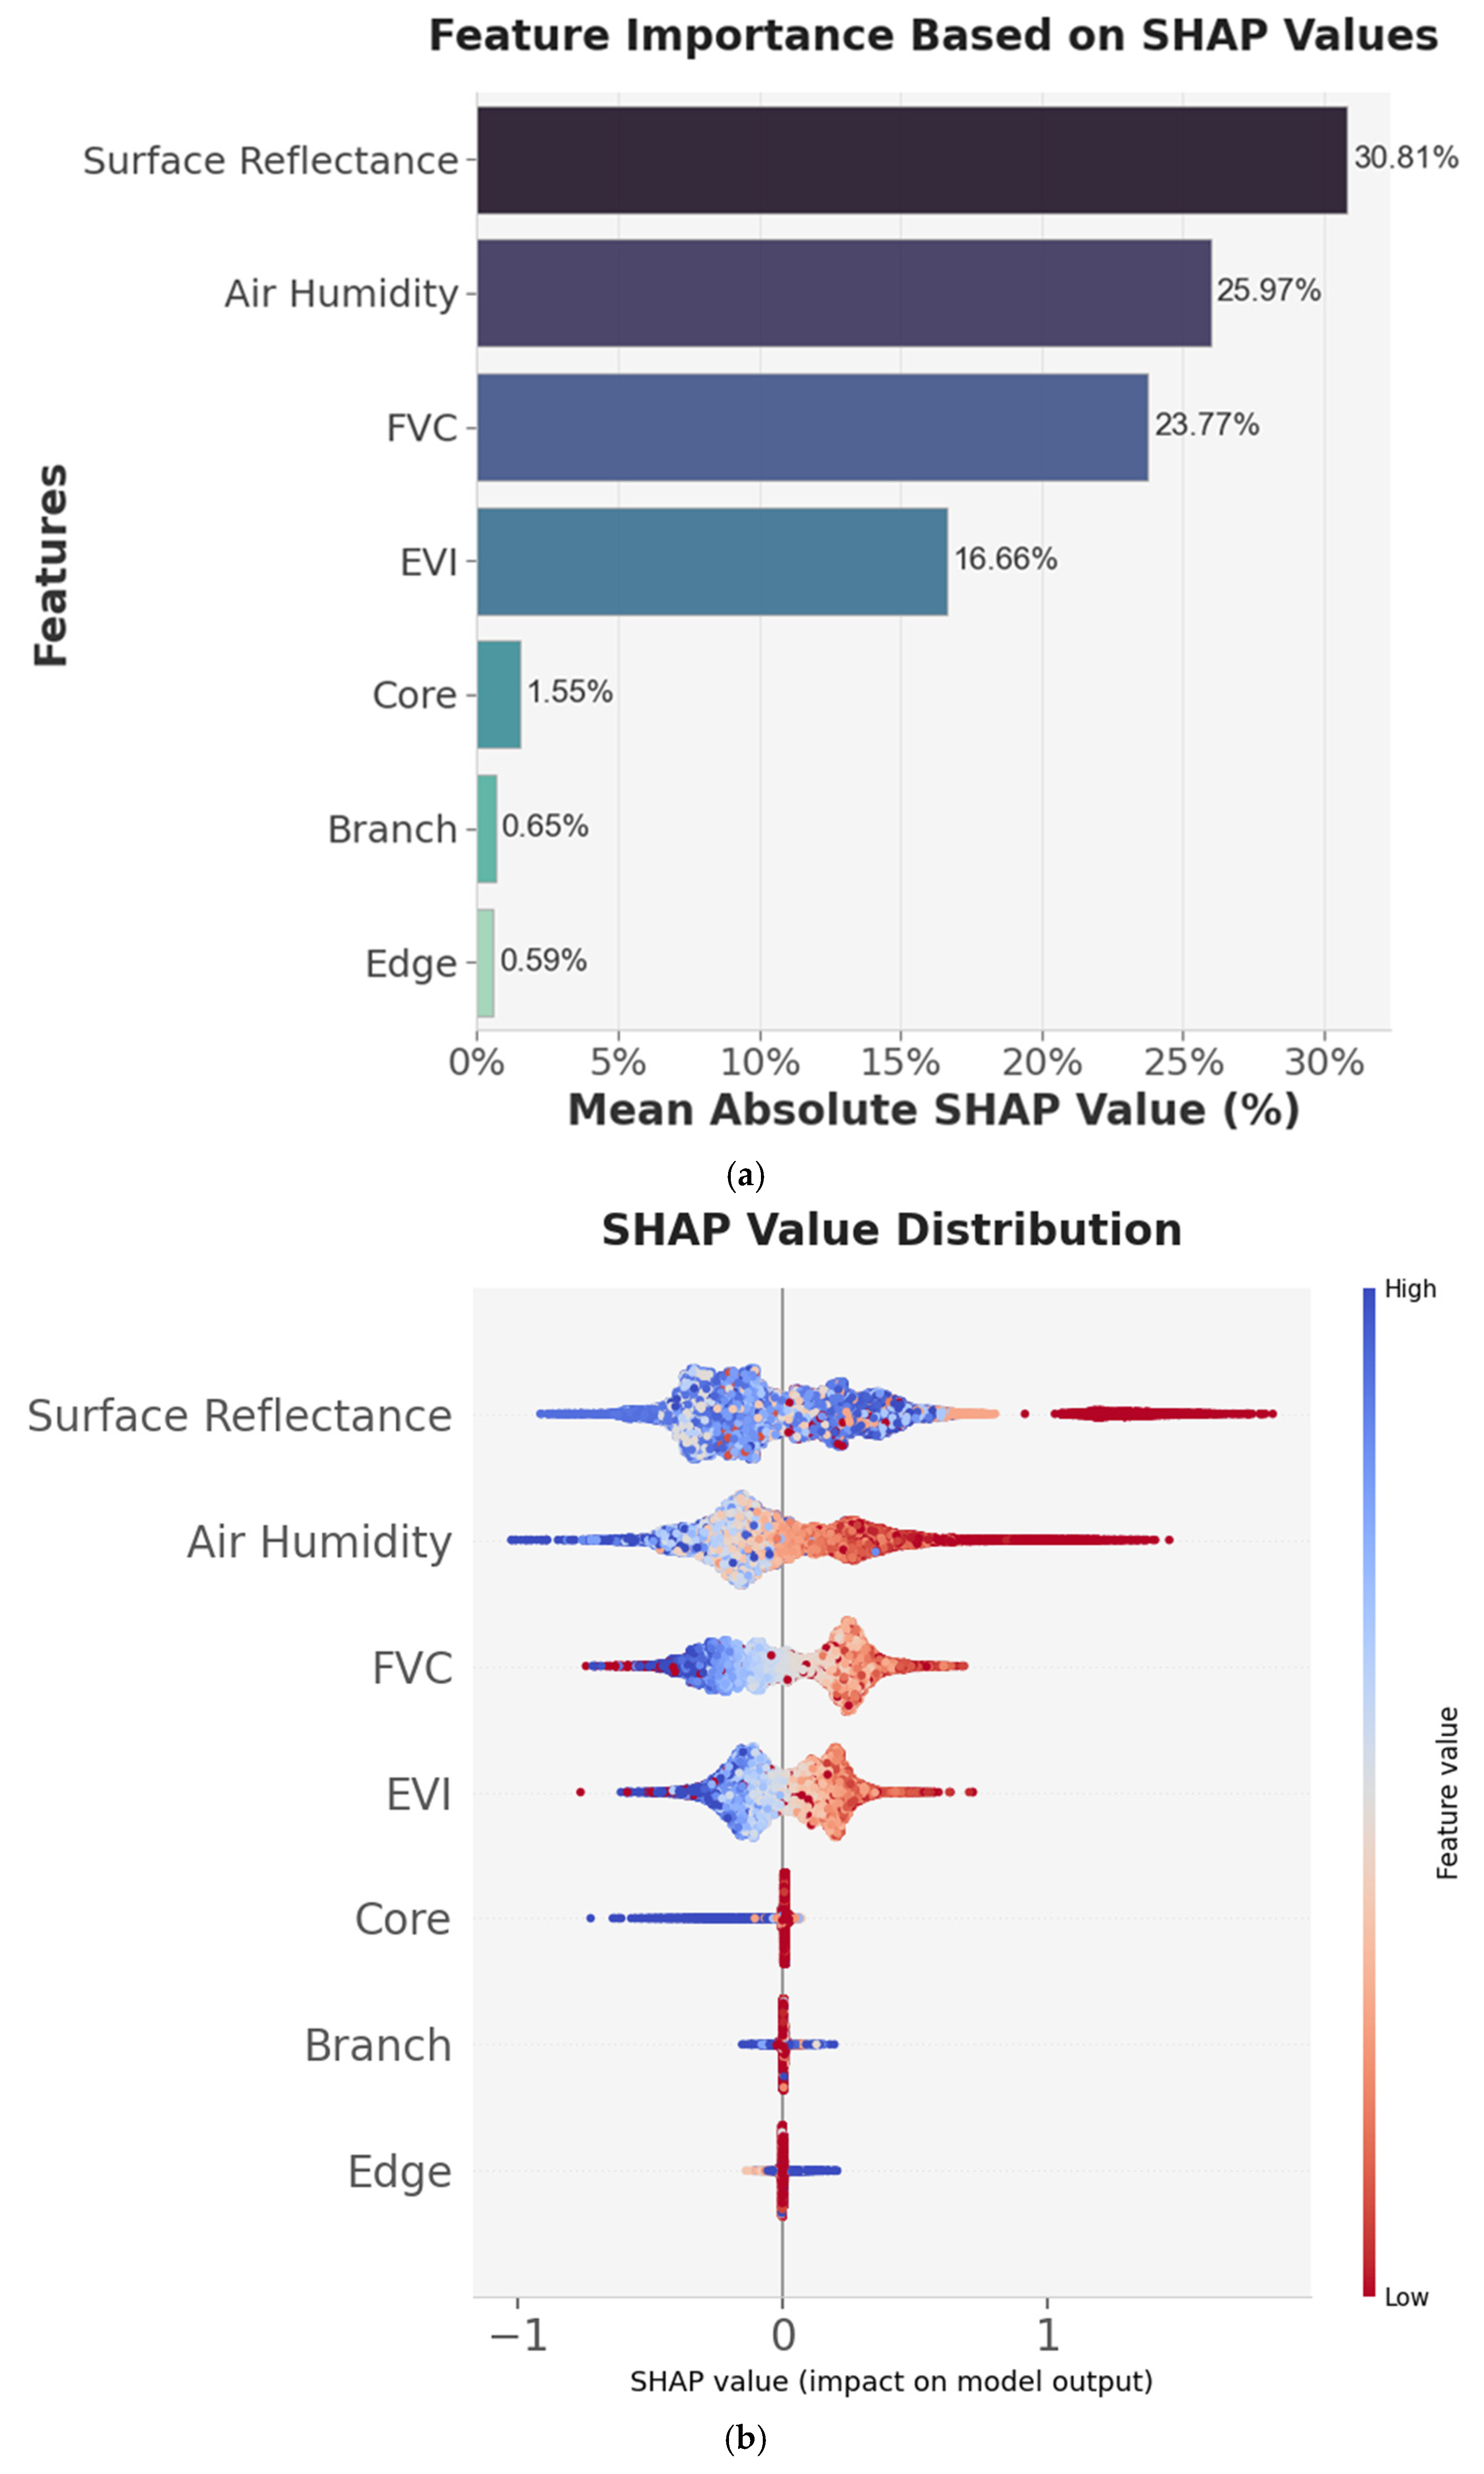
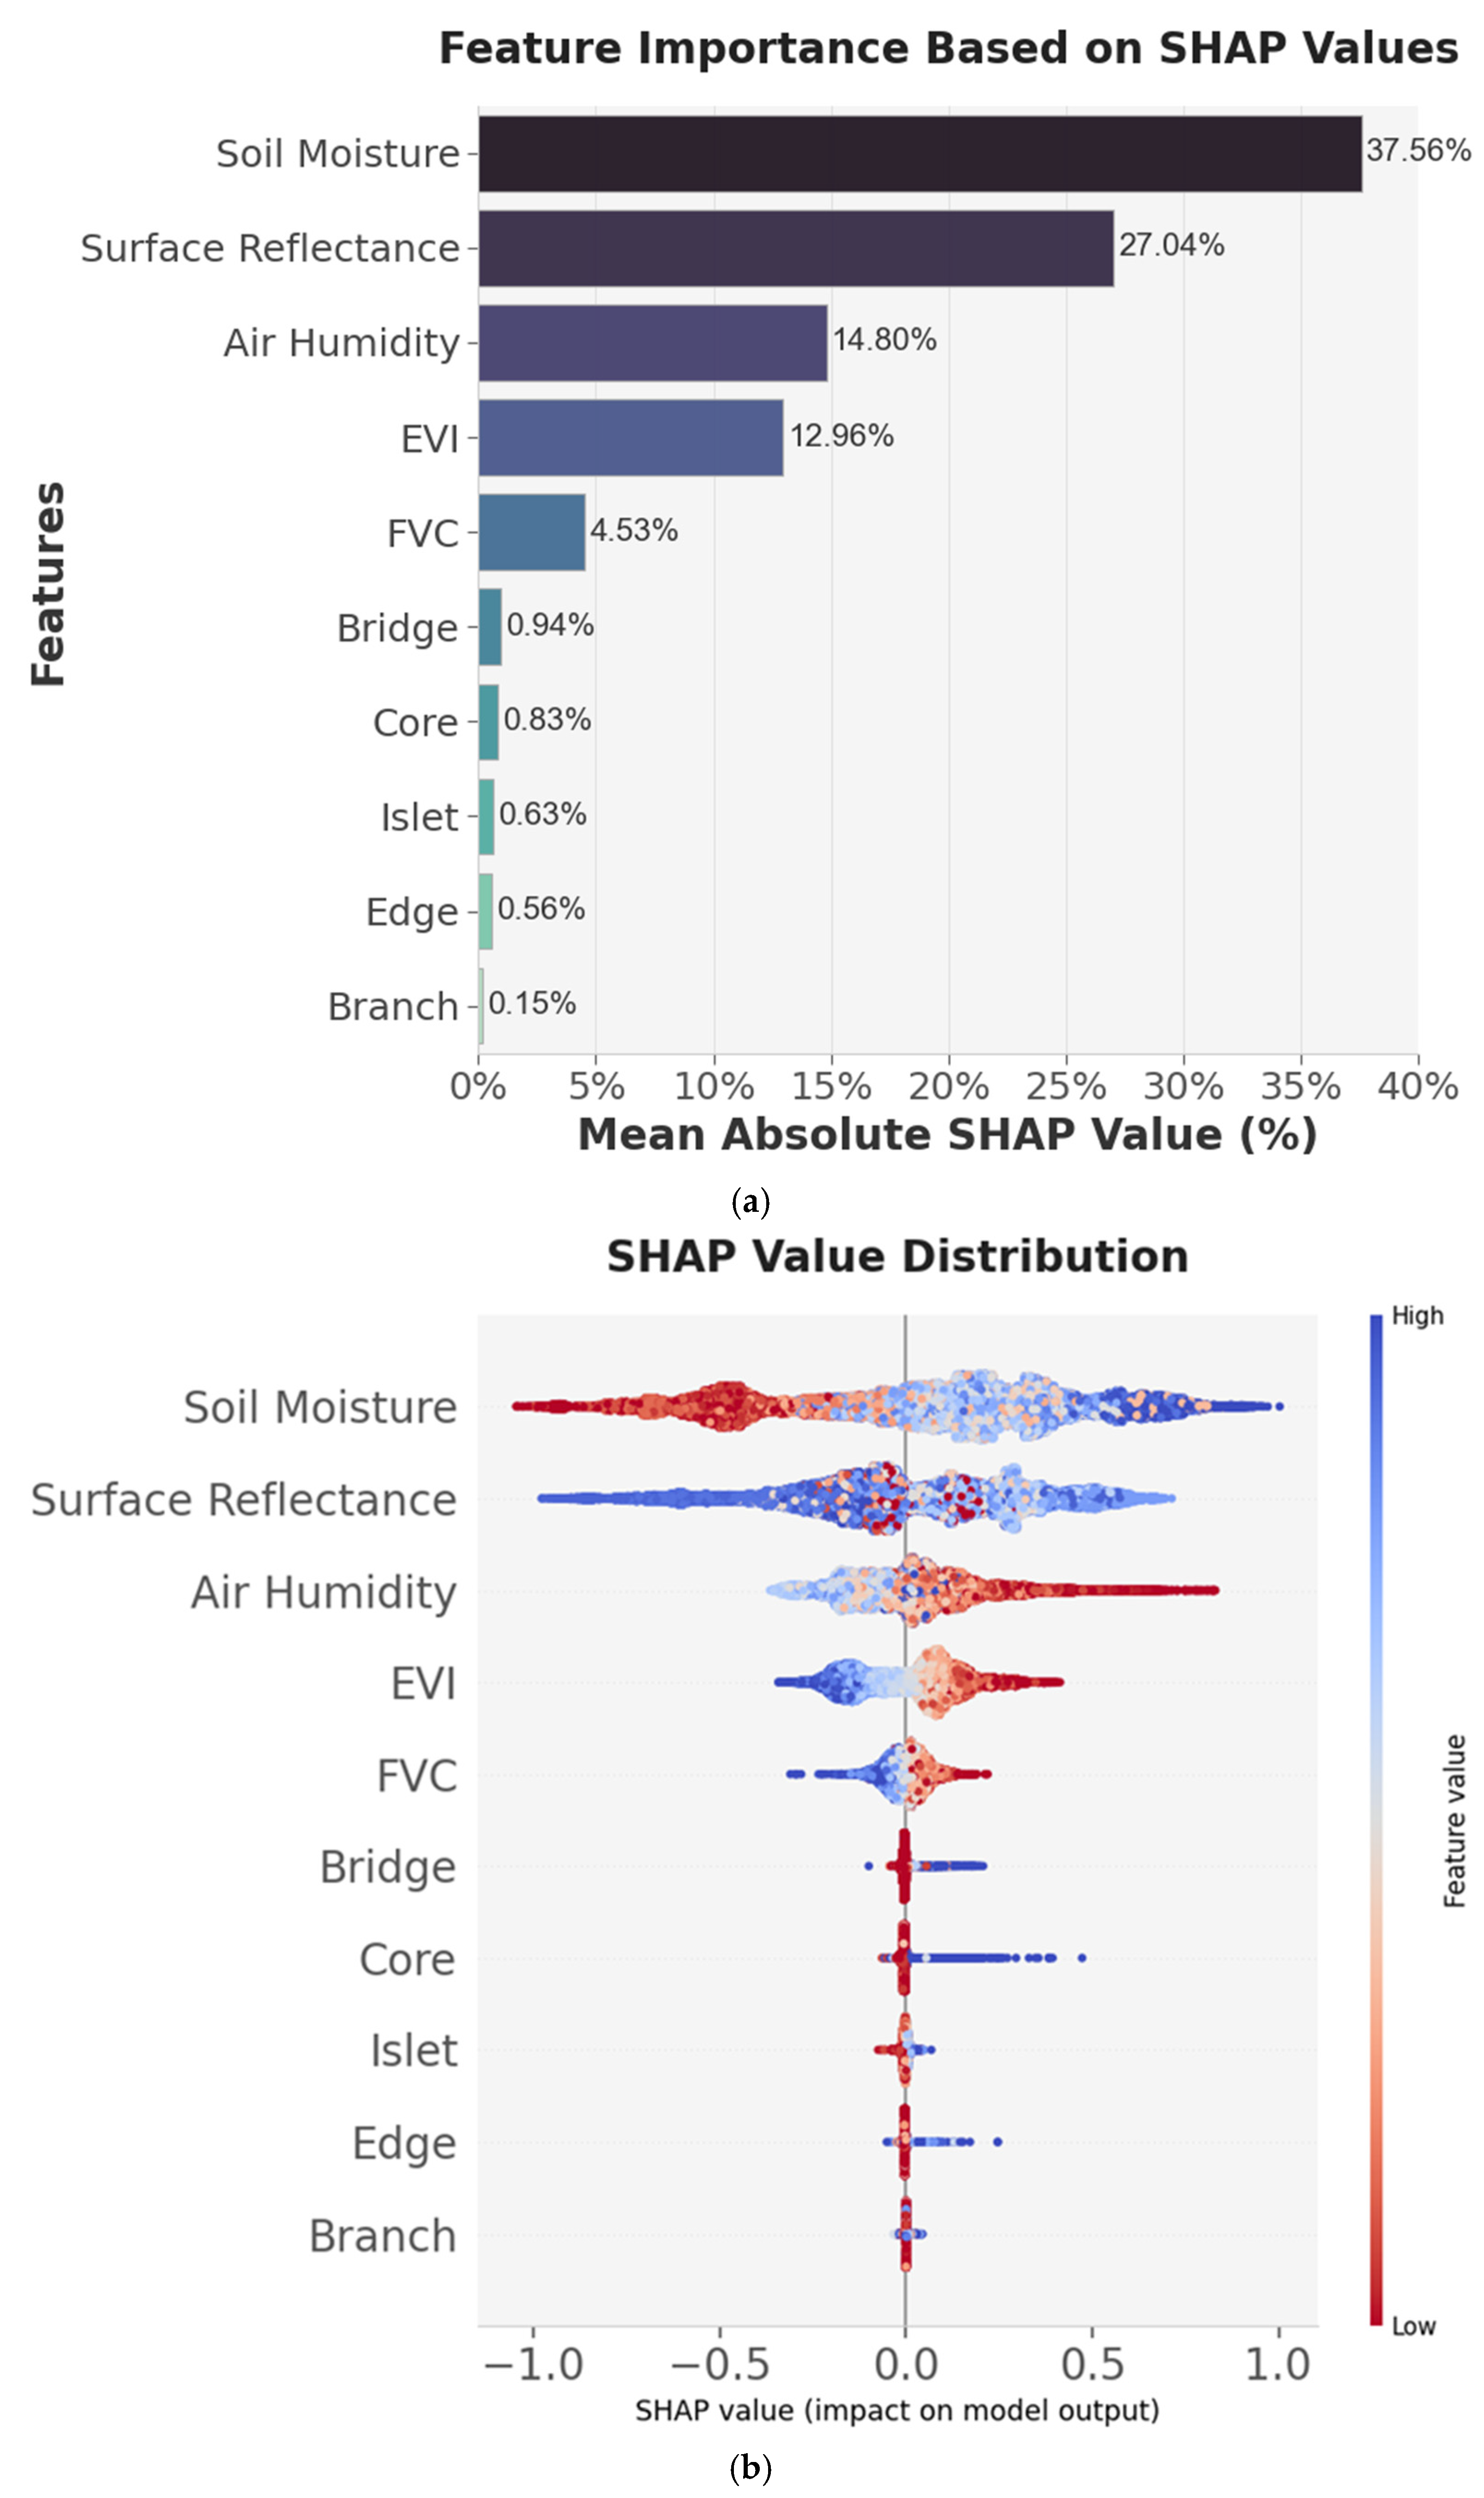
This study utilised the SHAP values of the Machine Learning model to quantify the analysis results, using importance maps and scatter plots to quantify the global and local importance of green space variables during daytime and nighttime (Figure 5a and Figure 6a), thereby identifying the key roles of different green spaces in regulating surface temperature. Figure 5 shows the SHAP global importance features, which calculate the average absolute SHAP values across all samples, indicating the importance of each sample. Figure 5b and Figure 6b show the local importance, plotting the SHAP values for each feature of each sample, indicating the scope of influence on the dataset. In Figure 5 and Figure 6, the X-axis represents the SHAP value, and the Y-axis represents the feature.
Figure 5.
Characteristic importance of daytime variables, (a) Figure illustrates the global importance of each daytime variable to LST; (b) Figure depicts the local importance of each daytime variable to LST.
Figure 6.
The feature importance of variables during the night-time period, (a) Figure illustrates the global importance of each variable for LST during the night-time period; (b) Figure depicts the local importance of each variable for LST during the night-time period.
Based on the SHAP analysis results from the LightGBM model, the relative importance of each variable in predicting Land Surface Temperature (LST) was calculated (Figure 5). The findings reveal significant variations in the contribution of different variables to daytime LST, with plant physiological and environmental variables playing a dominant role. Surface Reflectance exhibited the highest importance at 30.81%, followed by Air Humidity (25.97%) and FVC (23.77%). This indicates that surface reflectance characteristics, air humidity, and vegetation cover play crucial roles in regulating daytime surface temperature. Enhanced albedo elevates surface temperatures, exacerbating the urban heat island effect []. The relative importance of EVI was 16.66%. High EVI typically correlates with low LST [], as robust, active vegetation reduces LST through transpiration or dense canopy cover. In contrast, green space morphological variables exhibit relatively lower importance, with Core, Branch, and Edge contributing 1.55%, 0.65%, and 0.59% respectively. Despite these modest proportions, such structural indicators still partially reflect the potential influence of green space morphology on local microclimate and thermal distribution []. Overall, variations in diurnal LST are primarily influenced by the combined effects of surface spectral characteristics, humidity, and vegetation conditions, while green space morphological factors play a supplementary role in fine-scale thermal regulation.
The SHAP analysis results based on the optimal night-time model (XGBoost) reveal the relative importance of each variable in predicting night-time LST, as shown in Figure 6. Findings indicate that the dominant factors influencing night-time LST differ somewhat from those during the day, with environmental and soil moisture-related variables contributing significantly more than green space morphological indicators. Soil Moisture exhibited the highest importance at 37.56%, indicating its dominant role in nocturnal surface heat storage and release processes []. During the night, the surface no longer receives solar shortwave radiation, and surface temperature is primarily influenced by downward heat transfer from the surface, as well as longwave radiation and sensible/latent heat exchange between the surface and atmosphere. Surface Reflectance (27.04%) and Air Humidity (14.80%) followed, indicating that surface reflectance characteristics and atmospheric humidity remain crucial environmental factors influencing nocturnal LST distribution. Among vegetation-related indices, EVI (12.96%) and FVC (4.53%) exhibited relatively lower contributions, yet still exerted some influence on nocturnal heat exchange and surface cooling. Green space morphological variables exerted the least influence, with Bridge, Core, Islet, Edge, and Branch contributing 0.94%, 0.83%, 0.63%, 0.56%, and 0.15% respectively. This indicates that the direct impact of nocturnal green space spatial structure on LST is weak, though it may exert effects indirectly by regulating air humidity and thermal diffusion processes. Overall, nocturnal LST variations are primarily driven by environmental factors such as soil moisture, surface reflectance, and air humidity, while the influence of vegetation activity and green space morphology during the night is relatively diminished. This indicates that the nocturnal thermal environment is more strongly governed by surface and soil thermal properties, with diurnal variations reflecting temporal shifts in surface energy balance mechanisms.
3.3. The Marginal Effects of Green Space Variableon Daytime and Nighttime LST
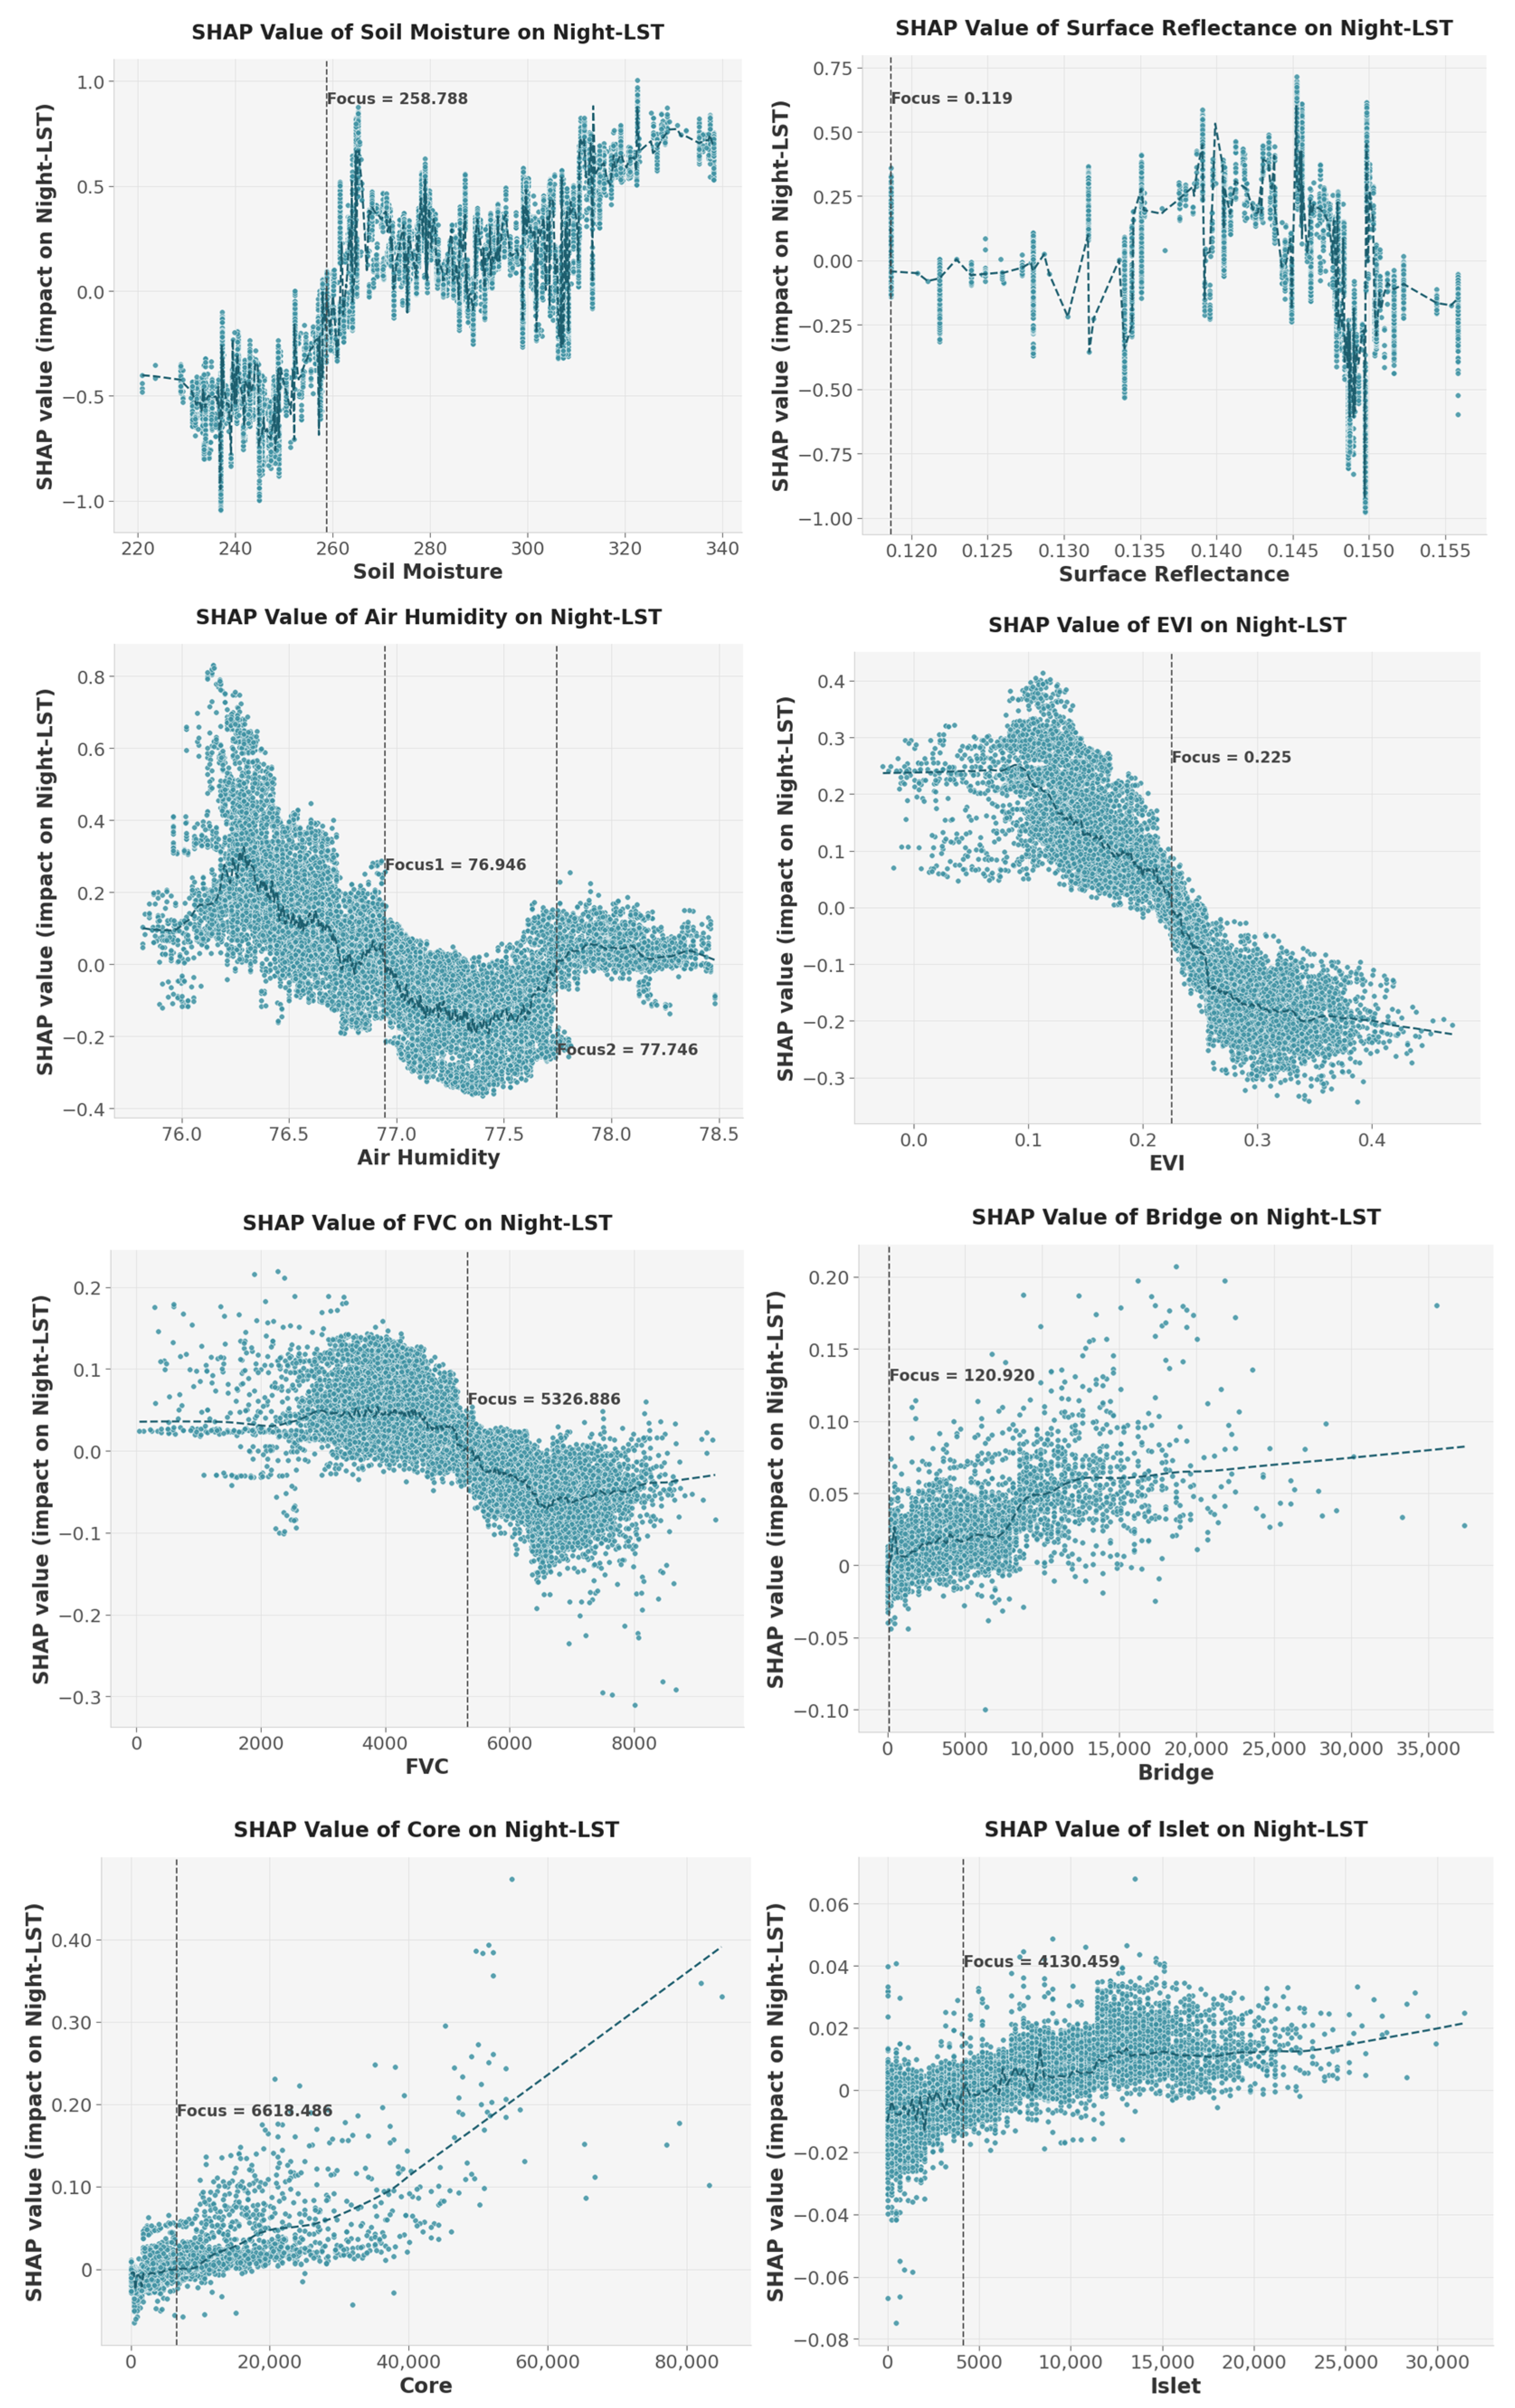
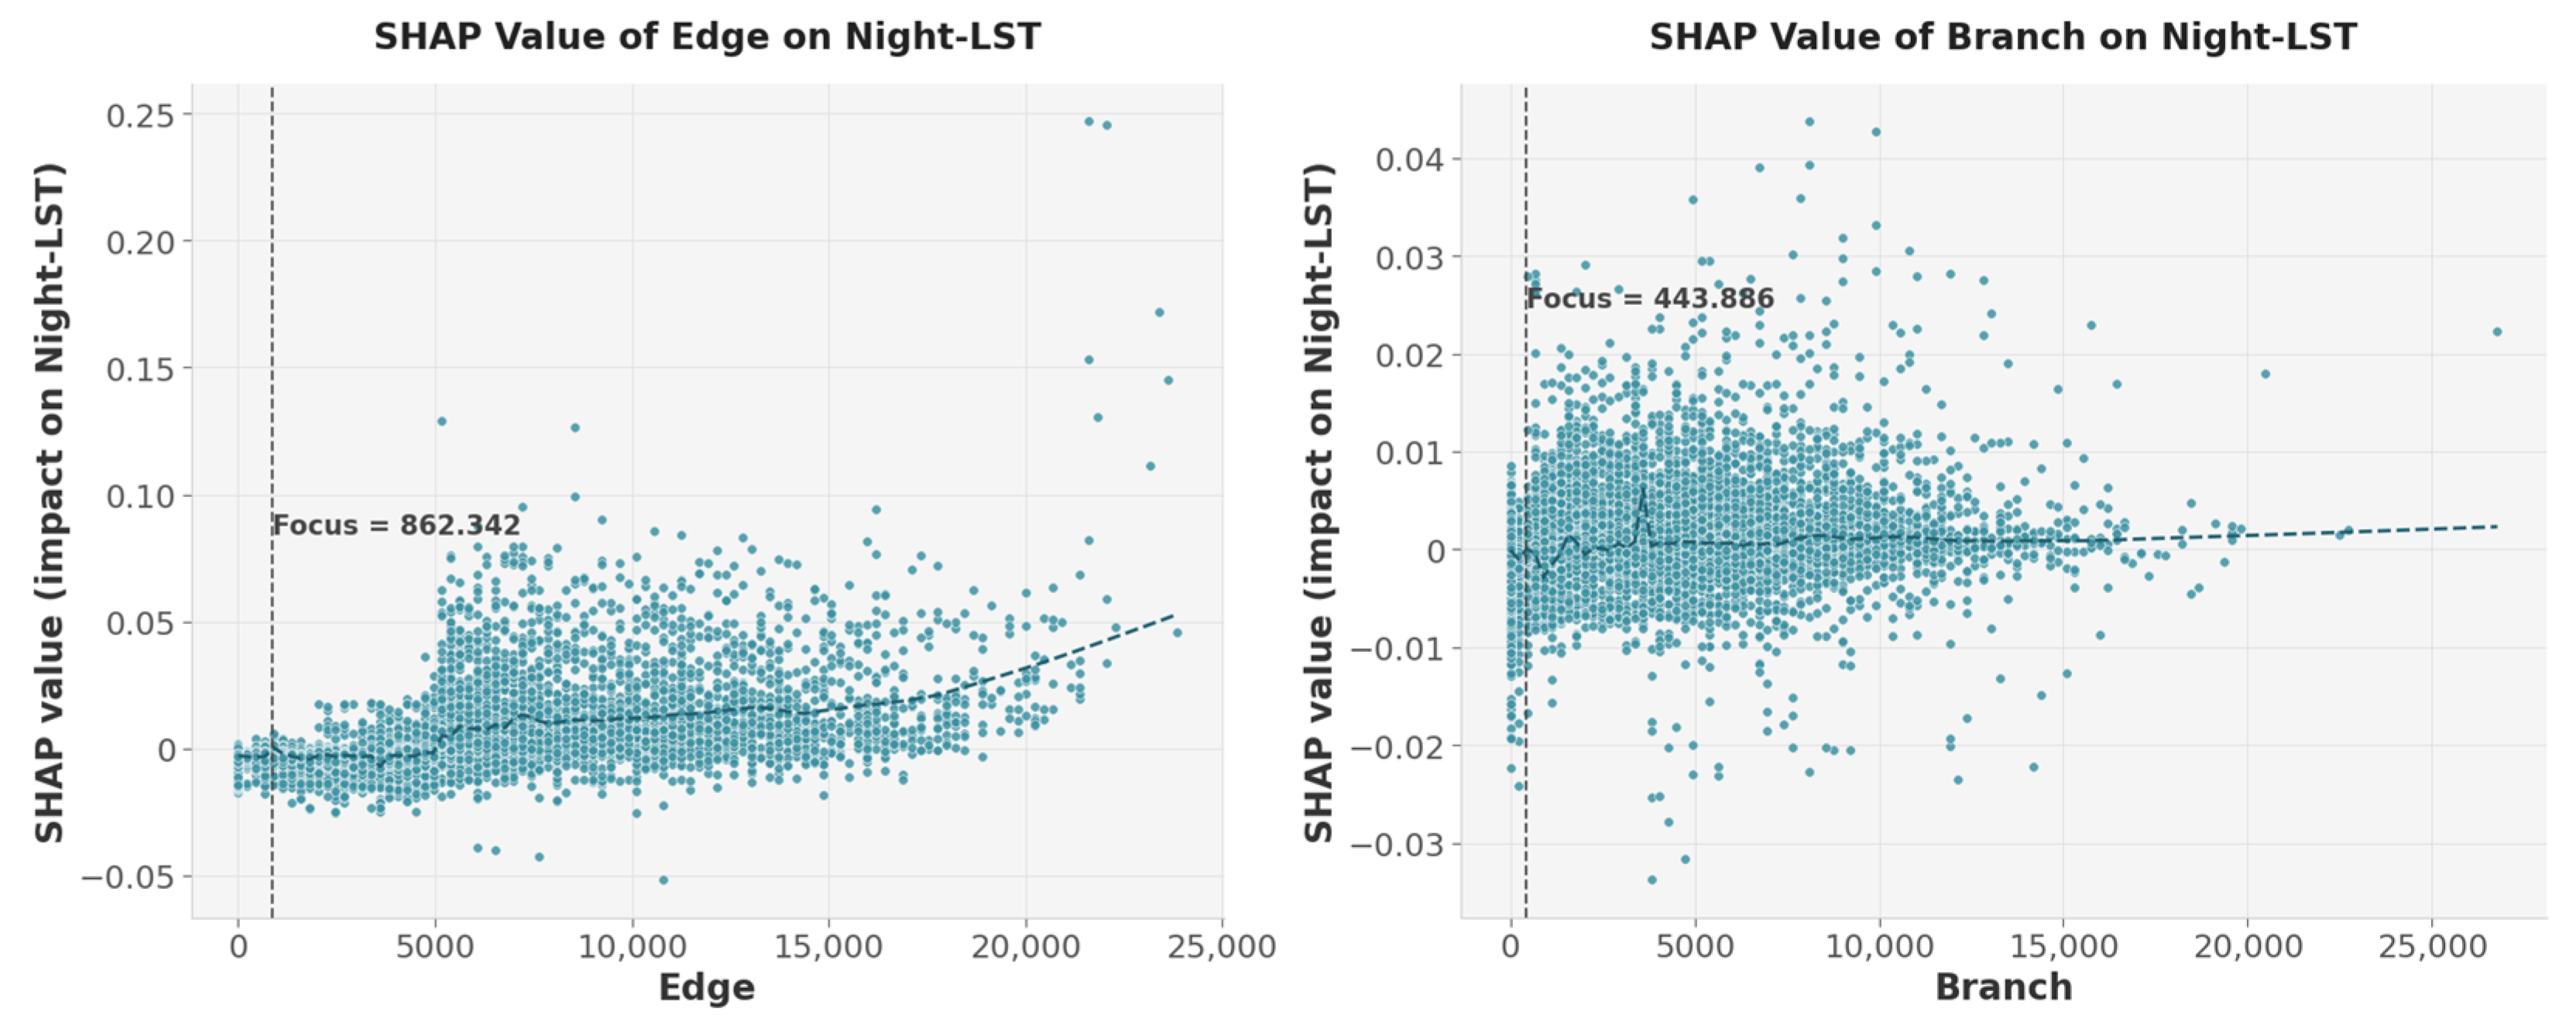
After analysing the global and significant effects of green space morphology on diurnal LST, we further utilised SHAP values to analyse the marginal effects of green space morphology indicators. Figure 7 and Figure 8 reveals the mechanisms by which various green space morphologies influence daytime and nighttime LST. SHAP values measure the extent to which individual features influence model prediction outcomes, with positive values indicating a promotion of LST increases and weaker surface temperature mitigation capabilities, and negative values indicating an inhibition of LST increases and effective surface temperature mitigation. We added fitted curves to visually illustrate the overall trend of how changes in indicator values affect LST, revealing the temporal heterogeneity of how form patterns regulate thermal environments. The results indicate that there is a non-linear relationship between green space form indicators and LST.
Figure 7.
Marginal effect of green space variables during daytime hours. The green dashed line in the figure represents the fitted curve, indicating the general trend of the scatter plot. The black dashed line denotes the intersection point between the fitted curve and the Y = 0 line, with the characteristic value of the intersection point labelled.

Figure 8.
Marginal effects of green space variables during night-time periods. The green dashed line represents the fitted curve, indicating the general trend of the scatter plot. The black dashed line denotes the intersection of the fitted curve with the Y = 0 line, with the characteristic value of the intersection point labelled.
In the daytime model, Surface Reflectance exhibits pronounced fluctuations near SHAP = 0, with its first discernible threshold occurring at 0.119. Values above this threshold generally indicate a cooling effect, showing a significant negative trend within the 0.135–0.150 range. Air Humidity shifts from positive to negative effects when humidity exceeds 76.767, with the cooling influence intensifying. Regarding vegetation indices, FVC exhibits a warming effect on LST within the range 3062.576–5417.265, while EVI shows a warming effect between 0.100 and 0.213, indicating potential insufficient shading or heat retention due to dense vegetation. Conversely, Core demonstrates a cooling trend when exceeding 1095.393. Branch and Edge exhibit SHAP = 0, with Branch showing a cooling trend above 10,742.286 and Edge turning positive above 488.927, exhibiting local fluctuations in the high-value 10,000 range, reflecting the complexity of edge effects.
In the nocturnal model, regulatory mechanisms differ markedly, with Soil Moisture playing a dominant role. Above 258.788, its fluctuating influence enhances the cooling effect. Surface Reflectance exhibits a warming effect within the 0.135–0.145 range, gradually turning negative beyond 0.145. Air Humidity markedly reduces LST between 76.946 and 77.746. Among vegetation indices, EVI turns negative beyond 0.225 and FVC beyond 5326.886, highlighting the prominence of plant transpiration and moisture retention during night-time. Greenland morphology indicators (Bridge, Core, Islet, etc.) exhibit cooling effects beyond their respective thresholds, though their overall influence remains smaller than environmental variables and soil moisture. Edge and Branch show weak threshold responses and slight upward trends, indicating that the nocturnal thermal environment is more strongly governed by heat capacity and moisture dynamics.
3.4. Interaction of Green Space Variable
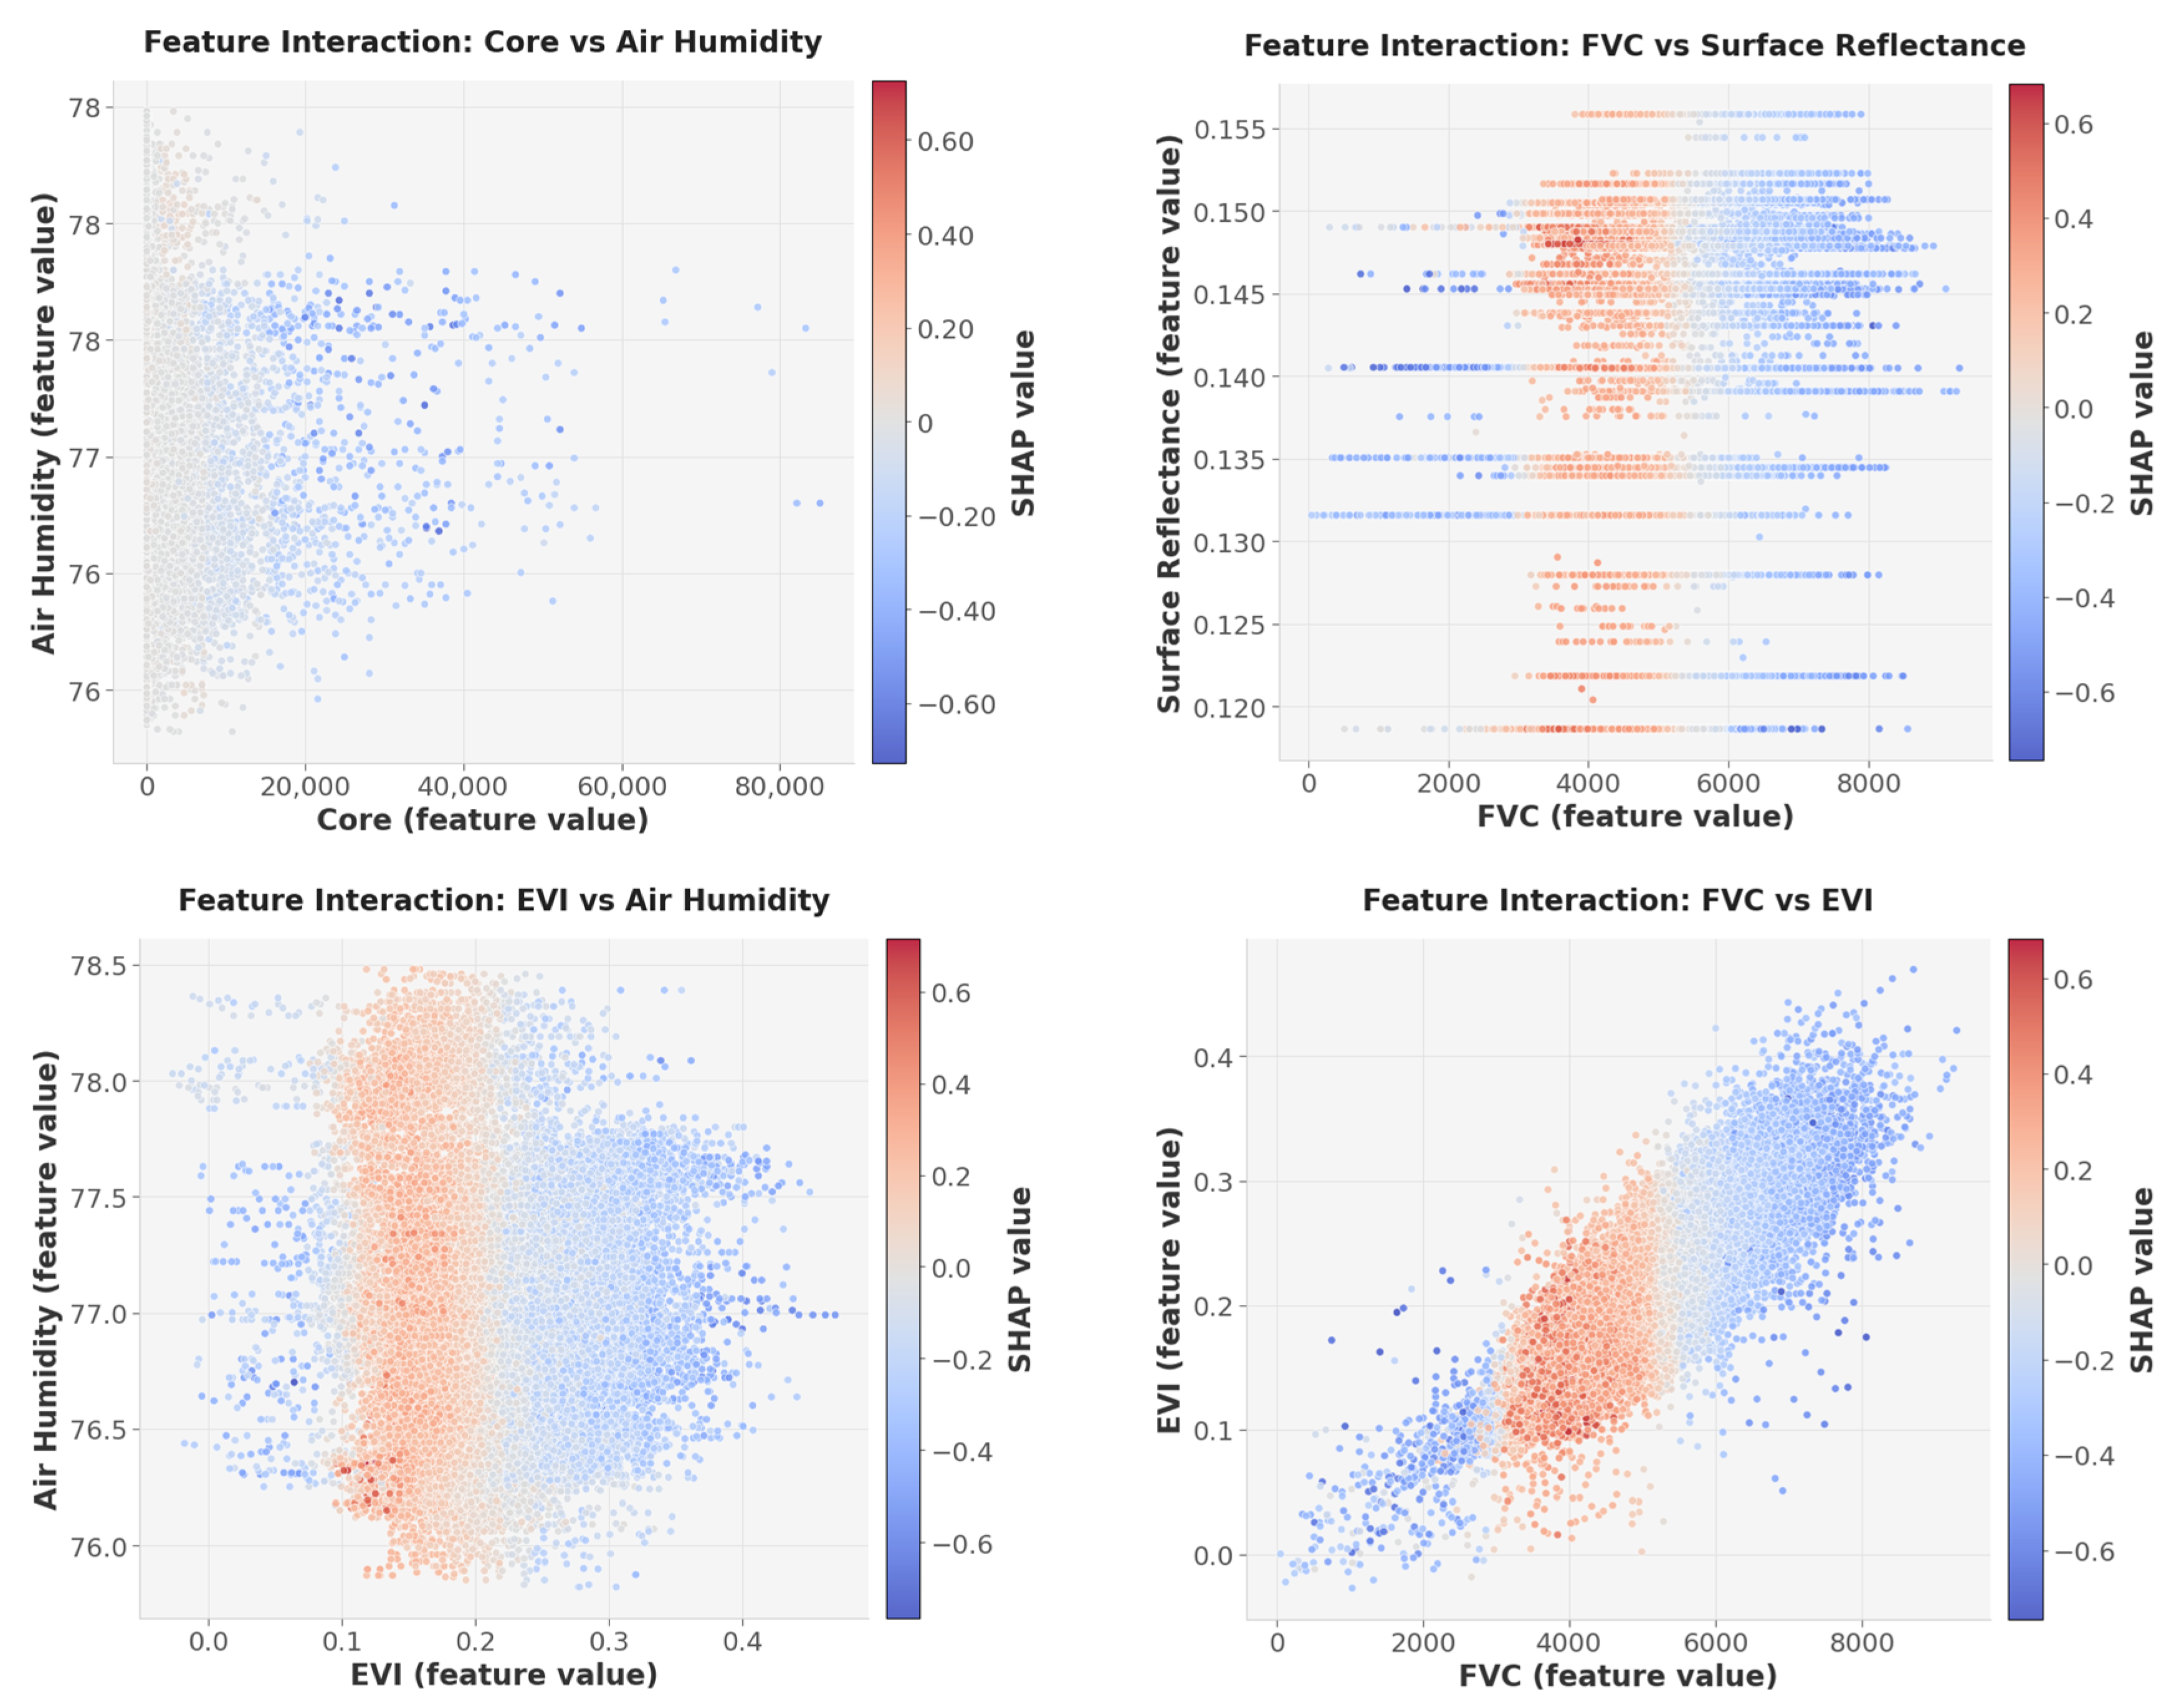
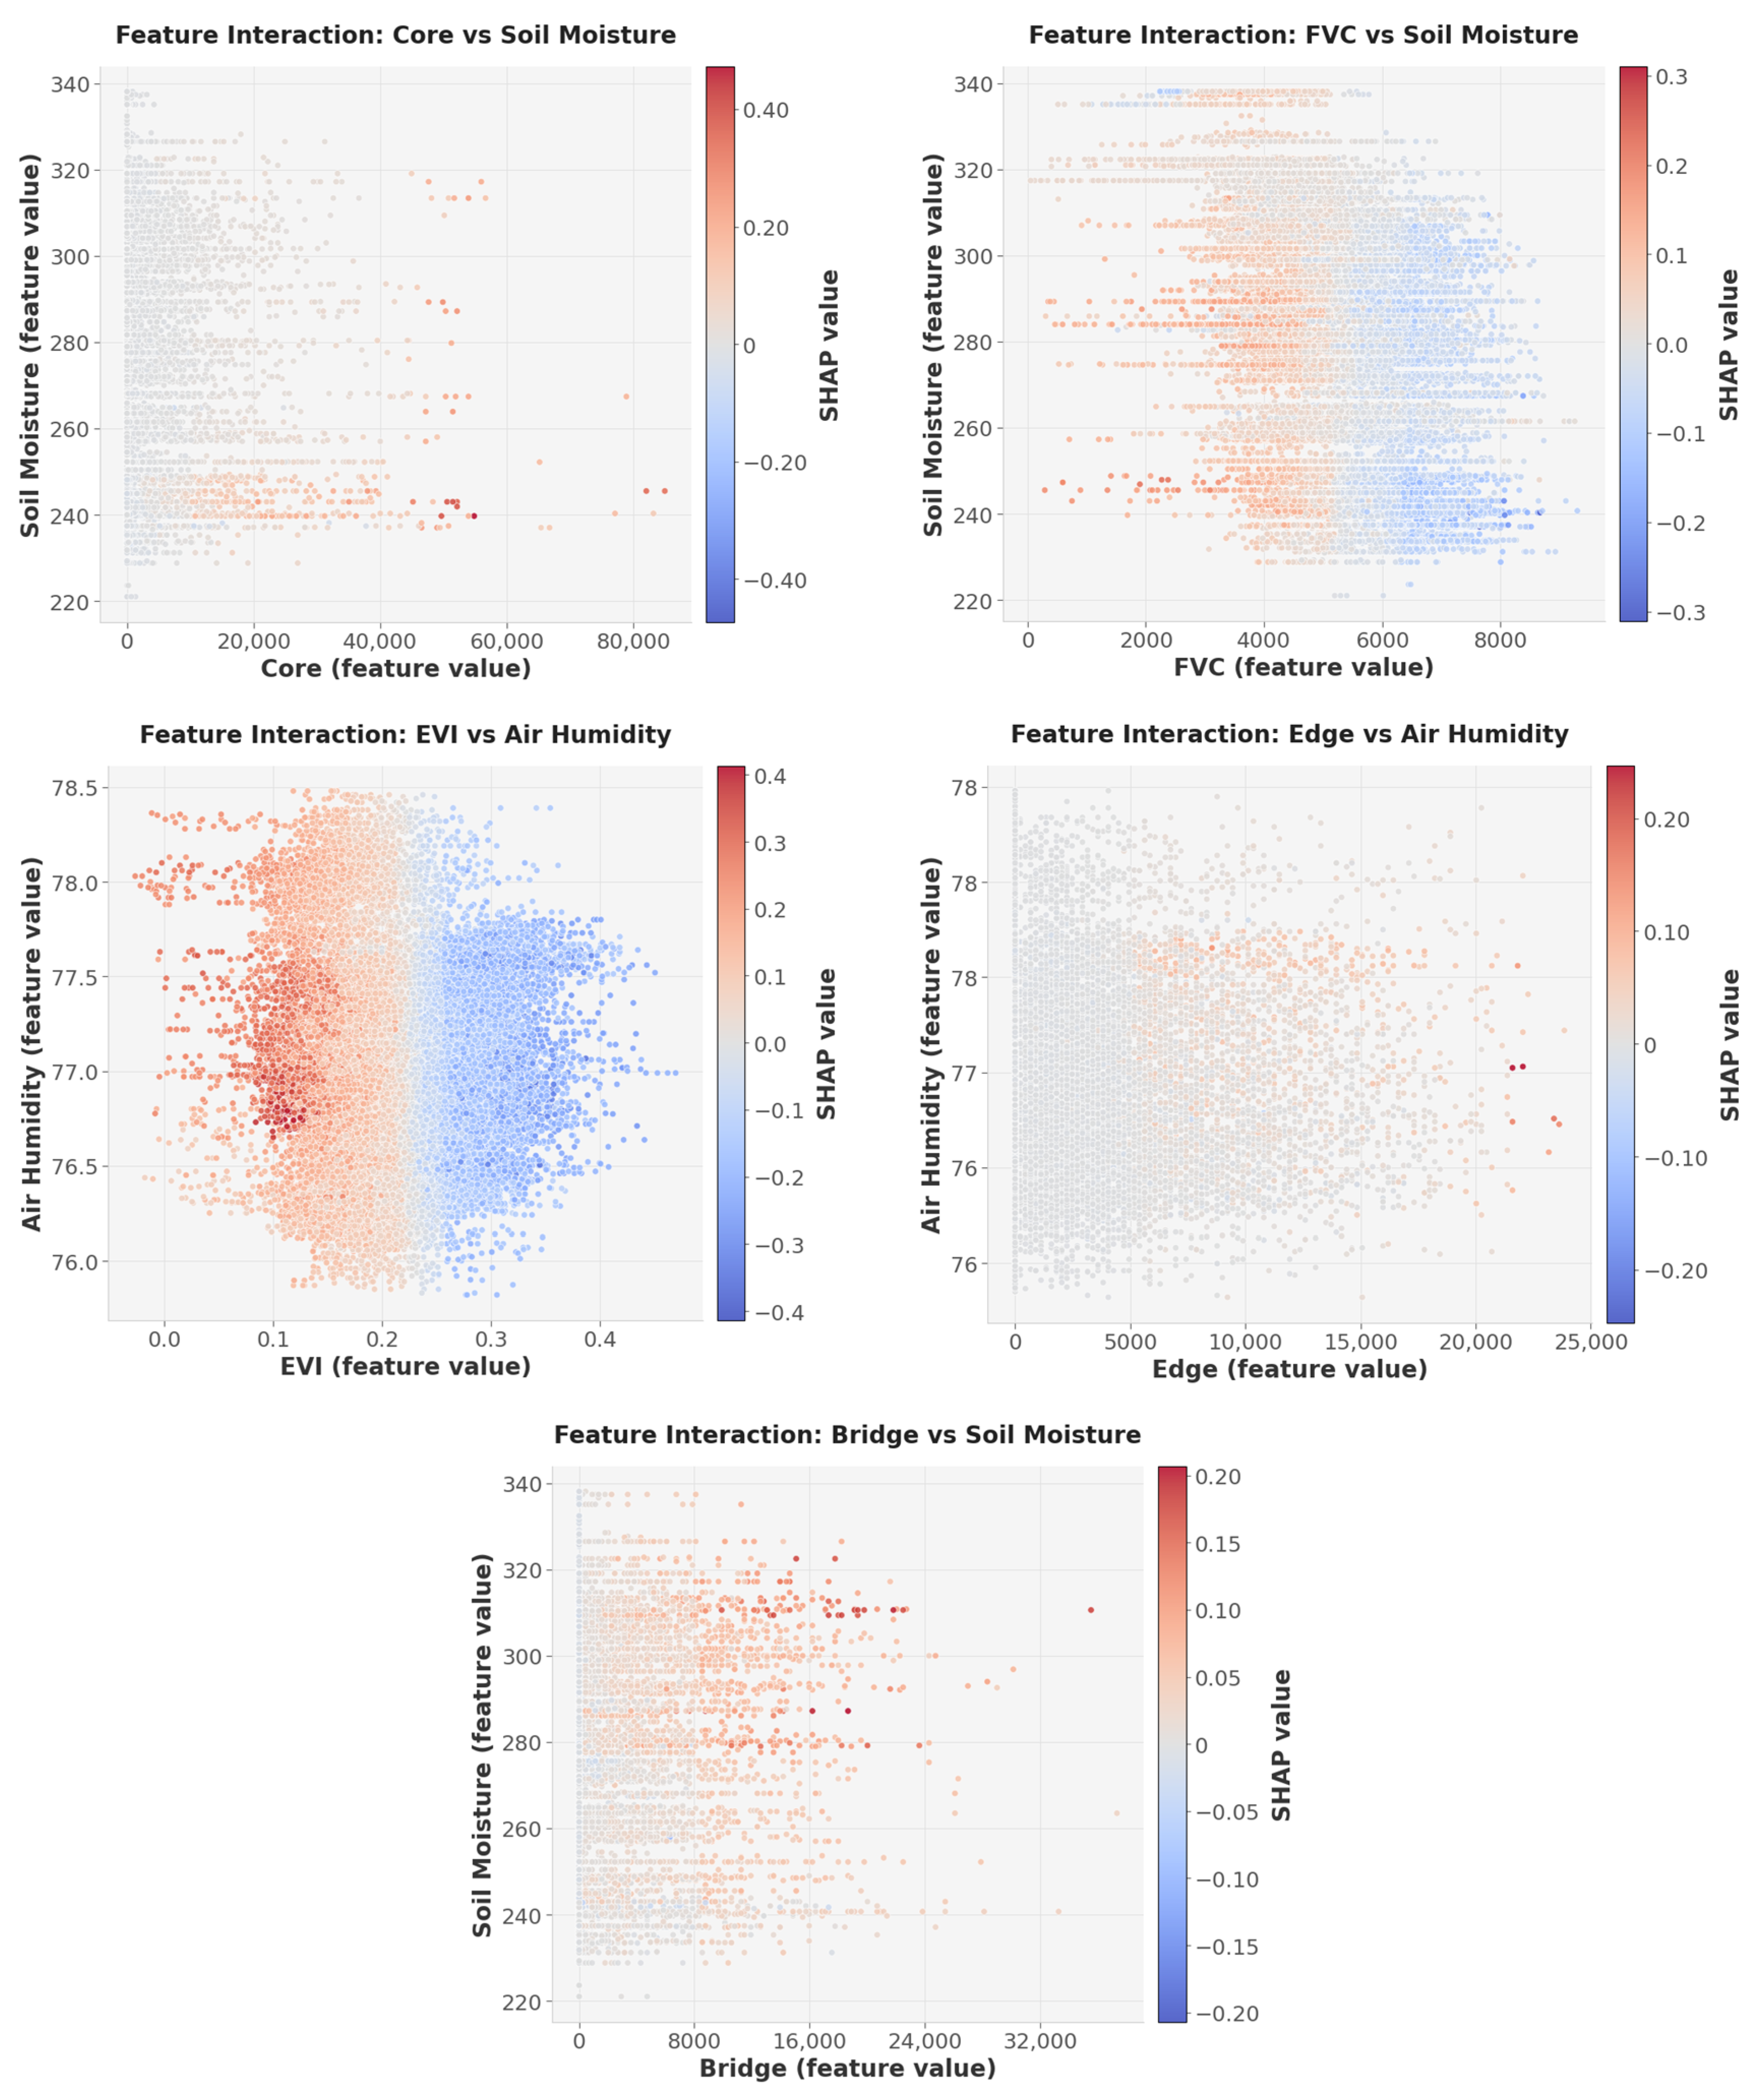
Following the identification of both global and marginal effects of green space elements on Land Surface Temperature (LST), this study further selected the most representative indicator combinations from daytime and night-time models to analyse SHAP interaction effects. The results, presented in Figure 9 and Figure 10, provide deeper insights into the synergistic cooling mechanisms of green space structure and ecological functions within high-density urban environments. This methodology aids in identifying potential complementary relationships and sensitivity thresholds among green space elements, providing scientific grounds for the refined regulation of thermal environments within urban green space systems. The daytime model emphasises interactions between vegetation morphology and ecological factors, including Core × Air Humidity, FVC × Surface Reflectance, EVI × Air Humidity, and FVC × EVI. The night-time model highlights coupling processes between green space morphology and soil moisture, encompassing Core × Soil Moisture, FVC × Soil Moisture, EVI × Air Humidity, Edge × Air Humidity, and Bridge × Soil Moisture.
Figure 9.
Interaction effect diagram of daytime green space variables. Scatter plot colours represent SHAP values, with red indicating high values contributing to warming effects on LST and blue indicating low values contributing to cooling effects. The X-axis and Y-axis denote feature values.
Figure 10.
Interaction effect diagram of nighttime green space variables. Scattered points represent SHAP values, with red indicating high values contributing to warming effects on LST. Blue denotes low values contributing to cooling effects on LST. The X-axis and Y-axis correspond to feature values.
Daytime modelling results indicate a significant interactive effect between green space continuity and local humidity conditions. Within the Core × Air Humidity combination, when air humidity falls within the 76.5–78.0 range and core green space area is below 10,000, SHAP values generally approach zero, suggesting a weaker reduction in LST during this phase. However, as the core green space area exceeded approximately 10,000 m2, the SHAP values began to decline, indicating that larger contiguous green spaces and higher humidity jointly enhance the evaporative cooling effect. The FVC × Surface Reflectance interaction results show the highest SHAP values when surface reflectance is between 0.120–0.150 and FVC is around 4000, indicating this combination contributes most significantly to LST warming. Conversely, SHAP values decrease markedly when FVC is 6000–8000 or 0–2000, reflecting a more pronounced cooling effect. The interaction results for EVI × Air Humidity indicate that the highest SHAP values occur when air humidity is maintained between 76.0–78.5 and EVI is 0.1–0.2, suggesting that within this range, the coupling of vegetation physiological activity with humidity contributes more strongly to LST warming. Conversely, when EVI is excessively low (0.0–0.1) or high (0.2–0.4), SHAP values markedly decrease, exhibiting a stronger cooling effect. This reveals a non-linear regulatory relationship between vegetation activity and air humidity. The FVC × EVI interaction exhibits a banded pattern, with peak SHAP values occurring at FVC approximately 3000–5000 and EVI 0.1–0.3, while values are markedly lower in other intervals.
In the nocturnal model, interactions between green space morphology and environmental factors exhibited pronounced nonlinear characteristics. For the Core × Soil Moisture combination, SHAP values remained within 0–0.2 when Core ranged from 0–2000 and soil moisture from 220–340, lacking low-value points. This indicates limited nocturnal cooling contributions from low-coverage core green spaces. In contrast, the FVC × Soil Moisture combination exhibited higher SHAP values and warming contributions at FVC 0–6000 and soil moisture 240–320. When FVC exceeded 6000 and soil moisture ranged from 240 to 300, SHAP values gradually decreased, indicating that moderate to high-coverage green spaces enhance cooling effects under certain humidity conditions. The EVI × Air Humidity combination exhibits marked dichotomy: positive SHAP values at EVI 0–0.2 and humidity 76.0–78.5 indicate significant warming contribution, whereas negative SHAP values at EVI 0.2–0.4 under identical humidity conditions reflect cooling effects. This demonstrates a non-linear regulatory relationship between nocturnal vegetation activity and air humidity. The Edge × Air Humidity combination predominantly exhibits low SHAP values, with only a few points showing high values. This indicates that the nocturnal cooling effect of edge green spaces is stable but limited in magnitude. The Bridge × Soil Moisture combination displays a gradient characteristic: SHAP values were low within the soil moisture range of 240–320. As Bridge area increased, SHAP values within this range gradually rose (0.0–0.20), suggesting that nocturnal corridor green spaces may contribute to localised warming under suitable humidity and connectivity conditions, though the overall effect remains limited.
4. Discussion
4.1. The Predominant Factors Influencing the Cooling Effect of Green Spaces
This study employs a multi-model comparison and SHAP interpretation framework to systematically elucidate the key drivers of thermal regulation by high-density urban green spaces across diurnal and nocturnal scales. Overall, the regulatory effect of green spaces on Land Surface Temperature (LST) exhibits a complex pattern involving multiple overlapping factors. SHAP analysis indicates that diurnal LST variations are jointly influenced by green space morphology, vegetation physiological characteristics, and environmental conditions, though the dominance of these factors varies significantly. Daytime LST is primarily influenced by surface spectral reflectance, air humidity, and vegetation cover [], whereas night-time LST centres on soil moisture, supplemented by surface reflectance and air humidity. Green space morphology indicators (such as Core, Edge, Bridge) exert relatively limited direct influence on overall LST, yet play auxiliary roles in local microclimate regulation, interactions with environmental factors, and green space connectivity [].
During daylight hours, the surface energy balance is dominated by shortwave radiation input, with vegetation cover (FVC), vegetation activity (EVI), and surface albedo emerging as core influencing factors []. The cooling effect of green spaces primarily relies on evapotranspiration and shading effects []. Moderately covered vegetation can significantly reduce surface temperatures under suitable air humidity conditions. However, excessively high or low vegetation coverage, coupled with highly reflective surfaces, may induce localised heat accumulation, thereby diminishing cooling efficiency. Xu et al. noted that urban green spaces distributed more equitably across areas are more effective in mitigating the urban heat island effect []. Moreover, moderate air humidity enhances vegetation’s evaporative cooling effect, enabling green spaces to exhibit stronger daytime cooling capacity []. Edge and Branch structures extend evaporative cooling by improving air exchange and shadow diffusion, while Bridge corridors potentially mitigate localised heat accumulation through ventilation guidance and warm air dispersion. Overall, daytime thermal mitigation relies not only on green spaces’ ecological functions but also on the rational configuration of contiguous structures and boundary diffusion systems. Planning should prioritise safeguarding vegetation health and enhancing canopy continuity, while integrating edge extension and ventilation guidance to improve cooling spillover efficiency.
At night, urban surface temperature regulation shifts from shortwave radiation dominance to surface heat release and longwave radiation dissipation, significantly elevating the importance of soil moisture and green space structure. Soil moisture becomes a critical factor, as dry soils exhibit weaker thermal conductivity and tend to cool rapidly overnight []. Compared to daytime processes dominated by vegetation transpiration and light energy allocation, the direct influence of nocturnal vegetation activity (EVI, FVC) and surface albedo diminishes []. Nevertheless, these factors exert indirect effects by regulating air humidity, sustaining cooling sources, and influencing thermal diffusion pathways. Concurrently, the spatial configuration of green spaces emerges as a structural determinant of nocturnal cooling efficacy. Extensive, contiguous Core green areas constitute cold air sources that continuously release thermal energy. Research by Doick et al. demonstrates that large-scale green spaces mitigate the urban heat island effect at night [], whilst Bridge and Loop corridors facilitate cold air transport and diffusion []. while small-scale islet green spaces, characterised by open sky views and high boundary ratios, exhibit stronger longwave radiation dissipation due to their morphological features, thereby demonstrating pronounced night-time cooling advantages []. Overall, nocturnal green space planning should prioritise connecting large-scale cooling sources with corridors while incorporating dispersed small green patches to enhance radiative heat dissipation. This establishes a continuous network of cooling islands and multi-tiered cold air transport chains, enabling efficient regulation of the urban nocturnal thermal environment.
4.2. Interaction Effects of Green Space Variables
This study further selected indicators demonstrating significant explanatory contributions within the diurnal and nocturnal models to conduct SHAP interaction analyses, thereby elucidating the mechanisms through which green space morphology and ecological functional factors synergistically regulate the urban thermal environment. Results indicate that the cooling effect of green spaces is not dominated by any single indicator, but rather jointly driven by vegetation physiological functions and spatial structural attributes, exhibiting pronounced diurnal variation characteristics.
Daytime interaction results revealed a pronounced synergistic regulatory mechanism between vegetation functional indicators and green space spatial patterns. The Core × Air Humidity combination yielded low SHAP values when core area was large and air humidity was moderately high, indicating that extensive contiguous green spaces can modulate air humidity [] and synergistically enhance evaporative cooling with moderate humidity conditions. The FVC × Surface Reflectance interaction revealed a strong cooling effect when vegetation canopy cover ranged between 6000–8000 and and surface reflectance within the 0.120–0.155 range, a strong cooling effect emerges. This demonstrates that high-coverage vegetation can counteract the warming effect of reflection through shading and light energy absorption [], whereas low plant coverage results in higher surface albedo, exacerbating the urban heat island effect []. The EVI × Air Humidity results indicate that moderate to high vegetation activity (0.2–0.4) combined with favourable air humidity conditions enhances evapotranspiration cooling; conversely, temperature regulation benefits diminish in low coverage zones []. The FVC × EVI results reflect the regulatory benefits of canopy density and vegetation physiological processes on cooling and humidification. Qin et al. noted that daytime vegetation canopy structure significantly influences cooling and humidification effects [].
Night-time interaction analyses reveal more pronounced interactions between green space form indicators and moisture conditions. In the Core × Soil Moisture interaction, small-scale core green spaces (<2000) exhibit lower SHAP values across all soil moisture ranges, indicating night-time cooling benefits for small-scale green spaces under any soil moisture condition []. Research by Jiao et al. previously indicated that green space patches of a certain size may exhibit higher transpiration rates, thereby mitigating the heat island effect []. The FVC × Soil Moisture results reveal that when FVC > 6000 and Soil Moisture is 240–300, green spaces demonstrate stronger nocturnal heat dissipation and cold storage release capabilities, yielding the most pronounced cooling effect. Conversely, when FVC falls below 6000, high SHAP values indicate that insufficient vegetation scale impedes the efficacy of moisture-based heat dissipation mechanisms, thereby limiting cooling benefits []. The EVI × Air Humidity interaction reveals significant cooling when EVI > 0.2, while cooling weakens when EVI < 0.2. Urban green spaces increase air humidity through physiological activity, enhancing thermal comfort [] and exhibiting pronounced nocturnal cooling effects. Fewer high-value points appear in Edge × Air Humidity and Bridge × Soil Moisture. Under relatively continuous moderate-to-high humidity conditions, increased bridging patch area reduces SHAP values, indicating that nocturnal corridor structures contribute to water-heat retention and cold air flow. This connectivity structure influences diurnal variations in LST [].
4.3. Green Space Construction Planning Recommendations for Cities to Address the Urban Heat Island Effect
Based on this study’s identification of green space cooling mechanisms and their diurnal variations, urban green space development to counteract the urban heat island effect should not be confined to expanding coverage. Instead, emphasis should be placed on the coordinated spatial and temporal allocation of green space types and ecological functions []. Findings indicate that daytime cooling relies on vegetation transpiration and surface radiation regulation, whilst night-time cooling is primarily driven by soil and green space ventilation structures. Consequently, high-density urban green space planning should shift from a ‘quantity-oriented’ to a ‘function-oriented’ approach, prioritising vegetation activity, soil moisture replenishment, and ventilation corridor systems as core design objectives. This activates the urban cooling source function through ecosystem processes.
Spatially, a multi-tiered green space system integrating corridors with core green areas should be established, with rational allocation of green space area and form []. During the day, priority should be given to enhancing green coverage in high-temperature hotspots, combining medium-to-high canopy vegetation with highly reflective surface materials to strengthen radiation reflection and evapotranspiration effects []. At night, focus should shift to optimising green space connectivity by preserving ventilation corridors and encouraging longitudinal cold air transport pathways such as street-front greening and riverine green wedges to enhance cold air diffusion capacity. Core green spaces require maintaining appropriate scale to avoid excessive fragmentation or monotonous vegetation structures; concurrently, introducing vertical greening and rooftop gardens in high-density areas establishes a three-dimensional cooling network.
Ecological management strategies should prioritise vegetation health maintenance and water management. It is recommended to select combinations of locally adapted, high-evapotranspiration tree species and heat-tolerant herbaceous plants. Implement rain gardens, permeable paving, and multi-source water replenishment systems to enhance green space water circulation capacity, thereby improving night-time thermal storage and cooling sustainability. Furthermore, integrating thermal risk monitoring technologies with SHAP threshold identification enables precision-based green space development grounded in heat sensitivity and climate resilience assessments. This facilitates tailored green space strategies for distinct neighbourhoods and functional zones. Through synergistic optimisation of ecosystem processes and urban morphology, multi-temporal and multi-type cooling effects can be achieved, thereby enhancing urban climate resilience and liveability.
4.4. Limitations
Although this study systematically analysed the mechanisms by which green space morphology influences diurnal surface temperatures, it still has certain limitations. The singularity of the study area also limits the generalisability of the conclusions. The current results are based on a case study in a specific climate zone, and the thermal regulation effects of green space morphology may undergo mechanism shifts depending on the climate background (e.g., temperate, arid regions). The absence of cross-regional validation necessitates caution in generalising the conclusions.
Furthermore, LST data and land use data exhibit scale discrepancies. Although these have been unified to a 300 m analysis grid through resampling and spatial aggregation, and validated against existing scale adaptation studies, this may still result in weakened micro-scale thermal heterogeneity signals. Similarly, aggregating MSPA morphological indicators to the same grid scale enhances model stability and statistical consistency, but may dilute local morphological characteristics. In terms of dynamic process analysis, the study did not sufficiently consider the impact of seasonal changes on morphological effects. For example, the morphological-thermal environment relationship of deciduous vegetation in winter may differ significantly from that of evergreen vegetation, and the morphological response mechanisms under extreme weather conditions such as heatwaves have not been addressed.
5. Conclusions
This study focuses on Shanghai’s main urban area, employing Multi-Scale Pattern Analysis (MSPA) to identify seven types of green space morphological units. A diurnal LST prediction system was constructed using LightGBM (daytime) and XGBoost (night-time) models, combined with the SHAP framework to quantify the nonlinear responses and interactive mechanisms of green space morphology, physiological, and physical factors on Land Surface Temperature. The key conclusions are as follows:
- (1)
- Machine learning models accurately reveal urban thermal environment mechanisms.
The LightGBM and XGBoost models achieved high accuracy under diurnal and nocturnal conditions, respectively, demonstrating gradient boosting methods’ suitability for simulating complex urban thermal fields. SHAP explanations revealed multi-factor coupled nonlinear pathways influencing LST, providing a transparent, interpretable analytical framework for identifying green space structural effects and hydrotemperatural processes.
- (2)
- Green spaces exert diurnal variations and structure-dependent influences on LST.
Daytime temperature regulation is primarily governed by albedo, vegetation cover, and air humidity, with evapotranspiration and radiation playing pivotal roles. Night-time cooling is dominated by soil moisture, driven by green space thermal storage and moisture release. Green space morphology contributes to both diurnal and nocturnal temperature regulation, with connectivity and corridor structures forming cold air transport chains that significantly enhance night-time cooling.
- (3)
- Green space indicators exhibit non-linear thresholds and scale effects.
Cooling benefits peak under moderate vegetation activity and soil moisture conditions; excessively high humidity and dense canopy cover may induce evapotranspiration saturation and thermal lag. Core green spaces, corridors, and branching structures demonstrate markedly enhanced cooling capacity upon reaching specific scales or connectivity thresholds, indicating that green space cooling effects depend on morphological matching and structural integrity.
- (4)
- Diurnal variations in urban thermal regulation mechanisms.
Daytime cooling primarily relies on high vegetation cover and elevated surface albedo, mitigating solar shortwave radiation through evapotranspiration cooling and shading to regulate local microclimates. Night-time cooling, however, is dominated by soil thermal storage capacity, green space continuity, and cold air transport pathways. Cooling energy diffuses to surrounding areas via thermal storage, radiation, and ventilation mechanisms, reflecting a shift from local regulation to multi-scale cold source networks.
Overall, this study underscores the importance of transitioning from an ‘area-driven’ approach to a ‘structural-functional synergy’ model for green spaces. It reveals key processes and different strategies for diurnal and nocturnal temperature regulation within high-density urban contexts, providing theoretical support for urban green space planning and thermal risk management.
Author Contributions
Conceptualization, M.S., Y.L., R.C. and K.C.; methodology, R.C. and K.C.; software, M.S.; validation, M.S., Y.L. and X.L.; formal analysis, M.S.; investigation, Y.L. and X.L.; resources, R.C. and K.C.; data curation, M.S. and Y.L.; writing—original draft preparation, M.S. and Y.L.; writing—review and editing, R.C. and K.C.; visualization, M.S. and Y.L.; supervision, R.C. and K.C.; project administration, M.S., K.C. and X.L.; funding acquisition, M.S., Y.L., R.C. and Y.L. All authors have read and agreed to the published version of the manuscript.
Funding
This research was supported by the Fujian Provincial Social Science Foundation Youth Project (Grant No. FJ2024C162), the Educational Science Planning Project of Fujian Agriculture and Forestry University (Grant No. 111423025), the Fujian Provincial Social Science Foundation Youth Project (Grant No. FJ2024C115), the Fujian Provincial Philosophy and Social Science Planning Project(Grant No. FJ2024A015) and Provincial Virtual Simulation Experimental Teaching Project(Grant No. SY2023002).
Institutional Review Board Statement
Not applicable.
Informed Consent Statement
Not applicable.
Data Availability Statement
The raw data supporting the conclusions of this article will be made available by the authors on request.
Conflicts of Interest
The authors declare no conflicts of interest. and The funders had no role in the design of the study; in the collection, analyses, or interpretation of data; in the writing of the manuscript; or in the decision to publish the results.
References
- Lan, F.; Da, H.L.; Wen, H.Z.; Wang, Y. Spatial Structure Evolution of Urban Agglomerations and Its Driving Factors in Mainland China: From the Monocentric to the Polycentric Dimension. Sustainability 2019, 11, 610. [Google Scholar] [CrossRef]
- Luo, H.F.; Wu, J.L. Effects of urban growth on the Land Surface Temperature: A case study in Taiyuan, China. Environ. Dev. Sustain. 2020, 23, 10787–10813. [Google Scholar] [CrossRef]
- Xu, Z.X.; Cai, Z.L.; Su, S.L.; Kang, M.J.; Ge, Y. Unraveling the association between the urban polycentric structure and urban surface thermal environment in urbanizing China. Sustain. Cities Soc. 2022, 76, 103490. [Google Scholar] [CrossRef]
- Ma, X.L.; Peng, S.Y. Assessing the quantitative relationships between the impervious surface area and surface heat island effect during urban expansion. Peerj 2021, 9, e11854. [Google Scholar] [CrossRef]
- Rizwan, A.M.; Dennis, Y.C.L.; Liu, C.H. A review on the generation, determination and mitigation of Urban Heat Island. J. Environ. Sci. 2008, 20, 120–128. [Google Scholar] [CrossRef]
- Huang, H.C.; Deng, X.; Yang, H.L.; Li, S.M.; Li, M.Y. Spatial Evolution of the Effects of Urban Heat Island on Residents’ Health. Teh. Vjesn.-Tech. Gaz. 2020, 27, 1427–1435. [Google Scholar] [CrossRef]
- Liu, S.D.; Zhang, J.J.; Wu, X.; Chen, W.; Zhang, J. Potential thermal constraints for sustainable industrial city: Refined simulation and prediction of extreme urban heat island effect. Sustain. Cities Soc. 2024, 105, 105342. [Google Scholar] [CrossRef]
- He, B.J.; Wang, J.S.; Liu, H.M.; Ulpiani, G. Localized synergies between heat waves and urban heat islands: Implications on human thermal comfort and urban heat management. Environ. Res. 2021, 193, 110584. [Google Scholar] [CrossRef]
- Niu, Z.P.; Fang, X.Y.; Sun, J.; Du, S.; Tang, H.; Shao, W.P.; Chen, T.Y.; Nie, J.; Yu, Z.W.; Yao, X.H.; et al. Exposure to Anthropogenic Heat Was Associated with the Increased Risks of Respiratory Allergy Symptoms in Preschool Children: A New Insight into the Urban Heat Island Effect. Environ. Sci. Technol. 2025, 59, 12060–12073. [Google Scholar] [CrossRef]
- Uriarte-Otazua, U.; Azkorra-Larrinaga, Z.; Varela-Alonso, M.; Gomez-Arriaran, I.; Irulegi-Garmendia, O. Impact of Heat Waves on the Well-Being and Risks of Elderly People Living Alone: Case Study in Urban and Peri-Urban Dwellings in the Atlantic Climate of Spain. Buildings 2025, 15, 2274. [Google Scholar] [CrossRef]
- Hao, M.; Liu, X.; Li, X. Quantifying heat-related risks from urban heat island effects: A global urban expansion perspective. Int. J. Appl. Earth Obs. Geoinf. 2025, 136, 104344. [Google Scholar] [CrossRef]
- Jia, R.Y.; Liu, J.W.; He, T.; Han, D.R.; Xu, X.L.; Liu, L.; Sun, Z.Y.; Qiao, Z. Population heat exposure risk from the perspective of urban heat island spatial expansion in China during 2005–2020. Urban Clim. 2024, 56, 101987. [Google Scholar] [CrossRef]
- Xu, Y.T.; Jia, R.Y.; Liu, J.W.; Han, D.R.; He, T.; Xu, X.L.; Liu, L.; Sun, Z.Y.; Qiao, Z. The population exposure risk of urban heat island effect: From the perspective of urban spatial expansion in China. Build. Environ. 2024, 258, 11565. [Google Scholar] [CrossRef]
- Sun, Y.M.; Augenbroe, G. Urban heat island effect on energy application studies of office buildings. Enegy Build. 2014, 77, 171–179. [Google Scholar] [CrossRef]
- Ying, J.; Zhang, X.J.; Zhang, Y.Q.; Bilan, S. Green infrastructure: Systematic literature review. Econ. Res.-Ekon. Istraz. 2021, 35, 343–366. [Google Scholar] [CrossRef]
- Tzoulas, K.; Korpela, K.; Venn, S.; Yli-Pelkonen, V.; Kazmierczak, A.; Niemela, J.; James, P. Promoting ecosystem and human health in urban areas using Green Infrastructure: A literature review. Landsc. Urban Plan. 2007, 81, 167–178. [Google Scholar] [CrossRef]
- Zepp, H.; Gessner, M.; Gruenhagen, L.; Bührs, M. Modeling the cooling effect of urban green spaces: The neglected control variables of ‘soil moisture’ and ‘biotope types’. Urban For. Urban Green. 2023, 90, 128137. [Google Scholar] [CrossRef]
- Cheng, H.J.; Han, Y.H.; Park, C. Quantitative analysis of differences in cooling effect and efficiency after changes in Green Infrastructure Types (GIT). Sustain. Cities Soc. 2025, 119, 106101. [Google Scholar] [CrossRef]
- Zhao, J.C.; Zhao, X.; Liang, S.L.; Wang, H.Y.; Liu, N.J.; Liu, P.; Wu, D.H. Dynamic Cooling Effects of Permanent Urban Green Spaces in Beijing, China. Remote Sens. 2021, 13, 3282. [Google Scholar] [CrossRef]
- Wu, Q.Y.; Huang, Y.H.; Irga, P.; Kumar, P.; Li, W.G.; Wei, W.; Shon, H.K.; Lei, C.W.; Zhou, J.L. Synergistic control of urban heat island and urban pollution island effects using green infrastructure. J. Environ. Manag. 2024, 370, 122985. [Google Scholar] [CrossRef]
- Zhang, J.X.; Zhao, J.Y.; Pang, B.; Liu, S.S. Calculation of the Optimal Scale of Urban Green Space for Alleviating Surface Urban Heat Islands: A Case Study of Xi’an, China. Land 2024, 13, 1043. [Google Scholar] [CrossRef]
- Moon, S.Y.; Kim, J.; Chong, W.K.O.; Ariaratnam, S.T. Urban Green Space Layouts and Urban Heat Island: Case Study on Apartment Complexes in South Korea. J. Urban Plan. Dev. 2018, 144, 04018004. [Google Scholar] [CrossRef]
- Liu, Q.Y.; Zhang, H.M.; Peng, J.X.; Li, Q.; Liu, T.; Hu, F.; Huang, H.; Shen, Y.P.; Ye, B.J.; Guo, Y.R.; et al. Mitigation strategies for regional heat island effects: Integrated network construction of cold and heat islands. Ecol. Indic. 2025, 176, 113703. [Google Scholar] [CrossRef]
- Xu, H.Z.; Yang, J.F.; Lin, Y.; Xu, N.; Li, M.Z.; Xu, Y.; Liu, X.Z.; Li, F.Y. Construction of a composite cooling network for the mitigation of urban heat risk in Fuzhou. Front. Environ. Sci. 2024, 12, 1462700. [Google Scholar] [CrossRef]
- Ren, S.L.; Huang, Z.; Yin, G.M.; Yan, X.Q.; Dong, Q.H.; Qi, J.N.; Zheng, J.P.; Bao, Y.; Zhang, S.Y. Spatially-optimized greenspace for more effective urban heat mitigation: Insights from regional cooling heterogeneity via explainable machine learning. Landsc. Urban Plan. 2025, 256, 105296. [Google Scholar] [CrossRef]
- Park, J.; Kim, J.H.; Lee, D.K.; Park, C.Y.; Jeong, S.G. The influence of small green space type and structure at the street level on urban heat island mitigation. Urban For. Urban Green. 2017, 21, 203–212. [Google Scholar] [CrossRef]
- Chen, M.; Sun, Y.B.; Yang, B.; Jiang, J.Y. MSPA-based green space morphological pattern and its spatiotemporal influence on Land Surface Temperature. Heliyon 2024, 10, e31363. [Google Scholar] [CrossRef] [PubMed]
- Geng, J.W.; Yu, K.Y.; Sun, M.L.; Xie, Z.; Huang, R.X.; Wang, Y.H.; Zhao, Q.Y.; Liu, J. Construction and Optimisation of Ecological Networks in High-Density Central Urban Areas: The Case of Fuzhou City, China. Remote Sens. 2023, 15, 5666. [Google Scholar] [CrossRef]
- Zou, H.; Wang, X.J. Progress and Gaps in Research on Urban Green Space Morphology: A Review. Sustainability 2021, 13, 1202. [Google Scholar] [CrossRef]
- Lin, J.Y.; Qiu, S.X.; Tan, X.J.; Zhuang, Y.Y. Measuring the relationship between morphological spatial pattern of green space and urban heat island using machine learning methods. Build. Environ. 2023, 228, 109910. [Google Scholar] [CrossRef]
- Zhang, W.L.; Qiu, S.X.; Lin, Z.C.; Chen, Z.X.; Yang, Y.C.; Lin, J.Y.; Li, S.Y. Assessing the influence of green space morphological spatial pattern on urban waterlogging: A case study of a highly-urbanized city. Environ. Res. 2024, 266, 120561. [Google Scholar] [CrossRef] [PubMed]
- Li, C.B.; Lu, L.L.; Fu, Z.T.; Sun, R.H.; Pan, L.Y.; Han, L.Y.; Guo, H.D.; Li, Q.T. Diverse cooling effects of green space on urban heat island in tropical megacities. Front. Environ. Sci. 2022, 10, 1073914. [Google Scholar] [CrossRef]
- Yang, H.; Zeng, H. Impact of Changes in Blue and Green Spaces on the Spatiotemporal Evolution of the Urban Heat Island Effect in Ningbo and Its Implications for Sustainable Development. Sustainability 2025, 17, 4156. [Google Scholar] [CrossRef]
- Sun, X.; Tan, X.Y.; Chen, K.L.; Song, S.; Zhu, X.D.; Hou, D.L. Quantifying landscape-metrics impacts on urban green-spaces and water-bodies cooling effect: The study of Nanjing, China. Urban For. Urban Green. 2017, 55, 126838. [Google Scholar] [CrossRef]
- Han, L.; Zhang, R.J.; Wang, J.Q.; Cao, S.J. Spatial synergistic effect of urban green space ecosystem on air pollution and heat island effect. Urban Clim. 2024, 55, 101940. [Google Scholar] [CrossRef]
- Xu, J.L.; Jin, Y.Y.; Ling, Y.; Sun, Y.Y.; Wang, Y. Exploring the seasonal impacts of morphological spatial pattern of green spaces on the urban heat island. Sustain. Cities Soc. 2025, 125, 106352. [Google Scholar] [CrossRef]
- Guan, Y.J.; Quan, J.L.; Ma, T.; Cao, S.S.; Xu, C.D.; Guo, J.L. Identifying Major Diurnal Patterns and Drivers of Surface Urban Heat Island Intensities across Local Climate Zones. Remote Sens. 2023, 15, 5061. [Google Scholar] [CrossRef]
- Lu, Y.A.; Wang, T.Y.; Huang, C.; Qin, Y.H. Radiation and Temperature of a Tropical Grassland in Summer Times: Experimental Observations. Atmosphere 2023, 14, 649. [Google Scholar] [CrossRef]
- Jiang, S.J.; Lee, X.; Wang, J.K.; Wang, K.C. Amplified Urban Heat Islands during Heat Wave Periods. J. Geophys. Res.-Atmos. 2019, 124, 7797–7812. [Google Scholar] [CrossRef]
- Aleksandrowicz, O.; Pearlmutter, D. The significance of shade provision in reducing street-level summer heat stress in a hot Mediterranean climate. Landsc. Urban Plan. 2022, 229, 104588. [Google Scholar] [CrossRef]
- Chen, B.; Kong, F.H.; Yin, H.W.; Middel, A.; Zhou, K.J.; Li, Z.Y. Advancing urban shade mapping for planning: Integrating shade demand and greening potential. Urban For. Urban Green. 2025, 111, 128888. [Google Scholar] [CrossRef]
- Song, L.; Tang, Z.H.; Zhang, X.Y.; Wang, Z.X.; Hong, B. Assessing effects of seasonal variations in 3D canopy structure characteristics on thermal comfort in urban parks. Urban For. Urban Green. 2025, 112, 128901. [Google Scholar] [CrossRef]
- Kong, J.; Zhao, Y.L.; Strebel, D.; Gao, K.; Carmeliet, J.; Lei, C.W. Understanding the impact of heatwave on urban heat in greater Sydney: Temporal surface energy budget change with land types. Sci. Total Environ. 2023, 903, 166374. [Google Scholar] [CrossRef] [PubMed]
- Meng, F.; Yan, S.L.; Tian, G.H.; Wang, Y.D. Surface urban heat island effect and its spatiotemporal dynamics in metropolitan area: A case study in the Zhengzhou metropolitan area, China. Front. Environ. Sci. 2023, 11, 1247046. [Google Scholar] [CrossRef]
- Chevance, G.; Minor, K.; Vielma, C.; Campi, E.; O’Callaghan-Gordo, C.; Basagaña, X.; Ballester, J.; Bernard, P. A systematic review of ambient heat and sleep in a warming climate. Sleep Med. Rev. 2024, 75, 101915. [Google Scholar] [CrossRef]
- Jato-Espino, D.; Manchado, C.; Roldan-Valcarce, A.; Moscardo, V. ArcUHI: A GIS add-in for automated modelling of the Urban Heat Island effect through machine learning. Urban Clim. 2022, 44, 101203. [Google Scholar] [CrossRef]
- Mutani, G.; Scalise, A.; Sufa, X.; Grasso, S. Synergising Machine Learning and Remote Sensing for Urban Heat Island Dynamics: A Comprehensive Modelling Approach. Atmosphere 2024, 15, 1435. [Google Scholar] [CrossRef]
- Tanoori, G.; Soltani, A.; Modiri, A. Machine Learning for Urban Heat Island (UHI) Analysis: Predicting Land Surface Temperature (LST) in Urban Environments. Urban Clim. 2024, 55, 101962. [Google Scholar] [CrossRef]
- Liu, Q.Q.; Hang, T.; Wu, Y.F. Unveiling differential impacts of multidimensional urban morphology on heat island effect across local climate zones: Interpretable CatBoost-SHAP machine learning model. Build. Environ. 2025, 270, 112574. [Google Scholar] [CrossRef]
- Bushenkova, A.; Soares, P.M.M.; Johannsen, F.; Lima, D.C.A. Towards an improved representation of the urban heat island effect: A multi-scale application of XGBoost for madrid. Urban Clim. 2024, 55, 101982. [Google Scholar] [CrossRef]
- Zhong, Q.K.; Li, Z.; Zhu, J.W.; Yuan, C. Revealing multiscale and nonlinear effects of urban green spaces on heat islands in high-density cities: Insights from MSPA and machine learning. Sustain. Cities Soc. 2025, 120, 106173. [Google Scholar] [CrossRef]
- Ming, Y.J.; Liu, Y.; Li, Y.P.; Song, Y.Z. Unraveling nonlinear and spatial non-stationary effects of urban form on surface urban heat islands using explainable spatial machine learning. Comput. Environ. Urban Syst. 2024, 114, 102200. [Google Scholar] [CrossRef]
- Li, Y.Y.; Zhang, H.S.; Lin, Y.Y.; Ling, J.; Xue, H.Y.; Guo, P.Z. Precise mitigation strategies for urban heat island effect in Hong Kong’s new towns using automated machine learning. Sustain. Cities Soc. 2025, 125, 106350. [Google Scholar] [CrossRef]
- Lin, L.G.; Zhao, Y.L.; Zhao, J.C.; Wang, D. Comprehensively assessing seasonal variations in the impact of urban greenspace morphology on urban heat island effects: A multidimensional analysis. Sustain. Cities Soc. 2024, 118, 106014. [Google Scholar] [CrossRef]
- Lin, L.G.; Zhao, Y.L.; Zhao, J.C. Optimizing urban green space spatial patterns for thermal environment improvement: A multi-objective approach in the context of urban renewal. Comput. Environ. Urban Syst. 2025, 121, 102320. [Google Scholar] [CrossRef]
- Liu, D.; Zhou, R.; Ma, Q.; He, T.X.; Fang, X.N.; Xiao, L.S.; Hu, Y.N.; Li, J.; Shao, L.; Gao, J. Spatio-temporal patterns and population exposure risks of urban heat island in megacity Shanghai, China. Sustain. Cities Soc. 2024, 108, 105500. [Google Scholar] [CrossRef]
- Zhao, M.Y.; Cai, H.Y.; Qiao, Z.; Xu, X.L. Influence of urban expansion on the urban heat island effect in Shanghai. Int. J. Geogr. Inf. Sci. 2016, 30, 2421–2441. [Google Scholar] [CrossRef]
- Zhang, H.; Qi, Z.F.; Ye, X.Y.; Cai, Y.B.; Ma, W.C.; Chen, M.N. Analysis of land use/land cover change, population shift, and their effects on spatiotemporal patterns of urban heat islands in metropolitan Shanghai, China. Appl. Geogr. 2013, 44, 121–133. [Google Scholar] [CrossRef]
- Zhang, K.X.; Wang, R.; Shen, C.C.; Da, L.J. Temporal and spatial characteristics of the urban heat island during rapid urbanization in Shanghai, China. Environ. Monit. Assess. 2010, 169, 101–112. [Google Scholar] [CrossRef] [PubMed]
- Yu, Q.; Wang, L.; Pan, S.; Chen, M. Spatiotemporal Characterization of Atmospheric Emissions from Heavy-Duty Diesel Trucks on Port-Connected Expressways in Shanghai. Atmosphere 2025, 16, 1183. [Google Scholar] [CrossRef]
- Wikipedia Contributors. G1503 Shanghai Ring Expressway. Wikipedia, The Free Encyclopedia. Available online: https://en.wikipedia.org/wiki/G1503_Shanghai_Ring_Expressway (accessed on 1 November 2025).
- Li, Z.H.; He, W.; Cheng, M.F.; Hu, J.X.; Yang, G.Y.; Zhang, H.Y. SinoLC-1: The first 1 m resolution national-scale land-cover map of China created with a deep learning framework and open-access data. Earth Syst. Sci. Data 2023, 15, 4749–4780. [Google Scholar] [CrossRef]
- Riitters, K.H.; Vogt, P.; Soille, P.; Kozak, J.; Estreguil, C. Neutral model analysis of landscape patterns from mathematical morphology. Landsc. Ecol. 2007, 22, 1033–1043. [Google Scholar] [CrossRef]
- Vogt, P.; Riitters, K.H.; Estreguil, C.; Kozak, J.; Wade, T.G. Mapping spatial patterns with morphological image processing. Landsc. Ecol. 2007, 22, 171–177. [Google Scholar] [CrossRef]
- Riitters, K.; Vogt, P.; Soille, P.; Estreguil, C. Landscape patterns from mathematical morphology on maps with contagion. Landsc. Ecol. 2009, 24, 699–709. [Google Scholar] [CrossRef]
- Wu, B.; Bao, Y.; Wang, Z.T.; Chen, X.T.; Wei, W.F. Multi-temporal evaluation and optimization of ecological network in multi-mountainous city. Ecol. Indic. 2023, 146, 109794. [Google Scholar] [CrossRef]
- Zhang, Y.Q.; Zhu, X.; Guo, Z. How do urban green space designs shape avian communities: Optimizing distribution, size and shape. J. Environ. Manag. 2025, 389, 126131. [Google Scholar] [CrossRef]
- Ferrari, B.; Quatrini, V.; Barbati, A.; Corona, P.; Masini, M.; Russo, D. Conservation and enhancement of the green infrastructure as a nature-based solution for Rome’s sustainable development. Urban Ecosyst. 2019, 22, 865–878. [Google Scholar] [CrossRef]
- Jiang, F.; Liu, S.H.; Yuan, H.; Zhang, Q. Measuring urban sprawl in Beijing with geo-spatial indices. J. Geogr. Sci. 2007, 17, 469–478. [Google Scholar] [CrossRef]
- Zhou, X.; Wang, T.; Zhang, X.M.; Bao, Y.; Wu, J.; Chen, X.Z.; Lu, Y.L.; Zhou, G.Q. Assessing carbon sink potentials in the built environment: A study of 40 Chinese cities using a bottom-up high-resolution approach. J. Clean. Prod. 2025, 519, 146058. [Google Scholar] [CrossRef]
- Fabra-Boluda, R.; Ferri, C.; Hernández-Orallo, J.; Ramírez-Quintana, M.; Martínez-Plumed, F. Cracking black-box models: Revealing hidden machine learning techniques behind their predictions. Intell. Data Anal. 2025, 29, 28–44. [Google Scholar] [CrossRef]
- Taleghani, M. The impact of increasing urban surface albedo on outdoor summer thermal comfort within a university campus. Urban Clim. 2018, 24, 175–184. [Google Scholar] [CrossRef]
- Phompila, C.; Lewis, M.; Ostendorf, B.; Clarke, K. MODIS EVI and LST Temporal Response for Discrimination of Tropical Land Covers. Remote Sens. 2015, 7, 6026–6040. [Google Scholar] [CrossRef]
- Jang, S.; Jung, J. Urban form and green space structure as drivers of urban heat mitigation. Sustain. Cities Soc. 2025, 130, 106597. [Google Scholar] [CrossRef]
- Sun, D.L.; Pinker, R.T. Case Study of Soil Moisture Effect on Land Surface Temperature Retrieval. IEEE Geosci. Remote Sens. Lett. 2004, 1, 127–130. [Google Scholar] [CrossRef]
- Bounoua, L.; DeFries, R.; Collatz, G.J.; Sellers, P.; Khan, H. Effects of land cover conversion on surface climate. Clim. Change 2002, 52, 29–64. [Google Scholar] [CrossRef]
- Maimaitiyiming, M.; Ghulam, A.; Tiyip, T.; Pla, F.; Latorre-Carmona, P.; Halik, Ü.; Sawut, M.; Caetano, M. Effects of green space spatial pattern on Land Surface Temperature: Implications for sustainable urban planning and climate change adaptation. Isprs J. Photogramm. Remote Sens. 2014, 89, 59–66. [Google Scholar] [CrossRef]
- Collatz, G.J.; Bounoua, L.; Los, S.O.; Randall, D.A.; Fung, I.Y.; Sellers, P.J. A mechanism for the influence of vegetation on the response of the diurnal temperature range to changing climate. Geophys. Res. Lett. 2000, 27, 3381–3384. [Google Scholar] [CrossRef]
- Winbourne, J.B.; Jones, T.S.; Garvey, S.M.; Harrison, J.L.; Wang, L.; Li, D.; Templer, P.H.; Hutyra, L.R. Tree Transpiration and Urban Temperatures: Current Understanding, Implications, and Future Research Directions. Bioscience 2020, 70, 576–588. [Google Scholar] [CrossRef]
- Xu, C.; Huang, Q.Y.; Haase, D.; Dong, Q.; Teng, Y.M.; Su, M.R.; Yang, Z.F. Cooling Effect of Green Spaces on Urban Heat Island in a Chinese Megacity: Increasing Coverage versus Optimizing Spatial Distribution. Environ. Sci. Technol. 2024, 58, 5811–5820. [Google Scholar] [CrossRef]
- Meili, N.; Manoli, G.; Burlando, P.; Carmeliet, J.; Chow, W.T.L.; Coutts, A.M.; Roth, M.; Velasco, E.; Vivoni, E.R.; Fatichi, S. Tree effects on urban microclimate: Diurnal, seasonal, and climatic temperature differences explained by separating radiation, evapotranspiration, and roughness effects. Urban For. Urban Green. 2021, 58, 126970. [Google Scholar] [CrossRef]
- Spronken-Smith, R.A.; Oke, T.R. The thermal regime of urban parks in two cities with different summer climates. Int. J. Remote Sens. 1998, 19, 2085–2104. [Google Scholar] [CrossRef]
- Yang, Q.Q.; Huang, X.; Tong, X.H.; Xiao, C.J.; Yang, J.; Liu, Y.; Cao, Y.X. Global assessment of urban trees’ cooling efficiency based on satellite observations. Environ. Res. Lett. 2022, 17, 034029. [Google Scholar] [CrossRef]
- Doick, K.J.; Peace, A.; Hutchings, T.R. The role of one large greenspace in mitigating London’s nocturnal urban heat island. Sci. Total Environ. 2014, 493, 662–671. [Google Scholar] [CrossRef]
- Narita, K.; Sugawara, H. Cold-air Seeping-out Phenomena in an Urban Green Space. J. Geogr.-Chigaku Zasshi 2011, 120, 411–425. [Google Scholar] [CrossRef]
- Liu, C.; Ouyang, X.Y.; Yang, J.X.; Gunasekera, D.; Weng, Q.H.; Zhao, X.S.; Sun, Z.C. Assessing the impact of urban block-scale landscape features on the diurnal cooling of green spaces using SDGSAT-1. Ecol. Indic. 2025, 178, 113937. [Google Scholar] [CrossRef]
- Zhang, Z.; Lv, Y.M.; Pan, H.T. Cooling and humidifying effect of plant communities in subtropical urban parks. Urban For. Urban Green. 2013, 12, 323–329. [Google Scholar] [CrossRef]
- Lin, B.S.; Lin, Y.J. Cooling Effect of Shade Trees with Different Characteristics in a Subtropical Urban Park. Hortscience 2010, 45, 83–86. [Google Scholar] [CrossRef]
- Proutsos, N.D.; Solomou, A.D.; Stefanidis, S.P. From Bare Soil to Green Infrastructure: Micrometeorological Benefits from the Restoration of a Small Urban Park in a Mediterranean City. Land 2025, 14, 1681. [Google Scholar] [CrossRef]
- Wei, J.X.; Li, H.B.; Wang, Y.C.; Xu, X.Z. The Cooling and Humidifying Effects and the Thresholds of Plant Community Structure Parameters in Urban Aggregated Green Infrastructure. Forests 2021, 12, 111. [Google Scholar] [CrossRef]
- Qin, Z.; Li, Z.D.; Cheng, F.Y.; Chen, J.F.; Liang, B. Influence of canopy structural characteristics on cooling and humidifying effects of Populus tomentosa community on calm sunny summer days. Landsc. Urban Plan. 2014, 127, 75–82. [Google Scholar] [CrossRef]
- Chen, B.Y.; Wang, W.W.; You, Y.C.; Zhu, W.X.; Dong, Y.T.; Xu, Y.P.; Chang, M.; Wang, X.M. Influence of rooftop mitigation strategies on the thermal environment in a subtropical city. Urban Clim. 2023, 49, 101450. [Google Scholar] [CrossRef]
- Jiao, M.; Zhou, W.Q.; Zheng, Z.; Wang, J.; Qian, Y.G. Patch size of trees affects its cooling effectiveness: A perspective from shading and transpiration processes. Agric. For. Meteorol. 2017, 247, 293–299. [Google Scholar] [CrossRef]
- Yu, Z.W.; Chen, J.Q.; Chen, J.K.; Zhan, W.F.; Wang, C.H.; Ma, W.J.; Yao, X.H.; Zhou, S.Q.; Zhu, K.; Sun, R.H. Enhanced observations from an optimized soil-canopy-photosynthesis and energy flux model revealed evapotranspiration-shading cooling dynamics of urban vegetation during extreme heat. Remote Sens. Environ. 2024, 305, 114098. [Google Scholar] [CrossRef]
- Kuang, W.H. Seasonal Variation in Air Temperature and Relative Humidity on Building Areas and in Green Spaces in Beijing, China. Chin. Geogr. Sci. 2020, 30, 75–88. [Google Scholar] [CrossRef]
- Sun, R.H.; Xie, W.; Chen, L.D. A landscape connectivity model to quantify contributions of heat sources and sinks in urban regions. Landsc. Urban Plan. 2018, 178, 43–50. [Google Scholar] [CrossRef]
- Li, H.W.; Meng, H.D.; He, R.Z.; Lei, Y.K.; Guo, Y.C.; Ernest, A.A.; Jombach, S.; Tian, G.H. Analysis of Cooling and Humidification Effects of Different Coverage Types in Small Green Spaces (SGS) in the Context of Urban Homogenization: A Case of HAU Campus Green Spaces in Summer in Zhengzhou, China. Atmosphere 2020, 11, 862. [Google Scholar] [CrossRef]
- Naeem, S.; Cao, C.X.; Qazi, W.A.; Zamani, M.; Wei, C.; Acharya, B.K.; Rehman, A.U. Studying the Association between Green Space Characteristics and Land Surface Temperature for Sustainable Urban Environments: An Analysis of Beijing and Islamabad. ISPRS Int. J. Geo-Inf. 2018, 7, 38. [Google Scholar] [CrossRef]
- Akbari, H.; Pomerantz, M.; Taha, H. Cool surfaces and shade trees to reduce energy use and improve air quality in urban areas. Sol. Energy 2001, 70, 295–310. [Google Scholar] [CrossRef]
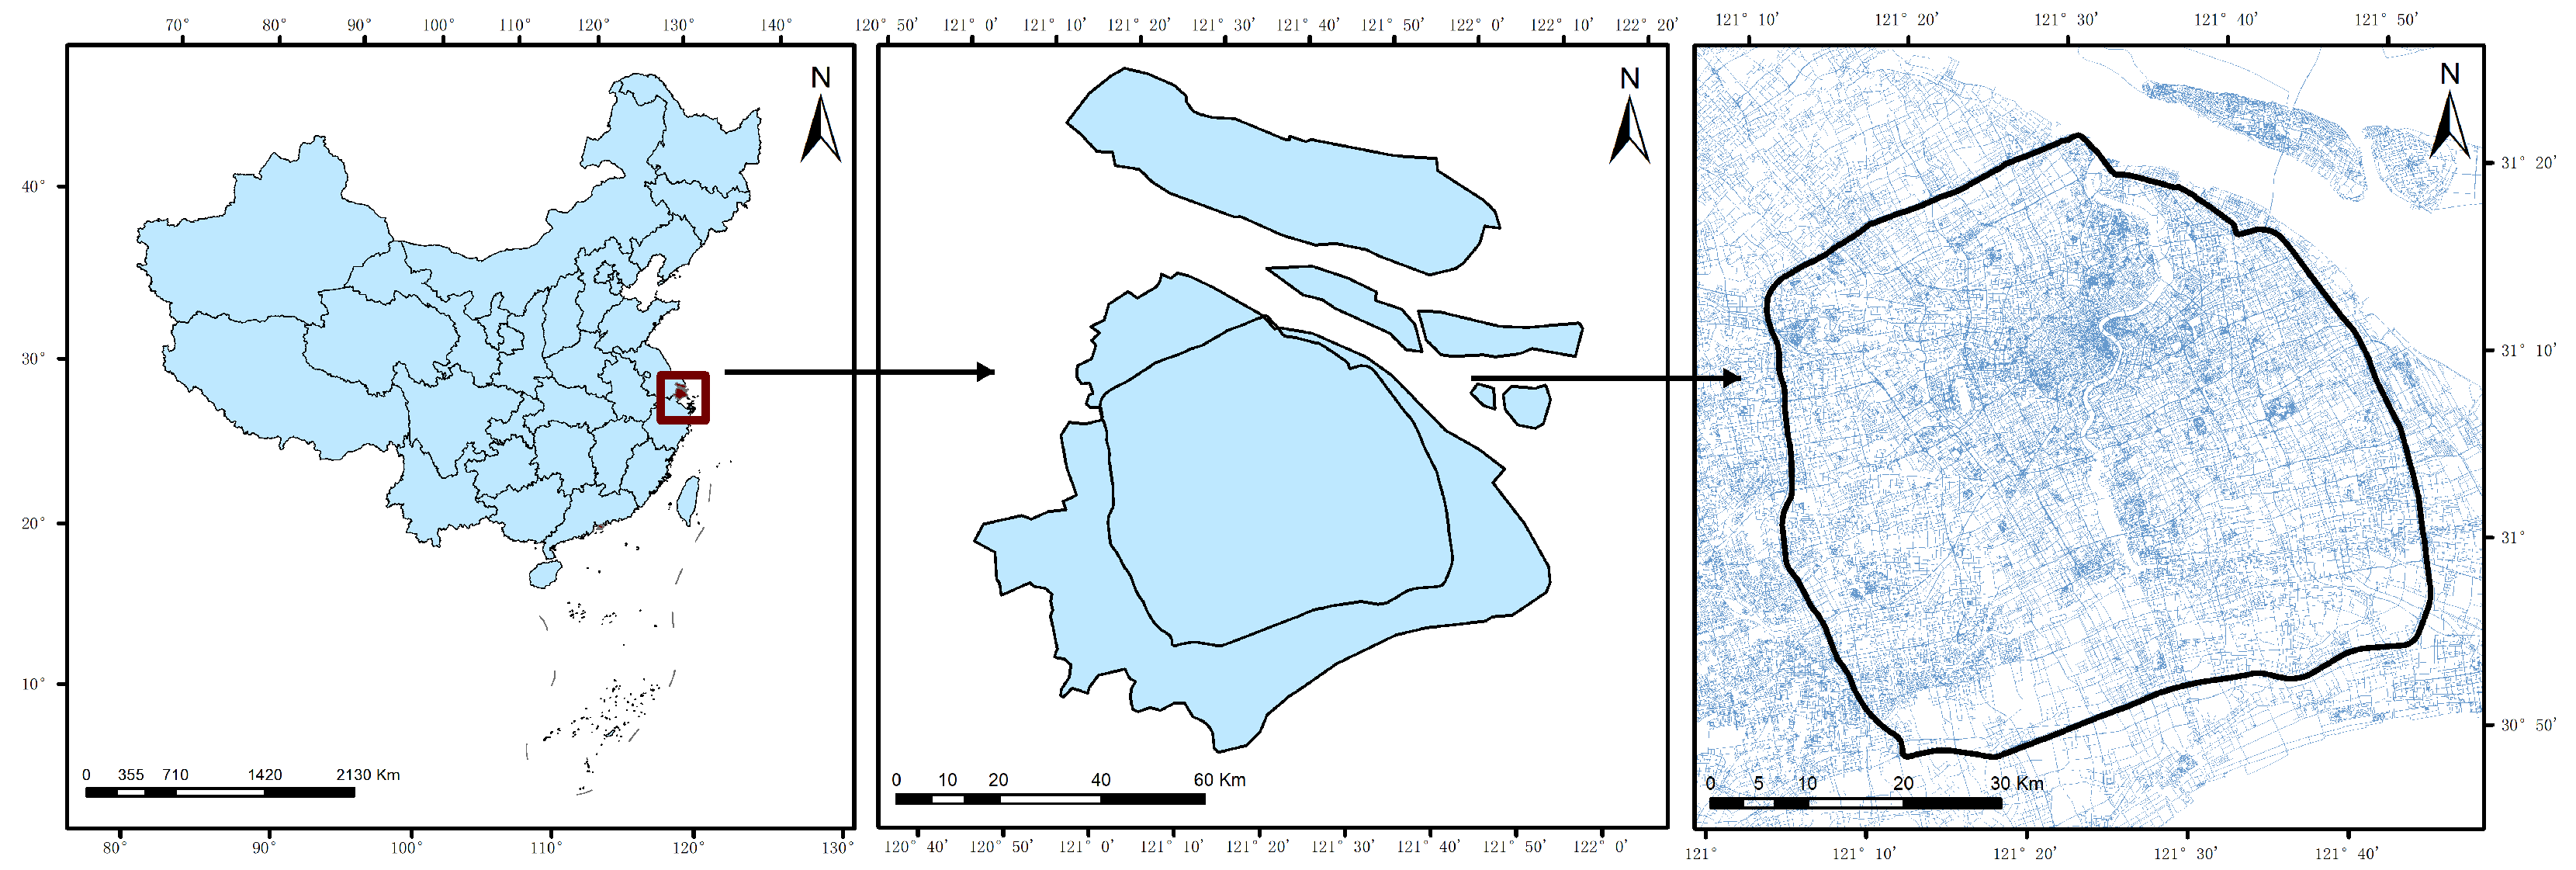
Disclaimer/Publisher’s Note: The statements, opinions and data contained in all publications are solely those of the individual author(s) and contributor(s) and not of MDPI and/or the editor(s). MDPI and/or the editor(s) disclaim responsibility for any injury to people or property resulting from any ideas, methods, instructions or products referred to in the content. |
© 2025 by the authors. Licensee MDPI, Basel, Switzerland. This article is an open access article distributed under the terms and conditions of the Creative Commons Attribution (CC BY) license (https://creativecommons.org/licenses/by/4.0/).