Article

Sediment Quality in an Anthropogenically Disturbed Shallow Lake: A Case Study of Baiyangdian Lake

1
Beijing Capital Eco-Environment Protection Group Co., Ltd., Block 6, No. 21 Chegongzhuang Avenue, Xicheng District, Beijing 100044, China
2
Center for Water Research, Beijing Normal University, Zhuhai 519087, China
*
Author to whom correspondence should be addressed.
Sustainability 2025, 17(22), 10184; https://doi.org/10.3390/su172210184
Submission received: 15 September 2025 / Revised: 1 November 2025 / Accepted: 6 November 2025 / Published: 14 November 2025

Abstract

We determined the total nitrogen (TN), total phosphorus (TP), total carbon (TC), and organic matter concentrations in sediments from surface water, waterways, ditches, swamps, and ponds of Baiyangdian Lake (BYDL), and investigated the spatial distribution, properties, and sources of the sediments. The TN, TP, TC, and OM concentrations in the sediments averaged 3677.21 ± 3686.15 mg/kg, 2038.25 ± 1190.87 mg/kg, 45,742.76 ± 29,535.23 mg/kg, and 12.05% ± 6.80%, respectively, and the concentrations were higher in the surface sediment (0–10 cm) than in the deeper sediment. We found that the TN and TP single evaluation indices at 0–10 cm averaged 5.61 and 2.18, respectively, indicating severe TN and TP pollution. The comprehensive pollution index averaged 4.80, and more than 87% of the sampling points were severely polluted. The organic and organic nitrogen (N) indices showed that 92.82% and 93.65% of the sites were polluted with organic matter and organic N, respectively. According to the C/N and C/P ratios, the organic matter and in the surface sediments was mainly from cellulose plant debris and phytoplankton. Of the correlations between the sediment properties, OM and TN were most strongly correlated, which indicates that the OM mineralization was closely related to the N source and migration. The findings of this study serve as crucial baseline data for the governance of BYDL, providing a vital data foundation for the systematic management of its water eco-environment.

1. Introduction

Total nitrogen (TN), total phosphorus (TP), and organic matter (OM) are the main indicators of eutrophication in water bodies. Lake sediments have a strong influence on pollutant transport and nutrient cycling and transformations in lakes [1]. Sediments change from being sinks to sources when they accumulate excessive amounts of nutrients such as carbon (C), nitrogen (N), and phosphorus (P). The nutrient salt concentrations in sediments can indirectly reflect the overall pollution level of a lake [2,3]. When the redox potential conditions in sediments change, OM will mineralize, nitrogen (N) and phosphorus (P) will be released, and dissolved oxygen in the water will be consumed, causing secondary pollution in the water body [4,5]. Freshwater eutrophication is mainly caused by nutrients such as N and P [6,7]. Most of the P in lake ecosystems is usually stored in bottom sediments, and P cycling from sediments into water bodies can negatively impact on the water quality [8]. Furthermore, N and P are essential for primary productivity in lakes and are key contributors to cyanobacterial outbreaks in lakes. Therefore, it is useful to evaluate the pollution status, eutrophication degree, and ecosystem status of a lake from the concentrations and distributions of N, P, and OM in lake sediments.
Baiyangdian Lake (BYDL) is an important water feature in China’s Xiongan New Area, and is crucial for maintaining the ecological balance of the area [9]. In recent years, the water quality indicators in BYDL, such as ammonia nitrogen, chemical oxygen demand (COD), and TP, have considerably improved through source control and water replenishment measures. Studies have reported that the sediments are polluted by both P and N, posing potential risks to the ecosystem [10,11]. The findings of the Baiyangdian Baseline Survey Project showed that the growth processes of aquatic plants in BYDL have caused a serious swamping problem, and, with 37% of the area swamped, swamping is a major contributor to the degradation of the lake ecosystem. A comprehensive study of the sediment pollution and consequent risks to the ecology of BYDL is needed as it will provide a reference for managing the sediment quality, controlling endogenous pollution across the entire region, and restoring the water ecosystem. It will also establish a baseline for developing a comprehensive endogenous dredging strategy for BYDL, to guide dredging projects that are scientifically and practically significant.
In this study, we conducted one of the most extensive sediment surveys in BYDL to date, with 513 sampling sites across five aquatic environments. By integrating multiple pollution indices and analyzing sediment sources, we provide a scientifically grounded basis for developing targeted and sustainable management strategies, particularly in the context of ongoing restoration efforts in the Xiongan New Area. Across the entire BYDL area, we (1) examined the spatial and vertical distribution characteristics of N, P, and OM in the sediments across distinct aquatic environments; (2) evaluated the sediment nutrient status and distinguished between natural accumulation processes and anthropogenic pollution pressures; and (3) identified the potential sources of sedimentary OM and nutrients. This comprehensive assessment aims to provide a scientifically grounded basis for developing targeted management strategies that consider both ecosystem protection and pollution control, particularly in the context of ongoing restoration efforts in the Xiongan New Area.

2. Materials and Methods

2.1. Overview of Baiyangdian Lake and Sample Collection

Baiyangdian Lake (38°43′–39°02′ N, 115°38′–116°07′ E) has a total area of about 366 km2 and is part of the Daqing River system, which in turn is part of the Haihe River Basin. The main land use types in the BYDL catchment area include water, farmland, forest grassland, grassland, and villages. Baiyangdian Lake is in the eastern monsoon zone and has a warm temperate, semi-arid climate and an average annual rainfall of 552.7 mm. Eight rivers, namely the Baigouyin, Ping, Bao, Fu, Tang, Zhulong, Xiaoyi, and Cao Rivers, flow into the lake [12]. For this study, we studied sediments from five different water environments in BYDL, including open surface water, watercourses, ditches, marshes, and reservoirs.
The sampling points were arranged as shown in Figure 1, in line with the characteristics of the BYDL water environments. We chose a total of 513 sampling sites, including 148 open water sites, 204 watercourse sites (rivers or channels used for shipping), 92 sites in ditches (located between reed terraces), 21 marsh sites (overpopulated with aquatic plants and shallow lakes that have become swamps), and 48 pond sites (man-made fish ponds built using dykes). Sediment column samples that were 6.3 cm in diameter and 60 cm long (Corer 60, Uwitec, Austria) were collected in August and September 2020. Once collected, the sediment core samples were sliced into layers at depths of 0–5 cm, 6–10 cm, 11–20 cm, 21–30 cm, and 31–40 cm in the sediment profile. The core section samples were stored in polyethylene #7 self-sealing bags in a car refrigerator at 4 °C and transported to the laboratory for analysis.

2.2. Sample Analysis

Sediment samples were freeze-dried, ground, homogenized, and passed through a 100-mesh sieve. The dried samples were then placed into polypropylene bags that were sealed and stored at −20 °C. The samples were analyzed within 4 weeks. The TP concentrations in the sediments were determined as outlined in the national standard for alkali fusion-molybdenum antimony anti-spectrophotometry (HJ 632-2011) after ashing at 500 °C (2 h) and extracting with 1 mol L−1 HCl (16 h) [13]. The total carbon (TC) and TN concentrations in the sediments were determined using an element analyzer (Vario EL III, Elementar, GRE). The freeze-dried sediment samples (1.0 g) were burned in a muffle furnace at 550 °C for 3 h. The OM concentrations were taken as the mass difference using the loss-on-ignition method [14]. The iron (Fe), manganese (Mn), and aluminum (Al) concentrations in the sediments were determined using inductively coupled plasma optical emission spectrometry (ICP-OES) (PerkinElmer, USA) after microwave digestion (CEM Mars, Matthews, NC, USA).

2.3. Evaluation Methods

(1)
Comprehensive Pollution Index
To determine the overall degree of pollution, we used the comprehensive pollution index (FF) based on the TN and TP concentrations of the river sediments, with the background values of soil from the Hebei Plain area as the reference values. The grades of the index are shown in Table 1. The FF was calculated using the single pollution index formula with Equations (1) and (2):
Si = Ci/Cs
FF = ((F2 + F2max)/2)1/2
where Si is the single evaluation index, Ci is the actual detected value of the evaluation index i in mg/kg, Cs is the standard value of the evaluation index i, and Cs is the background concentration of TN or TP in soil from the Hebei Plain, and was used as the standard value of the evaluation index i. The Cs values, or background values of TN and TP, in the soil from the Hebei Plain were 848.30 and 1012.50 mg/kg, respectively (China Geological Survey). F is the average of the single pollution indices for TN and TP, and Fmax is the maximum value among the single pollution indices.
(2)
Organic index and organic nitrogen evaluation
The organic pollution index (OPI) is frequently used to evaluate the environmental conditions of watershed sediments, and the organic nitrogen index (ONI) indicates whether the surface sediments of lakes are polluted with N [15,16]. The grades of the organic N and organic indices are shown in Table 1, and the indices were calculated using Equations (3)–(5):
Organic index = Organic carbon (%) × organic nitrogen (%)
Organic carbon (%) = Organic matter (%)/1.724
Organic nitrogen (%) = Total nitrogen (%) × 0.95

2.4. Data Processing

We used ArcGIS 10.3 to produce spatial distribution maps of the sediment nutrient salt concentrations and of the nutrient salt pollution status. OriginPro 9.1 was used to produce the data analysis charts, and the data were analyzed using Excel 2019 and IBM SPSS Statistics 26.

3. Results and Discussion

3.1. Spatial Distribution of Nutrients in Sediments

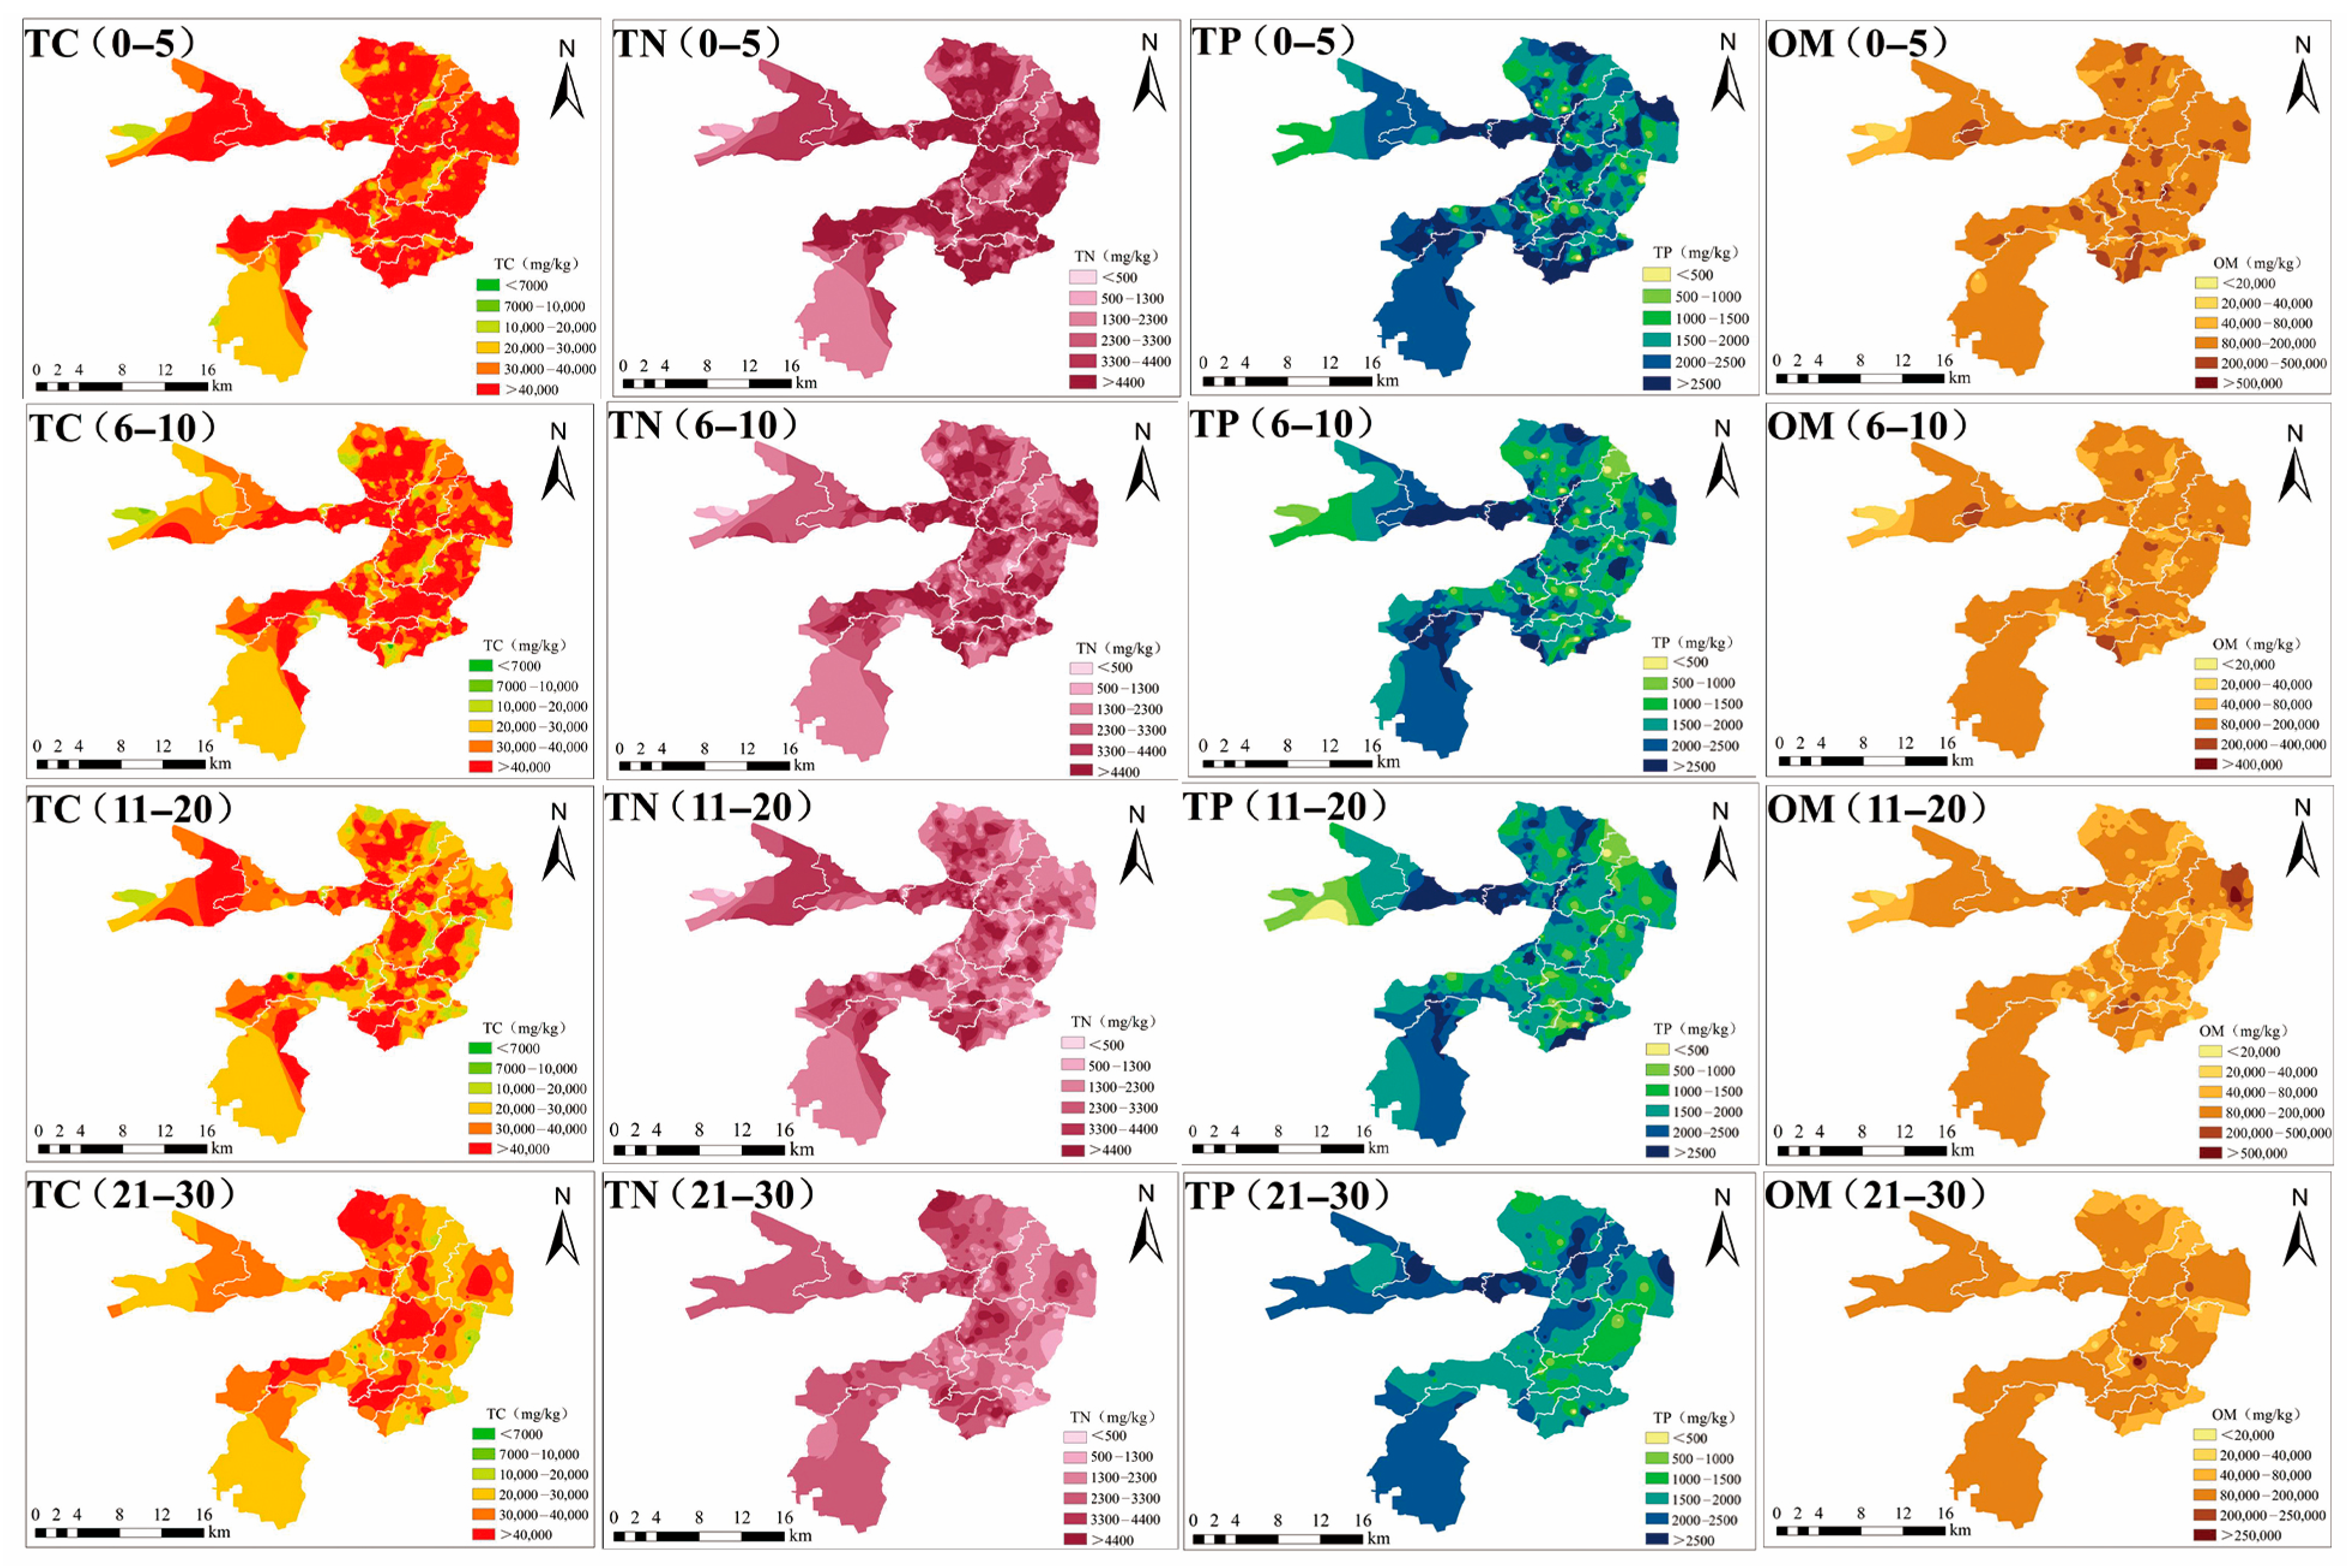
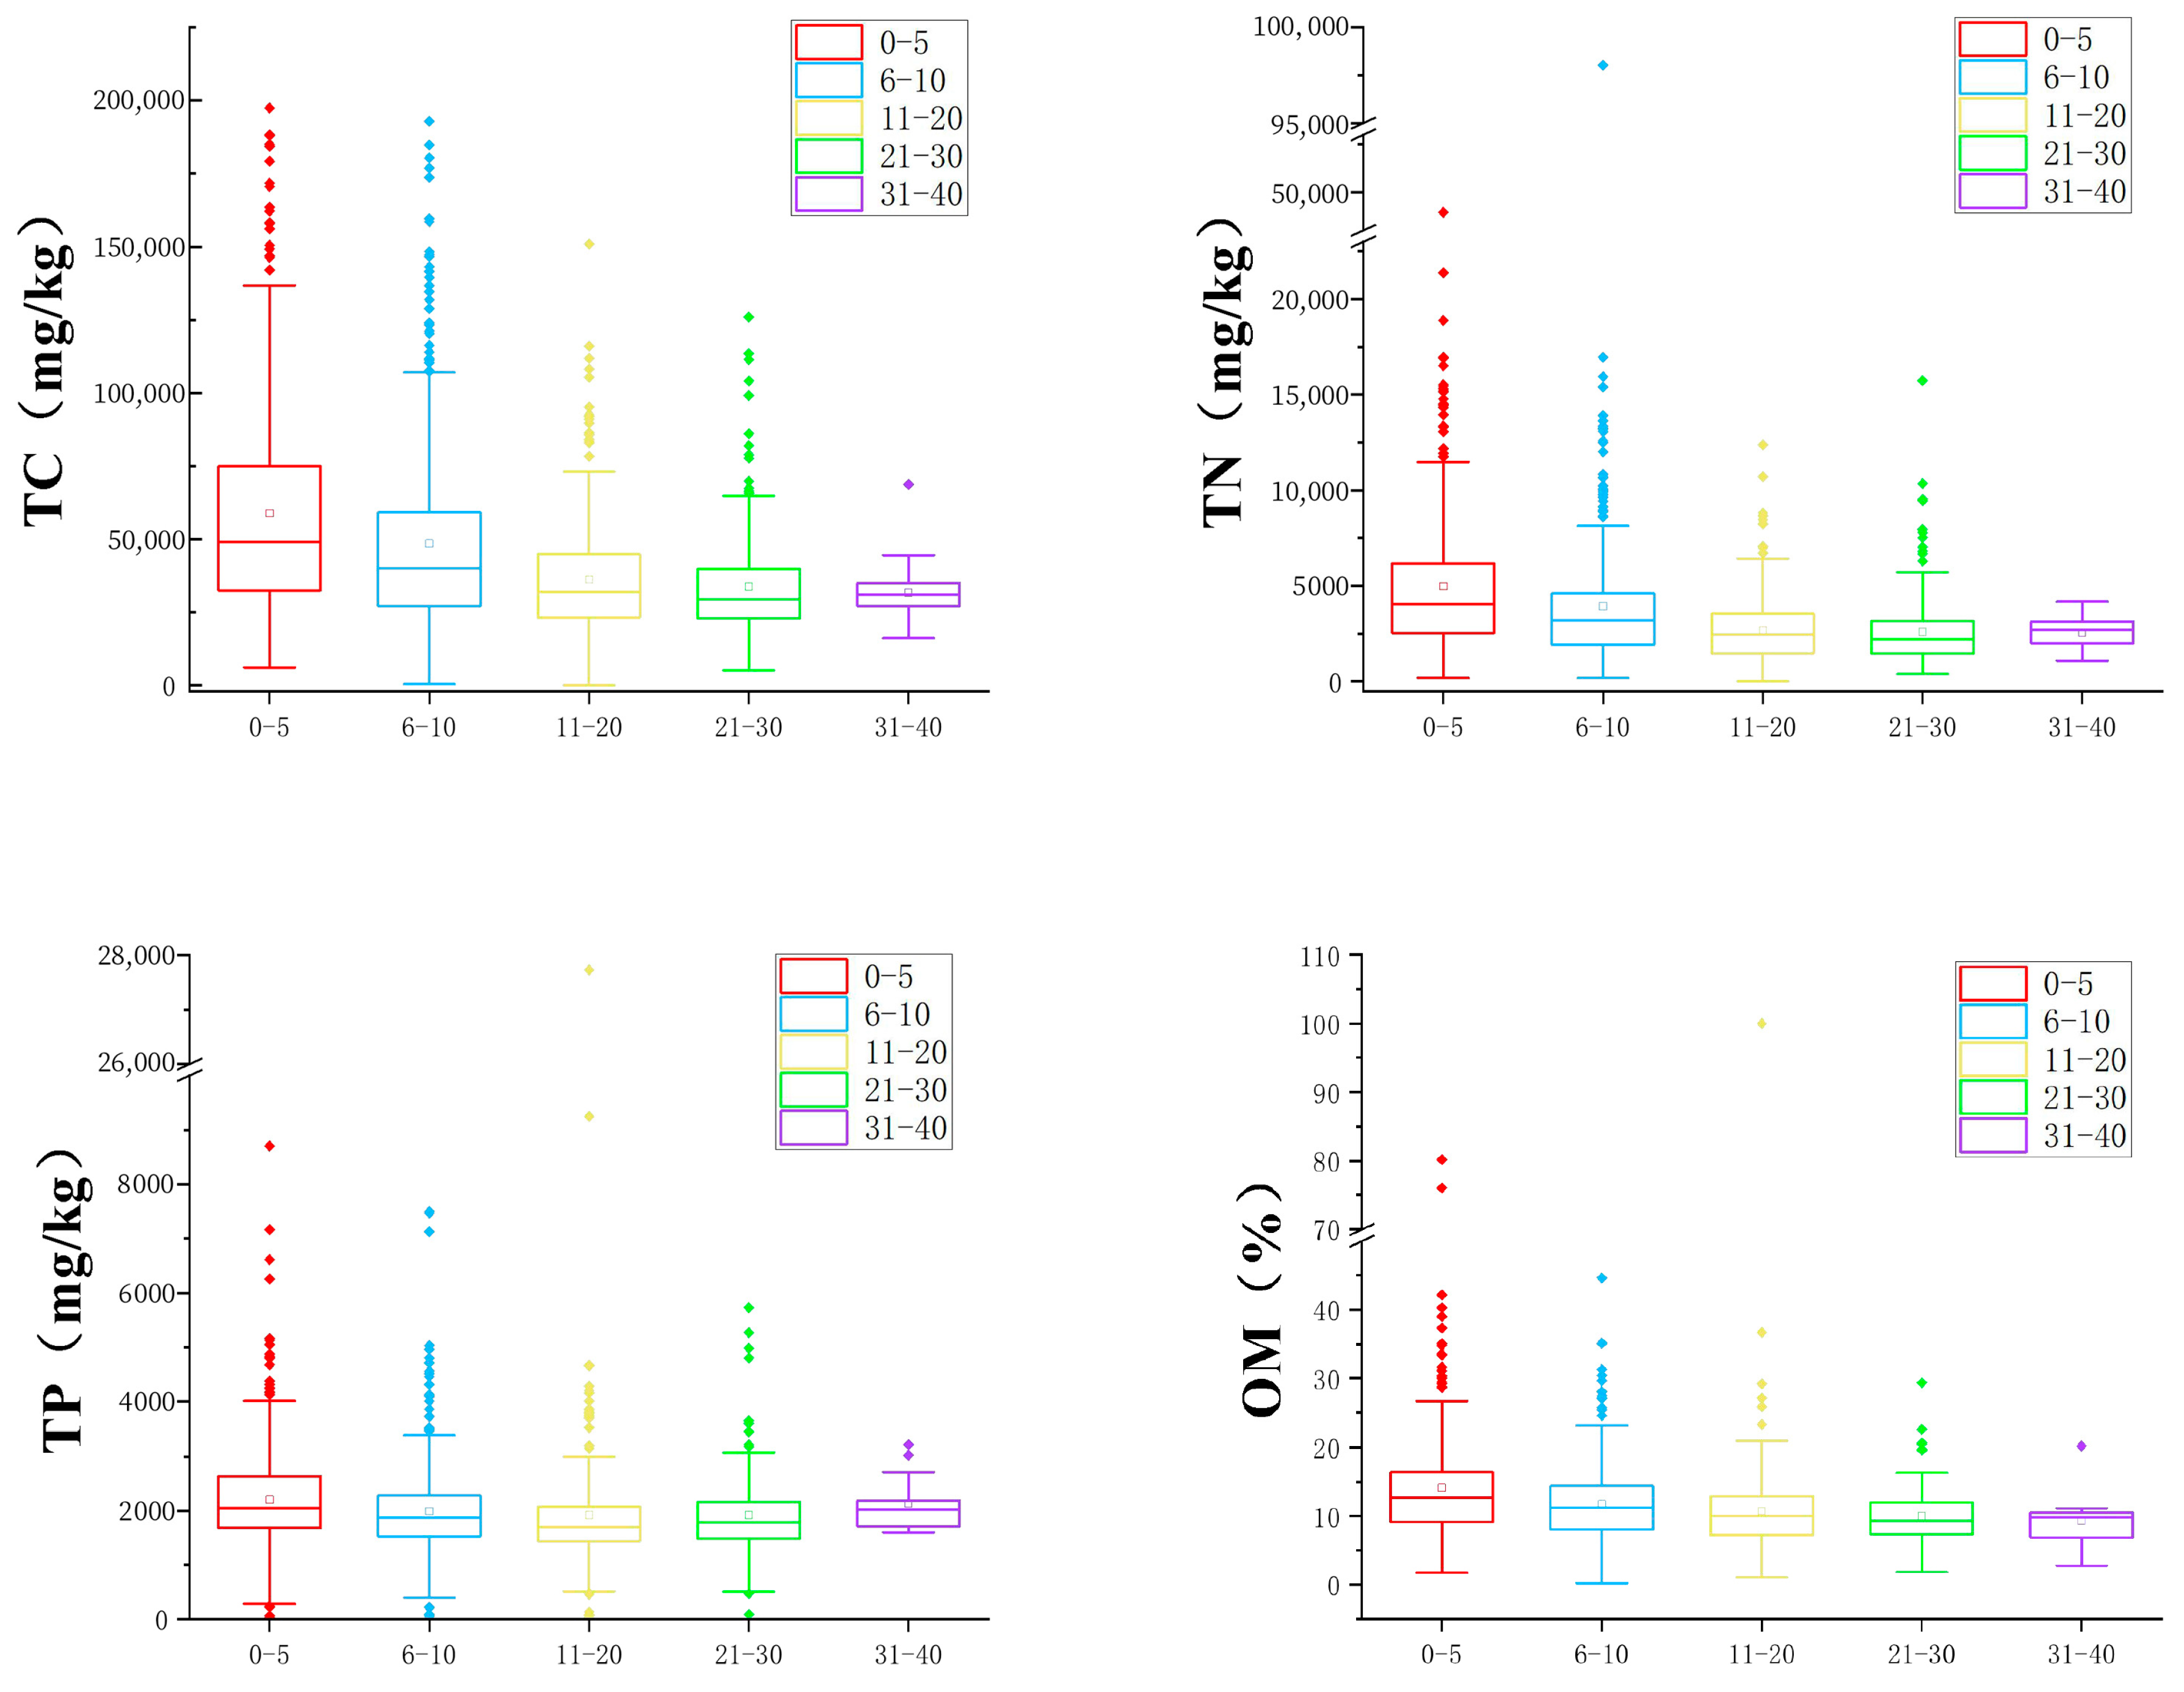
The spatial distributions of TN, TP, OM, and TC in the BYDL sediments are shown in Figure 2 and Figure 3. The TP concentrations in the sediments ranged from 187.96 to 8025.41 mg/kg. The average TP concentration, at 2038.25 ± 1190.87 mg/kg, was higher than the soil background value (1012.50 mg/kg) and varied considerably throughout the lake area. The five highest TP concentrations, detected in sediment samples from the watercourses, ranged from 7467.01 to 27,732.12 mg/kg, and were 7.4–27.4 times greater than the soil background value. The TP concentrations in the marsh area water averaged 2244.50 ± 1189.59 mg/kg and were also high. Apart from the TN and TP concentrations in the rivers and domestic sewage inputs, most of the TN and TP concentrations were high throughout the whole watershed, and were closely related to the net-pen aquaculture that is practiced in the BYDL. Because of ongoing high N and P inputs over many years, the sediment is becoming a nutrient reservoir [17], and the potential release of pollutants poses a risk of eutrophication in the lake.
As shown in Figure 2 and Figure 3, the TN concentrations varied from 187.96 to 8025.41 mg/kg, and the average TN concentration (3677.21 ± 3686.15 mg/kg) was much higher than the soil background level (848.30 mg/kg). The average TN concentration was highest in the marsh sediments (5640.31 mg/kg), followed by the ditch (4930.30 mg/kg), open water (3752.75 mg/kg), watercourse (3059.30 mg/kg), and pond (2698.03 mg/kg) sediments. The concentrations exceeded the soil background value in more than 95.75% of the analyzed sediments. Also, the TN concentrations in the sediments were high throughout the watershed, which means that the endogenous load should not be ignored. Before the Xiongan New Area was established, the water quality of BYDL was classified as poor (class V of the surface water standards), and the input rivers were the main source of pollutants. There are 39 villages with a population of about 98,000 dispersed in and around the lake. Domestic sewage and garbage from these villages are classified as allochthonous (external) sources of TN and other nutrients, as they are directly discharged into the lake (even without passing through the riverine system) and originate from outside the lake ecosystem [9].
The mean values of OM and TC in the BYDL sediments were 12.05% and 45,742.76 mg/kg, respectively. The mean values of OM in the open surface water, watercourse, ditch, marsh, and pond sediments reached 12.24%, 10.68%, 14.85%, 15.62%, and 11.27%, respectively, and the concentrations varied considerably between regions. The TC concentration averaged 67,175.20 mg/kg in the marsh area. The TC and OM distributions were similar, and the OM and TC were strongly correlated. Given that BYDL is a grass-type lake, the TC and organic matter in the sediments are mainly from decaying reeds and other aquatic organisms. Furthermore, the OM in the sediments, a colloidal substance, facilitates adsorption, complexation, and the distribution of heavy metals and organic pollutants. As the OM increases, the degree of organic nutrition of the sediments also increases [18,19].
The N and P concentrations and OM in lake reservoir sediments can reflect the degree of pollution of the sediments. We compared the nutrient and OM concentrations in the BYDL with those in other major lakes in China for the same period. As shown in Table 2, the average values of TN and TP in the BYDL sediments were higher than those in Poyang, Tai, Chaohu, and Dongting Lakes. The average TN and TP concentrations in the BYDL surface sediments were 3677 and 2038 mg/kg and were 1.05 and 1.57 times greater than those in Chaohu Lake, respectively. In addition, the OM concentration in surface sediment from BYDL reached 120,500 mg/kg, and was between 1.29 and 39.51 times greater than the OM in sediments from other lakes, including Tai, Chaohu, and Hengshui Lakes. Overall, there was more N, P, and in the BYDL sediments than in the sediments of the major lakes and reservoirs in China mentioned above, perhaps because BYDL had not been dredged for many years.
The spatial heterogeneity in sediment nutrient concentrations across different aquatic environments can be attributed to distinct biogeochemical processes and anthropogenic influences. The highest TN and OM levels in marsh sediments are likely driven by the prolific growth and subsequent decay of aquatic macrophytes, a natural accumulation process characteristic of such ecosystems. In contrast, the elevated TP concentrations observed in watercourses might be more closely linked to exogenous inputs, such as domestic sewage and agricultural runoff, highlighting the role of anthropogenic activities. Ditches, serving as connectors between terraces, showed intermediate to high values, possibly due to the convergence of materials from surrounding areas.

3.2. Evaluation of Nutrient Pollution in Surface Sediments

3.2.1. Comprehensive Pollution Index

As shown in Figure 4, the single pollution index value for TN (STN) in surface sediment of BYDL ranged from 0.49 to 25.19 and averaged 5.61 for the whole watershed, while the single pollution index value for TP (STP) ranged from 0.02 to 8.60 and averaged 2.18. Of the sampling sites, 98.92% were polluted by TN, with 3.76%, 5.91%, and 89.25% of the sampling sites experiencing mild, moderate, and severe pollution, while 6.45%, 8.87%, and 81.99% of the sampling sites were mildly, moderately, and severely polluted by TP. These results highlight the need to consider the endogenous pollution load in the surface sediment in BYDL. Also, the TN pollution was more severe than the TP pollution, and was perhaps related to the dense concentration of aquatic plants and aquatic life in the watershed. The FF for surface sediment ranged from 0.60 to 20.51, had an average of 4.80, and showed that more than 87% of the sampling points were severely polluted.
The results of the baseline survey for the BYDL water environment showed that plant decay residues in the areas of serious swamping, such as the Shaochedian and the Yangjiaodian area, formed a 40–50 cm layer of flocculent plant residues in the surface sediment, leading to an anaerobic zone that inhibited material transformation processes at the water–sediment interface. The decay of aquatic vegetation leads to drastic changes in the granular state and dissolved OM in the sediment zone. In addition, increases in the C, N, and P loads and changes in physicochemical conditions, such as the dissolved oxygen and transparency of the water body, disrupt the normal nutrient transformation and cycling processes in healthy ecosystems. Significant changes in transformation mechanisms and rates and nutrient fluxes [20,21,22,23,24] further exacerbate the accumulation of N and P in the sediments in the marsh area.

3.2.2. Characteristics of the OPI and ONI

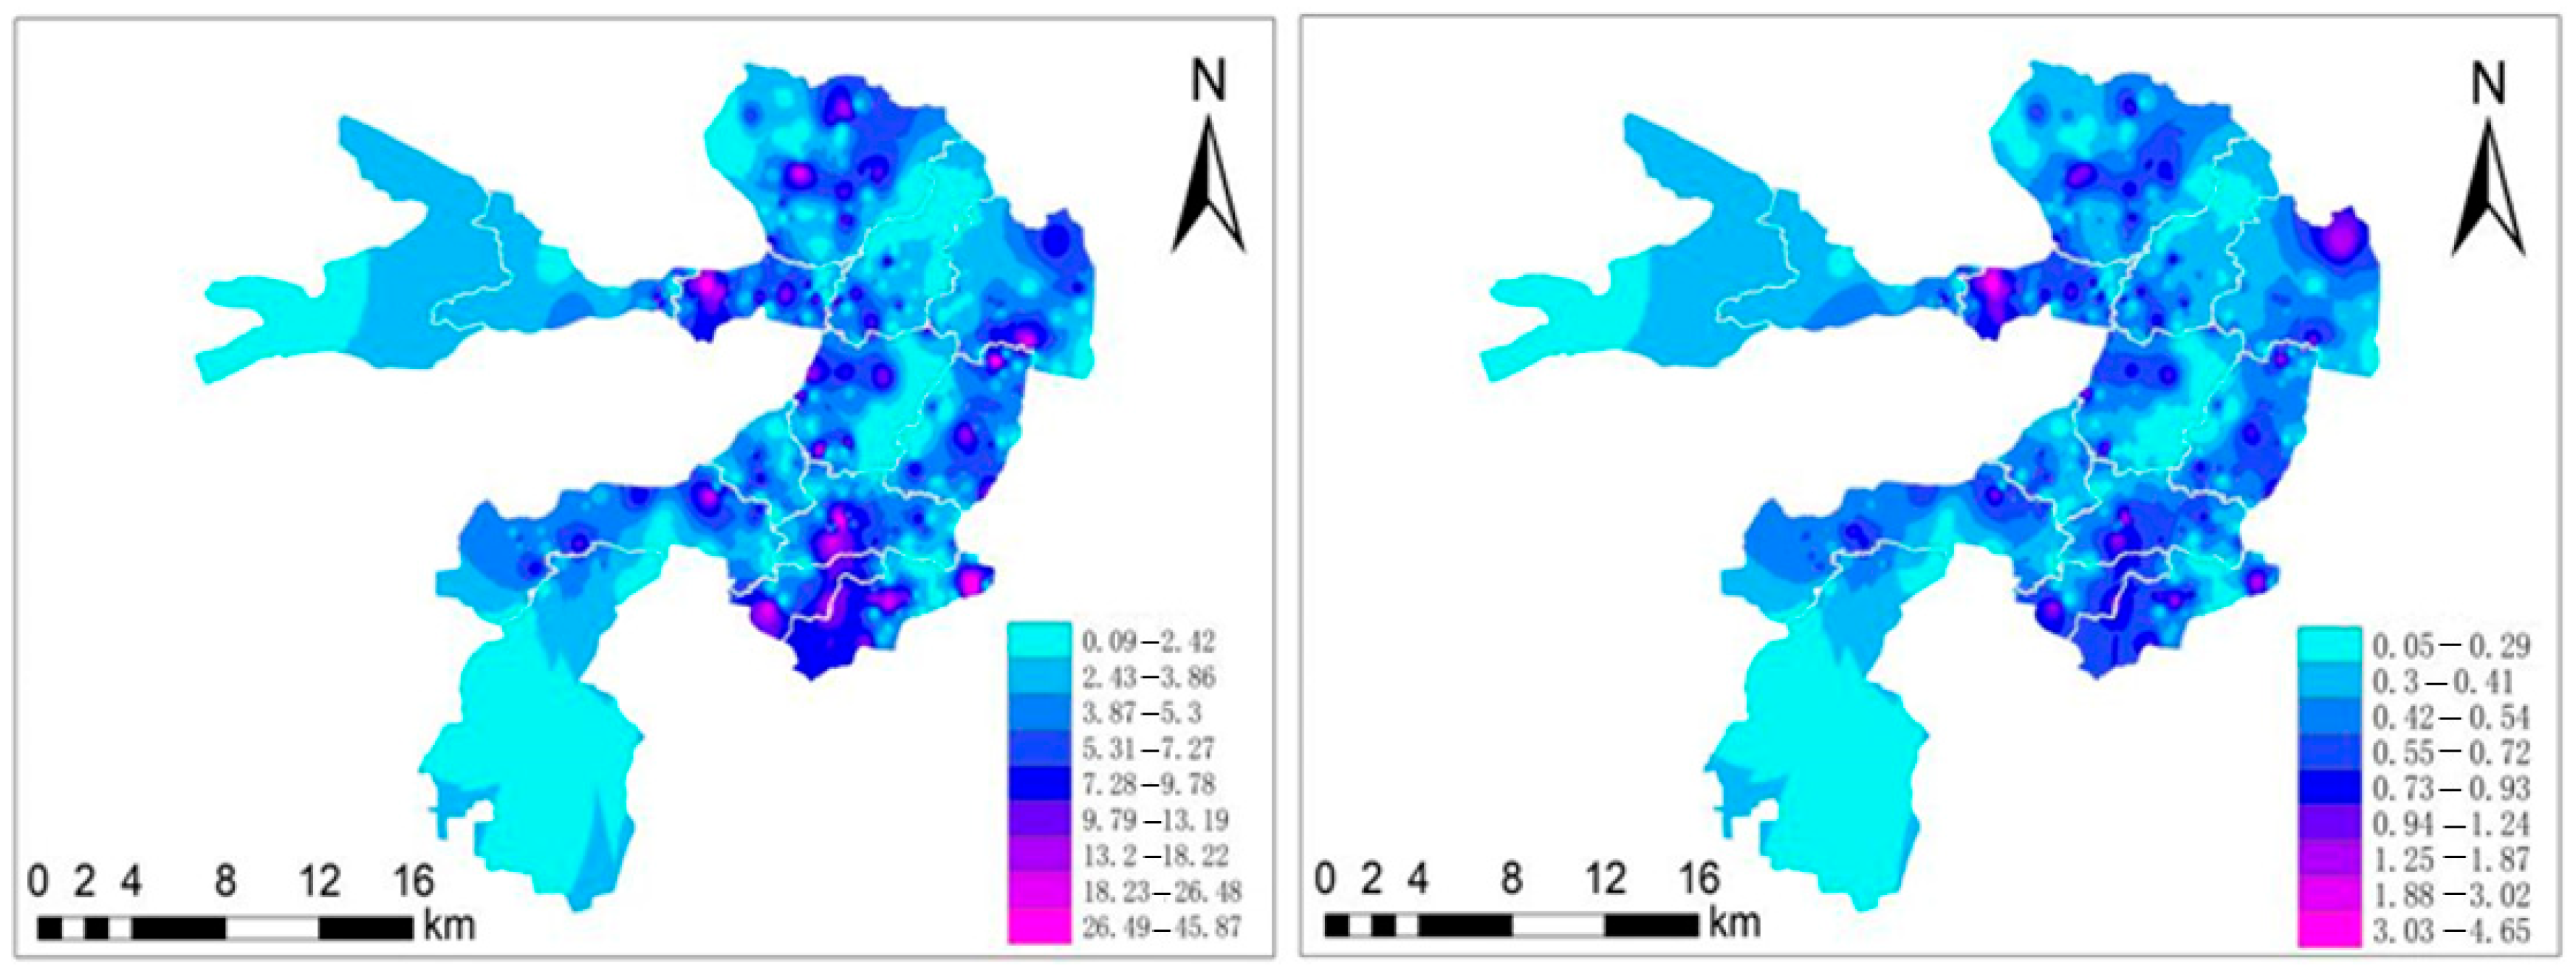
The OPI and ONI results show (Table 3 and Figure 5) that the organic contamination and ON contamination in the surface sediment of BYDL were in Class IV, and were higher than the contamination of lakes such as Taihu and Chaohu [15]. The range and average of the OPI for sediment were 0.09–45.90 and 4.67, respectively, indicating that the whole area was polluted by organics. The range and average of the ONI were 0.05–4.65% and 0.46%, respectively, and showed that there was ON pollution. Overall, there was organic pollution at 92.86% of the sampling points, of which 1.10% sites were ‘Subclean’, and 6.08% sites were ‘fairly clean’. There was ON pollution at 93.65% of the sampling sites, of which only 0.83% were ‘Subclean’, and 5.52% were ‘fairly clean’. Figure 5 shows that the ONI and OPI of BYDL shared the same spatial distribution, and that the pollution was more severe in the Nanliuzhuang, Caiputai, and Julongdian areas than in the other watershed areas. The Nanliuzhuang area is affected by the water quality of the discharge from the Fuhe River, while the organic pollution and ON contamination in the Julongdian area may be attributed to artificial aquaculture and other anthropogenic inputs.

3.3. Sediment Nutrient Source Analysis

3.3.1. Characterization of the Sediment C/N and C/P

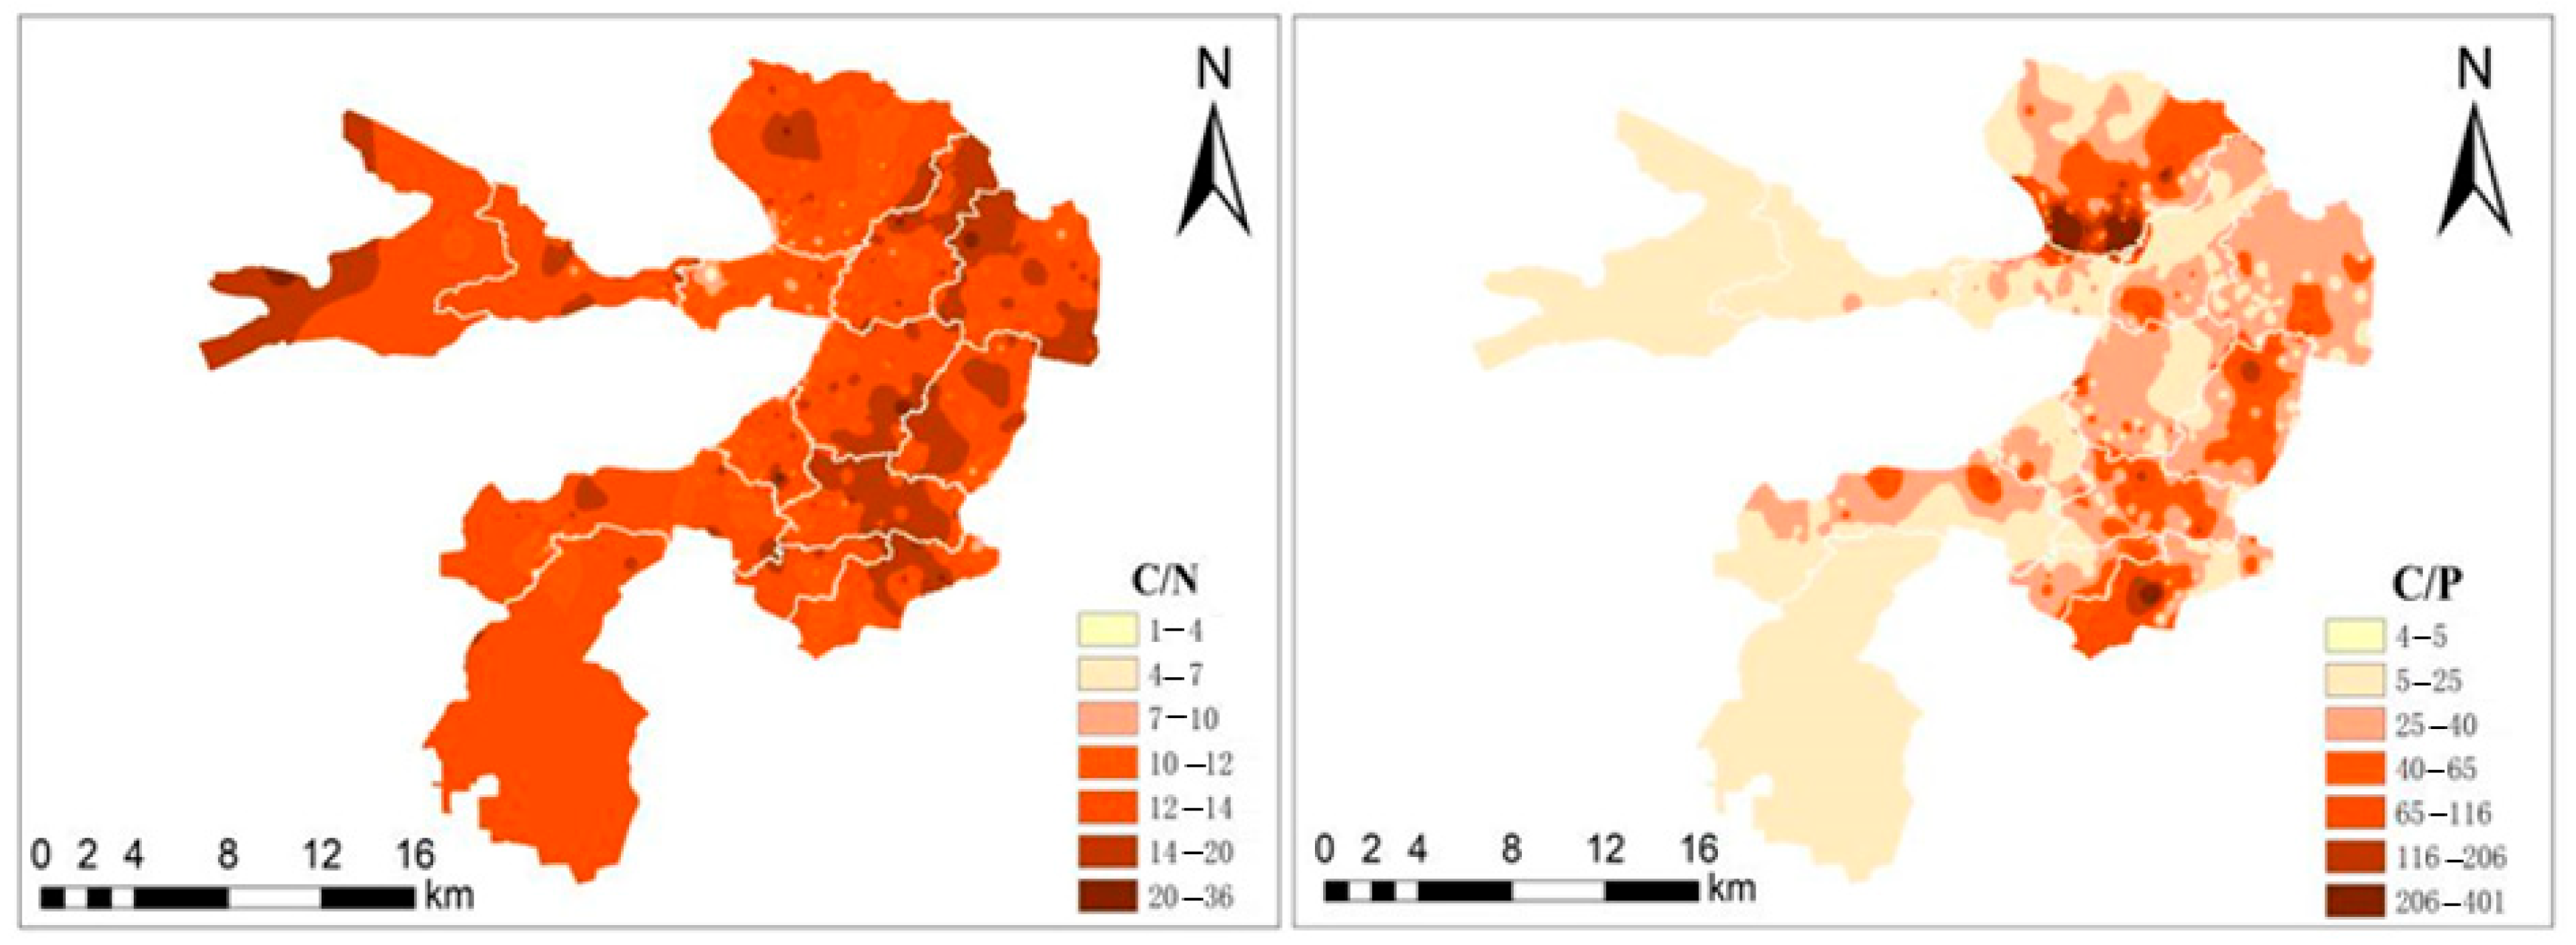
The C/N value can be used to distinguish the sources of OM and related nutrients in sediments of water bodies such as lakes, reservoirs, and oceans [25,26]. For example, a C/N value greater than 20 reflects fiber-bound plant debris, while a C/N between 4 and 12 reflects plant debris that is not fiber-bound. A C/N value less than 7 reflects zooplankton, a value of 6–14 reflects phytoplankton, and a value of 4–10 reflects algae [27]. Grass-type lakes, such as the BYDL, are mainly characterized by a grass-type clear-water state and generally have clear water, abundant submerged vegetation, and aquatic plants as the main primary producers [28]. The C/N of the open water surface, watercourse, ditch, marsh, and pool sediments in BYDL ranged from 0.78 to 206.10, 0.49 to 288.14, 6.83 to 82.26, 11.54 to 54.55, and 7.93 to 69.92, respectively. The main sources of OM were cellulosic plant debris and phytoplankton (Figure 6). Comparison of the C/N values for the BYDL with those of Lake Tai (4.8–18.0) and Lake Chaohu (7.28–9.95) suggests that aquatic plants had a stronger influence on the sediments in BYDL than in the other lakes [29]. Aquatic vascular plants, dominated by reeds, lotus, minced grass, and longbeard’s eyebright, cover between 30% and 40% of the BYDL. These aquatic plants naturally decay into organic debris that accumulates in the sediment, resulting in an increase in the OM content of the sediments [30,31].
Notably, the C/N ratios varied considerably among habitats. Marshes and ditches exhibited generally higher C/N ratios, reinforcing the notion that cellulose-rich plant debris from reeds and other emergent vegetation is the dominant OM source. Conversely, lower C/N ratios in some open water and pond areas suggest a greater relative contribution of phytoplankton-derived OM, which is consistent with the ecological characteristics of these less-vegetated, more pelagic zones.
The sediment C/P can reflect the efficiency of the degradation of organic C and P in sediments and the pattern of P [27,32]. The C/P values in the surface sediments of BYDL ranged from 0.68 to 4363.72 and averaged 56.15. In the northeastern and southwestern parts of the BYDL, the C/P values of surface sediments were larger than those in other areas, and the decayed aquatic vegetation in the watershed led to the accumulation of OM in the sediments. When aquatic organisms die, the P in the organisms, especially iron- and aluminum-bound P and organic P, decomposes rapidly and is released. However, degraded C is released more slowly than P [33], leading to slower accumulation of OM in sediments, which influences the C/P values. The C/P values in the surface sediments in this lake area were high. Submerged plants have the ability to enrich N and P in the aquatic environment, and the TN and TP enrichment of submerged plants in the BYDL, such as eel grass, goldfish algae, and stuckenia pectinata, ranged from 14,000 to 28,000 mg/kg and 2000 to 7000 mg/kg, respectively, which shows that the BYDL aquatic organisms were more enriched with N and P than the sediment [34]. The uptake and enrichment of N and P by submerged plants mainly occurs in the aquatic part of the plants, so the secondary release of nutrients to the water body and enrichment of sediments caused by plant decay can be reduced by regular balanced harvesting of aquatic plants [35].
It has been shown that the spatial distribution of N and P in surface sediment was related to exogenous inputs. Sediment N and P are mainly derived from the residues of aquatic organisms and nutrient inputs from the water body [36]. The main sources of N and P in the BYDL watershed are farmland surface sources and soil erosion, while the main sources of COD are livestock and poultry farming and urban sewage. Overall, farmland surface sources, livestock and poultry farming, soil erosion, and urban sewage were reported as the main sources of N, P, and COD in the BYDL watershed [37].

3.3.2. Sediment Nutrient Correlation Analysis

Correlation analysis of the nutrient concentrations in the surface sediments of BYDL showed that there were significant positive correlations between OM and TN (r = 0.752, p < 0.01), OM and TP (r = 0.631, p < 0.01), and TN and TP (r = 0.662, p < 0.01), and that the correlation between OM and TN was the strongest (Table 4). These results indicate that the mineralization of OM in the surface layer of BYDL was closely related to N and P, especially the source and migration of N. It has been shown that, when aquatic plant residues decompose into organic detritus, soluble N, P, and other nutrients are released, and cellulose, lignin, and other difficult-to-degrade C gradually accumulate [38]. The TN in the BYDL sediments is dominated by ON and may be from exogenous inputs and OM mineralization [39].
The results of a survey of the pollution sources in the BYDL showed that 197 factories in the upper reaches of the BYDL discharged sewage since 2000, and that the daily discharge of wastewater exceeded 336,000 tons/day. In addition, all the sewage from the rural areas in the watershed was discharged into the watershed, and the fish farming fences in the watershed aggravated the N and P enrichment in the sediments [40]. In addition, TN was positively correlated with the sediment silt thickness in the BYDL algal area and in the headwaters of the watershed (p < 0.1, data not given in this paper). This suggests that the N inputs were directly affected by sedimentation in the watershed area. As sediment is a reservoir for N, P, and OM, sediment dredging could help to abate endogenous pollution.

3.3.3. Principal Component Analysis

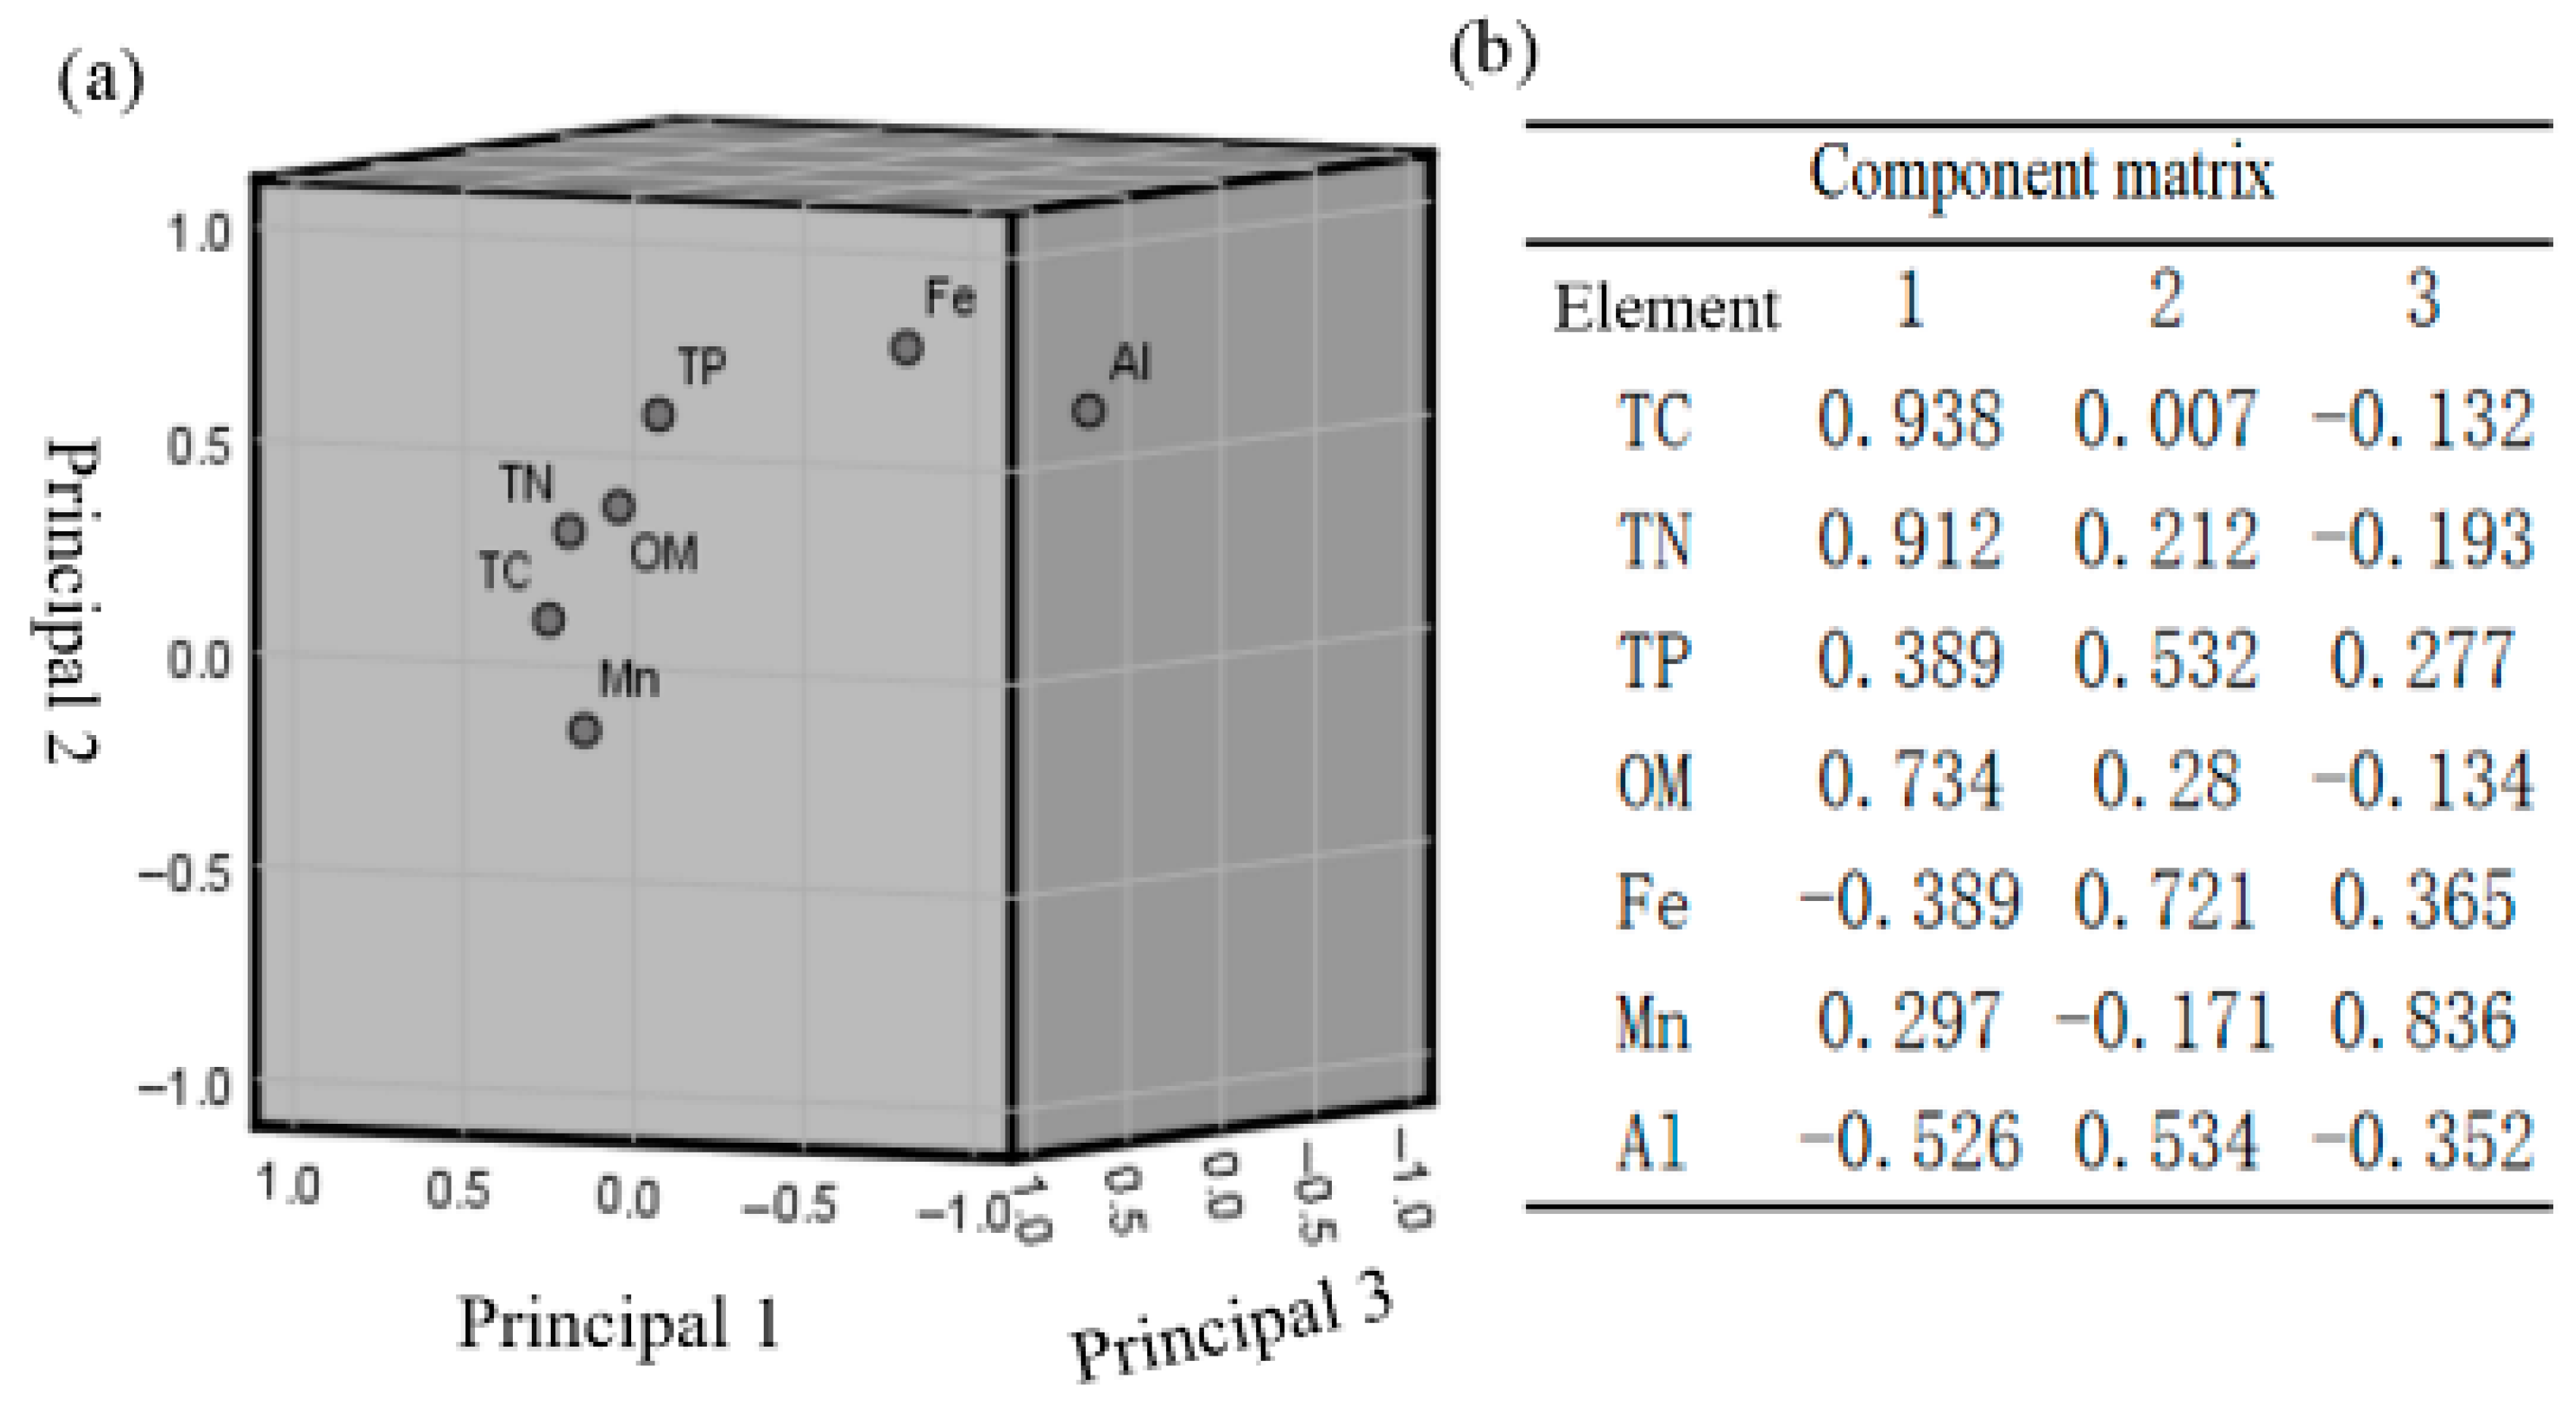
We obtained three principal components from principal component analysis. The first principal component was dominated by TN, TP, TS, OM, and Mn, and explained 41.69% of the total variance. The second principal component was dominated by Fe and explained 17.71% of the total variance. The third principal component was dominated by Al and explained 15.79% of the total variance. Together, these three components accounted for 75.19% of the variation (Figure 7). The relationships among the indicators are shown in Figure 7a. This figure shows that TN, TP, TS, OM, and Mn were clustered into one group, which indicates that the P nutrient salts had similar sources. Fe and Al were clustered in their own groups and represented the natural sources of soil mineralization. These results suggest that the N, P, and OM had natural sources that were not mineralized from soil rocks.
While external sources such as wastewater and aquaculture have historically contributed to nutrient accumulation in Baiyangdian sediments, the current dominance of internal processes (e.g., mineralization of aquatic plant debris) underscores the need for integrated management. Therefore, in addition to ongoing external pollution control, targeted internal measures are essential to mitigate legacy nutrient loads and prevent secondary pollution: For aquatic plant harvesting, (1) Timing: 1 month before the rainy season (to capture accumulated nutrients and avoid nutrient release via flood scouring) and 2 weeks after the annual growth peak (late August–early September, to prevent nutrient leaching during post-senescence decomposition), aligned with the lake’s hydrological (monsoon-driven runoff) and biological (plant growth-decay) cycles; (2) Locations: Priority areas with high nutrient loads identified by OPI/ONI indices (e.g., Nanliuzhuang, Caiputai, Julongdian), where aquatic plant biomass exceeds 600 g/m2 (based on our survey data in Section 3.2); (3) Method: Combined manual and mechanical harvesting, with a 10 cm residual stubble height to avoid sediment disturbance and ensure plant regrowth.

4. Conclusions

(1)
The OM and TN concentrations in the BYDL sediments were high and showed spatial variation, and the pollutant concentrations were particularly high in the marsh area. Overall, the concentrations were ranked as follows: marsh > ditch > open precipitation surface > watercourse or pond. Also, the TN, TP and OM concentrations were higher in the surface sediments (0–10 cm) than in the deeper sediments.
(2)
The STN, STP, and FF indices showed that more than 99.73% of the surface sediments in the BYDL were severely polluted. The ONI and OPI of the BYDL had similar spatial distributions and indicated higher pollution in the Nanliuzhuang, Caiputai, and Julongdian areas than in the other areas of the lake.
(3)
The C/N ratio and correlation analysis of the sediment properties showed that the OM and TN pollution of the BYDL bottom sediment were related to the natural decay of aquatic plants in the same region. These results show that it would be useful to harvest aquatic plants and reeds from transitional growth areas (e.g., Nanliuzhuang, Caiputai, and Julongdian) before the rainy season and at the end of the growth cycle (e.g., September–October) to capture nutrients before senescence and decomposition. This balanced harvesting approach would help to avoid further enrichment of N, P, and OM in sediments caused by decaying aquatic plants. At the same time, it would be useful to dredge the sediments from the heavily polluted areas of the BYDL watershed during the dry season (e.g., November–March) to minimize resuspension and ecological impact. A sustainable dredging strategy should prioritize localized hotspots while preserving benthic habitats and ecological functions. A long-term monitoring program (e.g., seasonal sampling of sediment and water quality) is recommended to evaluate the effectiveness of these interventions and track the recovery of the ecosystem.

Author Contributions

Conceptualization, W.Q.; methodology, W.Q. and D.F.; sample collection, D.F. and Y.X.; writing—original draft preparation, W.Q.; writing—review and editing, D.F., Y.X. and S.W. All authors have read and agreed to the published version of the manuscript.

Funding

This research was funded by the National Key R&D Program of China grant number 2022YFC3204400. And The APC was funded by National Key R&D Program of China.

Institutional Review Board Statement

Not applicable.

Informed Consent Statement

Not applicable.

Data Availability Statement

The original contributions presented in this study are included in the article. Further inquiries can be directed to the corresponding author.

Conflicts of Interest

Wenfeng Qu, Deyu Fu, Yin Xi were employed by Beijing Capital Eco-Environment Protection Group Co., Ltd. The remaining authors declare that the research was conducted in the absence of any commercial or financial relationships that could be construed as a potential conflict of interest.

References

  1. Zhuo, Y.; Zeng, W.; Ma, B.; Cui, D.; Xie, Y.; Wang, J. Spatiotemporal variation and influencing factors of nitrogen and phosphorus in lake sediments in China since 1850. J. Clean. Prod. 2022, 368, 133170. [Google Scholar] [CrossRef]
  2. Yang, C.; Yang, P.; Geng, J.; Yin, H.; Chen, K. Sediment internal nutrient loading in the most polluted area of a shallow eutrophic lake (Lake Chaohu, China) and its contribution to lake eutrophication. Environ. Pollut. 2020, 262, 114292. [Google Scholar] [CrossRef]
  3. Yang, C.; Li, J.; Yin, H. Phosphorus internal loading and sediment diagenesis in a large eutrophic lake (Lake Chaohu, China). Environ. Pollut. 2022, 292, 118471. [Google Scholar] [CrossRef]
  4. Liu, C.; Du, Y.; Chen, K.; Ma, S.; Chen, B.; Lan, Y. Contrasting exchanges of nitrogen and phosphorus across the sediment–water interface during the drying and re-inundation of littoral eutrophic sediment. Environ. Pollut. 2019, 255, 113356. [Google Scholar] [CrossRef] [PubMed]
  5. Zhong, J.; Wen, S.; Zhang, L.; Wang, J.; Liu, C.; Yu, J.; Zhang, L.; Fan, C. Nitrogen budget at sediment–water interface altered by sediment dredging and settling particles: Benefits and drawbacks in managing eutrophication. J. Hazard. Mater. 2021, 406, 124691. [Google Scholar] [CrossRef] [PubMed]
  6. Abell, J.M.; Özkundakci, D.; Hamilton, D.P.; Reeves, P. Restoring shallow lakes impaired by eutrophication: Approaches, outcomes, and challenges. Crit. Rev. Environ. Sci. Technol. 2022, 52, 1199–1246. [Google Scholar] [CrossRef]
  7. Socohou, A.A.; Djihouessi, M.B.; Tigo, B.A.; Viainon, V.M.; Adandedji, F.M.; Adounpke, J.; Aina, M.P. Spatio-temporal dynamics of nutrients at the water-sediment interface: Case of the Nokoue lagoon in Southern Benin. Environ. Monit. Assess. 2024, 196, 2. [Google Scholar] [CrossRef]
  8. Horppila, J. Sediment nutrients, ecological status and restoration of lakes. Water Res. 2019, 160, 206–208. [Google Scholar] [CrossRef]
  9. Wang, Y.; Liu, M.; Dai, Y.; Luo, Y.; Zhang, S. Health and ecotoxicological risk assessment for human and aquatic organism exposure to polycyclic aromatic hydrocarbons in the Baiyangdian Lake. Environ. Sci. Pollut. Res. 2021, 28, 574–586. [Google Scholar] [CrossRef]
  10. Dong, L.; Yang, Z.; Liu, X. Phosphorus fractions, sorption characteristics, and its release in the sediments of Baiyangdian Lake, China. Environ. Monit. Assess. 2011, 179, 335–345. [Google Scholar] [CrossRef]
  11. Zhao, Y.; Xia, X.; Yang, Z.; Xia, N. Temporal and spatial variations of nutrients in Baiyangdian Lake, North China. J. Environ. Inform. 2011, 17, 102–108. [Google Scholar] [CrossRef]
  12. Zhang, C.; Shan, B.; Zhao, Y.; Song, Z.; Tang, W. Spatial distribution, fractionation, toxicity and risk assessment of surface sediments from the Baiyangdian Lake in northern China. Ecol. Indic. 2018, 90, 633–642. [Google Scholar] [CrossRef]
  13. HJ 632-2011; Soil-Determination of Total Phosphorus by Alkali Fusion–Mo-Sb Anti Spectrophotometric Method. Ministry of Ecology and Environment of the People’s Republic of China: Beijing, China, 2012.
  14. Zhang, J.-W.; Wei, J.; Liu, L.; Wang, J.; Zhu, Y.-R.; Duan, L. Distribution characteristics and pollution assessment of nutrients in Hengshui Lake sediments. Huanjing Kexue 2020, 41, 5389–5399. [Google Scholar]
  15. Luo, W.; Fan, Y.; Lu, J.; Zhu, S. Nutrient Distribution and Interrelationships in Chaohu Lake, China: Insights from Sedimentary Records. Expo. Health 2025, 17, 863–873. [Google Scholar] [CrossRef]
  16. Wang, J.; Wei, H.; Liang, Z.; Zhan, S.; Jia, H.; Guo, S.; Ge, P. Contamination, risk and quantitative identification of nutrients and potentially toxic elements in the surface sediments of Baiyangdian Lake, North China. Ecotoxicology 2022, 31, 289–298. [Google Scholar] [CrossRef]
  17. Bian, W.; Wang, L.G.; Zhang, H.Z.; Wang, J.F.; Tian, Z.F.; Chen, X.Y. Study on phosphorus pollution load of aquaculture in Baiyangdian Lake. Adv. Mater. Res. 2012, 518, 1406–1411. [Google Scholar] [CrossRef]
  18. Fan, W.; Ao, L.; Zhang, S. Sedimentary phosphorus fractions in typical lacustrine wetland of Changshou Lake flowing into the Three-Gorges Reservoir. Bull. Environ. Contam. Toxicol. 2022, 109, 706–712. [Google Scholar] [CrossRef] [PubMed]
  19. Zhang, M.; Chu, E.; Xu, M.; Guo, J.; Zhang, Y. Temporal and spatial variation analysis on nutritive salt of Hongze Lake. Environ. Eng. Res. 2015, 20, 19–24. [Google Scholar] [CrossRef]
  20. Wang, L.; Liang, T. Distribution characteristics of phosphorus in the sediments and overlying water of Poyang Lake. PLoS ONE 2015, 10, e0125859. [Google Scholar] [CrossRef]
  21. Shen, J.; Yuan, H.; Liu, E.; Wang, J.; Wang, Y. Spatial distribution and stratigraphic characteristics of surface sediments in Taihu Lake, China. Chin. Sci. Bull. 2011, 56, 179–187. [Google Scholar] [CrossRef]
  22. Li, F.; Huang, J.; Zeng, G.; Yuan, X.; Li, X.; Liang, J.; Wang, X.; Tang, X.; Bai, B. Spatial risk assessment and sources identification of heavy metals in surface sediments from the Dongting Lake, Middle China. J. Geochem. Explor. 2013, 132, 75–83. [Google Scholar] [CrossRef]
  23. Wu, J.; Ma, L.; Yu, H.; Zeng, H.; Liu, W.; Abuduwaili, J. Sediment geochemical records of environmental change in Lake Wuliangsu, Yellow River Basin, north China. J. Paleolimnol. 2013, 50, 245–255. [Google Scholar] [CrossRef]
  24. Zhao, H.; Zhao, H.; Wang, S.; Zhang, L.; Qiao, Z. Coupling characteristics and environmental significance of nitrogen, phosphorus and organic carbon in the sediments of Erhai Lake. Environ. Sci. Pollut. Res. 2020, 27, 19901–19914. [Google Scholar] [CrossRef] [PubMed]
  25. Lone, A.M.; Shah, R.A.; Achyuthan, H.; Rafiq, M. Source identification of organic matter using C/N ratio in freshwater lakes of Kashmir Valley, Western Himalaya, India. Himal Geol 2018, 39, 101–114. [Google Scholar]
  26. Amor, R.B.; Jerbi, H.; Abidi, M.; Gueddari, M. Assessment of trace metal contamination, total organic carbon and nutrient accumulation in surface sediments of Monastir Bay (Eastern Tunisia, Mediterranean Sea). Reg. Stud. Mar. Sci. 2020, 34, 101089. [Google Scholar] [CrossRef]
  27. Shen, Z.; Qiu, J.; Hong, Q.; Chen, L. Simulation of spatial and temporal distributions of non-point source pollution load in the Three Gorges Reservoir Region. Sci. Total Environ. 2014, 493, 138–146. [Google Scholar] [CrossRef]
  28. Li, D.; Yu, R.; Chen, J.; Leng, X.; Zhao, D.; Jia, H.; An, S. Ecological risk of heavy metals in lake sediments of China: A national-scale integrated analysis. J. Clean. Prod. 2022, 334, 130206. [Google Scholar] [CrossRef]
  29. He, W.; Bai, Z.-L.; Liu, W.-X.; Kong, X.-Z.; Yang, B.; Yang, C.; Jørgensen, S.E.; Xu, F.-L. Occurrence, spatial distribution, sources, and risks of polychlorinated biphenyls and heavy metals in surface sediments from a large eutrophic Chinese lake (Lake Chaohu). Environ. Sci. Pollut. Res. 2016, 23, 10335–10348. [Google Scholar] [CrossRef]
  30. Li, Y.-H.; Cui, B.-S.; Yang, Z.-F. Influence of hydrological characteristic change of Baiyangdian on the ecological environment in wetland. J. Nat. Resour. 2004, 19, 62–68. [Google Scholar]
  31. Yang, W.; Yan, J.; Wang, Y.; Zhang, B.-T.; Wang, H. Seasonal variation of aquatic macrophytes and its relationship with environmental factors in Baiyangdian Lake, China. Sci. Total Environ. 2020, 708, 135112. [Google Scholar] [CrossRef]
  32. Zhuo, H.-H.; Qiu, G.-S.; Zhai, W.-Y.; Liu, Y.-B.; Lan, J.J.H.J.k.X.H.K. Evaluation of temporal and spatial variation characteristics of nutrients in surface sediment in the Three Gorges Reservoir area. Huanjing Kexue 2017, 38, 5020–5031. [Google Scholar]
  33. Zhou, Z.; Huang, T.; Li, Y.; Ma, W.; Zhou, S.; Long, S. Sediment pollution characteristics and in situ control in a deep drinking water reservoir. J. Environ. Sci. 2017, 52, 223–231. [Google Scholar] [CrossRef]
  34. Li, L.; Chen, X.; Zhang, M.; Zhang, W.; Wang, D.; Wang, H. The spatial variations of water quality and effects of water landscape in Baiyangdian Lake, North China. Environ. Sci. Pollut. Res. 2022, 29, 16716–16726. [Google Scholar] [CrossRef] [PubMed]
  35. Hu, N.; Sheng, Y.; Tang, Q.; Liu, X. Mechanisms of nitrogen and phosphorus release from heavily polluted coastal sediments and identification of influencing factor. Environ. Res. Commun. 2025, 7, 025005. [Google Scholar] [CrossRef]
  36. Meng, X.; Zhang, W.; Shan, B. Distribution of nitrogen and phosphorus and estimation of nutrient fluxes in the water and sediments of Liangzi Lake, China. Environ. Sci. Pollut. Res. 2020, 27, 7096–7104. [Google Scholar] [CrossRef]
  37. Wang, G.; Lv, C.; Gu, C.; Yu, Y.; Yang, Z.; Zhang, Z.; Tang, C. Pollutants Source Assessment and Load Calculation in Baiyangdian Lake Using Multi-Model Statistical Analysis. Water 2022, 14, 3386. [Google Scholar] [CrossRef]
  38. Tang, J.-Y.; Cao, P.-P.; Xu, C.; Liu, M.-S. Effects of aquatic plants during their decay and decomposition on water quality. Shengtai Xuebao 2013, 24, 83–89. [Google Scholar]
  39. Wu, T.; Qin, B.; Brookes, J.D.; Yan, W.; Ji, X.; Feng, J. Spatial distribution of sediment nitrogen and phosphorus in Lake Taihu from a hydrodynamics-induced transport perspective. Sci. Total Environ. 2019, 650, 1554–1565. [Google Scholar] [CrossRef]
  40. Zhao, C.; Gong, J.; Zeng, Q.; Yang, M.; Wang, Y. Landscape pattern evolution processes and the driving forces in the wetlands of lake Baiyangdian. Sustainability 2021, 13, 9747. [Google Scholar] [CrossRef]
Figure 1. Sediment sampling sites in Baiyangdian Lake. 513 sampling sites, including 148 open water sites, 204 watercourse sites (rivers or channels used for shipping), 92 sites in ditches (located between reed terraces), 21 marsh sites (overpopulated with aquatic plants and shallow lakes that have become swamps), and 48 pond sites (man-made fish ponds built using dykes).
Sustainability 17 10184 g001
Figure 2. Spatial distribution of the TC, TN, TP, and OM concentrations in sediments from different depths in the lake (vertical distribution 0–5 cm, 6–10 cm, 11–20 cm, 21–30 cm).
Sustainability 17 10184 g002
Figure 3. Vertical distribution of TC, TN, TP, and organic matter (OM) in the sediment cores (The boxes represent the interquartile range (IQR, 25th–75th percentiles), with the horizontal line inside each box indicating the median value. Whiskers extend to the most extreme data points within 1.5×IQR beyond the box edges, and individual points beyond the whiskers denote outliers).
Sustainability 17 10184 g003
Figure 4. Comprehensive pollution index for nutrients in the surface sediments of Baiyangdian Lake. I represents cleaning, II represents mild, III represents moderate, IV represents heavy.
Sustainability 17 10184 g004
Figure 5. Organic index (OPI, right figure) and organic nitrogen index (ONI, left figure) in the surface sediments (0–10 cm) of Baiyangdian Lake.
Sustainability 17 10184 g005
Figure 6. Distribution of the C/N and C/P ratios in the surface sediments of Baiyangdian Lake.
Sustainability 17 10184 g006
Figure 7. (a) Principal component analysis and (b) component matrix information for sediment parameters in Baiyangdian Lake.
Sustainability 17 10184 g007
Table 1. Classification criteria for comprehensive pollution index (FF), organic pollution index (OPI), and organic nitrogen index (ONI) in Baiyangdian Lake sediments.
Evaluation Methodology-Classification of Integrated Pollution Levels of Baiyangdian Sediments
ClassificationSTNSTPFF
Clean<1.0<0.5<1.0
Slightly polluted1.0–1.50.5–1.01.0–1.5
Moderately polluted1.5–2.01.0–1.51.5–2.0
Heavily polluted>2.0>1.5>2.0
Organic pollution index (OPI)Organic nitrogen index (ONI)
Threshold intervalPollution levelThreshold intervalPollution level
<0.05Clean<0.033Clean
≥0.05–<0.20Subclean≥0.033–<0.066Subclean
≥0.20–<0.50Fairly clean≥0.066–<0.133Fairly clean
≥0.50Organic Contamination≥0.133Organic Contamination
Table 2. Comparison of nutrient concentrations in surface sediments.
LakesProvincesOrganic Matter (mg/kg)TN
(mg/kg)
TP
(mg/kg)
References
Poyang LakeJiangxi15,9001340460[19]
Taihu LakeJiangsu12,800860560[20]
Chaohu LakeAnhui64,8001794792[14]
Dongting LakeHunan20,6001340294[21]
Wuliangsu SeaInner Mongolia30501570410[22]
Hengshui LakeHebei93,22618501020[13]
BaiyangdianHebei120,50036772038This work
Table 3. Percentage of sites in Baiyangdian Lake in the different OPI and ONI categories.
IndexAll WatersOpen PrecipitationWatercoursesDitchesFishpondsMarshes
OPI
Clean (I)000000
Subclean (II)1.100.280.83000
Fairly Clean (III)6.082.203.040.280.280.28
Organic Contamination (IV)92.8226.2439.515.488.563.04
ONI
Clean (I)000000
Subclean (II)0.830.280.55000
Fairly Clean (III)5.521.932.480.280.550.28
Organic Contamination (IV)93.6526.5240.3315.478.293.04
Table 4. Pearson correction coefficients for organic matter and nutrients in the surface sediments of Baiyangdian Lake.
NutrientTCTNTPOMC/N
TC1
TN0.943 *1
TP0.314 **0.353 **1
OM0.659 **0.696 **0.225 *1
C/N−0.189 *−0.424 *−0.228 **−0.343 **1
** indicates a significant correlation at the 0.01 level (two-tailed).
Disclaimer/Publisher’s Note: The statements, opinions and data contained in all publications are solely those of the individual author(s) and contributor(s) and not of MDPI and/or the editor(s). MDPI and/or the editor(s) disclaim responsibility for any injury to people or property resulting from any ideas, methods, instructions or products referred to in the content.