Article

Application of a Multi-Component Conditioner as a Sustainable Management Practice for Enhancing Soil Properties and Hordeum vulgare L. Growth and Yield

by
Jacek Długosz
1,
Karol Kotwica
2,
Ewelina Przybyszewska
3 and
Anna Piotrowska-Długosz
1,*
1
Department of Biogeochemistry, Soil Science, Irrigation and Drainage, Bydgoszcz University of Science and Technology, Bernardyńska 6/8 Street, 85-029 Bydgoszcz, Poland
2
Department of Agronomy, Bydgoszcz University of Science and Technology, S. Kaliskiego 7 Street, 85-796 Bydgoszcz, Poland
3
NaturalCrop Poland Ltd., KEN Avenue 57/2, 02-797 Warsaw, Poland
*
Author to whom correspondence should be addressed.
Sustainability 2025, 17(22), 10169; https://doi.org/10.3390/su172210169
Submission received: 2 September 2025 / Revised: 7 November 2025 / Accepted: 10 November 2025 / Published: 13 November 2025
(This article belongs to the Special Issue Sustainable Environmental Analysis of Soil and Water)

Abstract

The purpose of this study was to evaluate how a multi-component soil conditioner consisting of zeolite, calcium carbonate, potassium humate, and Ascophyllum nodosum extract affects selected soil properties (physical, chemical, and water-related properties, as well as microbial and enzymatic properties) and the growth and grain yield of spring barley (Hordeum vulgare L.). To achieve the goal, one-year research experiments were conducted at three conventionally tilled sites, which were situated on farms across three geographically separate regions in the Kuyavian–Pomeranian Region of Midwestern Poland. Most of the chemical properties, namely, total organic C, total N, pH in KCl, cation exchangeable capacity (CEC), as well as exchangeable (Mg, Ca, K, and Na) and available (Mg, K, and P) forms of nutrients, were not significantly affected by the conditioner or sampling time. Independent of the study location, the percentage of macropores in total porosity (TP) and dissolved nitrogen content (DNt) determined in July were considerably greater in the soil treated with Solactiv compared to the reference soil. Bulk density (BD), in turn, showed the opposite tendency, also suggesting the positive effect of the studied conditioner. At all study sites, application of the conditioner significantly reduced the percentage of micropores in total porosity (TP) (by 17%), while significantly increasing the content of macropores in TP (15%) and enhancing the percentage of available and readily available water capacity (8.5% and 14%). No clear changes in the results of C and N form and enzymatic activity were noted. The activities of DHA and FDAH behave differently in each study site, making it difficult to draw clear conclusions. The cellulase was the only enzyme that was significantly and positively affected by Solactiv at all study sites and for both sampling times. The values of dry matter of roots and plants, barley root length and surface, and barley grain yield were considerably greater in soil amended with Solactiv compared to the reference soil. Because some important soil and plant properties showed a positive response toward the tested conditioner, despite the low dose used, further studies should be conducted at a larger scale, focusing on different soils and plants.

1. Introduction

Agricultural productivity and crop yields are closely associated with soil health and fertility [1]. Unfortunately, currently soil resources worldwide face significant threats from overuse, degradation, and permanent loss due to the unbalanced soil management practices and changes in land use, as well as extreme weather and climate change and events (droughts and floods) [2,3]. Widely used agricultural practices such as intensive tillage and the application of high doses of synthetic fertilisers and pesticides, combined with minimal use of organic manure and cover crops, contribute substantially to ongoing soil deterioration as manifested by loss of organic matter, reduction in microbial diversity, and soil compaction and erosion [4]. Changes in soil moisture are important for the general health of soil because they significantly affect its overall biological activity, organic matter transformation, and nutrient cycling [5].
Poland has a significant area of agricultural land, though this is systematically decreasing. Moreover, the quality of agricultural soils in Poland is also a topic of concern, since over 40% of the country’s farmland comprises poor-quality sandy soils with limited agricultural potential [6]. These soils contain insufficient organic carbon and clay content, resulting in low cation exchange capacity (CEC) [7], making them highly vulnerable to drought conditions and nutrient loss through leaching. Additionally, approximately 80% of cultivated land shows varying degrees of acidification, and four million hectares require lime treatment [7].
In response to global and progressive soil deterioration and fertility loss, different soil additives and conditioners targeting specific soil-related problems are being developed and applied to limit soil degradation and improve soil quality worldwide [8,9,10,11,12,13,14]. Conditioners are natural or synthetic materials added to soil to improve its chemical, physical, microbial, or biochemical properties [8]. The primary aims of their application are to increase soil fertility by providing nutrients to plants; improve soil structure by enhancing soil aeration and drainage and diminishing excessive soil compaction; mitigate soil alkalinity or salinity by adjusting soil pH; and improve soil biological activity by activating soil microorganisms and their enzymes [11,12,13,14,15,16,17,18,19,20]. Therefore, soil conditioners should be dedicated to specific soil types; for example, use materials like compost, mulch, or biochar to improve sandy or coarse soils by enhancing water retention and fertility [21]. For heavy clay soils that hold too much water, materials such as gypsum or other conditioners that improve drainage and aeration are more suitable. Lime-based products have been successfully used in acid soils to reduce acidity [22]. Conditioners containing humic acid salt have been used to enhance root development and plant growth [15,23], while hydrogel and zeolite formulations have been applied to improve water retention [24]. A large group of commonly used conditioners comprises microbial preparations containing beneficial bacteria and fungi to improve soil biological activity [25,26].
Soil conditioners are often applied in relatively high doses (e.g., zeolites and biochar are applied in the dose of 5–10 t ha−1), which can have an adverse environmental effect, caused by conditioner compounds or their degradation products, and generate higher costs of plant cultivation, e.g., [27]. Using appropriate doses helps avoid excessive applications that could be uneconomical or lead to negative environmental impacts. An unexplored scientific gap in current soil conditioner application is the application of multiple conditioners as mixtures, thus reducing individual application rates by possible complementarities derived from the interaction of diverse components, e.g., [12,17]. Integrated approaches that combine soil conditioners with other strategies can enhance the positive feedback and the effectiveness of the conditioner over time. For example, combining biochar and compost can improve water retention, microbial activity, and nutrient sorption more effectively than either material alone [17]. Similarly, organic conditioners mixed with bio-organic fertilisers and micronutrients boost microbial communities and nutrient availability, resulting in better crop growth [9,10]. Other mixed conditioners, such as gypsum and biochar, can have a significant synergistic effect in improving salt-affected soils by reducing exchangeable sodium and increasing microbial biomass [13]. Additionally, the effect of low application rate is also important from an economic point of view.
In this study, we used Solactiv, a commercially available, innovative multi-component mineral–organic soil conditioner containing four synergistic components: (1) zeolite-clinoptilolite for enhanced soil sorption and water retention, (2) calcium carbonate for pH stabilisation, (3) potassium humate (originating from leonardite), which is rich in humic acids for improving soil health and plant growth. The literature reports that each of these components has exhibited a significant effect on soil and/or plant properties [18,28]. Zeolites, due to their intrinsic adsorption capacity, offer multiple benefits for soil environments by improving water retention in sandy soils and increasing porosity in clay-rich soils. Additionally, soils amended with zeolites showed increased CEC and enhanced nutrient retention [29]. They retain nutrients and serve as carriers that slowly release mineral nutrients after application, consequently improving yields and quality of crops [13,30,31,32]. Potassium humates, which are salts of humic acid originating from lignite brown coal, are considered to be a potential soil conditioner that works by improving SOM content, soil porosity, and water-holding capacity (WHC) as well as cation exchange capacity (CEC) [33,34]. Other studies have indicated that potassium humates activated plant growth by promoting root development, increasing nutrient uptake efficiency, and improving stress tolerance [15,35]. Positive responses in plant properties were also noted for the application of seaweed extracts (with spp. Ascophyllum, Fucus, and Laminaria being the most commonly used genera) as biostimulants, wherein both solid (granules) and liquid (drip and foliar spray) forms of application were used [19,36]. The application of seaweed extracts, being a source of phytohormones, polysaccharides and minerals, positively affected seed germination [11], shoot and root growth [37], nutrient use efficiency [11,38] reduction in biotic and abiotic stress [18,39,40] and improvements in crop yield and quality [41,42] and soil properties, e.g., soil microbial and enzymatic properties [43,44].
In the only study on the effect of Solactiv on soil properties carried out in soil under maize cultivation [45], the enzymatic activity increased significantly, while no such positive response was found for the amount of C and N determined in microbial biomass. Additionally, the application of the studied conditioner enhanced the content of available K (by about 11%), as well as improving soil water storage by increasing available water capacity (AWC). Because of the promising results obtained in the above-mentioned studies carried out under maize cultivation, further research related to other important agricultural plants is expected. Additionally, while most research on soil conditioners and their components demonstrates benefits for plant and soil properties under controlled laboratory conditions, e.g., [46], fewer studies have examined their effectiveness in the actual field environment, e.g., [47,48]. Accordingly, this study evaluated the field-based effectiveness of the selected conditioner under spring barley cultivation. We hypothesised that the conditioner with a multi-component formulation, besides a low dose used, would significantly improve soil properties (mainly microbial and biochemical variables, nutrient availability, and water properties) in an intensively managed field. We also hypothesised that the conditioner would increase spring barley growth and yield. To investigate the assumed hypotheses, this study aimed to evaluate how Solactiv affects a range of soil characteristics and spring barley growth and productivity across field trials at three study sites.

2. Materials and Methods

2.1. Description of the Experimental Fields and Soil Sampling

The influence of Solactiv on a range of soil features and spring barley growth and yield was investigated in three annual trials under conventional tillage practices. All research locations were situated on farms in three distinct mesoregions in the Kuyavian–Pomeranian Region (Midwestern Poland): Agriculture Cooperative Zjednoczeni in Janocin (52°36′24.6″ N 18°25′11.9″ E), an individual farm in Kobylnica (52°35′10.4″ N 18°26′46.3″ E), and an individual farm in Samsieczynek (53°13′36.4″ N 17°40′57.9″ E) (Figure 1).
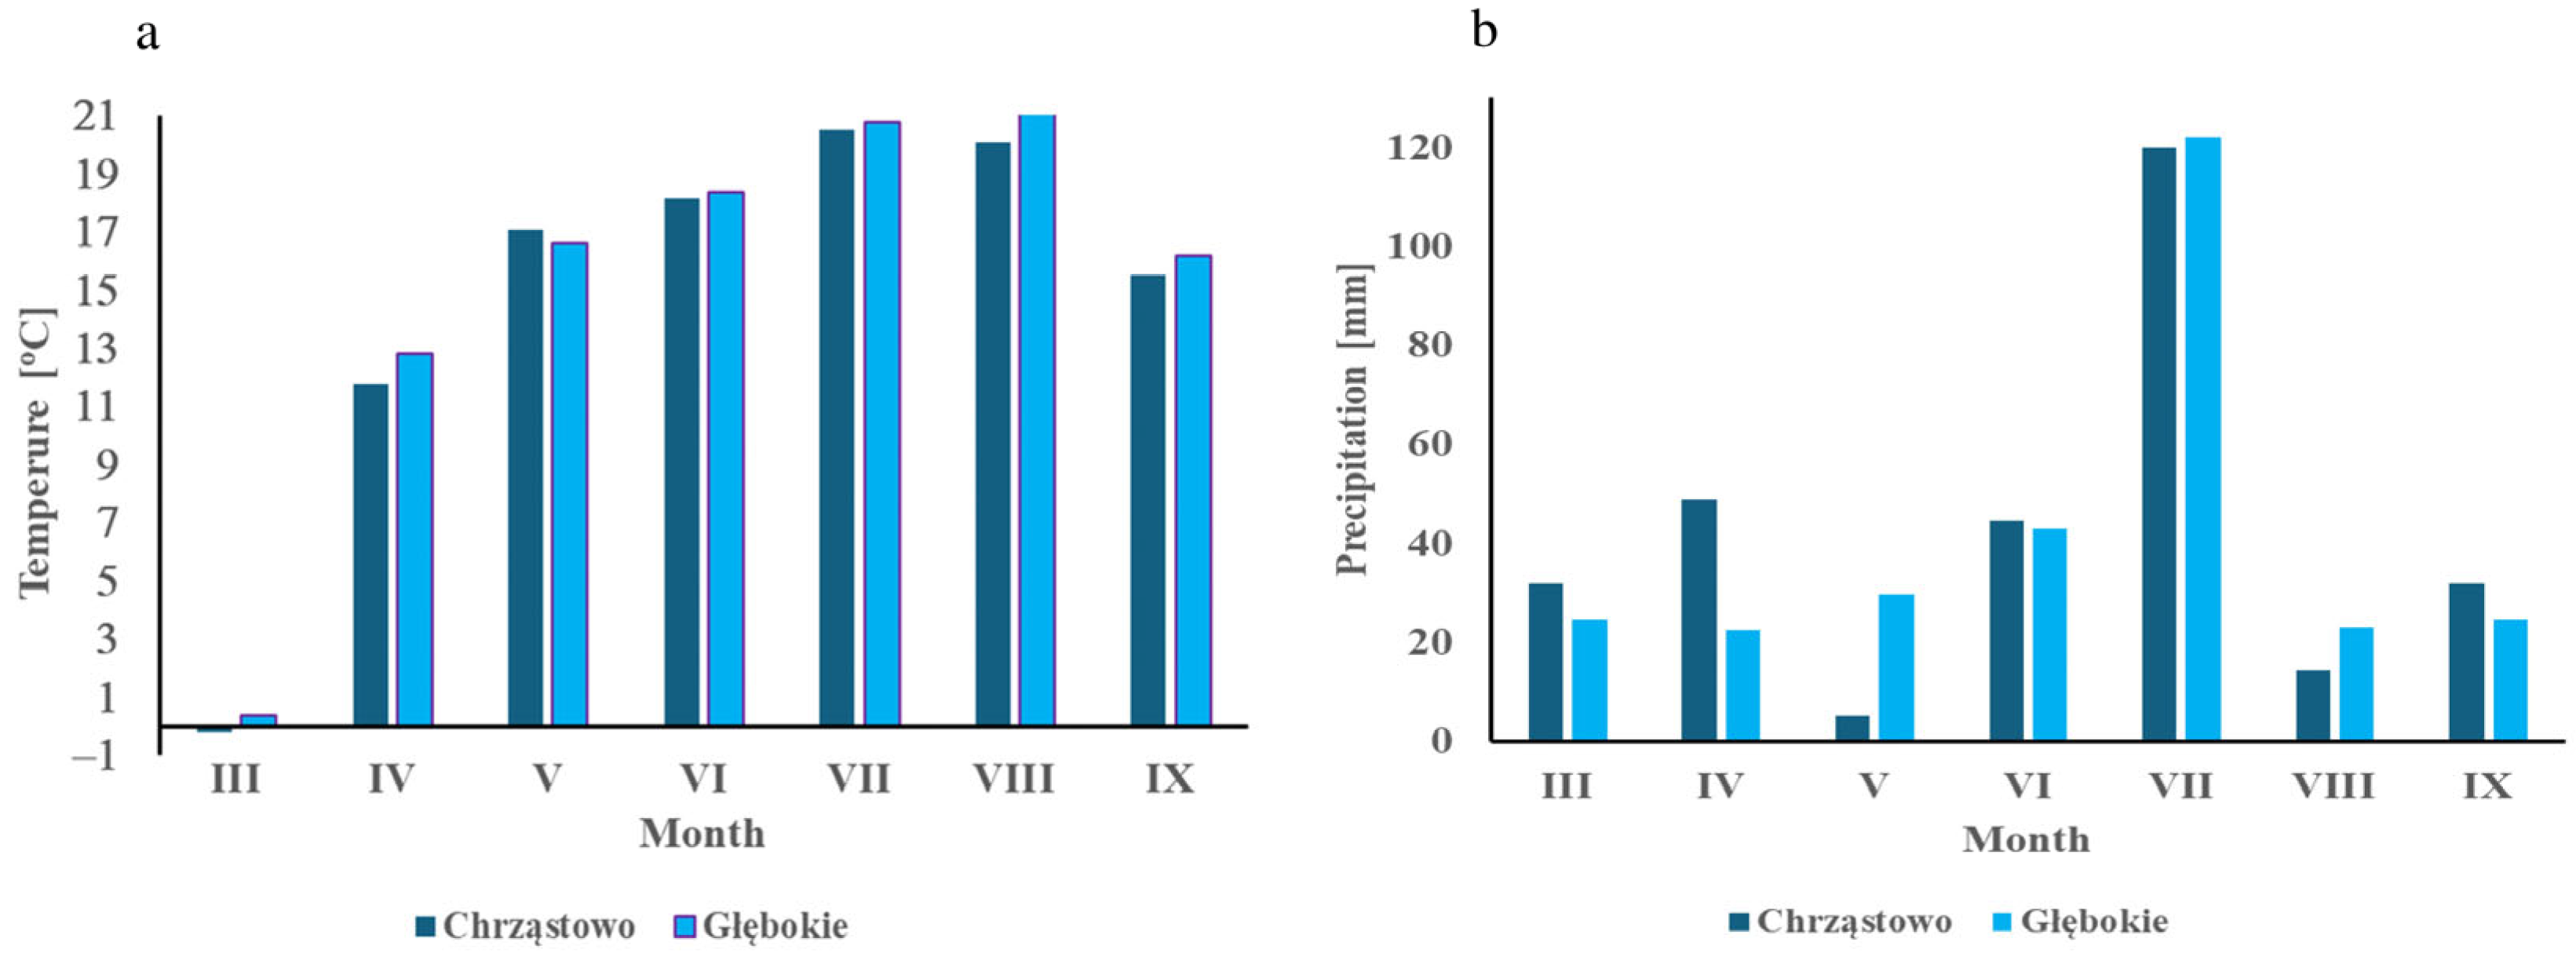
The research sites are situated in a temperate zone characterised by variable climate conditions, where North Atlantic maritime air masses meet continental air masses from the east. This convergence results in considerable daily and annual fluctuations in meteorological patterns. Weather data for the sampling periods were collected from nearby meteorological stations positioned close to the research locations (specifics are provided in Figure 2). Based on the IUSS Working Group WRB classification system, the examined soils were categorised as Haplic at Janocin, Haplic Luvisols at Kobylnica, and Albic Luvisols at Samsieczynek [49]. The basis for this classification was the finding of the presence of an agric diagnostic horizon in all profiles studied, and also the albic horizon in the soil from the Samsieczynek site. The soils across all locations developed from glacial till deposits. The upper soil layers at every study site have a sandy loam texture. Detailed information about the applied mineral fertilisation is given in Table S1.
An experimental area was established at each study site and separated into two equal sections (fields). One experimental section was managed with a tested conditioner at a rate of 300 kg ha−1 following the manufacturer’s suggested application rate (no additional benefits were observed at higher rates), while the other section served as an untreated control. The soil conditioner was applied prior to spring barley sowing and incorporated into the soil to a depth of 12 cm using cultivation equipment.
The tested conditioner contains the following components: (1) zeolite—50%, (2) calcium carbonate [CaCO3]—47.5%, (3) potassium humate powder—2%, and (4) the extract of Ascophyllum nodosum—0.5%. The zeolite applied in the Solactiv production originated from Western Slovakia and is supplied by the company Zeocem, Inc. (Bystré, Slovakia). Although clinoptilolite is the primary mineral in the zeolite used (84%), cristobalite, illite, and feldspars were also found in its composition. The specific surface area of the applied zeolite, estimated using the Brunauer–Emmett–Teller (BET) technique, ranged from 31.4 to 35.4 m2 g−1, indicating that this particular zeolite has a relatively moderate surface area compared to some other zeolites [50]. Two primary raw materials were used for conditioner production. First, Ascophyllum nodosum seaweed extract was acquired from Atlantic Ocean waters near Ireland through the Irish company BioAtlantis Ltd. (Tralee, Ireland). The extract’s organic matter (8–12%) includes alginate (27%), fucoidan (11%), phlorotannin (1%), and mannitol (1%). Potassium humate powder (95%, with 60–65% humic acids) from Humic Growth Solution, Inc. was also used as a pure material for conditioner production. It contained 60–65% humic acid derived from premium North American sources of weathered, oxidised sub-bituminous coal rich in humic compounds. This study used potassium humate with 95% purity, sourced from Humic Growth Solution, Inc. (Jacksonville, FL, USA), as another basic component for conditioner production. This component was extracted from leonardite—high-quality oxidised lignite (brown coal) sourced from the richest natural deposits located in North America, particularly in the western regions.
Bulk density and water-related properties were determined once (after barley harvesting), while the changes in other soil properties were assessed in samples collected twice: before barley sowing (prior to Solactiv application) and shortly after barley harvest. Twenty soil samples each were collected from both treated and control fields at each location. A hand auger was used to collect soil material from the Ap horizon (down to a depth of approximately 25–30 cm) at systematic intervals throughout the field zone (30 m × 10 m). At each grid point, ten individual sub-samples were randomly gathered within a two-metre radius and then combined to form the composite samples. To determine soil enzymatic activity and soil microbial biomass C and N, the soil samples were placed in plastic containers (which permitted gas exchange) and chilled to 4◦C in order to minimise any changes in the populations of microorganisms. The microbial and enzymatic activity was determined within two weeks based on fresh soil samples. The soil samples used to determine the physicochemical properties of the soil were air-dried and sieved (2 mm).

2.2. Determination of Soil Physicochemical Properties

The following analyses were performed on dry and sieved soil samples using the methodology commonly accepted in soil science [51]: the particle size was assessed based on the Casagrande method using the modification by Prószyński, and the sand fraction content was evaluated using the sieving method [52]. Total organic carbon (TOC) and total nitrogen (Nt) concentrations were assessed by dry combustion using a CN analyser –Vario Max CN (Elementar Analysensysteme GmbH, Langenselbold, Germany) [53]. Dissolved organic carbon and nitrogen (DOC and DNt) were extracted with 0.004 M CaCl2 for one hour at a 1:10 soil–solvent ratio and determined using a Multi N/C 3100 analyser (manufactured by Analityk, Jena, Germany) [53]. Each analysis was performed in triplicate, and mean values were presented. The obtained results were expressed as mg C (N) kg−1 dry soil weight. Atomic absorption spectrometry (AAS) using a Philips PU 9100X apparatus (Eindhoven, The Netherlands) was employed to measure available magnesium and potassium levels after extraction with 0.0125 M CaCl2 (for Mg) [54] and the Egner–Riehm DL method [55] (for K and P). The potassium content in the solution was determined by Atomic absorption spectrometry (AAS) using a Philips PU 9100X apparatus. Phosphorus was determined by the colorimetric method, and was measured using a spectrophotometer UV Vis Evolution 220 (Thermo Scientific, Waltham, MA, USA). The contents of exchangeable nutrients (Mg, Ca, K, Na) were analysed in 0.1 M BaCl2 solutions [56]. Soil pH was determined potentiometrically in 1 M KCl (1:2.5 soil-to-solution ratios) [57], and hydrolytic acidity (Hh) was measured in 1M CH3COONa [58]. Moisture content was obtained gravimetrically after 24 h drying at 105 °C [59]. The effective cation exchange capacity (CEC) was presented as a sum of the Hh and basic saturation (BS) values [56]. Bulk density and water retention measurements were conducted on cylindrical soil samples with four replicates each [60]. The total porosity (TP) was calculated using the following formula: TP = (Sw − So) · Sw−1 · 100 (%) [60]. Properties related to the water retention were determined using low- and high-pressure chambers (pF range 0–2.7 and pF range 3.0–4.2, respectively). Volumetric water capacities (VWC) were evaluated at soil water potentials of 98.1 hPa (pF 2.0), 981.0 hPa (pF 3.0), and 15,547.9 hPa (pF 4.2) [60]. Pore volume categories and corresponding water capacities were calculated in the following way: macropores (as the difference between total porosity and VWC at pF 2.0), micropores (Wvol. at pF 4.2), and mesopores representing potentially useful water retention or available water capacity (AWC) (as the difference between VWC at pF 2.0 and at pF 4.2). Additionally, the readily available water capacity (RAWC) (the difference between VWC at pF 2.0 and VWC at pF 3.0) and small pore available water capacity (SAWC) (the difference between VWC at pF 3.0 and VWC at pF 4.2) were determined as the components of available water capacity (AWC) [60].

2.3. Soil Enzymatic and Microbial Biomass Content

The method of Thalmann et al. [61] was used to evaluate soil dehydrogenase activity (DHA). Briefly, a soil sample (1 g) was mixed with 1% TTC solution (triphenyltetrazolium chloride) and TRIS buffer (100 mM, pH between 7.4 and 7.8) and left in a shaking incubator for 24 h at 30 °C. After incubation, acetone was added to extract the reaction product (triphenyl formazan—TPF). The soil suspensions were then filtered, and the optical density of the clear filtrate was measured spectrophotometrically at 546 nm using a spectrophotometer UV Vis Evolution 220 (Thermo Scientific, Waltham, MA, USA). The DHA was presented as mg of TPF released per kg dried soil (mg TPF kg−1 24 h−1). The total soil hydrolysis activity was determined by the method outlined by Adam and Duncan [62]. Soil samples with natural moisture content were mixed with a phosphate-buffer solution (60 mM, pH 7.6) that contained fluorescein diacetate salt as a substrate. After a one-hour incubation at 37 °C, the reaction was stopped by adding a methanol–chloroform solution (1:2 ratio). The soil mixture was then subjected to centrifugation (3000 rpm) using Beckman GS-6R centrifuge (Beckman Coulter Life Science, Indianapolis, IN, USA), and the absorbance of clear supernatant was measured colorimetrically at 490 nm wavelength using a spectrophotometer UV Vis Evolution 220 (Thermo Scientific, Waltham, MA, USA). The level of the FDAH activity was quantified as milligrams of fluorescein generated per kilogram of soil per hour (mg F kg−1 h−1). Cellulase (CEL) activity was measured following the procedure described by Schinner and von Mersi [63]. This involves incubating field-moist soil samples with the acetate buffer (50 mm, pH 5.5) and carboxymethylcellulose solution (serving as a substrate) for 24 h at 50 °C. The hydrolysis products (reducing sugars) generated during the incubation period were quantified spectrophotometrically at 690 nm wavelength using a spectrophotometer UV Vis Evolution 220 (Thermo Scientific, Waltham, MA, USA). The CEL activity levels were expressed as milligrams of glucose liberated per kilogram of dry soil per hour (mg Glu kg−1 h−1).
The content of microbial biomass carbon and nitrogen (MBC, MBN) was evaluated using the chloroform fumigation–extraction protocol outlined in Brookes et al. [64] and Vance et al. [65], respectively. The selected method assumes fumigation of soil samples with chloroform to lyse microbial cells, followed by extraction of the released C and N. Soil samples (25 g) with controlled moisture content (50%) were exposed to ethanol-free chloroform (CHCl3) at 25 °C for a 24 h period. After incubation time, the chloroform was removed through successive evacuation using a vacuum pump. Both fumigated samples and untreated control soils were then processed with 0.5 M K2SO4 solution (using a 5:1 ratio) for half an hour and examined for soluble carbon concentrations according to the protocol proposed by Vance et al. [65]. In turn, the content of total nitrogen was evaluated using the method developed by Bremner and Mulvaney [66]. The correction factor of 0.38 (kEC) [65] was applied to adjust for the recovery of MBC, while the factor of (0.54 = kEN) [67] was used to calculate the real values of MBN content. The difference in extractable C and N between fumigated and control samples, after using the appropriate correction factors, gives the correct results of microbial biomass content.

2.4. Plant Characteristics

At each experimental location, plant biomass was collected for analysis during the earing stage of spring barley (BBCH 55–56) from five measurement points within each experimental replication. At a single point, a soil clod containing plants and their roots (20 cm × 20 cm × 25 cm) was dug up. Immediately after the plants were dug up, two individuals were separated from the soil in a water wash and then weighed as a whole (shoot and root) to determine their fresh weight. The plants were then divided into aboveground and belowground parts and weighed again to determine the fresh weight of the shoot and root parts. To determine the dry weight of the whole spring barley plants, from their aboveground parts and from their roots, fresh plant biomass obtained from each experimental site was dried at 105 °C and then weighed [68]. Root analysis determined the total root length, root area, and average root diameter. A portion of the roots of individual spring barley plants, previously prepared for dry weight analysis, was used for the analysis. A digital scanning system was used in the study, so the prepared roots were stained with a methylene blue solution to enhance contrast before scanning. During the analysis, each root sample was evenly distributed in a water layer on a transparent tray and scanned at 200 dpi using an Epson Expression 836 L system scanner (Seiko Epson Corporation, Nagano, Japan). The roots were analysed for total root length, root system area, and average root diameter using WinRHIZO v. 5.0 software from Regent Instruments Inc., Quebec City, QC, Canada. Spring barley grain was harvested from the experimental units of individual research sites using a Wintersteiger Classic plot combine harvester equipped with a cutting table with a belt feeder with a working width of 1250 mm (in Janocin and Kobylnica). Grain harvested from individual experimental units was weighed, and its actual moisture content was determined. Grain yield was expressed in t/ha at 15% water content.

2.5. Statistical Calculations

The Shapiro–Wilk test (Statistica v. 13.3, TIBCO Software Inc., based in Palo Alto, CA, USA) revealed that the measured variables did not follow a normal distribution, so the data were subjected to logarithmic transformation. Since the transformation successfully improved distributional normality, all subsequent analyses were performed with the transformed dataset. We used one-way analysis of variance (ANOVA) to evaluate how the application of conditioner affected soil and barley characteristics as compared to the untreated controls, as well as to compare the results obtained from the two sampling times. The results of these analyses were the basis for performing a comprehensive ANOVA synthesis for all three study sites. In this synthesis, the study location served as a random effect, while conditioner application was the constant (mixed model). When ANOVA revealed statistically significant treatment effects, Tukey’s HSD post hoc test was used to identify specific differences between treatment means with significance determined at p < 0.05. To assess differences between soil samples, Principal Component Analysis (PCA) was performed on the mean values of all studied variables. Sample ordination was based on the first two principal components (PC1 and PC2). Dataset variability was quantified using the coefficient of variation (CV%), which was categorised following Wilding’s [69] classification system: low variability (CV = 0–15%), moderate variability (CV = 16–35%), and high variability (CV > 36%).

3. Results

3.1. Soil Chemical, Physical, and Water-Related Properties

Because no significant changes were obtained for chemical properties between study sites, the data presented in Table 1 are mean values for all study sites. Most of these properties, i.e., Corg, Ntot, pH in KCl, S, ECEC, basic saturation (BS), exchangeable forms of Mg, K, and Na, as well as available forms of P and Mg, were not significantly affected by conditioner application or sampling time.
The exception was the available K and exchangeable Ca content. The first of them was significantly higher in soil taken in March than in July, and the decline was approximately 11%, while the second one was 10% higher in soil collected after barley harvest than in soil taken in March. Further, the hydrolytic acidity (Hh) was significantly higher in soil destined for and treated with the conditioner than in control soil, and this relationship held for both sampling dates. The contents of Corg and Ntot were in the ranges 8.20–8.99 mg kg−1 and 1.07–1.13 mg kg−1, respectively. The soil pH in KCl was slightly acidic and ranged between 6.24 and 6.51. The concentration of Pavail was in the high class of its content (67–88 mg kg˗1) while the content of available Mg and K was in the average class according to PN-R-04023 [70]. Most of the chemical properties exhibited a moderate or small variability, as indicated by CV values between 7.6 and 33.6%. Only the Hh and exchangeable forms of Mg (in control soil), Ca (in both fields), K and Na (July, control soil) have a high variability (CV = 36.3–75.0%).
The studied soils are composed of 39.2% silt (from 0.05 to 0.002 mm) and 5.1% clay (< 0.002 mm) and displayed a moderate variability (Table 2).
Independent of the study location, bulk density (BD) was considerably lower in the samples collected from the area with the Solactiv compared to the control. When study sites were considered separately, this tendency was only true for one study site (Samsieczynek) (Table S2). The difference in total porosity (TP) between the fields with and without the tested conditioner was statistically insignificant, irrespective of the study location, as well as for soil samples taken from Janocin and Kobylnica (Table 2 and Table S2). Only in the soil sampled in Samsieczynek was TP markedly greater in soil amended with conditioner as compared to the control soil (Table S2). Based on the mean values for all study sites, the percentage of macropores in TP was significantly higher in soil amended with conditioner compared to the control soil. This was also true for soil samples analysed separately in two study sites (Kobylnica and Samsieczynek) (Table 2 and Table S2). At all study sites, the application of conditioner significantly reduced (by 17%) the percentage of micropores in TP, while significantly enhancing the percentage of AWC and RAWC (Table S2). In turn, the percentage of SAWC did not present significant differences between soil amended with conditioner and control soil derived from all three study sites. The soil’s physical and water-related features showed little and, in some cases, moderate variability (CV = 0.6–22.0%) (Table S2).

3.2. Carbon and Nitrogen: Dissolved Forms and Microbial Biomass

The dataset of soil C and N was discussed in two ways: based on means calculated for the study sites (to check the general tendency of changes) and for each study site independently (Table 3, Tables S3 and S4).
When the experimental sites were considered together, no significant differences in DOC concentration were noted between experimental fields (conditioner, control), while such a difference was found for DNt content determined in July (Table 3). For each of the study sites considered separately, the differences in the dissolved forms of C and N (DOC and DNt) between fields with and without conditioner were not significant on each sampling date, except for DOC content tested in soil from Samsieczynek (Table S3). The above observation was also true in the case of DNt for most of the differences between sampling times, although its content in the control soil was significantly higher in soil collected in March than in July. In the case of soil with Solactiv applied, this observation was only true in soil from the Janocin site. Taking into account the average for all research sites, the content of MBC and MBN in March was significantly higher in control soil than in soil destined for and treated with the conditioner, while after barley harvest (July), values of these properties were not significantly differentiated between the two experimental fields (control vs. soil treated with conditioner) (Table S3). The content of MBC and MBN determined for the Janocin study site was significantly higher in soil from the Solactiv field compared to the control soil (for both March and July). The same relationship was also noted for soil from Samsieczynek (March only) and Kobylnica (July only). The opposite tendency was found for soil collected from Samsieczynek in July (Table S4).
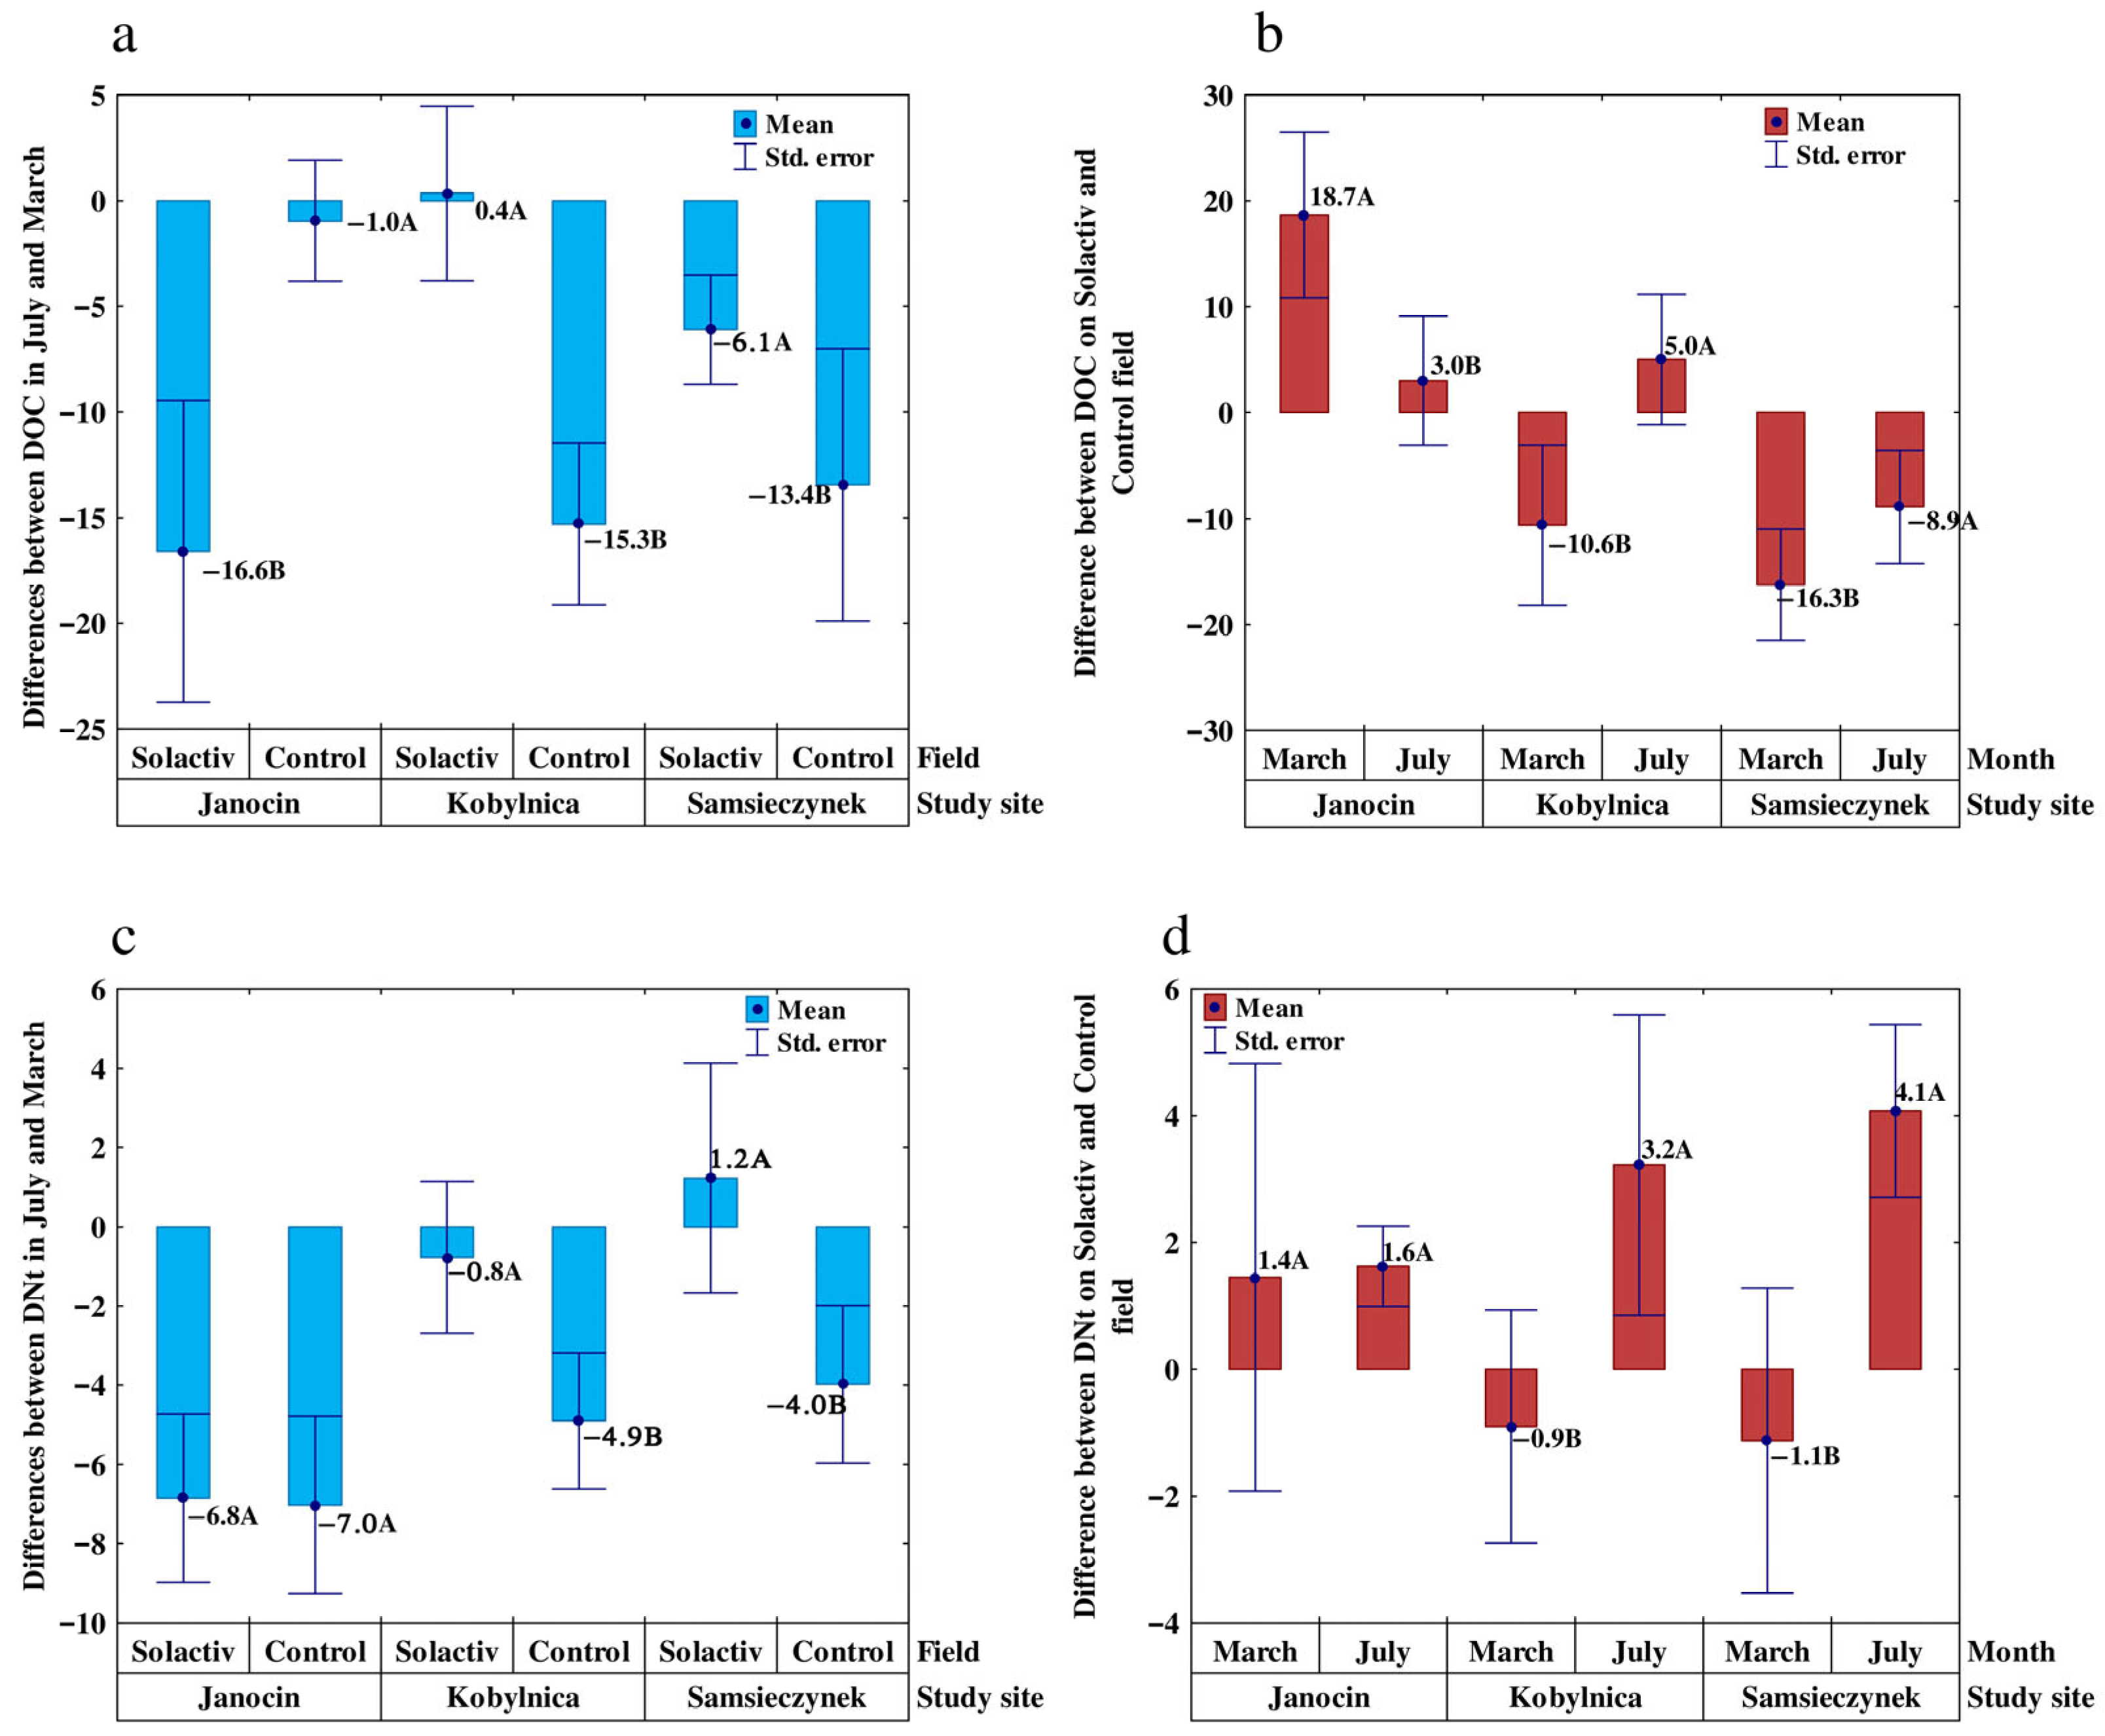
Because the layout of the basic dataset presented in Table 3, Table 4, Tables S3 and S4 does not show the precise effect of the applied conditioner on C and N forms, we have presented the level of differences between results obtained in July and March for the same field (control, conditioner) as well as variability between data obtained for conditioner and control soils for the same sampling month (March, July) (Figure 3 and Figure 4). This approach allows for a more accurate assessment of the influence of the conditioner (a significant increase or smaller decrease in content of the studied properties as compared to the control).
When analysing variability in DOC between July and March, a large decrease in its content was found in soil taken from the Solactiv field at the Janocin study site (16.6 mg kg−1) compared to the control field (1.0 mg kg−1). A similar tendency was also observed for DOC content at Samsieczynek, while the range of results was smaller.
The beneficial effect of the studied conditioner on DOC content was only noticed for soil from Kobylnica (Figure 3a). The decline in DNt concentration between July and March in control soil was 4.9 mg kg−1, whereas in soil with Solactiv it was only 0.8 mg kg−1, suggesting a positive effect of the conditioner on this property in soil taken from Kobylnica (Figure 3c). Additionally, differences in DNt content between July and March were also found in soil from Samsieczynek, and these favoured the Solactiv field. Considering the level of differences between results obtained in July and March for the same field (control and conditioner), we found the positive effect of the applied conditioner on DOC and DNt content in two of the three study sites (Figure 3b,d). However, this influence had a different nature as regards the study site. In soil from Kobylnica, a positive impact was found for both DOC and DNt content, whereas in the soil originating from Samsieczynek, a lower decrease in DOC content was determined in July than in March, and the positive impact of Solactiv was found for DNt concentration (4.1 mg kg−1).
There were no clear patterns for the content of MBC and MBN in the study sites regarding differences between results obtained in July and March for the same field (control and conditioner), as well as variability between data obtained for conditioner and control soils for the same sampling month (March and July) (Figure 4a–d).
Thus, in both approaches, no significant changes in these properties were found for soil collected from Janocin (Figure 4a–d), whereas in soil from Kobylnica, a lower decrease in MBC and MBN content was noted in soil taken from the field with Solactiv compared to the control (Figure 4a,c). In soil from Samsieczynek, in turn, large increases in the content of these properties were received in the control soil compared to the amended soil (76–MBC and 87–MBN) (Figure 3a,b). Additionally, the above properties exhibited a large reduction in contents in soil from Samsieczynek collected in July (compared to control soil), suggesting the negative influence of the studied conditioner on soil microbial C and N content (Figure 4b,d).

3.3. Soil Enzymatic and Microbial Properties

The results of enzymatic activity were analysed twofold: without division by study sites (to check the general tendency) (Table 4) and for each location separately (Table S4, Figure 5 and Figure 6).
When the study locations were considered together, all the studied enzymes revealed significantly higher activity in the soil that had been dedicated for Solactiv application (March) as well as in the soil after conditioner application (July) compared to the control soils (Table 4). The above observation was also true in most cases (enzyme and location) when the study sites were analysed separately (Table S4). The exception was the activity of FDAH and DHA determined in soil collected at Samsieczynek in July, as well as the activity of CEL evaluated for Janocin on both sampling dates and for Kobylnica in March (Table S4). Despite the fact that the dissimilarity between enzymatic activity in the soil taken from both sites (Solactiv and untreated plots) before and after the application of conditioner was statistically proven, they showed similar patterns, suggesting no conditioner effect on these variables.
Since the basic data presented in Table 4 and Table S4 did not clearly indicate either a significant influence (positive or negative) or a lack of influence of Solactiv on enzymatic properties, the level of differences between results obtained in July and March for the same field (control vs. Solactiv) as well as the variability between results received for conditioner and control soils for the same sampling time (March and July) were also presented (Figure 5 and Figure 6). The actual significant and positive impact of Solactiv was found only in the case of CEL activity. Accordingly, the differences in the CEL activity between July and March were significantly higher in soil taken from the Solactiv field compared to the control soil, and this pattern was observed at two of the three research locations (Figure 4a). Additionally, the CEL activity given as a difference between Solactiv and control fields was significantly higher in July than in March, which further confirms the positive effect of Solactiv on the CEL activity at all study sites (Figure 5b).
Considering the differences between the results obtained in July and March, the application of the conditioner significantly decreased the FDAH level in soil collected in Janocin; meanwhile, in soil taken from the two other locations, there were no significant changes in FDAH level between the field with Solactiv applied and the control site (Figure 6a). Additionally, the difference in FDAH level between Solactiv and control soils was significantly higher in March than in July in Janocin and Kobylnica, while the opposite trend was noted for the Samsieczynek study site (Figure 6b).
There were no clear differences in DHA due to the application of the Solactiv at any of the experimental sites (Figure 6c,d). Analysing the differences between results achieved in July and March has shown that the application of conditioner significantly increased the DHA at the Janocin study site, while for the other two study sites, the tendency was opposite (Figure 6c). Based on the differences between experimental fields (conditioner and control), the DHA was significantly higher in the soil studied in July (Janocin), while the opposite trend was noted for the other study sites (Figure 6d).

3.4. Properties Relating to the Growth and Yield of Spring Barley

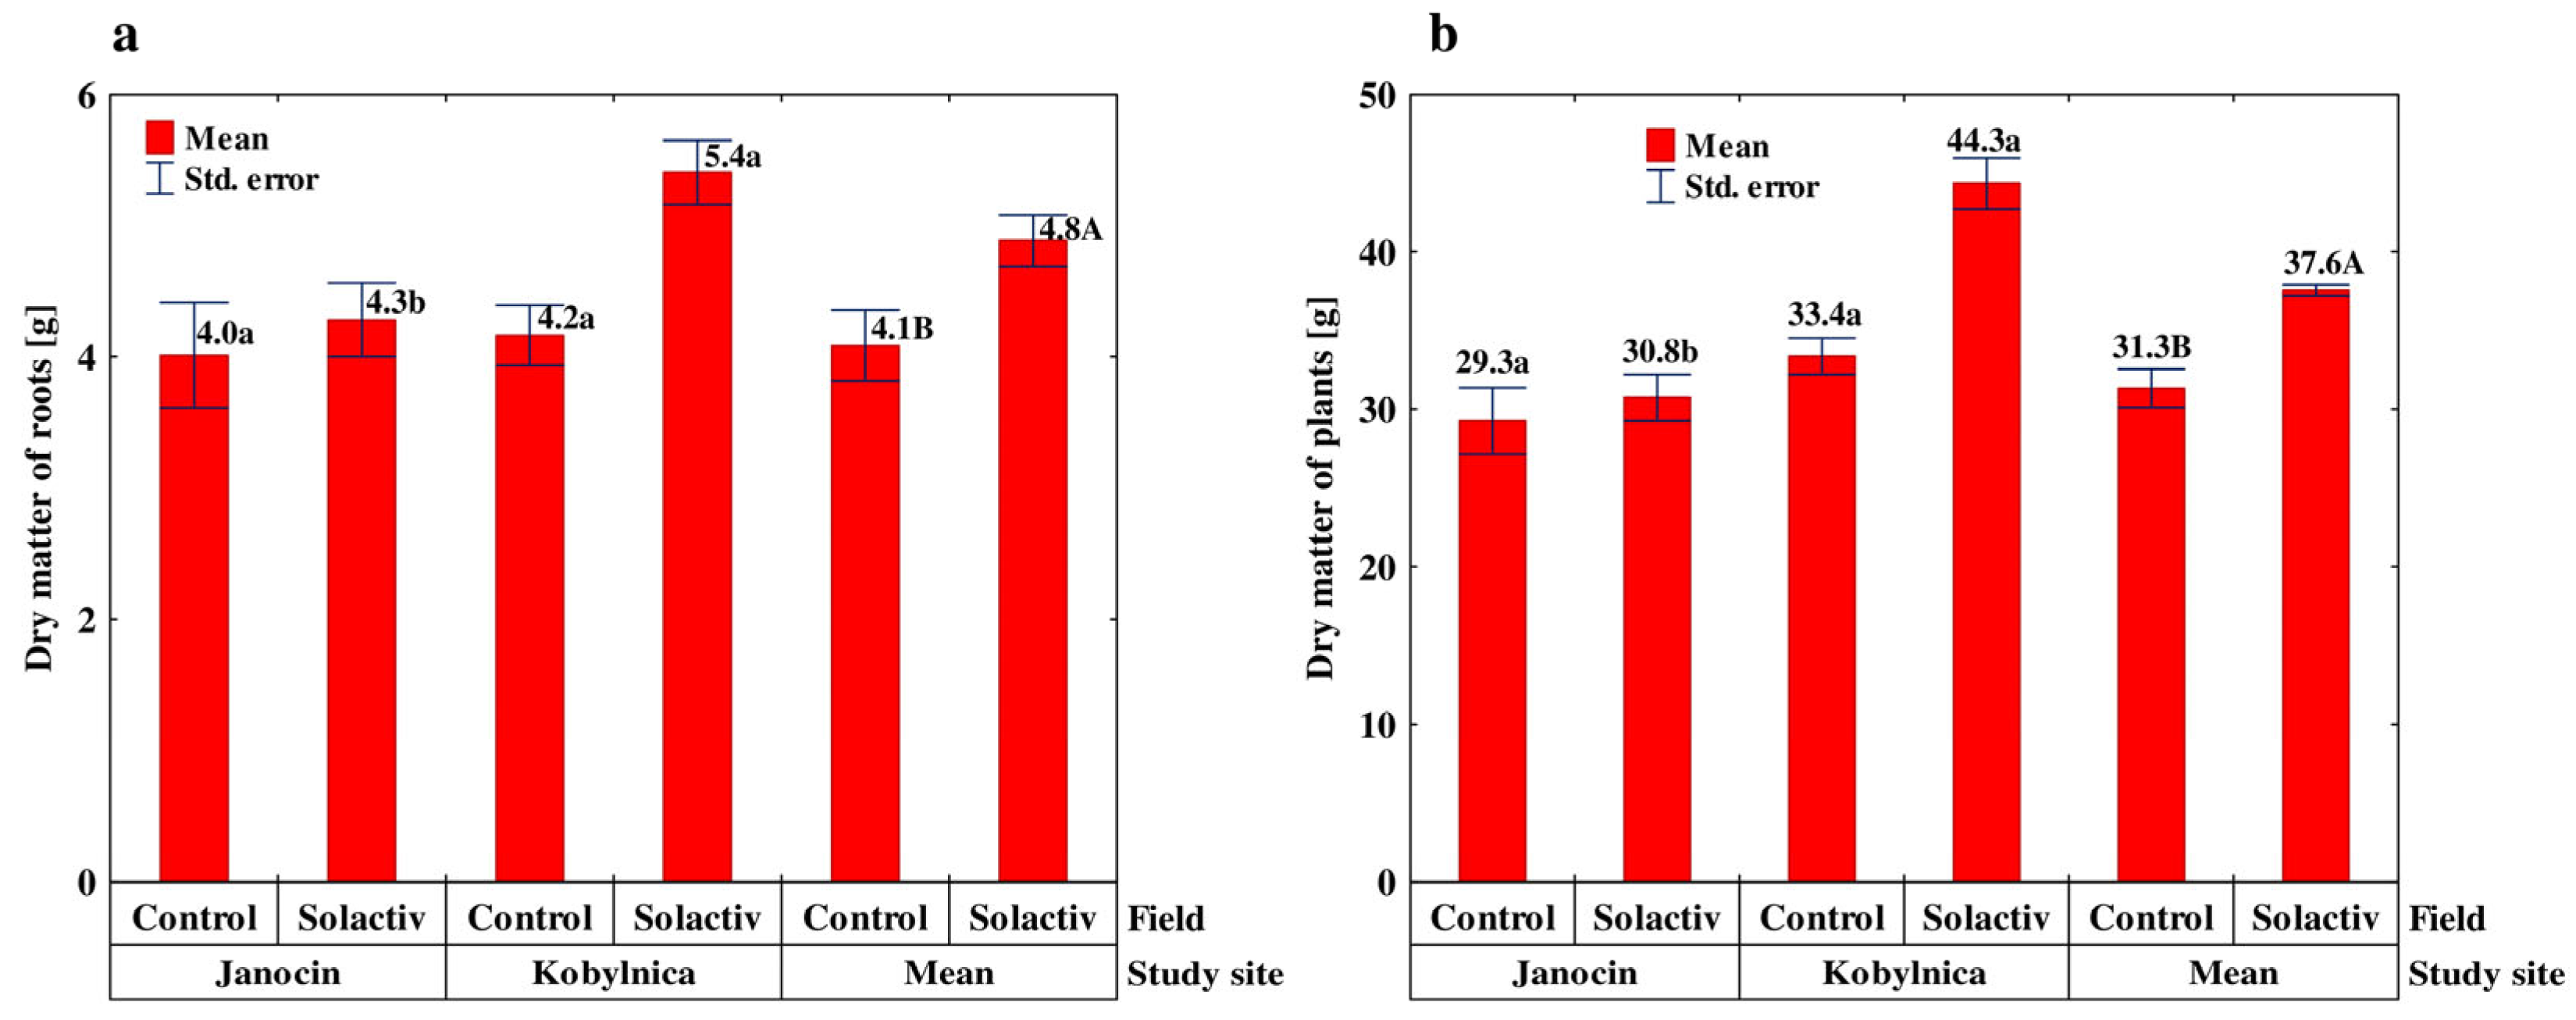
Dry matter of roots and plants (the sum of surface and subsurface parts) was considerably greater in soil amended with conditioner compared to the reference soil. This was true for both considered study sites, as well as for the mean values calculated for both study sites (Figure 7).
The influence of Solactiv was greater in soil collected from Kobylnica than from Janocin (results were, respectively, 22 and 25% higher). The same trend was found for the values of barley root length and surface (Figure 8).
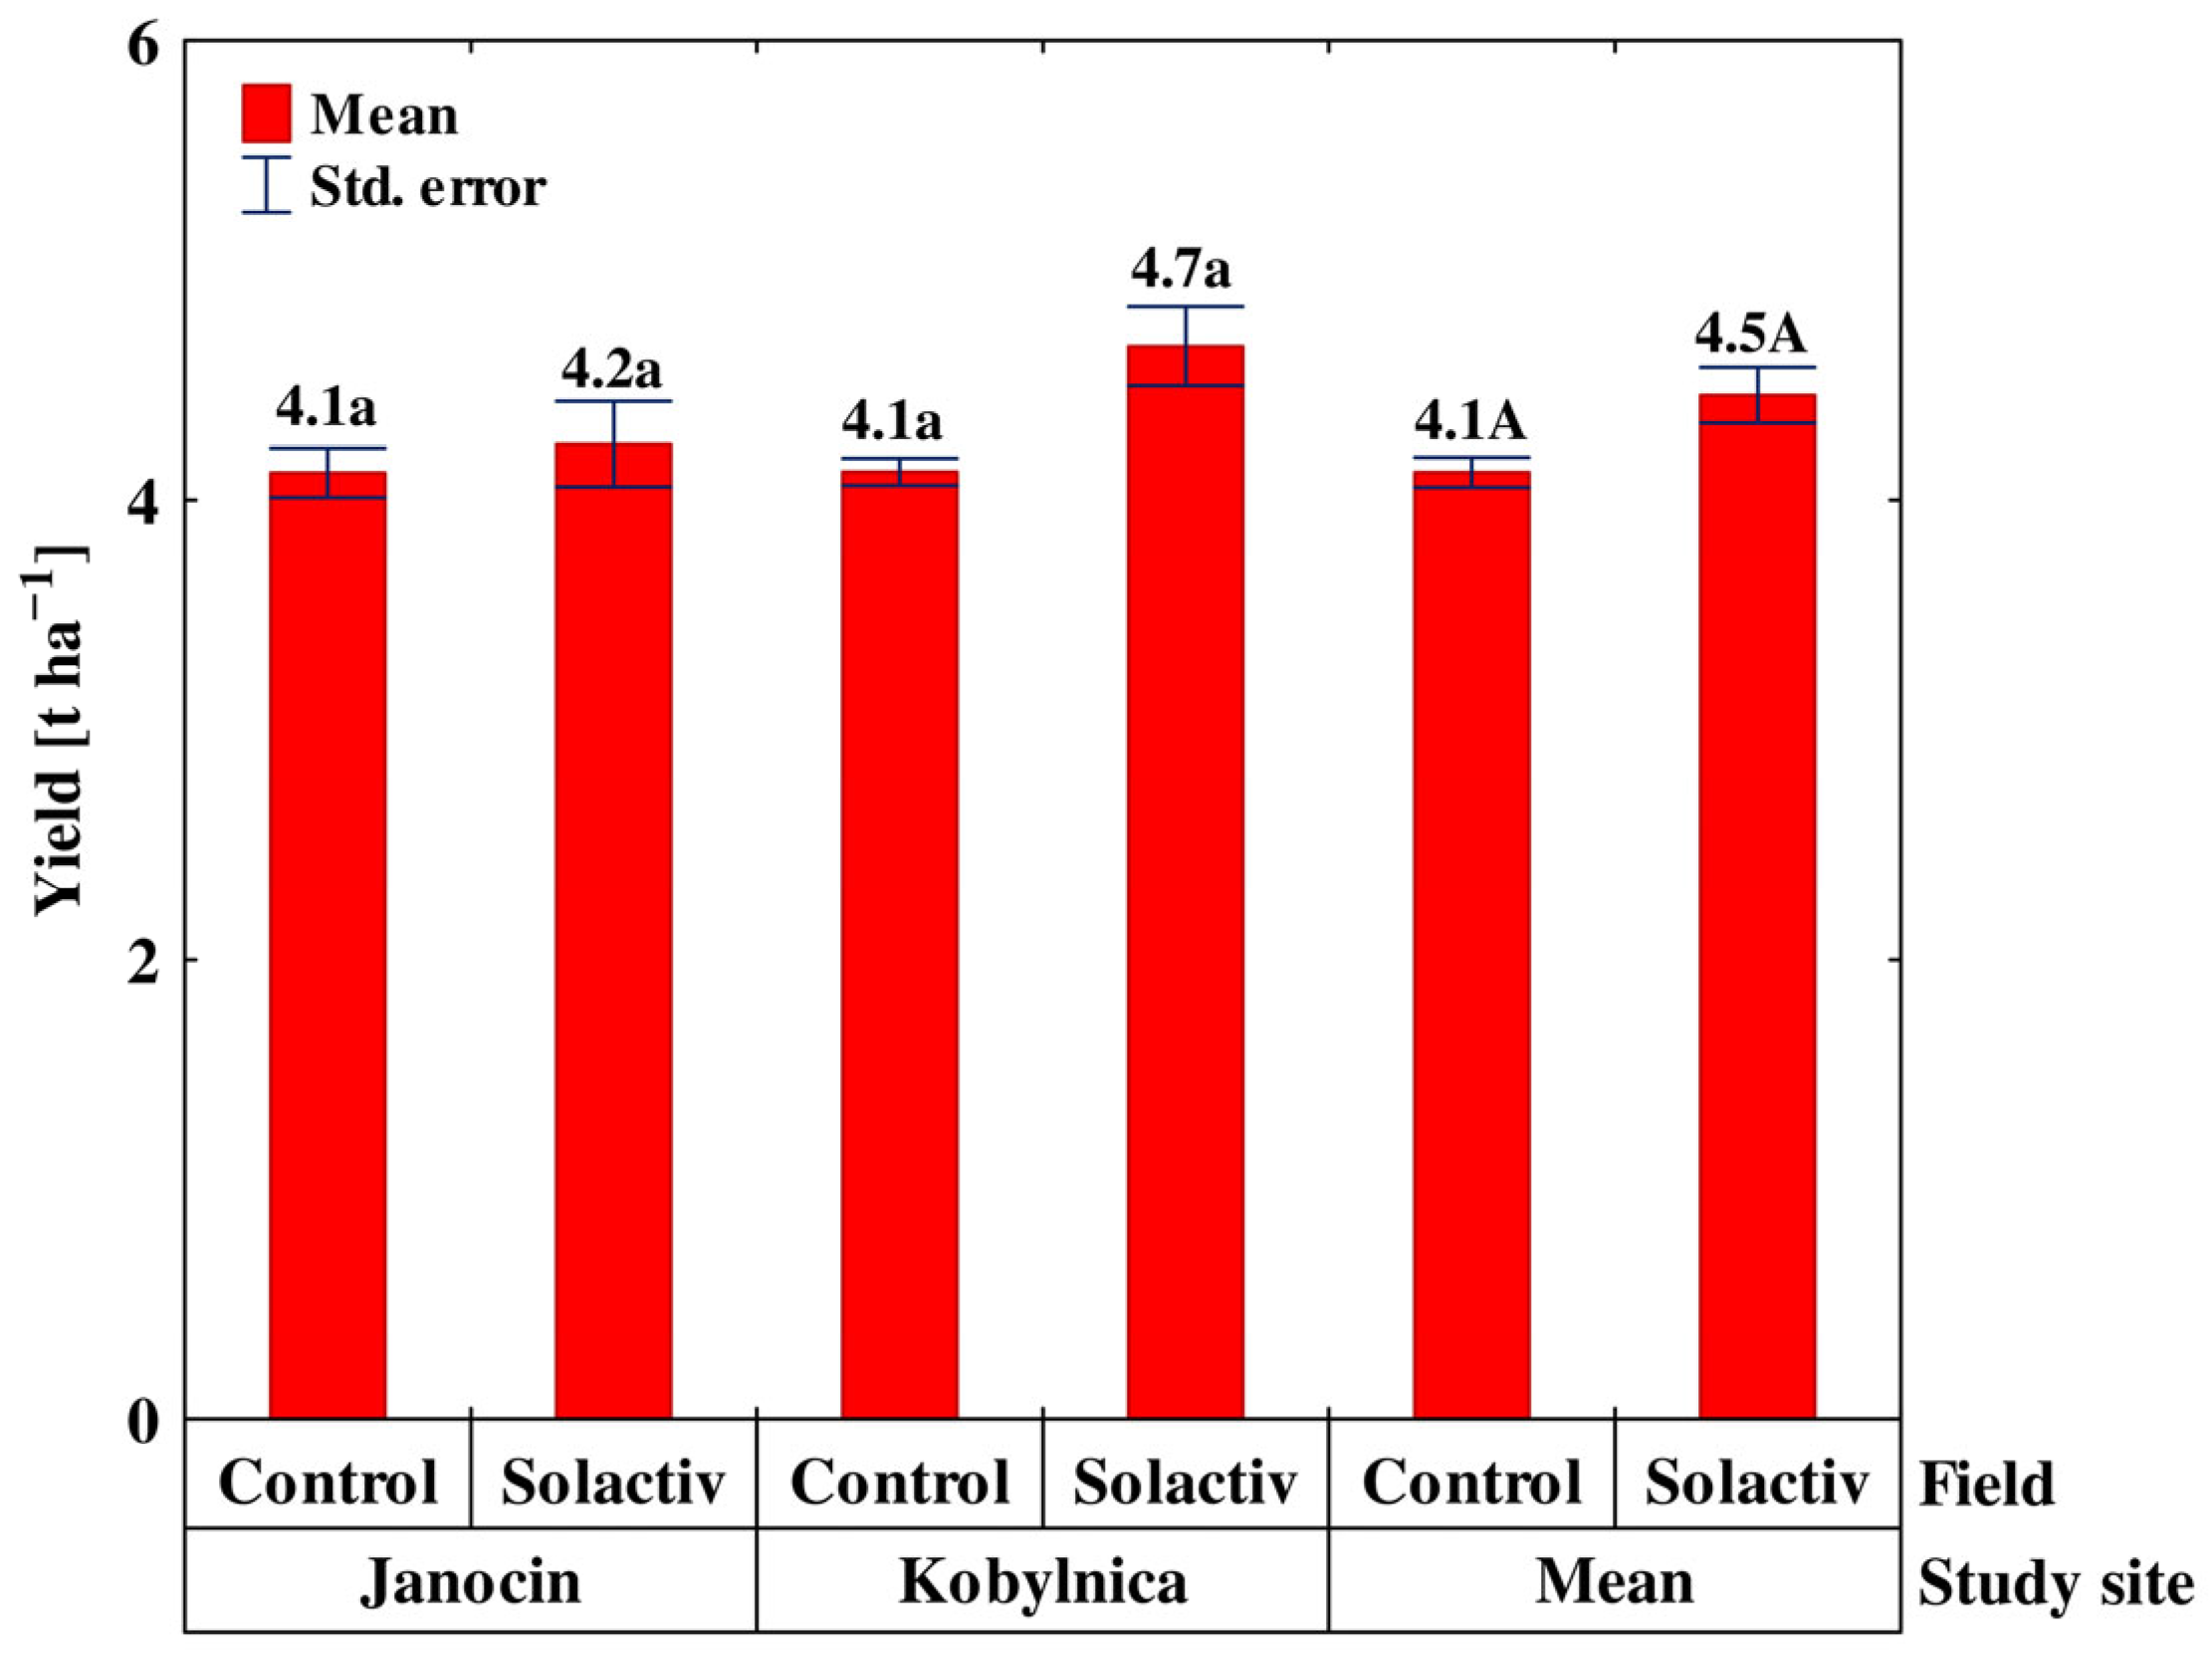
The yield of barley grain was also significantly higher in soil amended with conditioner than in control soil at both study sites, though the differences were not too high (2.4% for Janocin and 12.7% for Kobylnica) (Figure 9).

3.5. Principal Component Analysis

Based on PCA, three principal components were identified that accounted for 94.8% of the total variance, most of which (81.3%) were explained by PC1 and PC2 (Figure 10a).
The first principal component (PC1) had the largest contribution to the description of the total variability (47.7%). Chemical properties (e.g., CEC, available K, and Mg) and the content of different C and N forms (e.g., Corg, Ntot, MBC, MBN) were most negatively correlated (>−0.700) with PCA 1. PCA 1 had the largest contribution to the variance explanation (90%) of the following variables: exchangeable and available Mg, Ntot, clay, MBC, and MBN. For these properties, the contribution of PCA 2 to the variance explanation was small (Table S6). PCA 2, on the other hand, was correlated with the water properties and explained from 65 to 95% of the variability of these properties. The FDAH and RAWC were the only variables whose variance was not predominantly explained by either PCA 1 or PCA 2 (Table S6). PCA 3 dominated in explaining the variance of these variables (FDAH—62% and RAWC—83.1%). PCA of the cases showed that the only significant differentiating factor was the location of the experimental fields (Figure 10b). PCA 1 differentiated the results obtained in Kobylnica and Samsieczynek, which were negatively correlated with this PCA, and the results obtained in Janocin, which were positively correlated with PCA 1. PCA 2, on the other hand, differentiated the results from the Kobylnica site (negative correlation) and the results from the Samsieczynek site (positive correlation).

4. Discussion

4.1. Selected Physicochemical Properties

It is well known that a significant increase in the total carbon and nitrogen is usually noticed after several years of ongoing treatment with different, e.g., [71]. Accordingly, the confined duration of this investigation (one year) could explain why the content of Corg and Ntot was not significantly differentiated between the objects with and without the tested Solactiv. Because of the presence of zeolite–clinoptilolite in the conditioner, we expected a significant increase in the soil available K. It is obvious that zeolites are known for their high capacity to exchange cations [72]. Actually, clinoptilolite, as the most abundant natural zeolite [73], which often serves as a potassium source and can regulate potassium release from fertilisers, thereby enhancing their efficient utilisation by plants [19]. High cationic exchange capacity of clinoptilolite was confirmed by Józefaciuk et al. [74], who used this zeolite in their field-based research and observed that zeolite-enriched soil had a significantly larger surface area than the combined surface areas of the original soil and zeolite alone. Previously, Długosz et al. [45] found that application of Solactiv, which contains 50% of clinoptilolite, increased the available K content by over 11%. Unexpectedly, in this study, the content of available K was not significantly affected by the conditioner. The lack of a significant effect of zeolite from Solactiv on the available K content may be due to the relatively high content of potassium in soil (medium class according to the abundance classes [70] and potassium fertilisation applied in the study) (Table S1).
The applied conditioner had a positive effect on some water-related properties, which could have been due to the presence of zeolite in the tested Solactiv. The porous nature of zeolites allows them to store water, which can be desorbed to form a moisture layer on their surface, creating an optimal habitat that promotes microorganism growth and activity and enabling plants to better tolerate water stress [75]. The addition of zeolite to sandy soil enhanced the plant-available water content by 50% [76]. In this study, the percentage of available water capacity (AWC) and readily available water capacity (RAWC) also increased, but the percentage values were lower (8.5% and 14.0%, respectively), which may have been caused by a relatively low dose of zeolite applied (150 kg ha−1). The greater increase in the percentage of AWC (by about 10–67%) and RAWC (by about 15–111%) was found in the study of de Campos Bernardi et al. [73]. These substantial improvements in AWC and RAWC were achievable due to the initially low water retention values in the studied Entisols and the high zeolite application rates employed (reaching up to 100 g kg−1 of soil). The reduction in bulk density (BD) that we observed in conditioner-treated fields can also be attributed to the zeolite–clinoptilolite component within the conditioner. This finding was also supported by other researchers [77], who conducted a study on wheat grown in two distinct soil types: sandy loam and silty loam. Their results demonstrated dose-related bulk density reductions in both soil types. Accordingly, the values of BD in sandy loam decreased sequentially by about 10%, 15%, 34% and 41%, respectively, while in silty loam by about 18%, 22%, 37% and 41%, respectively. Additionally, the values of total porosity in both soil types were also increased [77]. Furthermore, the pot experiment conducted by Ravali et al. [27] showed that zeolite treatment substantially decreased soil bulk density, reaching the lowest measurement of 0.97 Mg m−3 at the 7.5 t ha−1 application rate. The zeolite component in the tested Solactiv probably contributed to the observed changes in the soil pore distribution: a 15% increase in macroporosity and a 17% reduction in microporosity within the total porosity were noted. Such a tendency was also supported by Githinji et al. [78], who documented macroporosity increases by 10 m3 m−3 (from 15 to 25 m3 m−3) following clinoptilolite addition to sandy soil.

4.2. Soil Enzymatic and Microbial Properties

The obtained data on microbial biomass and enzymatic properties only partially point to their positive response to the applied conditioner. Key factors such as soil pH, organic matter, and microbial biomass content, as well as the range of physicochemical properties that play pivotal roles in affecting soil enzymatic activity, were not significantly changed by the applied conditioner, which was confirmed by the lack of significant correlations between these properties. Of the three tested enzymes, only cellulase activity responded positively to the applied conditioner and was significantly increased by the tested conditioner at two out of three study sites. We guessed that zeolites, characterised by their porous structure and ion-binding capacity, could significantly affect cellulase activity. Zeolites can adsorb cellulase enzymes onto their surface, potentially affecting the enzyme conformation and activity [79,80]. The pore structure of zeolites can influence which molecules can access the active site of the enzyme [81]. Thus, microporous zeolites can restrict the diffusion of large molecules, potentially hindering cellulase activity. However, some zeolites, like those with meso- and macropores, can enhance diffusion and improve catalytic performance. One example of such a zeolite is the clinoptilolite used in this study, which is characterised by high porosity, with voids constituting from 24 to 32% of its volume.
In turn, no clear trend was found in the activity of dehydrogenases; thus, these enzymes were significantly activated by the Solactiv only at one study site, while at the two other sites the conditioner decreased their activity. Finally, there were no significant changes in the FDAH level in any study location. What is more, the conditioner did not significantly affect the amount of microbial biomass (measured by the C and N content). Therefore, the hypothesis that microbial and enzymatic properties would be improved by Solactiv under spring barley cultivation could be accepted only partially. According to the literature data, interactions between Solactiv components and microbial and enzymatic properties are complex and depend on various factors, e.g., [12,20,24,28,31,36,38,44]. In the study of Wolny-Koładka et al. [82], determination of the DHA in soil under spring wheat and spring oilseed rape cultivation indicates the significant reduction in this property for five different mineral–organic treatments (NPK; NPK + 3% or 6% lignite and 3% zeolite–vermiculite; NPK + 3% or 6% leonardite and 3% zeolite–vermiculite) compared to the control soil, even though the number of determined microorganisms (bacteria, mould fungi, Azotobacter spp., and actinomycetes) increased by 116–1600%. Consequently, the authors concluded that fertilisation based on mineral and organic additions in the form of lignite and leonardite, combined with a zeolite–vermiculite, effectively increased the number of the studied microbial groups. Dehydrogenase activity acts as a measure of the total microbial oxidative metabolism, revealing a pattern of growth and activity of microbial communities, and is not always related to the amount of microbial biomass [83]. The literature data [84,85] indicated that the activity of microbial populations measured with dehydrogenase enzymes can respond to the application of a zeolite in various ways, and the dose of zeolite is often crucial. In the study carried out by Doni et al. [84] in grapevine cultivation, an increase in soil dehydrogenase activity in the range 8–110% was observed after relatively high doses of zeolite application (5 and 10 t ha−1) after 6 months from initial treatments. In addition [84], even though the content of total organic carbon remained constant, there was a reduction in humic substances in soils treated with zeolite. This finding indicated that zeolite addition enhanced microbial activity in the soil, which in turn activated the breakdown of existing organic carbon stocks through microbial mineralization processes. The influence of seaweed-based biofertilizers on soil biochemical properties has been well-documented in the literature, e.g., [86,87,88]. Due to their rich composition of organic compounds, including carbohydrates, proteins, enzymes, vitamins, and fatty acids, seaweeds are believed to substantially influence soil enzymatic activity. Previously, Wang et al. [87] observed that seaweed fertilisers applied at different concentrations altered the soil microbial dynamics and enzymatic activity, with a notable effect on the dehydrogenase and protease function. Similarly, Chen et al. [88] found significant increases in the enzymatic activities of dehydrogenases, cellulases, nitrate reductase, and urease in maize rhizosphere soil a short time after the seaweed fertiliser use. Previous studies have also established that seaweed extract applications lead to increased soil bacterial activity [88,89]. However, our results did not support these findings, as the soil conditioner we tested showed no clear effect on the content of carbon and nitrogen in the soil microbial biomass, along with soil dehydrogenase activity (DHA).
The varying effects of Solactiv on individual enzyme activities observed in this study can be attributed to the wide range of enzymatic reactions, each with distinct optimal environmental requirements, varying levels of activity, sensitivity, and differences in soil substrate availability for specific enzymatic reactions. This is especially evident for FDA hydrolysis activity, as the breakdown of fluorescein diacetate (enzymatic substrate) is catalysed by a range of intracellular enzymes, including esterases, lipases, and proteases, that are found in metabolically active microorganisms [90]. The absence of significant variation in microbial and enzymatic properties between Solactiv-managed and control soils may be attributed to the limited experimental duration and the complex interactions between the various components of the soil conditioner.

4.3. Plant Properties

Despite the low dose used, the applied conditioner significantly increased dry matter of roots and shoots, barley root length and surface as well as barley grain yield (independent of the study location and when study sites were considered separately), which is particularly important for agricultural production. We assumed that all of the Solactiv components might have a positive impact on barley growth and yield. Previously, a positive influence of the individual components of Solactiv or their potential synergistic effects has been frequently observed, but usually, higher doses were applied [17,91]. In the first study year conducted by Szatanik-Kloc et al. [92] on a poor soil with zeolite amended at doses from 1 to 8 t/ha, an increase in spring wheat yield was noted. Research by Hassan and Mahmoud [93] showed that zeolite-containing amendments applied to the sandy and loamy sand soils increased the maize yield by 14.3 t ha−1. Moreno et al. [17] showed a positive effect of zeolites supplemented with leonardite at a dose of 75 t ha−1 on plant growth and yield of barley as compared with the compost treatments, either with zeolite or without. Because of the wide range of beneficial properties, this mixture has become significant for improving soil physical and chemical properties and thereby enhancing plant growth and yield. The positive effects of Ascophyllum nodosum extract on plant growth and productivity across different cultivated species have been reported [41,88,94,95]. In their study on strawberries and carrots, Alam et al. [94,95] demonstrated that Ascophyllum nodosum extract enhanced plant growth and production with increased rhizosphere microbial activity. According to Chen et al. [88], application of seaweed fertiliser resulted in significant improvements in maize seedling development, with significant seedling height and above-ground fresh mass. This effect may be attributed to the presence of biostimulants, including 2% abscisic acid, 3% adenine, and 5% indoleacetic acid [96].
Potassium humate, a humic acid salt obtained from lignite brown coal, is characterised by high concentrations of carboxylic and phenolic groups. Humic acid affects plant development through both direct and indirect mechanisms, with the indirect effects enhancing the soil’s physical, chemical, and biological properties [15]. The results of the greenhouse trial [97] demonstrated that the humic acids (originating from leonardite) applied at a dose of 1.5 g per 1 kg of soil had a significant effect on potato growth (55%) and tuber yield (66.0%) in contrast to the control. However, numerous studies have demonstrated minimal or no beneficial effects when humates are applied at standard recommended rates (typically 5–10 kg ha−1 for K humate), suggesting these application levels are likely insufficient for achieving effectiveness [98,99]. Similarly, the potassium humate concentration in Solactiv applied in this research (6 kg ha−1) appeared insufficient to achieve the assumed efficiency, as such low application rates likely do not provide adequate levels of the bioactive compounds [45].

5. Conclusions

Despite the low single dose used (only 300 kg ha−1), the applied conditioner significantly increased some important soil and plant properties, which can be attributed to its complex and unique nature. Therefore, the use of Solactiv represents a potentially valuable strategy for advancing sustainable agricultural practices through enhancing some physical and water-related soil properties as well as selected plant properties. Additionally, the effect of a low application rate is also important from an economic point of view. Nevertheless, inconclusive findings regarding soil enzymatic, microbial, and chemical variables indicate that further research involving multi-site barley cultivation studies and scaled-up field trials is essential to across multiple sites and commercial-scale applications are needed to confirm its effectiveness. It should be stressed that the Luvisols used in this study have moderate fertility and relatively high nutrient levels, which may have obscured the true potential of the soil conditioner. Future studies should test the long-term impact of Solactiv on various agricultural systems (e.g., no-till), different soil types, especially the low-fertility sandy soils with limited productivity, to obtain a clearer picture of how well it affects soil fertility, water, and nutrient retention in realistic field-scale conditions. Furthermore, environmental parameters such as temperature and rainfall patterns at various study locations should also be considered to validate the study’s findings. Because of the clear, positive response of cellulase activity in this study, it is worth assessing the range of cellulolytic enzymes as affected by the applied conditioner in different agricultural systems. Finally, research should also focus on developing a new, more effective Solactiv formula by incorporating new components, such as polyacrylamide, biochar, and organic composts.

Supplementary Materials

The following supporting information can be downloaded at: https://www.mdpi.com/article/10.3390/su172210169/s1, Table S1. Mineral fertilization used in the experimental fields. Table S2. Physical and water-related properties as affected by the applied conditioner for individual study sites. Table S3. The content of dissolved carbon and nitrogen as affected by the applied conditioner and sampling month. Table S4. The content of microbial biomass carbon and nitrogen as affected by the applied conditioner and sampling month. Table S5. Enzymatic activity as affected by the applied conditioner and sampling month. Table S6. Loading scores of the variable for PCA.

Author Contributions

Conceptualization, J.D.; Formal analysis, J.D. and A.P.-D.; Investigation, J.D., A.P.-D. and K.K.; Methodology, A.P.-D. and K.K.; Project administration, J.D. and E.P.; Visualisation, A.P.-D. and E.P.; Writing—original draft, J.D., A.P.-D. and K.K.; Writing—review and editing, A.P.-D. and E.P. All authors have read and agreed to the published version of the manuscript.

Funding

This research was funded by The Polish Agency for Enterprise Development, grant number ID POIR.02.03.02-06-0002/17, as well as by NaturalCrop Poland Ltd.

Institutional Review Board Statement

Not applicable.

Informed Consent Statement

Not applicable.

Data Availability Statement

The data used to support the findings of this study are available from the authors upon request.

Acknowledgments

We are most grateful to the Experimental Station for Cultivar Testing in Chrząstowo and Głębokie (Poland) for providing the meteorological data. Much gratitude is due to Tim Brombley for proofreading the article.

Conflicts of Interest

Author Ewelina Przybyszewska was employed by the company NaturalCrop Poland Ltd. The remaining authors declare that the research was conducted in the absence of any commercial or financial relationships that could be construed as a potential conflict of interest.

References

  1. Xing, Y.; Wang, X.; Mustafa, A. Exploring the link between soil health and crop productivity. Ecotoxicol. Environ. Saf. 2025, 289, 117703. [Google Scholar] [CrossRef]
  2. Furtak, K.; Wolińska, A. The impact of extreme weather events as a consequence of climate change on the soil moisture and on the quality of the soil environment and agriculture—A review. Catena 2023, 231, 107378. [Google Scholar] [CrossRef]
  3. Oishy, M.N.; Shemonty, N.A.; Fatema, S.I.; Mahbub, S.; Min, E.L.; Raisa, M.B.H.; Anik, A.H. Unravelling the effects of climate change on the soil-plant-atmosphere interactions: A critical review. Soil Environ. Health 2025, 3, 100130. [Google Scholar] [CrossRef]
  4. Kopittke, P.M.; Menzies, N.W.; Wang, P.; McKenna, B.A.; Lombi, E. Soil and the intensification of agriculture for global food security. Environ. Int. 2019, 132, 105078. [Google Scholar] [CrossRef] [PubMed]
  5. Chen, Q.; Li, G.; Li, Q.; Zhou, Z.; Feng, Y.; Luo, Y.; Tan, H.; Tian, X. Soil moisture determines the consistency of organic matter decomposition in field and lab test patterns. Catena 2024, 246, 108485. [Google Scholar] [CrossRef]
  6. Krasowicz, S.; Matyka, M.; Madej, A. The rational use of Polish soils as a challenge for science, advice, and agricultural practice State Research Institute in Puławy. Acta Sci. Pol. Oecon. 2023, 22, 17–25. [Google Scholar] [CrossRef]
  7. Ochal, P.; Jadczyszyn, T.; Jurga, B.; Kopiński, J.; Matyka, M.; Madej, A.; Rutkowska, A.; Smreczek, B.; Łysiak, M. Environmental aspects of soil acidity in Poland. In Studies and Reports of Institute of Soil Science and Plant Cultivation—State Research Institute; Report Prepared as a Part of the Task 2.2; Institute of Soil Science and Plant Cultivation–State Research Institute: Puławy, Poland, 2017; p. 47. [Google Scholar]
  8. Shinde, R.; Sarkar, P.; Thombare, N.; Naik, S. Soil conservation: Today’s need for sustainable development. Agric. Food E-Newsl. 2019, 1, 175–183. [Google Scholar]
  9. Thakur, P.; Wadhwa, H.; Shubham; Kaushal, S. Soil conditioners: Refinement of soil health for better tomorrow. Curr. J. Appl. Sci. Technol. 2023, 42, 1–9. [Google Scholar] [CrossRef]
  10. Triphati, S.; Tiwari, T.; Sachan, R. Soil Conditioners: Substances that Enhance Physical Properties of Soil. In Current Research and Review in Soil Science; Bright Sky Publications: Delhi, India, 2023; Volume 3, pp. 19–29. [Google Scholar]
  11. Rakkammal, K.; Maharajan, T.; Ceasar, S.A.; Ramesh, M. Biostimulants and their role in improving plant growth under drought and salinity. Cereal Res. Commun. 2023, 51, 61–74. [Google Scholar] [CrossRef]
  12. Cataldo, E.; Fucile, M.; Manzi, D.; Masini, C.M.; Doni, S.; Mattii, G.B. Sustainable soil Managment: Effects of clinoptilolite and organic compost soil application on eco-physiology, quercitin, and hydroxylated, methoxylated anthocyanins on Vitis vinifera. Plants 2023, 12, 708. [Google Scholar] [CrossRef]
  13. Kukowska, S.; Szewczuk-Karpisz, K. Managment of the soil environment using biochar and zeolite in various combinations: Impact on soil condition and economical aspects. J. Soils Sediments 2025, 25, 77–102. [Google Scholar] [CrossRef]
  14. Galamini, G.; Ferretti, G.; Rosinger, C.; Huber, S.; Diaz-Pines, E.; Faccini, B.; Keiblinger, K.M. Potential for agricultural recycling of struvite and zeolites to improve soil microbial physiology and mitigate CO2 emission. Geoderma 2025, 453, 117149. [Google Scholar] [CrossRef]
  15. Kumar, D.; Singh, A.P.; Raha, P.; Rakshit, A.; Singh, C.M.; Kishor, P. Potassium humate: A potential soil conditioner and plant growth promoter. Int. J. Agric. Environ. Biotechnol. 2013, 6, 441–446. [Google Scholar] [CrossRef]
  16. Kołodziej, B.; Sugier, D.; Bielińska, E. The effect of leonardite application and various plantation modalities on yielding and quality of roseroot (Rhodiola rosea L.) and soil enzymatic activity. J. Geochem. Explor. 2013, 129, 64–69. [Google Scholar] [CrossRef]
  17. Moreno, J.L.; Ondoño, S.; Torres, I.; Bastida, F. Compost, leonardite, and zeolite impacts on soil microbial community under barley crops. J. Soil Sci. Plant Nutr. 2017, 17, 214–230. [Google Scholar] [CrossRef]
  18. Shukla, P.S.; Mantin, E.G.; Adil, M.; Bajpai, S.; Critchley, A.T.; Prithiviraj, B. Ascophyllum nodosum-based biostimulants: Sustainable applications in agriculture for the stimulation of plant growth, stress tolerance, and disease Managment. Front. Plant Sci. 2019, 10, 655. [Google Scholar] [CrossRef]
  19. Ahmed, M.; Ullah, H.; Piromsri, K.; Tiisarum, R.; Chaum, S.; Datta, A. Effect of an Ascophyllum nodosum seaweed extract application dose and method on growth, fruit yield, quality, and water productivity of tomato under water-deficit stress. S. Afr. J. Bot. 2022, 151, 95–107. [Google Scholar] [CrossRef]
  20. Liu, Q.; Cui, H.; Yang, W.; Wang, F.; Liao, H.; Zhu, Q.; Qin, S.; Lu, P. Soil conditioner improves soil properties, regulates microbial communities, and increases yield and quality of Uncaria rhynchophylla. Sci. Rep. 2024, 14, 13398. [Google Scholar] [CrossRef]
  21. Dueñas, J.F.; Kunze, E.; Li, H.; Riling, M.C. Soil conditioner mixtures as an agricultural Managment alternative to mitigate drought impacts: A proof of concept. Nat. Hazards Earth Syst. Sci. 2025, 25, 1377–1386. [Google Scholar] [CrossRef]
  22. Goulding, K.W.T. Soil acidification and the importance of liming agricultural soils with particular reference to the United Kingdom. Soil Use Manag. 2016, 32, 3. [Google Scholar] [CrossRef]
  23. Ouni, Y.; Ghnaya, T.; Montemurro, F.; Abdelly, C.; Lakhdar, A. The role of humic substances in mitigating the harmful effects of soil salinity and improve plant productivity. Int. J. Plant Prod. 2014, 8, 353–374. [Google Scholar]
  24. Wu, Q.; Xia, D.; Chen, G.; Sun, T.; Song, Y. Effects of zeolite on drought resistance and water—nitrogen use efficiency in paddy rice. J. Irrig. Drain. Eng. 2019, 145, 04019024. [Google Scholar] [CrossRef]
  25. Piotrowska, A.; Długosz, J.; Zamorski, R.; Bogdanowicz, P. Changes in some biological and chemical properties of an arable soil treated with the microbial biofertilizer UGmax. Pol. J. Environ. Stud. 2012, 21, 455–463. [Google Scholar]
  26. Mayer, J.; Scheid, S.; Widmer, F.; Fließbach, A.; Oberholzer, H.R. How effective are “Effective micro-organisms (EM)”? Results from a field study in temperate climate. Appl. Soil Ecol. 2010, 46, 230–239. [Google Scholar] [CrossRef]
  27. Ravali, C.; Rao, K.J.; Anjaiah, T.; Suresh, K. Effect of zeolite on soil physical and physico-chemical properties. Int. Ref. Peer Rev. Index. Q. J. Sci. Agric. Eng. 2020, 10, 776–781. [Google Scholar]
  28. Mondal, M.; Biswas, B.; Garai, S.; Sarkar, S.; Banerjee, H.; Brahmachari, K.; Bandyopadhyay, P.K.; Maitra, S.; Brestic, M.; Skalicky, M.; et al. Zeolites enhance soil health, crop productivity and environmental safety. Agronomy 2021, 11, 448. [Google Scholar] [CrossRef]
  29. Ferretti, G.; Rosinger, C.; Diaz-Pines, E.; Faccini, B.; Coltorti, M.; Keiblinger, K.M. Soil quality increases with long-term chabazite-zeolite tuff amendments in arable and perennial cropping systems. J. Environ. Manag. 2024, 354, 120303. [Google Scholar] [CrossRef]
  30. Bhattarai, B.; Neupane, J.; Dhakal, S.P.; Nepal, J.; Gnyawali, B.; Timalsina, R.; Poudel, A. Effect of biochar from different origin on physio-chemical properties of soil and yield of Garden Pea (Pisum sativum L.) at Paklihawa, Rupandehi. Nepal. World J. Agric. Res. 2015, 3, 129–138. [Google Scholar]
  31. Ergolu, N.; Emekci, M.; Athanassiou, C.G. Applications of natural zeolites on agriculture and food production. J. Sci. Food Agric. 2017, 97, 3487–3499. [Google Scholar] [CrossRef]
  32. Sangeetha, C.; Baskar, P. Zeolite and its potential uses in agriculture: A critical review. Agric. Rev. 2016, 37, 101–108. [Google Scholar] [CrossRef]
  33. Demirer, T. Effect of leonardite application on leaf nutrient content and fruit chemical parameters of cherry (Prunus avium L.). J. Plant Nutr. 2019, 42, 2532–2538. [Google Scholar] [CrossRef]
  34. Dinçsoy, M.; Sönmez, F. The effect of potassium and humic acid applications on yield and nutrient contents of wheat (Triticum aestivum L. var. Delfii) with same soil properties). J. Plant Nutr. 2019, 42, 2757–2772. [Google Scholar] [CrossRef]
  35. Alharbi, K.; Rashwan, E.; Hafez, E.; El-Dein Omara, A.; Mohamed, H.H.; Alshaal, T. Potassium Humate and Plant Growth-Promoting Microbes Jointly Mitigate Water Deficit Stress in Soybean Cultivated in Salt-Affected Soil. Plants 2022, 11, 3016. [Google Scholar] [CrossRef]
  36. Margal, P.B.; Thakare, R.S.; Kamble, B.M.; Patil, V.S.; Patil, K.B.; Titirmare, N.S. Effect of seaweed extracts on crop growth and soil: A review. J. Exp. Agric. Int. 2023, 45, 9–19. [Google Scholar] [CrossRef]
  37. Khan, W.; Palanisamy, R.; Critchley, A.T.; Smith, D.L.; Papadopoulos, Y.; Prithiviraj, B. Ascophyllum nodosum extract and its organic fractions stimulate Rhizobium root nodulation and growth of Medicago sativa (Alfalfa). Commun. Soil Sci. Plant Anal. 2013, 44, 900–908. [Google Scholar] [CrossRef]
  38. Banjare, L.; Banwasi, R.; Jataw, G.K.; Shrivastav, L.K. Effect of seaweed extract on yield and nutrient uptake of rice in a vertisol. Pharma Innov. J. 2022, 11, 2193–2198. [Google Scholar]
  39. Repke, R.A.; Ribeiro Silva, D.M.; Camilo dos Santos, J.C.; de Almeida Silva, M. Increased soybean tolerance to high-temperature through biostimulant based on Ascophyllum nodosum (L.) seaweed extract. J. Appl. Phycol. 2022, 34, 3205–3218. [Google Scholar] [CrossRef]
  40. Frioni, T.; Vander-Weide, J.; Palliotti, A.; Tombesi, S.; Poni, S.; Sabbatini, P. Foliar vs. soil application of Ascophyllum nodosum extracts to improve grapevine water stress tolerance. Sci. Hortic. 2021, 277, 109807. [Google Scholar] [CrossRef]
  41. Naz, S.; Din Muhammad, H.M.; Ramzan, M.; Sadiq, B.; Ahmad, R.; Ali, S.; Alsahli, A.A.; Altal, A. Seaweed application enhanced the growth and yield of pea (Pisum sativum L.) by altering physiological indices. J. Soil Sci. Plant Nutr. 2023, 23, 6183–6195. [Google Scholar] [CrossRef]
  42. Ronga, D.; Biazzi, E.; Parati, K.; Carminati, D.; Carminati, E.; Tava, A. Microalgal biostimulants and biofertilisers in crop productions. Agronomy 2019, 9, 192. [Google Scholar] [CrossRef]
  43. Siwik-Ziomek, A.; Szczepanek, M. Soil extracellular enzyme activities and uptake of N by oilseed rape depending on fertilization and seaweed biostimulant application. Agronomy 2019, 9, 480. [Google Scholar] [CrossRef]
  44. Villa e Vila, V.; Rezende, R.; Marques, P.A.A.; Wenneck, G.S.; Crepaldi de Faria Nocchi, R.; de Souza Terassi, D.; Barion Alves Andrean, A.F.; Matumoto-Pintro, P.T. Seaweed extract of Ascophyllum nodosum applied in tomato crop as a biostimulant for improving growth, yield and soil fertility in subtropical condition. J. Appl. Phycol. 2023, 35, 2531–2541. [Google Scholar] [CrossRef]
  45. Długosz, J.; Piotrowska-Długosz, A.; Kotwica, K.; Przybyszewska, E. Application of multi-component Conditioner with clinoptilolite and Ascophyllum nodosum extract for improving soil properties and Zea mays L. growth and yield. Agronomy 2020, 10, 2005. [Google Scholar] [CrossRef]
  46. Őztürk, H.S.; Türkmen, C.; Erdogan, E.; Baskan, O.; Dengiz, O.; Parlak, M. Effects of a soil conditioner on some physical and biological features of soils: Results from a greenhouse study. Biores. Technol. 2005, 96, 1950–1954. [Google Scholar] [CrossRef]
  47. Ebrahimi, E.; Asadi, G.; von Fragstein und Niemsdorff, P. A field study on the effect of organic soil conditioners with different placements on dry matter and yield of tomato (Lycopersicon esculentum L.). Int. J. Recycl. Org. Waste Agric. 2019, 8, 59–66. [Google Scholar] [CrossRef]
  48. Jeřábková, J.; Salaš, P.; Burgová, J. The Influence of the Application of Soil Conditioners on the Temperature and Moisture of the Soil Environment. Inż. Mineral. 2024, 1, 1–7. [Google Scholar] [CrossRef]
  49. IUSS Working Group WRB. World reference base for soil resources. In International Soil Classification System for Naming Soils and Creating Legends for Soil Maps, 4th ed.; International Union of Soil sciences (IUSS): Vienna, Austria, 2022. [Google Scholar]
  50. Gorbulewski, K.; Fronczak, J.; Leszczyńska, M. Specific surface area-basic parameter of reactive material’s characteristics. Sci. Rev. Eng. Environ. Sci. 2008, 17, 122–130. (In Polish) [Google Scholar]
  51. Soil Survey Staff. 2014 Soil Survey Staff, Keys to Soil Taxonomy, 11th ed.; USDA Natural Resources Conservation Service: Washington, DC, USA, 2010.
  52. Domżał, H.; Słowińska-Jurkiewicz, A.; Turski, R. Przewodnik do Ćwiczeń z Gleboznawstwa z Elementami Geologii i Mechaniki Gleb, 1st ed.; Wydawnictwo Akademii Rolniczej: Lublin, Poland, 1976; pp. 12–16. (In Polish) [Google Scholar]
  53. Gonet, S.S.; Dębska, B.; Pakula, J. The Content of Dissolved Organic Carbon in Soils and Organic Fertilisers, 1st ed.; PTSH: Wrocław, Poland, 2002. (In Polish) [Google Scholar]
  54. PN-R-04020:1994; Chemical-Agricultural Analysis of Soil—Determination of Available Magnesium Content. PKN Press: Warsaw, Poland, 2018.
  55. Egner, H.; Riehm, H.; Domingo, W.R. Studies concerning the chemical analysis of soils as background for soil nutrient assessment. II. Chemical extracting methods to determinate the phosphorous and potassium content of soil. Kungl. Lantbr. Ann. 1960, 26, 199–215. (In German) [Google Scholar]
  56. PN-ISO 11260.2018; Soil Quality—Determination of Effective Cationic Exchange Capacity and Base Saturation with Barium Chloride. PKN Press: Warsaw, Poland, 2018.
  57. Van Reeuwijk, L.P. Procedures for Soil Analysis, 6th ed.; ISRIC Technical Paper 9; International Soil Reference and Information Centre, Food and Agriculture Organization of the United Nations: Wageningen, The Netherlands, 2002; p. 14. [Google Scholar]
  58. Jaremko, D.; Kalembasa, D. A comparison of methods for the determination of cation exchange capacity of soils. Ecol. Chem. Eng. S. 2014, 3, 487–498. [Google Scholar]
  59. PN-ISO 11465.1999; Soil quality—Determination of Soil Dry Matter and Soil Water Content Expressed as Dry Matter of Soil—Gravimetric Method. PKN Press: Warsaw, Poland, 1999.
  60. Walczak, R.; Ostrowski, J.; Witkowska-Walczak, B.; Sławiński, C. Spatial characteristics of water conductivity in the surface level of Polish arable soils. Int. Agrophys. 2002, 16, 239–247. [Google Scholar]
  61. Thalmann, A. Zur Methodik der Bestimmung der Dehydrodgenaseaktivitat im Boden mittels Triphenyltetrazolium-chlorid (TTC). Landwirtsch. Forsch. 1968, 21, 249–258. [Google Scholar]
  62. Adam, G.; Duncan, H. Development of a sensitive and rapid method for the measurement of total microbial activity using fluorescein diacetate (FDA) in a range of soils. Soil Biol. Biochem. 2001, 33, 943–951. [Google Scholar] [CrossRef]
  63. Schinner, F.; von Mersi, W. Xylanase-, CM-cellulase- and invertase activity in soil: An improved method. Soil Biol. Biochem. 1990, 22, 511–515. [Google Scholar] [CrossRef]
  64. Brookes, P.C.; Landman, A.; Pruden, G.; Jenkinson, D.S. Chloroform fumigation and the release of soil nitrogen: A rapid extraction method to measure microbial biomass nitrogen in soil. Soil Biol. Biochem. 1985, 17, 837–842. [Google Scholar] [CrossRef]
  65. Vance, E.D.; Brookes, P.C.; Jenkinsen, D.S. An extraction method for measuring soil microbial biomass C. Soil Biol. Biochem. 1987, 19, 703–707. [Google Scholar] [CrossRef]
  66. Bremner, J.M.; Mulvaney, C.S. Nitrogen—Total. In Methods of Soil Analysis. Part 2. Chemical and Microbiological Properties; Page, A.L., Miller, R.H., Keeny, D.R., Eds.; SSSA: Madison, WI, USA, 1982; pp. 595–624. [Google Scholar]
  67. Joergensen, R.G.; Mueller, T. The fumigation-extraction method to estimate soil microbial biomass: Calibration of the kENvalue. Soil Biol. Biochem. 1996, 28, 33–37. [Google Scholar] [CrossRef]
  68. PN-88/R-04013.1994; Chemical-Agricultural Analysis of Plants. Determination of Air-Dry and Dry Mass. Polish Committee: Warsaw, Poland, 1996.
  69. Wilding, L.P. Spatial variability: Its documentation, accommodation, and implication to soil surveys. In Soil Spatial Variability; Nielsen, D.R., Bouma, J., Eds.; PUDOC: Wageningen, The Netherlands, 1985; pp. 166–194. [Google Scholar]
  70. PN-R-04023.1996; Agrochemical Soil Analysis—Determination of Available Phosphorus in Mineral Soils. Polish Committee: Warsaw, Poland, 1996.
  71. Sherrod, L.A.; Peterson, G.A.; Westfall, D.G.; Ahuja, L.R. Cropping intensity enhances soil organic carbon and nitrogen in a no-till agroecosystem. Soil Sci. Soc. Am. 2003, 67, 1533–1543. [Google Scholar] [CrossRef]
  72. Morante-Carballo, F.; Montalván-Burbano, N.; Carrión-Mero, P.; Espinoza-Santos, N. Cation exchange of natural zeolites: Worldwide research. Sustainability 2021, 13, 7751. [Google Scholar] [CrossRef]
  73. De Campos Bernardi, A.C.; Polidoro, J.C.; de Melo Monte, M.B.; Pereira, E.I.; Ribeiro, C.; Ramesh, K. Enhancing nutrient use efficiency using zeolites minerals—A review. Adv. Chem. Eng. Sci. 2016, 6, 295–304. [Google Scholar] [CrossRef]
  74. Józefaciuk, G.; Szatniak-Kloc, A.; Ambrozewicz-Nita, A. The surface area of zeolite-amended soils exceeds the sum of the inherent surface areas of soil and zeolite. Eur. J. Soil Sci. 2018, 69, 787–790. [Google Scholar] [CrossRef]
  75. Tatlier, M.; Munz, G.; Henninger, S.K. Relation of water adsorption capacities of zeolites with their structural properties. Microporous Mesoporous Mat. 2018, 264, 70–75. [Google Scholar] [CrossRef]
  76. Palanivell, P.; Ahmed, O.H.; Susilawati, K.; Majid, N.M.A. Mitigating ammonia volatilization urea in waterlogged condition using clinoptilolite zeolite. Int. J. Agric. Biol. 2015, 17, 149–155. [Google Scholar]
  77. Abdel-Hassan, A.N.; Abdullah Radi, A.M. Effect of zeolite on some physical properties of wheat plant growth (Triticum aestivum L.). Plant Arch. 2017, 18, 2641–2648. [Google Scholar]
  78. Githinji, L.J.M.; Dane, J.H.; Walker, R.H. Physical and hydraulic properties of inorganic amendments and modelling their e ects on water movement in sand-based root zones. Irrig. Sci. 2011, 29, 65–77. [Google Scholar] [CrossRef]
  79. Xu, C.; Sun, L.; Tong, S.; Quyang, J.; Gu, X. Cellulase immobilization on zeolitic imidazolate frameworks for boosting cellulose hydrolysis at high solids loading. Ind. Crops Prod. 2023, 206, 117693. [Google Scholar] [CrossRef]
  80. Sun, L.; Xu, C.; Tong, S.; Gu, X. Enhancing cellulose hydrolysis via cellulase immobilization on zeolitic imidazolate frameworks using physical adsorption. Bioprocess Biosyst. Eng. 2024, 47, 1071–1080. [Google Scholar] [CrossRef]
  81. Jampana, S.R.; Jia, L.; Ramarao, B.V.; Kumar, D. Experimental investigation of the adsorption and desorption of cellulase enzymes on zeolite-β for enzyme recycling applications. Bioprocess Biosyst. Eng. 2021, 44, 495–505. [Google Scholar] [CrossRef]
  82. Wolny-Koładka, K.; Jarosz, R.; Marcińska-Mazur, L.; Mierzwa-Hersztek, M. Effect of mineral and organic additions on soil microbial composition. Int. Agrophys. 2022, 63, 131–138. [Google Scholar] [CrossRef]
  83. Burns, R.G.; DeForest, J.L.; Marxsen, J.; Sinsabaugh, R.L.; Stromberger, M.E.; Wallenstein, M.D.; Weintraub, M.N.; Zoppini, A. Soil enzymes in a changing environment: Current knowledge and future directions. Soil Biol. Biochem. 2013, 58, 216–234. [Google Scholar] [CrossRef]
  84. Doni, S.; Gispert, M.; Peruzzi, E.; Macci, C.; Mattii, G.B.; Manzi, D.; Masini, C.M.; Grazia, M. Impact of natural zeolite on chemical and biochemical properties of vineyard soils. Soil Use Manag. 2020, 37, 1–11. [Google Scholar] [CrossRef]
  85. Shivakumara, M.N.; Rangaish, K.M.; Subbarayappa, C.T.; Chamegowda, T.C.; Thimmegowda, M.N.; Ramaiah, M. Effect of zeolite and fertilizer application on soil microbial biomass and enzyme activity in finger millet. Int. J. Curr. Microbiol. App. Sci. 2019, 8, 1939–1957. [Google Scholar] [CrossRef]
  86. Nabti, E.; Jha, B.; Hartmann, A. Impact of seaweeds on agricultural crop production as biofertilizer. Int. J. Environ. Sci. Technol. 2016, 14, 1119–1134. [Google Scholar] [CrossRef]
  87. Wang, M.; Chen, L.; Li, Y.; Chen, L.; Liu, Z.; Wang, X.; Qin, S. Responses of soil microbial communities to a short-term application of seaweed fertilizer revealed by deep amplicon sequencing. Appl. Soil Ecol. 2018, 125, 288–296. [Google Scholar] [CrossRef]
  88. Chen, Y.; Li, J.; Huang, Z.; Su, G.; Li, X.; Sun, Z.; Qin, Y. Impact of short-term application of seaweed fertilizer on bacterial diversity and community structure, soil nitrogen contents, and plant growth in maize rhizosphere soil. Folia Microbiol. 2020, 65, 591–603. [Google Scholar] [CrossRef]
  89. Xavier James, V.C.; Pushpa Thiraviam, A.G.; Al-Dosary, M.A.; Hatamleh, A.A.; Bukhari, N.A.; Arokiyaraj, S.; Kalaiyarasi, M. Evaluation of nutrient composition and biostimulant properties of seaweeds for improving soil microbial population and tomato plant growth. BioResources 2025, 20, 1431–1451. [Google Scholar] [CrossRef]
  90. Hernández, I.Z.; Zamopra-Natera, J.F.; Garcia, P.M.; Ramirez, E.; Trujillo, N. Biological activity in soils treated with green manures of Lupinus spp. (Leguminosae) using the hydrolysis of fluorescein diacetate method (FDA) in Jalisco, Mexico. Hortic. Int. J. 2020, 4, 203–206. [Google Scholar] [CrossRef]
  91. Ippolito, J.A.; Tarkalson, D.D.; Lehrsch, G.A. Zeolite soil application method a ects inorganic nitrogen, moisture, and corn growth. Soil Sci. 2011, 176, 136–142. [Google Scholar] [CrossRef]
  92. Szatanik-Kloc, A.; Szerement, J.; Adamczuk, A.; Józefaciuk, G. Effect of low zeolite doses on plants and soil physicochemical properties. Materials 2021, 14, 2617. [Google Scholar] [CrossRef] [PubMed]
  93. Hassan, A.Z.A.; Mahmoud, A.W.M. The combined effect of bentonite and natural zeolite on sandy soil properties and productivity of some crops. Topclass J. Agric. Res. 2013, 1, 22–28. [Google Scholar]
  94. Alam, M.Z.; Braun, G.; Norrie, J.; Hodges, D.M. Ascophyllum extract application can promote plant growth and root yield in carrot associated with increased rootzone soil microbial activity. Can. J. Plant Sci. 2013, 94, 337–348. [Google Scholar] [CrossRef]
  95. Alam, M.Z.; Braun, G.; Norrie, J.; Hodges, D.M. Effect of Ascophyllum extract application on plant growth, fruit yield and soil microbial communities of strawberry. Can. J. Plant Sci. 2013, 93, 23–36. [Google Scholar] [CrossRef]
  96. Lötze, E.; Homan, E.W. Nutrient composition and content of various biological active compounds of three South African-based commercial seaweed biostimulants. J. Appl. Phycol. 2016, 28, 1379–1386. [Google Scholar] [CrossRef]
  97. Hartz, T.K. Humic substances generally ineffective in improving vegetable crop nutrient uptake or productivity. Hortic. Sci. 2010, 45, 906–910. [Google Scholar] [CrossRef]
  98. Little, K.R.; Rose, M.T.; Jackson, W.R.; Cavagnaro, T.R.; Patti, A.F. Do lignite-derived organic amendments improve early-stage pasture growth and key soil biological and physicochemical properties? Crop Pasture Sci. 2014, 65, 899–910. [Google Scholar] [CrossRef]
  99. Akimbekov, N.; Qiao, X.; Digel, I.; Abdieva, G.; Ualieva, P.; Zhubanova, A. The effect of leonardite-derived amendments on soil microbiome structure and potato yield. Agriculture 2020, 10, 147. [Google Scholar] [CrossRef]
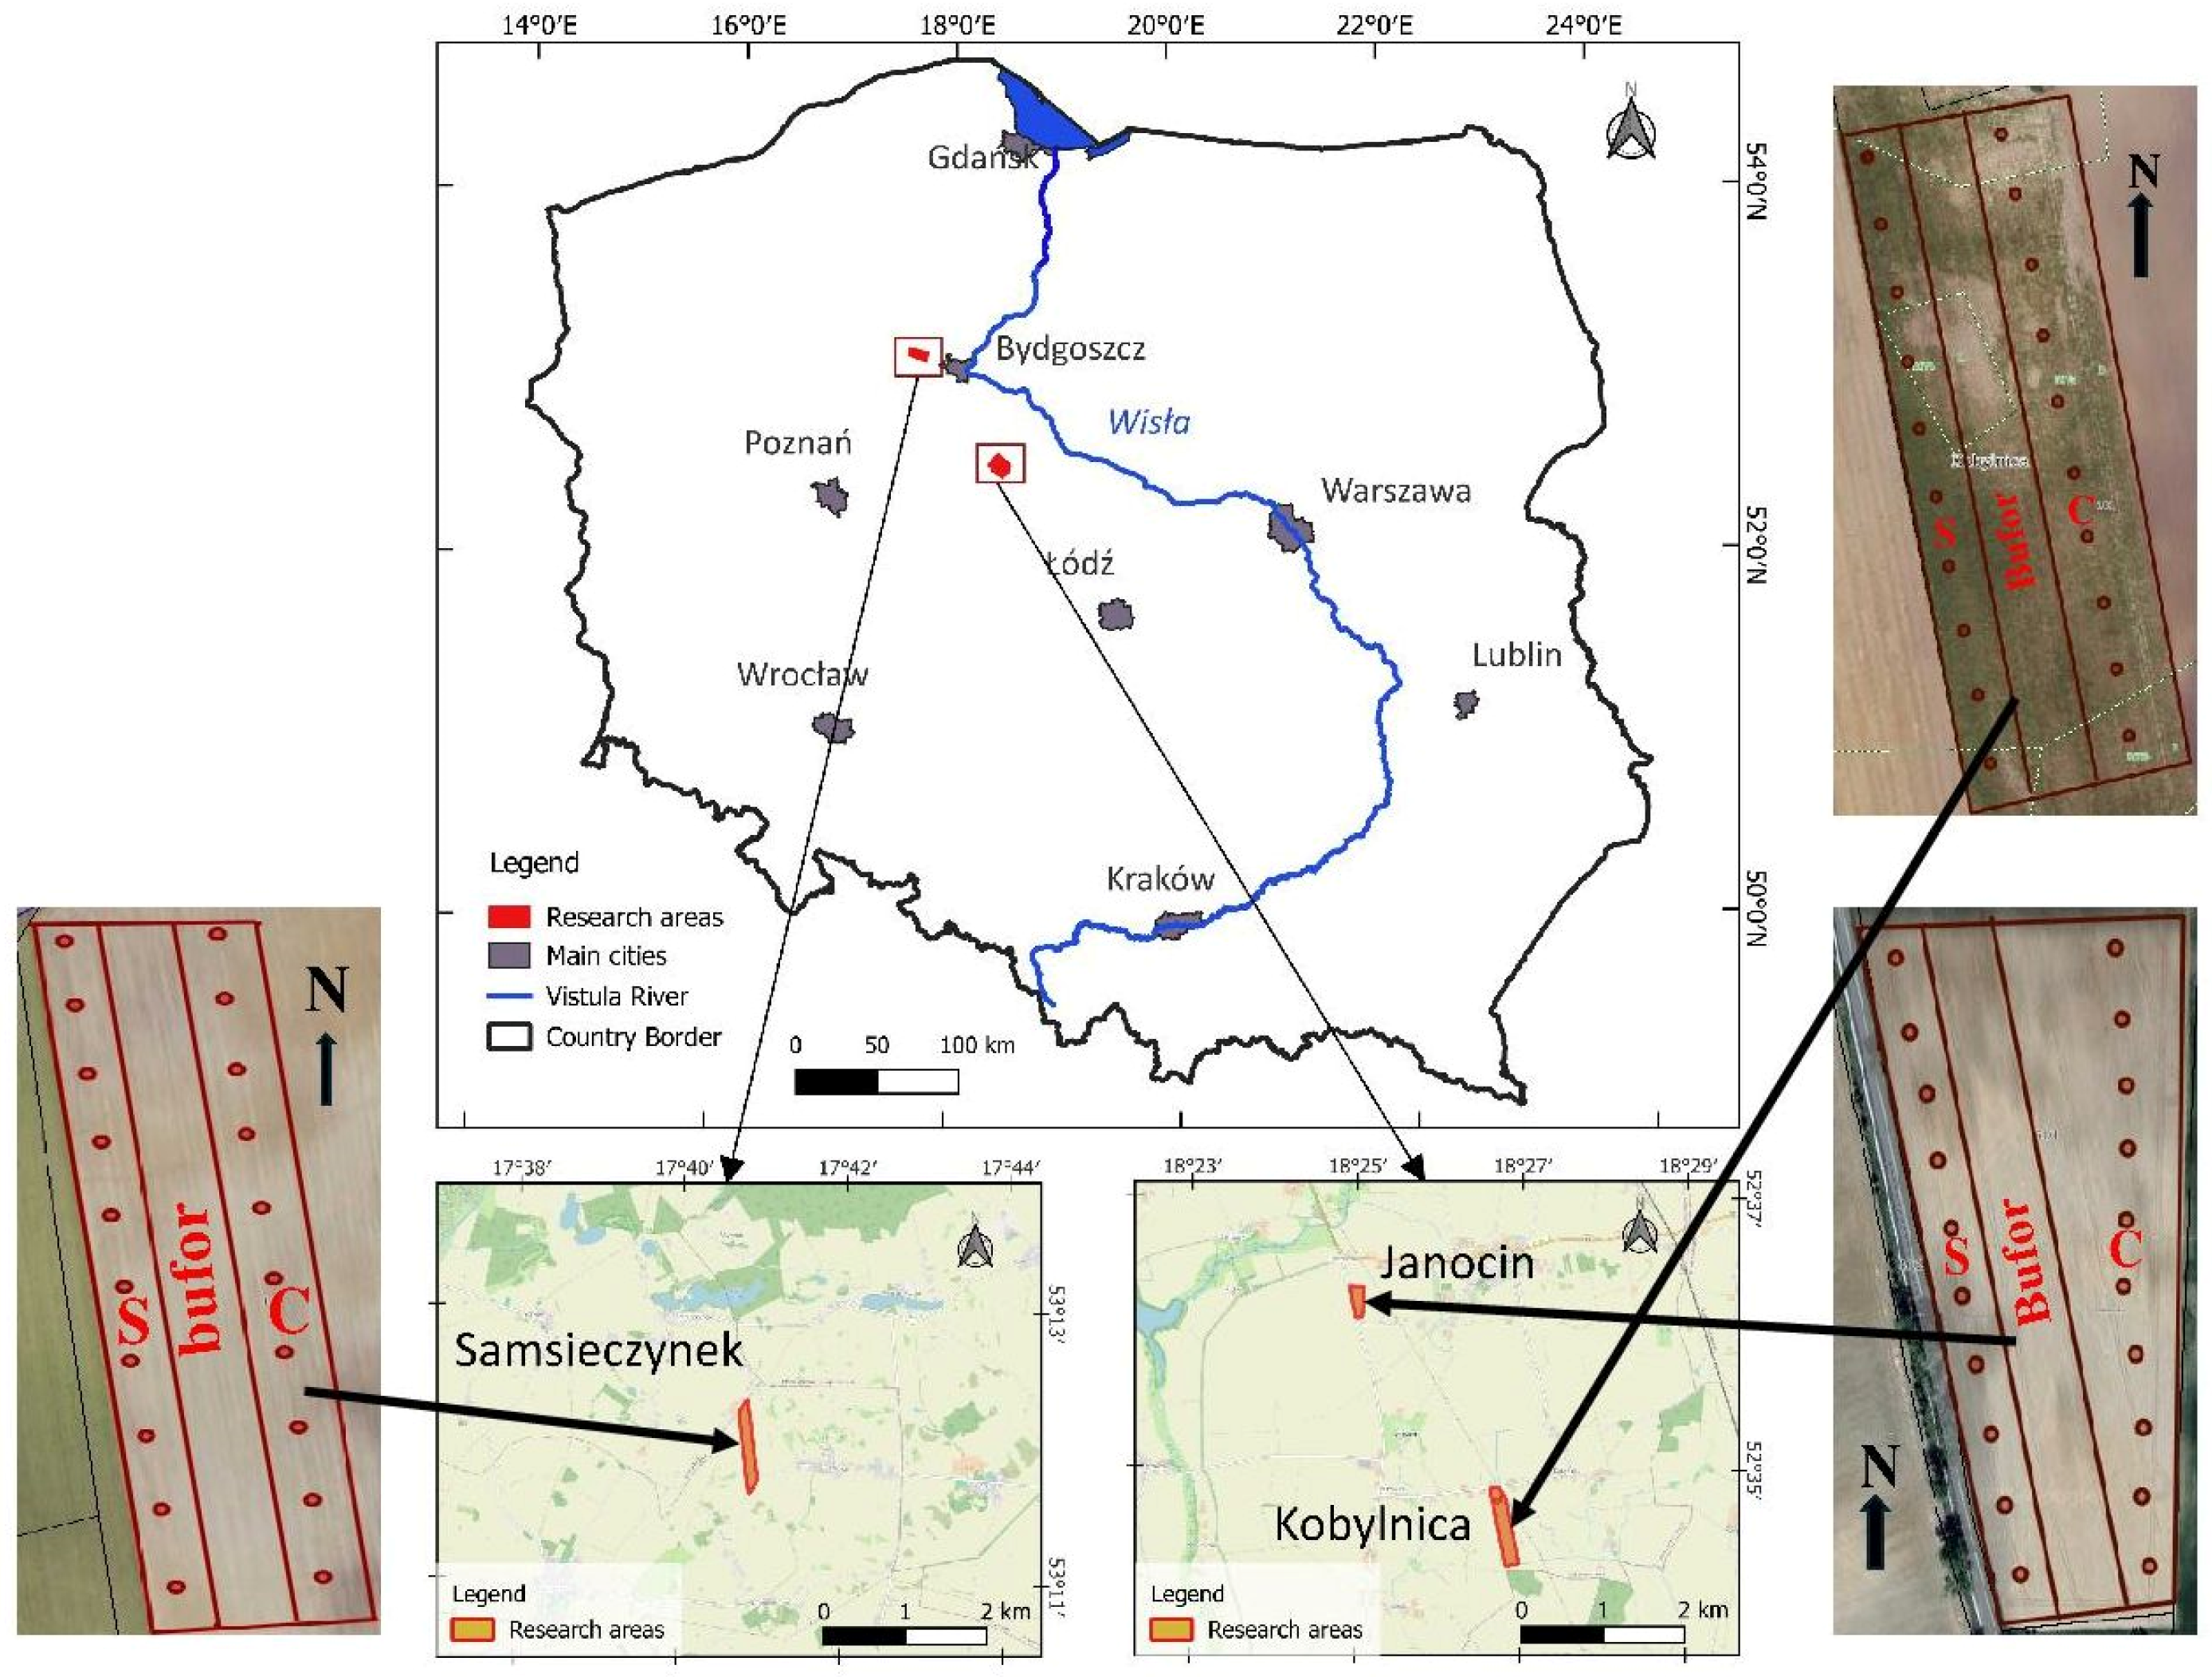
Figure 1. Location of research sites and sampling scheme: S—soil amended with Solactiv, and C—control soil.
Sustainability 17 10169 g001
Figure 2. Average air temperature (a) and precipitation (b) at the experimental sites. Notes: Chrząstowo weather station is located nearest to the Samsieczynek study site, while Głębokie weather station is located nearest to the Janocin and Kobylnica study sites.
Sustainability 17 10169 g002
Figure 3. The level of differences between DOC and DNt results (mg kg−1) obtained in July and March for the same field (control vs. Solactiv) (a,c), as well as variability between data obtained for conditioner and control soils for the same sampling month (March or July) (b,d). Different letters between means for conditioner sites and control sites (obtained from the difference between results from July and March) indicate significant differences at p < 0.05 according to the Tukey HSD Test (a,c). Different letters between means for March and July (obtained from the difference between results for control or Solactiv and control) indicate significant differences at p < 0.05 according to the Tukey HSD Test (b,d).
Sustainability 17 10169 g003
Figure 4. The level of differences between MBC and MBN results (mg kg−1) obtained in July and March for the same field (control vs. Solactiv) (a,c), as well as variability between data obtained for conditioner and control soils for the same sampling month (March and July) (b,d). The significance of and capital letters is explained in the caption of Figure 3.
Sustainability 17 10169 g004
Figure 5. The level of differences between CEL activity (mg Glu kg−1 h−1) obtained in July and March for the same field (control vs. Solactiv) (a), as well as variability between data obtained for conditioner and control soils for the same sampling month (March and July) (b). Different letters between means for conditioner sites and control sites (obtained from the difference between results from July and March) indicate significant differences at p < 0.05 according to the Tukey HSD Test (a). Different letters between means for March and July (obtained from the difference between results for control or Solactiv and control) indicate significant differences at p < 0.05 according to the Tukey HSD Test (b).
Sustainability 17 10169 g005
Figure 6. The level of differences between FDAH and DHA (mg F kg−1 h−1 and mg TPF kg−1 24 h−1, respectively) obtained in July and March for the same field (control vs. Solactiv) (a,c), as well as variability between data obtained for conditioner and control soils for the same sampling month (March and July) (b,d). The significance of and capital letters is explained in the caption of Figure 3.
Sustainability 17 10169 g006
Figure 7. Dry matter of (a) barley’s roots and (b) all plants (g). Different lowercase letters between means for conditioner sites and control sites for the given study location indicate significant differences at p < 0.05 according to the Tukey HSD Test. Different capital letters between means for conditioner sites and control for all study locations indicate significant differences at p < 0.05 according to the Tukey HSD Test.
Sustainability 17 10169 g007
Figure 8. Barley’s root (a) length and (b) surface (g). The significance of lowercase and capital letters is explained in the caption of Figure 7.
Sustainability 17 10169 g008
Figure 9. Yield of barley grain (t ha−1). The significance of lowercase and capital letters is explained in the caption of Figure 7.
Sustainability 17 10169 g009
Figure 10. Principal Component Analysis derived from the studied soil properties: (a) plot of the first two principal components (PCs) for the assessed soil variables; Corg—total organic carbon, Ntot—total nitrogen, DHA—dehydrogenase activity, FDAH—fluorescein sodium salt hydrolysis, CEL—cellulase avtivity, DOC—dissolved organic carbon, DNt—dissolved nitrogen, MBC—microbial biomass carbon, MBN—microbial biomass nitrogen, AWC—available water capacity; RAWC—readily available water capacity; SAWC—small pore available water capacity, Ma—macropores, Mi—micropores, Pav—available phoshprus, Kav—available potassium, Mgav—available magnesium, Kex—exchangeable potassium, Naex—exchangeable sodium, Caex—exchangeable calcium, Mgex—exchangeable magnesium, CEC—cation exchange capacity (b) Principal Component Analysis of the properties determined in the individual study sites (Janocin, Kobylnica, and Samsieczynek); S—sites with Solactiv, C—control sites.
Sustainability 17 10169 g010
Table 1. Soil chemical properties as determined by Solactiv and sampling month (mean values for the study locations).
PropertySampling MonthControlSolactiv
Mean ± SECV [%]Mean ± SECV [%]
Corg [g kg−1]* III8.69 (±0.48)19.28.99 (±0.60)23.2
** VII8.20 (±0.26)10.88.92 (±0.54)21.0
Ntot [g kg−1]III1.07 (±0.03)11.01.12 (±0.05)15.4
VII1.09 (±0.03)8.71.13 (±0.04)10.9
pH in 1M KClIII6.34 (±0.15)12.06.24 (±0.19)15.2
VII6.51 (±0.15)11.26.35 (±0.18)14.1
Hh [cmol kg−1]III0.79 (±0.10) B63.01.16 (±0.18) A73.9
VII0.84 (±0.11) B66.51.10 (±0.17) A75.0
CEC [cmol kg−1]III9.43 (±0.61)31.510.3 (±0.65)31.2
VII11.3 (±1.41)31.412.2 (±0.71)28.8
Basic saturation (BS) [%]III89.4 (±1.8)9.686.0 (±2.2)12.7
VII91.1 (±1.4)7.689.4 (±1.7)9.3
Mg-exchan [cmol kg−1]III0.48 (±0.04)43.00.49 (±0.03)30.0
VII0.49 (±0.04)42.50.48 (±0.03)33.6
Ca-exchan [cmol kg−1]III7.58 (±0.64)41.27.97 (±0.76)46.8
VII9.41 (±0.72)37.49.95 (±0.78)38.6
K-exchan [cmol kg−1]III0.34 (±0.02)27.90.37 (±0.01)14.0
VII0.33 (±0.03)36.70.38 (±0.01)15.5
Na-exchan [cmol kg−1]III0.23 (±0.01)13.60.29 (±0.01)21.4
VII0.21 (±0.02)44.80.25 (±0.02)31.3
P-avail [mg kg−1]III63.4 (±1.3)10.267.1 (±2.8)20.3
VII66.0 (±2.1)15.470.0 (±3.4)24.1
K-avail [mg kg−1]III155.8 (±9.7) a30.5158.1 (±7.1) a21.9
VII138.6 (±7.7) b27.4139.6 (±5.5) b19.2
Mg-avail [mg kg−1]III53.1 (±3.0)27.356.9 (±2.7)23.5
VII57.9 (±3.4)28.459.6 (±2.4)19.9
Notes: SE—standard error; CV—coefficient of variation; III—March, before barley sowing (* Solactiv was to be used); VII—July, after the harvest of barley (** Solactiv was used); Corg—organic carbon; Ntot—total nitrogen; Hh—hydrolytic acidity; BS—basic saturation; CEC—cation exchange capacity; exchan—exchangeable forms; avail—available forms. Different capital letters indicate significant differences between conditioner and control locations at the same sampling time (p < 0.05, Tukey HSD Test). Different lowercase letters indicate significant differences between March and July within the same soil management (p < 0.05, Tukey HSD Test). Means without letters are not significantly different.
Table 2. Physical and water-related variables as determined by the Solactiv used (mean values for the research locations).
PropertyControlSolactiv
Mean ± SECV [%]Mean ± SECV [%]
Clay [%]5.0 (±0.3) A22.05.2 (±0.3) A21.3
Silt [%]38.5 (±2.9) A26.339.9 (±2.4) A21.2
Bulk density1.61 (±0.0) B1.11.57 (±0.01) A2.8
Total porosity35.2 (±0.30) A3.636.2 (±0.29) A3.4
Macropores7.22 (±0.34) B19.78.51 (±0.45) A22.3
AWC17.2 (±0.25) B6.218.8 (±0.17) A3.8
RAWC9.51 (±0.17) B7.711.01(±0.17) A6.4
SAWC7.64 (±0.32) A18.07.66 (±0.29) A16.0
Micropores10.8 (±0.26) A10.48.94 (±0.28) B13.4
Notes: SE—standard error; CV—coefficient of variation; AWC—available water capacity; RAWC—readily available water capacity; SAWC—small pore available water capacity. Different capital letters indicate significant differences between conditioner and control locations (p < 0.05, Tukey HSD Test). Means without letters are not significantly different.
Table 3. The content of carbon and nitrogen (dissolved forms and microbial biomass) in response to the conditioner application and sampling month (mean values across the study sites).
PropertySampling MonthControlSolactiv
Mean ± SECV [%]Mean ± SECV [%]
DOC* III101.1 (±4.0) Aa13.798.4 (±2.8) Aa9.8
** VII91.2 (±2.3) Ab8.791.0 (±2.8) Ab10.6
DNtIII23.6 (±0.9) Aa12.823.3 (±1.0) Aa15.5
VII18.2 (±0.5) Bb18.221.1 (±1.0) Aa16.1
MBCIII118.3 (±7.9) Bb32.8133.5 (±6.8) Aa24.8
VII131.3 (±8.8) Aa32.8135.9 (±5.5) Aa19.9
MBNIII19.7 (±1.33) Bb33.123.1 (±1.1) Aa22.5
VII21.5 (±1.6) Aa35.523.1 (±1.0) Aa22.0
Notes: SE—standard error; CV—coefficient of variation; III—March, before barley sowing (* Solactiv was to be used); VII—July, after the harvest of barley (** Solactiv was used); DOC—dissolved organic carbon (mg kg−1); DNt—dissolved organic nitrogen (mg kg−1); MBC—microbial biomass carbon (mg kg−1); MBN—microbial biomass nitrogen (mg kg−1). The significance of lowercase and capital letters is explained in the caption of Table 1.
Table 4. Enzymatic activity as determined by the used conditioner and sampling month (mean values across the study locations).
PropertySampling MonthControlSolactiv
Mean ± SECV [%]Mean ± SECV [%]
FDAH* III21.1 (±0.66) Ba15.324.4 (±0.89) Aa17.9
** VII19.4 (±0.59) Bb15.022.4 (±0.47) Aa10.2
DHAIII7.28 (±1.00) Ba67.29.28 (±1.05) Aa55.5
VII8.08 (±1.01) Ba61.49.20 (±0.67) Aa35.6
CMCIII5.17 (±0.20) Bb18.86.19 (±0.17) Ab13.4
VII8.73 (±0.19) Ba10.611.0 (±0.30) Aa13.6
Notes: SE—standard error; CV—coefficient of variation; III—March, before barley sowing (* Solactiv was to be used); VII—July, after the harvest of barley (** Solactiv was used). FDAH—fluorescein diacetate hydrolysis activity (mg F kg−1 h−1); DHA—dehydrogenase activity (mg TPF kg−1 24 h−1); CEL—cellulase activity (mg Glu kg−1 h−1). The significance of lowercase and capital letters is explained in the caption of Table 1.
Disclaimer/Publisher’s Note: The statements, opinions and data contained in all publications are solely those of the individual author(s) and contributor(s) and not of MDPI and/or the editor(s). MDPI and/or the editor(s) disclaim responsibility for any injury to people or property resulting from any ideas, methods, instructions or products referred to in the content.