Abstract
Kinmen Island, historically known as Quemoy, holds significant historical and geopolitical importance due to its strategic location in the Taiwan Strait, just a few kilometers from the Chinese mainland. This study presents the first comprehensive assessment of soil erosion and deposition on Kinmen, providing a scientific foundation for future land conservation and sustainable development initiatives. It also addresses the underrepresentation of small-island environments in soil erosion modeling by adapting the Revised Universal Soil Loss Equation (RUSLE) and Unit-Stream-Power-based Erosion Deposition (USPED) models for coarse-textured soils under limited rainfall conditions, offering insights into the reliability and limitations of these models in such contexts. The rainfall–runoff erosivity factor () was derived from precipitation data at four stations, while soil samples from ten locations were analyzed for the Soil Erodibility Factor (). Topographic factors, including the Slope Length and Steepness () and the Topographic Sediment Transport () factors, were computed from a 20 m DEM (Digital Elevation Model), and the Cover-Management Factor () was obtained from land use classification. The RUSLE estimated a mean soil erosion rate of 2.17 Mg ha−1 year−1, while the USPED results varied with parameterization, ranging from 0.87 to 3.79 Mg ha−1 year−1 for erosion and 1.39 to 6.51 Mg ha−1 year−1 for deposition. The results were compared with studies from the neighboring Fujian Province and contextualized through two field expeditions. This pioneering research advances the understanding of erosion and deposition processes in a strategically located island environment and supports evidence-based policies for land conservation, contributing to SDG 15 (Life on Land) and SDG 13 (Climate Action).
1. Introduction
Agriculture has been indispensable to human civilization, with food availability central to societal advancement. However, soil erosion poses a major threat to agricultural sustainability [1]. Traditional plow-based practices can accelerate erosion rates beyond natural soil formation [2], depleting nutrient-rich topsoil, reducing crop yields, and increasing sedimentation in rivers and lakes. These impacts degrade water quality and harm fragile ecosystems.
Soil erosion modeling is a key tool for analyzing and predicting erosion patterns. A global review identified 435 models developed for this purpose [3], with the Revised Universal Soil Loss Equation (RUSLE) family being the most widely used. Applications of RUSLE have had substantial impacts worldwide. In Europe, large-scale assessments have informed soil conservation policy [4]. In China, recent work demonstrated opportunities to reduce cropland erosion through crop switching and improved management [5]. In Brazil, high-resolution mapping advanced the understanding of soil erodibility at a national scale [6]. At the global level, projections of land use and climate change impacts highlighted future erosion risks and conservation priorities [7].
In Taiwan, soil erosion research has focused on watersheds and reservoirs, with USLE/ RUSLE-based studies reporting high mean soil erosion rates. For example, the Shihmen Reservoir watershed has been estimated at roughly 82–127 Mg ha−1 year−1[8,9,10,11,12], while the Zhuoshui River Basin averaged 122.9 Mg ha−1 year−1[13]. Across Taiwan, a conservative estimate is 200.7 Mg ha−1 year−1 [14].
Numerous erosion studies worldwide have used USLE/RUSLE for their simplicity and broad applicability. However, several reviews have identified recurring problems in their application, including inconsistent estimation of model factors and the use of non-standard or empirically derived relationships that reduce result reliability and reproducibility [15,16]. Similar issues have been noted for Unit-Stream-Power-based Erosion Deposition (USPED), where the interpretation of erosion and deposition signs has occasionally been reversed [17,18]. These challenges underscore the importance of careful parameterization and transparent methodology. In this study, RUSLE and USPED are applied to Kinmen Island with an emphasis on methodological rigor, as further detailed in the Materials and Methods Section and later evaluated in the Discussion Section.
This study examines soil erosion on Kinmen Island, an offshore island of Taiwan where no previous research has applied RUSLE or USPED. Smaller islands like Kinmen remain underrepresented in global studies, making this case particularly important. Globally, small islands are often overlooked in soil erosion research despite their ecological fragility, limited monitoring infrastructure, and high exposure to climate extremes. The primary objective of this study is to quantify soil erosion on Kinmen using RUSLE [19] and compare results with USPED [20,21], which estimates both erosion and deposition. Unlike prior applications in Taiwan’s watersheds [22], no such work exists for Kinmen. As the Agency of Rural Development and Soil and Water Conservation (ARDSWC) lacks relevant data, we collected new field measurements, providing a critical baseline for understanding soil erosion processes on small islands. This study addresses the following research questions: (i) What are the soil erosion rates on Kinmen as estimated by RUSLE? (ii) How do these results compare with USPED, which accounts for both erosion and deposition? (iii) What insights can these findings provide for understanding soil erosion processes in small-island environments?
2. Materials and Methods
This section first introduces the study site, Kinmen Island, and the models employed in this research: RUSLE and USPED. To provide a systematic overview, Table 1 summarizes the datasets used for calculating erosion factors and for field observation, including their sources and resolution or accuracy. The detailed procedures for deriving each factor and applying the models are described in the following subsections. Analysis was performed using R 4.3.3, GRASS GIS 8.3.1, and ArcGIS 10.4.1 to compute erosivity, erodibility, and other factors.

Table 1.
Summary of datasets used for erosion factor calculation and field observation.
2.1. Study Site
Kinmen Island, located west of Taiwan Island, comprises two main islands: Kinmen Main Island and Little Kinmen (Lieyu) (Figure 1). Shaped like a dumbbell, the island covers approximately 131.7 km2 and features rolling hills, coastal lowlands, and laterite platforms formed from granite gneiss [23,24,25]. The eastern part consists of gneiss hills shaped by long-term weathering and erosion, distinct from the shorter-term processes studied here. Taiwu Mountain, the highest point, reaches 247.6 m above sea level. The western part is mainly laterite platforms, low hills, and lowlands, with low gneiss hills in the southwest [26]. Island elevations are shown in Figure 2.
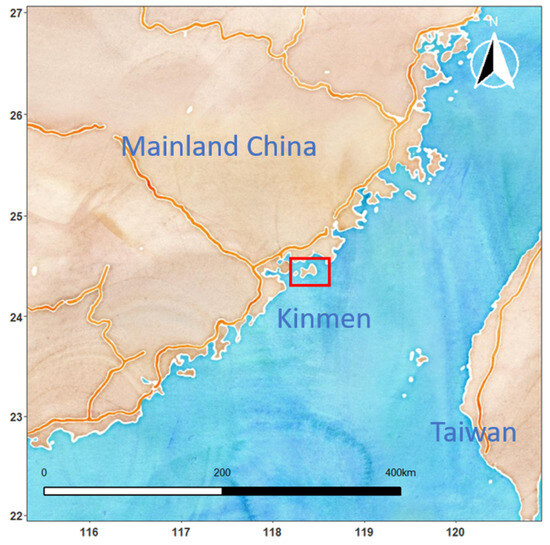
Figure 1.
Location of the study area: Kinmen Island, situated in the Taiwan Strait between Mainland China and Taiwan. The red box highlights the island’s position relative to the surrounding coastlines.
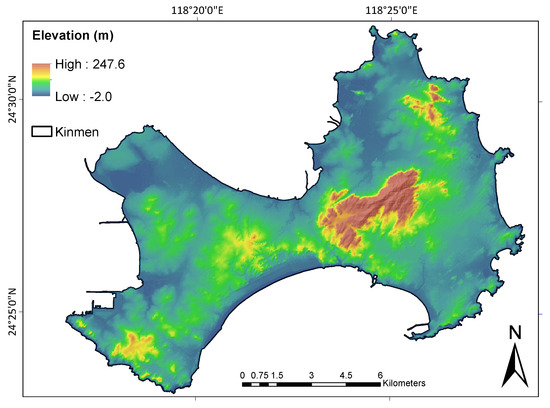
Figure 2.
Topographic map of Kinmen Island showing elevation, locations of rainfall monitoring stations, and sampling sites for the soil erodibility factor ().
Historically known as Quemoy, Kinmen still bears scars from the 1958 Second Taiwan Strait Crisis, when its strategic location a few kilometers from mainland China placed it at the center of heavy artillery bombardment. The conflict began on 23 August 1958, with tens of thousands of shells fired in a single day, and intermittent shelling continued until 1979. The crisis drew global attention and was described by the U.S. Secretary of State Christian Herter as the “first serious nuclear crisis” [27], paralleling more recent conflicts such as the Russia–Ukraine war.
Agriculture historically dominated Kinmen’s economy, but the island also maintained a substantial military presence until 1992, which supported local livelihoods. The lifting of military restrictions initiated a shift toward tourism [28]. The Offshore Islands Development Act of 2000 promoted peaceful cross-strait relations and tourism through the “Mini Three Links” initiative [29], launched in 2001 and expanded in 2011, enabling independent travel between Kinmen and mainland China. Tourism growth has spurred infrastructure expansion, increasing pressure on natural resources and creating the challenge of balancing economic growth with ecological conservation.
Kinmen’s infertile, sandy soils and limited natural resources make it vulnerable to environmental degradation and climate change. According to the USDA Soil Taxonomy, the main soils are Ultisols and Entisols [30]. Ultisols include Paleustults, Haplustults, and Plinthustults—highly weathered and acidic soils typical of humid subtropical regions. Entisols, such as Ustipsamments and Ustorthents, are young, weakly developed soils common in sandy or disturbed areas. The island’s coarse-grained soils have low water retention and fertility due to extensive weathering [31]. Excessive cultivation without sufficient vegetation cover has further accelerated erosion, exposing barren laterite [30]. Kinmen was designated a low-carbon development county in 2012 [31], reflecting its sustainability commitment.
This research supports soil and water conservation on Kinmen by analyzing erosion and deposition rates and their spatial patterns. The findings will aid sustainable soil management and align with SDG 15, which emphasizes the conservation of terrestrial ecosystems and combating land degradation [32].
2.2. The RUSLE and USPED Models
The RUSLE model calculates soil erosion as follows:
where
- A = computed soil loss per unit area (Mg ha−1 year−1).
- = rainfall–runoff erosivity factor (MJ mm ha−1 h−1 year−1).
- = soil erodibility factor (Mg hour MJ−1 mm−1).
- L = slope length factor (dimensionless).
- S = slope steepness factor (dimensionless).
- C = cover management factor (dimensionless).
- P = support practice factor (dimensionless).
The USPED model estimates soil erosion and deposition by first computing the sediment flow at transport capacity:
where
- T = sediment flow at transport capacity (Mg m ha−1 year−1).
- = rainfall–runoff erosivity factor (MJ mm ha−1 h−1 year−1).
- = soil erodibility factor (Mg hour MJ−1 mm−1).
- = topographic sediment transport factor (m2 m−1).
- C = cover management factor (dimensionless).
- P = support practice factor (dimensionless).
USPED modifies the USLE/RUSLE framework by replacing with , calculated from the upslope contributing area per unit width:
where
- U = upslope contributing area per unit width (m2/m).
- = angle of the slope.
- m = empirical coefficient.
- n = empirical coefficient.
Different m and n values are used to represent sheet erosion () and rill erosion (, ). In this study, we used and following [33] and also tested , for rill erosion.
Finally, USPED derives erosion and deposition by computing the divergence of sediment flow [34,35]:
where
- ED = soil erosion or deposition (Mg ha−1 year−1).
- = aspect of the topography or the direction of flow.
- = (, ) = unit vector in the steepest slope direction.
A positive divergence indicates soil erosion, where sediment transport capacity increases and soil detachment rises to meet it; a negative divergence indicates deposition [17,18]. As noted in the Introduction, many past studies have mistakenly reversed these signs, leading to incorrect interpretations of erosion and deposition patterns.
Building on these considerations, this study also sought to address several common pitfalls reported in the broader soil erosion modeling literature. First, the rainfall–runoff erosivity factor (Rm) was calculated directly following the original RUSLE manual [19], using high-frequency (1 min) rainfall data aggregated to 15 min intervals, rather than relying on empirical equations that can produce biased estimates. The detailed procedure is described in the section on Rm determination. Second, the soil erodibility factor (Km) was determined from laboratory analysis of field-collected soil samples, providing physically based values instead of depending solely on literature data. Further explanation is provided in the section on Km determination. Third, in applying USPED, we carefully adhered to the correct interpretation of erosion as positive divergence and deposition as negative divergence, thereby avoiding the sign-reversal errors noted in some previous studies. The modeling framework and its implications are elaborated in the subsequent methodological and discussion sections. These steps strengthen the reliability and reproducibility of the modeling framework applied to Kinmen Island.
2.3. Determination of the Factor
Unlike the case for Taiwan Island [14], the government does not provide or values for Kinmen. To avoid the errors associated with inaccurate empirical equations [16], we calculated directly using the methodology in the RUSLE manual [19]. One-minute interval rainfall data, purchased from the government, were aggregated to 15-min intervals for ease of processing.
The computation involves multiple steps. First, rainfall events are defined by segmenting the storm data. Under RUSLE criteria, an event is significant if total precipitation exceeds 12.7 mm or if 6.35 mm accumulates within 15 min. Storms are separated if rainfall during a six-hour period remains below 1.27 mm. Next, the total storm energy (E) is calculated (Equation (5)) using from Equation (6). RUSLE specifies that values—the product of total storm energy and the maximum 30 min intensity—are additive for individual storms. These values are calculated for each event and summed (Equation (7)) and then divided by the number of years N to obtain mean annual .
For this study, rainfall data from four Central Weather Administration (CWA) stations (Figure 2) were used. Due to budget limits, only five years (2018–2022) of one-minute data were acquired. Two stations (C0W140 and C0W150) suffered equipment failures in 2021, so their values were averaged over four years, excluding that year.
where
- E = total storm energy (MJ ha−1).
- = maximum 30 min intensity (mm h−1).
- = for storm i (MJ mm ha−1 h−1).
- j = number of storms in an N year period.
- = unit kinetic energy (MJ ha−1 mm−1).
- = rainfall intensity (mm h−1).
- = for increment r (MJ ha−1 mm−1).
- = rainfall depth for the increment of the storm hyetograph (mm).
It should be noted that the above equations, while directly derived from [19], are not presented explicitly in that reference and require careful interpretation of the methodology. After computing , values were spatially interpolated across Kinmen Island using the Inverse Distance Weighting (IDW) method.
2.4. Determination of the Factor
In this study, the calculation of followed the empirical formula described in the RUSLE manual [19]. As the original formula yields values in imperial units, results were converted to metric units by multiplying by the factor 0.1317, as shown in Equation (8).
where
- = percent organic matter.
- s = soil-structure code.
- p = profile permeability class.
- M = (percent modified silt) × (percent silt + percent sand).
- = (%silt + %very fine sand) × (100 − %clay).
Although empirical equations are often used to estimate the soil erodibility () factor in large-area studies, they may produce unrealistic values exceeding the theoretical upper limit of 0.1 (Mg h MJ−1 mm−1) [15]; therefore, this study directly determined through field sampling and laboratory particle-size analysis, ensuring that all values are physically measured and regionally representative rather than derived from empirical equations.
A total of 18 soil samples were collected from 10 locations on Kinmen Island and analyzed in the laboratory to determine . As detailed in Table S1 of the Supplementary Materials (“Particle-size distributions and related properties for Km estimation”), sites 1, 2, 3, 4, 6, 7, 9, and 10 each include two samples (e.g., 1.1 and 1.2), while sites 5 and 8 include only one sample due to insufficient soil quantity for complete grain-size analysis after transport to the laboratory in Taiwan. Figure 3 illustrates the island’s geological formations and sampling locations. Surface soils exhibit marked heterogeneity even over short distances; therefore, sampling aimed to capture representative conditions. The soils primarily consist of deposits formed by aeolian, fluvial, marine, or oceanic processes [23,36], laterite gravel, the Kinmen Formation, and weathered rock fragments. Particle size distribution was first assessed using sieve analysis down to a No. 270 sieve (0.053 mm). Finer fractions were analyzed with the hydrometer method to estimate silt and clay content. Both methods followed ASTM (American Society for Testing and Materials) standards.
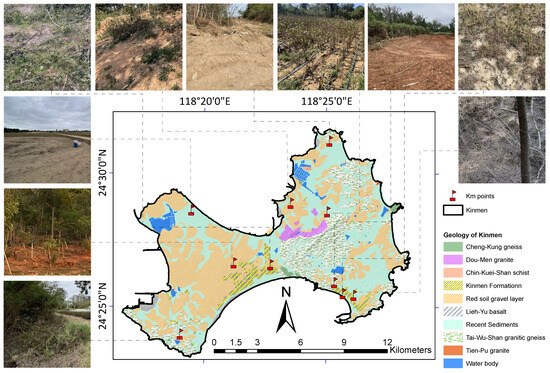
Figure 3.
Geological map of Kinmen with the locations of the sampling points, accompanied by field photographs depicting the corresponding site conditions.
In situ permeability tests were also performed, but access restrictions from landowners limited site selection, and infiltration rates failed to reach steady state. Soil-structure codes were unavailable because some samples were inadvertently discarded. Given that s ranges from 1 to 4 and p from 1 to 6, average values of and were adopted. The soil samples collected on Kinmen contained 85–99% sand, which provides important context for these parameter choices. In the RUSLE formulation, the soil-structure code (s) is defined as 2 for fine granular and 3 for medium/coarse granular soils; therefore, selecting represents a reasonable midpoint for the predominantly sandy soils observed. Likewise, the profile permeability class (p) is coded as 3 for moderate permeability and 4 for slow-to-moderate permeability. Considering the limited infiltration observations together with the sandy texture, was adopted as a balanced representation. Prior studies indicate that the influence of p and s on may be minor [37].
The resulting values were interpolated using Universal Kriging to produce a spatial map for Kinmen Island from the ten sampling locations as it accounts for both spatial autocorrelation and data trends. For , Universal Kriging was unsuitable due to too few data points to fit a variogram model, so IDW was used instead.
2.5. Determination of the and Factors
The key difference between the RUSLE and USPED models lies in their treatment of the and factors. For the RUSLE, this study employs the Desmet and Govers equation [38] to compute the factor from the upslope contributing area, using the field-based modules in SAGA. Notably, Chen and Nguyen [39] were the first to apply this method across the entire island of Taiwan.
In the USPED model, the factor is replaced by , which evaluates topographic sediment transport based on the upslope contributing area per unit width. Recommended values of m and n account for different erosion types: predominantly sheet erosion, a combination of sheet and rill erosion, or predominantly rill erosion. Typical ranges are – and –, with higher values indicating prevailing rill erosion and more turbulent flow, where erosion increases sharply with water volume. These parameters can also be fitted to field data.
Both sheet and rill erosion occur on Kinmen Island. In this study, we tested two cases: (1) , for mixed sheet and rill erosion; and (2) , for predominantly rill erosion.
The and factors were computed from a 20 m resolution DEM (Digital Elevation Model) provided by the Ministry of the Interior (Figure 2). Kinmen’s topography includes negative elevation values due to its geographic setting and tidal fluctuations, where some areas fall below average sea level during high tide. These values are essential for accurately representing terrain morphology and its influence on slope and erosion, making their inclusion critical for realistic sediment transport modeling.
2.6. Determination of the and Factors
In this study, the 2021 Land Use and Land Cover (LULC) data purchased from the National Land Surveying and Mapping Center were used to determine the values. The conversion of LULC data to factors was initially based on a reference table developed for the Shihmen Reservoir watershed in Taiwan [40]. This table was then expanded to include LULC types specific to Kinmen Island that were absent in the Shihmen Reservoir dataset, as shown in Table 2.

Table 2.
LULC categories and associated C values, modified from [40].
Due to the lack of detailed field data on soil conservation measures, this study follows a conservative approach widely adopted in soil erosion research, assuming the factor to be 1 for Kinmen.
2.7. On-Site Field Observations
The soil erosion modeling results were not formally validated through monitoring data as no erosion pins or long-term measurement infrastructure were installed on Kinmen Island. Instead, on-site field surveys were conducted to provide observational evidence and contextual understanding of erosion conditions within the study area. Two field surveys were conducted in July 2023. During the first visit to Kinmen, 24 locations were inspected to evaluate local conditions and capture photographic documentation. In the second survey, erosion depth measurements were recorded at six specific sites. From the 24 locations visited, representative examples of sheet erosion and rill erosion were identified and presented. Figure 4 shows only the six locations in green where photographs are provided in the Results section and the six locations in red where erosion depths were measured. These observations illustrate the presence and characteristics of erosion features on Kinmen, but they were not intended as a systematic validation of the model predictions.
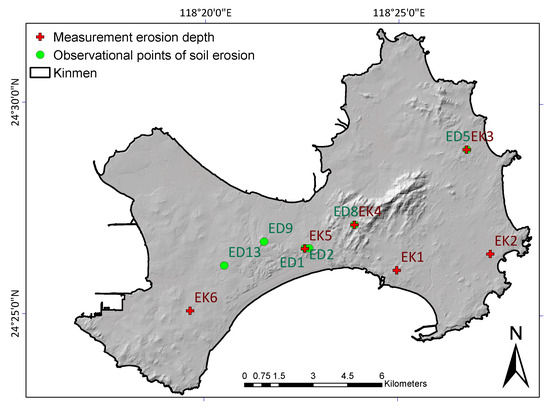
Figure 4.
Representative locations of rill and sheet erosion on Kinmen Island, indicating sites where erosion depth was measured (in red) and sites of field observations of soil erosion (in green).
3. Results
This study’s findings are presented in three parts. First, the erosion factors derived from the RUSLE and USPED models are analyzed. Second, soil erosion estimates from both models are compared. Finally, field measurements of erosion depth are used to provide context for the model results and offer insights into on-site erosion processes.
3.1. Quantitative Assessment of Erosion Factors Using RUSLE and USPED
Figure 5 shows the spatial distribution of the key erosion and deposition factors, alongside a SPOT 7 satellite image from 23 August 2022. The and maps were interpolated from rainfall station data and soil sampling points, respectively. The northwest exhibits the highest values, while some of the lowest values are found in the northeast. Conversely, the southeast displays relatively high values but lower values.
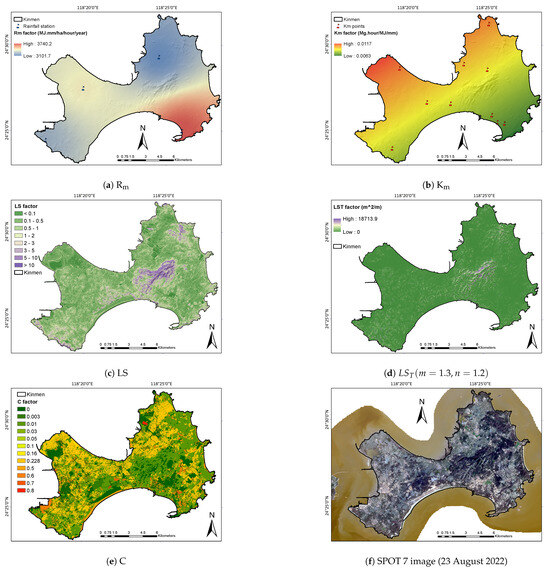
Figure 5.
Factors of the RUSLE and USPED models: (a) , (b) , (c) , (d) , (e) C, and (f) SPOT 7 image of Kinmen Island.
The and maps reflect the island’s generally flat terrain, except around Taiwu Mountain, the highest peak. The factor is highest in the north, indicating sparser vegetation. Together, these spatial patterns highlight the interaction between climate, soil properties, topography, and land cover in shaping erosion and deposition on Kinmen Island.
Table 3 summarizes the average, maximum (Max), and minimum (Min) values of these factors. The factor averages 3352 MJ mm ha−1 hour−1 year−1, ranging from 3102 to 3740, showing notable spatial variability. The factor averages 0.0090 Mg hour MJ−1 mm−1, with a range of 0.0063–0.0117, reflecting differences in soil erodibility. The detailed particle-size data used to compute the Km values, together with the per-station Rm values and their averages, are provided in the Supplementary Materials. The factor averages 0.95, with values from 0.03 to 29.85. The topographic sediment transport factor () averages 13.20 for , , and 60.57 for , . The cover-management factor () averages 0.12, with values from 0 to 0.80, indicating variation in vegetation cover across the island.

Table 3.
Average, maximum, and minimum values of erosion factors for the RUSLE and USPED models.
3.2. Comparison of Soil Erosion Estimates from RUSLE and USPED
Figure 6 shows the spatial patterns of erosion and deposition across Kinmen Island. The RUSLE output (Figure 6a) indicates widespread low to moderate erosion rates, with most of the island showing values between 0 and 3 Mg ha−1 year−1 and 3 and 6 Mg ha−1 year−1. Scattered hotspots are found primarily in cultivated areas, sparsely vegetated land, and some coastal slopes, reflecting the strong influence of the cover-management (C) factor on local erosion intensity. In contrast, the generally flat topography of Kinmen limits the / contribution, which helps to explain the dominance of low erosion values compared with more mountainous regions of Taiwan.
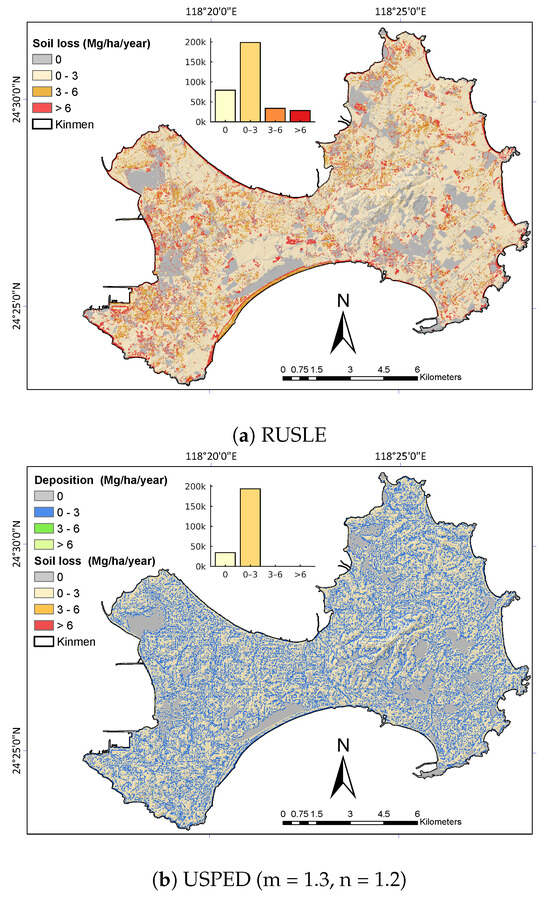
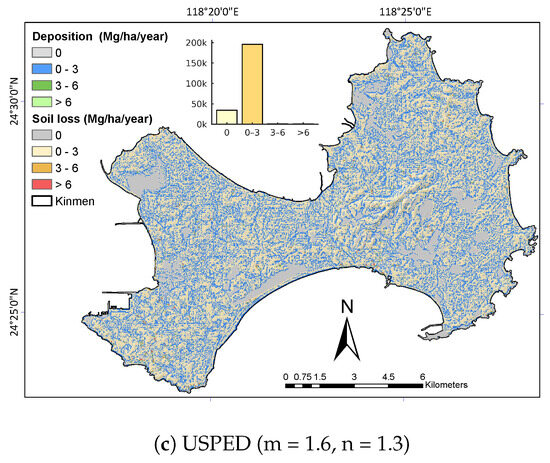
Figure 6.
Distribution of soil erosion and deposition from the (a) RUSLE model, (b) USPED model (m = 1.3, n = 1.2), and (c) USPED model (m = 1.6, n = 1.3).
The USPED outputs (Figure 6b,c) reveal more complex spatial dynamics, with yellow, orange, and red indicating erosion and blue and green indicating deposition. This dual-process representation highlights areas of sediment redistribution that RUSLE does not capture. The USPED results are also more sensitive to parameter choices, with higher m and n values producing larger predicted erosion and deposition magnitudes. The observed patterns suggest that localized land use interacts with gentle slope gradients to determine whether a site functions predominantly as an erosion source or a deposition sink.
Table 4 summarizes the corresponding soil erosion and deposition rates from the two models. The RUSLE model estimates an average erosion rate of 2.17 Mg ha−1 year−1 but does not account for deposition. The USPED model, by contrast, provides both erosion and deposition estimates: for and , erosion is 0.87 Mg ha−1 year−1 and deposition is 1.39 Mg ha−1 year−1; for and , erosion increases to 3.79 Mg ha−1 year−1 and deposition to 6.51 Mg ha−1 year−1. In both scenarios, the total amounts of erosion and deposition are of similar magnitude, reflecting USPED’s mass-balance framework. The USPED map for the sheet erosion case () is provided in the Supplementary Materials, where the total erosion and total deposition amounts for different parameterizations are also reported. In addition, the island area fractions derived from RUSLE and USPED (for multiple values) are included in the Supplementary Materials.

Table 4.
Summary of soil erosion and deposition on Kinmen Island based on the RUSLE and USPED models.
These contrasts highlight the complementary strengths of the two models: RUSLE offers a simpler estimate of overall erosion magnitude, whereas USPED reveals the spatial interplay between erosion and deposition and accounts for the balance between the two processes, making it particularly valuable for understanding landscape-scale sediment redistribution. By linking the modeled outcomes to controlling factors such as land cover and topography, the comparison also underscores how management interventions (e.g., vegetation cover improvements) could mitigate erosion risks even in relatively flat island settings.
3.3. Observed Field Evidence of Soil Erosion Depth
Figure 7 presents an overlay of RUSLE-derived soil erosion estimates on a Pléiades satellite image (15 November 2022). The colored grid cells indicate modeled annual soil loss, with higher values marking potential erosion hotspots. Two field observation sites (ED1 and ED2; see also Figure 8) are also shown on the image. The overlay reveals that some modeled hotspots coincide with bare soil or disturbed land visible in the satellite image, while others do not. This discrepancy is expected because RUSLE represents long-term average annual soil erosion, whereas the Pléiades image reflects land-surface conditions at a single moment in time. Accordingly, the figure should be viewed as providing observational evidence and contextual understanding of erosion conditions on Kinmen, rather than a quantitative validation of the model outputs. The southern shoreline and Kinmen Airport are also visible, where potential erosion can be observed along coastal stretches near built-up areas.
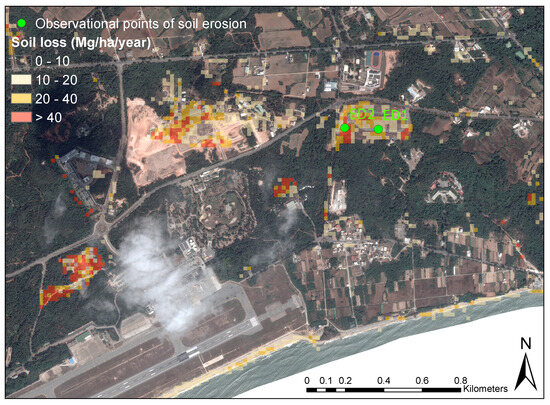
Figure 7.
Overlay of RUSLE-derived soil erosion estimates on a Pléiades image (15 November 2022). The color scale shows annual soil loss in Mg ha−1 year−1, with higher values indicating potential hotspots. Two field observation sites (ED1 and ED2; see Figure 8) are marked on the image. The overlay highlights locations where modeled hotspots align with bare or disturbed land visible in the satellite image, as well as areas where such agreement is absent.
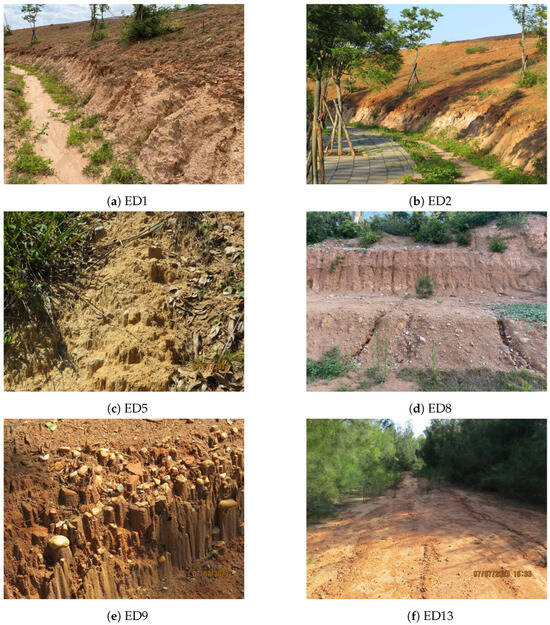
Figure 8.
The locations of on-site observation of soil erosion on Kinmen Island, corresponding to the six marked locations in Figure 4: (a) ED1, (b) ED2, (c) ED5, (d) ED8, (e) ED9, and (f) ED13. Each image depicts varying degrees of soil erosion observed during field visits. ED1 and ED2 are also shown in Figure 7, where they are displayed in relation to modeled erosion hotspots and the Pléiades satellite image.
The locations of soil erosion depth measurements are shown in Figure 4, with corresponding photographs in Figure 8. As noted earlier, ED1 and ED2 are also shown in Figure 7, where their positions relative to modeled erosion hotspots can be seen. Rill erosion was observed at ED1, ED2, ED8, and ED13, while sheet erosion occurred at ED5 and ED9. Sheet erosion was marked by topsoil loss and the presence of soil pedestals—small, elevated patches of soil protected by stones or rock fragments that shield them from raindrop impact. Unlike Taiwan Island, where intense typhoons quickly erode such features, Kinmen’s milder rainfall allows them to persist, making sheet erosion more easily observed.
Rill erosion, characterized by channels formed by concentrated surface runoff, was most apparent on slopes adjacent to dirt roads or sidewalks. Rainfall-driven runoff in these areas removes substantial amounts of soil, illustrating the erosive force of concentrated water flow.
At each of the six measurement sites (Figure 4), a ruler with millimeter precision was used to record soil pedestal height from the base of a protecting stone to the ground surface. Multiple readings per site were averaged. Table 5 lists the mean cumulative erosion depths and standard deviations. “Cumulative” refers to the fact that these depths have accumulated over many years, with the initial onset of erosion unknown.

Table 5.
Cumulative erosion depth measurements at six locations on Kinmen Island. “Number of measurements” refers to the count of readings taken at each site and, therefore, has no physical unit.
It is important to note that these field measurements were conducted as observational surveys to provide context about erosion processes on Kinmen, rather than as a formal validation of the RUSLE or USPED model predictions. Using Universal Kriging, the spatial mean cumulative erosion depth for Kinmen Island was estimated at 42.9 mm—exceeding model predictions from both RUSLE and USPED. Because the onset of erosion is uncertain and may have been influenced by typhoon-related events, these measured depths are not considered reliable for quantitative model evaluation. In contrast, the model predictions fall within a more reasonable range based on empirical experience and validated studies in the neighboring Fujian Province. This issue and its implications are further discussed in Section 4.1.
4. Discussion
The application of the RUSLE and USPED models provided valuable insights into the extent and spatial distribution of soil erosion and deposition on Kinmen Island. In the following sections, we examine why measured erosion depths exceed model predictions and compare our findings with data from the nearby Fujian Province to place Kinmen’s erosion dynamics in a regional context.
4.1. Lack of Monitoring, Erosion Onset, and Annual Soil Loss Estimation
As noted in Section 3.3, the field erosion depth measurements should be understood as observational context rather than a formal validation reference. Unlike many regions, Kinmen Island has no history of systematic soil erosion monitoring. No erosion pins or long-term devices were installed, which prevents rigorous evaluation of the model predictions. In such cases, direct field measurements of erosion depth, as performed here, provide one of the few feasible means to quantify erosion. However, while these measurements are valuable, they are highly uncertain and likely influenced by assumptions about erosion onset related to rainstorms or typhoon events. For this reason, model-based estimates from RUSLE and USPED remain more credible for representing average island-wide conditions.
Kinmen’s long-term mean annual precipitation is about 1100 mm year−1 [41], but the 2018–2022 rainfall data used in this study average only 745.9 mm year−1, reflecting a recent absence of typhoon landfalls. Typhoons likely play a major role in driving erosion by delivering intense rainfall that can remove soil pedestals and reset erosion surfaces. Therefore, identifying typhoons with direct impacts on Kinmen was critical to constraining the onset of erosion.
Based on the Central Weather Administration’s typhoon database, four notable events were identified:
- Typhoon Lupit (2–9 August 2021).
- Tropical Depression WP242018 (22–26 August 2018).
- Typhoon Guchol (4–8 September 2017).
- Typhoon Meranti (15 September 2016; direct landfall on Kinmen).
Among these, Typhoon Meranti in 2016 caused the most severe impacts according to available damage reports and is hypothesized to mark the beginning of the current erosion phase. Figure 9 shows the typhoon’s path across the study area. It should be emphasized that typhoons are not treated here as a separate research subject since their rainfall contribution is already represented in the factor. They are mentioned only because the absence of long-term erosion monitoring on Kinmen makes it impossible to determine when the observed erosion features first developed. In this context, we postulate that soil pedestals and similar features persist between major storm events and are reset when such events occur. Assuming erosion began after 15 September 2016, the period to our field survey dates (24–26 July 2023) spans 2503 days.
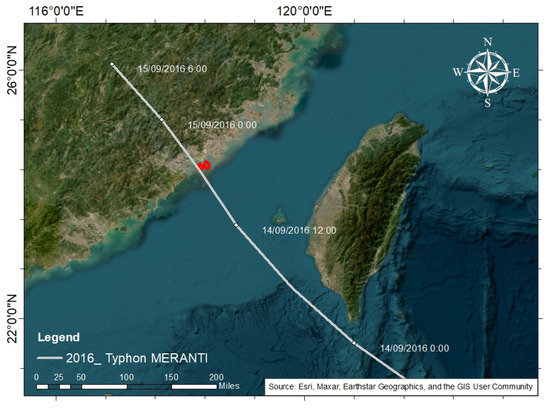
Figure 9.
Track of Typhoon Meranti in September 2016, showing its trajectory and timing before and after making landfall on Kinmen (shown in red).
The mean cumulative erosion depth for Kinmen, derived from field measurements (Table 5), is 42.9 mm. This translates to an average annual erosion depth of 6.3 mm year−1, or 87.58 Mg ha−1 year−1, assuming a soil unit weight of 1.4 Mg m-3. These estimates are considerably higher than expected based on empirical experience and may not represent typical long-term rates. In contrast, the RUSLE prediction of 2.17 Mg ha−1 year−1 and the highest USPED prediction (3.79 Mg ha−1 year−1 for , ) fall within a more reasonable range and align better with comparable studies in neighboring Fujian Province.
The disparity may stem from several factors. First, field measurements capture localized hotspots of erosion not fully represented in spatially averaged models. Second, because the exact onset of erosion is unknown, the assumption that it began after Typhoon Meranti may overestimate annual rates. Third, local variations in soil properties, land use, and vegetation cover may differ from model parameter assumptions. Ultimately, while field erosion depths provide important site-specific insight in the absence of monitoring, they should not be treated as a validation dataset, and the RUSLE and USPED outputs are considered to provide more reasonable island-wide averages.
4.2. Comparison with Neighboring Fujian Province
The comparison between our RUSLE and USPED results and field-observed erosion phenomena shows a weak correlation. To contextualize our findings, we examined studies from the neighboring Fujian Province, including those that focus on individual erosion factors, landscape change, and ecosystem services. A synthesis of these studies is presented in Table 6.

Table 6.
Summary and comparison of soil erosion studies conducted in neighboring Fujian Province. Some studies focus solely on individual factors, while others do not provide average or range values. Original figures from the studies are presented without rounding.
Although the literature provides useful background, it also reveals methodological issues similar to those discussed in the Introduction Section [15,16]. As summarized in Table 6, many studies did not follow standard USLE/RUSLE procedures for calculating the rainfall erosivity factor (), often substituting empirical equations for high-resolution rainfall data. Such empirical relationships, as noted in earlier reviews, can produce substantial inaccuracies. Comparable challenges exist for the factor: where some reported values exceed known physical limits, others lack proper units, or were derived using non-standard methods. These inconsistencies make direct, quantitative comparison with our Kinmen results unreliable.
The regional comparison is, therefore, helpful but necessarily limited. While it highlights the prevalence of methodological shortcuts in Fujian studies, it also demonstrates the difficulty of synthesizing results when factors are derived inconsistently. The broader implication is that meaningful cross-regional comparisons require standardized methods and transparent reporting of data sources and procedures.
The study by [48], which reported a 2020 RUSLE-based erosion rate of 3.38 Mg ha−1 year−1 validated with hydrological station data, is a notable exception and aligns closely with our findings. However, the broader variability in methods and data quality across the Fujian studies prevents firm conclusions.
This underscores the importance of our work: Kinmen represents an isolated island setting where soil erosion modeling has not previously been conducted and where we have applied fully documented, standard-compliant methods using actual high-frequency rainfall and measured soil properties. By addressing the methodological pitfalls identified in the past literature, our study provides a more reliable reference point for understanding erosion dynamics in small-island environments and contributes to a more standardized basis for comparison with neighboring regions such as Fujian.
4.3. Management Implications for Kinmen
The findings of this study also have practical relevance for soil and water conservation planning on Kinmen Island. Given that overall erosion rates are relatively low to moderate but localized hotspots occur in cultivated and sparsely vegetated areas, targeted management is recommended. Conservation practices such as maintaining ground cover through cover crops, mulching, or residue retention could effectively reduce soil loss in farmland. Contour farming and small-scale terraces may further help minimize rill development on slopes near agricultural plots and roads. In coastal areas where erosion risk is higher, the establishment of vegetative buffer strips and reinforcement of vulnerable slopes would provide additional protection. These site-specific measures, combined with the development of long-term monitoring infrastructure, would support sustainable land management and align with broader soil conservation goals in Taiwan and beyond.
4.4. Study Limitations and Considerations
It is worth emphasizing that this study directly addressed several methodological pitfalls frequently encountered in soil erosion modeling. By calculating the rainfall–runoff erosivity factor (Rm) from high-frequency rainfall records in accordance with the RUSLE manual, we avoided the biases that can arise from simplified empirical equations. The soil erodibility factor (Km) was derived from laboratory analysis of field-collected samples, ensuring physically based values instead of relying on generalized or literature-based parameters. In applying USPED, we also adhered to the correct interpretation of positive divergence as erosion and negative divergence as deposition, thereby eliminating the sign-reversal errors that have appeared in past applications. These measures enhance the reliability and reproducibility of the results and provide a stronger reference point for small-island environments such as Kinmen.
While these steps improved methodological reliability, this study also evaluated soil erosion and deposition patterns on Kinmen Island using the RUSLE and USPED models, with comparisons to studies in neighboring Fujian Province. The results reinforce the importance of standardized modeling procedures to enable meaningful cross-regional comparisons. The relatively low erosion rates observed are consistent with Kinmen’s lower rainfall and gentle topography, which limit runoff and erosive energy. While these findings provide a useful baseline for local conservation strategies, several methodological constraints warrant consideration for future modeling in similar environments.
First, the factor was derived from high-temporal-resolution rainfall data following the original RUSLE methodology. This improves process fidelity but depends on costly and limited datasets. In this case, only five years of data (2018–2022) were available, during which rainfall was below the long-term average. This temporal limitation may bias the erosivity estimate toward lower values, underscoring the need for extended datasets or the integration of synthetic rainfall series to capture interannual variability.
Second, the relatively low factor likely reflects both methodological and logistical constraints. Difficulties in achieving steady infiltration rates during field permeability testing, coupled with restricted access imposed by landowners and budgetary limitations, which constrained soil sampling to 18 samples from 10 locations in this pilot study, may have led to an underestimation of soil erodibility. Future studies should address this limitation by expanding the number of sampling sites and improving spatial coverage across diverse soil and land-cover types to better capture regional-scale variability. This highlights the importance of improving in situ measurement protocols and ensuring representative sampling, especially in areas with limited accessibility.
Third, the cover-management (C) and support practice (P) factors were derived from national land-use data. Because no detailed records of conservation practices (e.g., contouring, terracing, and strip cropping) are available for Kinmen, a uniform was assumed. While this simplifies conditions and may overestimate erosion in managed lands, it avoids introducing speculative values. We acknowledge this as a limitation and emphasize the need for more detailed management information in future studies.
Fourth, the resolution of the DEM used in this study (20 m) may constrain the accuracy of topographic factor estimation. Higher-resolution datasets (e.g., 5 m DEMs or LiDAR-derived products) would better capture microtopographic variability and improve both and factor calculations. As no finer DEM is currently available for Kinmen, we acknowledge this as a limitation and recommend that future work incorporate higher-resolution elevation data when feasible.
Fifth, although field surveys identified extensive sheet and rill erosion, the observed annual rate of 87.58 Mg ha−1 exceeded both RUSLE and USPED predictions. This discrepancy suggests potential misestimation of erosion onset timing—possibly linked to Typhoon Meranti in 2016—or underrepresentation of extreme events in the model inputs. The absence of long-term erosion monitoring hampers retrospective calibration. Incorporating erosion pins or similar field-based monitoring tools could provide continuous validation data and help reconcile model–field mismatches.
A further limitation relates to scaling. The erosion depths obtained from field surveys represent localized point conditions, whereas the RUSLE and USPED models produce distributed estimates across the landscape. Directly comparing point-based measurements with gridded model outputs may, therefore, introduce mismatches and uncertainty. For this reason, the field observations in this study are interpreted as qualitative context to illustrate erosion processes, rather than as quantitative validation of model predictions.
Overall, these limitations do not diminish the study’s value as the first quantitative erosion assessment for Kinmen Island, but they do indicate critical avenues for methodological refinement. Future work should prioritize longer climatic records, more robust soil sampling strategies, and permanent monitoring infrastructure. Such measures would strengthen model calibration, improve predictive reliability, and enhance transferability of results to other data-scarce, low-relief island environments.
In addition, this study was designed as a preliminary benchmark for Kinmen. However, it did not separately analyze the effect of farmland on erosion rates or delineate erosion probability zones. These tasks would require more detailed land-use stratification, longer-term monitoring, and probabilistic modeling. We note them here as important directions for future research to complement the baseline results presented in this study.
In summary, although data and logistical constraints introduced uncertainties, the corrective measures implemented in this study—such as the direct calculation of , laboratory-based determination of , and proper USPED interpretation—represent a meaningful step toward more reliable erosion modeling in small-island contexts.
5. Conclusions
This study applied two soil erosion models—the RUSLE and the USPED model—to assess soil erosion and deposition on Kinmen Island. It represents the first comprehensive evaluation of soil erosion in this region. As no rainfall erosivity data were available for the island, we compiled rainfall records from weather stations and calculated the factor according to the equation specified in the RUSLE manual. The factor was determined through field sampling and laboratory analysis of soils from Kinmen Island. USPED was also applied using divergence signs to distinguish erosion and deposition, thereby avoiding common sign-reversal errors.
According to the RUSLE model, most of Kinmen Island exhibits low-to-moderate erosion rates (average 2.17 Mg ha−1 year−1), with scattered hotspots occurring mainly in cultivated land, sparsely vegetated areas, and some coastal slopes. These spatial patterns emphasize the influence of land cover and land use on erosion processes, while the island’s gentle topography and relatively low rainfall help restrict the occurrence of severe erosion compared with Taiwan Island. By contrast, the USPED results, which vary with parameter settings, indicate somewhat higher erosion and deposition values, underscoring the model’s greater sensitivity to topographic controls.
The main methodological contributions of this study are as follows: (i) use of high-frequency rainfall data to calculate the factor in accordance with the RUSLE manual, (ii) laboratory-based determination of the factor from field samples rather than relying solely on literature values, and (iii) careful implementation of USPED with correct interpretation of divergence signs. These refinements strengthen reproducibility and comparability across regions.
Because Kinmen lacks systematic erosion monitoring, temporal evolution of erosion could not be quantified, but field observations confirm that sheet and rill erosion remain visible. This data gap underscores the importance of future long-term monitoring to capture storm-driven dynamics and provide quantitative validation of model predictions. Despite these limitations, the findings provide valuable insights into the island’s erosion dynamics and establish a foundation for soil conservation strategies in similar environments, contributing to the achievement of Sustainable Development Goals (SDGs), particularly SDG 13: Climate Action and SDG 15: Life on Land.
Supplementary Materials
The following supporting information can be downloaded at https://www.mdpi.com/article/10.3390/su172210052/s1.
Author Contributions
Conceptualization, W.C.; Data Curation, W.C., K.A.N. and Y.-C.H.; Funding Acquisition, W.C.; Investigation, W.C., K.A.N. and Y.-C.H.; Methodology, W.C.; Project Administration, W.C.; Resources, W.C.; Software, W.C., K.A.N. and Y.-C.H.; Supervision, W.C.; Validation, W.C., K.A.N. and Y.-C.H.; Visualization, K.A.N. and Y.-C.H.; Writing—Original Draft, W.C. and K.A.N.; Writing—Review and Editing, W.C., K.A.N. and Y.-C.H. All authors have read and agreed to the published version of the manuscript.
Funding
This study was partially supported by the Ministry of Science and Technology (Taiwan) research project (Grant Number MOST 111-2121-M-027-001) and by the National Science and Technology Council (Taiwan) research projects (Grant Numbers NSTC 112-2121-M-027-001 and NSTC 114-2121-M-027-001).
Institutional Review Board Statement
Not applicable.
Informed Consent Statement
Not applicable.
Data Availability Statement
The raw data used in this study are not publicly available due to restrictions imposed by the data owner or source. Consequently, these data cannot be disseminated or shared as part of this publication. Interested researchers may request access directly from the data owner or source, subject to their terms and conditions. The authors confirm that they do not have the right to distribute the raw data employed in this study. The derived GeoTIFF figures of erosion factors (Rm, Km, LS, LST) and modeled outputs from RUSLE and USPED, together with R scripts for rainfall event segmentation and erosivity (Rm) calculation, have been deposited in Figshare and are openly available at https://doi.org/10.6084/m9.figshare.30252529.
Acknowledgments
This article is partially derived from the master’s thesis of Yu-Chieh Huang, submitted to the National Taipei University of Technology in partial fulfillment of the requirements for the Master of Science degree [51]. Part of this article builds on a preprint version we deposited in SSRN, which has since been expanded with additional analyses, corrected methodologies, new figures, and Supplementary Materials. We would like to express our sincere gratitude to Hao-Jun Sun, Yi-Jia Jiang, and Chiao-Shin Huang for their invaluable contributions during field excursions, particularly in verifying soil erosion and conducting in situ permeability tests. Furthermore, the authors acknowledge the use of ChatGPT 5 to enhance the readability and language of the manuscript. All content generated by the tool was subsequently reviewed and edited as needed, and the authors take full responsibility for the final version of the publication. The authors gratefully acknowledge the use of purchased satellite imagery obtained through the Center for Space and Remote Sensing Research (CSRSR), National Central University (NCU): SPOT-7 imagery © Airbus DS (2022), and Pléiades imagery © CNES (2022), Distribution Airbus DS. The imagery was sublicensed for academic research use from Airbus DS via CSRSR, NCU.
Conflicts of Interest
The authors declare no conflicts of interest.
References
- Pimentel, D.; Harvey, C.; Resosudarmo, P.; Sinclair, K.; Kurz, D.; McNair, M.; Crist, S.; Shpritz, L.; Fitton, L.; Saffouri, R.; et al. Environmental and economic costs of soil erosion and conservation benefits. Science 1995, 267, 1117–1123. [Google Scholar] [CrossRef] [PubMed]
- Montgomery, D.R. Soil erosion and agricultural sustainability. Proc. Natl. Acad. Sci. USA 2007, 104, 13268–13272. [Google Scholar] [CrossRef] [PubMed]
- Borrelli, P.; Alewell, C.; Alvarez, P.; Anache, J.A.A.; Baartman, J.; Ballabio, C.; Bezak, N.; Biddoccu, M.; Cerdà, A.; Chalise, D.; et al. Soil erosion modelling: A global review and statistical analysis. Sci. Total Environ. 2021, 780, 146494. [Google Scholar] [CrossRef] [PubMed]
- Panagos, P.; Borrelli, P.; Poesen, J.; Ballabio, C.; Lugato, E.; Meusburger, K.; Montanarella, L.; Alewell, C. The new assessment of soil loss by water erosion in Europe. Environ. Sci. Policy 2015, 54, 438–447. [Google Scholar] [CrossRef]
- Li, K.; Zhou, Z.; Wang, Z.; Zeng, Y.; Hubacek, K.; Borrelli, P.; Li, C.; Zhang, W.; Deng, Z.; Wang, J.; et al. Opportunity for mitigating soil loss by water erosion in cropland through crop switching and improved management in China. Geogr. Sustain. 2025, 6, 100262. [Google Scholar] [CrossRef]
- de Faria Godoi, R.; Rodrigues, D.B.B.; Borrelli, P.; Oliveira, P.T.S. High-resolution soil erodibility map of Brazil. Sci. Total Environ. 2021, 781, 146673. [Google Scholar] [CrossRef]
- Borrelli, P.; Robinson, D.A.; Panagos, P.; Lugato, E.; Yang, J.E.; Alewell, C.; Wuepper, D.; Montanarella, L.; Ballabio, C. Land use and climate change impacts on global soil erosion by water (2015–2070). Proc. Natl. Acad. Sci. USA 2020, 117, 21994–22001. [Google Scholar] [CrossRef]
- Liu, Y.-H.; Li, D.-H.; Chen, W.; Lin, B.-S.; Seeboonruang, U.; Tsai, F. Soil erosion modeling and comparison using slope units and grid cells in Shihmen reservoir watershed in Northern Taiwan. Water 2018, 10, 1387. [Google Scholar] [CrossRef]
- Tsai, F.; Lai, J.-S.; Nguyen, K.A.; Chen, W. Determining cover management factor with remote sensing and spatial analysis for improving long-term soil loss estimation in watersheds. ISPRS Int. J. Geo-Inf. 2021, 10, 19. [Google Scholar] [CrossRef]
- Chen, W.; Li, D.-H.; Yang, K.-J.; Tsai, F.; Seeboonruang, U. Identifying and comparing relatively high soil erosion sites with four DEMs. Ecol. Eng. 2018, 120, 449–463. [Google Scholar] [CrossRef]
- Lo, T.-W. Rainfall Factor and Mean Value Estimation of Shihmen Reservoir Sub-Watersheds. Master’s Thesis, National Taipei University of Technology, Taipei, Taiwan, 2020. (In Chinese). [Google Scholar]
- Liu, Y.-H. Analysis of Soil Erosion of Shihmen Reservoir Watershed in Taiwan and Lam Phra Ploeng Basin in Thailand. Master’s Thesis, National Taipei University of Technology, Taipei, Taiwan, 2019. (In Chinese). [Google Scholar]
- Liou, Y.-A.; Nguyen, Q.-V.; Hoang, D.-V.; Tran, D.-P. Prediction of soil erosion and sediment transport in a mountainous basin of Taiwan. Prog. Earth Planet. Sci. 2022, 9, 52. [Google Scholar] [CrossRef]
- Chen, W.; Nguyen, K.A.; Huang, Y.-C. Soil erosion in Taiwan. Agriculture 2023, 13, 1945. [Google Scholar] [CrossRef]
- Majhi, A.; Shaw, R.; Mallick, K.; Patel, P.P. Towards improved USLE-based soil erosion modelling in India: A review of prevalent pitfalls and implementation of exemplar methods. Earth-Sci. Rev. 2021, 221, 103786. [Google Scholar] [CrossRef]
- Chen, W.; Huang, Y.-C.; Lebar, K.; Bezak, N. A systematic review of the incorrect use of an empirical equation for the estimation of the rainfall erosivity around the globe. Earth-Sci. Rev. 2023, 238, 104339. [Google Scholar] [CrossRef]
- Gouma, M.; van Wijngaarden, G.J.; Soetens, S. Assessing the effects of geomorphological processes on archaeological densities: A GIS case study on Zakynthos Island, Greece. J. Archaeol. Sci. 2011, 38, 2714–2725. [Google Scholar] [CrossRef]
- Mitasova, H.; Barton, M.; Ullah, I.; Hofierka, J.; Harmon, R.S. GIS-based soil erosion modeling. In Treatise on Geomorphology: Volume 1–14; Elsevier: Amsterdam, The Netherlands, 2013; pp. 228–258. [Google Scholar]
- Renard, K.G.; Foster, G.R.; Weesies, G.A.; McCool, D.K.; Yoder, D.C. Predicting Soil Erosion by Water: A Guide to Conservation Planning with the Revised Universal Soil Loss Equation (RUSLE). In Agricultural Handbook; United States Department of Agriculture: Washington, DC, USA, 1997; p. 703. [Google Scholar]
- Mitasova, H.; Hofierka, J.; Zlocha, M.; Iverson, L.R. Modelling topographic potential for erosion and deposition using GIS. Int. J. Geogr. Inf. Syst. 1996, 10, 629–641. [Google Scholar] [CrossRef]
- Mitasova, H.; Brown, W.M.; Johnston, D.; Mitas, L. GIS tools for erosion/deposition modelling and multidimensional visualization. In Part III: Process Based Erosion Simulation. Geographic Modelling and Systems Laboratory; University of Illinois Urbana-Champaign: Champaign, IL, USA, 1996. [Google Scholar]
- Chen, W.; Wang, W.-H.; Nguyen, K.A. Soil erosion and deposition in a Taiwanese watershed using USPED. Sustainability 2022, 14, 3397. [Google Scholar] [CrossRef]
- Wu, C.-T.; Lin, E.-S. Geology and Landscapes of Kinmen. In Kinmen Academic Series; Dow Tien Publishing House: New York, NY, USA, 1998; Volume 11. (In Chinese) [Google Scholar]
- Chen, C.-H. Kinmen Island Geological Survey and Research. Geophysics 1986, 7, 14–25. (In Chinese) [Google Scholar]
- Lin, C.-C.; Chen, P.-Y.; Lin, F.-Y. Report on the Geology and Mineral Deposits in Quemoy Islands, Fuchien; MRSO: Hollywood, FL, USA, 1970. (In Chinese) [Google Scholar]
- Chen, P.-Y. Studies of the Quaternary Clays and Clay Minerals from Chinmen Island, Fukien. Taiwan Min. Ind. 1965, 2–4, 66–92. (In Chinese) [Google Scholar]
- Halperin, M.H. The 1958 Taiwan Straits Crisis: A Documented History; Rand Corporation: Santa Monica, CA, USA, 1996. [Google Scholar]
- Wan, T.-L.A. Islands, geopolitics and language ideologies: Sociolinguistic differentiation between Taiwanese and Kinmenese Hokkien. Lang. Commun. 2022, 83, 36–48. [Google Scholar] [CrossRef]
- Tsai, C.-W. A Strategy Study of Tourism Development for Kinmen after the Implementation of Individual Visit of Mini Three Links. J. Natl. Quemoy Univ. 2012, 2, 235–254. (In Chinese) [Google Scholar]
- Kuo, C.-M.; Chen, Z.-S. The Project of Investigation of Soil and Vegetation Analysis in Kinmen National Park; Kinmen National Park Headquarters, Construction and Planning Agency, Ministry of the Interior: Kinmen, Taiwan, 2002.
- Chen, C.-T. Introduction to Kinmen Studies; National Quemoy University: Kinmen, Taiwan, 2022. (In Chinese) [Google Scholar]
- Lal, R.; Bouma, J.; Brevik, E.; Dawson, L.; Field, D.J.; Glaser, B.; Hatano, R.; Hartemink, A.E.; Kosaki, T.; Lascelles, B.; et al. Soils and sustainable development goals of the United Nations: An International Union of Soil Sciences perspective. Geoderma Reg. 2021, 25, e00398. [Google Scholar] [CrossRef]
- Borrelli, P.; Märker, M.; Schütt, B. Modelling post-tree-harvesting soil erosion and sediment deposition potential in the Turano River Basin (Italian Central Apennine). Land Degrad. Dev. 2015, 26, 356–366. [Google Scholar] [CrossRef]
- Harmon, B.A.; Mitasova, H.; Petrasova, A.; Petras, V. r.sim.terrain 1.0: A landscape evolution model with dynamic hydrology. Geosci. Model Dev. 2019, 12, 2837–2854. [Google Scholar] [CrossRef]
- Mitasova, H.; Mitas, L. Multiscale soil erosion simulations for land use management. In Landscape Erosion and Evolution Modeling; Springer: Berlin/Heidelberg, Germany, 2001; pp. 321–347. [Google Scholar]
- Lin, W.; Lee, C.-Y.; Yang, H.-C.; Chen, C.-H. Geological Map of Taiwan Scale 1:50,000 in Kinmen Area; Central Geological Survey, Ministry of Economic Affairs: New Taipei City, Taiwan, 2011. (In Chinese)
- Lin, L.-L.; Chang, S.-T. Study of Soil Erodibility Factor Estimation Equations. J. Chin. Soil Water Conserv. 2008, 39, 355–366. (In Chinese) [Google Scholar]
- Desmet, P.J.J.; Govers, G. A GIS procedure for automatically calculating the USLE LS factor on topographically complex landscape units. J. Soil Water Conserv. 1996, 51, 427–433. [Google Scholar] [CrossRef]
- Chen, W.; Nguyen, K.A. The New Island-Wide LS Factors of Taiwan, with Comparison with EU Nations. Sustainability 2022, 14, 3059. [Google Scholar] [CrossRef]
- Wang, W.-H. Analyzing Soil Erosion and Deposition Using USPED in the Shihmen Reservoir Watershed. Master’s Thesis, National Taipei University of Technology, Taipei, Taiwan, 2022. (In Chinese). [Google Scholar]
- Central Weather Administration. Kinmen Weather Station: Station Characteristics; Central Weather Administration: Taipei, Taiwan. Available online: https://etour.cwa.gov.tw/station_inpage.php?stn_id=17 (accessed on 16 August 2024). (In Chinese)
- Fang, G.Q.; Ruan, F.S.; Wu, X.H.; Guo, Z.M. Main features of soil erodibility in Fujian province. Soil Water Conserv. Fujian 1997, 2, 19–23. [Google Scholar]
- Wang, B.; Zheng, F.; Guan, Y. Improved USLE-K factor prediction: A case study on water erosion areas in China. Int. Soil Water Conserv. Res. 2016, 4, 168–176. [Google Scholar] [CrossRef]
- Wang, X.Q.; Zeng, S.J.; Chen, X.G.; Lin, J.L.; Chen, S.M. Change analysis on soil erosion of Fujian Province from 1990 to 2015. Int. Arch. Photogramm. Remote Sens. Spat. Inf. Sci. 2017, 42, 1381–1386. [Google Scholar] [CrossRef]
- Chen, S.; Zha, X. Effects of the ENSO on rainfall erosivity in the Fujian Province of southeast China. Sci. Total Environ. 2018, 621, 1378–1388. [Google Scholar] [CrossRef]
- Ye, H.; Hua, W.; Huang, C.; Huang, T.; Wang, H.; Yuan, X.; Yang, H. Quantitative evaluation of soil erosion in the upper Minjiang River Basin of China based on integration of geospatial technologies using RUSLE. Pol. J. Environ. Stud. 2020, 29, 3419–3429. [Google Scholar] [CrossRef]
- Li, C.; Lin, L.; Hao, Z.; Post, C.J.; Chen, Z.; Liu, J.; Yu, K. Developing a USLE cover and management factor (C) for forested regions of southern China. Front. Earth Sci. 2020, 14, 660–672. [Google Scholar] [CrossRef]
- Gao, J.; Shi, C.; Yang, J.; Yue, H.; Liu, Y.; Chen, B. Analysis of spatiotemporal heterogeneity and influencing factors of soil erosion in a typical erosion zone of the southern red soil region, China. Ecol. Indic. 2023, 154, 110590. [Google Scholar] [CrossRef]
- Xie, X.; Wang, X.; Wang, Z.; Lin, H.; Xie, H.; Shi, Z.; Liu, X. Influence of landscape pattern evolution on soil conservation in a red soil hilly watershed of Southern China. Sustainability 2023, 15, 1612. [Google Scholar] [CrossRef]
- Xu, J.; Jiang, X.; Liu, H.; Yin, F.; Xu, Y.; Gao, C. Monitoring of spatiotemporal changes in ecosystem service functions and analysis of influencing factors in Pingtan Island. Ecol. Indic. 2024, 158, 111590. [Google Scholar] [CrossRef]
- Huang, Y.-C. Soil Erosion and Deposition of Kinmen. Master’s Thesis, National Taipei University of Technology, Taipei, Taiwan, 2023. (In Chinese). [Google Scholar]
Disclaimer/Publisher’s Note: The statements, opinions and data contained in all publications are solely those of the individual author(s) and contributor(s) and not of MDPI and/or the editor(s). MDPI and/or the editor(s) disclaim responsibility for any injury to people or property resulting from any ideas, methods, instructions or products referred to in the content. |
© 2025 by the authors. Licensee MDPI, Basel, Switzerland. This article is an open access article distributed under the terms and conditions of the Creative Commons Attribution (CC BY) license (https://creativecommons.org/licenses/by/4.0/).