1. Introduction
Amidst the backdrop of the escalating global energy crisis and environmental challenges, sustainable development has emerged as an imperative trajectory for human societal progress. The transportation sector, being one of the principal sources of energy consumption and carbon emissions, holds significant sway over the realization of global climate objectives. Photovoltaic (PV) pavement technology, as an innovative sustainable transportation solution, integrates solar photovoltaic modules into the road structure, thereby endowing road infrastructure with energy-generation capabilities [
1]. This technology not only effectively harnesses road space and reduces reliance on conventional energy sources but also diminishes carbon emissions, alleviates energy pressures, and yields substantial environmental and economic benefits [
2,
3]. However, in practical applications, PV pavements confront multifaceted challenges, including structural strength, durability, and safety, with their long-term performance directly influencing service life and sustainability. Therefore, an in-depth investigation into the structural performance of PV pavements, optimization of design parameters, and enhancement of load-bearing capacity and durability are of paramount importance for propelling the sustainable development of PV pavement technology.
PV pavement technology enables energy generation through the incorporation of solar PV modules into the road structure, thereby endowing transportation infrastructure with energy production capabilities [
4]. This dual function presents significant environmental and economic benefits. However, as essential components of the transportation network, roads are constantly subjected to vehicular loads, temperature fluctuations, humidity, and other environmental factors. Given that PV pavements are directly exposed to dynamic environmental conditions, their structural strength, durability, and safety are critical factors influencing their feasibility and large-scale deployment [
5]. At present, research on the mechanical performance of PV pavements remains relatively limited and lacks systematic theoretical and practical support. There is an urgent need for in-depth structural response analyses to provide a reliable foundation for engineering applications [
6]. Nussbaum researched evaluation methods for the third-generation plate model of Scott and Julie’s prefabricated PV pavement, adjusting testing standards for plate fatigue and mechanical tests, which provides an important reference for assessing the mechanical properties of PV pavements [
7]. Dezfooli used model tests to evaluate the power generation, anti-slip, mechanical, fatigue, and drainage performances of the plates, thereby laying the foundation for a comprehensive performance assessment of PV pavements [
8]. Zhang employed TracePro and ANSYS 2025 R1 finite element software for optical and structural mechanical analysis of a light-guiding concrete PV pavement model [
9]. Li conducted indoor mechanical and power generation tests on a transparent resin concrete PV pavement model [
10]. Hu used PVsyst and ANSYS software for power generation prediction and structural mechanical analysis of a micro-PV array hollow plate model, validating the results via indoor tests [
11]. He established a 3D finite element model to analyze the stress in solid-encapsulated PV Pavement Slab under different loading conditions and bonding dimensions, revealing key factors in the interlayer delamination failure mechanism [
12]. Zhang Chengjian et al. [
9,
10,
11,
12] employed finite element software to conduct optical and mechanical analyses of PV pavement structures, providing theoretical support for the structural design of PV pavements. These studies have explored the performance of PV pavements from various perspectives. However, the existing research is predominantly focused on the power generation performance, anti-slip performance, and partial mechanical performance testing of PV pavements. Systematic and comprehensive research on the structural performance of PV pavements under dynamic loading remains insufficient.
In addition to the aforementioned studies, recent international research has expanded the focus of photovoltaic pavements from purely structural and localized performance aspects to broader dimensions, including material and thickness effects, thermo–mechanical coupling behavior, the influence of surface texture on power generation and skid resistance, as well as urban sustainability. Li Sinan et al. pointed out that the transparent layer is commonly made of tempered glass, resin, or resin–glass aggregate composites, where different designs involve trade-offs among skid resistance, light transmittance, and durability [
13]. Although glass exhibits excellent transmittance and durability, its skid resistance requires improvement through surface texturing. Rahman et al. compared the performance of tempered glass, float glass, and polycarbonate as transparent cover layers [
14]. Their results showed that polycarbonate outperforms in terms of impact resistance and light transmittance but suffers from a limited lifespan. The thickness of the cover layer directly affects both optical transmittance and stress distribution, necessitating a balance between structural safety and optical performance. Zhou Bochao et al. noted that an increase in photovoltaic cell temperature significantly reduces photoelectric conversion efficiency, with every 1 °C rise causing output power and efficiency to decrease by approximately 0.65% and 0.08%, respectively [
15]. Xiang Bo validated the effectiveness of photovoltaic–thermal pavements (PVTR) through numerical modeling and experimental comparison [
16]. The results indicated that the integrated energy efficiency of such systems can reach 3.95 times that of conventional PV pavements while effectively lowering cell temperature, thereby extending service life. Jiang Wei et al. examined the decisive role of road structure features (e.g., medians, guardrails, and slopes) in determining effective PV utilization area and illumination conditions [
17]. Their findings showed that surface conditions and layout schemes directly affect PV conversion efficiency, with reflection, shading, or coarse textures significantly reducing effective radiation capture. Kim et al., in a site selection analysis of PV on Korean national highways, highlighted that ground slope, shading, and surface flatness at candidate sites critically influence power generation [
6]. Steeper slopes and complex surface conditions often require greater spacing between modules or additional anti-glare and anti-fouling measures; otherwise, generation efficiency is reduced. Hou Jiang assessed the potential of highway PV deployment on a global scale, estimating that full implementation could generate approximately 17,578 TWh annually offsetting about 28.8% of global carbon emissions [
18]. Moreover, the study emphasized synergistic benefits, including reducing traffic accident fatalities (about 150,000 per year), lowering socio-economic losses (approximately USD 0.43 trillion annually), and achieving net benefits exceeding USD 14 trillion over a 25-year lifespan. This indicates that highway PV systems, at both urban and regional levels, are not only an energy substitution strategy but also an integrated measure for improving public health and socio-economic sustainability. Coutu et al. conducted a series of engineering tests on the Solar Roadways prototype, showing that this type of PV pavement system maintained good functionality under heavy vehicles, freeze–thaw cycles, and humid conditions, thereby confirming its durability and reliability for urban road applications [
19]. They also estimated the unit power generation of a two-lane section, which could supply electricity to dozens of surrounding households, highlighting its potential in supporting urban energy self-sufficiency. Li et al. [
13] reported that the design of the surface layer of photovoltaic pavements—particularly the insufficient thickness of the transparent layer—renders them susceptible to fatigue damage under high-frequency vehicular loading. Such damage subsequently leads to cracking and deformation of the pavement, thereby significantly reducing its service life to well below the 20-year design lifespan typical of conventional pavements. Consequently, one of the key technical challenges faced by photovoltaic pavements lies in enhancing their load-bearing capacity and durability while maintaining high photoelectric conversion efficiency.
Commencing from the perspective of sustainable development, this study undertakes a comprehensive analysis of the photovoltaic pavement structure, thereby furnishing scientific underpinnings and optimization strategies for the structural design of photovoltaic pavements. These strategies are aimed at augmenting their load-bearing capacity and long-term service safety. Chen et al. [
20] reported that under static loading conditions, when the panel thickness was at its maximum level (approximately 45 mm), the average maximum tensile stress was 0.527 MPa. In our transient dynamic loading simulation with the same panel thickness of 45 mm, the maximum normal stress was found to be 0.351 MPa, which represents a reduction of approximately 33.5% compared with the static loading average value reported by Chen et al. In our transient dynamic loading simulation under the same geometric conditions, the maximum vertical deflection was 0.21 mm, a further reduction of approximately 1.9% compared with the static loading simulation results. By refining the design of photovoltaic pavements, material waste can be significantly reduced, construction costs can be effectively lowered, and the service life of the road as well as the efficiency of energy production can be notably improved. Ultimately, this approach offers robust support for the realization of low-carbon, circular, and sustainable transportation infrastructure development [
21].
2. Structural Modeling of Load-Bearing PV Highway
PV pavements can be categorized into prefabricated, solid-encapsulated, and load-bearing types based on structural form. Among these, load-bearing PV pavements are designed without additional supports. They integrate PV modules directly into the road surface. This design reduces space usage while offering good load-bearing capacity and stability, making them suitable for withstanding vehicle loads, particularly on highways.
2.1. Layered Structure of PV Module
As shown in
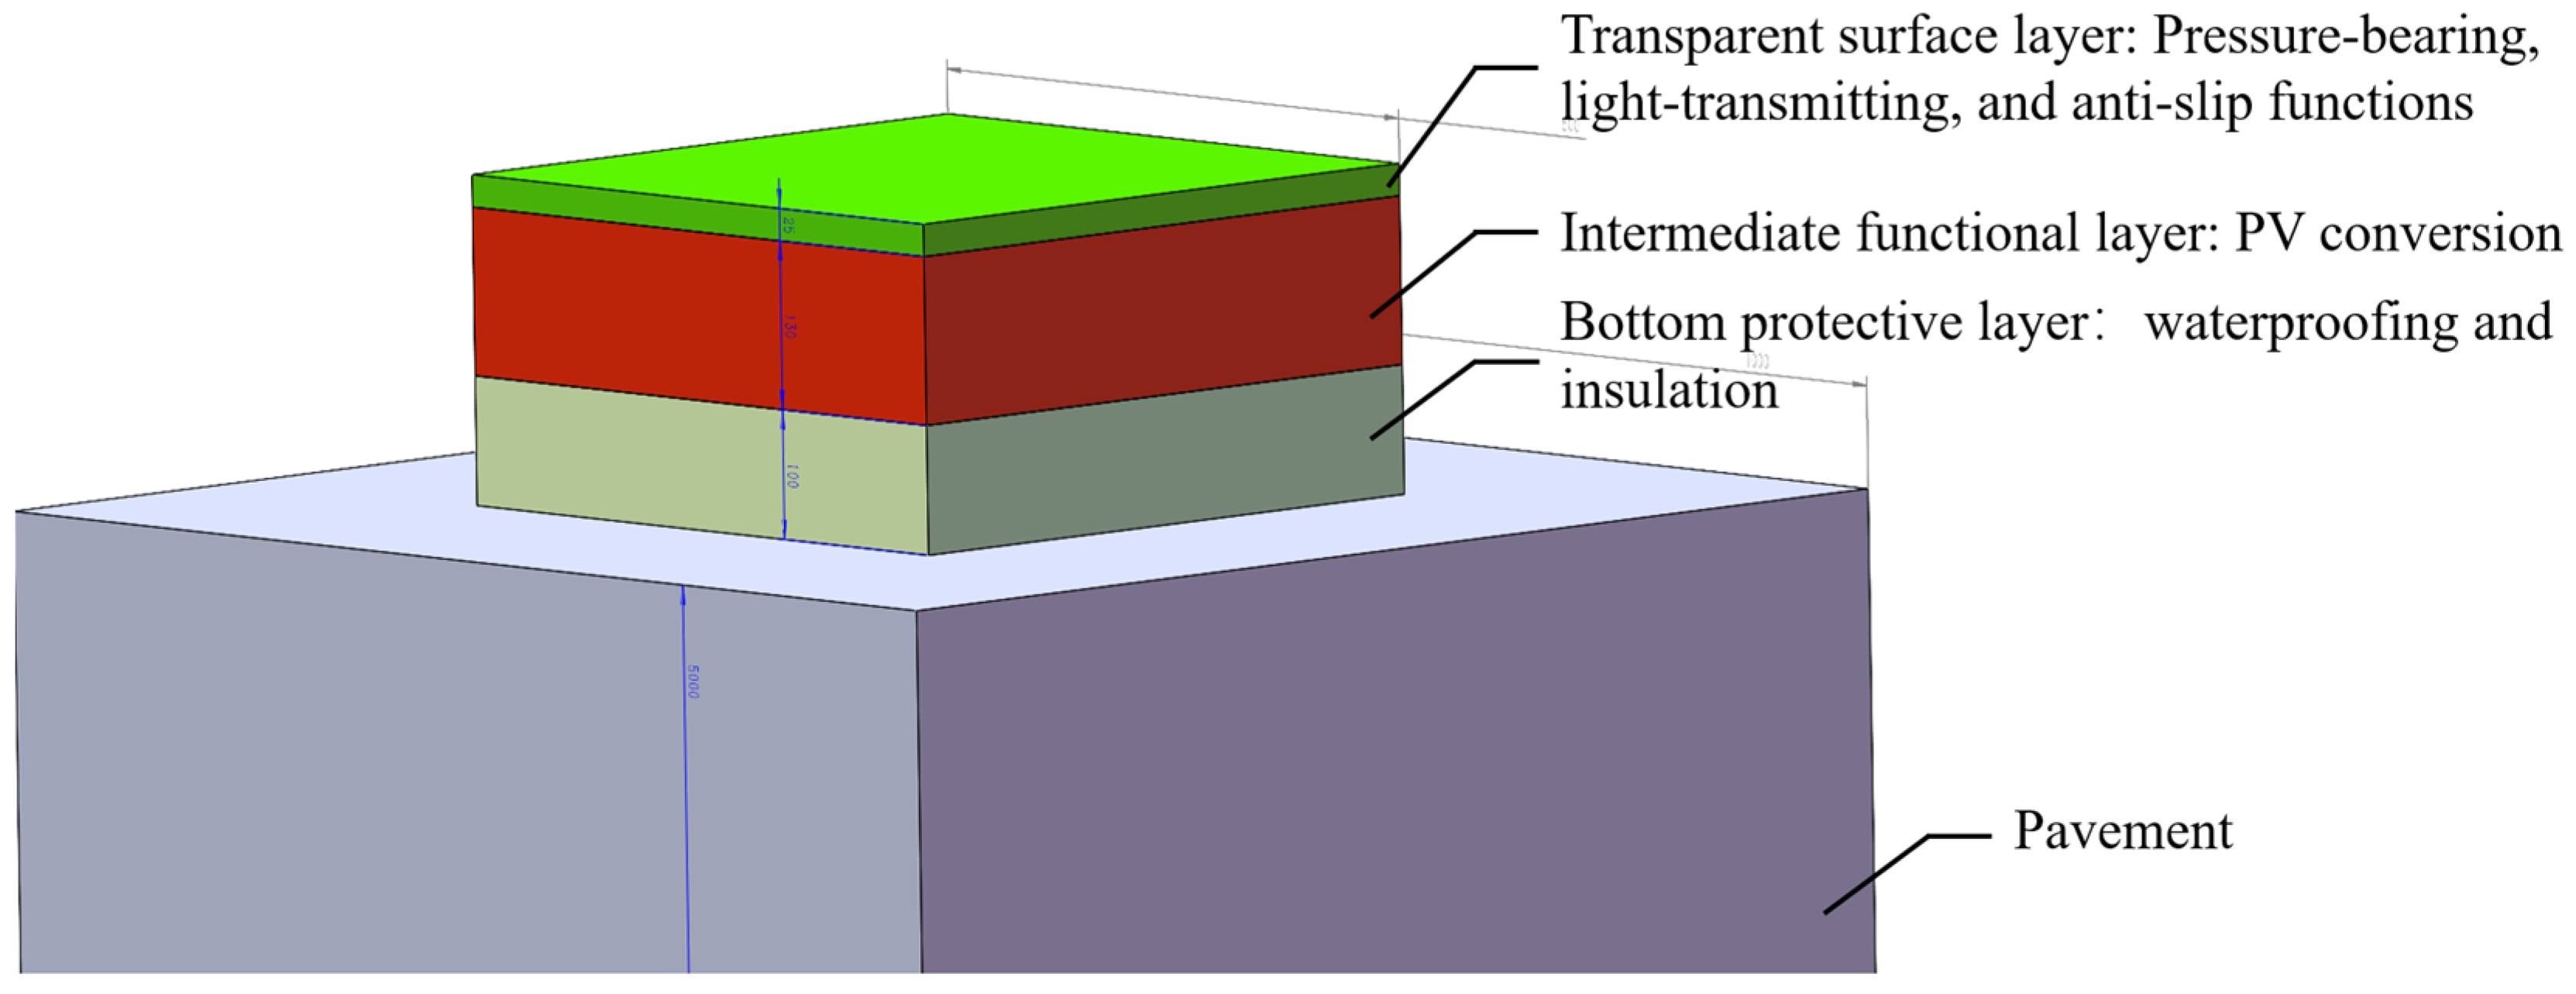
Figure 1, the PV module consists of three main layers: the surface transparent layer, the intermediate functional layer, and the bottom protective layer. The surface transparent layer, which is in direct contact with vehicular traffic, is made of high-strength tempered glass or composite materials, providing load-bearing capacity, skid resistance, and light transmittance [
22]. The intermediate functional layer contains PV cells, which convert solar energy into electrical energy, and is encapsulated to ensure long-term stable performance. The bottom protective layer is composed of concrete or polymer composite materials, serving as structural support while providing waterproofing and insulation, thus ensuring the overall stability and durability of the module [
23]. This layered design allows the PV module to possess both robust load-bearing capacity and effective power generation performance.
2.2. Geometric Dimensions of the PV Module
To investigate the influence of different structural parameters on the mechanical performance and overall stability of the PV module, a geometric model of the module was established. The model’s dimensions are based on the constants in
Table 1. By varying the surface transparent layer thickness (
S) and the base sidewall thickness (
B), the corresponding results are verified. The geometric parameters of the model include the longitudinal length, transverse length, and thickness of each structural component.
Given the load application at the center of the slab and the standard axle load equivalent rectangular length of approximately 50 cm, the slab shape is typified by an absolutely symmetrical square configuration [
13]. The side length dimension being identical to the standard axle load equivalent rectangular length allows for the lateral load distribution position to be disregarded, enabling full distribution of the load across the transverse position of the pavement slab. This permits a focus solely on the longitudinal load distribution scenario [
24].
In the model, the overall slab, the base plate, and the surface transparent layer are all defined with a longitudinal and transverse length of 500 mm. The thickness of the base plate is set to 100 mm, and the height of the base sidewalls is fixed at 130 mm.
To investigate the influence of varying thicknesses on structural response, this study conducts simulation analyses on nine distinct values of S, ranging from 5 mm to 45 mm, specifically: 5 mm, 10 mm, 15 mm, 20 mm, 25 mm, 30 mm, 35 mm, 40 mm, and 45 mm. The parameter B spans from 50 mm to 140 mm, with selected values as follows: 50 mm, 60 mm, 70 mm, 80 mm, 90 mm, 100 mm, 110 mm, 120 mm, 130 mm, and 140 mm.
By performing simulation analyses across these various thickness combinations, the stress–strain distribution and overall structural performance of the PV module under different loading conditions can be obtained. These results serve to optimize structural design, ensuring the long-term service life and stability of PV pavements. The structural model of the PV pavement is illustrated in
Figure 2. To facilitate differentiation between the parameters of the sidewalls and the base, which are distinct from each other, distinct colors have been assigned for clear distinction.
3. Finite Element Simulation Analysis
To validate the finite element model’s capability in capturing pavement structural responses, the study by Yang et al. [
25] can be referenced. In their work, the authors compared measured and simulated strain responses under vehicular and Falling Weight Deflectometer (FWD) loading conditions, thereby confirming the effectiveness of the finite element method in analyzing the mechanical behavior of asphalt pavement structures under varying load scenarios.
Building upon the established PV highway model and parameter settings, the finite element analysis (FEA) method is introduced to investigate the mechanical performance of PV pavements under various working conditions, enabling a precise evaluation of structural responses. This approach discretizes complex structures and solves the governing equations to achieve refined simulations, thereby elucidating the influence patterns of key parameters—such as the thickness of the surface transparent layer and the base sidewall—on the structural performance of the PV pavement. As such, FEA serves as an essential and efficient tool for analyzing mechanical behavior.
3.1. Preparation for Simulation Analysis
3.1.1. Model Assumptions
The contact between PV modules is assumed to be perfectly bonded, meaning there is no gap or relative sliding between components in the finite element model;
The structure beneath the PV module is modeled as an equivalent elastic foundation, which is assumed to realistically represent the elastic properties of an actual subgrade and influences the stress–strain behavior of the entire system [
26];
All materials in the model are considered to be continuous, homogeneous, and isotropic [
27]. That is, material properties are assumed to be uniform throughout the structure and identical in all directions;
When applying constraints in ANSYS Workbench, the foundation surface is fully fixed, and normal deformation constraints are applied to the four lateral boundaries to restrict the movement of the model [
28];
The effect of load transfer between adjacent modules is neglected. Each module is considered to respond independently to loading, with no interaction or load sharing between slabs;
The self-weight of the structure is not included in the finite element model, in order to simplify the computational process and focus the analysis on structural response under external loads [
29].
In this study, the boundary conditions and inter-slab interactions are uniformly assumed as follows: the bottom surface of the foundation is fully constrained to approximate the overall support provided by a deep subgrade; the four vertical sides are subjected to normal displacement constraints to restrict horizontal movement while allowing free vertical deformation; and the top surface is left unconstrained except for the wheel-load application area. Within each module, bonded contact is applied between layers to ensure no interlayer slip. The interaction between adjacent slabs is modeled using a “displacement continuity without explicit transfer of bending moment and shear force” approach. No rigid shear keys or moment transfer elements are introduced across joints, and thus load sharing between slabs is not considered.
The effect of adjacent slabs is therefore treated as “displacement continuity without explicit transfer of bending moment and shear force,” and inter-module load sharing is neglected. This simplification allows the obtained results to better reflect the constitutive response of a single module under vehicular loads. In practical engineering, edge modules may exhibit slightly larger vertical deformations due to the absence of constraints from neighboring slabs, whereas interior modules, subjected to multidirectional restraints, possess higher stiffness and experience more uniform stress distribution.
3.1.2. Model Parameters
In selecting the elastic modulus of materials, this study accounted for the differences between laboratory and in situ loading conditions. Cheng et al. [
30] highlighted that the viscoelastic properties of asphalt materials can lead to variations in modulus values obtained under different loading frequencies and modes. Such effects should be appropriately reflected in finite element modeling to ensure accurate representation of material behavior.
Table 2 provides a detailed summary of the physical and mechanical parameters of the materials comprising each layer of the PV pavement structure, including density, elastic modulus (E), and Poisson’s ratio [
20]. These parameters are employed to define the material characteristics of each layer, thereby influencing the mechanical response analysis of the overall model.
3.1.3. Mesh Generation
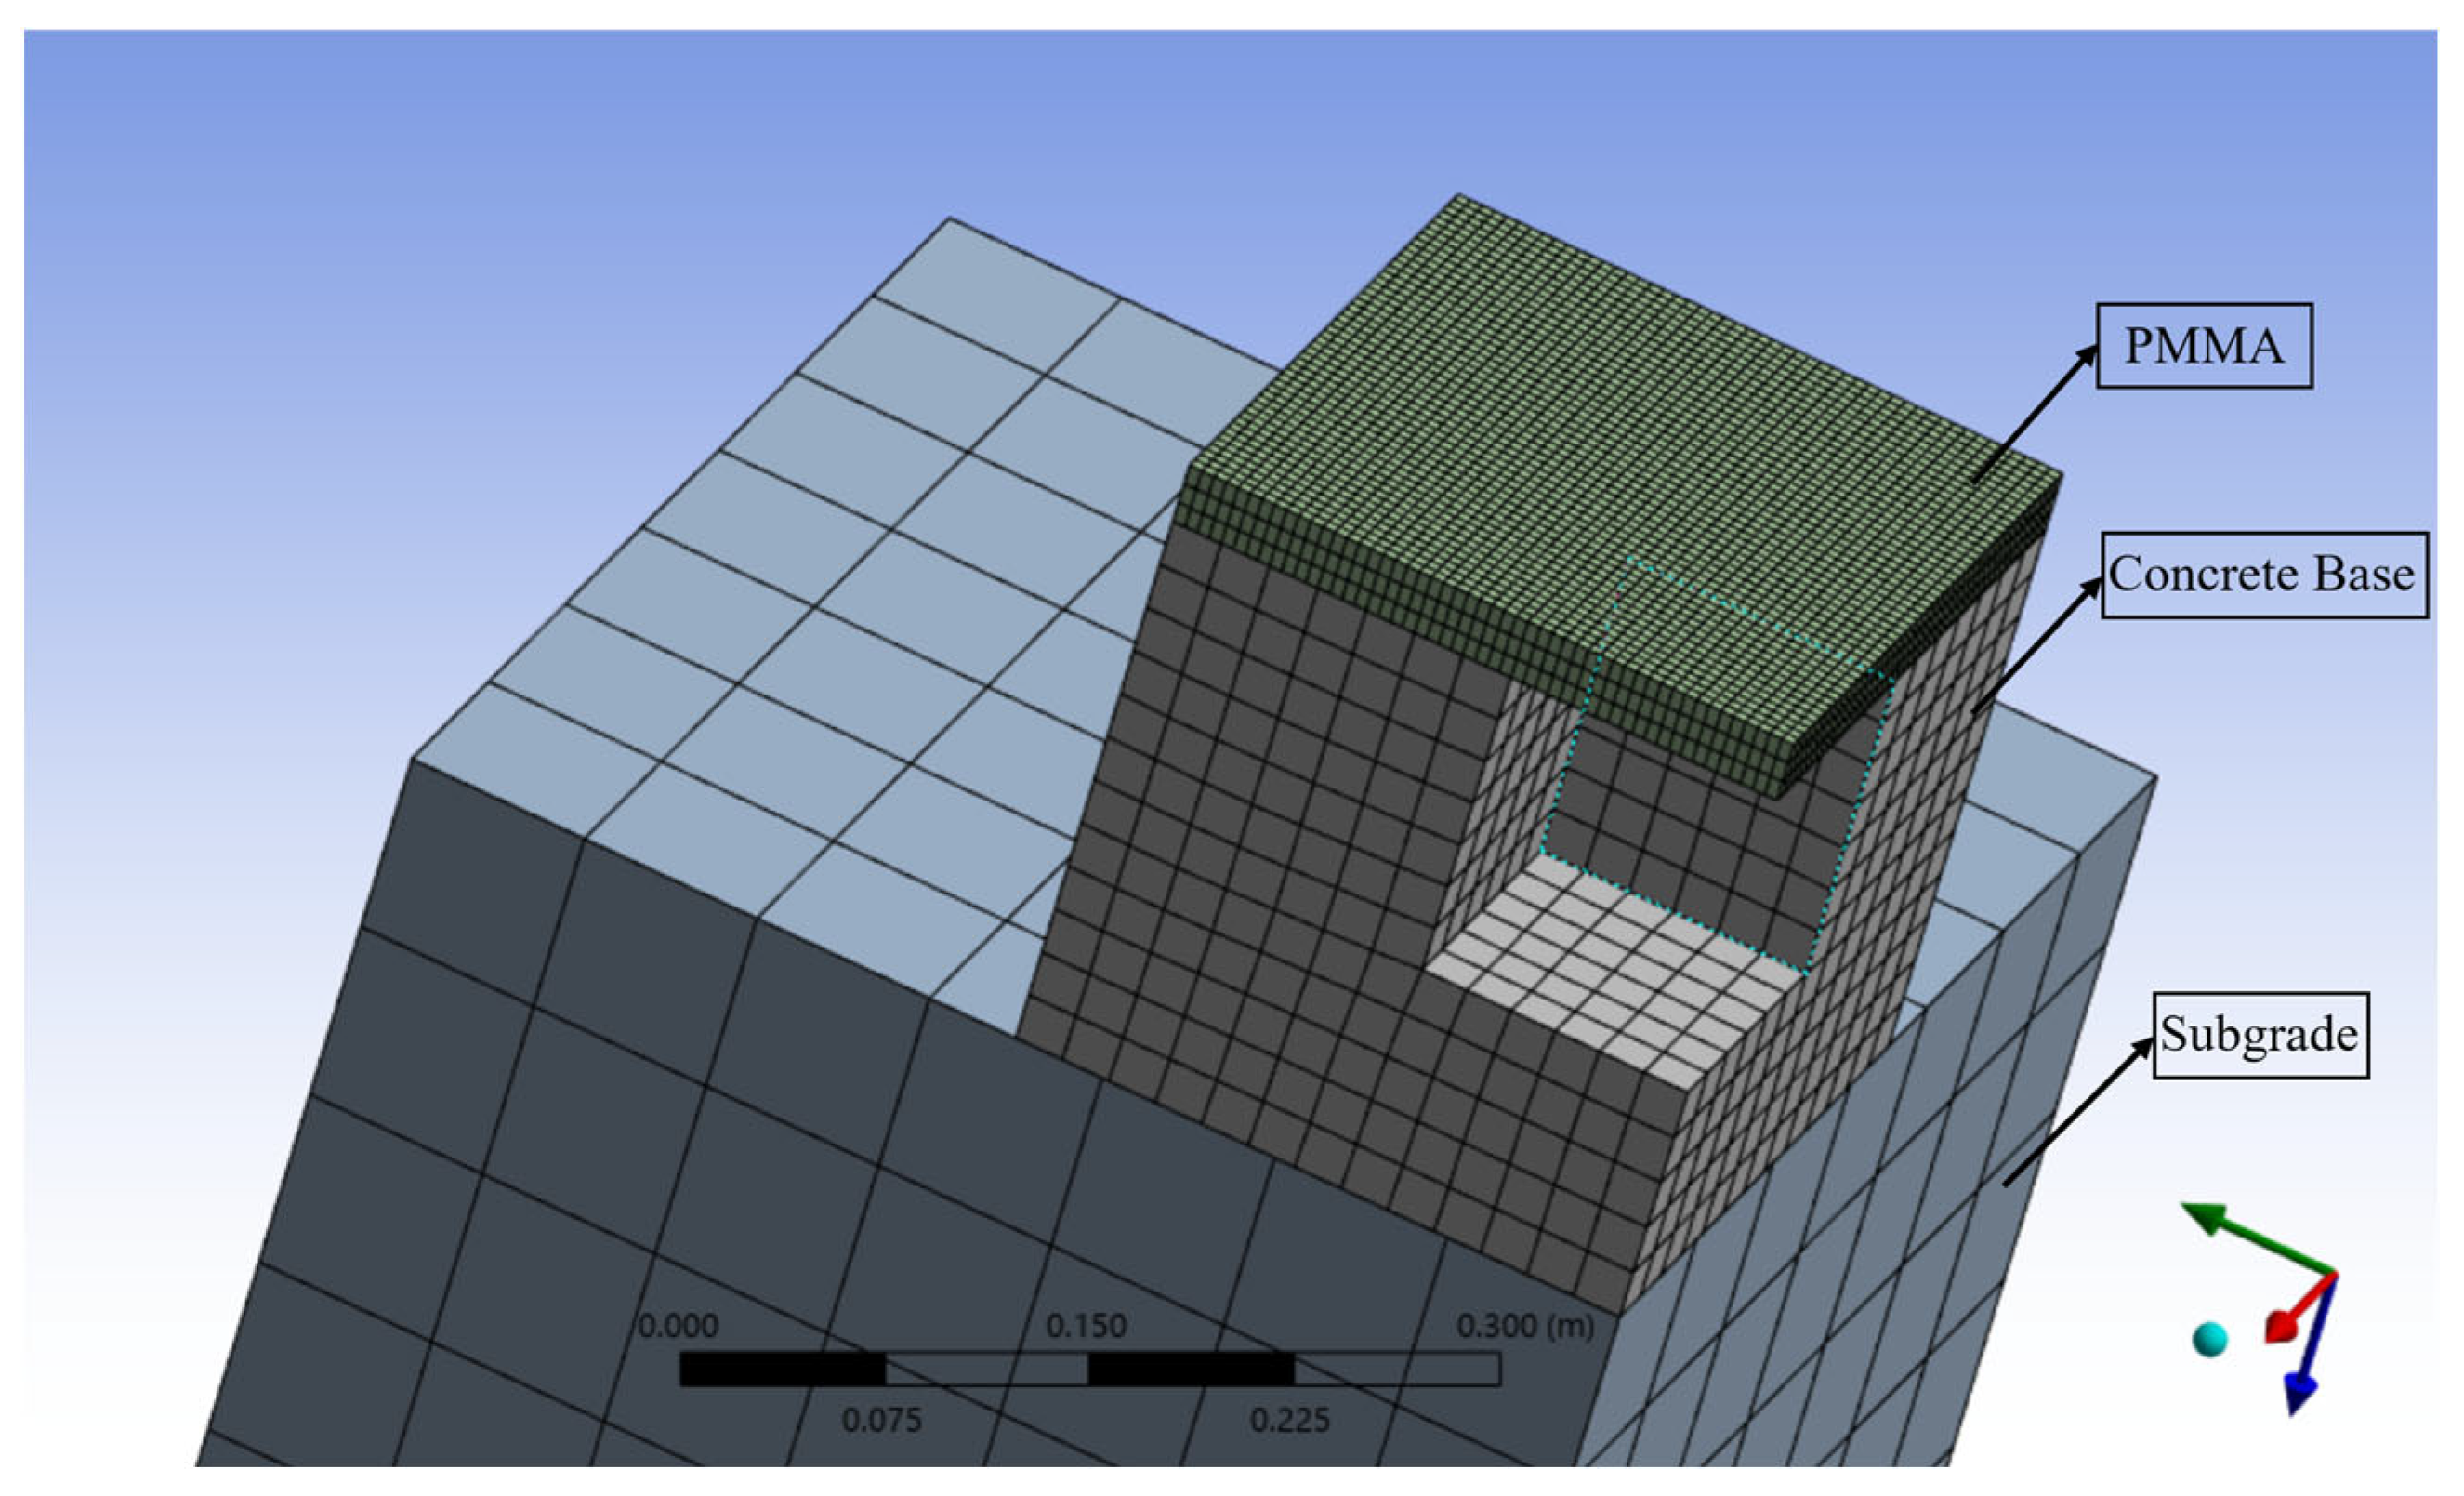
To balance computational accuracy and efficiency in the finite element analysis, appropriate meshing strategies were applied to different components of the model. The model consists of the subgrade, concrete base, PV module surface layer (made of PMMA), and PMMA sidewalls. Each component was meshed using different element sizes based on its structural role and stress characteristics. The meshing scheme is detailed in
Table 3 and is visually illustrated in
Figure 3. In this study, the supporting structure’s mesh employs the ANSYS secondary solid element SOLID186 (corresponding to Hex20/Wed15/Pyr13). The SOLID65 element, utilized for simulating the cracking behavior of the base, is excluded from the subsequent mesh quality statistics due to its unique integration scheme.
The subgrade, serving as the bottom foundation, experiences relatively minor deformation. The initial mesh size was set to 0.015 m. After coarsening to 0.075 m, the discrepancy in results compared to the finer mesh remained below 5%, while computation time was significantly reduced. Therefore, the final mesh size for the subgrade was set to 0.075 m. In contrast, the PV module surface layer (PMMA), subjected to dynamic vehicle loads, is a critical region with significant stress and strain variations. To ensure high accuracy, a fine mesh size of 0.005 m was applied to this component to accurately capture localized responses. The PMMA sidewalls, which serve a supporting and connecting role, were meshed with a size of 0.01 m. The difference between this mesh and the finer reference mesh remained within 5%, achieving a good balance between accuracy and computational efficiency. The concrete base, as the primary load-bearing component, initially used a mesh size of 0.01 m. It was then adjusted to 0.02 m, with an error margin of less than 5%, effectively improving computational performance. Thus, the final mesh size for the base was set to 0.02 m.
Using this model as a representative case, the number of elements and nodes resulting from the meshing process is summarized in
Table 4. All other model variants underwent similar mesh refinement procedures, with slight variations in mesh and node counts due to differences in structural dimensions.
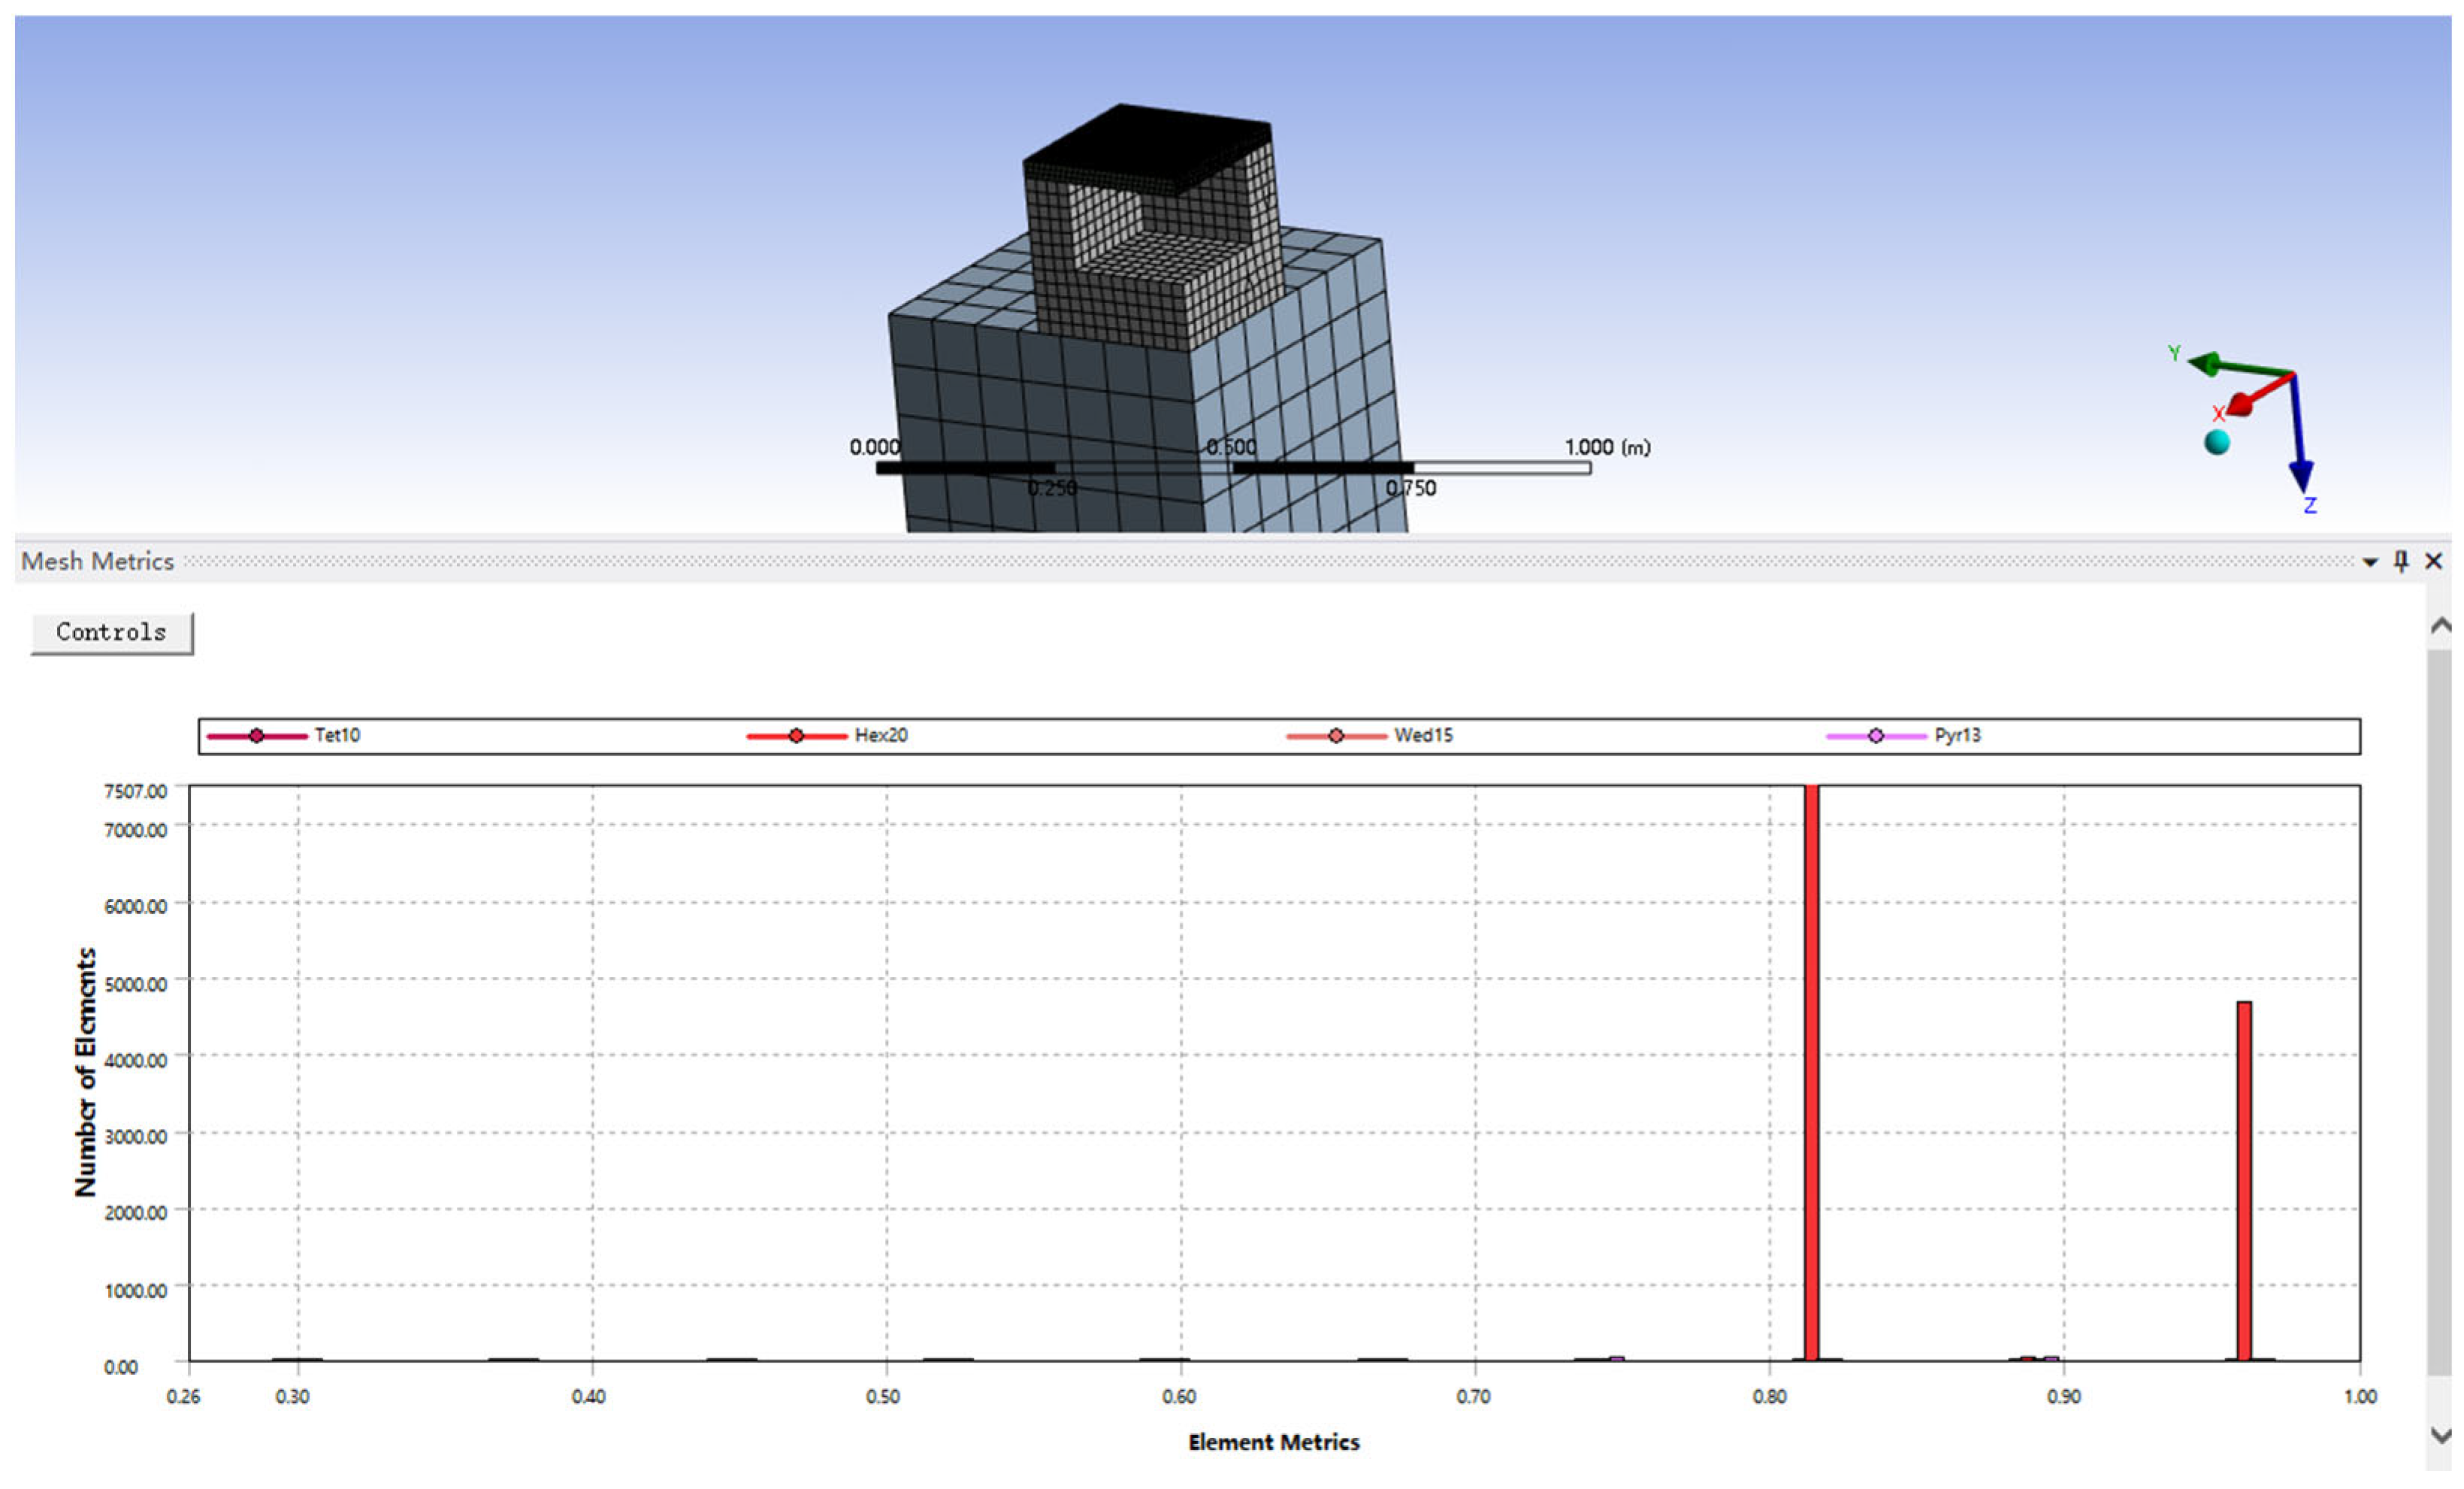
Mesh quality is added as a criterion for mesh evaluation, as shown in
Figure 4.
The mesh quality distribution chart solely encompasses the higher-order solid elements (Hex20, Wed15, Pyr13, corresponding to SOLID186) of the load-bearing structure. The SOLID65 element, lacking midside nodes, is not included in this quality assessment. The quality distribution of Hex20 tetrahedral quadratic elements primarily ranges from 0.85 to 1.00, with an average value of approximately 0.93. The Wed15 (wedge-shaped) and Pyr13 (pyramid-shaped) elements are relatively few in number, but their quality is no lower than 0.70. All element qualities exceed the minimum threshold recommended by ANSYS (>0.50), with no significant low-quality or abrupt change elements observed. The mesh transitions are smooth across all regions, with reasonable element sizes and proportions.
3.1.4. Element Type Selection
In this simulation study, suitable element types were selected for each material to accurately model the mechanical behavior of the PV highway subgrade and PV modules under dynamic loading conditions.
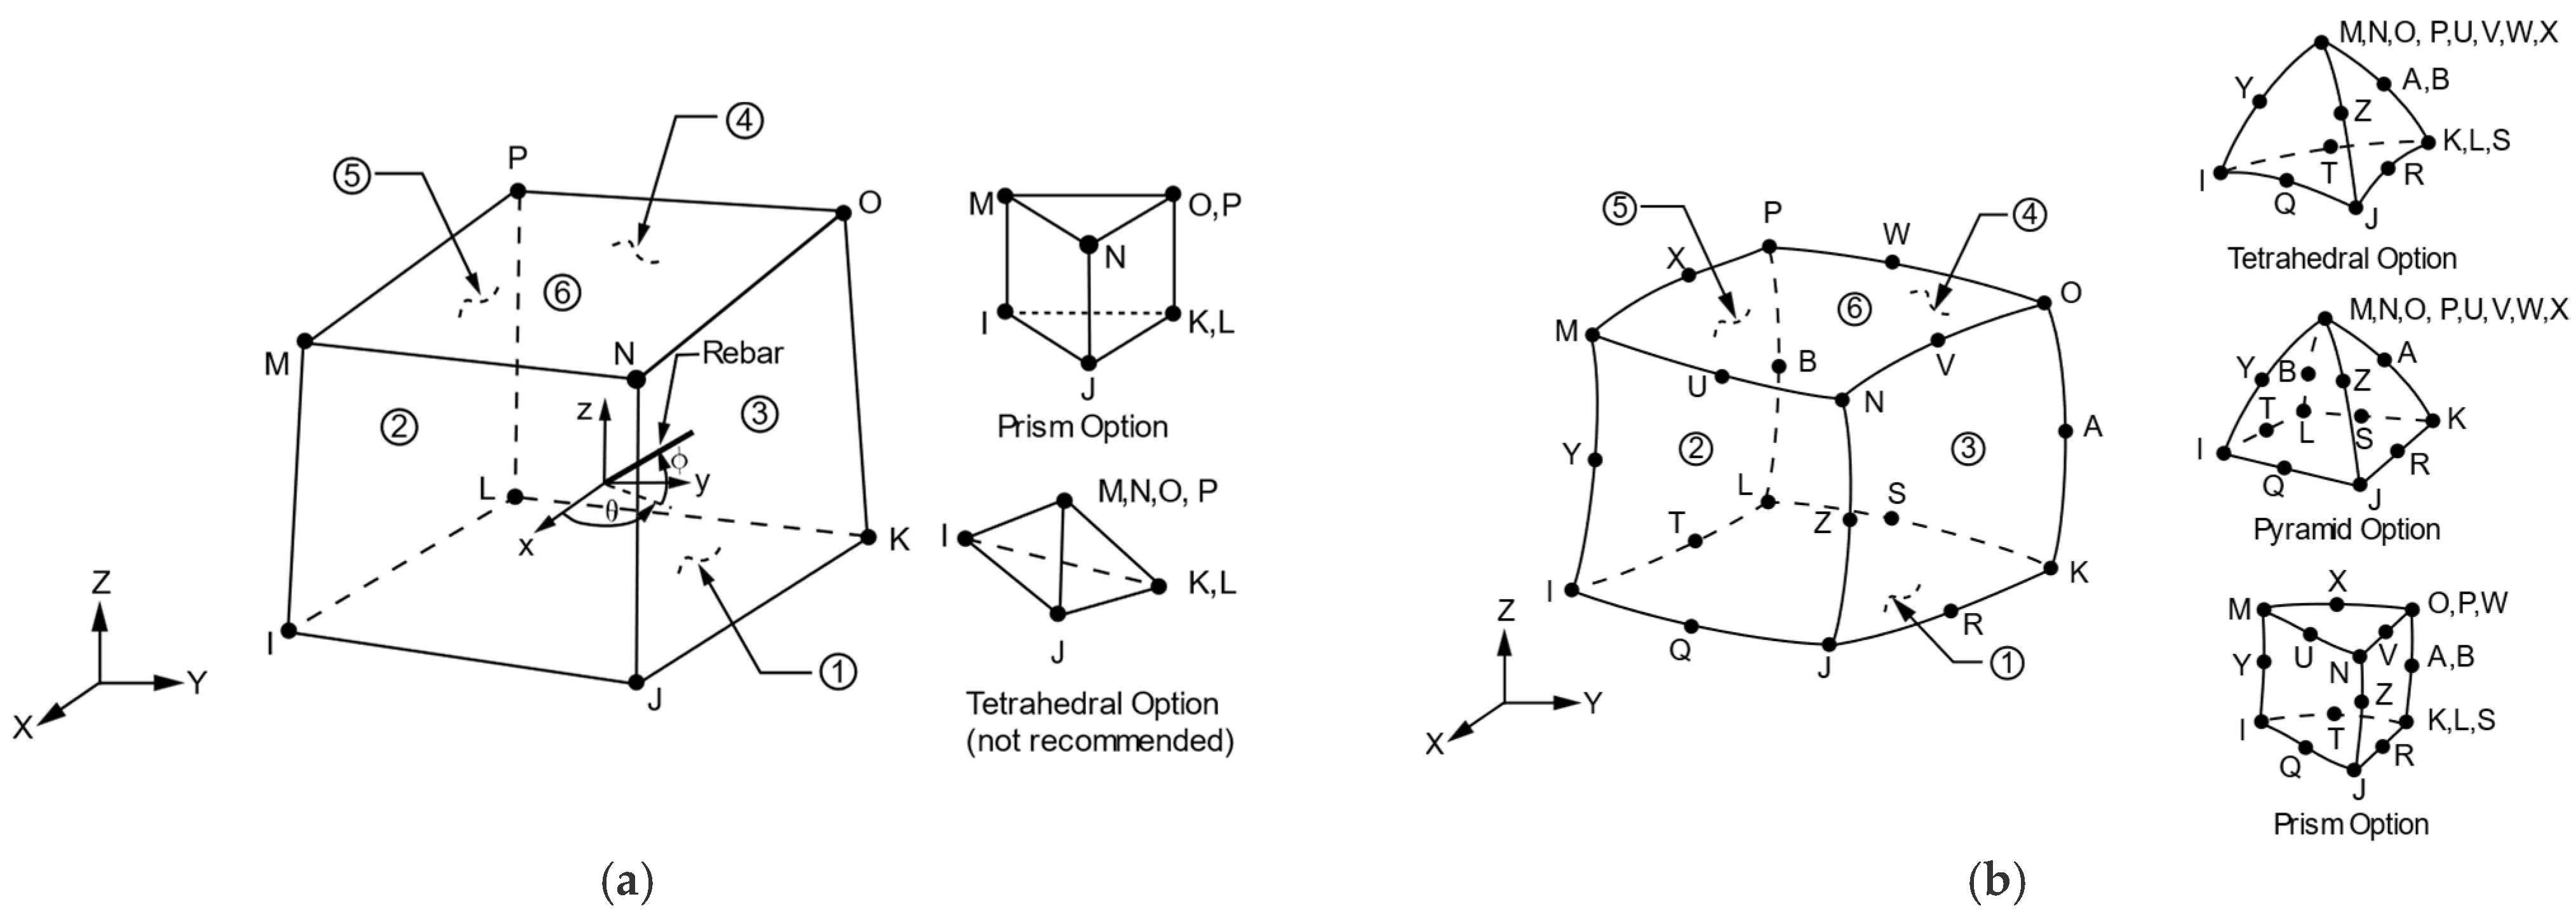
For the subgrade, the SOLID65 element was employed, as shown in
Figure 5a. This element is specifically designed for concrete structures and is capable of simulating nonlinear behavior, including cracking in three orthogonal directions, crushing, plastic deformation, and creep. It can also incorporate embedded reinforcement modeling through internal rebar elements. SOLID65 is an 8-node element with three degrees of freedom per node, enabling precise capture of stress responses in the subgrade.
For the PV modules, the SOLID186 element was selected, as shown in
Figure 5b. This high-order 20-node element is suitable for linear elastic materials without reinforcement. It supports large deformation and strain simulations, providing highly accurate stress–strain results, and is well-suited for modeling the complex structure of PV modules.
By combining SOLID65 and SOLID186 elements, the finite element model accurately simulates the mechanical responses of both the subgrade and PV modules under dynamic loading. This modeling approach ensures reliable results and provides a solid theoretical foundation for the structural design and optimization of PV highways.
3.2. Transient Analysis
Following the completion of mesh generation, transient analysis of the PV pavement structure is performed by incorporating APDL command streams and used the standard axle load BZZ-100 to carry out the load application. Specifically, the analysis type is first defined as transient, and analysis options—such as nonlinear geometric effects—are configured to accurately capture the structural behavior under dynamic loading. Subsequently, boundary conditions and loads are applied via APDL commands: fixed constraints are imposed on the pavement subgrade, while concentrated or distributed forces simulating dynamic wheel loads are applied to the surface of the PV module. The time history of the loading is also defined by specifying time steps and the total analysis duration to regulate the application of loads. Based on this setup, solver parameters—such as convergence criteria and output controls—are configured to ensure solution stability and result accuracy. Finally, the solution commands are executed, enabling ANSYS to perform transient analysis based on the defined model, material properties, boundary conditions, and loading scenarios, thereby yielding the mechanical response of the PV pavement structure under dynamic conditions. The APDL command stream is presented in Listing 1:
| Listing 1. APDL command stream. |
FINISH
/SOLU
v = 1667
f0 = 3000
a = 180
b = 200
msize = 5
num_steps = (750-b)/msize
/SOLU
ANTYPE,TRANS
TIMINT,ON
* DO,i,1,num_steps,1
OUTRES,ALL,ALL
TIME, i * msize
NSUBST,10
SFEDELE,ALL,ALL,PRES
NSEL,S,LOC,Z,0
NSEL,R,LOC,Y,-msize*i,-msize*i-b
NSEL,R,LOC,X,160,160+a
CM,load_nodes1,NODE
SF,load_nodes1,PRES,-f0
ALLSEL,ALL
SOLVE
CMDELE,load_nodes1,NODE
*ENDDO
FINISH |
All constraints are added through the APDL command stream. The vehicle speed is set at 60 km/h, with a dynamic amplification factor of 1.2. If the vehicle speed increases to 80 km/h or 100 km/h, the dynamic amplification factor can be increased to approximately 1.3 and 1.4, respectively. This results in a corresponding increase of about 5% to 10% in the maximum deformation and peak stress of the structure.
3.3. Simulation Results with Different Parameters
Simulation results obtained from ANSYS indicate that S has a significant impact on the structural response. Thinner transparent layers (e.g., 5 mm) result in greater deformation and stress concentration, which may lead to fatigue damage and reduced structural durability. As S increases, the overall stiffness of the structure is enhanced, and both total deformation and local stress/strain are significantly reduced. Furthermore, stress becomes more uniformly distributed, decreasing the risk of localized damage and extending the service life of the structure. These findings suggest that appropriately increasing S in engineering design can effectively improve the mechanical performance and structural stability of PV pavements, offering valuable guidance for practical applications.
3.3.1. Deformation Results Analysis
Simulations were conducted using various combinations of surface transparent layer thickness (
S) and base sidewall thickness (
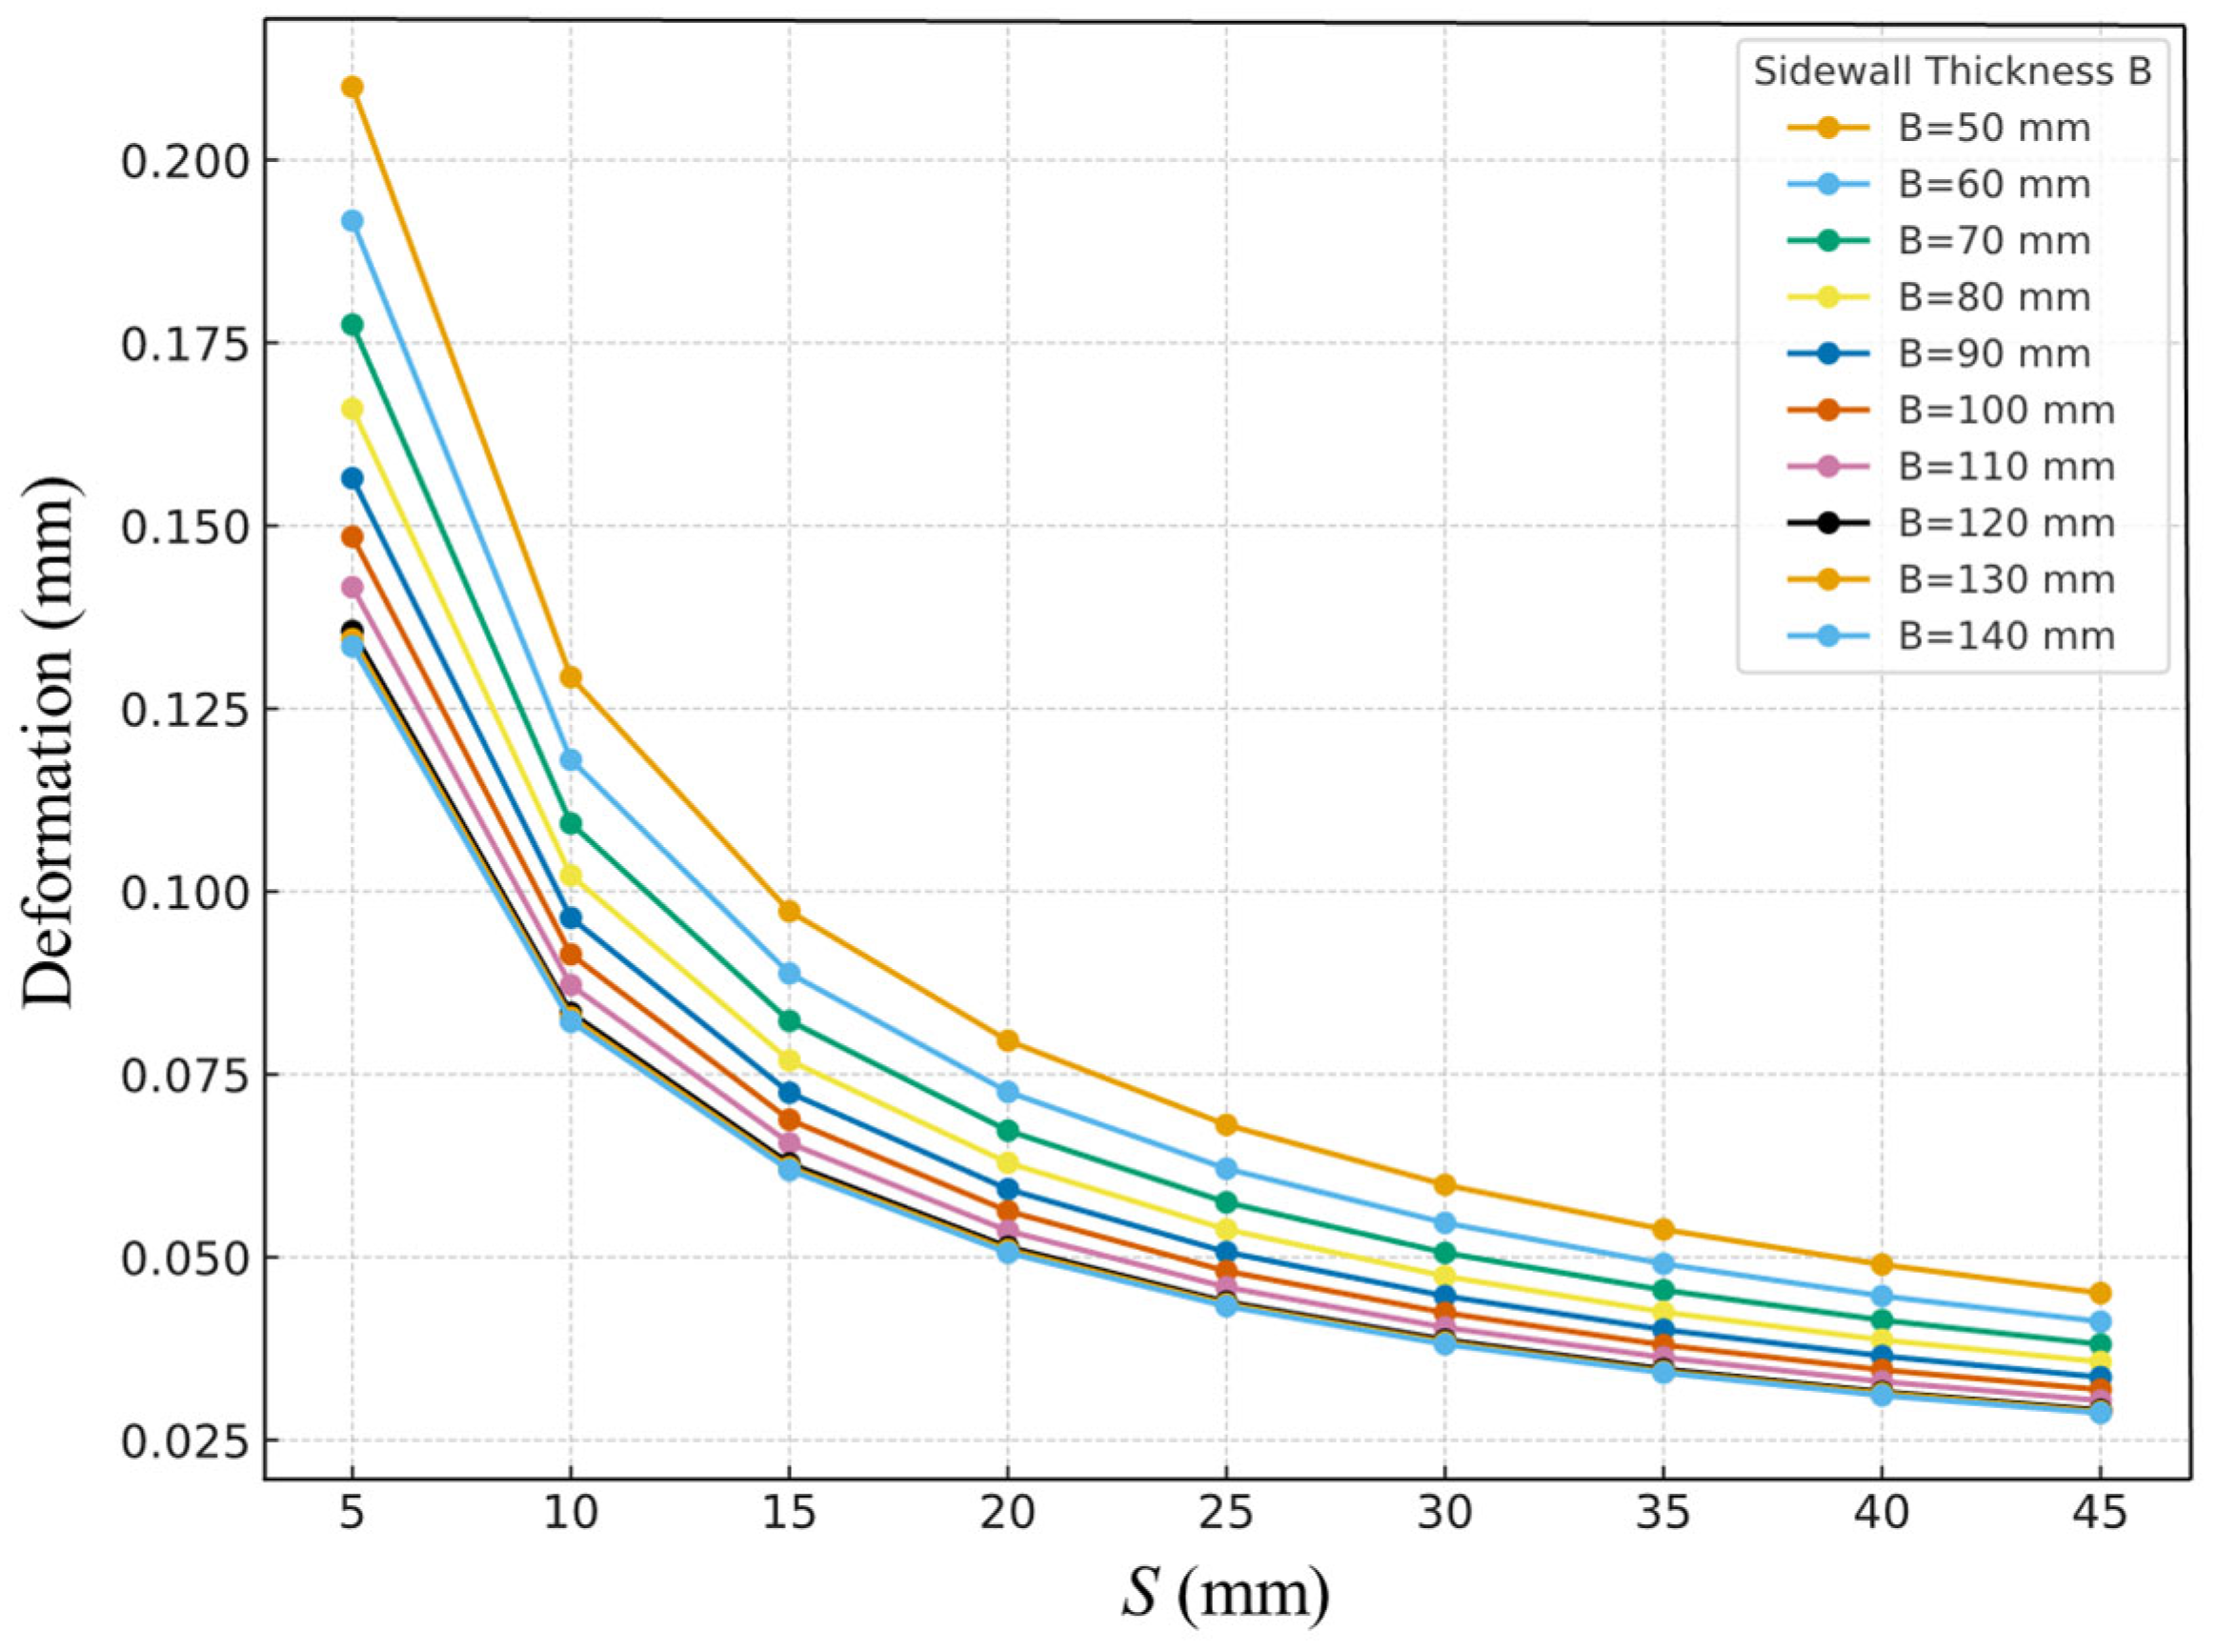
B), with the corresponding total deformation values obtained through computational analysis. The deformation results are presented in
Table 5 and illustrated in
Figure 6.
The simulation results indicate that, under otherwise identical conditions, larger values of S and B lead to smaller total deformation of the panel. However, when the thickness increases beyond a certain range, the marginal benefits gradually diminish. For example, when B = 50 mm, the peak total deformation decreases from 0.210 mm at S = 5 mm to 0.045 mm at S = 45 mm. This trend is consistent with the principles of structural mechanics, whereby, with material parameters held constant, the flexural rigidity of a plate is proportional to the cube of its thickness. Hence, increasing thickness substantially enhances structural stiffness, effectively reducing deflection and stress levels. As S increases, both the moment of inertia and shear stiffness rise significantly, resulting in smaller deflections. When S lies within the range of 20–30 mm, the rate of deformation reduction shows clear diminishing marginal effects. Thickening the sidewalls also improves overall stiffness, thereby reducing peak deflection. However, when B exceeds approximately 120 mm, further thickening contributes little additional benefit to deformation reduction, exhibiting a “plateau effect.” In this study, the BZZ-100 standard axle load was adopted, and peak values were recorded at the “wheel rolling—central position” moment. The representative range of total deformation under varying S and B is approximately 0.03–0.21 mm.
3.3.2. Stress Analysis Results
The stress results from simulations with different combinations of
S and
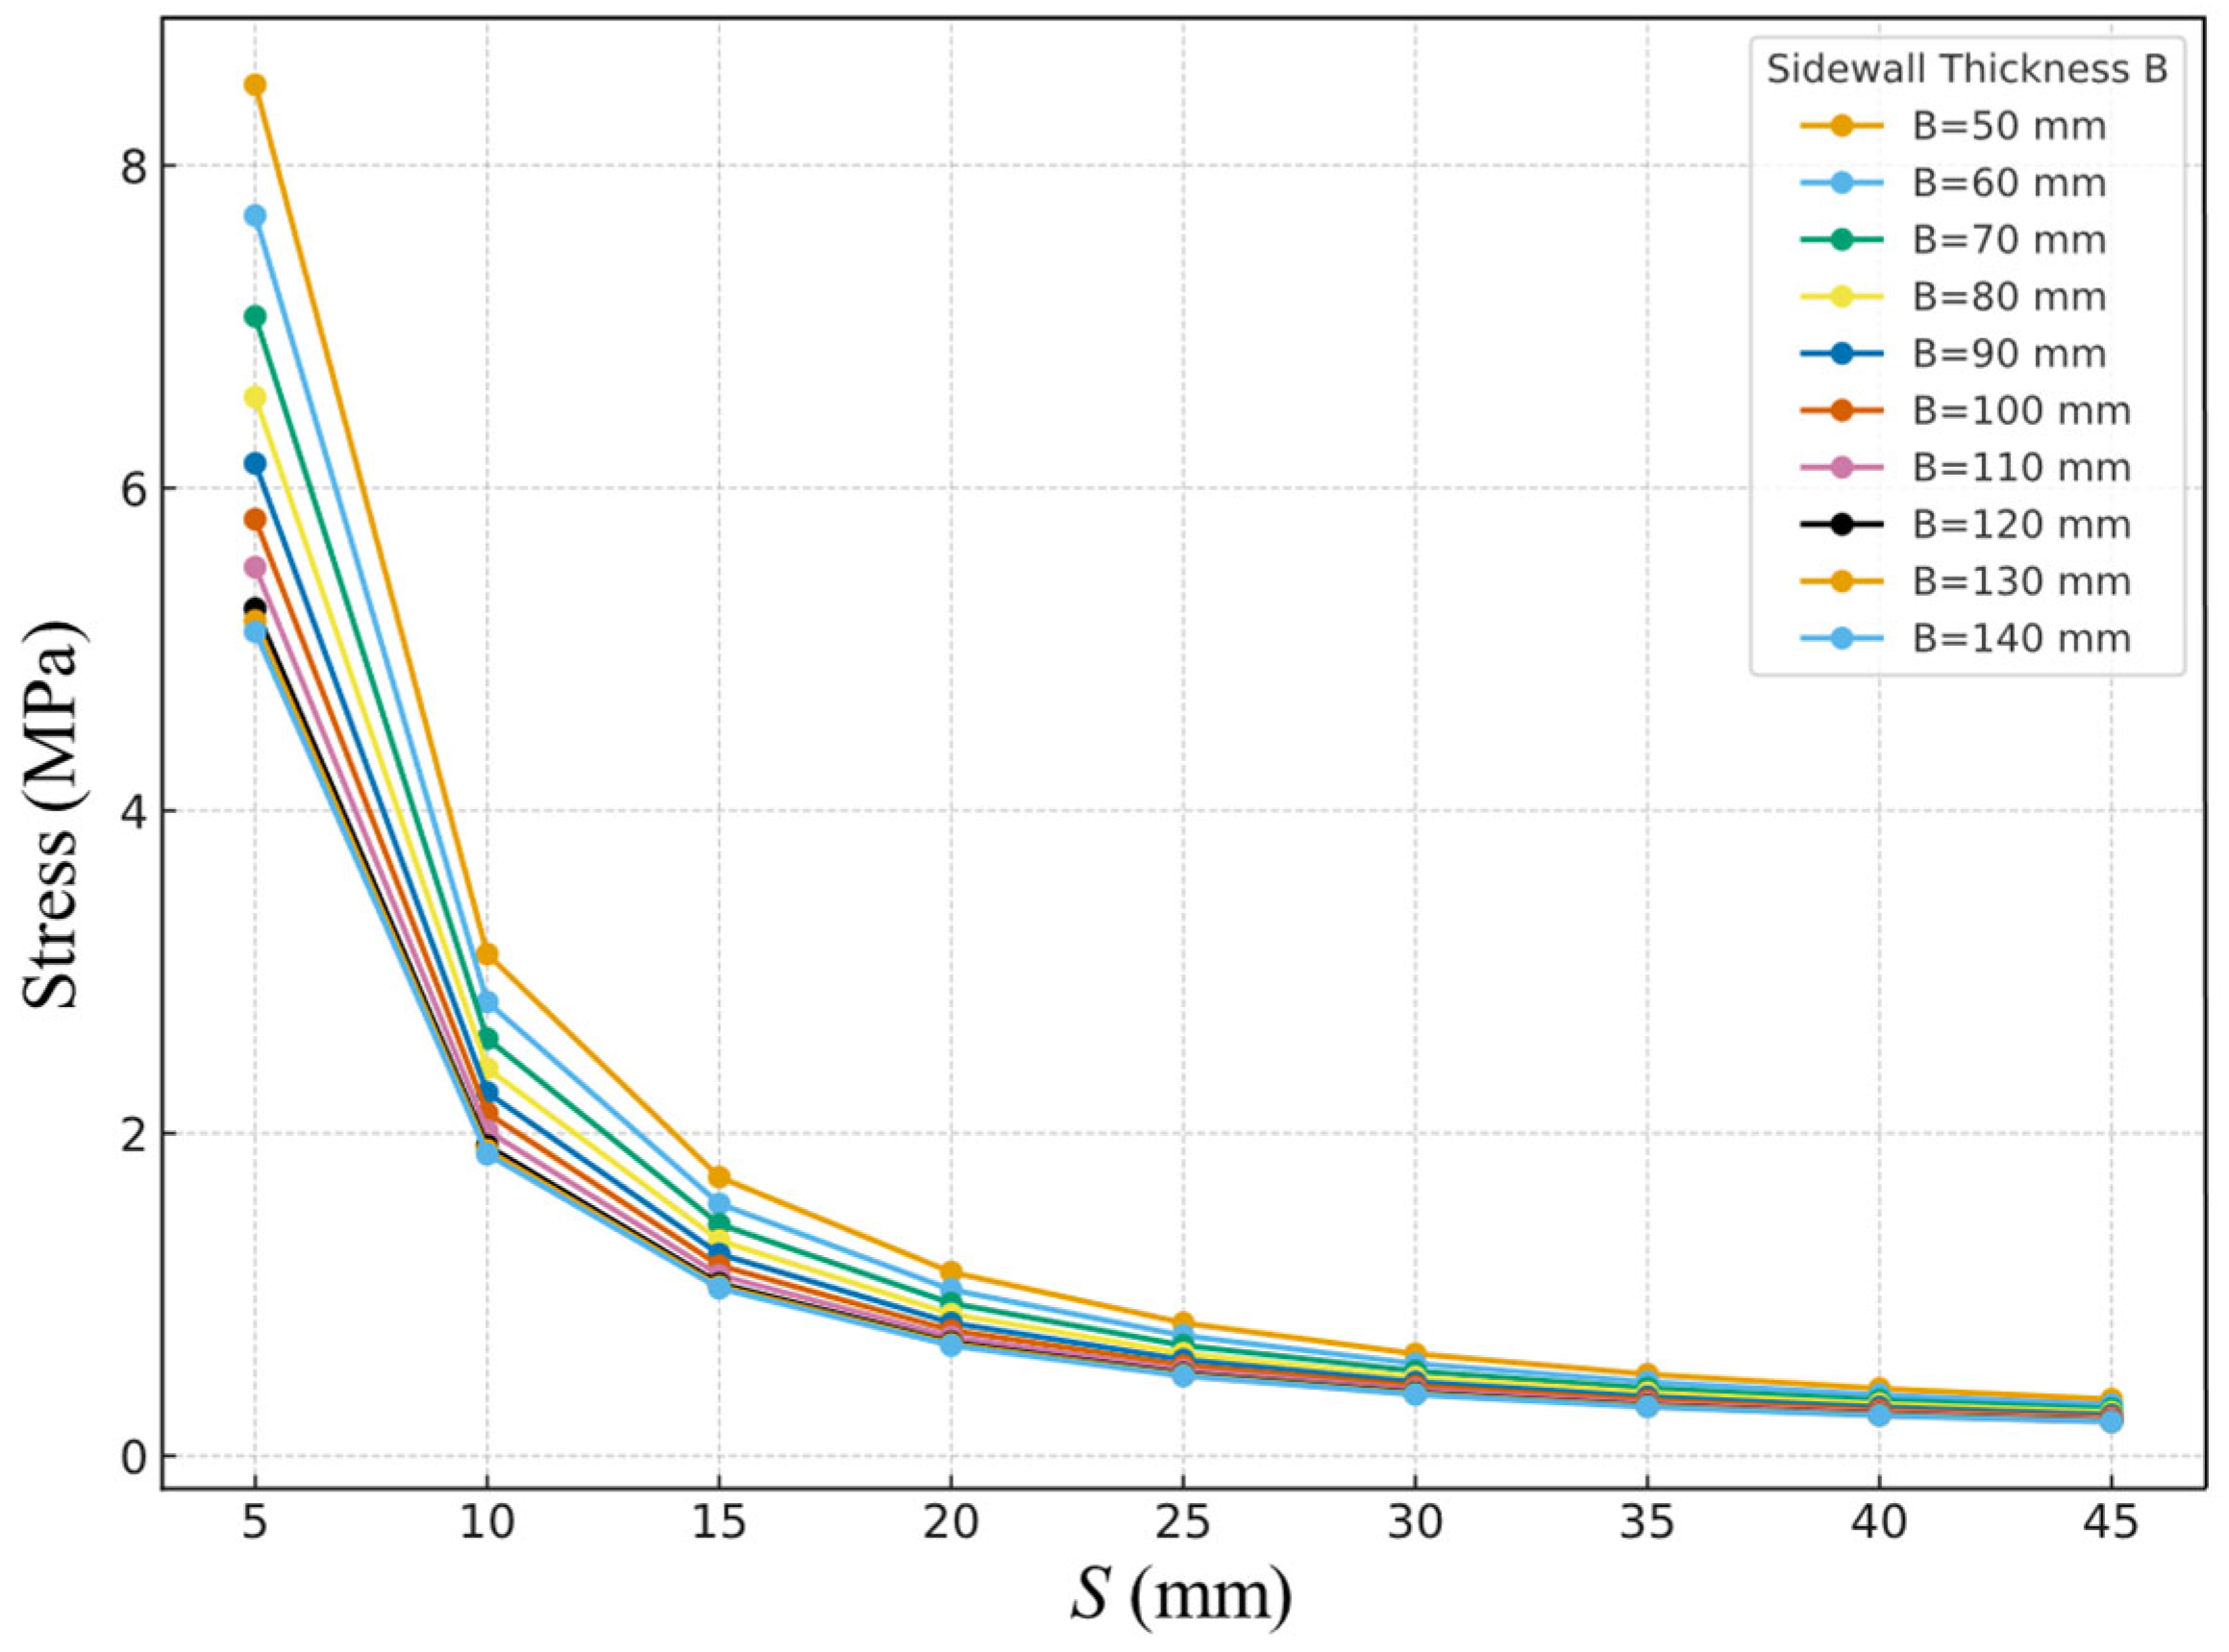
B are presented in
Table 6 and illustrated in
Figure 7.
The simulation results demonstrate that both S and B exert significant influence on the structural stress distribution: under otherwise identical conditions, larger values of S and B correspond to lower maximum equivalent stress. The underlying mechanism is that thickening the transparent layer and sidewalls simultaneously increases the section flexural rigidity and shear stiffness of the component. For instance, when B = 50 mm, increasing S from 5 mm to 45 mm markedly reduces the peak equivalent stress near the transparent layer and the interface. This occurs because, once the “upper flange” of the section is thickened, the moment of inertia grows approximately with the cube of the thickness, thereby alleviating stress concentration. Within the range of S = 20–30 mm, the rate of stress reduction shows diminishing marginal benefits (though still significantly better than thinner layers within the optimized interval). This trend aligns with the time-history characteristics of equivalent stress under transient loading conditions at different S values. Increasing the sidewall thickness enhances the box-like confinement effect and the overall stiffness of the structure, thereby reducing peak equivalent stress. However, once B reaches around 120 mm, further thickening yields only marginal improvement in stress reduction, exhibiting a typical diminishing marginal effect.
3.3.3. Strain Analysis Results
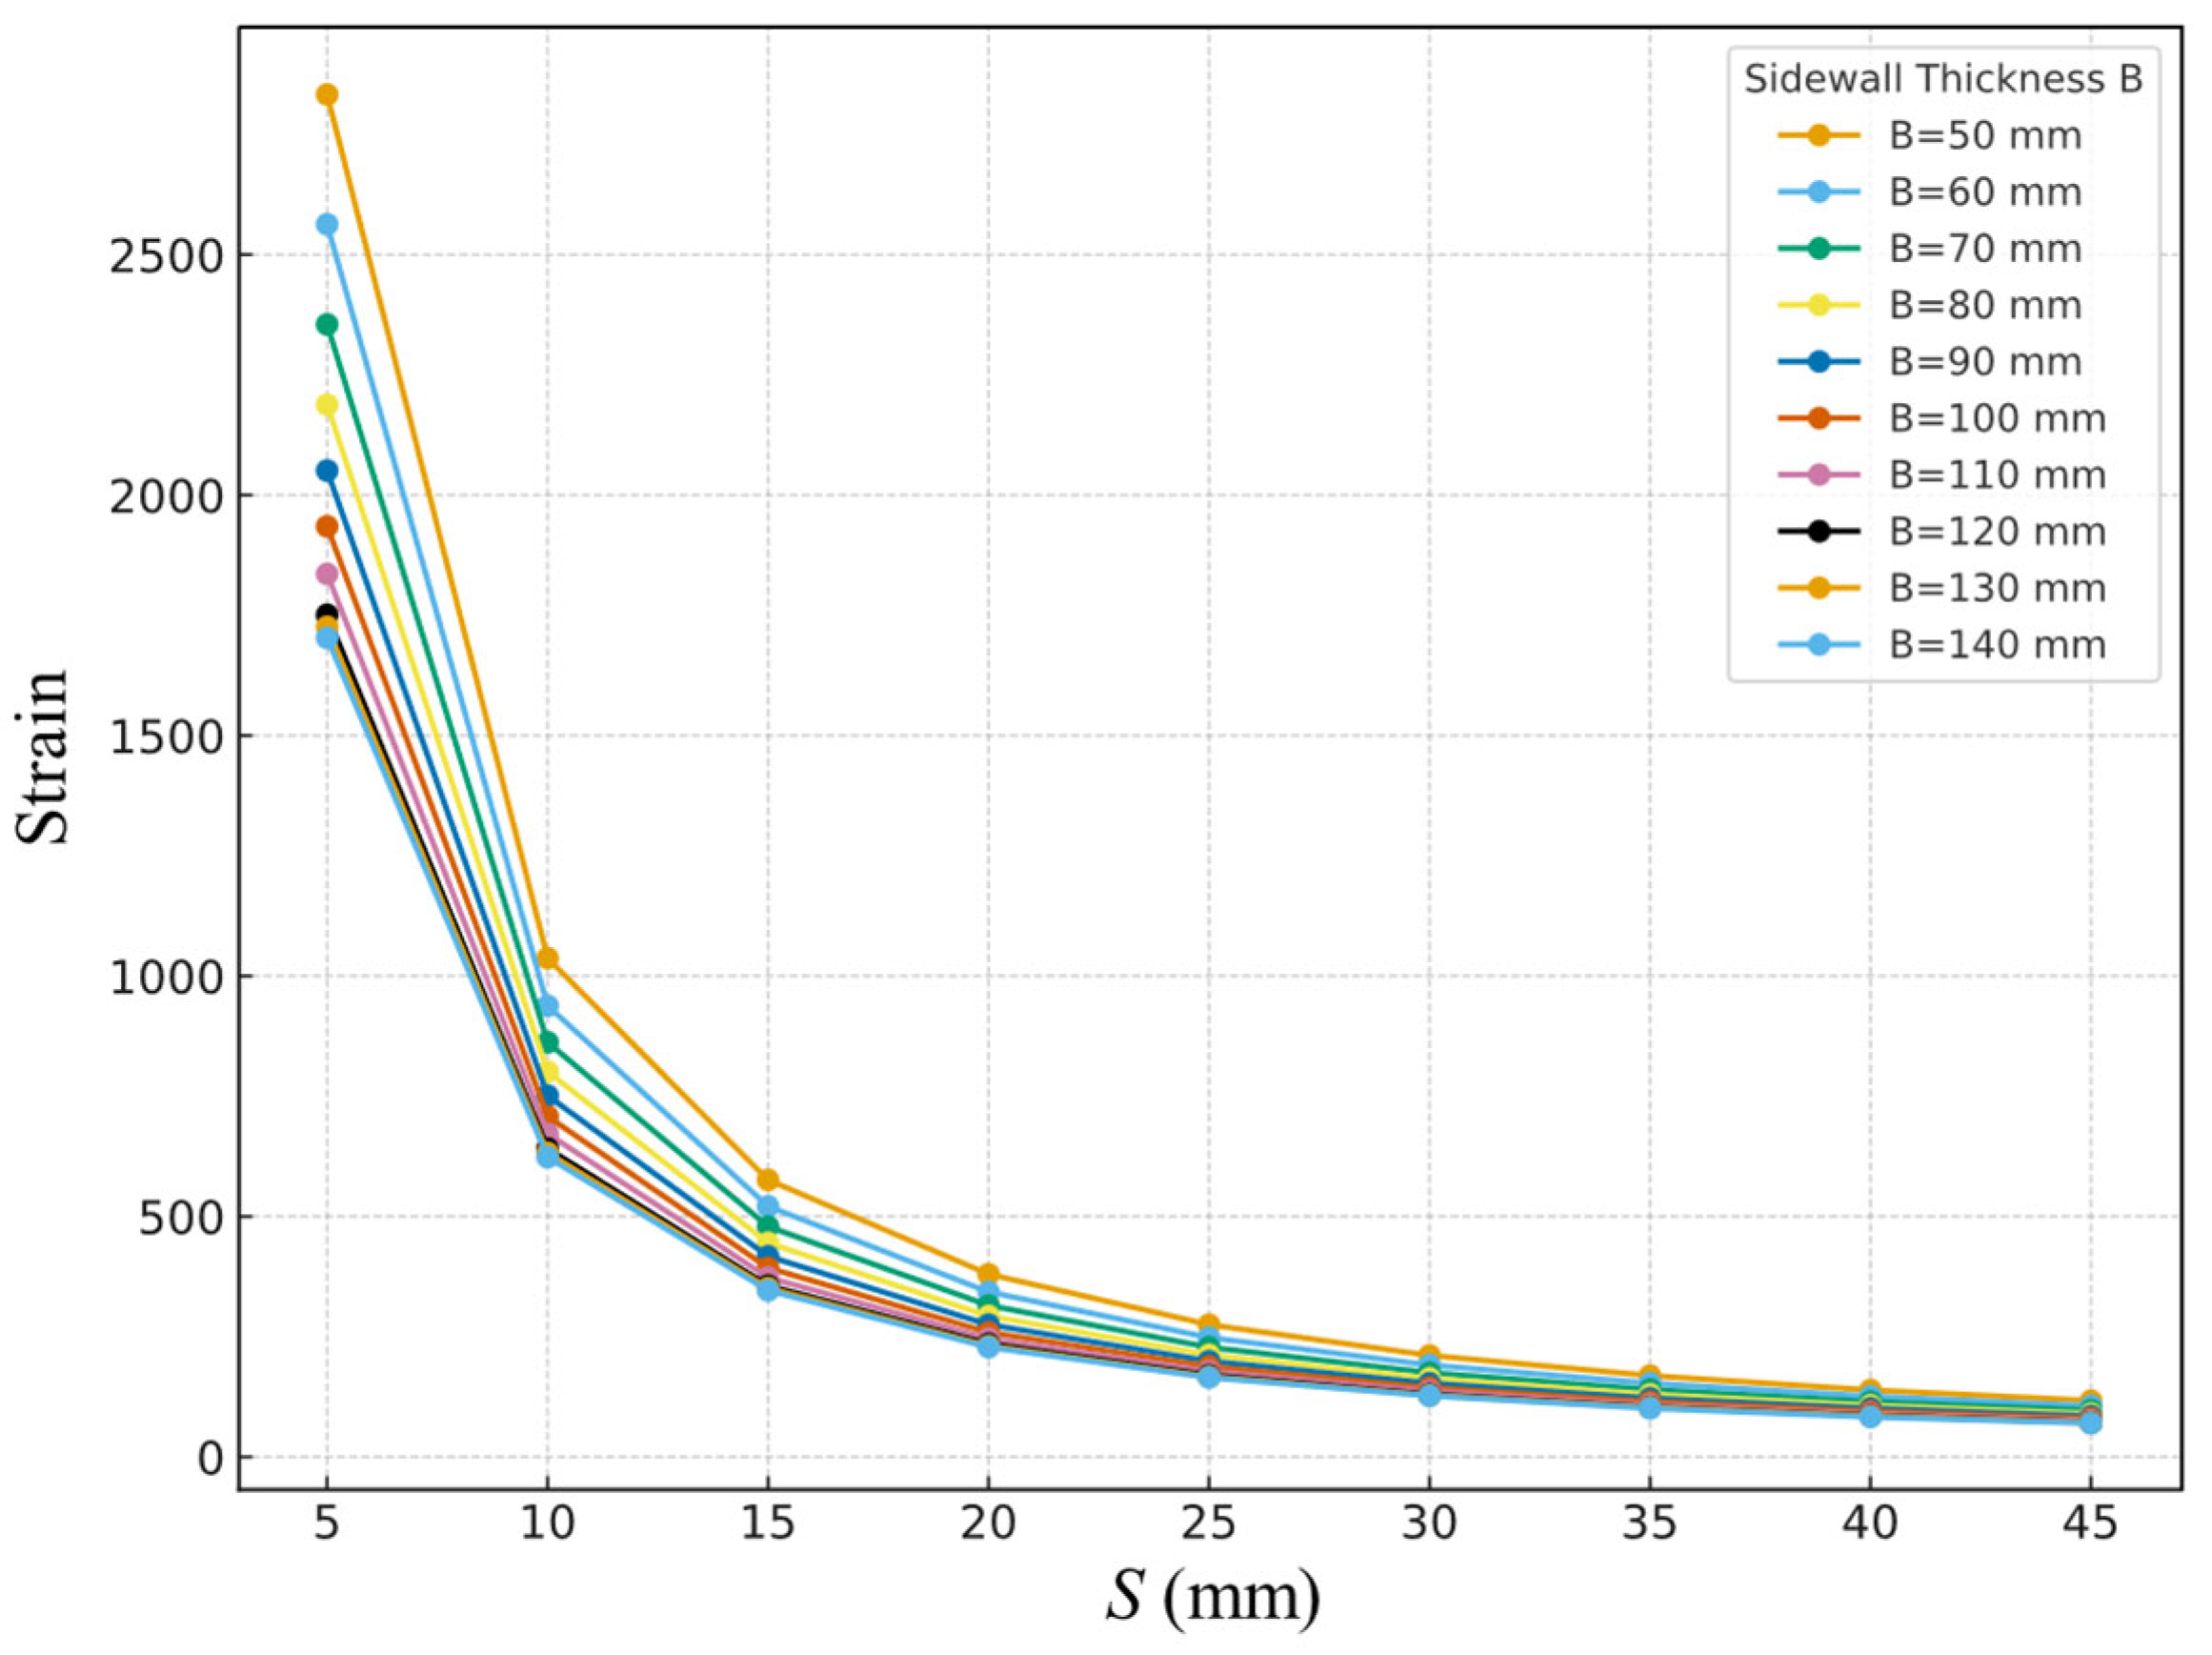
Strain, as a critical indicator of material deformation, typically signifies that smaller values correspond to less deformation under applied force, thereby contributing to enhanced structural stability. As shown in
Table 7 and
Figure 8, strain values exhibit a declining trend with increasing
S and
B, indicating that thicker transparent layers and sidewalls effectively reduce structural deformation and enhance overall stiffness and stability.
Under the rolling action of the BZZ-100 standard axle load, the peak principal strain on the tensile side of the transparent layer exhibits a stable and physically consistent trend with respect to the thickness parameter. Thickening the transparent layer markedly enhances both the flexural and shear stiffness of the section, thereby reducing the curvature and surface tensile strain induced by wheel loads. When S lies within the range of 20–30 mm, the marginal reduction diminishes, showing a typical “thick layer → plateau” characteristic. Increasing the sidewall thickness strengthens the box-like confinement and overall stiffness, thus lowering strain; however, once a certain thickness is exceeded, the growth in overall stiffness slows, and the strain reduction tends toward a plateau.
According to Hooke’s law of linear elasticity, under uniaxial loading the strain can be approximated as ε = σ/E, where σ denotes stress and E denotes the elastic modulus. Taking the elastic modulus of PMMA for the transparent layer as E ≈ 3.0 GPa, the peak principal strain in this study falls within the range of approximately 600–2800 με (0.06–0.28%). The theoretical strain interval corresponding to the peak stress values (approximately 2–9 MPa) given in
Table 6 is 670–3000 με, which is in good agreement with the results presented in
Table 7. Furthermore, comparison with material performance indices shows that this strain range is significantly below the recommended service-stage upper limit for PMMA (0.5%, or 5000 με), and also lower than the commonly adopted compressive strain limit for concrete (0.3%).
3.4. Time-Dependent Structural Response in Transient Dynamic Simulation
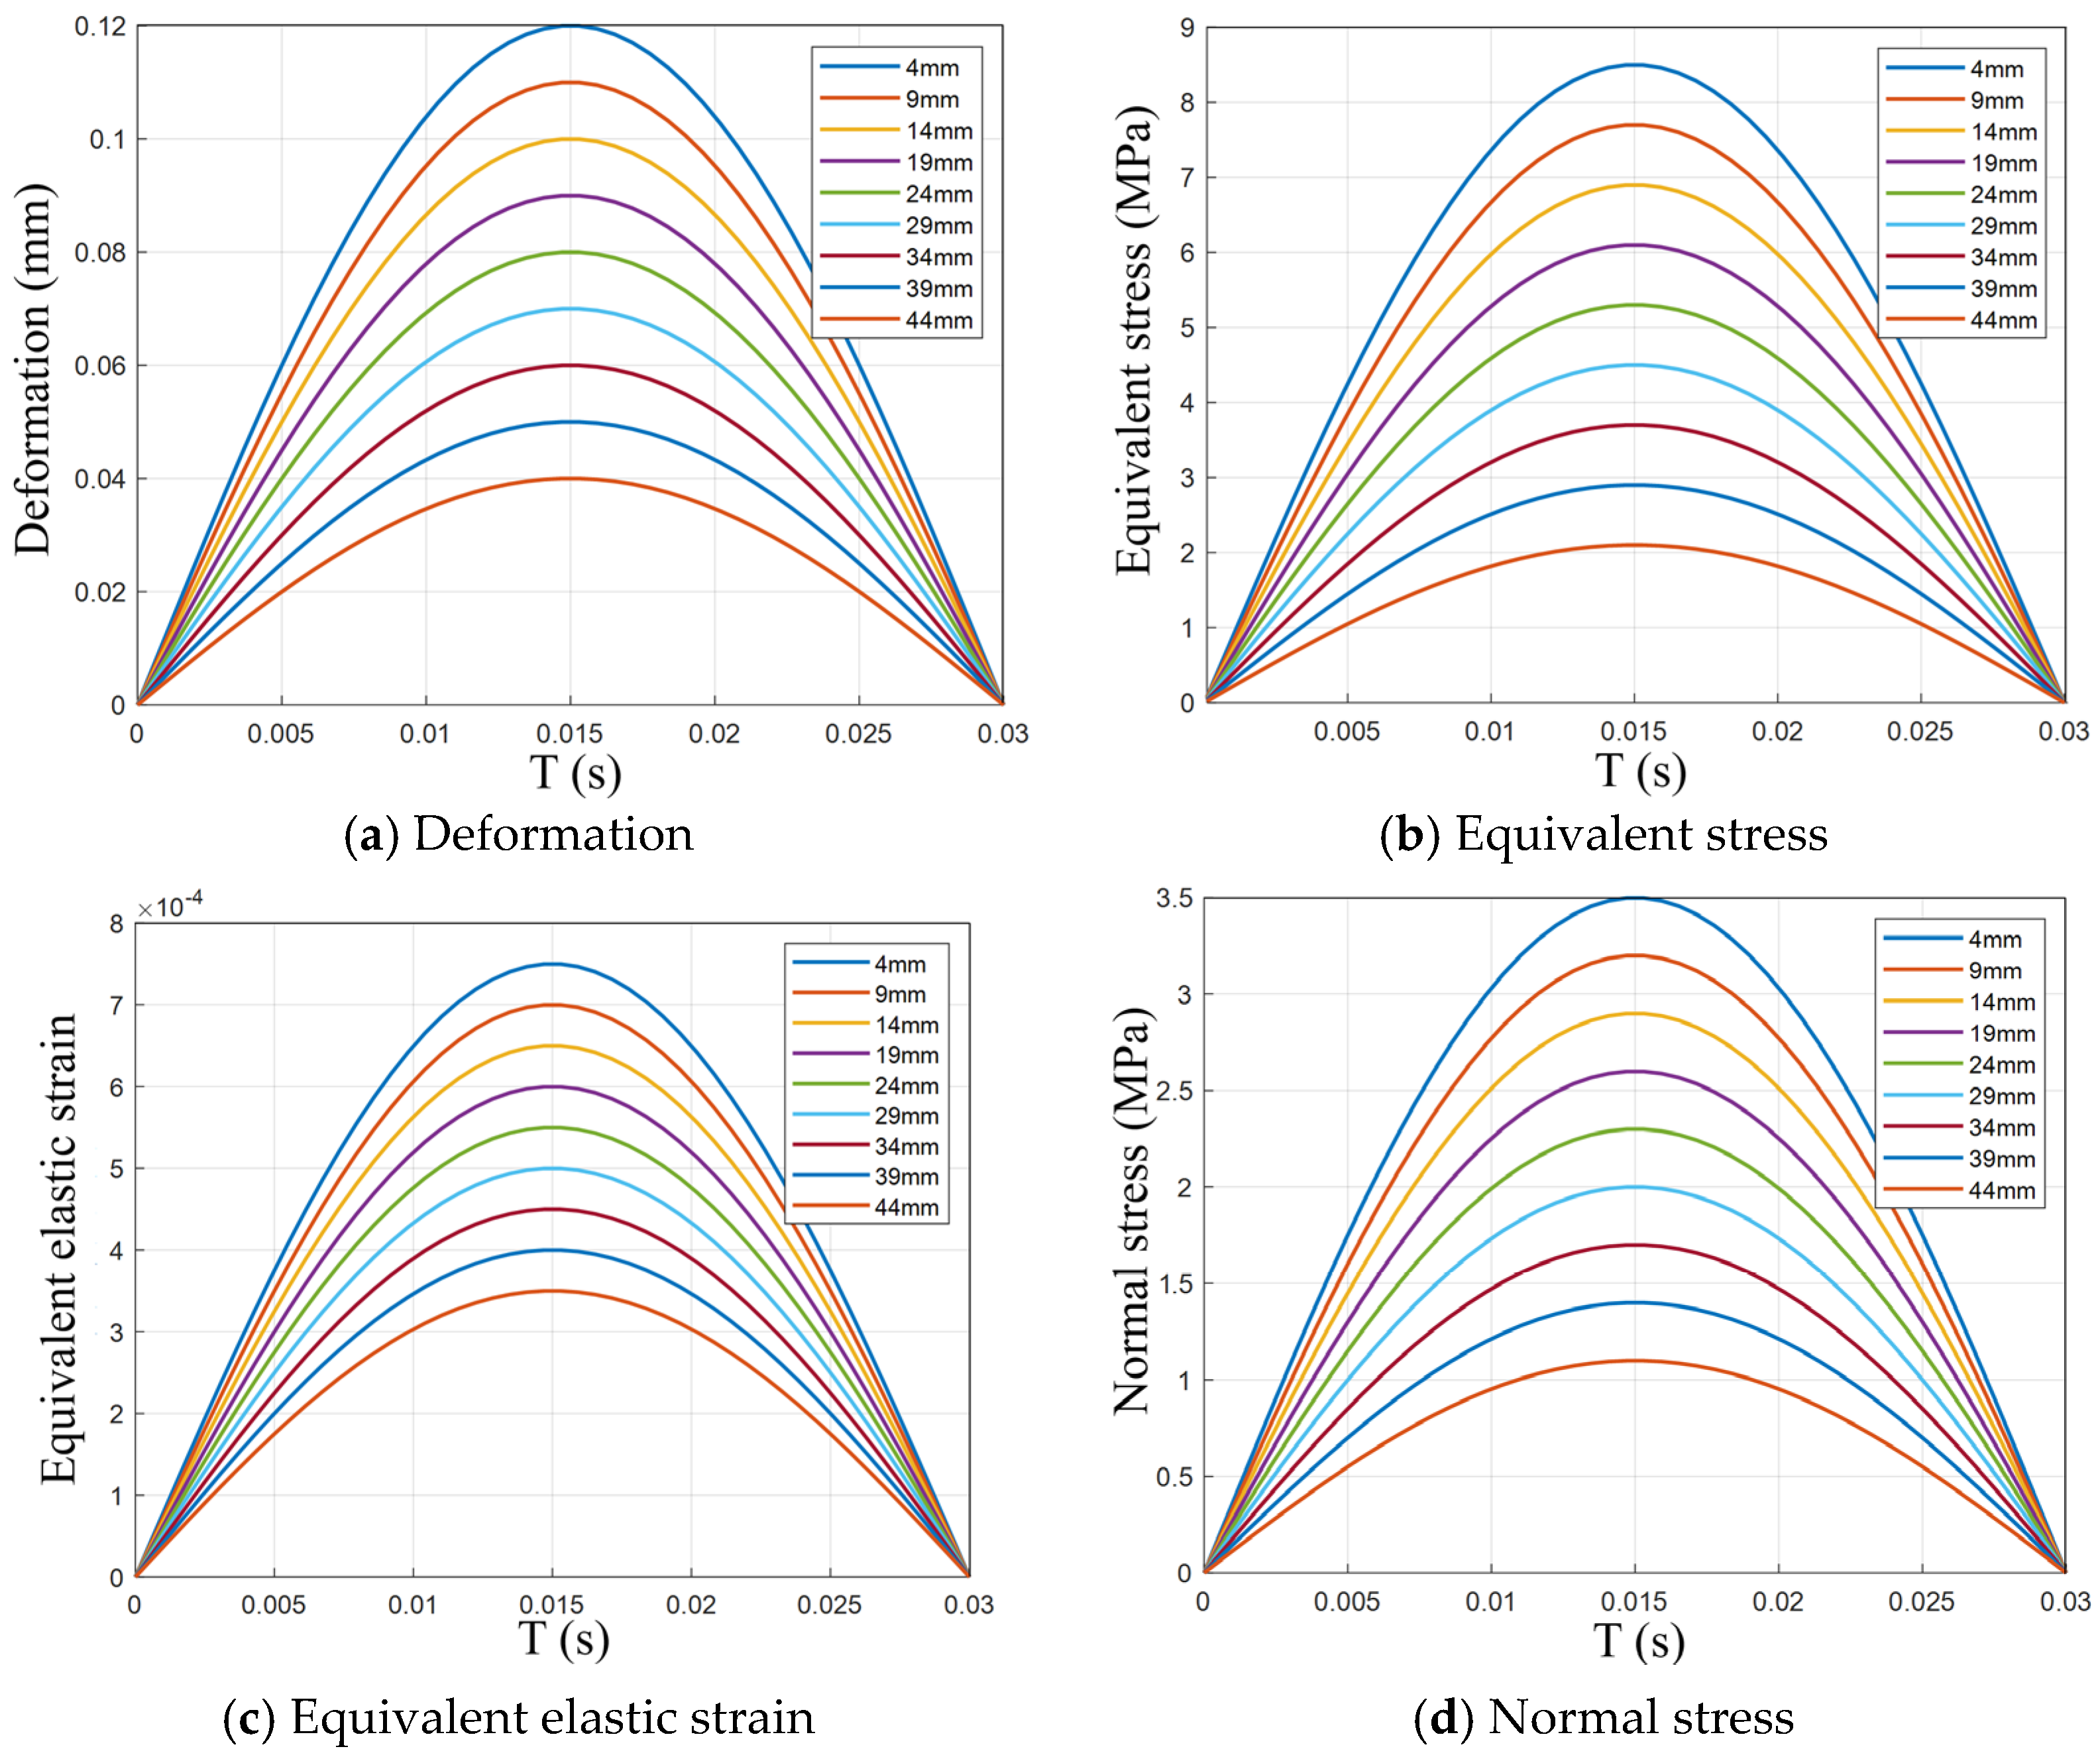
This study investigates the transient mechanical response of PV pavement modules under wheel loads, and presents time-history curves of deformation, equivalent stress, equivalent elastic strain, and normal stress, as shown in
Figure 9. These curves exhibit symmetric parabolic (half-sine wave) characteristics, reflecting the dynamic loading and deformation behavior of PV modules during the wheel rolling process. The analysis reveals that the surface layer thickness has a significant influence on all physical quantities, with notable variations in peak response values across different thickness levels (ranging from 4 mm to 45 mm). The following discussion addresses each parameter in detail.
The deformation curve follows a symmetric parabolic distribution, where deformation increases to a peak and then decreases back to zero as the wheel passes over the module. At T = 0.015 s, the deformation reaches its maximum value, indicating the wheel is positioned directly above the center of the PV module, resulting in maximum deformation. Thinner surface layers (e.g., 4 mm) exhibit the largest deformation—up to 0.12 mm—while thicker layers (e.g., 45 mm) reduce this to approximately 0.02 mm. This demonstrates that thicker surface layers are more effective at resisting deformation, improving the overall stiffness of the structure, and reducing bending of the PV panel, thereby enhancing its durability.
The equivalent stress also follows a symmetric half-sine wave pattern, peaking at T = 0.015 s, when the wheel is centered on the PV module. Surface layer thickness has a pronounced effect on stress magnitude. For a 4 mm layer, the peak equivalent stress reaches 8.5 MPa, while for a 45 mm layer, it decreases to around 2 MPa. This indicates that thinner surface layers are more prone to higher localized stresses, which may lead to material fatigue or damage. In contrast, thicker layers can effectively disperse the applied load and reduce stress concentration, thereby improving the service life of the PV module.
Equivalent elastic strain reflects the degree of elastic deformation under load and shows a similar trend to that of equivalent stress, also forming a symmetric half-sine curve. At T = 0.015 s, the strain peaks and then gradually returns to zero. For thinner layers (4 mm), the maximum equivalent elastic strain is approximately 0.00075, whereas for thicker layers (45 mm), the value drops to around 0.0003. This indicates that while thinner layers are more deformable, they are also more susceptible to fatigue damage. Thicker layers, due to their increased stiffness, undergo less deformation, which contributes to better long-term performance by reducing cumulative strain-induced material degradation under repeated loading.
Normal stress represents the structural response under vertical pressure from the wheel. Its curve also shows a symmetric parabolic trend, peaking at T = 0.015 s. For a 4 mm surface layer, the peak normal stress reaches 3.5 MPa, whereas for a 45 mm layer, the stress drops significantly to around 0.5 MPa. This suggests that thinner layers are more likely to experience high localized stresses under vertical loading, increasing the risk of local damage. In contrast, thicker surface layers are more capable of distributing the applied load evenly, thereby reducing peak normal stresses and lowering the probability of crack initiation.
By comparing the calculated maximum stress and maximum strain with the material’s failure strength and fatigue threshold, respectively, it is demonstrated that all stress values are below the allowable stress of the material, and all strain values do not exceed the fatigue limit, with corresponding safety factors all greater than 1. Therefore, it can be confirmed that under the examined working conditions, the deformation and stress of the structure are within the safe and acceptable range.

