1. Introduction
Tropical cyclones (TCs) cause a variety of damages. In 2023, for example, TC Freddy resulted in 1209 deaths even in Malawi, a land-locked country, and adversely affected the lives of 2.3 million people [
1]. The highest concentrations of risk from TCs, however, are found in coastal East, Southeast and South Asia; Madagascar and Eastern Africa; and Central America, the Caribbean, and the Atlantic Seaboard of North America [
2].
One of the sectors most clearly exposed, and plausibly most affected by TCs, is fisheries. TCs damage coastal infrastructure, including roads and houses essential for transporting catch, destroy fishing gear and boats, and prevent fishers from going to sea because of safety concerns. They are often accompanied by very heavy rainfall and mud flows that can damage marine habitats such as coral reefs, seagrasses, and seaweed beds, which is a critical environment for many fish species and can lead to downstream consequences for the fisheries sector [
3]. Unlike many terrestrial economic sectors, fisheries may be significantly affected even when the storms are far from shore. Fishing-dependent communities, especially in developing countries, are vulnerable to even short-term TC-induced disruptions [
4].
Despite the vital importance of fisheries to the livelihoods, food security, and export revenues of many coastal communities and economies, and despite the increasing vulnerability of communities to TC impacts associated with climate change, the existing research on TC impacts on fisheries is limited (see
Section 2 for a review). Importantly, most existing assessment methods are labor-intensive, dependent on costly and delayed data collection and unable to provide timely information during or immediately after events. There is a lack of scalable, replicable and cost-effective methods for real-time assessments and impact forecasting, which is essential for disaster preparedness, effective emergency response, and long-term resilience.
Given this research gap, we advance the existing body of research by developing an automated, scalable, accessible, and cost-effective toolkit capable of retrospective, real-time (nowcasting) and prospective (forecasting) assessments of TC impacts on fishing activity as measured by changes in the number of fishing boats at sea.
Nowcasting and forecasting are particularly valuable because they can help shift the framework from reactive assessment to proactive planning, even during the emergency management stage. Predicting likely disruptions to fishing activity before or at the time of TC occurrence enables policymakers and disaster managers to evaluate alternative scenarios and implement targeted interventions in real time. For instance, authorities can simulate how different cyclone tracks or intensities would affect specific fishing grounds, anticipate production losses, issue timely advisories, and allocate emergency resources more efficiently. This forward-looking capability enhances preparedness strategies, especially in regions with weak early warning systems or where fishing is a primary livelihood. This way, the toolkit can support more informed governance and disaster management practices and help improve coastal resilience, which can mitigate cyclone-induced losses [
5,
6].
The added value of the toolkit can be summarized in several points:
Automation: The toolkit streamlines the entire data processing pipeline using open-source tools built in Python (3.13.0) and R (4.4.1). It automates the extraction, cleaning, and integration of satellite and cyclone data, and applies a Vector Generalized Linear Model (VGLM) to generate timely and actionable indicators. This automation drastically reduces the time, cost, and technical expertise required to assess the effects of tropical cyclones on fishing activity.
Scalability: The toolkit is designed for global application and can be used across multiple countries, maritime Exclusive Economic Zones (EEZs), and across various spatial and temporal scales. While the primary application is for the TC hazard and the fisheries sector, the framework could also be adapted to other environmental hazards and economic sectors.
Accessibility: The toolkit is fully open-source and employs publicly available data, ensuring that it can be adopted by a wide range of users—including researchers, policymakers, NGOs, and local authorities—regardless of their access to proprietary data or advanced GIS expertise.
Real-time application: The toolkit enables nowcasting of cyclone impacts as a storm approaches and its path is forecasted as well as forecasting of the likely future impact of hypothetical cyclones. This real-time and forecasting capability allows stakeholders to anticipate disruptions to fishing activity, assess potential losses, and develop and coordinate timely interventions such as safety advisories or temporary fishing bans.
The remainder of the paper is structured as follows:
Section 2 reviews existing studies on TC impacts on fisheries with a focus on the used data sources.
Section 3 discusses the specific fishing activity and cyclone datasets used in our analysis.
Section 4 outlines the methodology of the toolkit, including the modelling framework and user interface.
Section 5 describes the structure and design of the open-source toolkit.
Section 6 provides illustrative examples of the toolkit’s output and potential applications.
Section 7 concludes with a discussion of policy implications and study limitations.
2. Data Sources for Assessing Cyclone Impacts on Fisheries
Understanding the impact of TCs on fisheries requires diverse and often complex data sources. The studies which explore these effects use various methodologies, which can be broadly grouped into three categories based on the fishing activity data used:
Nighttime light satellite data,
Ship tracking system data (e.g., Automatic Identification System or Vessel Monitoring System—AIS), and
Other fisheries-related data, including field surveys, port landings, interviews, and logbooks.
Each category offers distinct advantages and trade-offs in terms of spatial and temporal resolution, scalability, and the type of insights it supports. In this section, we review key studies within each group, highlighting how researchers have approached the challenge of measuring cyclone-related disruptions to fishing activity. This review helps contextualize the design of our toolkit and motivates its emphasis on automation, scalability, and accessibility.
2.1. Nighttime Light Satellite Data
Tian et al. [
7], Li et al. [
8] and Noy et al. [
4] study the effect of tropical storms on fishing activity using, similarly to this study, nighttime light satellite data from the Visible Infrared Imaging Radiometer Suite (VIIRS) Day-Night Band (DNB) and a VIIRS boat detection algorithm from Elvidge et al. [
9].
Tian et al. examine the effects of TCs, climate and environmental changes, fishery closures and the COVID-19 pandemic on coastal fisheries in Beibu Gulf, located in the northwest of the South China Sea [
7]. While primarily relying on VIIRS imagery, the authors also employ alternative high-resolution images (Luojia1–01) to identify the detection limits of the VIIRS images and improve detection parameters. To analyse storm effects on fishing activity, they count the number of fishing boats before, during and after a single case study—the 2015 Cyclone Nangka.
Li et al. investigate fishing activity time trends across the South China Sea, also considering the effects of TCs [
8]. They note that the existing fishing vessel detection methods based on nightlight data may be less effective in this region due to background coastal brightness fluctuations. To address this, they develop a novel fishing boat detection method that accounts for these fluctuations and apply it to monthly composite VIIRS DNB images between 2012 and 2019. To study the impacts of tropical storms on nighttime fishing activity, they develop a storm destruction potential indicator which integrates storm intensity, duration, and the size of the storm-impacted area, correlating this with nighttime light data aggregated seasonally.
Noy et al. combine satellite imagery and cyclone data to estimate substantial commercial fishing production losses per day during cyclone events in the Philippines in 2012, affecting a large number of households dependent on fishing for their income [
4]. Their findings highlighted the vulnerability of fishing-dependent communities to even short-term disruptions.
2.2. Ship Tracking Systems Data
Fishing activity data derived from the AIS are used by Fang et al. [
10] to examine the impact of TCs on China’s offshore fisheries between 2013 and 2018. They employ an AIS-derived dataset from Kroodsma et al. [
11], which uses convolutional neural networks to distinguish fishing from non-fishing vessels and map fishing activity. To assess the effect of 52 TCs on fishing activity, Fang et al. develop TC impact indices quantifying storm-induced reductions in fishing hours and vessel hours. They also analyse the relationship between the TC impact indices and a TC hazard index for potential use in pre-cyclone impact assessments.
Rezaee et al. study the effect of extreme weather on commercial fishing activity in Atlantic Canada between 2005 and 2010, using similar Vessel Monitoring System datasets gathered by the Canadian Department of Fisheries and Oceans [
12]. They analyse the relationship between cyclone-related weather conditions and fishing activity using count-data regression methods.
2.3. Other Fishing Activity Data
Other studies analyse storm effects on fishing activity using alternative, and typically local, fisheries data such as catch amounts, catch composition (by species), fish landings counted at ports, fishing effort, or fishing hours. These data are mostly collected locally through sample surveys or on-boat monitors (as in Lacheheb et al. [
13] and Mediodia et al. [
14]). Compared to the nighttime light satellite and ship tracking data, these local datasets may be less suitable for analysing detailed spatio-temporal characteristics of fishing activity on a large scale and are generally more difficult to extrapolate from. However, they provide useful insight into economically relevant characteristics such as catch amounts, composition, gear damage, or the length of fishing activity interruptions, provided that survey respondents are representative of the larger population of fishers.
Many of these studies also rely on primary data collected through interviews with fishers or other relevant stakeholders, questionnaires, direct field observations or fishing vessel logbooks. For example, Chang et al. use fishers’ logbooks to analyse the effects of the 2009 Cyclone Morakot in the waters off the northern part of Taipei, China comparing catch composition pre- and post-cyclone, detailing shifts in major fishing grounds, and overlaying fishing ground locations and catch per unit of effort with storm-related marine environmental variables [
15]. Tang et al. [
16] similarly investigate the effects of the 2009 cyclones Goni and Koppu on fish catch in the South China Sea and Giri et al. [
17] examine the impacts just before and after the 2013 Cyclone Phailin in the northern Bay of Bengal.
Yagi compares mean catch per unit effort and the composition of catch before and after the 2011 TC Meari in Tachibana Bay, Japan, using data from the supervisor of this fishery [
18]. Monteclaro et al. assess the impact of the 2013 Cyclone Haiyan using GPS data for stationary fishing gears alongside interviews and focus group discussions for non-stationary fishing gears, fishing operations and fish catch impacts [
19]. Kundu and Santhanam [
20] and Gupta et al. [
21] analyse the impacts of the 2021 Cyclone Yaas on fish landing centres in Northern Odisha and West Bengal, respectively, based on field observations and interviews, focusing on the loss of active working days that quantify fishers’ perceived economic losses from lost working days. Raju et al. pursue a similar approach for the 2020 Cyclone Amphan in the Bay of Bengal [
22,
23].
Studies such as Burkholder et al. [
24], Punya et al. [
25], and Makwana and Patnaik [
26], use aggregate fisheries data available from government agencies. Burkholder et al. examine the effect of the 1996 and 1999 hurricane seasons on commercial fisheries landings in two ecosystems in North Carolina, by comparing pre- and post-storm fish landings values based on data from the state’s Division of Marine Fisheries [
24]. Similarly, Punya et al. use data from the Indian Central Marine Fisheries Research Institute but focus on a single cyclone [
25].
Finally, unlike the previously mentioned studies that conduct before-after analyses, Heck et al. perform a global assessment of storm risk to fisheries in coastal nations based on indicators of hazard, exposure, sensitivity, and adaptive capacity [
27,
28]. While their methodology is radically different from ours, the global applicability of their modelling is similar. They use data on fisheries landings and the number of fishers from the United Nations’ Food and Agriculture Organization.
3. Fishing Activity and Cyclone Track Data for the Toolkit
The new algorithm we develop for this toolkit automates the extraction of data from satellite and cyclone track databases, enabling analysis across diverse geographical locations and time periods. By translating complex raw data into usable indicators, the toolkit supports both informed decision-making and scalable research on the impacts of TCs.
3.1. Fishing Data and Identification of Fishing Grounds
The VIIRS dataset, derived from the Suomi National Polar Partnership (SNPP) satellite operated by NASA and NOAA, utilizes an algorithm developed by Elvidge et al. [
9] to detect fishing boats that employ bright lights to attract fish, based on the sharpness and intensity of light emissions. This fishing boat dataset is freely available, with global daily coverage starting in 2012, and can be accessed through the Payne Institute for Public Policy [
29].
Our toolkit integrates this dataset with the spatial boundaries of each country’s Maritime Exclusive Economic Zone (EEZ) to define areas of analysis. Because fisheries within an EEZ are managed by national authorities, the identity of beneficiaries of the fisheries (and often the nationality of the fishers) is clearer. While there is a substantial amount of fishing in international waters, the VIIRS data does not enable reliable identification of vessel nationality, making such areas less relevant for our purpose of informing fisheries’ disaster risk management.
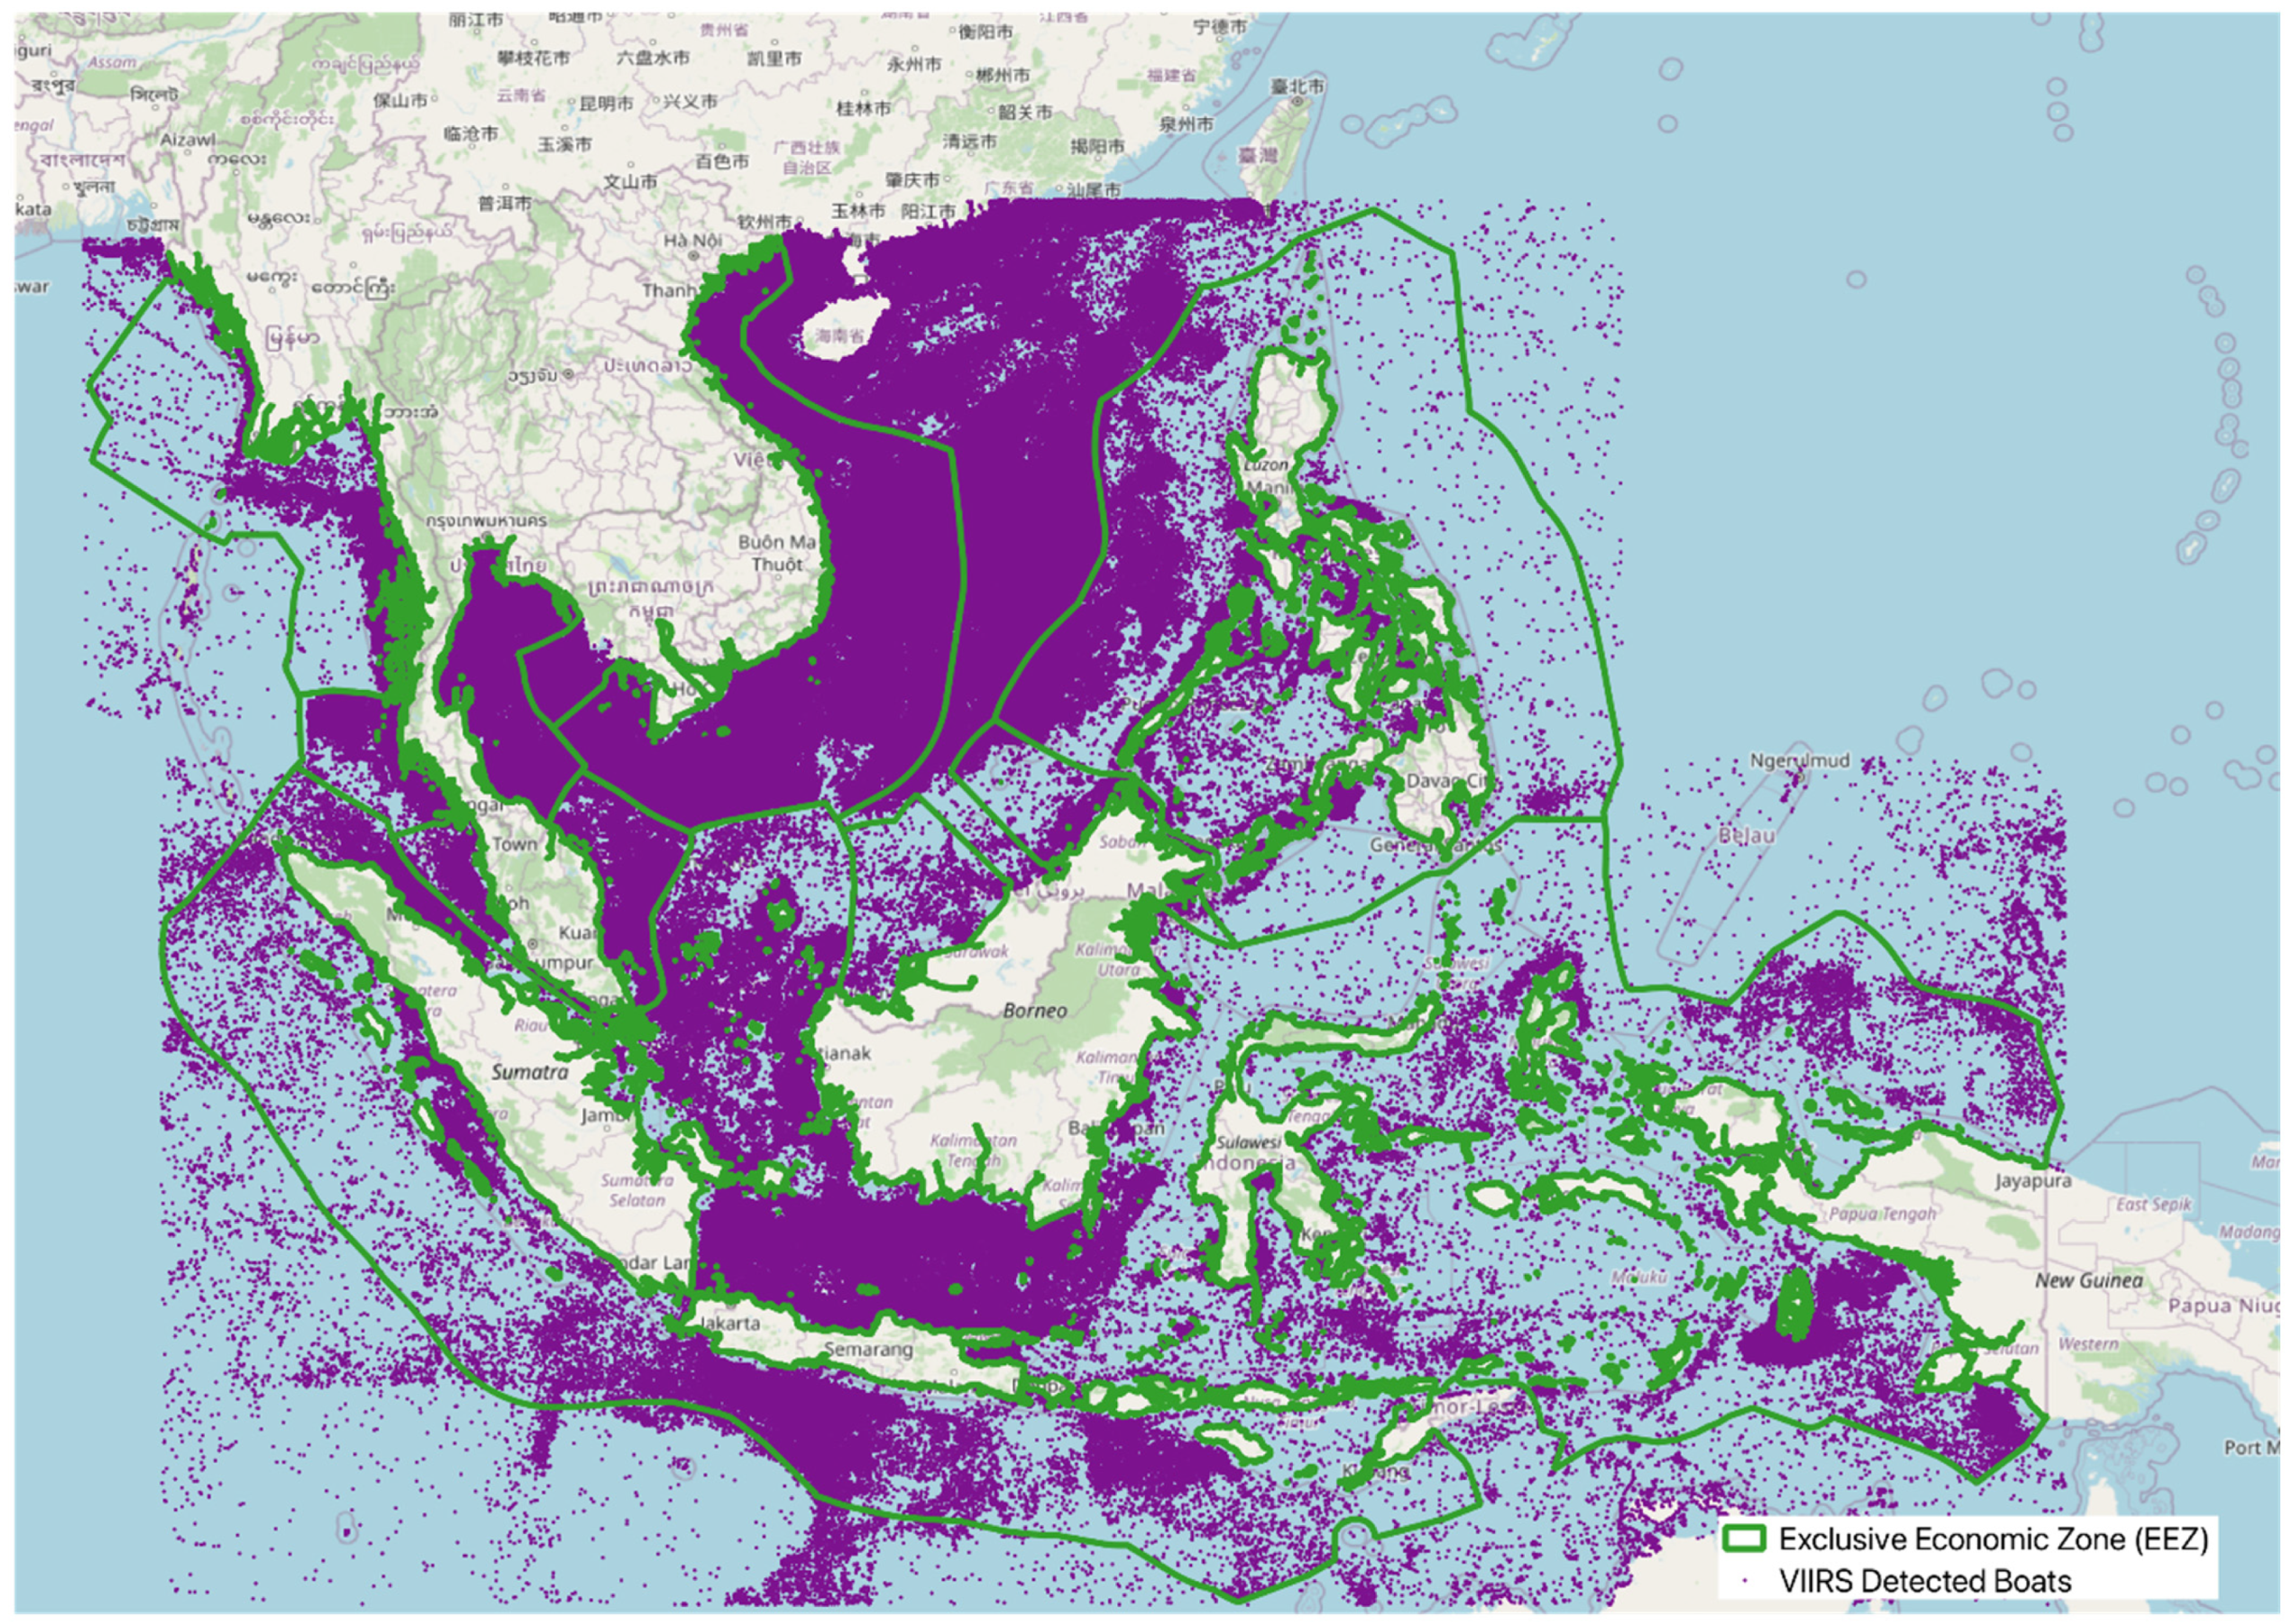
Figure 1 provides an example of VIIRS data for the South China Sea region. Each dot represents a single boat observed during 2024.
To identify the main fishing grounds, we apply a structured data preparation workflow that incorporates both spatial and temporal filtering. The vessel detections are spatially filtered to those within the country’s EEZ and further restricted to observations marked with high-confidence Quality Flags (QF) set by VIIRs. The dataset is further filtered to include only observations within the country’s defined cyclone season—for example, June to December in the case of the Philippines. By focusing on this specific temporal window, we ensure that the resulting fishing grounds are relevant for evaluating exposure and behavioral changes linked to tropical cyclone activity. Vessel detections that coincide with the presence of a tropical cyclone in the EEZ are also filtered out. The resulting dataset captures the typical fishing patterns during the cyclone season in the absence of cyclones, and this will serve as our baseline dataset for historical analysis.
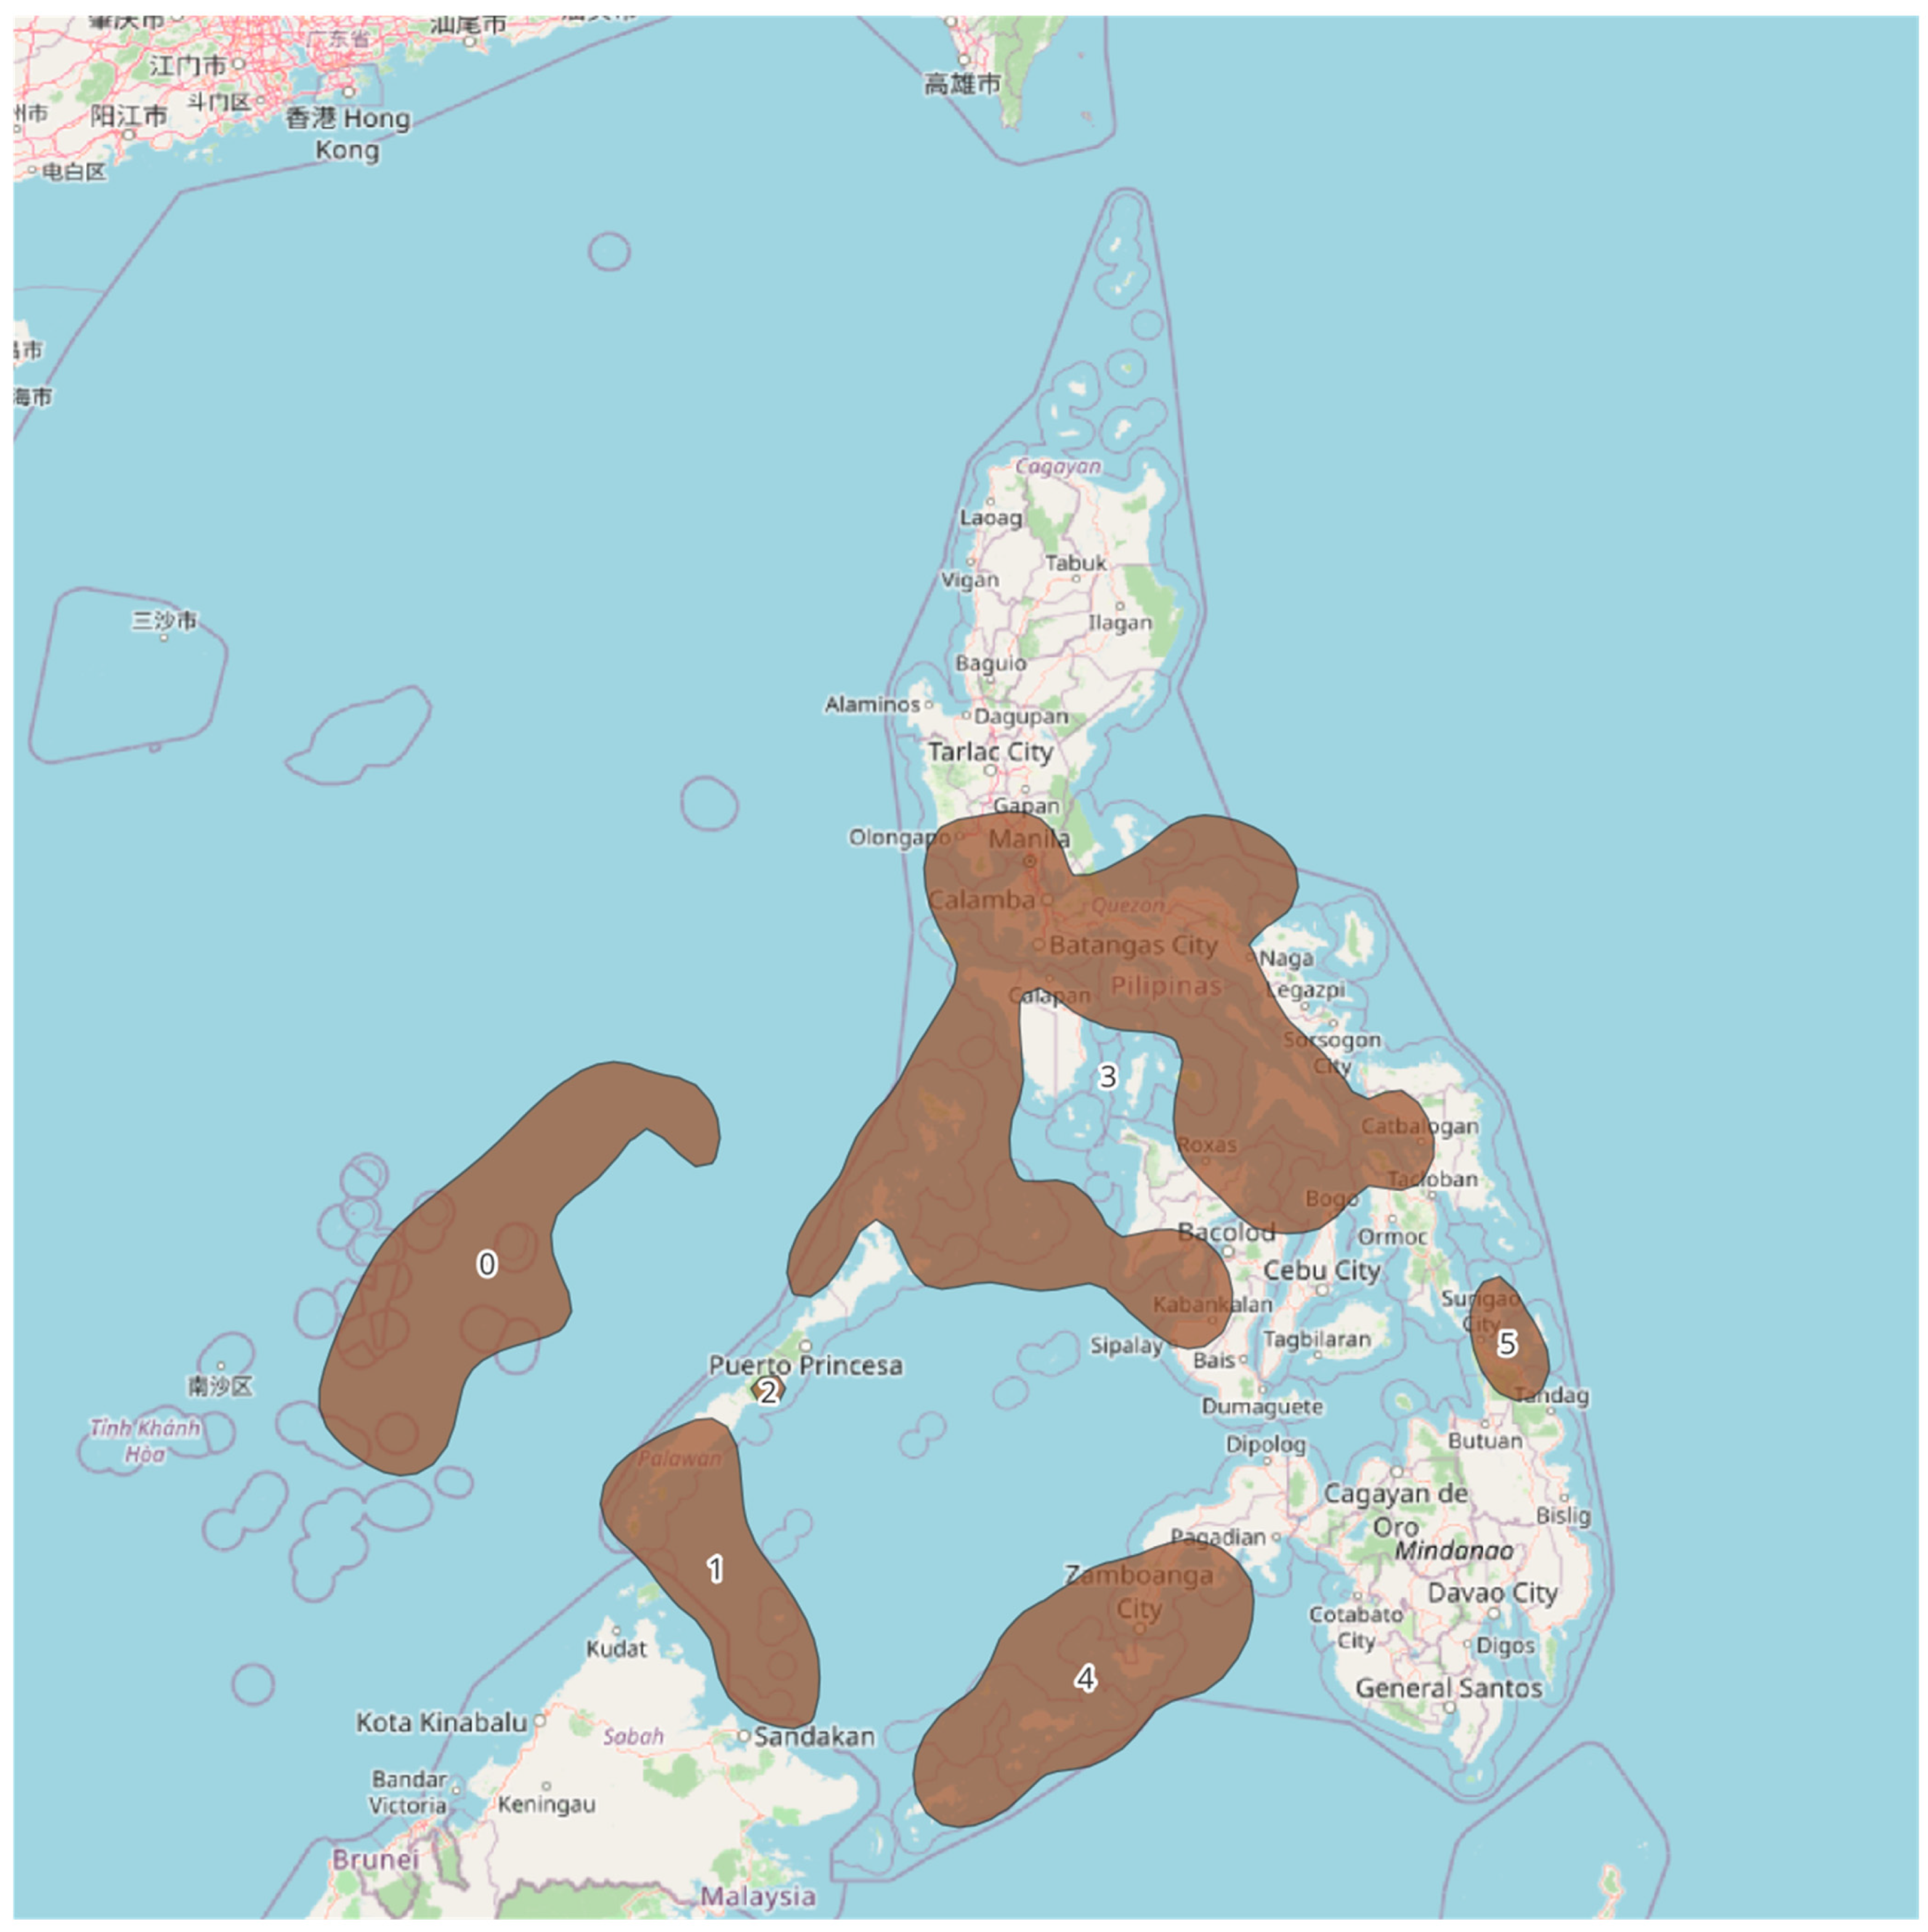
This baseline dataset is then processed using a Kernel Density Estimation (KDE) algorithm, which converts discrete vessel locations into a continuous probability density surface. This spatial smoothing technique helps identify areas of concentrated fishing activity within the EEZ (See
Figure 2 for an example from the Philippines). These density maps form the basis for assessing the impact of TCs on key fishing grounds.
The KDE method is particularly well suited for this task due to its ability to create a smooth gradient from discrete point data, effectively identifying the regions with the highest concentrations of fishing activity. This approach is especially useful for visualizing the spatial distribution of fishing effort, laying the groundwork for subsequent analyses of the impact of TCs on the most heavily fished grounds.
We construct the density function based on the work of Samiuddin and El-Sayyad [
30] as follows:
where
is the estimated density of observed fishing vessels,
is the bandwidth that determines the smoothness of the estimate, and
is the Gaussian kernel function that weighs the observations. The Gaussian function ensures that each vessel’s location exerts a diminishing, symmetric influence with increasing distance from
, thereby avoiding directional bias [
31].
The bandwidth
is a critical parameter that dictates the extent of clustering assumed. A larger
results in a smoother spatial representation, potentially concealing variations over smaller geographical areas. Conversely, a smaller
can yield a very detailed density map, where even a few data points may constitute a perceived cluster (a fishing ground). Therefore, selecting an optimal bandwidth is essential for accurately representing significant clusters while avoiding excess detail. To guide this selection, Green et al. [
32] propose the following formula,
, where
is the standard deviation,
is the interquartile range, and
is the sample size. This formula strikes a balance between over-smoothing and over-fitting, facilitating the identification of high-density areas while filtering out noise.
As the KDE algorithm is applied separately for each country’s EEZ, it allows for detailed spatial mapping of fishing activity at the level in which this activity can be effectively managed. This enables a more precise assessment of the potential impacts of cyclones, both direct, on the fishing sector, and indirect, on related sectors such as seafood processing.
3.2. Cyclone Data
The International Best Track Archive for Climate Stewardship (IBTrACS) database provides comprehensive global cyclone track data (See
Figure 3) and serves as our primary source for identifying cyclones affecting specific fishing grounds [
33,
34]. To focus on the most impactful events, we restrict the analysis to cyclones that pass through and remain within a country’s EEZ for at least 24 h. This criterion ensures that only cyclones with substantial potential to affect fishing activities are considered.
For each cyclone that meets this criteria, information is extracted from the database at 6-h intervals, including: storm speed (the speed at which the eye of the storm is moving), wind speed (a standard measure of cyclone intensity), and the cyclone’s geographic position (latitude and longitude).
3.3. Calculating Cyclone Distances Relative to Fishing Grounds
Once the fishing grounds are identified using KDE, the centroid of each ground is calculated. For every cyclone recorded in the IBTrACS database, the positions of the cyclone track (recorded by latitude and longitude as the storm passes through the EEZ) are used to calculate the distance between each point along the track and the centroid of the fishing ground. From this set, the minimum distance for each day is determined, representing the cyclone’s closest approach to the fishing ground on that day. In addition, the average storm translation speed at this closest point is calculated using the IBTRACS data, providing a measure of the cyclone’s movement speed on that day. (The storm translation speed refers to the rate at which the cyclone’s center (or eye) moves across the Earth’s surface. It is calculated using the IBTrACS positional data recorded at 6-h intervals by measuring the distance between successive track points and dividing by the time elapsed. This speed is distinct from wind speed, which reflects the cyclone’s intensity. The translation speed near the fishing ground is important because slower-moving storms may cause longer-lasting disruptions to fishing activity, even if their wind speeds are not extreme).
4. Nowcasting Fishing Activity During Cyclone Events
A first step is to track and measure the spatial relationship between cyclones and fishing grounds by identifying fishing activity locations and quantifying the proximity of cyclone tracks to these areas, as described in
Section 3. Building on this foundation, nowcasting predicts the immediate or near-term response of fishing activity during cyclone events. Using a model trained on historical cyclone and fishing data, nowcasting enables near-real-time estimation of changes in boat counts based on current storm conditions, helping to anticipate disruptions to fishing.
To develop the nowcasting model, the historical data from 2012 to 2024 were compiled from VIIRS, focusing on cyclones that entered a country’s EEZ for at least 24 h, and the corresponding fishing boat locations during the identified cyclone events. Fishing grounds were generated using the same filtering steps discussed in
Section 3.1. Using these fishing grounds as reference points, we calculated the cyclone-related variables for each event: the minimum distance from each cyclone to the centre of each fishing ground within the country’s EEZ, the maximum wind speed, and the average storm translation speed.
These variables were then used to fit a cubic regression model which captures non-linear relationships between cyclone characteristics and the observed number of fishing boats during cyclone periods. The coefficients derived from the model were then used to calculate the predicted boat counts during new cyclone events. The cubic model is formulated as follows:
where
is the number of boats in fishing ground
i on day
t,
is the intercept,
and
are the estimated coefficients for mean storm translation speed for storm
s and maximum wind speed recorded for that storm on that day
, respectively,
and
are the estimated coefficients for the quadratic and cubic maximum wind speed terms, respectively, and
represents the coefficient for the distance of the storm
from fishing ground
i on day
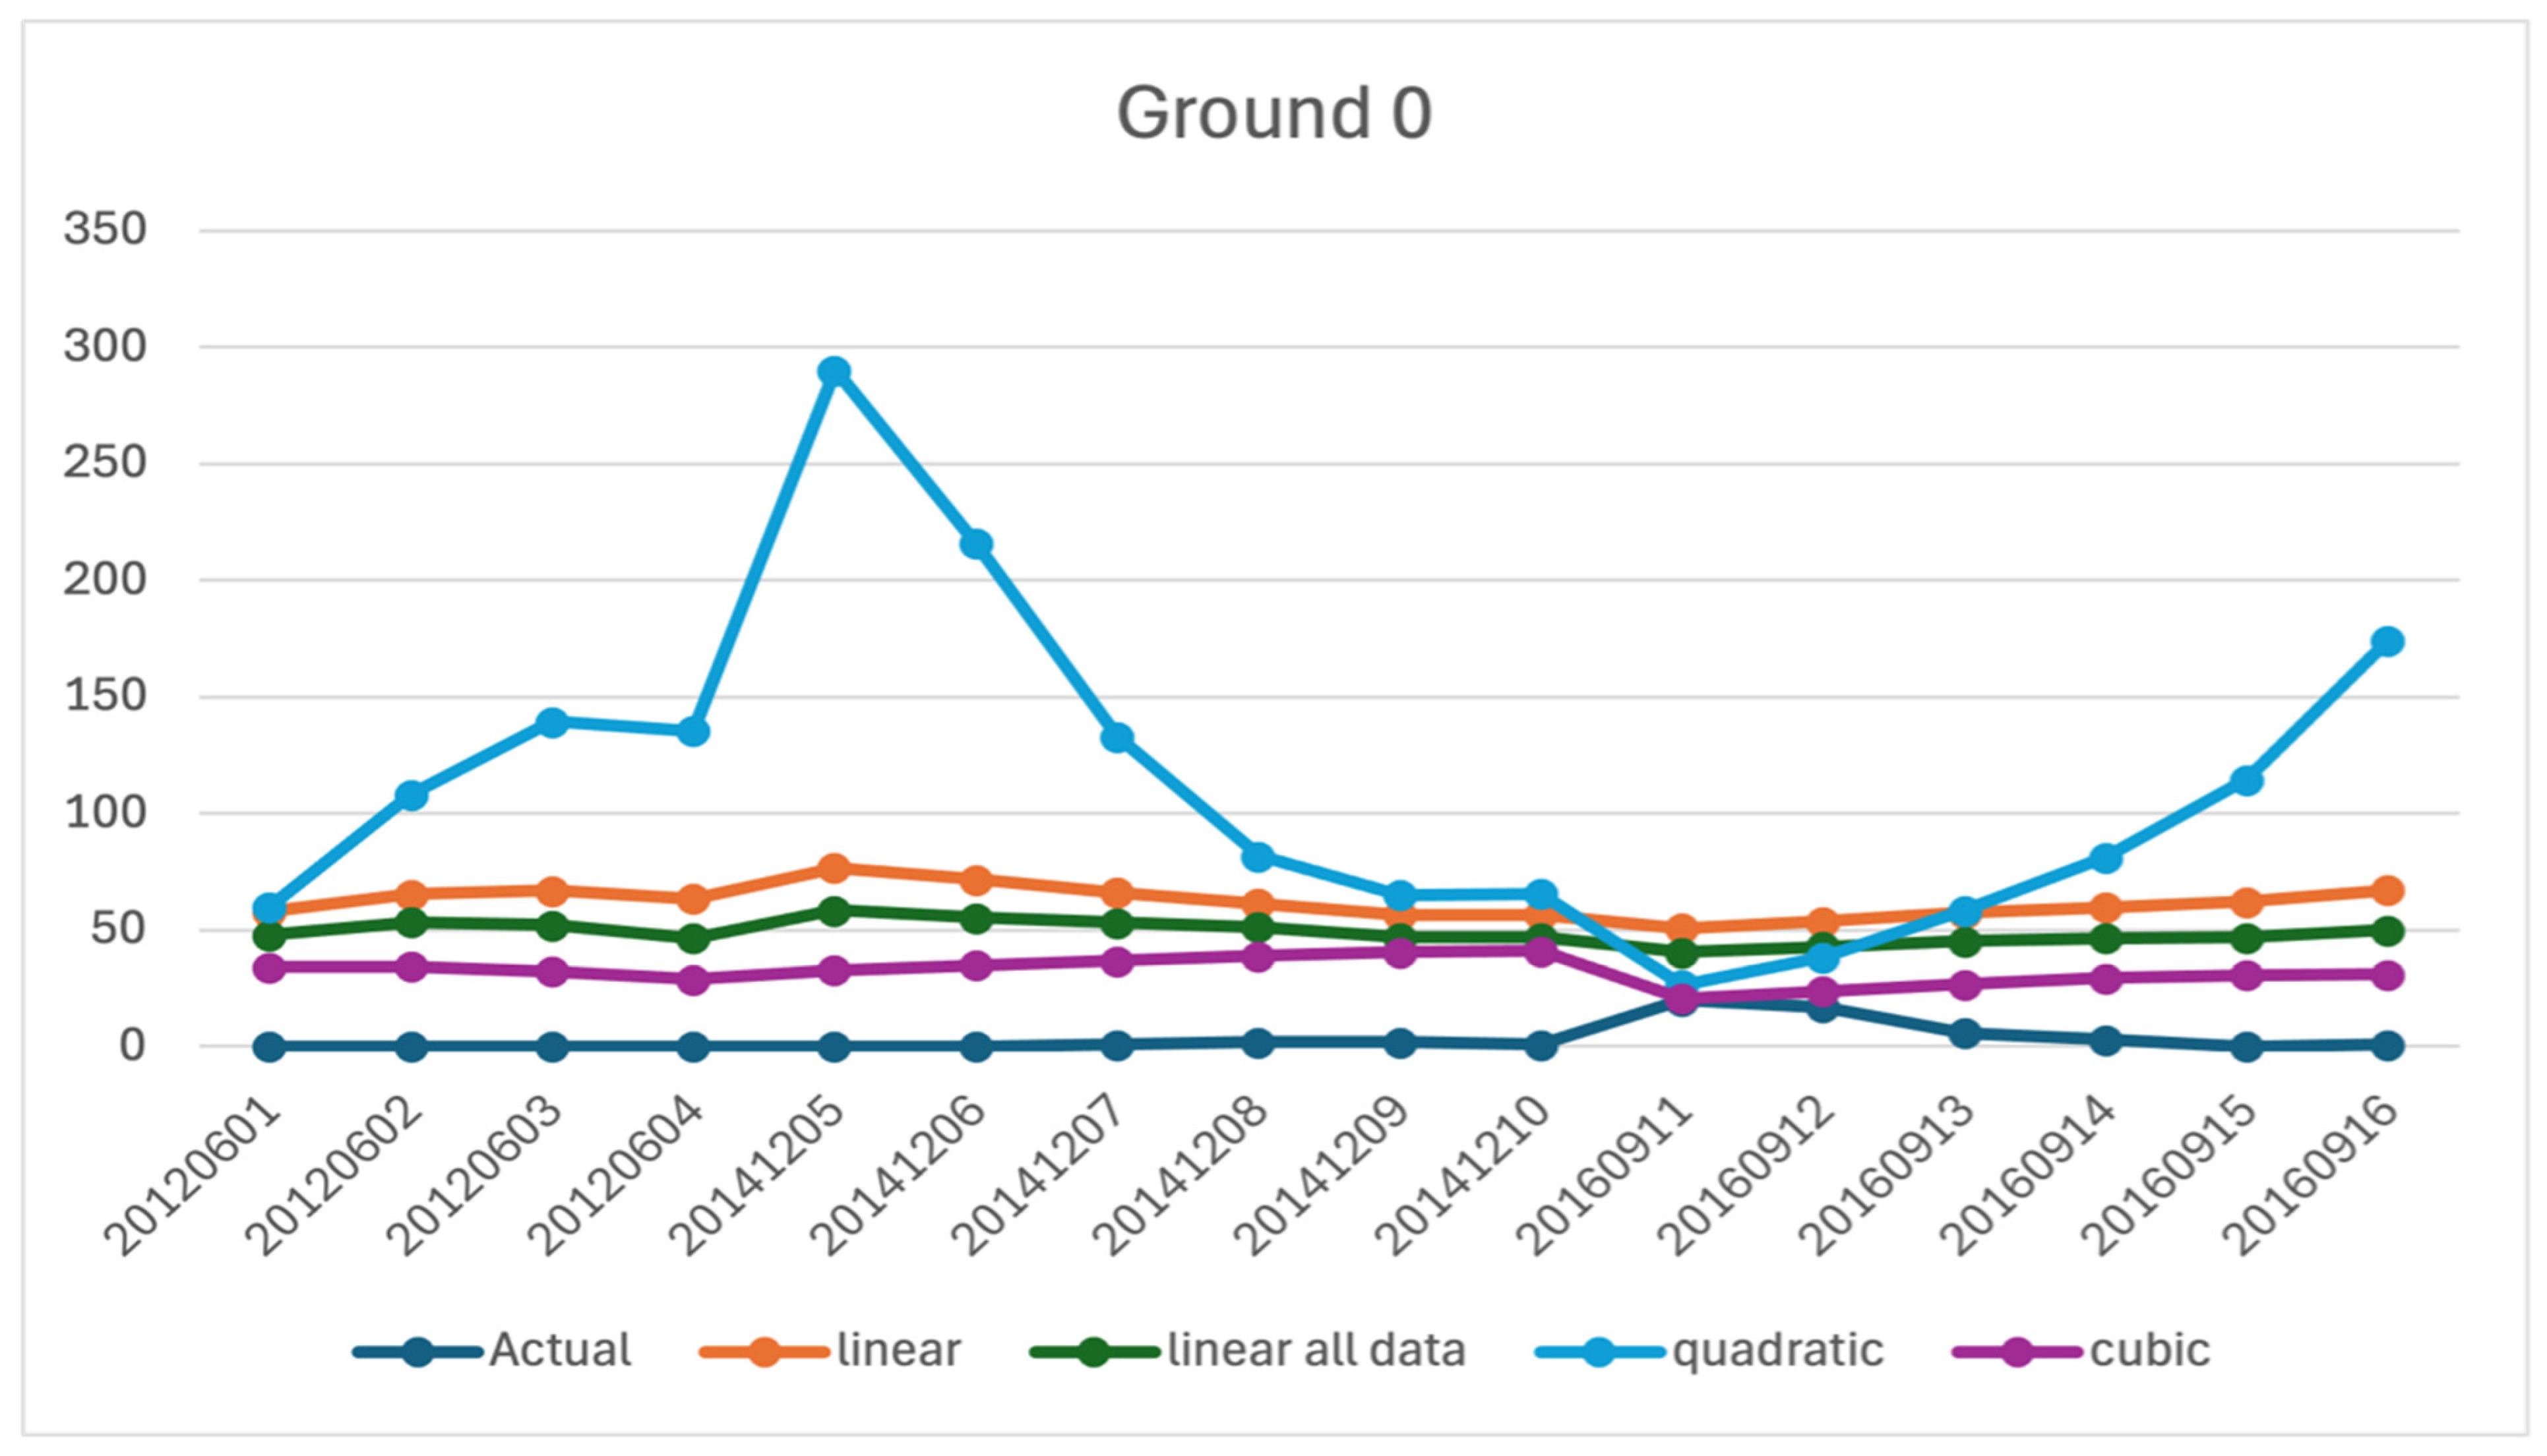
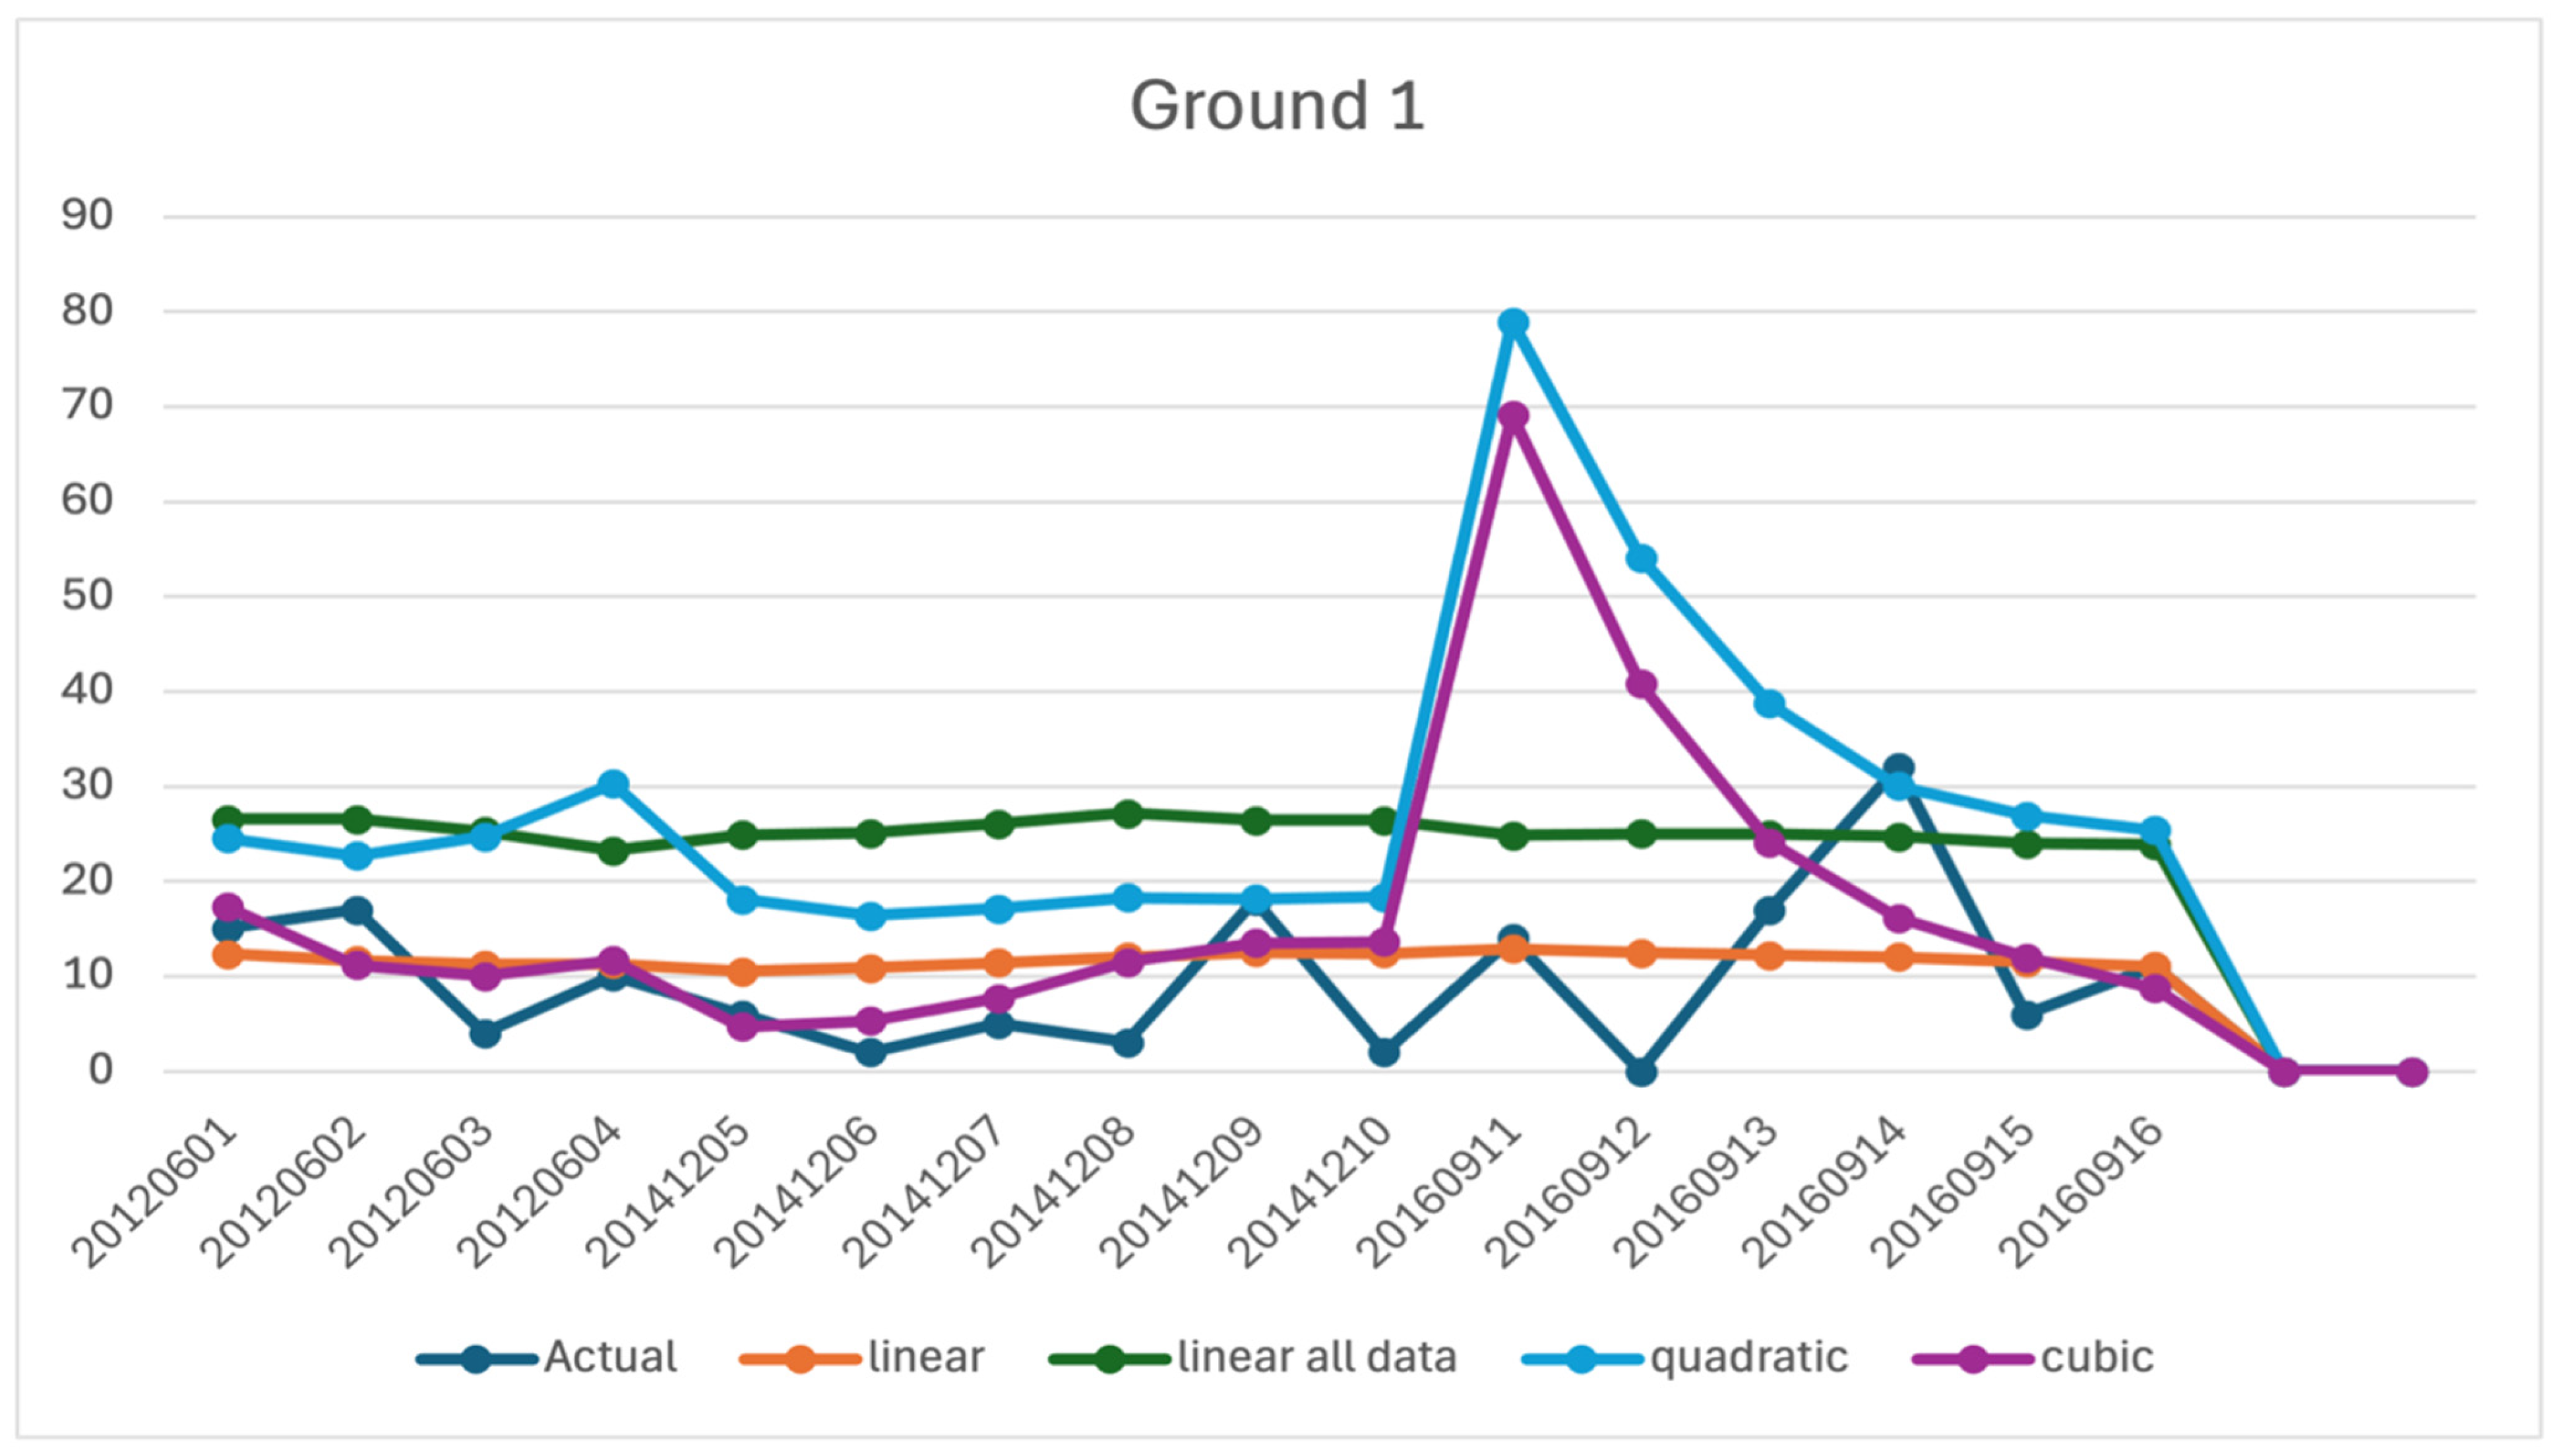
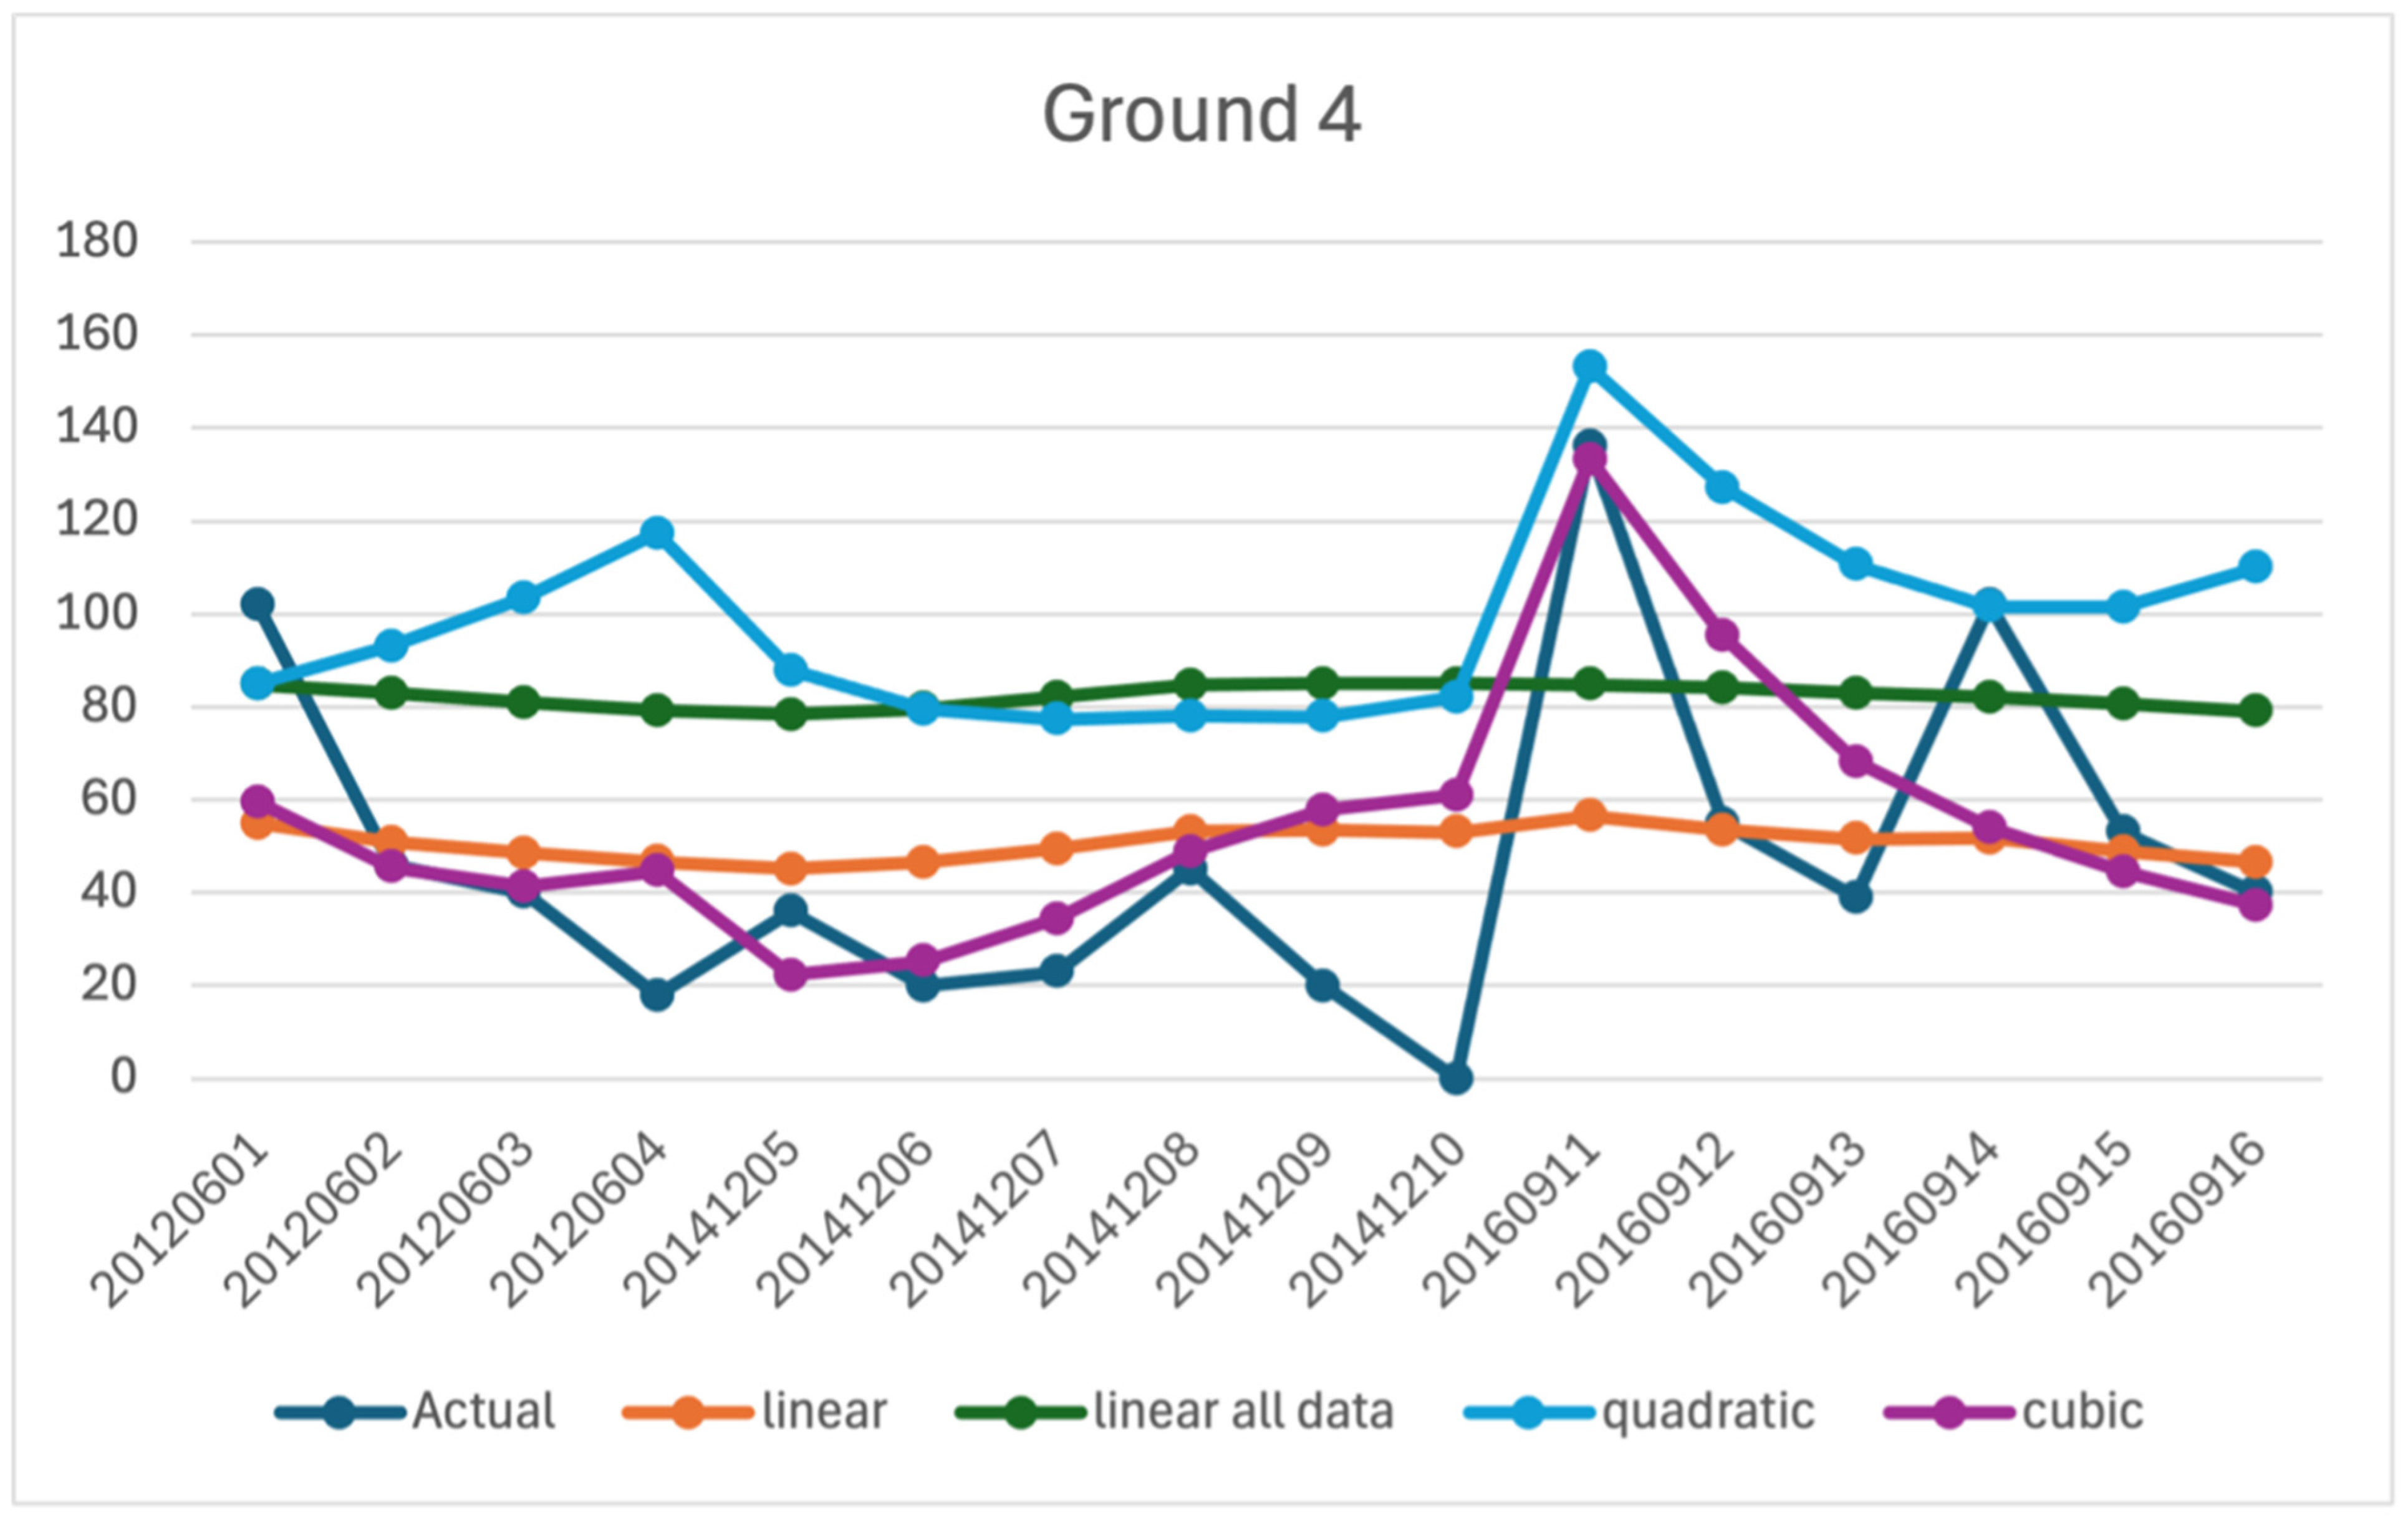
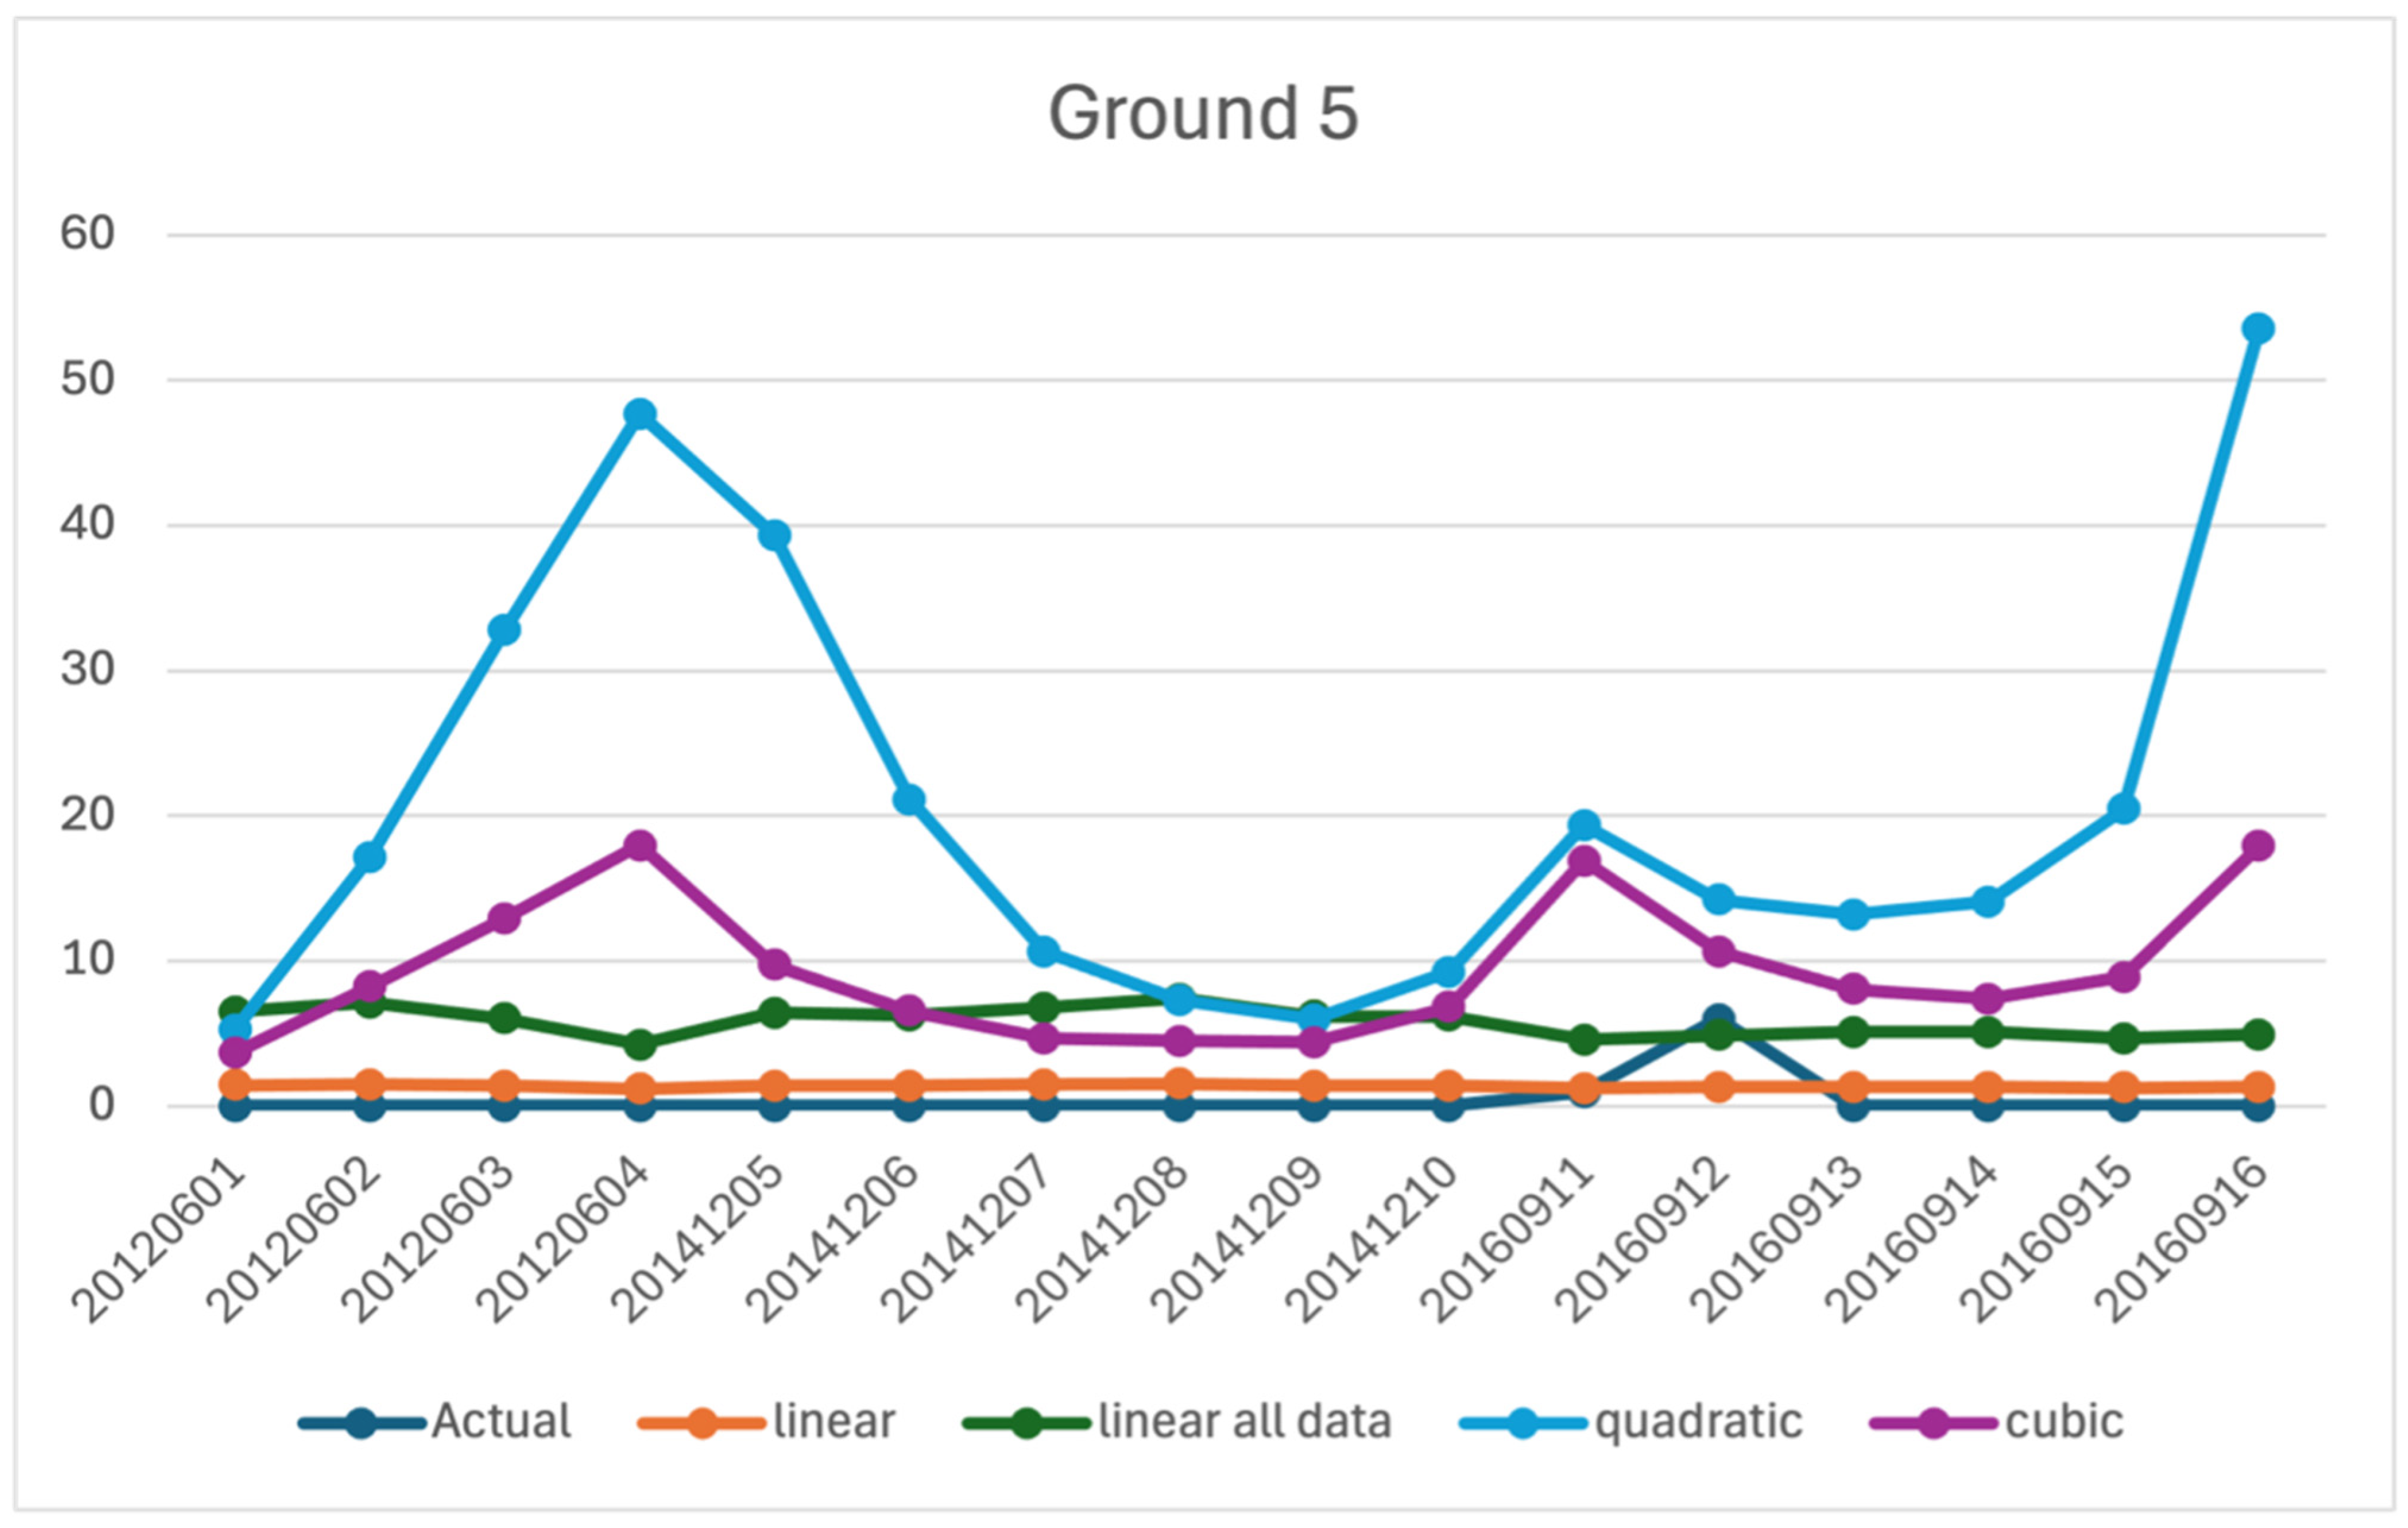
t. (A cubic relationship is used because it allows for greater flexibility in modeling nonlinear effects. Specifically, it enables the impact of wind speed on the number of boats to increase, decrease, and then potentially reverse direction again, capturing more complex patterns such as turning points in the response. The cubic model performs better than linear and quadratic models in our dataset; model comparison is provided in the
Appendix A. See also Emanuel for the original formulation of a cubic function for terrestrial damage associated with TCs [
35]). For example,
Table A1 in the
Appendix A shows the estimated cubic model results for all fishing areas in the Philippines. (As an illustration, we have selected several cyclones to estimate the drops in number of boats during the cyclone vis-a-vis the average number of boats during the last 30 days. These results are more fully described in the
Appendix A).
We use the estimated coefficients (βs) to calculate the predicted number of boats operating during cyclone events. Specifically, the coefficients are applied to observed storm parameters (storm translational speed, wind speed, and distance) and the results are compared to a baseline which accounts for the average number of boats recorded in the 30 days prior to each cyclone. This comparison allows us to estimate the change in fishing activity attributable to the cyclone, based on deviations from the immediate pre-cyclone fishing activity levels. (To ensure meaningful comparisons, we excluded fishing grounds with very low activity, i.e., those with a standard deviation of fewer than 10 boats over the baseline period, as they showed minimal variation in boat presence, indicating consistently low or no fishing activity).
Several validations methods were employed to determine the specification that will best capture the relationship between cyclone characteristics and fishing activity. Specifically, we use the Akaike Information Criterion (AIC) and the Bayesian Information Criterion (BIC).
Table A2 compares the AIC and BIC scores of linear, quadratic, and cubic models, with lower score values indicating better-fitting models. Additionally, in
Figure A1,
Figure A2,
Figure A3,
Figure A4,
Figure A5,
Figure A6 and
Figure A7, we compare the models’ boat count predictions for several TC events and fishing grounds (6 individual fishing grounds and also in all fishing grounds together) with actual data to visualize which model yields the most accurate predictions. Based on these validation methods, we chose the cubic model as it demonstrated the best overall fit, capturing the non-linear effects of wind speed and other cyclone characteristics on fishing activity.
5. Toolkit Design and Development
The toolkit provides an end-to-end solution for analysing the relationship between cyclones and fishing activity. It automates the entire process—from extracting fishing data from satellite imagery, integrating cyclone track, wind speed, and storm speed data, estimating the regression model described above, to generating outputs for various use cases. The toolkit handles data cleaning, processing, and model application, offering a workflow that requires no manual intervention and produces ready-to-use indicators valuable for emergency responders, policymakers, and researchers.
The toolkit is built entirely with open-source tools (Python and R), using publicly available data from VIIRS and IBTrACS. Its interface ensures that non-experts, including users with limited GIS expertise, can easily operate the tool. To maximize accessibility and user flexibility, the toolkit is available in two formats:
Standalone graphical user interface (GUI) application: Available for download at
https://drive.google.com/drive/folders/1ZYD-M4C-ra8Evb2W5l2rlbEhM-UskqYk (accessed on 6 November 2025), this version is designed for Windows users seeking a plug-and-play solution with minimal local setup. It features an intuitive interface built with PySimpleGUI, allowing users to select input parameters and analysis options with just a few clicks. The GUI handles all backend processing and visualization, with outputs, such as maps, summary tables, and interactive visualizations, saved in structured local folders. The underlying codebase is open and available on GitHub (
https://github.com/Nowcasting-Disasters?tab=repositories, accessed on 6 November 2025), ensuring transparency, reproducibility, and opportunities for further development.
Google Colab version: Also available at
https://drive.google.com/drive/folders/1ZYD-M4C-ra8Evb2W5l2rlbEhM-UskqYk (accessed on 6 November 2025), this cloud-based version is intended for advanced users who want to customize or extend the codebase. It runs entirely in the cloud with no local installation required, making it especially convenient for users with limited computing resources. The Colab version allows users to modify parameters such as country, year, cyclone season, filtering thresholds, and KDE values. Because it exposes the full processing logic and model configuration, this version is ideal for research and can be integrated into larger workflows or paired with additional datasets for cross-sectoral studies.
The toolkit supports two types of analysis, selectable via a radio button interface: (1) Historical analysis, which conducts a year-by-year assessment of fishing activity in relation to past cyclones, and (2) Nowcasting, which uses data from an ongoing or incoming cyclone to predict the expected number of boats likely to be fishing and compares this to the average during non-cyclone periods.
While both modules follow a similar underlying workflow, their visual outputs differ. The following sections describe each module in turn.
5.1. Historical Analysis
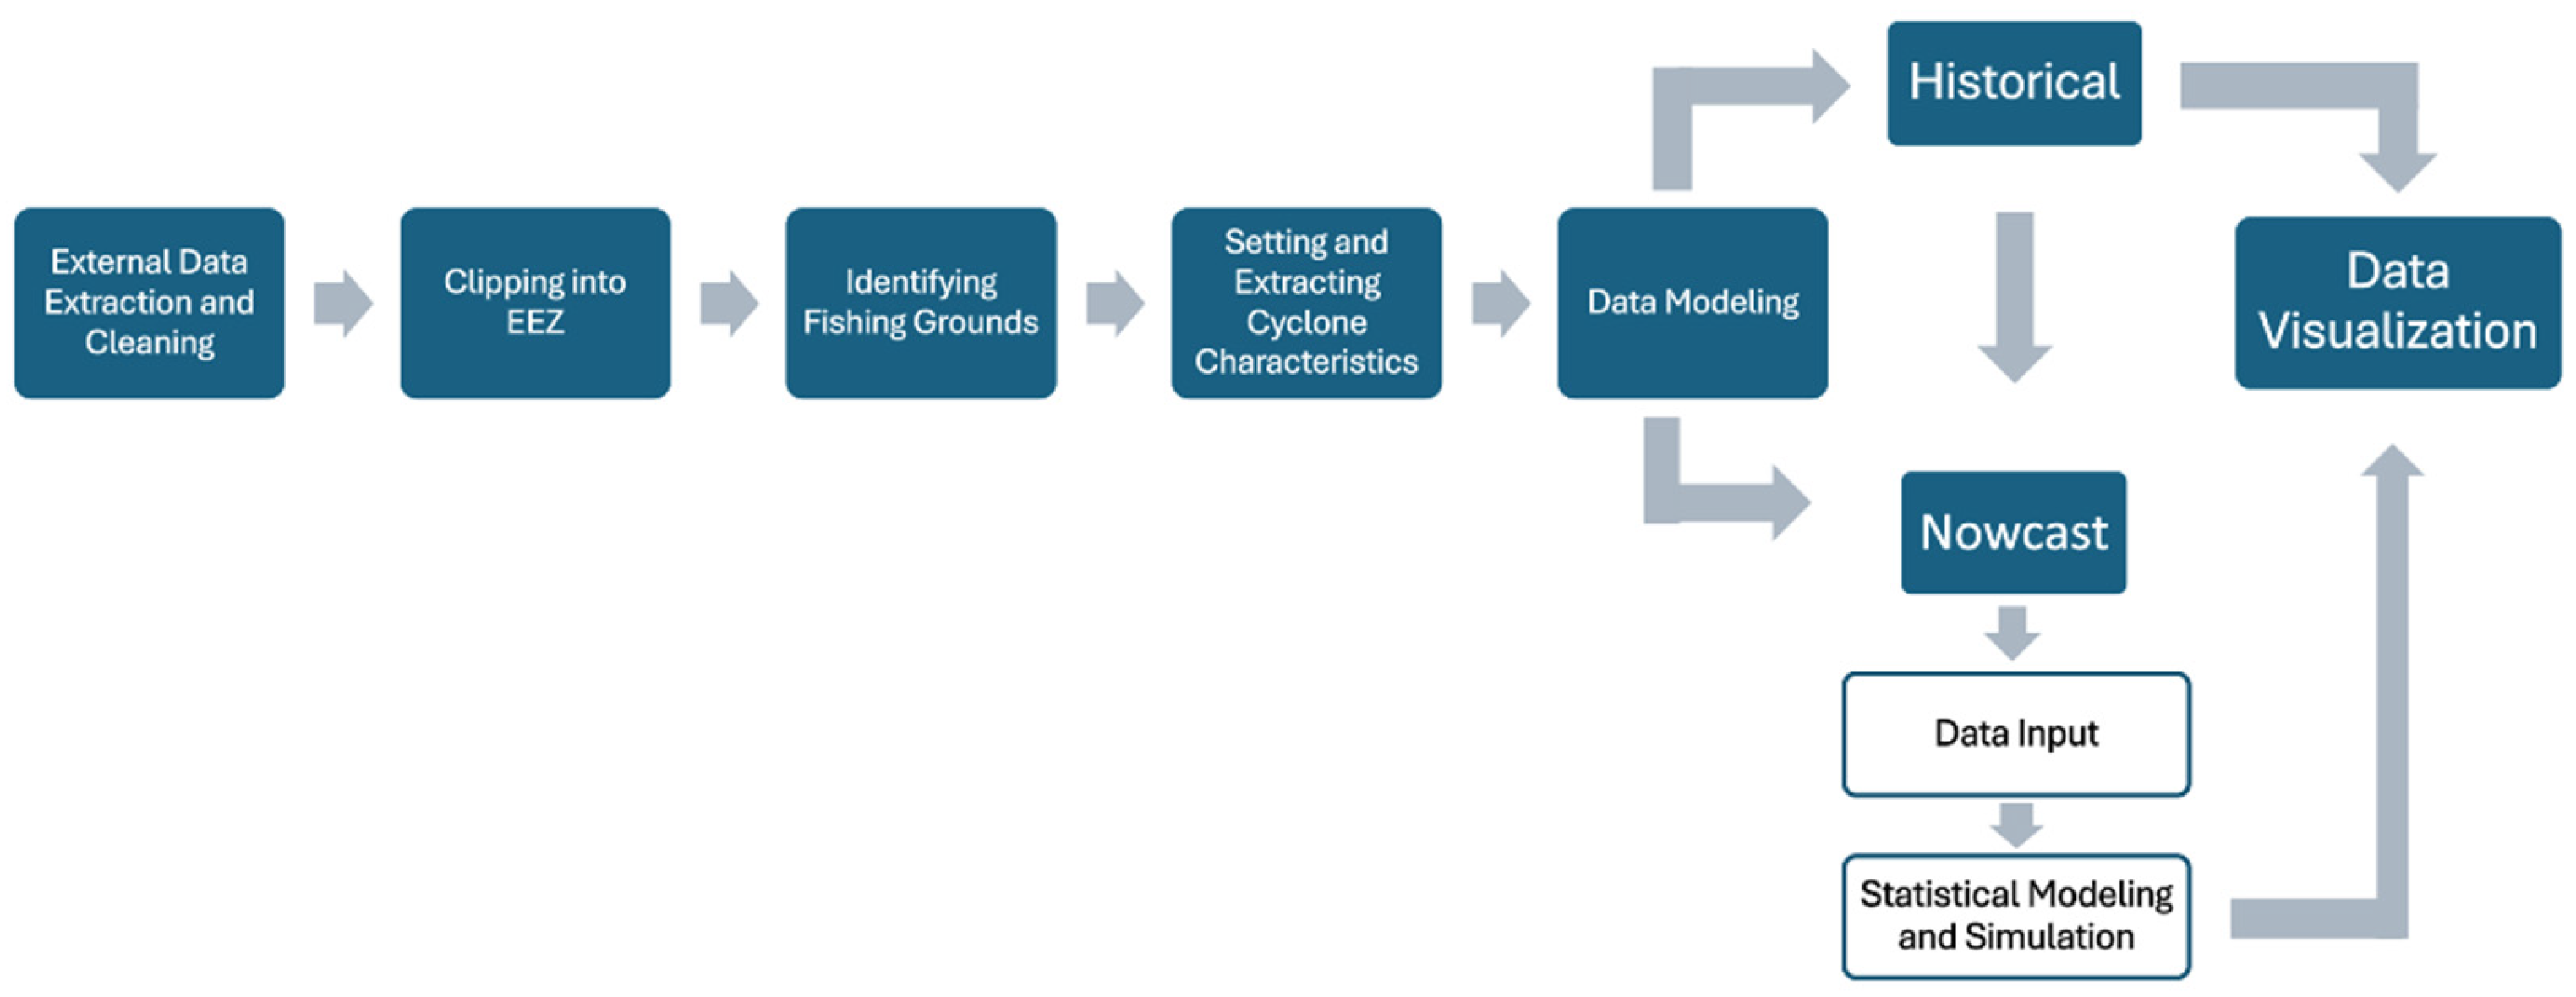
This module is designed to analyse one country-year at a time. It allows users to run the analysis for different countries or years, maintaining comparability across all outputs and enabling aggregation at various temporal and spatial scales. This module follows a structured six-step process to assess the impact of tropical cyclones on fishing activity (
Figure 4). These steps include extracting fishing and cyclone data, cleaning to remove null values and incomplete records, clipping the data to fit within the country’s EEZ, KDE processing, deriving key cyclone characteristics and applying statistical modelling, and finally, visualizing the results.
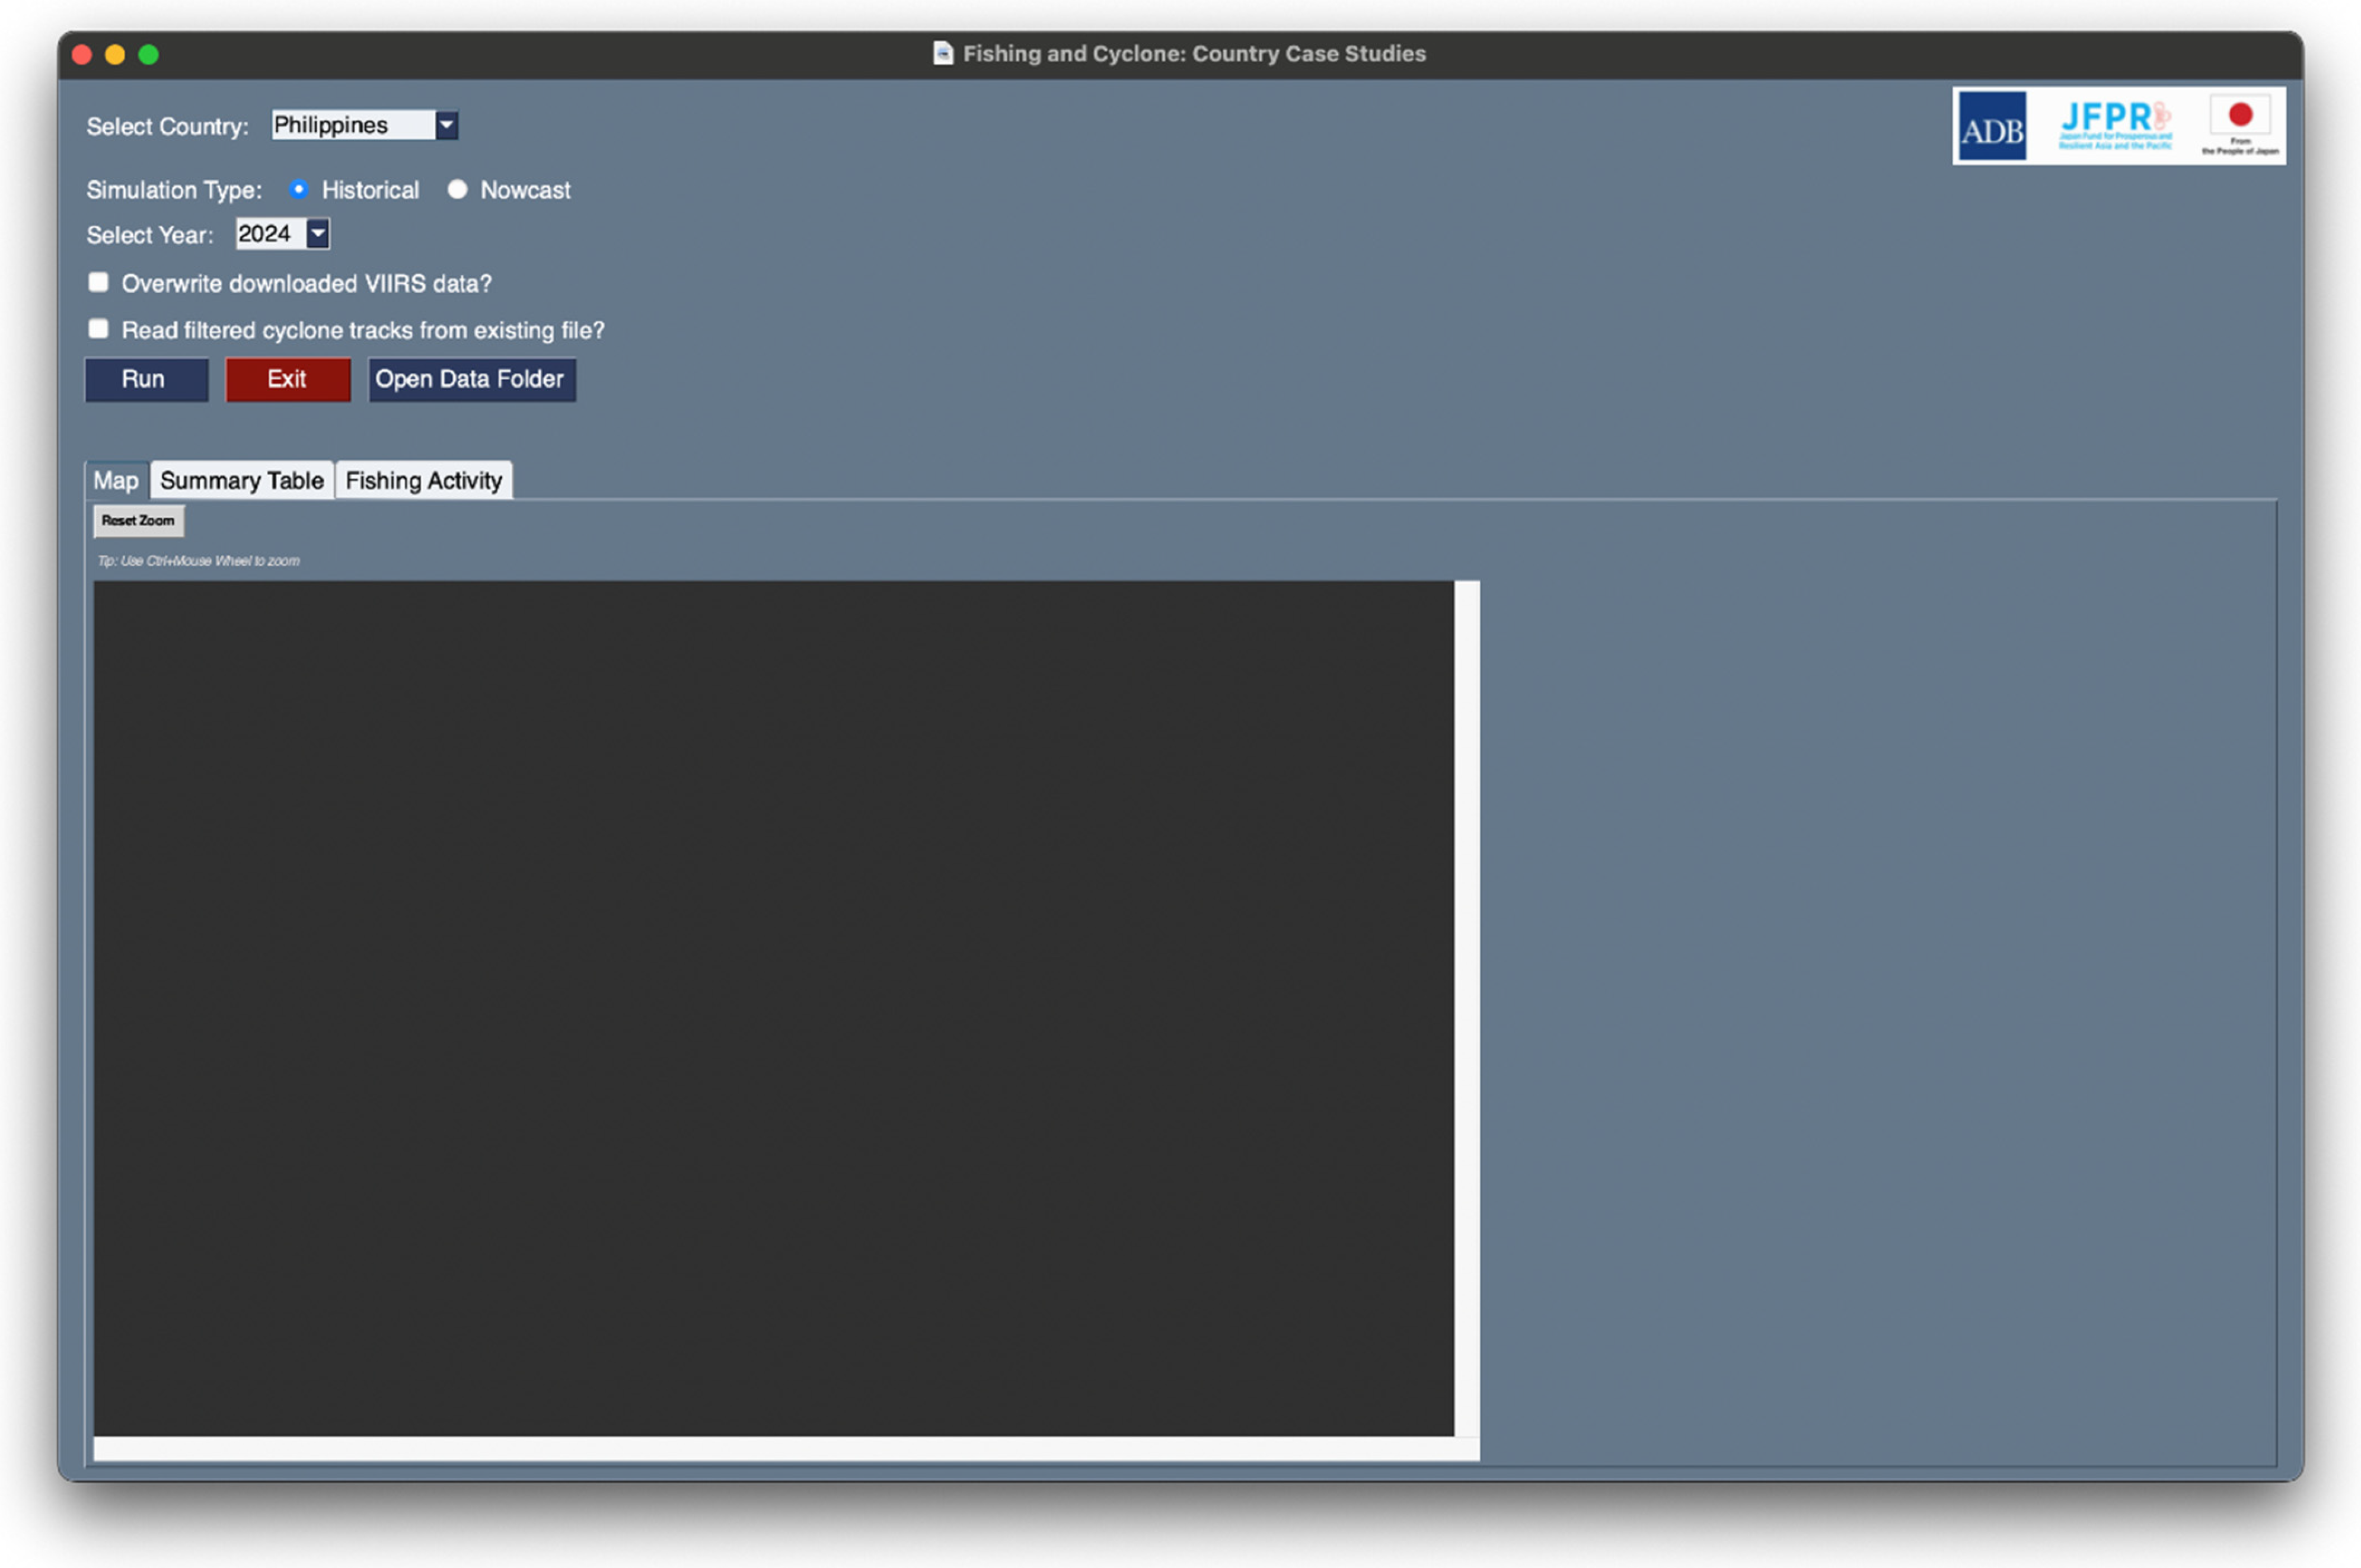
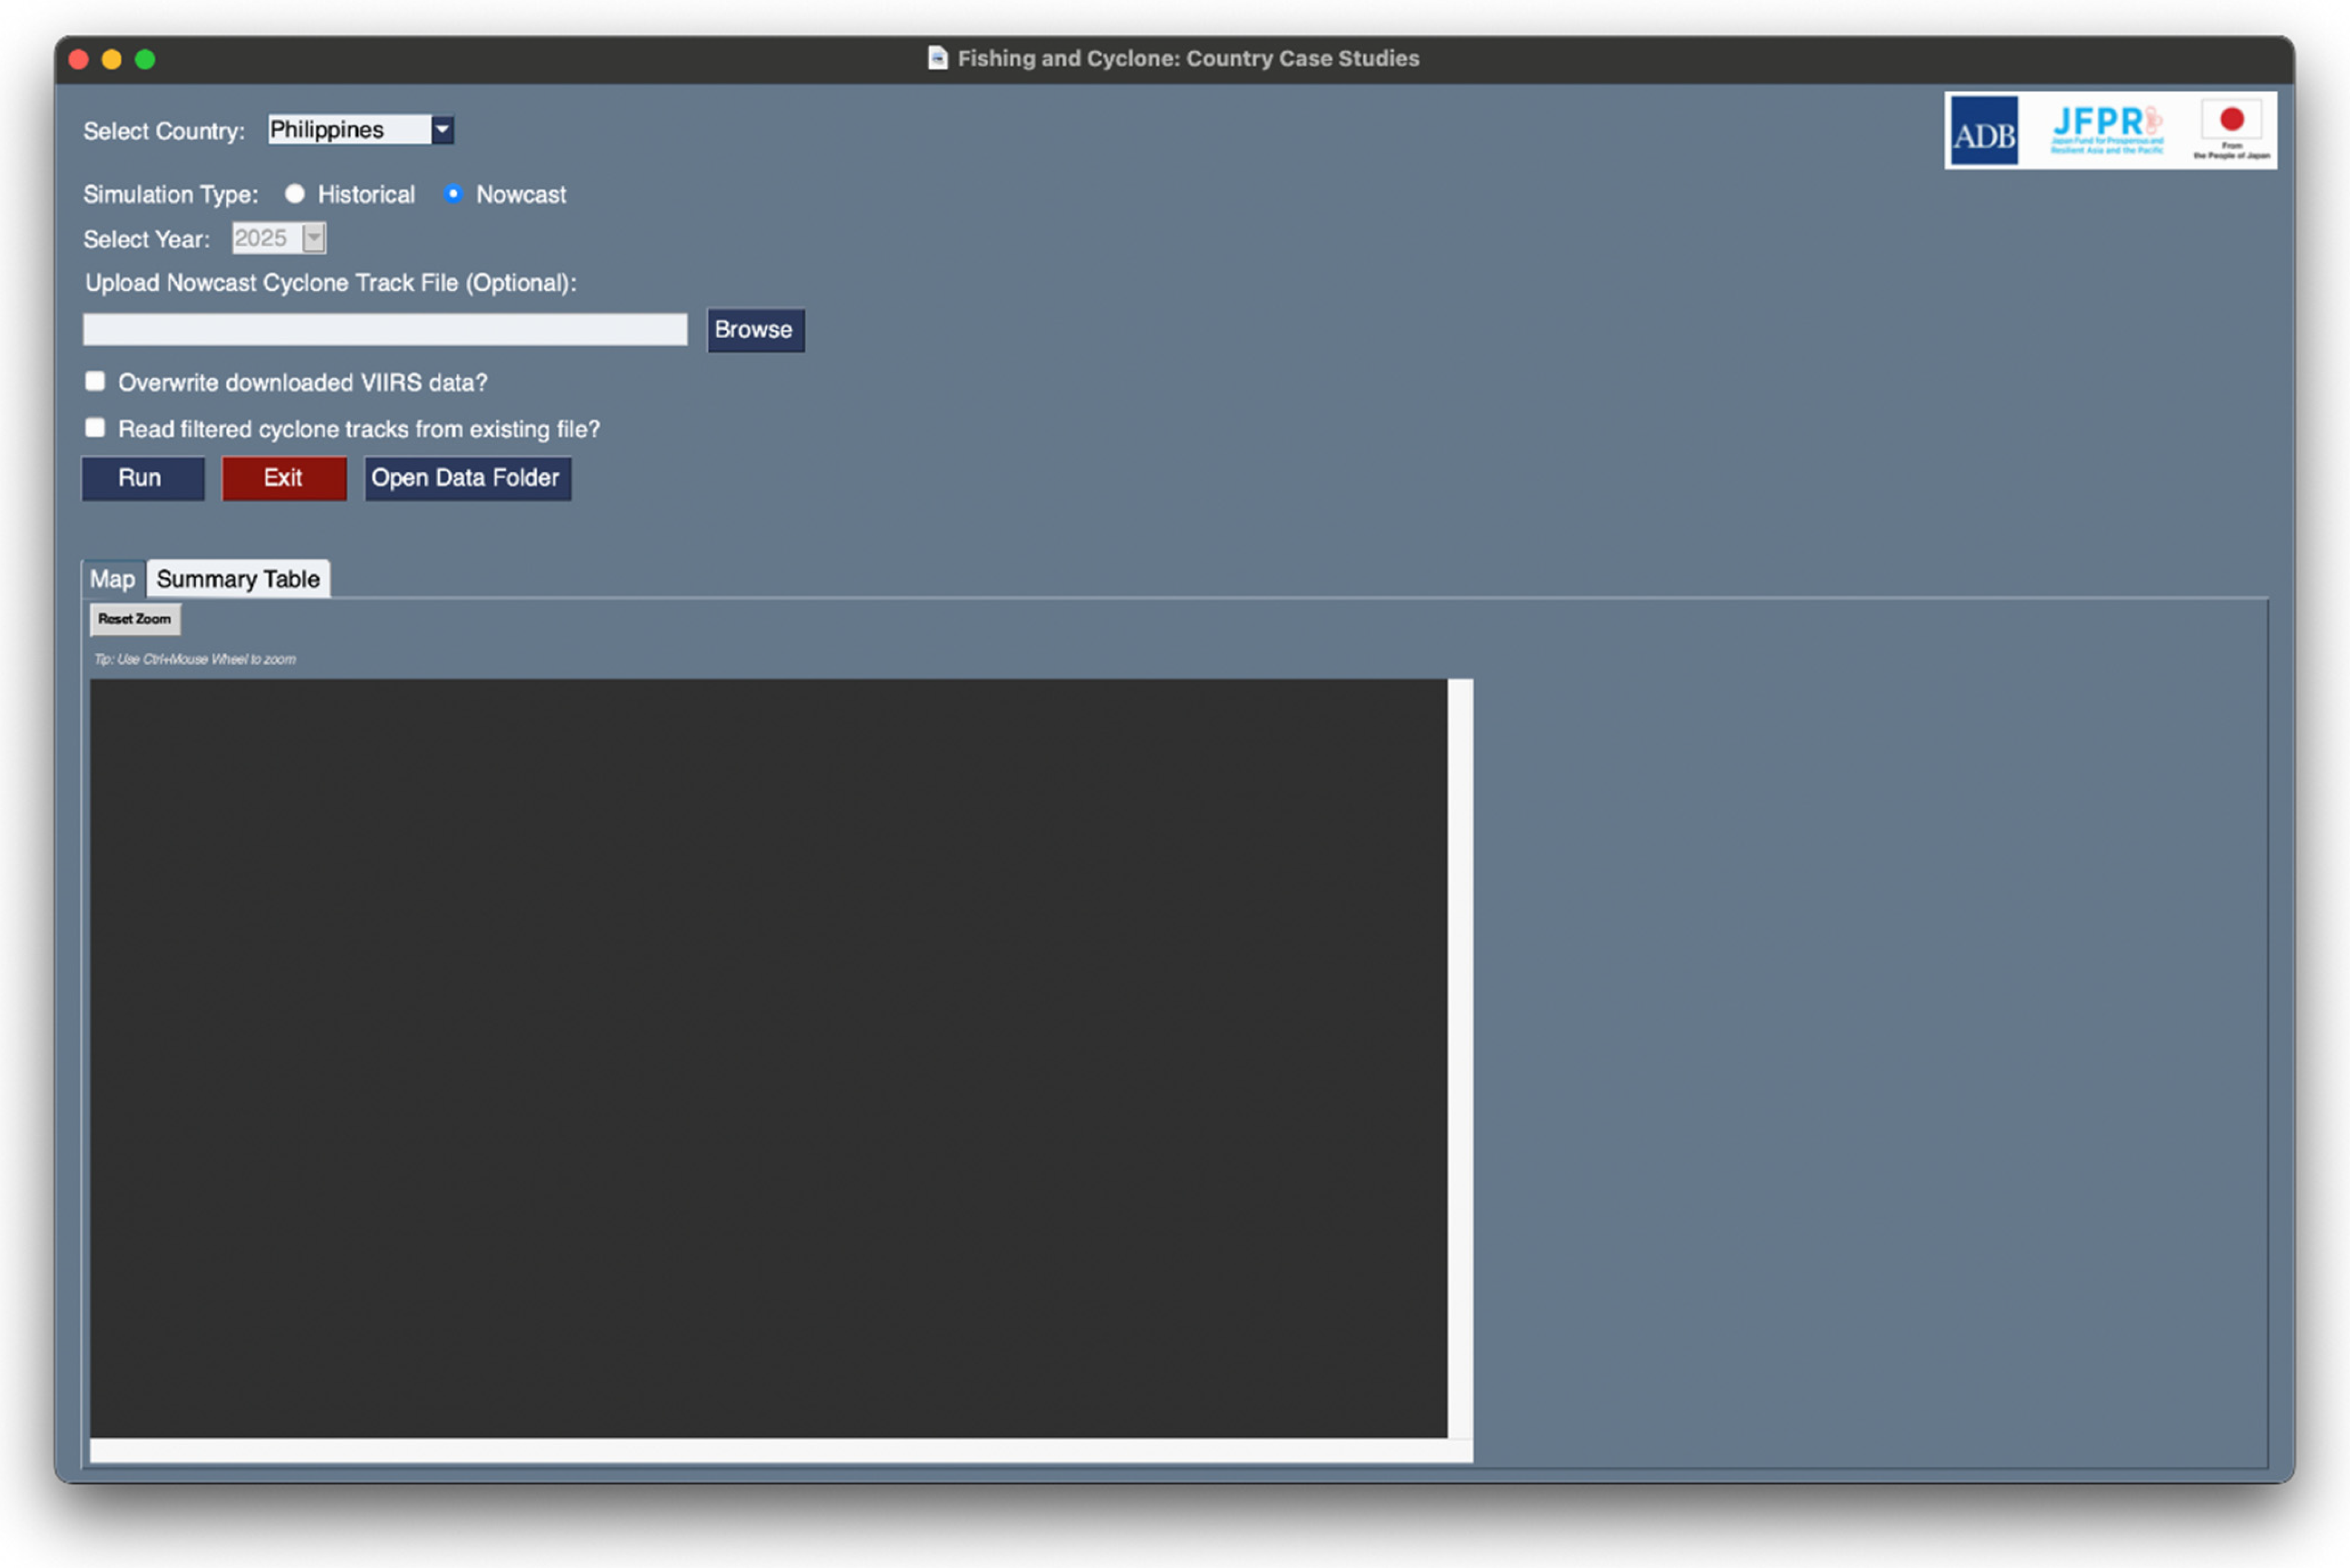
The analysis begins by allowing the user to specify a country and year (See
Figure 5). The tool then extracts daily data for the months during which the cyclone season is more active within that country’s maritime areas, focusing on VIIRS data that include each boat’s location and its timestamp. Cyclone track data from IBTrACS are also retrieved for the same period.
After extraction, the cleaning process prepares the data for analysis by filtering out irrelevant points and correcting any anomalies. This involves removing incomplete records, addressing inconsistencies-such as placeholder typhoon names (e.g., NO_NAME or UNNAMED), and applying the VIIRS-provided Quality Flags (QF) to ensure that only valid and relevant data are retained.
The results of the analysis are visualized using Python’s PySimpleGUI. These include maps showing the main fishing grounds derived from KDE, graphical representations of cyclone tracks and their proximity to these grounds, and quantified impacts of cyclones on fishing activity, such as changes in the number of boats during specific past cyclone events.
5.2. Nowcasting
The nowcasting module extends the toolkit’s functionality by allowing users to simulate fishing activity during ongoing, incoming, or hypothetical cyclone events. Unlike the historical analysis, which is based on year-specific past events, the nowcasting module allows users to input a cyclone scenario—either latest observation from IBTrACS or using synthetic data—and generate boat activity predictions using a pre-trained model. Its modular design supports multiple analyses of cyclone scenarios.
Building on the same framework as the historical analysis, this module adapts the workflow for predictive analysis (
Figure 6). It includes:
Selection for a cyclone track,
Spatial filtering to include only cyclones entering the country’s EEZ,
Extraction of key cyclone characteristics (e.g., location, maximum wind speed, and average storm translation speed),
Computation of minimum distance to the identified fishing grounds, and
Generation of predicted number of boats based on the model’s coefficients.
The predictions are passed to the visualization and output tabs, which display the results. These include maps of key fishing grounds, predicted boat activity during the nowcasted or hypothetical cyclone event, and comparisons with the average baseline fishing activity.
6. Generated Output
The outputs generated by the toolkit quantify how fishing activities respond to cyclone events. These outputs vary depending on the selected analysis mode, which users can choose via a radio button interface. Each mode yields a suite of outputs designed to support response planning, decision-making, and research.
6.1. Historical Analysis Mode
In the historical analysis mode, users select a country and specific year to assess fishing activity in relation to cyclones that occurred during that period. This retrospective analysis helps users identify patterns of disruption, evaluate exposure, and understand impacts of cyclones across multiple fishing grounds.
The outputs generated for this mode include the following described in the sections below.
6.1.1. Identification of Fishing Grounds
The fishing ground map provides a spatial depiction of key fishing areas within the user-selected country. The fishing grounds are generated using KDE applied to VIIRS-detected boat locations, after the data has been filtered to include only high-confidence vessel observations within the country’s EEZ and restricted to non-cyclone days within the defined cyclone season of a particular country. It serves as a baseline spatial footprint of fishing activity and is critical for contextualizing all other results. An example of the identified fishing grounds in Vietnam in 2024 is shown in
Figure 7.
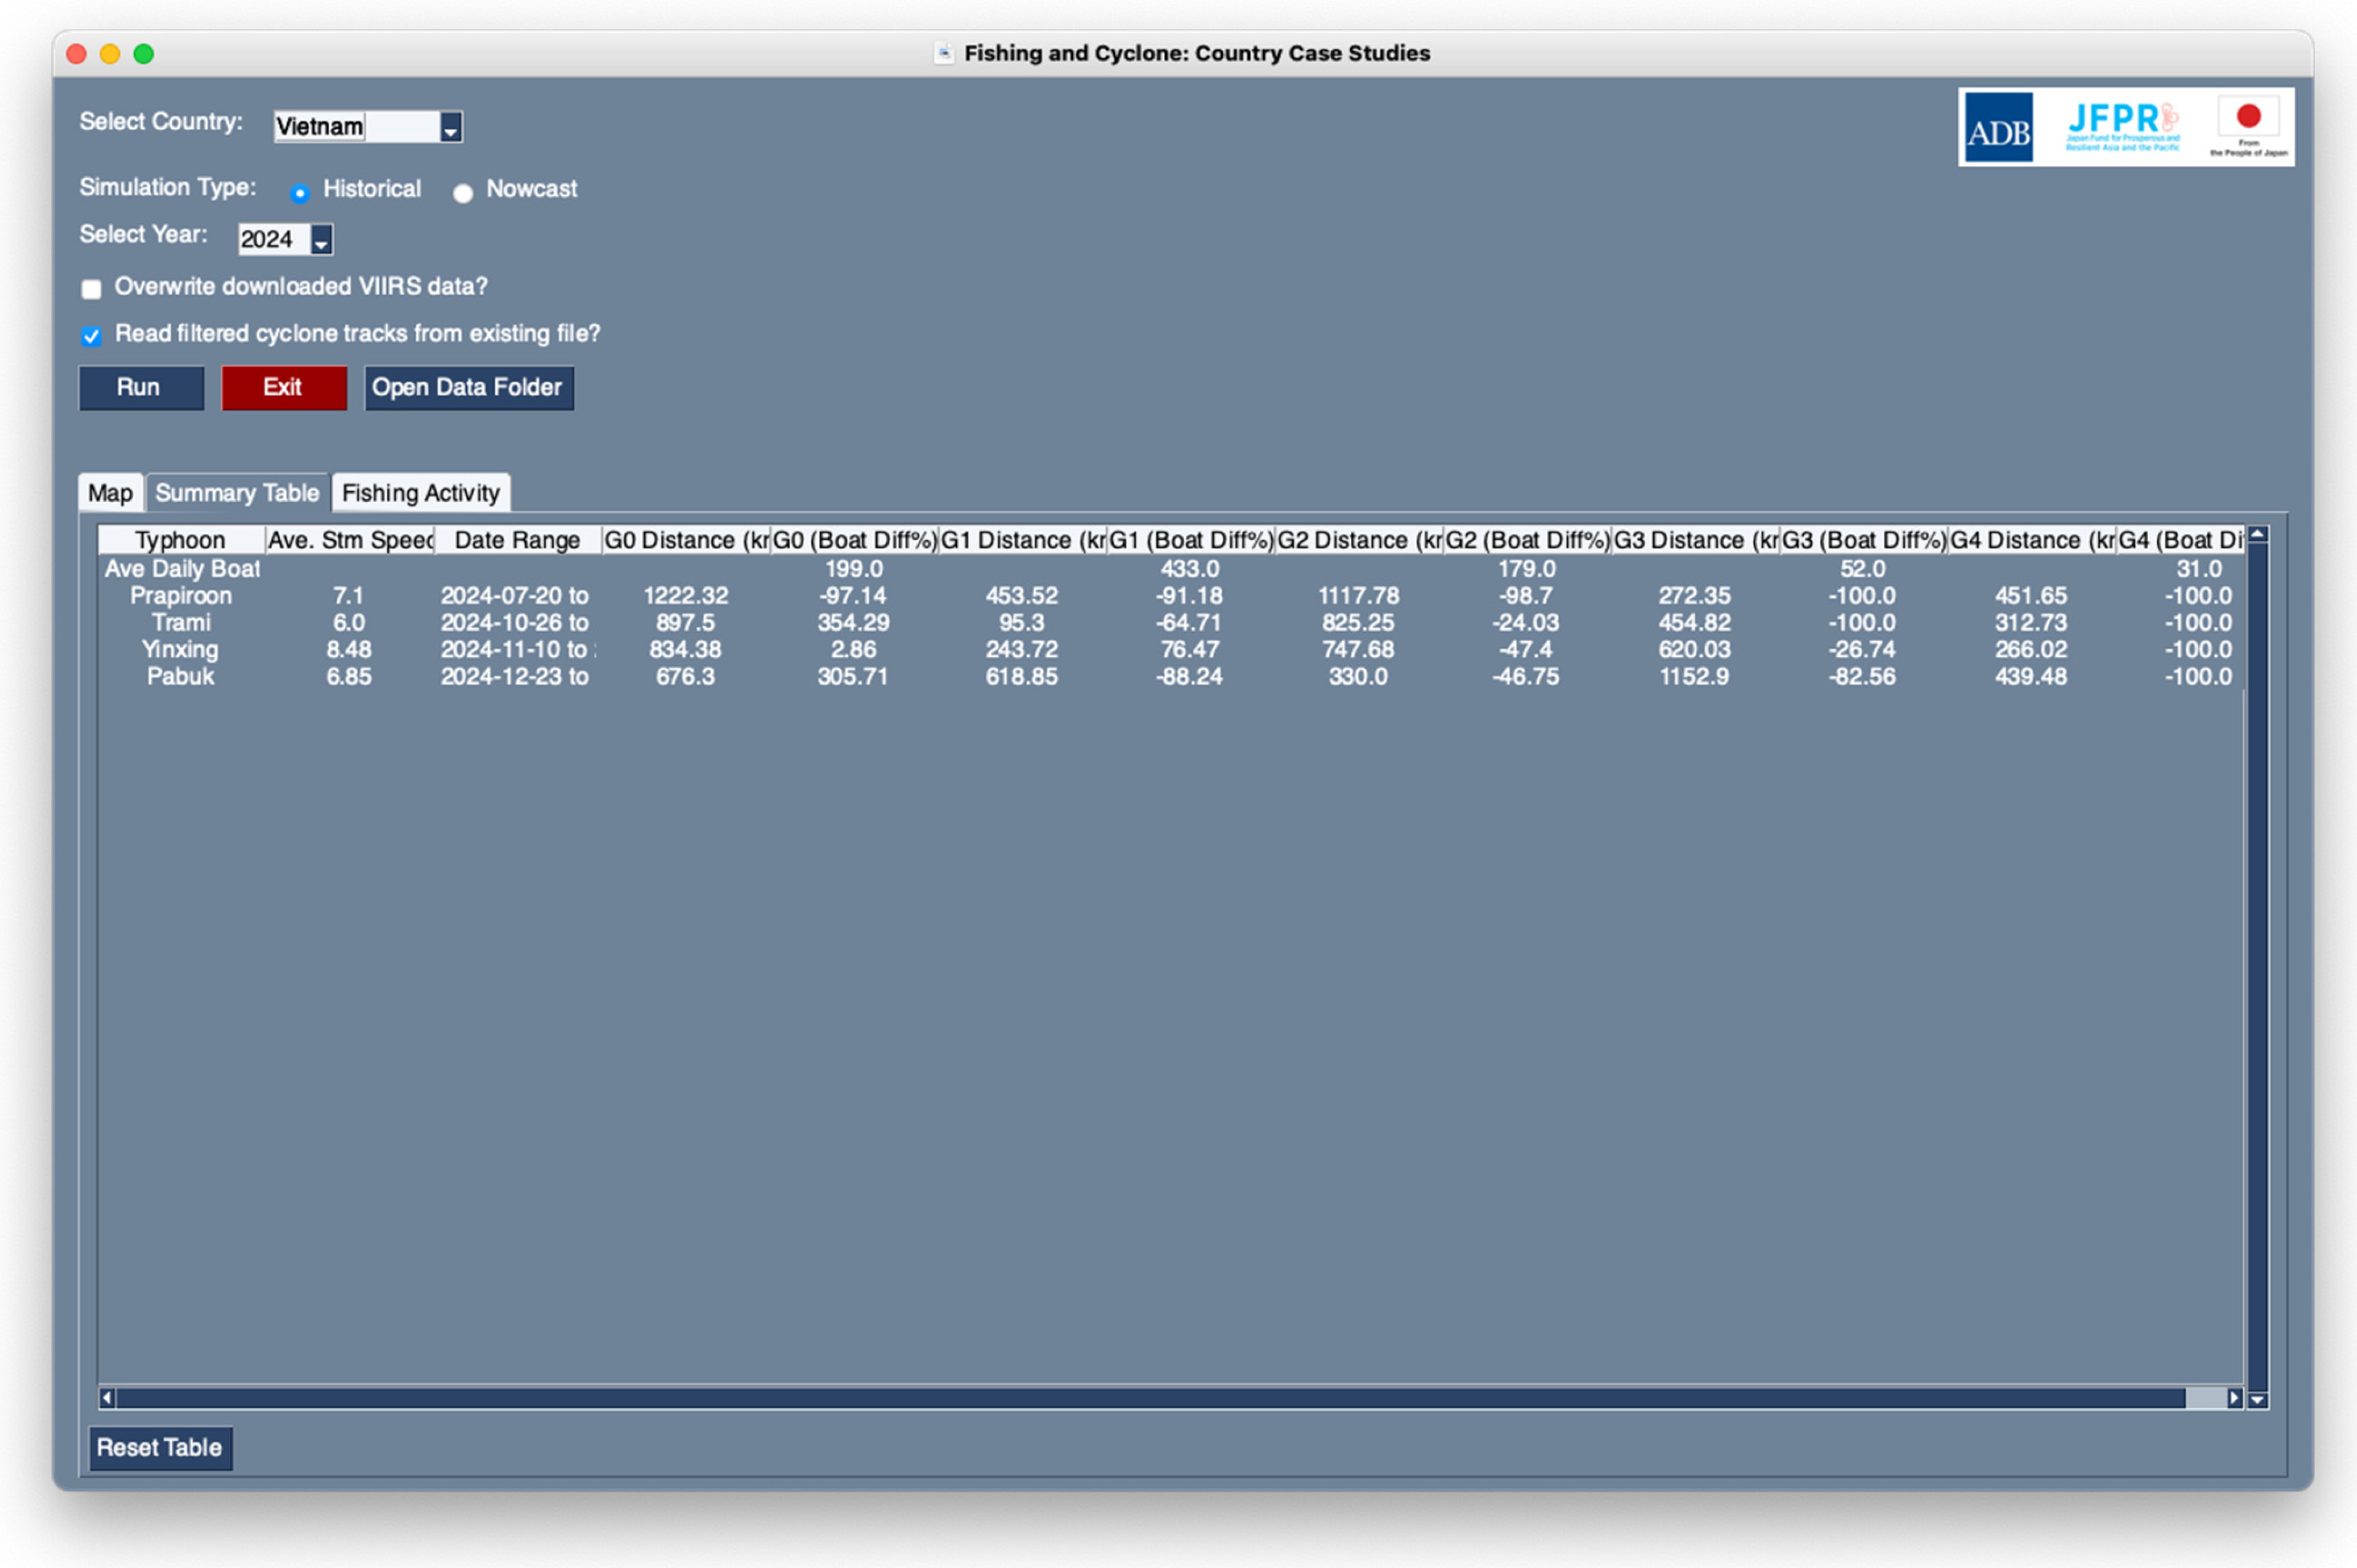
6.1.2. Summary Table Showing Boat Differences (In %)
The summary table provides a quantitative assessment of TC impacts on fishing activity for each cyclone event in the selected year. For every fishing ground affected by a cyclone, the toolkit calculates:
the average number of boats during non-cyclone periods
the number of boats detected when the cyclone was in proximity
the percentage difference between these values to compare fishing activity before and during the cyclone
This table offers a concise, at-a-glance overview of how fishing activity changes during cyclones. An example is provided in
Figure 8, which depicts the impacts of TCs on fishing activity in Vietnam in 2024. Quantifying these effects can help policymakers and researchers identify trends in vulnerability or resilience across different regions or years.
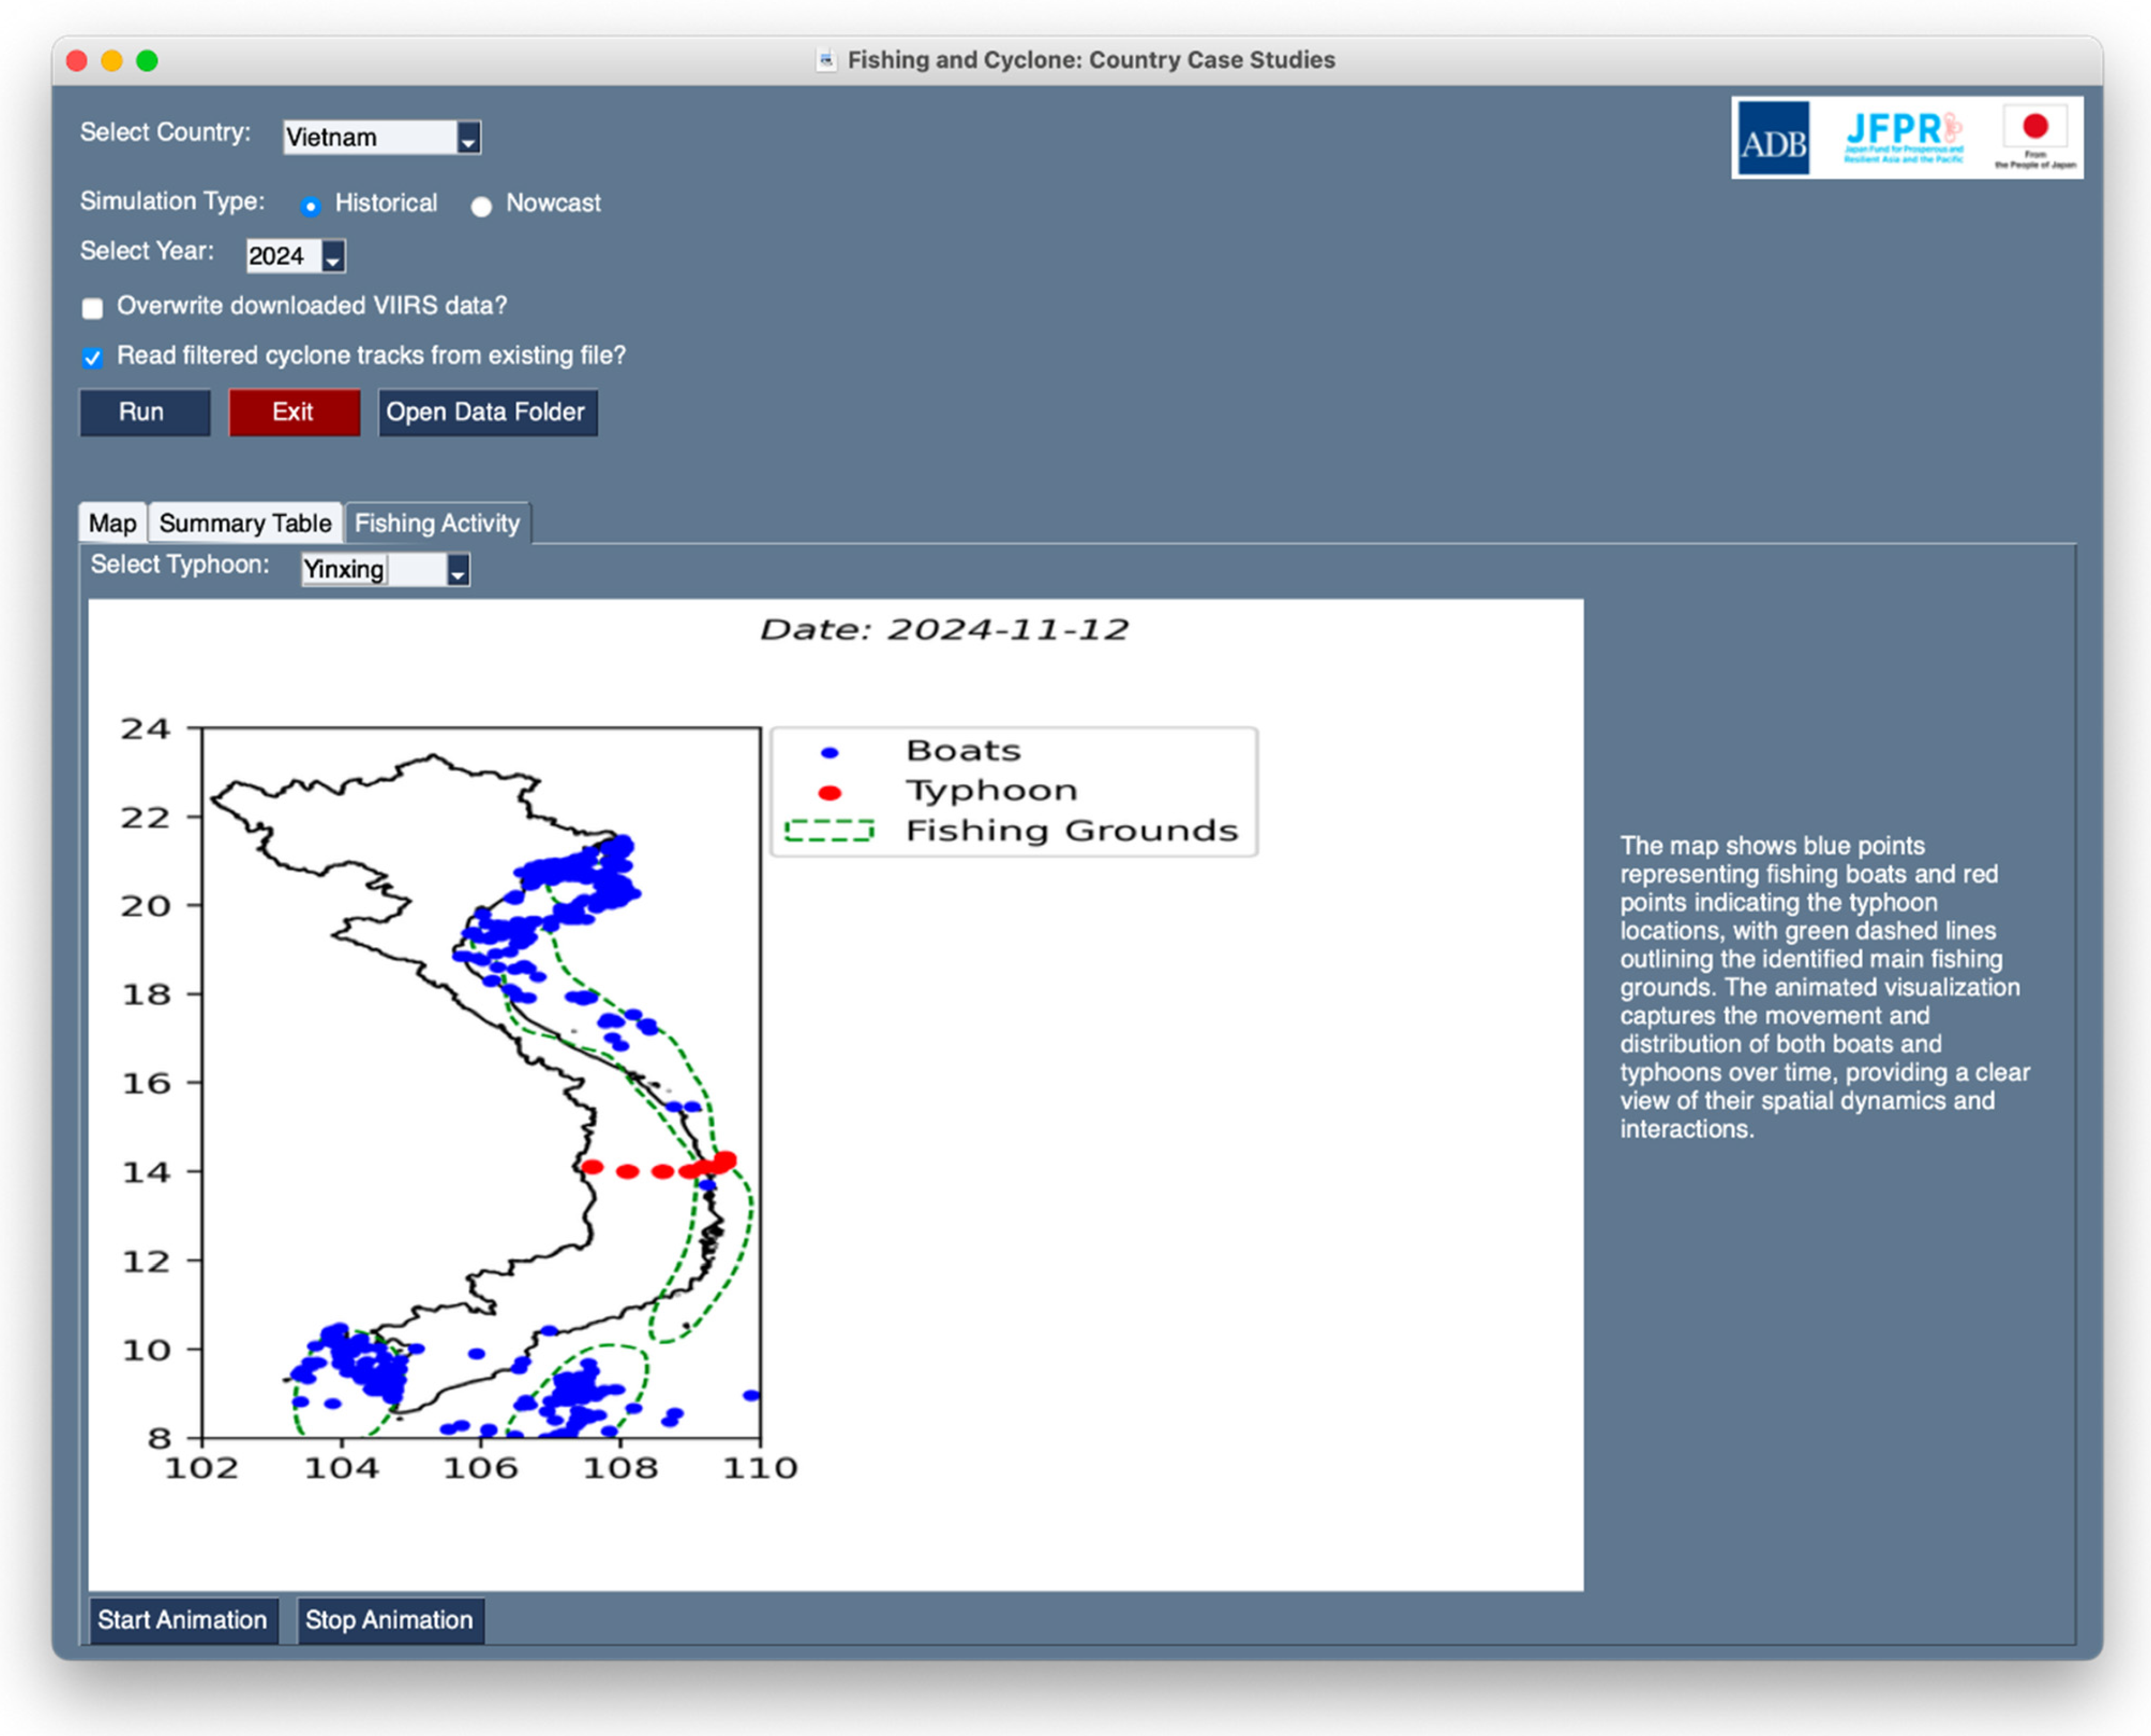
6.1.3. Boat and Cyclone Movement Visualization
This animated visualization tracks the movement of fishing boats and cyclone paths during the cyclone period (
Figure 9). It enables users to observe how fishing boats respond to cyclone movement, and how proximity of the cyclone influences boat distribution. This visualization includes time-stamped frames. This dynamic output is most suitable for communicating findings to non-technical stakeholders, including local governments and humanitarian organizations. It provides an intuitive way to demonstrate how fishing activity shifts in response to cyclone threats, and can inform early warning strategies, port readiness, and advisories for safe fishing operations.
6.2. Nowcasting Mode
The Nowcasting module enables users to either upload a cyclone track or use the latest observed cyclones from IBTrACS to predict the number of boats likely to be fishing. The toolkit applies the same cubic regression model, which is fitted on the historical data, to estimate the number of boats expected to be fishing during the specified cyclone event. The outputs for nowcasting use the historically derived fishing grounds from 2012–2024 VIIRS data to assess potential exposure during the nowcast scenario. This ensures that fishing grounds reflect long-term patterns. These predefined fishing grounds are then used to measure the cyclone’s proximity and compute expected impacts.
The model calculates the predicted number of boats during the cyclone based on cyclone characteristics such as distance to the identified fishing grounds, wind speed, and storm speed. As inputted by the user, the model predicts the number of boats likely to be fishing during the cyclone event. These values are compared against the historical average boat activity under normal (non-cyclone) conditions to estimate the reduction or deviation in fishing behaviour. These predictions offer a valuable way to understand the potential operational impacts of a cyclone before it fully develops or even enters the EEZ. The outputs, while more hypothetical, are similar to those provided in the historical module. They allow users to anticipate how fishing operations might be affected before a cyclone arrives, which can support early warning, readiness assessments, and risk communication for fisheries-dependent communities.
7. Policy Implications and Limitations
The identification of major fishing grounds shows where fishing activity is typically concentrated, presumably as these are the richer resources, and allows emergency planners and marine authorities to anticipate which fishing areas may be most disrupted during cyclone events. The ability to analyze historical changes in fishing activity resulting from TC occurrence across countries and years enables consistent, long-term tracking of how fisheries respond to cyclones and helps to identify patterns of exposure and vulnerability over time. This can contribute to evidence-based policy development and adaptation planning. Finally, the toolkit’s ability to nowcast or forecast likely changes in fishing activity based on forecasted or hypothetical cyclone scenarios enables authorities to anticipate disruptions before they occur and to evaluate alternative response or adaptation strategies. The nowcasting ability allows disaster managers to pre-allocate resources, issue early advisories, and plan temporary closures of vulnerable fishing grounds, helping to protect livelihoods and safety.
For policymakers, the scenario-based forecasts can improve long-term planning by informing on the ways in which changing storm patterns may affect fishing activity. Depending on the availability of other novel assessment methods and datasets, this can consequently lead to more detailed assessments of fisheries productivity and help analyze impacts on food security. Ultimately, the forward-looking capability of the toolkit supports a shift from reactive disaster responses to proactive risk management and long-term adaptation. As the toolkit is open-source and automated, the training demands are modest and could be met through short in-person or online workshops without the need for personnel with a high level of technical expertise.
It is important to emphasize that the toolkit’s outputs are subject to uncertainties and limitations associated with the used data and statistical models. Nighttime light satellite data can be subject to various detection errors, and because they mainly detect bright, offshore lights from larger vessels, they may bias the fishing activity estimates against small-scale fishers who are more likely to operate near shore and use little to no lighting. (A similar bias of underestimating fishing activity for small vessels may be present in analyses which employ AIS data such as Fang et al. [
10], as only ships of certain tonnage are obligated to install AIS). The toolkit’s nowcasting capability is based on the historical relationship between cyclone occurrence and fishing activity, but this relationship may not hold over longer time spans if changes in fishing technology and infrastructure or other factors alter how fisheries respond to cyclones over time. The analysis of the historical relationship may have also been influenced by confounding factors, and additional uncertainty is introduced by the structural uncertainty of the chosen statistical model. The analysis only considers the effects on major fishing grounds, and it is possible that the fishing boats displaced from the fishing ground choose to fish in a safer area outside of the identified fishing ground.
Presently, the toolkit’s estimates should be interpreted as indicative and decisions based on its outputs should ideally be supplemented with additional data sources, expert judgment or local knowledge. Continued refinement and calibration based on larger datasets and integration with ground-truth data will be essential to further validate and enhance the accuracy and reliability of the toolkit. Future iterations of the toolkit would benefit from an inclusion of uncertainty quantifications, e.g., with probabilistic forecasting methods such as bootstrapping or Monte Carlo simulations. VIIRS boat detection uncertainty could also potentially be quantified using AIS or ground-survey data. Currently, the tool can estimate the reduction in the number of boats. In the future, the toolkit’s usefulness could be enhanced by the integration of catch data, so that it can better inform on actual fisheries’ production. The toolkit depends on data sources that are currently publicly available but may not be so readily available in the future, as they depend on government funding.
Our work highlights the critical need for continued investment in open, high-frequency data to support the vulnerable fishing sectors as the risk of cyclones increases because of climate change [
36]. With better data and further research, we will learn more about the impact of cyclones on fisheries and the communities which depend on them. This knowledge can then result in more effective disaster risk reduction and climate change adaptation policies. We believe the toolkit developed here is a step towards that goal.
Author Contributions
Conceptualization, I.N. and M.P.; methodology, all authors; software, D.F.A., P.V. and M.L.; resources, M.P.; data curation, D.F.A. and P.V.; writing—original draft preparation, M.L. and P.V.; writing—review and editing, all authors; funding acquisition, M.P. All authors have read and agreed to the published version of the manuscript.
Funding
This research was funded by the Japan Fund for Prosperous and Resilient Asia and the Pacific (Government of Japan) through the Asian Development Bank.
Institutional Review Board Statement
Not applicable.
Informed Consent Statement
Not applicable.
Data Availability Statement
Links to all the data and code used in this work are provided in the text.
Acknowledgments
The authors thank Melanie Grace Quintos and Tom Uher for valuable research assistance. The authors have reviewed and edited the output and take full responsibility for the content of this publication.
Conflicts of Interest
The authors declare no conflicts of interest. The funders had no role in the design of the study; in the collection, analyses, or interpretation of data; in the writing of the manuscript; or in the decision to publish the results.
Appendix A
Table A1.
Regression Coefficients for Fishing Grounds: A Philippine EEZ Example.
Table A1.
Regression Coefficients for Fishing Grounds: A Philippine EEZ Example.
| | All Fishing Grounds | Ground 0 | Ground 1 | Ground 3 | Ground 4 |
|---|
| Intercept | 5.767794 *** | 3.862524 *** | 2.824298 *** | 4.140008 *** | 4.216685 *** |
| distance | NA | −0.000233 | 0.000638 *** | 0.001268 *** | 0.000409 *** |
| windspd | 0.000796 | −0.000301 | −0.014819 | −0.014269 | −0.010676 |
| windspd2 | 0.00006 | 0.000157 | 0.000173 | 0.000184 | 0.000148 |
| windspd3 | −0.000001 | −0.000001 | −0.000001 | −0.000001 | −0.000001 |
| trans | −0.008364 | −0.006981 | 0.001755 | −0.020501 | −0.002017 |
| AIC | 6404.727296 | 4382.42638 | 4007.261621 | 5077.960484 | 5143.172422 |
| BIC | 6429.719803 | 4411.584305 | 4036.419546 | 5107.118409 | 5172.330347 |
| RMSE | 260.748478 | 90.688969 | 19.556348 | 89.752493 | 56.240244 |
| PseudoRsq | 0.1435 | 0.2211 | 0.7852 | 1.2889 | 0.3293 |
Table A2.
AIC and BIC for linear, quadratic, and cubic models.
Table A2.
AIC and BIC for linear, quadratic, and cubic models.
| Linear | AIC | 6,407,612,453 | 4,383,143,534 | 4,004,266,688 | 431,723,228 | 5,077,428,511 | 5,140,293,321 | 2,292,130,850 |
| | BIC | 6,424,274,124 | 4,403,970,624 | 4,025,093,778 | 452,550,318 | 5,098,255,600 | 5,161,120,411 | 2,312,957,939 |
| Quad. | AIC | 6,403,355,097 | 4,381,238,384 | 4,006,119,912 | 433,720,209 | 5,077,117,759 | 5,141,978,369 | 2,289,402,612 |
| | BIC | 6,424,182,186 | 4,406,230,892 | 4,031,112,419 | 458,712,716 | 5,102,110,267 | 5,166,970,876 | 2,314,395,119 |
| Cubic | AIC | 6,404,727,296 | 4,382,426,380 | 4,007,261,621 | 434,426,153 | 5,077,960,484 | 5,143,172,422 | 2,291,257,051 |
| | BIC | 6,429,719,803 | 4,411,584,305 | 4,036,419,546 | 463,584,078 | 5,107,118,409 | 5,172,330,347 | 2,320,414,976 |
Model Comparison
This section presents a comparison of alternative model specifications to capture the relationship between cyclone wind speed and the number of boats. We evaluate and compare linear, quadratic, and cubic forms to identify the functional form that best reflects the nature of this relationship.
We estimate each model separately for individual fishing grounds and at the national level. The resulting coefficients are used to predict the number of boats during selected cyclones, which are then compared to the observed values—closer predictions indicate higher accuracy. Additionally, model fit is assessed using AIC and BIC, with lower values indicating a better-fitting model.
Figure A1.
A comparison of model predictions of boat numbers with actual data for fishing ground 0.
Figure A1.
A comparison of model predictions of boat numbers with actual data for fishing ground 0.
Figure A2.
A comparison of model predictions of boat numbers with actual data for fishing ground 1.
Figure A2.
A comparison of model predictions of boat numbers with actual data for fishing ground 1.
Figure A3.
A comparison of model predictions of boat numbers with actual data for fishing ground 2.
Figure A3.
A comparison of model predictions of boat numbers with actual data for fishing ground 2.
Figure A4.
A comparison of model predictions of boat numbers with actual data for fishing ground 3.
Figure A4.
A comparison of model predictions of boat numbers with actual data for fishing ground 3.
Figure A5.
A comparison of model predictions of boat numbers with actual data for fishing ground 4.
Figure A5.
A comparison of model predictions of boat numbers with actual data for fishing ground 4.
Figure A6.
A comparison of model predictions of boat numbers with actual data for fishing ground 5.
Figure A6.
A comparison of model predictions of boat numbers with actual data for fishing ground 5.
Figure A7.
A comparison of model predictions of boat numbers with actual data for all boats in all fishing grounds.
Figure A7.
A comparison of model predictions of boat numbers with actual data for all boats in all fishing grounds.
References
- CRED. Disaster Year in Review 2023. CRED Crunch #74; Centre for Research on the Epidemiology of Disasters: Brussels, Belgium, 2024. [Google Scholar]
- Donatti, C.I.; Nicholas, K.; Fedele, G.; Delforge, D.; Speybroeck, N.; Moraga, P.; Blatter, J.; Below, R.; Zvoleff, A. Global hotspots of climate-related disasters. Int. J. Disaster Risk Reduct. 2024, 108, 104488. [Google Scholar] [CrossRef]
- Fabricius, K.E.; De’ATh, G.; Puotinen, M.L.; Done, T.; Cooper, T.F.; Burgess, S.C. Disturbance gradients on inshore and offshore coral reefs caused by a severe tropical cyclone. Limnol. Oceanogr. 2008, 53, 690–704. [Google Scholar] [CrossRef]
- Noy, I.; Lacheheb, M.; Pundit, M. The Impact of Tropical Cyclones on Fishing Activities in the Philippines. Fish. Res. 2025, 281, 107221. [Google Scholar]
- Nur, L.; Noy, I.; Wilkinson, E.; Roy, A.; Pundit, M. Rapid Insights for Earlier Action: Big Data’s Role in Impact-Based Forecasting, Nowcasting, and Post-Disaster Damage and Loss Assessments. Asian Dev. Bank Brief. 2023, 279. [Google Scholar] [CrossRef]
- Yonson, R.; Gaillard, J.C.; Noy, I. The Measurement of Disaster Risk: An Example from Tropical Cyclones in the Philippines. Rev. Dev. Econ. 2018, 22, 736–765. [Google Scholar] [CrossRef]
- Tian, H.; Liu, Y.; Tian, Y.; Jing, Y.; Liu, S.; Liu, X.; Zhang, Y. Advances in the use of nighttime light data to monitor and assess coastal fisheries under the impacts of human activities and climate and environmental changes: A case study in the Beibu Gulf. Mar. Policy. 2022, 144, 105227. [Google Scholar] [CrossRef]
- Li, H.; Liu, Y.; Sun, C.; Dong, Y.; Zhang, S. Satellite observation of the marine light-fishing and its dynamics in the South China Sea. J. Mar. Sci. Eng. 2021, 9, 1394. [Google Scholar] [CrossRef]
- Elvidge, C.D.; Zhizhin, M.; Baugh, K.; Hsu, F.C. Automatic boat identification system for VIIRS low light imaging data. Remote Sens. 2015, 7, 3020–3036. [Google Scholar] [CrossRef]
- Fang, W.; Guo, C.; Han, Y.; Qing, R. Impact of Tropical Cyclone Avoidance on Fishing Vessel Activity over Coastal China Based on Automatic Identification System Data during 2013–2018. Int. J. Disaster Risk Sci. 2022, 13, 561–576. [Google Scholar] [CrossRef]
- Kroodsma, D.A.; Mayorga, J.; Hochberg, T.; Miller, N.A.; Boerder, K.; Ferretti, F.; Wilson, A.; Bergman, B.; White, T.D.; Block, B.A.; et al. Tracking the global footprint of fisheries. Science 2018, 359, 904–907. [Google Scholar] [CrossRef]
- Rezaee, S.; Pelot, R.; Ghasemi, A. The effect of extreme weather conditions on commercial fishing activities and vessel incidents in Atlantic Canada. Ocean. Coast Manag. 2016, 130, 115–127. [Google Scholar] [CrossRef]
- Lacheheb, M.; Noy, I.; Kahui, V. Marine heatwaves and commercial fishing in New Zealand. Sci. Total Environ. 2024, 954, 176558. [Google Scholar] [CrossRef] [PubMed]
- Mediodia, H.J.; Noy, I.; Kahui, V. The impact of ocean warming on selected commercial fisheries. Aust. J. Agric. Resour. Econ. 2024, 68, 587–607. [Google Scholar] [CrossRef]
- Chang, Y.; Chan, J.-W.; Huang, Y.-C.A.; Lin, W.-Q.; Lee, M.-A.; Lee, K.-T.; Liao, C.-H.; Wang, K.-Y.; Kuo, Y.-C. Cyclone-enhanced upwelling and its influence on fishing activities in the southern East China Sea. Int. J. Remote Sens. 2014, 35, 6561–6572. [Google Scholar] [CrossRef]
- Tang, D.; Yu, J.; Wang, S.; Pan, G. Cyclone Impacts on Fishery in the South China Sea. In Cyclone Impact Crisis Manag; Tang, D., Sui, G., Eds.; Springer: Heidelberg/Berlin, Germany, 2014; Volume 40. [Google Scholar]
- Giri, S.; Das, S.; Chanda, A.; Das, I.; Maity, S.; Hazra, S. Increase in fish catch after the cyclone Phailin in the northern Bay of Bengal lying adjacent to West Bengal coast—A case study. Indian J. Geo-Mar. Sci. 2015, 44, 1897–1900. [Google Scholar]
- Yagi, M. Short-term change in fish assemblages after the passage of a cyclone in a temperate, coastal bay. Acta Ichthyol. Piscat. 2021, 51, 175–183. [Google Scholar] [CrossRef]
- Monteclaro, H.; Quinitio, G.; Moscoso, A.D.; Napata, R.; Espectato, L.; Anraku, K.; Watanabe, K.; Ishikawa, S. Impacts of Cyclone Haiyan on Philippine capture fisheries and implications to fisheries management. Ocean Coast. Manag. 2018, 158, 128–133. [Google Scholar] [CrossRef]
- Kundu, S.K.; Santhanam, H. A report on the impacts of cyclone Yaas over a fish landing centre vulnerable to cyclonic storms and natural hazards–Talsari, Northern Odisha. Local Environ. 2021, 26, 1043–1050. [Google Scholar] [CrossRef]
- Gupta, S.; Ray, A.; Sarkar, S.; Das, N.; Mondal, B.; Haldar, A. Impact of cyclone Yaas on fisheries resources of Eastern Sunderban part of West Bengal, India. Int. Res. J. Biol. Sci. 2023, 12, 42–44. [Google Scholar]
- Raju, S.S.; Dash, G.; Ghosh, S.; Dash, S.S.; Narayanakumar, R. Impact of Cyclone Amphan on marine fisheries of West Bengal. Mar. Fish. Inf. Serv. Tech. Ext. Ser. 2020, 244, 30–31. [Google Scholar]
- Raju, S.S.; Roul, S.K.; Das, P.C.; Ghosh, S.; Kumar, R.N. Impact of Cyclone Amphan on marine fisheries of Odisha. Mar. Fish. Inf. Serv. Tech. Ext. Ser. 2020, 244, 27–29. [Google Scholar]
- Burkholder, J.; Eggleston, D.; Glasgow, H.; Brownie, C.; Reed, R.; Janowitz, G.; Posey, M.; Melia, G.; Kinder, C.; Corbett, R.; et al. Comparative impacts of two major hurricane seasons on the Neuse River and western Pamlico Sound ecosystems. Proc. Natl. Acad. Sci. USA 2004, 101, 9291–9296. [Google Scholar] [CrossRef] [PubMed]
- Punya, P.; Kripa, V.; Padua, S.; Mohamed, K.S.; Narayanakumar, R.; Nameer, P.O. Socio-economic impact of cyclone Ockhi on fishers along the Kerala and Tamil Nadu coasts, India. J. Mar. Bio. Assoc. India 2021, 63, 89–96. [Google Scholar]
- Makwana, M.; Patnaik, U. Vulnerability of marine fisheries to sea surface temperature and cyclonic events: Evidences across coastal India. Reg. Stud. Mar. Sci. 2021, 48, 102002. [Google Scholar] [CrossRef]
- Heck, N.; Beck, M.W.; Reguero, B. Storm risk and marine fisheries: A global assessment. Mar. Policy 2021, 132, 104698. [Google Scholar] [CrossRef]
- Heck, N.; Beck, M.W.; Reguero, B.; Pfliegner, K.; Ricker, M.; Prütz, R. Global climate change risk to fisheries–A multi-risk assessment. Mar. Policy 2023, 148, 105404. [Google Scholar] [CrossRef]
- Payne Institute for Public Policy. VIIRS Boat Detection Data (VBD). Colorado School of Mines. 2021. Available online: https://payneinstitute.mines.edu/viirs-boat-detection-data-vbd/ (accessed on 6 November 2025).
- Samiuddin, M.; El-Sayyad, G.M. On nonparametric kernel density estimates. Biometrika 1990, 77, 865–874. [Google Scholar] [CrossRef]
- Silverman, B.W. Density Estimation for Statistics and Data Analysis; Routledge: London, UK, 2018. [Google Scholar]
- Green, A.A.; Berman, M.; Switzer, P.; Craig, M.D. A transformation for ordering multispectral data in terms of image quality with implications for noise removal. IEEE Trans. Geosci. Remote Sens. 1988, 26, 65–74. [Google Scholar] [CrossRef]
- Knapp, K.R.; Kruk, M.C.; Levinson, D.H.; Diamond, H.J.; Neumann, C.J. The International Best Track Archive for Climate Stewardship (IBTrACS): Unifying tropical cyclone best track data. Bull. Am. Meteorol. Soc. 2010, 91, 363–376. [Google Scholar] [CrossRef]
- Gahtan, J.; Knapp, K.R.; Schreck, C.J.; Diamond, H.J.; Kossin, J.P.; Kruk, M.C. International Best Track Archive for Climate Stewardship (IBTrACS) Project, Version 4.01. [Indicate Subset Used]; NOAA National Centers for Environmental Information: Asheville, NC, USA, 2024. [Google Scholar] [CrossRef]
- Emanuel, K. Global Warming Effects on U.S. Hurricane Damage. Weather Clim. Soc. 2011, 3, 261–268. [Google Scholar] [CrossRef]
- Newman, R.; Noy, I. The Global Climate-Change-Attributed Costs of Extreme Weather. Nat. Commun. 2023, 14, 6103. [Google Scholar] [CrossRef]
| Disclaimer/Publisher’s Note: The statements, opinions and data contained in all publications are solely those of the individual author(s) and contributor(s) and not of MDPI and/or the editor(s). MDPI and/or the editor(s) disclaim responsibility for any injury to people or property resulting from any ideas, methods, instructions or products referred to in the content. |
© 2025 by the authors. Licensee MDPI, Basel, Switzerland. This article is an open access article distributed under the terms and conditions of the Creative Commons Attribution (CC BY) license (https://creativecommons.org/licenses/by/4.0/).
