Article

Green Fiscal Policy and Brand Development Potential: Evidence from China’s Comprehensive Demonstration Cities for Energy Conservation and Emission Reduction

1
Business School, Chengdu University, Chengdu 610106, China
2
School of International Business, Southwestern University of Finance and Economics, Chengdu 611130, China
3
Economic and Business Faculty, Open University of Catalunya, 08035 Barcelona, Spain
*
Authors to whom correspondence should be addressed.
Sustainability 2025, 17(21), 9817; https://doi.org/10.3390/su17219817
Submission received: 3 September 2025 / Revised: 29 October 2025 / Accepted: 31 October 2025 / Published: 4 November 2025

Abstract

High-quality brand development requires both innovation and legal protection. Although innovation and branding reinforce each other, companies must also prioritize legal safeguards to prevent brand image damage caused by infringement. Therefore, a city’s level of innovation and intellectual property protection jointly shapes its brand development potential. Green fiscal policies can incentivize enterprises to invest in eco-friendly technological R&D, thereby providing foundational support for brand development. This study utilizes trademark data (2005–2018) from 299 prefecture-level cities in China and employs a quasi-natural experiment based on the pilot program of “Comprehensive Demonstration Cities for Energy Conservation and Emission Reduction.” A multi-period DID model is utilized to assess whether such fiscal policies enhance urban brand development potential. According to the findings, the policy substantially improves brand potential by raising awareness of intellectual property and restricting industrial energy use. Heterogeneity analysis reveals stronger policy effects in western and eastern urban areas, particularly in cities with more “Time-Honored Chinese Brands,” increased research and development investment, lower fiscal pressure, greater marketization, and non-resource-based economies. These results add to the literature on brand innovation and protection and provide empirical support for the role of green fiscal policy in promoting brand growth potential.

1. Introduction

A brand is not just a logo; it is a living business asset that grows in worth as it absorbs and represents consumers’ perceptions of product quality, technology, and cultural value and reflects an intangible recognition of excellence in the minds of consumers. As a cognitive concept, it encompasses how consumers evaluate and experience products or services and serves as a key driver of customer loyalty. Strong brands can enhance recognition in both domestic and international markets, attract potential consumers, and reflect the overall competitiveness of firms and even nations. Under this premise, and in line with actions carried out internationally, for example, by the European Union, the Chinese Government is committed to continuously advancing brand development and actively promoting the global influence of Chinese brands. Thus, this emphasizes the strategic imperative to evolve from “Made in China” to “Created in China,” shifting from competition based on speed to competition based on quality and moving from recognition for Chinese products to respect for Chinese brands—core principles for achieving sustainable brand development. This shift is a critical pathway toward achieving high-quality national development. As emphasized in the Guiding Opinions on Promoting Brand Development in the New Era, fostering sustainable and high-quality brand growth must be anchored in a steadfast commitment to quality, excellence, and innovation. By 2025, many competitive Chinese brands with strong product quality are expected to emerge. At present, China has made positive progress in brand building, and Chinese brands are rising rapidly on the global stage. However, compared with world-leading brands, there remains a significant gap in profitability and return on equity. To build strong and high-level domestic brands, continued momentum and sustained support are needed to empower the development potential of Chinese brands.
Many studies have shown that sustained innovation capabilities help enhance brand value and ensure long-term brand vitality [1]. Innovation and branding, whether in the context of corporate brands or territory-related brands, are mutually dependent and reinforcing. In fact, in this latter area, it is essential to note that products and local brands originating from countries traditionally considered highly innovative (such as the USA and Germany in the European context or Japan, Korea, and currently China in the Asian context) enjoy prestige and are perceived as being of high quality given the prestige of the country brand. However, this transfer of associations between the country brand and local brands usually works in both directions. Although the country brand reinforces certain connotations of local brands, these subsequently contribute to and strengthen the meaning of the global brand. For example, in Spain, the global brand (‘Marca España’) both reinforces and is reinforced by local brands such as Inditex (Zara, a brand in the fashion and accessories sector) or Sol Meliá (an international hotel group). These and other companies are recognized for their strong international presence, innovation, consumer orientation, and commitment to sustainability.
To advance sustainable China brand development, cities should enhance technological innovation and upgrade the technical and quality level of their products. Enterprises should capitalize on sound innovation capacity and brand leadership to achieve long-term competitive advantage. Innovation can function as a key driver for brand growth [2,3].
Innovation in brands is perceived positively by customers. This involves improvements in the features of the products or services they offer or in the way they inform and engage in dialogue with their customers, thereby enhancing customer satisfaction and even fostering loyalty and recommendation [4]. Furthermore, brand innovation enhances brands. Belderbos further indicated that brand innovation has the capability to improve companies’ strategic flexibility and market competition capability [5]. In addition, a brand itself is a market concept, and without trademark registration, the brand is not subject to legal protection and might be seized or misappropriated by other companies. Note that brands are born with the intention of identifying, differentiating, and protecting a company’s creations [6]. For the protection of their own interests, companies should not exclusively value innovation-led growth, but innovation outcome protection as well. Law protection plays a pivotal role to curb counterfeiting, piracy, and patent violation. When cultivating brand image and improving brand value, enterprises should attach importance to legal protection given that any innovation leading to brands that are not protected by patents might become an easy target for imitation by competitors. Thus, innovation and legal protection are cornerstones to domestic brands’ high-quality development. The growth potential of domestic brands is positively correlated with the relative strength of the legal protection system and the rate of innovation.
In recent years, issues such as energy shortages and ecological pollution have constrained China’s economic development. With the intensification of climate change and resource depletion, sustainable development has gradually become a key focus in academic research [7,8]. The 2010 G20 Summit noted that sustainable development is essentially sustainable green growth. Sustainable development helps countries eliminate outdated technologies, improve energy efficiency, and acts as a strategy for high-quality development. Edward Barbier argued that when ecosystems are degraded and lose functionality due to pollution emissions, countries face ecological scarcity, market failures, and policy failures, making sustainable economic development unachievable [9]. Fast economic growth in China since the reform and opening up has been accompanied by increased pollution and declining environmental quality. As the leading global carbon emitter, China is confronted with serious issues related to energy shortages and ecological degradation, which hinder its sustainable economic growth [10].
In line with some programs proposed by the EU, such as the European Green Deal, the Net-Zero Industry Act, or the Sustainable Industry Low Carbon (SILC) initiative, and the USA through the Inflation Reduction Act, the Chinese government has highlighted the importance of hastening the transition to greener development models, promoting eco-friendly and carbon-neutral industries, and supporting the formation of sustainable production and consumption patterns as a key component of achieving high-quality economic growth. Green development, as a concept, has been steadily integrated into national macroeconomic policy. Fiscal spending has increasingly supported environmental governance, and environmentally friendly tax and spending policies that encourage the reduction in emissions and the conservation of energy have taken shape. Green fiscal policy has become a powerful instrument for local governments to drive green innovation. Hewett and Ekins define green fiscal policy as a set of tax and pricing measures that aim to improve environmental outcomes while also increasing government revenue [11]. Generally, green fiscal policy refers to government measures such as green taxes, subsidies, investment, and procurement to achieve environmental goals. Green fiscal policy combines the functions of environmental regulation and fiscal incentives. Studies have shown that green fiscal policy not only helps save energy, reduce emissions, and improve ecological conditions [12,13], but also contributes to industrial upgrading and supports the green transformation of the economy, thereby enhancing the innovation capacity of firms [14,15]. Therefore, the implementation of environmentally friendly spending policies can promote enterprise innovation to some degree, which subsequently helps strengthen the potential for brand development in China.
This study offers several potential contributions that distinguish it from prior research. From a scholarly standpoint, the earlier literature mainly focused on the effects of the “Comprehensive Demonstration Cities for Energy Conservation and Emission Reduction” policy on carbon emissions or environmentally friendly innovation. This investigation instead analyzes the effect of this policy on the growth potential of domestic brands. By conducting an empirical analysis of whether the policy has a positive influence on brand development potential in China and further exploring its mechanisms and heterogeneity, this research expands the understanding of the policy’s effectiveness and adds practical relevance to the existing literature. Second, regarding research content, this study identifies how the demonstration program can enhance brand development potential by raising intellectual property awareness and reducing industrial energy consumption. Here, heterogeneity analysis is conducted across multiple dimensions, including regional differences, city resource endowment types, research and development investment levels, fiscal pressure, and the presence of “Time-Honored Chinese Brands”. This provides a more comprehensive assessment of how the pilot program influences brand development potential and provides helpful recommendations for optimizing the role of environmentally friendly spending policies and advancing brand development in China. Third, in terms of methodology, using panel data collected from 299 prefecture-level cities in China between 2005 and 2018, this investigation approaches the pilot program as a quasi-natural experiment. A multi-period DID model is employed to examine the effect of the policy on domestic brand development potential. To address potential endogeneity concerns, the PSM-DID method is also applied, ensuring that the empirical findings are trustworthy and resilient.

2. Policy Background and Literature Review

2.1. Policy Background

To promote the green transformation of urban economies in China, the central government introduced goals for reducing emissions and conserving energy during the 11th Five-Year Plan period. These targets included lowering total emissions of major pollutants by 10% and cutting energy consumption by 20% per unit of GDP. Financial subsidies were provided to support specific projects. However, because each subsidy had to be allocated to a designated project, funds became fragmented, and policy organizers could not coordinate their use effectively. This significantly weakened the initiative of local governments. Drawing on insights gained during the 11th Five-Year Plan, the central government adjusted its strategy during the 12th Five-Year Plan. It shifted away from the “project-by-project” approach and launched a city-level program called the “Comprehensive Demonstration Cities for Energy Conservation and Emission Reduction”.
There are clear differences in scale and focus. For example, the Chinese ECER project concentrates on local, city-level implementation. The EU promotes continental initiatives such as the Green Deal or SILC, and the U.S. implements national policies through the Inflation Reduction Act. However, these countries all share fundamental strategic objectives. Specifically, they aim to accelerate the transition toward more sustainable development models, foster low-carbon industries, and promote environmentally friendly production and consumption patterns. Moreover, all three employ economic incentives and support technological innovation as a key tool to achieve their sustainability goals, highlighting a shared vision on the importance of combining regulation, financial stimuli, and technological development to achieve high-quality, environmentally responsible economic growth.
The ECER project aimed to integrate scattered funds and increase subsidy intensity to improve efficiency and the zeal with which local authorities are pushing for measures to lessen pollution and conserve energy. In June 2011, following approval from the State Council, the National Development and Reform Commission and the Ministry of Finance formally launched the demonstration program. Eight cities were selected in the first batch. Subsequently, the second and third batches were selected in October 2013 and September 2014, respectively. In total, three batches of 30 demonstration cities were identified, covering 27 provinces nationwide. The full list of demonstration cities is shown in Table 1. The overall goal of the demonstration program is to encourage low-carbon, environmentally friendly, and circular development in selected cities; accelerate industrial restructuring; and significantly enhance urban sustainability.
To strengthen the credibility and enforceability of the policy, the “Comprehensive Demonstration Cities for Energy Conservation and Emission Reduction” policy combines both financial incentives and regulations pertaining to the environment. On one hand, the Notice on Launching the Comprehensive Demonstration of Fiscal Policies for Energy Conservation and Emission Reduction (hereinafter referred to as the “Notice”) requires demonstration cities to adjust their fiscal expenditure structures and allocate a certain amount of funding to support initiatives to conserve energy and decrease emissions. The central government annually disbursed comprehensive incentive funds to the demonstration cities throughout the pilot phase.
The National Development and Reform Commission demonstrated that by 2015, the central government had provided a total of 16.6 billion CNY in financial support to demonstration cities, which also helped attract over 100 billion CNY in social investment. Therefore, being selected as a demonstration city served as a strong fiscal incentive for local governments. On the other hand, the Notice also clearly requires demonstration cities to eliminate outdated production capacity and equipment. Each city must develop strict performance evaluation methods, meet specific targets, promote advanced technologies that are both energy efficient and eco-friendly, and achieve substantial reductions in major pollutants. To ensure the effectiveness of the program, the Supplementary Notice on the Comprehensive Demonstration of Fiscal Policies for Energy Conservation and Emission Reduction issued by the Ministry of Finance and the National Development and Reform Commission states that demonstration cities must meet the energy conservation and emission reduction goals outlined in their implementation plans. Regular performance evaluations are conducted, and cities that do not reach their goals will be stripped of their demonstration status and have their incentive funds revoked. If failure is due to force majeure, 20% of the total incentive funding will be deducted for each unmet target. By combining fiscal incentives with environmental regulation, the comprehensive demonstration program aims to maximize the effectiveness of public financial resources.

2.2. Literature Review

Existing research on green fiscal policy mainly focuses on two aspects: its impact on environmental governance and on technological innovation. The following section reviews the literature from both perspectives.
First, we consider the impact of green fiscal policy on environmental governance. Since pollution emissions have caused severe environmental damage, numerous scholars as well as international organizations have examined policies designed to reduce such emissions.
As an example, in the European case, the European Union Emissions Trading System (EU ETS) was established in 2005 as a carbon emission trading scheme (cap-and-trade system) designed to lower greenhouse gas emissions across the EU. Cap-and-trade schemes impose a cap on the total emissions of specified pollutants within a given area while allowing companies to trade emission rights within that framework. According to data provided by the European Environment Agency, the European Union has complied with and exceeded the emission reduction targets set by relevant agreements [16]. Furthermore, the work of Dueñas and Mandel highlights that the funds allocated to the low-carbon economy (for the programming periods 2007–2013 and 2014–2020) effectively reduced greenhouse gas emissions in developed and transition regions, although with more limited effects in less developed areas [17].
In the United States, the Inflation Reduction Act (IRA) represents the most ambitious federal legislation aimed at addressing climate change. It combines large-scale tax incentives, subsidies, and the creation of a green bank to accelerate the clean energy transition [18]. Independent models project that the IRA could reduce greenhouse gas emissions by 43% to 48% below 2005 levels by 2035, with the most significant impacts expected in the power and transportation sectors.
In addition, recent assessments emphasize that the fiscal expansion embedded in the IRA is not only expected to cut emissions but also to strengthen environmental governance by embedding climate objectives within the broader fiscal framework [19]. Unlike the EU ETS, which relies primarily on market-based pricing of carbon allowances, the IRA operates through tax credits and direct subsidies that incentivize private investment in clean energy, electric vehicles, and green infrastructure. This fiscal strategy aims to realign industrial policy with climate targets while generating co-benefits such as job creation and regional economic development. Nevertheless, scholars have also cautioned that the distributive effects of such large-scale subsidies, as well as their potential to trigger international trade frictions, remain key challenges in the U.S. context [20].
With regard to China, environmental governance was accompanied by not only green policies, but also by pilot programs and carbon emission trading programs that are low carbon. Policies on carbon trading have, according to certain analyses, been found to increase carbon emission efficiency, whereas policies on low-carbon pilots have been found to stimulate emissions reductions by spurring innovation among corporations and changing industry structure. As opposed to market-based regulation policies like carbon trading and pilots on low-carbon cities, green fiscal policy provides fiscal incentives that divert social funds and talent from demonstration cities to environmental governance [21]. Green fiscal policy plays an important mechanism to induce companies to reduce pollution. The policy enhances the level of discretionary funds from local governments so that they transition from relying on energy-intensive and highly polluting industries and therefore reduce CO2 emissions sharply [22]. Zhao et al. evaluated carbon taxes and emissions and concluded that stricter carbon taxes tend to increase carbon cut efficiency [23]. Lin and Zhu using panel data on 114 cities within China, tested the association between fiscal policies on energy conservation and sustainable urban developments, and found that such policies reduce CO2 emissions from demonstration cities drastically and enhance sustainability indicators [24]. Wang and Qiu considered the role of fiscal policies on energy conservation on urban environmental governance and concluded that the policy reduces pollution by upgrading innovation and energy effectiveness. However, the effect is more evident within the short-run and tends to disappear within longer temporal intervals [25]. Using provincial panel data between 2007 and 2020 and a spatial Durbin model, researchers tested an interaction effect between combined effects by pollution control and fiscal policies on agriculture and showed that green fiscal policy effectively reduces agricultural pollution and boosts carbon emission reductions [26]. In summary, most studies indicate that green fiscal policy helps regulate environmental governance in demonstration cities and contributes significantly to reducing carbon emissions in China.
Second, it is worth analyzing the green fiscal policy’s effect on the technological innovation landscape. In the European context, green fiscal policy has been closely linked to the promotion of technological innovation through the European Green Deal and complementary fiscal instruments. The European Commission has mobilized substantial funds to stimulate research, development, and the implementation of clean technologies [27,28]. Likewise, fiscal mechanisms such as carbon taxes, energy tax reforms, and targeted subsidies have been fundamental in supporting eco-innovation, particularly in renewable energy, energy efficiency, and sustainable mobility [29]. Empirical studies indicate that these fiscal measures not only reduce emissions but also strengthen European leadership in clean technology patents and the commercialization of low-carbon technologies; however, their effectiveness varies depending on the fiscal capacity and market maturity of each Member State [27].
Regarding the United States, the Inflation Reduction Act (IRA) represents a turning point in linking fiscal policy with technological innovation. Its provisions, which include renewable energy, electric vehicles, green hydrogen, and carbon capture, are expected to significantly accelerate technological deployment and innovation capacity [18,30]. Independent projections estimate that these measures could generate significant indirect technological effects, enhancing U.S. competitiveness in global clean technology markets. However, scholars warn about the potential distributive effects of these subsidies and their capacity to generate trade frictions, posing challenges for the sustainability of such innovation-oriented fiscal policies [30,31].
Finally, in China’s environment, technological advances are an enterprise development driving force, and environmental pollution fundamentally hinges on innovation-led solutions [32]. Investigating fiscal policy contributes to lowering emissions and conserving energy, and its effects on green innovation represents a significant problem for China’s green economic transition goal. However, the existing literature prefers to focus on the impact of environmental regulation or fiscal incentives alone while discussing how policy innovation affects firms.
As an instrument of policy that has the capacity to control energy utilization and emissions of carbon, environmental regulation enables the adjustment of structures of industries, drives enterprises to control pollution during production, stimulates innovation on technology to control pollution, and promotes green competition [33]. In addition to regulation, fiscal policy has a crucial function to address environmental issues and stimulate green technological innovation [34]. Fiscal incentives, e.g., raising subsidies from the government and investing in research and development, have the capacity to lead enterprises to pay particular special attention to green research and development. Green fiscal policy encapsulates both characteristics of environmental regulation and fiscal incentives. In addition, it enables companies to counteract inertial forces, take active participation in green innovation, and enhance innovation performance [35]. Guo et al. argued that policies on emissions reductions and energy conservation implemented through fiscal policies can alleviate cost pressures on research and development by providing tax incentives and incentive companies to spend more on innovation costs [36]. Yusof illustrated that policies concerning green innovation improve eco-friendly advancement by increasing technology research and development intensity and upgrading industry [37]. Using a difference-in-differences model, one study tested green fiscal policy and firm innovation and demonstrated that policy enhances green innovation performance considerably [38]. According to data from Chinese publicly traded companies, Eduardo et al. illustrated that policy drives companies to adopt green technology to face change and enhance organizational efficiency [39]. Hanna et al. concluded that policy promotes industrial upgrades by limiting energy-intensive sectors and incentivizing the growth of new and service-based businesses [40]. As industrial upgrading increases demand for green products, firms are driven to accelerate green technological innovation to meet market needs [41].

3. Theoretical Analysis and Research Hypotheses

3.1. Trademarks and Brand Development Potential

According to data from the World Intellectual Property Organization, global trademark applications have shown mixed trends in recent years. By the end of 2022, in China, the number of valid applications reached approximately 7.7 million classes, representing a 14.58% year-on-year increase. In contrast, in the United States, the volume of applications was around 945,571 classes in 2022. However, in 2023, there was a decline to approximately 739,395 classes. Meanwhile, the European Union Intellectual Property Office (EUIPO) recorded 436,720 classes filed in 2022, ranking among the five busiest offices worldwide. However, it also experienced a slight decrease in application volumes during 2023. Within the European Union, Germany led trademark applications with around 475,911 classes, followed by Spain with approximately 125,209 classes. In addition, Italy and France also reported significant volumes of filings. In the United Kingdom, trademark activity remained strong, consolidating its position among the most active markets in Europe [42,43,44].
Numerous studies have shown that trademarks help transform innovation activities into commercial value in the market, and a positive correlation exists between trademarks and innovation [45]. Companies with more innovative products tend to file more trademarks [46]. Jensen and Webster identified a notable association between trademarks and other innovation metrics, such as research and development expenditure and patents, suggesting that trademarks serve as an important metric for measuring innovation at the firm level [47]. Given that patents primarily capture “radical” innovation based on science and technology, they do not account for “incremental” innovation activities such as marketing assets, commercialization, and promotional efforts [48,49]. Trademark data, by contrast, are better suited for capturing both non-technological and broader forms of innovation [50], and some scholars even argue that trademarks provide a broader measure of inventiveness than patents. Therefore, the number of trademark applications can be used as an indicator of a company’s level of brand innovation. In addition, brand protection depends on trademark protection. Once a brand is registered as a trademark, it becomes more difficult for competitors to replicate the same product or technology. Proper use of trademarks can protect both the brand and its associated innovations. To prevent infringement that may damage brand image and equity, firms must prioritize trademark registration to safeguard legally the brand ownership and legitimacy of their innovations. In the long run, without legal mechanisms for brand protection, innovation behavior tends to be short lived [51]. Holding ownership of innovations also ensures that firms can benefit when brand equity is transferred [52]. Currently, brands have become a valuable intangible asset for companies. For businesses, brands have evolved into a seal of origin and emotional identity [53], generating awareness and fostering customer loyalty. On the other hand, for consumers, brands have shifted from being merely a source of information about product quality to becoming a companion that engages in dialogue, builds relationships, and creates unforgettable experiences [54]. Trademark protection is a foundation for brand development, and firms should focus on the coordinated development of trademarks and brands. By properly using legal protection, companies can maximize the commercial value of their brands under the protection of the law.
Encouraging enterprises to register trademarks for their innovative brands helps enhance the potential for brand development. Compared with the long-standing tradition of registering trademarks in Europe and the USA, where firms have integrated trademark registration into their corporate strategy for decades, protecting them across multiple jurisdictions before launching a product, this practice is a more recent phenomenon in China, dating back to the early 1980s, coinciding with the economic opening and the enactment of the Trademark Law in 1982 [55,56].
This situation means that most Chinese firms, to protect their research and development outcomes, apply for trademark registration before establishing a strong brand image for their products or services. This ensures legal protection and allows the brand to remain firmly under the control of its holder. Therefore, companies with a greater number of trademarks generally have more potential to develop strong brands. Trademark applications are not only positively correlated with innovation and reflect the level of brand-driven innovation, but they also serve as legal instruments for brand protection. Given that brand development requires both innovation and legal safeguards, this study makes use of the number of trademark requests filed each year in prefecture-level cities as a proxy for urban brand development potential.

3.2. Green Fiscal Policy and Brand Development Potential

To build a brand with long-term sustainable development, two strategic directions can be pursued. The first focuses on the cultural heritage of the brand, emphasizing its traditions and emotional and cultural associations (both associated with the geographical origin and company’s values). The second involves promoting brand growth through innovation, focusing on the brand’s core competitiveness, with high-tech and high-quality brands as the core strategy [57]. These two directions are not separate; in fact, they should be combined to strengthen each other. The ideal state of brand development is when both “cultural connotation” and “technological innovation” advance together and mutually support each other [58,59]. Although European and American brands have traditionally emphasized balancing both types of connotations to strengthen brand equity through consumer engagement [52,58,60], China’s brand development is increasingly emphasizing cultural connotations. However, the relationship between brand building and innovation remains an area that requires further research. In today’s world of rapid technological advancement, successful brand growth requires building brands capable of delivering value not only to customers but also to society [61]. Technological innovation enables companies to develop strong, efficient, and sustainable brands that can address pressing climate and environmental challenges. In this context, brand development increasingly depends on leveraging technological innovation to create competitive advantages and establish long-term market differentiation. Furthermore, environmentally friendly fiscal policies aimed at improving energy efficiency and preventing pollution play a critical role in this process. These policies integrate fiscal incentives with environmental regulations to encourage companies to adopt sustainable practices. To foster a comprehensive green economic transformation, such policies set clear objectives for controlling environmental pollution and promoting sustainable development.
Focus on China context, to promote comprehensive green economic transformation, this policy sets a series of environmental pollution control targets. These include deepening the treatment of volatile organic compound pollution in high-pollution industries, expanding the use of renewable energy sources, and advancing the construction of green projects. Although the demonstration cities are subject to policy regulations, they also enjoy fiscal subsidies and special funds for reducing emissions and conserving energy. Moreover, the central government allocates comprehensive reward funds of 1.5 to 2 billion CNY to each city based on their three-year demonstration period. A policy with direct financial rewards undoubtedly encourages enterprises in the demonstration zones to accelerate the elimination of high-emission, high-energy-consuming industries [62]. It also incentivizes firms to research and innovate green, low-carbon technologies, helping cities generate a new wave of trademarks, thereby empowering the development potential of urban brands. On this basis, the following hypothesis is formulated:
H1. 
The green fiscal policy in demonstration cities helps enhance domestic brand development potential.

3.3. Mechanism: How Green Fiscal Policy Affects Brand Development Potential

First, the policy helps strengthen awareness of intellectual property protection. In brand marketing, many companies lack sufficient knowledge about the benefits of intellectual property (IP) protection. This can cause highly innovative and environmentally conscious brands to suffer considerable financial losses and experience significant damage to their brand image and reputation [2,52].
Environmentally friendly fiscal policies have emerged as a critical mechanism to encourage firms to strengthen their IP protection strategies, enabling them to safeguard innovations while simultaneously promoting sustainable business models. Specifically, green fiscal policies—designed to reduce greenhouse gas emissions and enhance energy efficiency—offer comprehensive financial incentives to demonstrate cities, fostering the transition toward a green, low-carbon, and circular economic development model [63,64]. These initiatives not only stimulate investment in green innovation but also establish a comprehensive framework in which intellectual property protection emerges as a critical driver of sustainable competitive advantage [65]. By fostering a stronger alignment between innovation strategies and environmental objectives, they encourage firms to allocate greater resources to environmentally friendly R&D while supporting regions in developing collaborative platforms that facilitate green technological innovation.
On one hand, fiscal subsidies reduce R&D costs and strengthen firms’ motivation to innovate. On the other hand, as innovation outcomes increase, firms become more inclined to apply for patents, thereby improving their IP awareness. Under the influence of fiscal incentives, local governments also become more aware of IP protection. Faced with financial rewards, they tend to quickly implement existing product research and technological development projects and apply for patents to obtain authorization. For local governments that had no prior engagement in technology development or innovation, fiscal incentives play a guiding and demonstrative role. They help direct financial resources toward green innovation and reduce the costs associated with information asymmetry. As a result, resource allocation efficiency improves, technological research and development projects are implemented more rapidly, and local governments are more active in supporting patent applications for research outputs. The green fiscal policy thus encourages firms to accelerate the commercialization of research and development achievements and to use the IP legal system to protect those outcomes. This reflects an improvement in IP awareness at the city level. As more innovative inventions are registered as trademarks, brand development potential is enhanced. On this basis, the following hypothesis is formulated:
H2. 
Under the effect of fiscal incentives, green fiscal policy can stimulate enterprises to strengthen intellectual property protection awareness, thereby enhancing urban brand development potential.
Second, it is important to strengthen environmental regulation and limit industrial energy consumption. Europe emphasizes structural fiscal alignment through comprehensive budgeting strategies such as the European Green Deal, the Fit for 55 package, and green budgeting—which allocates at least 30% of the EU budget to climate-related objectives—as well as reinforced Energy Efficiency Directives [66,67,68]. In addition, the United States relies on localized financial incentives at the municipal level, such as the Portland Clean Energy Community Benefits Fund (PCEF), which finances community projects aimed at reducing emissions, and competitive grants for sustainable construction through the Green Investment Fund [69].
In contrast, the Chinese context integrates centralized performance monitoring with fiscal incentives and penalties, exemplified by its ESER policies implemented in demonstration cities. These policies foster sustainable technological innovation and involve the allocation of billions of CNY in subsidies for energy conservation and emission reduction, including performance-based rewards. Particularly, the Notice on Adjusting the Distribution and Performance Evaluation Methods for Comprehensive Demonstration Reward Funds for Energy Conservation and Emission Reduction states that the central government will conduct annual assessments of demonstration cities and perform a final evaluation at the end of the demonstration period. In cases where a city fails to meet the specified standards by the conclusion of the demonstration period, 20% of its comprehensive reward funds will be deducted [70]. Given that the demonstration period lasts only three years, cities find it challenging to accomplish energy conservation and emission reduction goals using market-oriented mechanisms like environmental taxes or green electricity trading systems. In the short term, the most effective approach is to apply administrative measures, such as restricting industrial electricity use and increasing penalties to reduce the capacity of high-pollution, energy-intensive industries.
Tao et al. used a DID model and PSM-DID method to study carbon emission data from 283 prefecture-level cities in China and found that adjusting total energy consumption and energy consumption structure helps reduce urban carbon emissions [71]. As a policy with clear environmental evaluation indicators, the green fiscal policy imposes strict environmental regulations on demonstration cities. Under the pressure of performance assessments, these cities optimize energy resource allocation and improve industrial energy efficiency.
A large body of research shows that advancements in technology are crucial for enhancing energy efficiency and fostering environmentally conscious economic growth [72]. In response to the costs of environmental regulation, local governments continually increase research and development expenditures and innovation investments, eliminate outdated equipment, strengthen high-quality technological innovations and applications, and encourage funding flows toward energy-efficient technologies, thus promoting progress in green technology. Furthermore, to maintain long-term competitive advantages, the optimal strategy for local governments is to improve patent conversion efficiency, apply trademarks to high-quality products, and develop these products into influential brands. On this basis, the following hypothesis is formulated:
H3. 
Under the effect of environmental regulation, the green fiscal policy promotes innovation in green technologies in demonstration cities by limiting industrial energy consumption, thereby enhancing the potential for domestic brand development.

4. Data Sources and Research Design

4.1. Variable Definitions

The dependent variable examined in this research refers to brand development potential. We define brand development potential as a forward-looking, city-level capacity to transform marketing-related intangible assets into market-recognizable brands in the near future. In practice, pre-market brand-building activities are formalized and legally protected through trademarking. Hence, following the empirical literature that uses trademark activity as a proxy for branding investment and market-oriented (often non-technological) innovation, we operationalize brand development potential with trademark data. A large body of work documents that (i) trademarks capture firms’ branding and product/service differentiation efforts beyond patents, (ii) trademarking is particularly informative in services and consumer markets, and (iii) trademark intensity predicts future firm outcomes (profitability, output, and growth) [73].
Given that the development of high-quality brands requires both innovation and legal protection, trademark applications serve as both an indicator of brand innovation and a key legal protection tool. Accordingly, this research employs the annual number of trademark applications filed in each city as a metric to gauge the overall potential for brand development. Specifically, the development potential of domestic brands is denoted by the volume of trademark applications within each Chinese city.
We use annual trademark applications rather than registrations for three reasons. First, applications timestamp firms’ branding decisions in the focal year and avoid administrative lags in examination that blur the timing of branding efforts. Second, applications better capture potential brand creation, which is our construct of interest, whereas registrations partly reflect ex-post administrative screening. Third, applications are widely used in the literature when the outcome is forward-looking and policy timing is essential [73]. To comprehensively analyze how green fiscal policies affect brand development potential across China, trademarks are classified into goods and service trademarks per the Nice Classification. These categories are used to measure the potential for goods brand development and service brand development, respectively. The discussion below will separately analyze the overall brand development potential (Brand), goods brand development potential (Goods brand), and service brand development potential (Service brand) in cities.
The core explanatory variable herein is a dummy variable corresponding to the “Comprehensive Demonstration Cities for Energy Conservation and Emission Reduction” (denoted as “policy”). This variable is assigned a value of 0 in the absence of policy implementation and 1 upon policy enforcement.
Regarding control variables, for the purpose of mitigating the impact of other confounding factors on the development of domestic brands, this study incorporates city-level factors that affect brand construction based on the existing literature. Such variables encompass the city scale, economic development level, financial development level, informatization level, public cultural service level, and industrialization level, all of which are incorporated into the model to account for their effects on the regression outcomes. The specific control variables are defined as follows: City Size (CS) is measured by the annual year-end total population of each city; the Economic Development Level (GDP) is indicated by the gross domestic product of each city; the Financial Development Level (FIN) is represented by the ratio of the sum of year-end RMB loan balances and year-end RMB deposit balances of financial institutions to GDP; the Informatization Level (INF)is quantified by the number of broadband internet users in each city; the Public Cultural Service Level (PCS) is reflected by the number of books held in public libraries of each city; and the Industrialization Level (IND) is gauged by the count of industrial enterprises in each city. All control variables, with the exception of the Financial Development Level (FIN), have undergone logarithmic transformation. Descriptive statistics for the key variables are provided in Table 2.

4.2. Model Specification

In this study, the pilot initiative of “Comprehensive Demonstration of Fiscal Policies for Energy Conservation and Emission Reduction” is regarded as a quasi-natural experiment. To tackle the endogeneity issue inherent in conventional regression models, the difference-in-differences (DID) approach is employed to assess policy impacts. Given that the policy was rolled out in phases across 2011, 2013, and 2014, the standard DID model is limited to examining policy effects at a single time point. Accordingly, this study designates pilot cities as the treatment group and non-pilot cities as the control group, thereby constructing a multi-period DID model. The specification of the model is presented in Equation (1):
B r a n d i t = α 0 + α 1 p o l i c y i t + γ c o n t r o l i t + μ i + σ t + ε i t
Here, i denotes the city, t stands for the year, and B r a n d i t represents the brand development potential of city i in year t. This study will examine the overall brand development potential of cities (Brand), goods brand development potential (Goods brand), and service brand development potential (Service brand), separately. In addition, p o l i c y i t denotes the dummy variable corresponding to the “Comprehensive Demonstration of Fiscal Policies for Energy Conservation and Emission Reduction” in pilot cities. The value is 1 for cities that have implemented the policy in a given year and in subsequent years, and it is 0 for cities that have not implemented the policy. The coefficient α 1 denotes the impact of the policy on the potential for domestic brand development, derived from a difference-in-differences analysis comparing pilot and non-pilot cities across the pre- and post-policy implementation periods. A significantly positive coefficient suggests that the green fiscal policy helps enhance domestic brand development potential. Here, c o n t r o l i t denotes the set of control variables influencing the development of domestic brands, μ i stands for city-specific factors that remain constant over time, σ t signifies time-fixed effects, and ε i t represents the random error term.

4.3. Data Source and Processing

In the present study, the dependent variable is operationalized using the count of trademark applications within China’s prefecture-level cities, including total trademark applications, service trademark applications, and goods trademark applications. The data are primarily derived from the China National Intellectual Property Administration, which maintains comprehensive records of trademark applications across all Chinese cities spanning the period from 1978 to 2019, and classifies trademarks by type, such as goods trademarks, service trademarks, Latin-letter trademarks, Chinese-character trademarks, and mixed Chinese-English trademarks. Considering the research scope, this study selects city-level data on total trademark applications, service trademark applications, and goods trademark applications from 2005 to 2018 as the sample.
The data pertaining to control variables in this study are extracted from the China City Statistical Yearbook. This includes data on population, gross domestic product, number of broadband internet users, balances of RMB deposits and loans in financial institutions, number of books in public libraries, and number of industrial enterprises. Furthermore, details regarding the pilot cities and implementation years of the green fiscal policy were gathered from the official website of the Ministry of Finance. Using this information, the three batches of demonstration cities designated in 2011, 2013, and 2014 were identified. Trademark application data, control variable data, and policy data were then matched by year and city code. The final matched sample includes 299 cities. Descriptive statistics for the key variables are presented in Table 2.
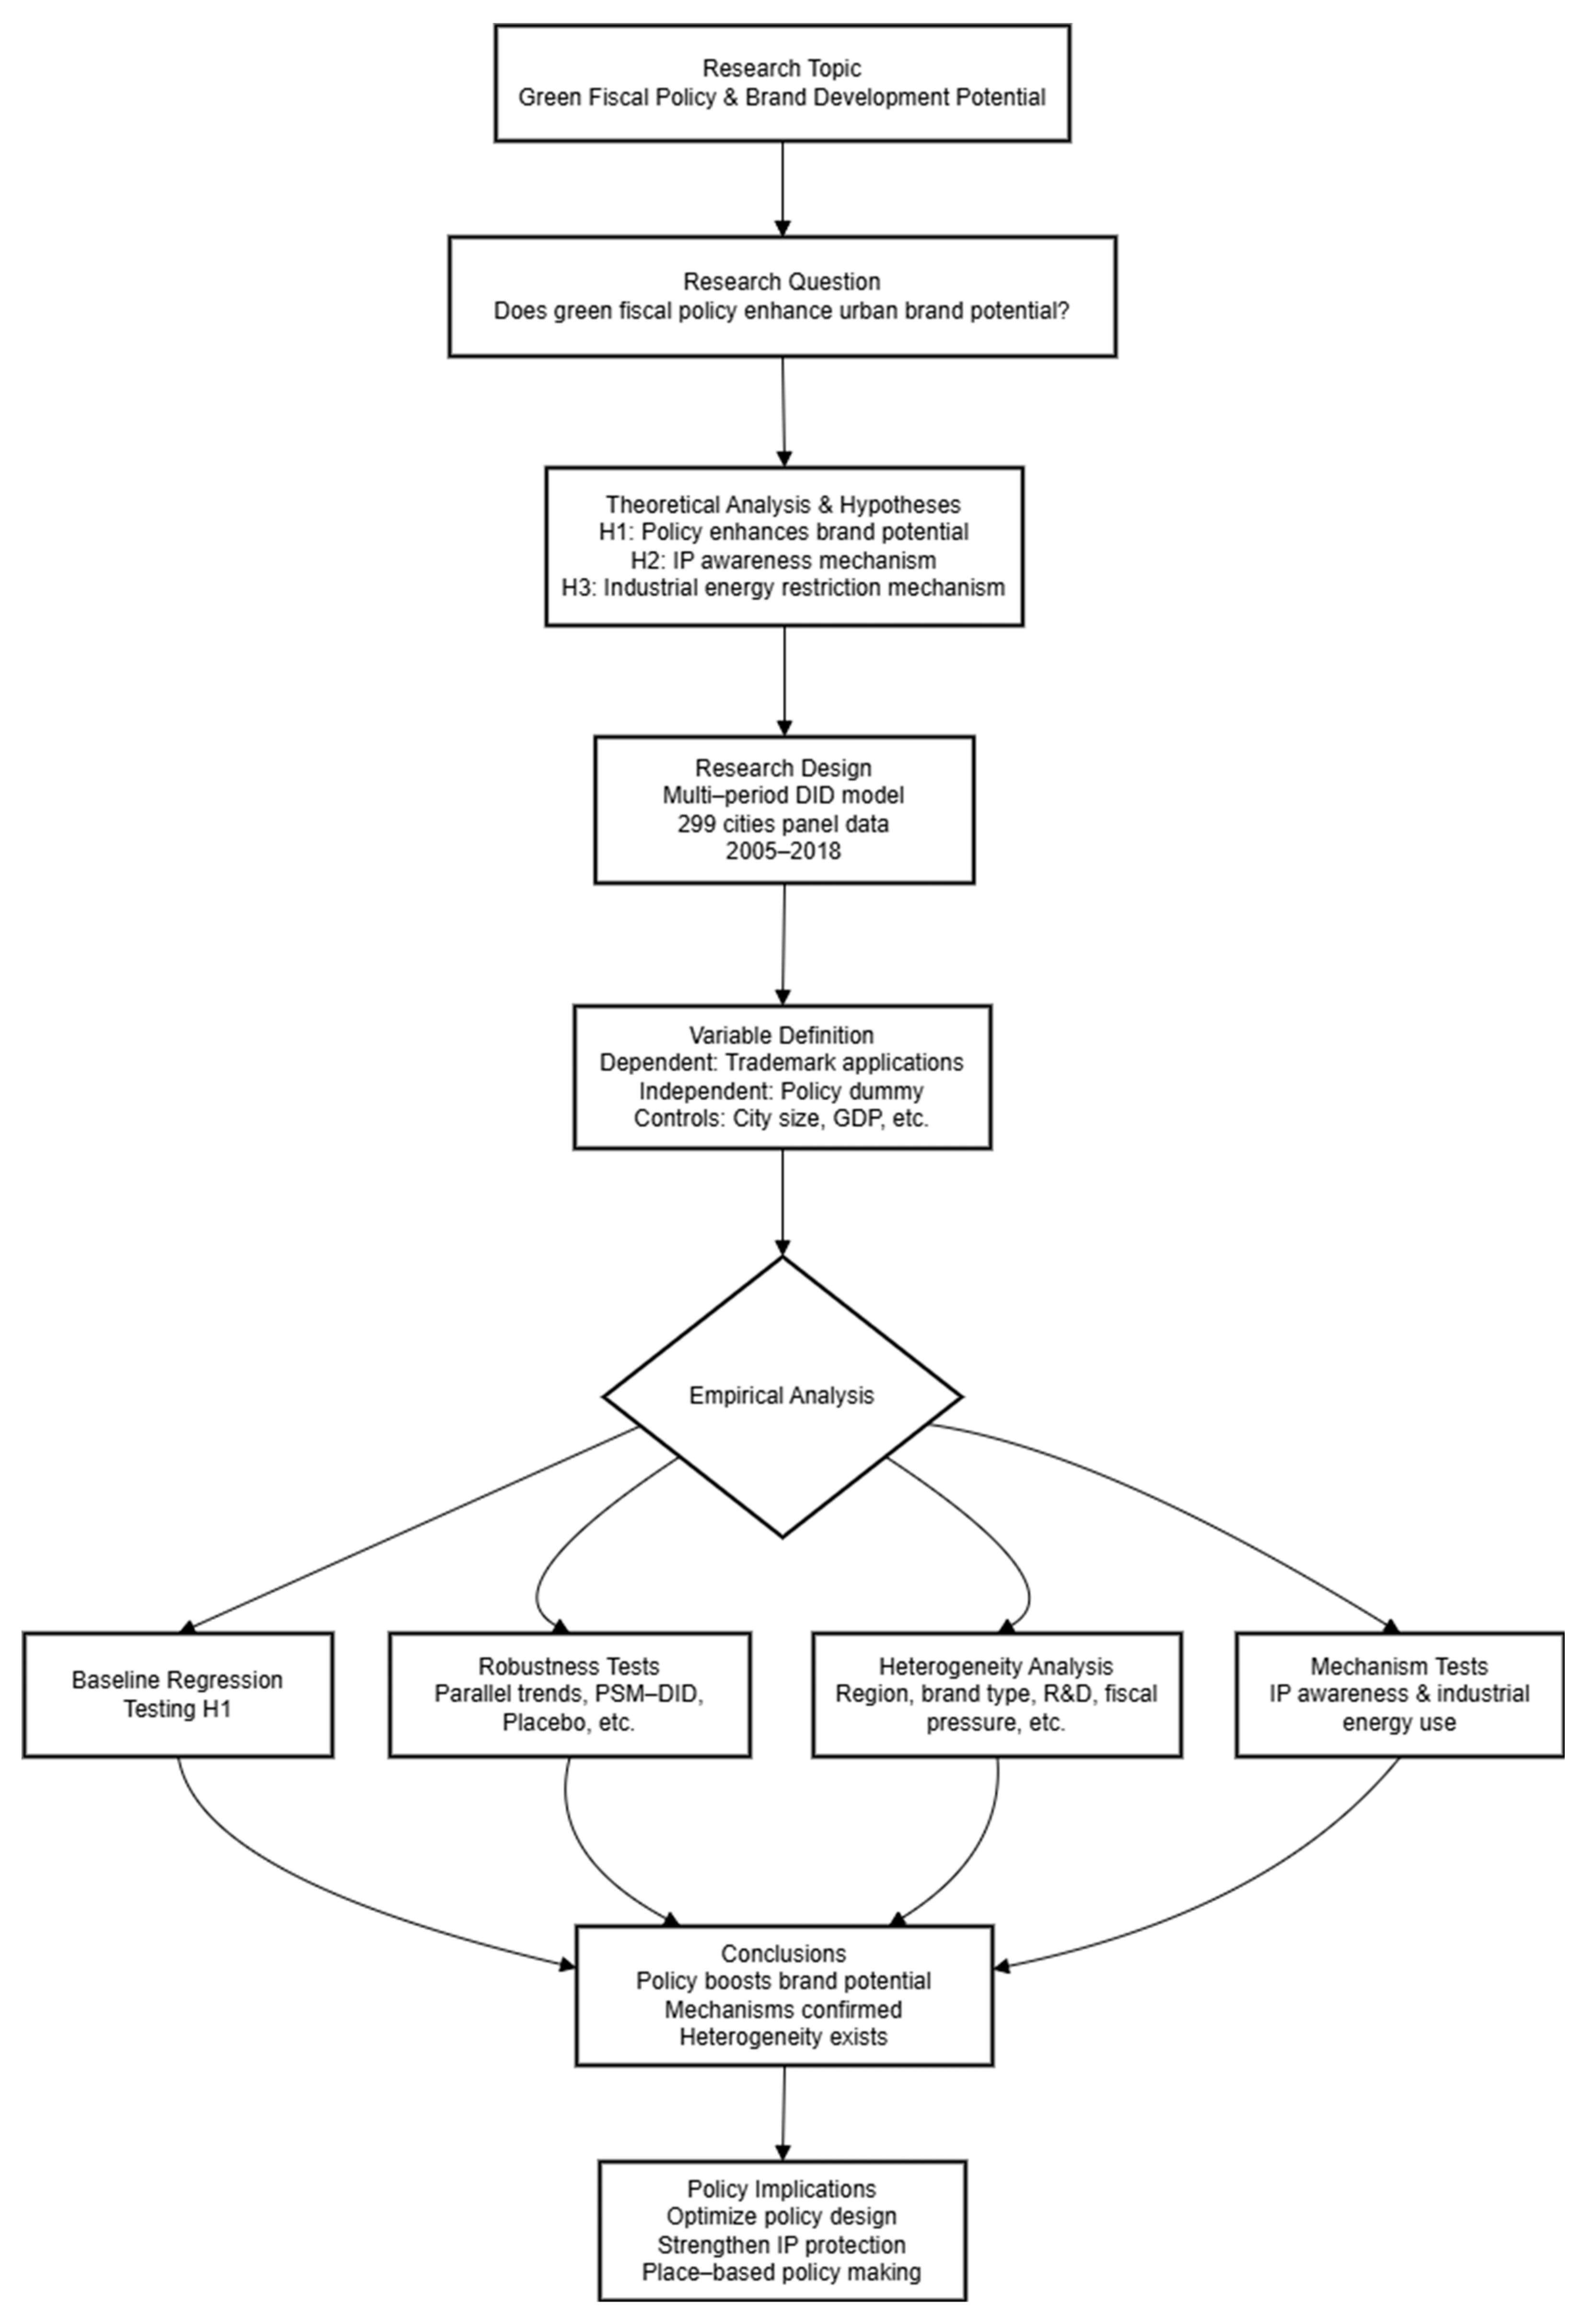
The implementation and analysis process of this study is shown in Figure 1.

5. Analysis of Empirical Result

5.1. Baseline Regression

To address the potential bias of heavy tailed distributions in the dependent variable, we follow the latest best practices in empirical economics and used Poisson pseudo maximum likelihood (PPML) estimation with high-dimensional fixed effects [74]. This method is specifically designed for non-negative, skewed dependent variables with many zeros and outliers. It produces robust estimates without the need for arbitrary transformations like log (y + 1) and can perform consistent inference even under heteroscedasticity. The baseline regression findings regarding the effects of energy-saving and emission-reducing fiscal policies on the development potential of domestic brands are presented in Table 3. Columns (1) and (2), respectively, denote the regression outcomes excluding and including control variables. Both columns show that the coefficient of the policy variable is significantly positive, regardless of whether control variables are included. The estimated coefficients are 0.247 in column (1) and 0.235 in column (2), and both significant at the 1% level. This finding suggests that the pilot initiative for comprehensive demonstration of cities under energy-saving and emission-reducing fiscal policies contributes to enhancing the overall development potential of domestic brands. Therefore, Hypothesis 1 is supported.
Columns (3) and (4) in Table 3 present the regression findings regarding the effects of energy-saving and emission-reducing fiscal policies on the development potential of product brands. The results reveal that, regardless of whether control variables are excluded or included, the regression coefficients of the policy variable remain significantly positive at the 1% significance level, with respective values of 0.251 and 0.244. Under the same set of control variables, both coefficients are higher than those related to the overall development potential of city brands. This suggests that the influence of energy-saving and emission-reducing fiscal policies on brand development potential is primarily manifested in boosting the development potential of product brands. Columns (5) and (6) present the regression findings concerning the effects of energy-saving and emission-reducing fiscal policies on the development potential of service brands. In both scenarios, the coefficients of the policy variable lack statistical significance, suggesting that the policy exerts no significant promotional effect on the development potential of service brands. A possible explanation is that product brands represent tangible goods, which mainly belong to the primary and secondary industries, whereas service brands represent intangible services, which mainly belong to the tertiary industry. The primary objective of energy-saving and emission-reducing fiscal policies is to urge local governments to attach greater importance to environmental governance. The primary and secondary industries, as the main areas of high pollution and high emissions, are inevitably the key targets of the demonstration city initiatives. Under the impetus of local government pressure, primary and secondary industries will expedite green technological innovation to attain energy-saving and emission-reducing targets, phase out obsolete production capacities, and boost the output of green and innovative products. In this process, the conversion rate of research and development achievements into patents can also be improved. In other words, the development potential of product brands in the primary and secondary industries will increase under the influence of fiscal policy. In contrast, the tertiary industry, as the main source of service brands, is not a major contributor to environmental pollution and thus is not significantly impacted by energy-saving and emission-reducing fiscal policies. Consequently, the policy exerts no significant positive effect on enhancing the development potential of service brands.
To summarize, using separate analysis of the effects of energy-saving and emission-reducing fiscal policies on the development potential of product brands and service brands, the results show that the significant increase in the overall brand development potential of demonstration cities is mainly due to the policy’s regulation of the primary and secondary industries. This leads to a notable rise in product-based innovation output. This suggests that the energy-saving and emission-reducing fiscal policy can exert an effective role. While promoting environmental governance, it also helps enhance the development potential of domestic brands in China. It is worth noting that although the adjusted R2 in this study is as high as 0.989, the core findings of this research are based on the magnitude, significance, and sign of the policy variable’s coefficient. Therefore, our core DID coefficient consistently remains statistically significant across all regression models, indicating that the impact of green fiscal policy on urban brand development potential is substantive and economically meaningful. This finding strongly supports our research conclusions.

5.2. Robustness Test

5.2.1. Parallel Trend Test

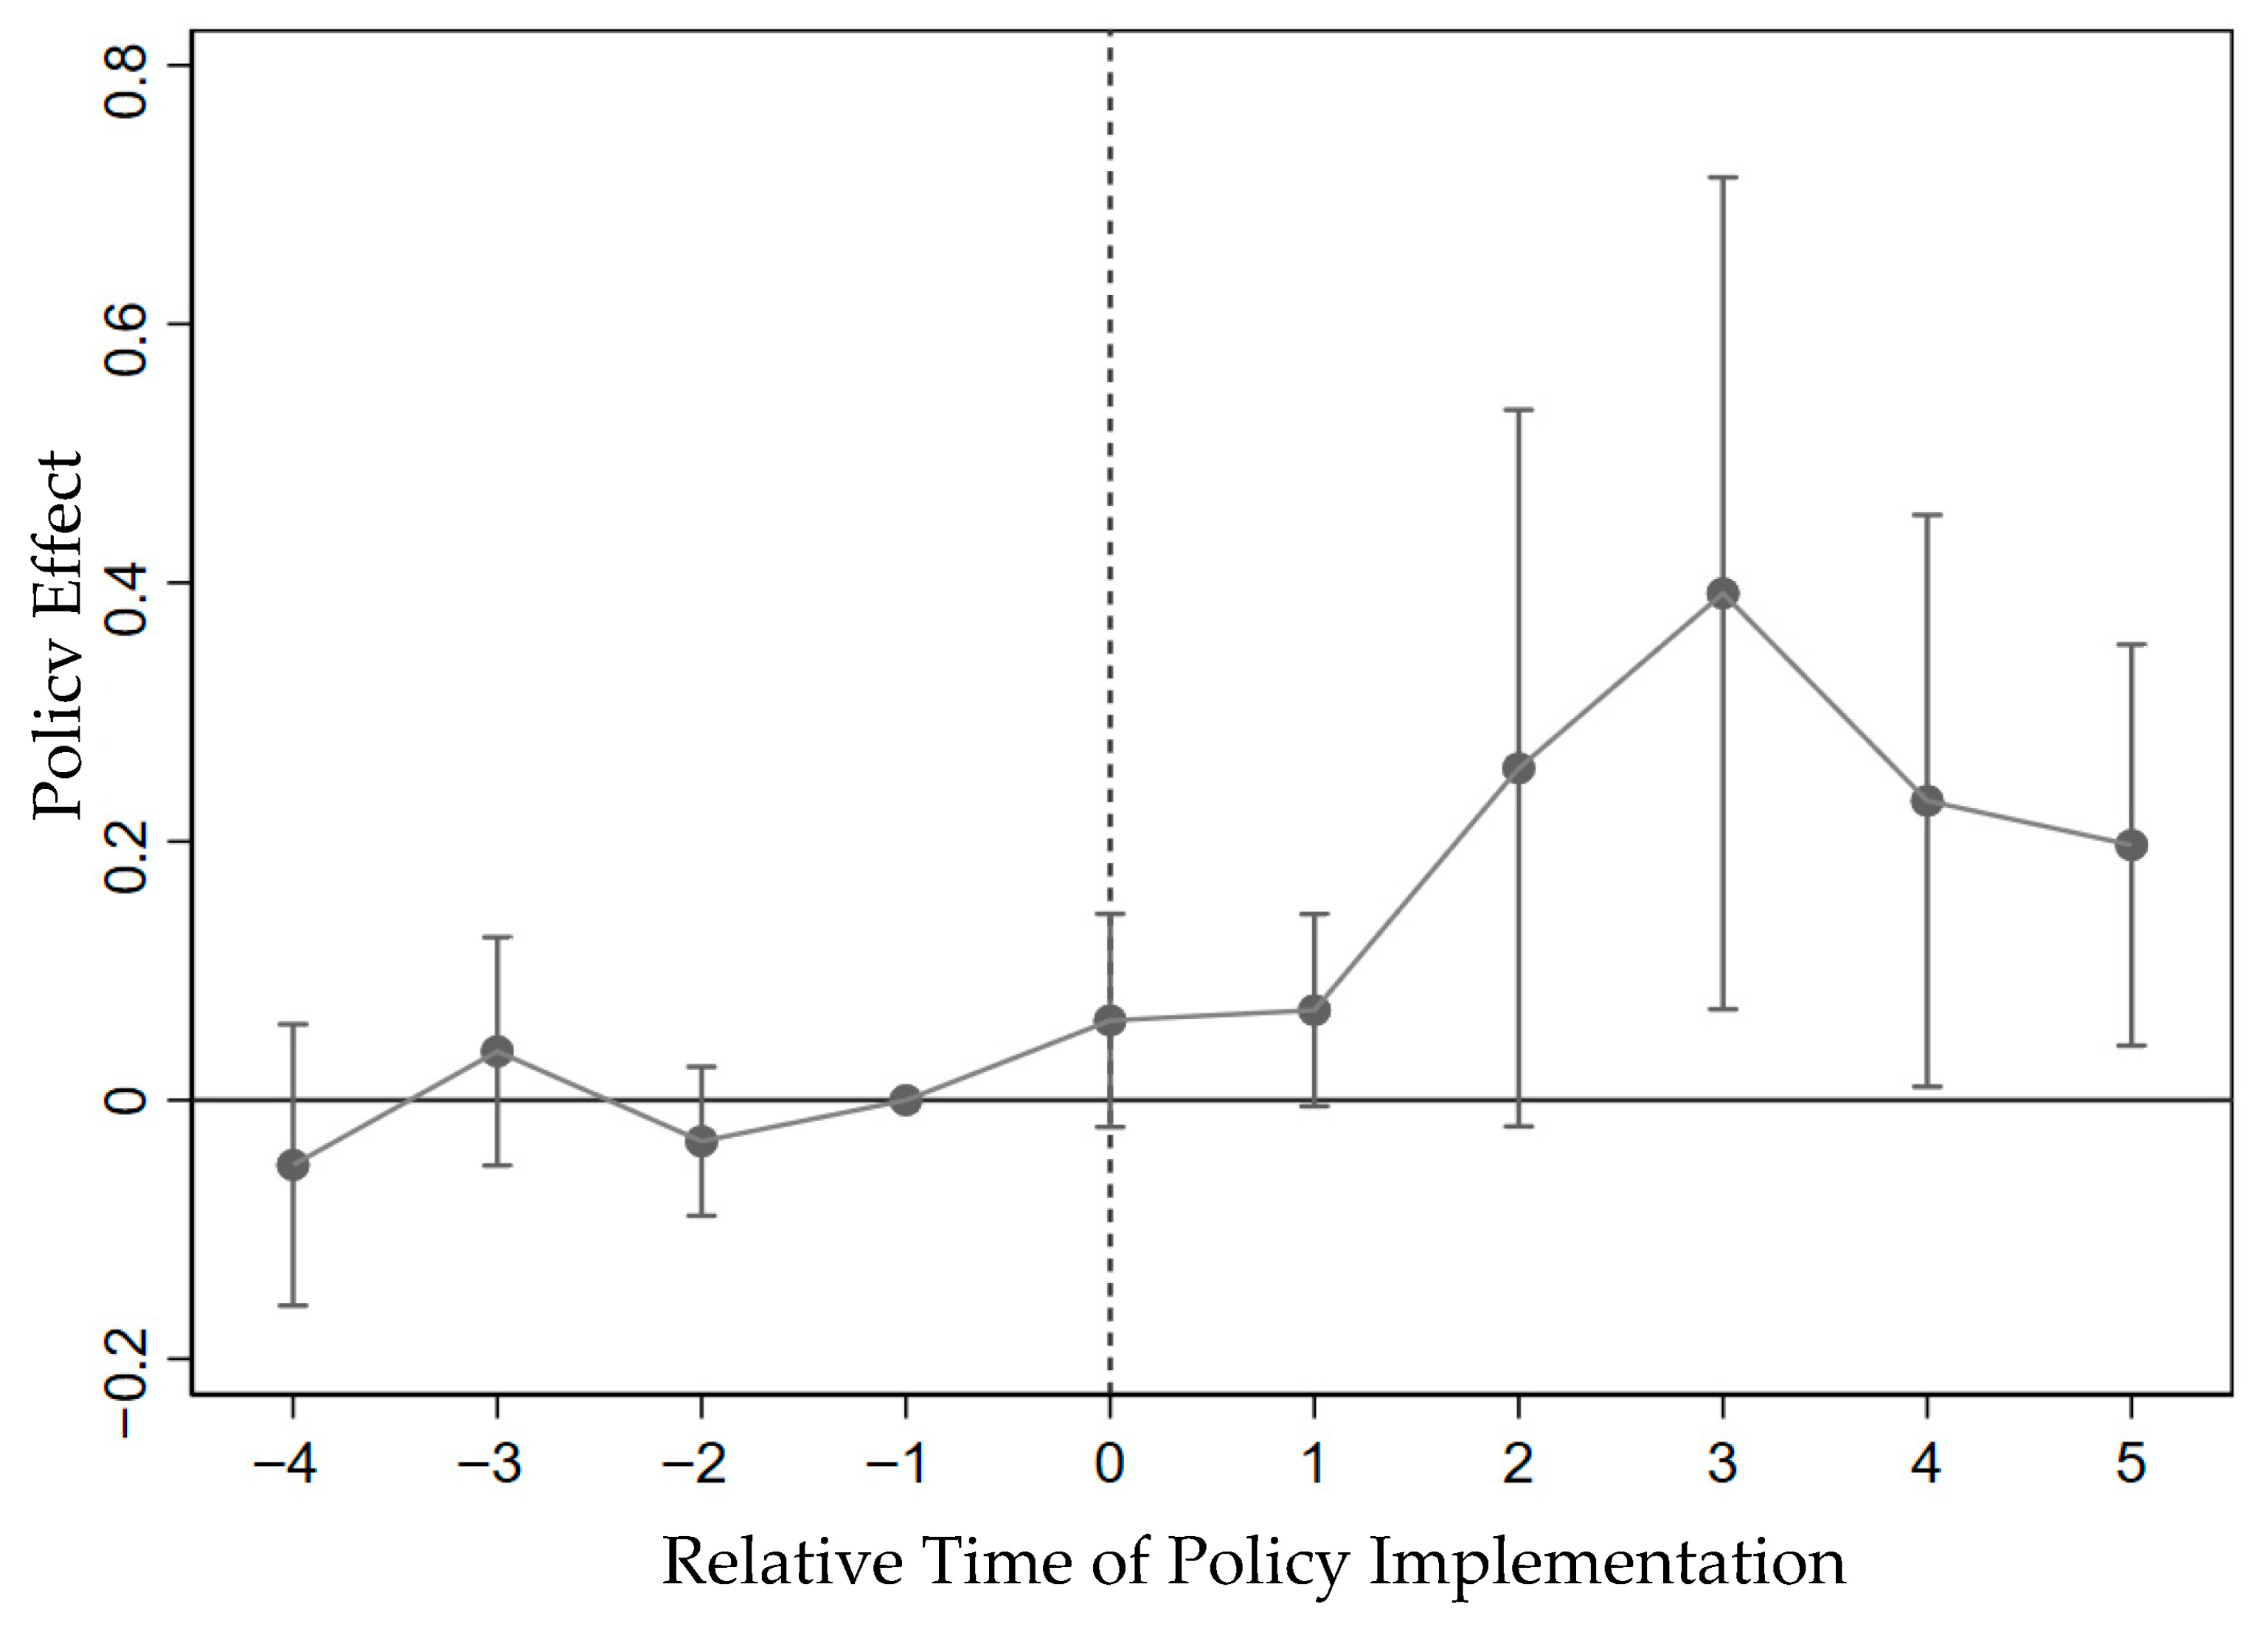
The notable increase in the overall brand development potential across cities may not stem from the pilot implementation of energy-saving and emission-reducing fiscal policies. It could potentially be affected by unobservable factors. To verify the effectiveness of the policy, the parallel trend assumption must be satisfied before applying the difference-in-differences model. This requires that the treatment group and the control group follow a consistent trend before the policy pilot, and a significant difference must emerge between the two after the policy pilot. Therefore, this research takes the year before the policy implementation as the base period. Figure 2 presents the dynamic effects of energy-saving and emission-reducing fiscal policies on brand development potential. Prior to the implementation of the comprehensive demonstration pilot, the mean values of the treatment group cities and control group cities exhibited fluctuations around zero, indicating no significant disparity between the two groups, with the brand development potential trends of demonstration cities and non-demonstration cities showing overall similarity. In the first and second years after the policy implementation, the policy did not significantly promote the overall brand development potential of cities. A possible reason is that that a certain amount of time is needed between the issuance of the policy and its implementation and actual impact. Thus, the effect of energy-saving and emission-reducing fiscal policies on the overall urban brand development potential exhibits a certain time lag. Nevertheless, as the pilot policy advances, the mean values of the treatment and control groups display an upward tendency and gradually diverge significantly from zero, confirming that the parallel trend assumption holds.

5.2.2. Placebo Test

To further confirm that the increase in the overall brand development potential of demonstration cities is caused by the pilot implementation of energy-saving and emission-reducing fiscal policies, rather than by other random factors, this study generates a pseudo-policy dummy variable. Specifically, 30 cities are randomly chosen as the treatment group, with the remaining cities functioning as the control group. Subsequently, a random year for policy implementation is assigned to each city in the treatment group. Based on model (1), the regression is re-estimated, and this procedure is repeated 1000 times to obtain the distribution of estimated coefficients and p-values from the 1000 regressions. The results are shown in Figure 3. The results indicate that the estimated coefficients from the randomly generated pseudo-policy are centered around zero, whereas the policy coefficient from the baseline regression (0.235) appears as an outlier in the placebo test. Furthermore, the distribution of the estimated coefficients approximates normality. This implies that the conclusion—that the pilot initiative of energy-saving and emission-reduction fiscal policies in demonstration cities enhances the development potential of domestic brands—is not attributable to chance or random factors. It thereby reinforces the robustness of the baseline regression findings.

5.2.3. Propensity Score Matching Combined with the Difference-in-Differences (PSM-DID) Approach

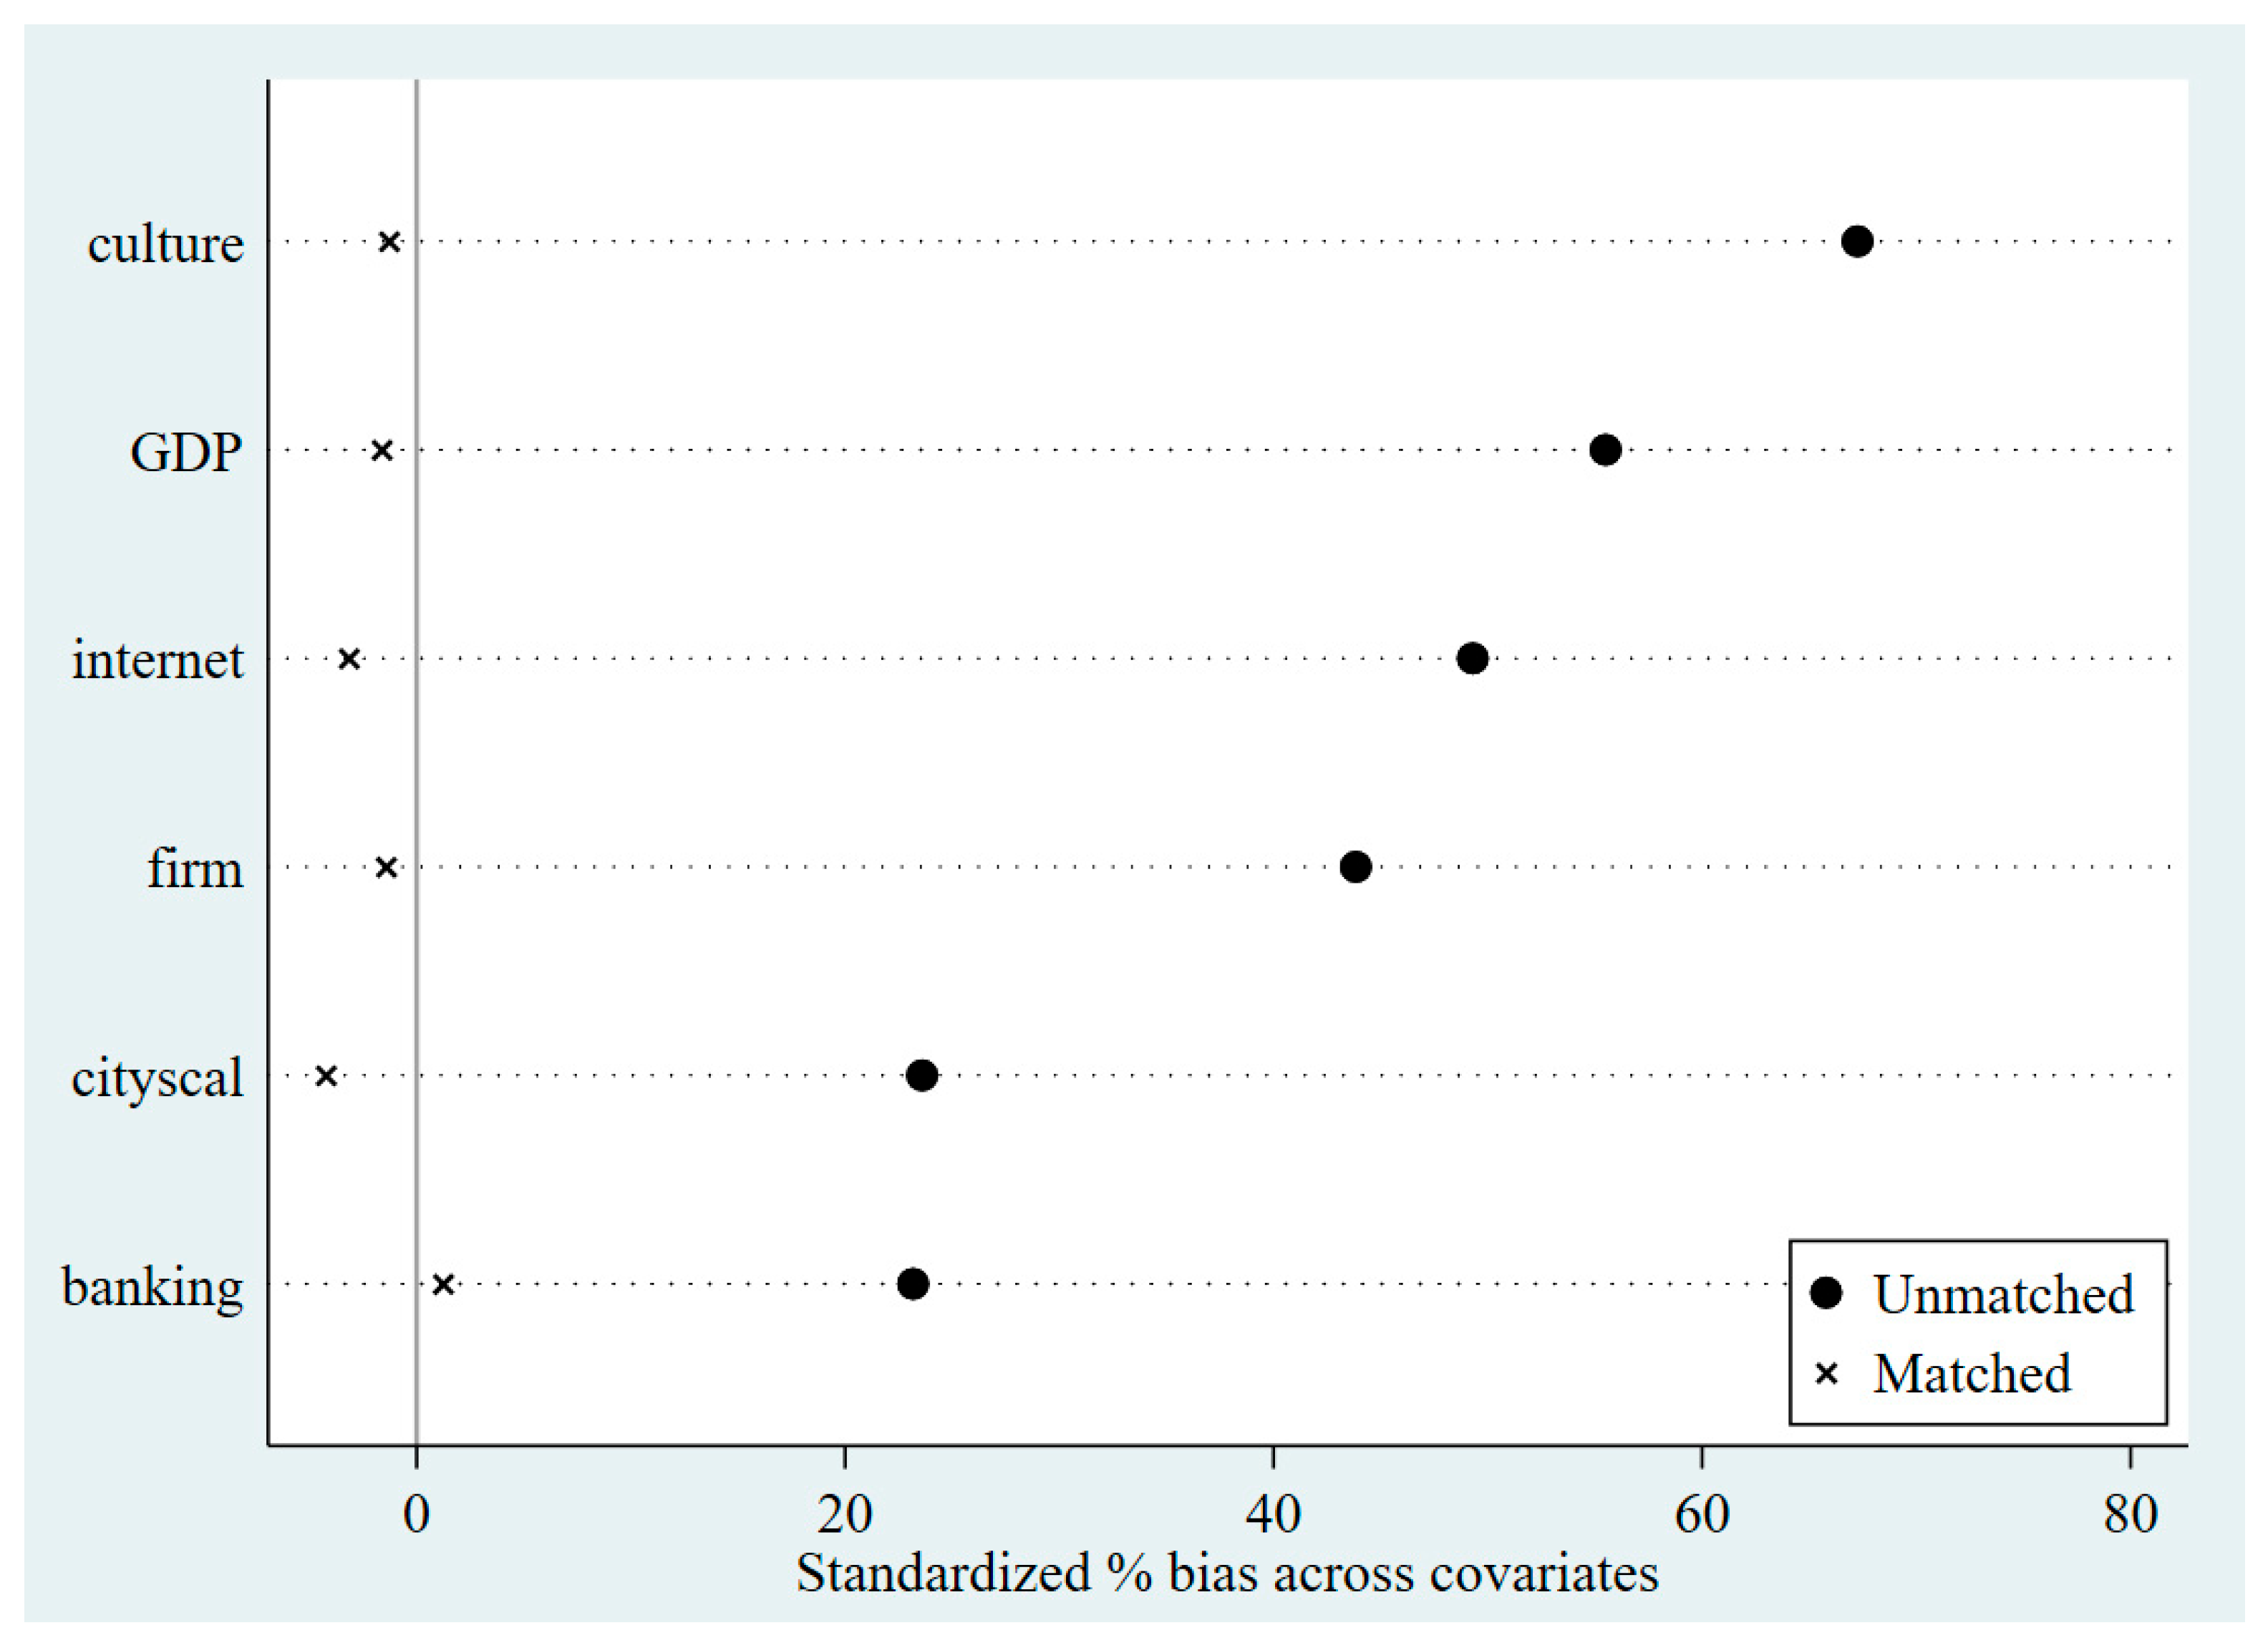
Given the potential systematic disparities between the treatment and control groups, coupled with the non-random selection of demonstration cities, sample selection bias may arise. To ensure greater similarity in characteristics between the two groups, this study employs the PSM-DID method for robustness checks. Initially, the propensity score matching (PSM) approach is utilized to generate matched samples, with control variables serving as matching criteria. A 1:2 nearest neighbor matching method is employed to identify non-demonstration cities that are most similar to demonstration cities under the energy-saving and emission-reducing fiscal policy, and these are subsequently designated as the control group. Then, the multi-period difference-in-differences method is used to test the policy effect between the control group and the treatment group. Figure 4 illustrates that propensity score matching eliminates characteristic disparities between the treatment and control groups, thereby mitigating sample selection bias. As presented in column (1) of Table 4, the regression coefficient of the policy variable stands at 0.131 and is significantly positive at the 5% level. This confirms the robustness of the conclusion that energy-saving and emission-reducing fiscal policies significantly boost the development potential of domestic brands in China.

5.2.4. Precise DID Tests

In the baseline regression, this study assumes that the policy implementation timeframe for each batch of demonstration cities commences in January of the implementation year. In practice, the initiation of the energy-saving and emission-reducing fiscal policy pilot across different batches of demonstration cities did not occur in January, and the conventional method fails to account for potential variations in policy effects arising from the shorter duration of policy implementation in the initial year of each batch. To ensure the robustness of the findings, this study tightens the identification criteria for policy implementation years, replacing the core explanatory variable “policy” in the baseline regression with “Did_jingzhun”. Specifically, the first batch of demonstration cities started the policy in June 2011, the second batch in October 2013, and the third batch in October 2014. The values of the Did_jingzhun variable are assigned as follows. For the first batch, Did_jingzhun is set to 0 for years before 2011, 1/2 for 2011, and 1 for all subsequent years. The same logic applies to the second and third batches based on their respective starting years.
As shown by the regression results in columns (2) of Table 4, concerning the association between energy-saving and emission-reducing fiscal policies and overall brand development potential, the coefficient of Did_jingzhun is 0.256, and it is significant at the 1% level. In comparison with the baseline regression coefficient of 0.235 in model (1), following precise adjustment of the policy implementation timeframe, the effect of energy-saving and emission-reduction fiscal policies on the overall brand development potential of demonstration cities has increased by 2%, confirming that such policies can effectively boost the development potential of domestic brands in China.

5.2.5. Excluding the Interference of Other Policies

In addition to energy-saving and emission-reducing fiscal policies, other policies may also affect the development potential of domestic brands. To eliminate estimation errors caused by the influence of other policies, this study adds dummy variables for other representative policies to model (1). These variables encompass the Smart City Pilot Policy introduced in 2012, the establishment of Pilot Free Trade Zones commencing in 2013, the Carbon Emissions Trading Pilot Policy launched in 2011, and the Low-Carbon City Pilot Policy enacted in 2010. These policy variables are represented by Did1, Did2, Did3, and Did4, respectively. The regression results are presented in column (3) of Table 4. Upon controlling for the effects of other policies, the coefficient of the “policy” variable remains significantly positive at the 1% level, suggesting that these four policies did not introduce bias into the estimation outcomes.

5.2.6. Replacing the Dependent Variable

To further verify the robustness of the baseline regression findings, this study replaces the number of trademark applications per year in each city with the number of successfully registered trademarks per year as an alternative measure of brand development potential. The multi-period difference-in-differences approach is also employed to investigate the impact of energy-saving and emission-reduction fiscal policies on brand development potential in China. Column (4) of Table 4 reports the regression results following the replacement of the dependent variable. The findings reveal that the coefficient of the policy variable remains significantly positive at the 1% level, suggesting that the energy-saving and emission-reducing fiscal policy can significantly boost brand development potential, thereby further validating the baseline regression results.

5.2.7. Other Robustness Tests

  • Excluding the Influence of Provincial Capitals and Cities with Independent Planning Status
In assessments of the impact of energy-saving and emission-reducing fiscal policies on the development potential of domestic brands, the economic development level of cities may exert an influence on the baseline regression results. The observed increase in brand development potential may be driven by the rapid growth of economically developed cities, rather than by the policy itself. To avoid this possibility, this study excludes provincial capital cities and cities with independent planning status (Dalian, Qingdao, Ningbo, Xiamen, and Shenzhen) from the sample. After re-estimating the model based on specification (1), the results are reported in columns (1) and (2) of Table 5. The results indicate that, even after excluding the impact of cities with relatively high economic development, the positive effect of energy-saving and emission-reducing fiscal policies on brand development potential remains significant, thereby further validating the robustness of the baseline regression findings.
2.
Changing the Clustering Level
Considering that certain cities or provinces may experience random shocks in specific years that affect the development potential of domestic brands, this study further clusters the regression results at both the city-year level and the province-year level during the estimation process. This approach controls for internal factors within cities or provinces at a given time that may influence the regression results. As presented in columns (3) and (4) of Table 5, following clustering at different levels, the coefficient of the energy-saving and emission-reducing fiscal policy remains significantly positive at the 1% level, thereby further validating the robustness of the baseline regression findings.

5.3. Heterogeneity Analysis

5.3.1. Regional Heterogeneity

Given the uneven economic development across China’s regions, the same policy may yield divergent effects in eastern, central, and western areas. To explore the heterogeneous impact of energy-saving and emission-reducing fiscal policies on the development potential of domestic brands, the full sample is partitioned into three regional subgroups, including eastern, central, and western, and regressions are performed using model (1). The results are reported in Table 6. In the eastern region, the policy significantly improves the overall brand development potential of cities, but it only promotes the development potential of product brands and exerts no significant impact on service-oriented brands. In the central region, the policy exerts no significant influence on brand development potential. In the western region, the policy boosts the development potential of both product brands and service brands.
Overall, energy-saving and emission-reducing fiscal policies significantly boost brand development potential in eastern and western regions, whereas the regression coefficient for central region cities lacks statistical significance. One plausible explanation is that the eastern region features a higher economic development level, accompanied by more abundant funding and more sophisticated human resources for green innovation. Relative to central and western regions, eastern cities exhibit greater efficiency in eliminating high-energy-consuming and high-polluting production capacities, leading to more substantial policy-induced benefits in the eastern region. Although cities in the western region have less financial support and fewer innovation resources than those in the eastern and central regions, industrial pollution in the west is relatively low. After the policy is implemented, cities in the western region are more likely to respond effectively and receive financial support through policy incentives. This encourages brand building in the western region. In the central region, cities lack both sufficient research and development funding and the necessary infrastructure to support innovation, as seen in the east, and also cannot respond to the policy as effectively as cities in the west to qualify for financial incentives. Thus, the policy exerts no significant impact on brand development potential in the central region.

5.3.2. Brand Heterogeneity: “Time-Honored Chinese Brands”

“Time-Honored Chinese Brands” refer to products or services with a long history and rich cultural heritage in China. As these brands represent regional characteristics and traditional culture, the number of such brands varies across cities, which may influence the total number of trademark applications. Drawing on the official list released by the Ministry of Commerce, this study ascertains the quantity of “Time-Honored Chinese Brands” in each city. Cities are grouped by year, using the annual median as the cutoff. Cities with a number of brands above the median are classified as the high group, whereas those below the median form the low group. The regression results in Table 7 show that, in cities with more “Time-Honored Chinese Brands”, the energy-saving and emission-reducing fiscal policy significantly enhances brand development potential. Nevertheless, in cities with a smaller number of such brands, the policy exerts no significant impact. A possible reason is that “Time-Honored Chinese Brands” are associated with high quality and strong service standards. Cities with more of these brands are more likely to value business integrity, which helps foster a positive commercial environment and supports brand building.

5.3.3. Heterogeneity in Research and Development Investment

Differences in local government investment in research and development may also lead to varying impacts on brand development. This study uses the logarithm of annual science and technology expenditure in each city as a proxy for R&D investment. Using the median as a threshold, the full sample is partitioned into cities with high R&D investment and those with low R&D investment. The findings of the heterogeneity test are presented in Table 8. In cities with higher R&D investment, the energy-saving and emission-reducing fiscal policy exerts a significant positive effect on brand development potential. In cities with lower research and development investment, the policy coefficient is not statistically significant. A possible explanation is that strong research and development investment provides solid support for technological innovation and helps develop high-quality brands. In contrast, in cities with limited research and development investment, although the policy may impose constraints on production methods, the lack of funding for innovation fails to stimulate green innovation. This limits progress in brand development.

5.3.4. Fiscal Pressure Heterogeneity

When local governments confront persistent fiscal revenue expenditure imbalances, the effectiveness of energy-saving and emission-reducing fiscal policies may be constrained. To verify this hypothesis, this study constructs a fiscal pressure index based on the ratio of the gap between local general public budget expenditure and revenue to local general public budget revenue. Taking the median of local fiscal pressure from 2010 to 2018 as the cutoff, cities are categorized into high and low fiscal pressure groups for separate regression analyses, with the results presented in Table 9. In the low fiscal pressure group, the coefficient of the policy variable is statistically significant. In contrast, in the high fiscal pressure group, the policy effect is not significant. This finding suggests that excessive fiscal pressure may weaken the effectiveness of the policy. A possible reason is that when local governments experience fiscal constraints, they lack the incentive to meet energy-saving and emission reduction targets. Even when financial incentives are available, they may be insufficient. In cities with high fiscal pressure, resources may not be effectively allocated, leading to waste and hindering innovation activities, which limits further development of brand potential.

5.3.5. Heterogeneity in Urban Resource Endowment

To examine whether variations in urban resource endowments induce heterogeneous effects of the pilot policy on brand development potential, this study partitions the sample into two subgroups, namely, resource-based cities and non-resource-based cities, according to the State Council’s National Sustainable Development Plan for Resource-Based Cities (2013–2020). The results of the grouped regressions are presented in Table 10. The findings reveal that in resource-based cities, the energy-saving and emission-reducing fiscal policy exerts no significant impact on brand development potential. However, in non-resource-based cities, the policy significantly promotes both overall brand development potential and product brand development potential, with significant coefficients at the 1% level. A possible explanation is that resource-based cities rely heavily on resource extraction and related industries, making their industrial structure relatively narrow. This makes it difficult for enterprises to undergo transformation, which is unfavorable for fostering an environment of sustainability and technological innovation. In addition, the lack of industrial diversity may limit the inflow of diverse talent, weakening human capital support for brand development.

5.3.6. Heterogeneity in the Degree of Marketization

Variations in urban marketization levels may result in divergent effects of energy-saving and emission-reducing fiscal policies on brand development potential. Drawing on the city-level marketization index from the China Provincial Marketization Index Report, this study gauges urban marketization levels and annually partitions the sample into high- and low-marketization groups using the median as the threshold. As shown in Table 11, the regression results demonstrate that in cities with higher marketization, the policy significantly boosts brand development potential. Conversely, in cities with lower marketization, the policy coefficient lacks statistical significance. One plausible explanation is that cities with a high degree of marketization offer a more open and transparent business environment. Firms in these cities have better access to financing and face more intense competition, which increases their motivation to enhance competitiveness through technological innovation. Consequently, enterprises are more inclined to pursue innovation-driven brand development, improving brand potential. In less marketized cities, firms have lower operational flexibility and face higher financing costs. This increases the cost of innovation, making it more difficult for the policy to promote brand development potential.

6. Mechanism Test

6.1. Intellectual Property Awareness

As analyzed in the previous section, under fiscal incentives, energy-saving and emission-reducing fiscal policies are capable of boosting the development potential of domestic brands by encouraging demonstration cities to strengthen their awareness of intellectual property protection. To test Hypothesis 2, this study sets up the following model for mechanistic analysis:
l n z h i s h i i t = β 0 + β 1 p o l i c y i t + γ c o n t r o l i t + μ i + σ t + ε i t
The variable lnzhishi is employed as a proxy for a city’s overall intellectual property awareness, which reflects the city’s overall focus on intellectual property. This study collects the total number of searches for the keywords “trademark” and “intellectual property” on the Baidu Index from 2005 to 2018 in each sample city and takes the logarithm of this value to construct a city-level intellectual property awareness indicator. lnzhishi is a proxy variable rather than a direct measurement indicator of intellectual property awareness. Due to the limitations of direct measurement of intellectual property awareness in data availability, lnzhishi is used to indirectly reflect the role of mediating mechanisms.
The findings of the mechanism test are presented in Table 12. As shown in column (1), the regression result reveals that the coefficient of the energy-saving and emission-reducing fiscal policy stands at 0.368, which is significant at the 1% level. This indicates that the policy significantly reinforces cities’ overall awareness of intellectual property. To further explore whether heightened intellectual property awareness influences the total number of trademark applications in cities, this study incorporates the variable into model (1). Column (2) of Table 12 displays the regression results. Specifically, although the energy-saving and emission-reducing fiscal policy variable remains significant at the 1% level, its coefficient is smaller than that in the baseline regression. The coefficient for intellectual property awareness is 0.061, which is significant at the 5% level. These results provide evidence that the energy-saving and emission-reducing fiscal policy enhances the development potential of domestic brands by strengthening cities’ overall awareness of intellectual property protection, thus offering support for Hypothesis 2.

6.2. Limiting Industrial Energy Consumption

According to the theoretical description of Hypothesis 3, demonstration cities, under the pressure of environmental regulations, will limit industrial energy consumption to achieve energy-saving and emission-reducing goals. At the same time, to reduce the costs imposed by environmental regulations, demonstration cities tend to strengthen innovation and technology development, which enhances the development potential of domestic brands. To test whether this mechanism holds, this study constructs the following model:
e l e c i t = ω 0 + ω 1 p o l i c y i t + γ c o n t r o l i t + μ i + σ t + ε i t
The variable elec is employed as a proxy for industrial energy consumption. This study develops the indicator using the ratio of industrial electricity consumption to total urban electricity consumption in each sample city. This indicator is a proxy variable rather than a direct measurement indicator of “energy consumption”. ω1 denotes the coefficient reflecting the impact of energy-saving and emission-reducing fiscal policies on industrial energy consumption in demonstration cities. Column (3) of Table 12 shows that the coefficient is −0.032, which is significantly negative at the 5% level, indicating that the policy significantly reduces industrial energy consumption in demonstration cities. To further test the validity of this mechanism, the variable elec is added to model (1). The regression results in column (4) of Table 12 show that the coefficient of policy is 0.239 and significantly positive at the 1% level. This coefficient is larger than that in the baseline regression. The coefficient for elec is −0.173, suggesting that energy-saving and emission-reducing fiscal policies enhance brand development potential in China by curbing industrial energy consumption in demonstration cities. This thus supports Hypothesis 3. In summary, our empirical results provide evidence that green fiscal policy may indirectly promote the brand development potential of cities by influencing intellectual property protection and technological advancements in energy conservation and emission reduction. Specifically, the increase in intellectual property awareness reflects to some extent the mediating role of intellectual property protection, whereas the reduction in industrial energy consumption suggests the potential mechanism of technological progress.

7. Discussion

This study provides a comprehensive empirical examination of the intricate relationship between green fiscal policy and urban brand development potential in China, offering novel insights into the nexus between environmental governance and economic dynamism at the city level. By employing a rigorous quasi-experimental design, our findings robustly confirm that China’s policy of “Comprehensive Demonstration for Fiscal Policies for Energy Conservation and Emission Reduction” significantly enhances the brand development potential of participating cities. This result not only aligns with but also significantly expands upon a growing body of prior literature that highlights the proactive role of environmental policies as a driver for innovation, technological upgrading, and competitive advantage [75,76,77]. For instance, although studies in Western contexts have often debated the Porter hypothesis [78], our research provides compelling empirical evidence from the world’s largest developing economy, demonstrating that top-down, incentive-based fiscal policies can indeed stimulate a virtuous cycle of environmental improvement and economic value creation. By focusing on brand development potential, a direct outcome of innovation and intellectual property, our research provides a more granular understanding of the specific mechanisms through which green policies translate into tangible economic benefits.
Our mediation analysis further reveals two critical pathways through which this policy operates: strengthening intellectual property protection awareness and promoting advancements in energy-saving and emission-reducing technologies. This finding is consistent with established theoretical frameworks suggesting that environmental regulations can spur a “compliance-driven” innovation effect, where firms invest in cleaner technologies to meet regulatory pressure, thereby fostering technological progress [79,80,81]. Our empirical evidence contributes to this body of work by substantiating these theoretical claims within the unique context of China’s state-led policy environment. The policy acts as a powerful signal, compelling local governments and enterprises to prioritize environmental goals, which subsequently catalyze innovation and technological shifts across various sectors.
The emphasis on intellectual property awareness as a mediating channel is a particularly novel contribution of this study. It extends the traditional understanding of green policy’s impact beyond mere technological and energy-efficient improvements [73,82]. Our findings suggest that green fiscal policies can have a broader, more systemic impact on a city’s institutional and legal landscape. When a city, under policy pressure and fiscal incentives, actively promotes intellectual property protection, it creates a more secure environment for innovation. This enhanced awareness and legal safeguard encourage firms to invest more in brand-building activities, knowing that their intellectual assets are better protected from infringement. As a result, the city fosters a more vibrant and competitive ecosystem where brand value can be accumulated and sustained over the long term. This finding highlights a previously underexplored dimension of green policy’s economic effects, suggesting that policymakers can use environmental incentives not only to curb pollution but also to strategically nurture a city’s brand equity and economic resilience.
Furthermore, our findings offer crucial policy implications for governments both in China and internationally that are seeking to harmonize environmental protection with economic growth. The success of China’s comprehensive demonstration policy suggests that a targeted, multi-faceted approach that combines fiscal incentives with performance-based criteria is an effective method to drive green innovation. Unlike fragmented or purely punitive environmental regulations, a holistic policy framework can create a positive feedback loop where public investment in green infrastructure and technologies stimulates private sector innovation, ultimately leading to stronger, more competitive brands. This approach serves as a compelling model for other nations navigating similar challenges, demonstrating that environmental policy and brand development are not mutually exclusive but can be mutually reinforcing. The policy’s success underscores the importance of a coordinated effort across government agencies to ensure that fiscal support for environmental goals is closely linked to broader economic development strategies, such as fostering brand reputation and competitiveness.

8. Conclusions and Policy Recommendations

8.1. Conclusions and Theoretical Positioning

This study employs the pilot program of “Comprehensive Demonstration Cities for Energy-Saving and Emission-Reduction Fiscal Policies” as a quasi-natural experiment. Leveraging the multi-period difference-in-differences approach and panel data of 299 Chinese cities spanning 2005 to 2018, this empirical research investigates the impact and mechanism of energy-saving and emission-reducing fiscal policies on domestic brand development in China. The fundamental theoretical contribution of this study is its pioneering role in linking a national green fiscal policy to the enhancement of urban non-material asset competitiveness (brand development potential), thereby expanding the literature beyond traditional outcomes like environmental quality and technological patents.
The key findings are as follows. First, in comparison with non-demonstration cities, energy-saving and emission-reducing fiscal policies effectively improve the brand-building efficiency of local governments. Empirical results show that under the policy, the development potential of domestic brands in demonstration cities increased by 23.5% compared with non-demonstration cities, which helps demonstration cities build influential brands. Second, energy-saving and emission-reducing fiscal policies mainly exert an influence on the brand development potential of primary and secondary industries, with no significant impact observed on the tertiary industry. A potential rationale is that, as a regulatory policy for environmental governance in demonstration cities, the fiscal policy promotes technological innovation in high-pollution and high-emission enterprises in the primary and secondary industries to meet energy-saving and emission-reducing targets. In this process, the rate of research and development output and patent applications naturally increases in these industries. In contrast, the tertiary industry is not a major contributor to pollution; thus, it is subject to less regulation under the fiscal policy. Third, mechanism analysis reveals that, under the fiscal incentives and environmental regulatory measures embedded in energy-saving and emission-reducing fiscal policies, demonstration cities increase trademark applications and enhance domestic brand development potential through improving intellectual property awareness and reducing industrial energy consumption. Fourth, the impact of demonstration city construction on domestic brands is delayed, with significant effects observed only in the third year after policy implementation. Fifth, energy-saving and emission-reducing fiscal policies exert a stronger impact in eastern and western cities relative to central cities. The policy is more effective in cities with more “Time-Honored Chinese Brands”, higher research and development investment, lower fiscal pressure, non-resource-based industries, and higher levels of marketization in promoting brand development potential.
In this sense, we can confirm that China’s energy-saving and emission-reducing fiscal policies have played an essential role in enhancing the development potential of domestic brands. By combining environmental regulation, fiscal incentives, and performance-based evaluations, the country model ensures a strong alignment between local initiatives and national objectives. This approach has supported technological innovation, encouraged industrial transformation, and strengthened the competitiveness of sustainability-oriented brands in key sectors of the economy.

8.2. Policy Implications and Advanced Recommendations

The findings of this study offer substantial and actionable insights for governments globally seeking to align environmental sustainability with long-term economic competitiveness. First, policymakers should transition from general fiscal subsidies to integrated, performance-contingent incentive mechanisms. Because the policy’s effectiveness is significantly mediated by the enhancement of intellectual property awareness, governments must design specialized strategies, such as establishing a “Green-IP Integration Fund”. In this model, fiscal support for energy conservation and emission reduction is contingent upon or significantly augmented by an enterprise’s demonstrable efforts in brand protection, including successful trademark registration and patent commercialization. This ensures that fiscal intervention is precisely calibrated to facilitate the formation and security of brand assets, thereby maximizing the policy’s sustainable economic return.
Second, the observed heterogeneity, particularly the policy’s weak impact on the tertiary (service) industry and in resource-based cities, necessitates a strategic adjustment. For the service sector, future policies must shift from reliance on regulatory pressure to proactive fiscal incentives (e.g., specialized tax credits and low-interest financing) designed to foster sustainable service brand innovation and the adoption of green business models. Furthermore, for resource-based and fiscally constrained regions, the focus should pivot from high-cost local industrial innovation to establishing inter-regional brand transfer and cooperation mechanisms. This strategy allows these cities to efficiently adopt successful green brand and IP models from high-marketization areas.
Third, the demonstrated rise in urban IP awareness must be sustained by robust institutional support. Governments must enhance measures to improve the conversion rate of IP outcomes into recognized brand value. This necessitates strengthening IP enforcement—particularly against infringement of high-value brands—by reducing the costs of litigation and ensuring swifter judicial resolution. Such institutional reinforcement is crucial for converting temporary, policy-driven innovation into sustained, protected, and influential domestic brand equity.
Finally, in light of the identified three-year lagged effect, policy evaluation systems should adopt a longer-term perspective that prioritizes brand equity and competitive growth alongside immediate emission reduction goals. Moreover, learning from international governance models, policymakers should explore mechanisms that increase local autonomy in tailoring specific performance metrics. This adaptability, combined with diversified funding channels (e.g., the issuance of green bonds), would optimize the policy’s efficacy based on the unique resource endowments and market maturity of each region.

8.3. Limitations and Future Research

Although this study employed robust econometric models to investigate the impact of green fiscal policy on brand development potential, several limitations warrant discussion.
First, it is important to note that the mediating mechanisms examined in this study rely on proxy variables rather than direct measurements. Specifically, intellectual property awareness (Inzhishi) serves as a proxy for intellectual property protection, whereas industrial energy consumption (elec) functions as a proxy for technological progress in energy conservation and emission reduction. The mediation evidence obtained through these variables should therefore be interpreted as indirect support for the underlying mechanisms, rather than as direct causal evidence. Second, a major constraint lies in the empirical analysis where the PSM-DID approach, despite effectively addressing endogeneity, led to a significant reduction in the effective sample size from 3980 to 955 observations. This substantial reduction may affect the generalizability of our findings, suggesting that the conclusions may be more representative of the successfully matched cities rather than all comprehensive demonstration cities for energy conservation and emission reduction. Future research could explore alternative research designs, such as panel fixed-effects models or other comprehensive econometric methods, to maximize the use of sample data while controlling for endogeneity. Third, brand development potential is a complex, multi-dimensional concept. This study primarily constructed its measure based on two core dimensions: innovation and intellectual property protection. However, it did not encompass other critical aspects such as brand awareness, consumer loyalty, or overall brand value. Future studies could aim to build a more comprehensive index to more precisely gauge brand development potential at the city level. Finally, our data primarily covers the period from 2008 to 2019. Although this timeframe effectively captures the policy’s effects, it does not include recent developments in green fiscal policy and branding trends, particularly those implemented after 2020 in the context of China’s “dual carbon” goals. Future research should incorporate updated data to continuously track and assess the long-term effects of these evolving policies. By addressing these limitations, future research can provide more holistic and profound insights into the relationship between green fiscal policy and urban brand development.

Author Contributions

L.Y.: conceptualization, methodology, supervision, funding acquisition, writing—original draft. Q.Z.: data curation, resources, visualization, methodology, writing—review and editing. J.-Z.A.I.: conceptualization, writing—original draft. Z.M.: project administration, writing—review and editing. J.J.: visualization, writing—original draft. All authors have read and agreed to the published version of the manuscript.

Funding

This research received no external funding.

Data Availability Statement

The data supporting the findings of this study (including original experimental data, the process of exploratory analysis, and its intermediate results) are currently stored in a controlled-access cloud disk to facilitate peer review and reader reading. Readers, editors, and reviewers can obtain the data using the following link and extraction code: Link: [https://pan.baidu.com/s/1Acebs9e1w-VpRZRB7ijJTA?pwd=p8ah]; Extraction code: [p8ah]. After the paper is finally accepted for publication, the dataset will be permanently archived here.

Acknowledgments

The author express thanks to Deng for sharing the data.

Conflicts of Interest

The authors declare no conflicts of interest.

References

  1. Nedergaard, N.; Gyrd-Jones, R. Sustainable Brand-Based Innovation: The Role of Corporate Brands in Driving Sustainable Innovation. J. Brand. Manag. 2013, 20, 762–778. [Google Scholar] [CrossRef]
  2. Brexendorf, T.O.; Bayus, B.; Keller, K.L. Understanding the Interplay between Brand and Innovation Management: Findings and Future Research Directions. J. Acad. Mark. Sci. 2015, 43, 548–557. [Google Scholar] [CrossRef]
  3. Andonova, V.; Losada-Otalora, M. Understanding the Interplay between Brand and Innovation Orientation: Evidence from Emerging Multinationals. J. Bus. Res. 2020, 119, 540–552. [Google Scholar] [CrossRef]
  4. Nadeem, W.; Ashraf, A.R.; Kumar, V. Fostering Consumer Engagement with Sustainability Marketing Using Augmented Reality (SMART): A Climate Change Response. J. Bus. Res. 2025, 192, 115289. [Google Scholar] [CrossRef]
  5. Belderbos, R.A.; Kazimierczak, M.; Goedhuys, M. Trademarks, Patents and the Appropriation Strategies of Incumbents: The Scope of New Firm Formation in European Regions. Reg. Stud. 2022, 56, 210–226. [Google Scholar] [CrossRef]
  6. Casprini, E.; Melanthiou, Y.; Pucci, T.; Zanni, L. Managing Founder-Based Brand Identity during Succession. J. Brand. Manag. 2020, 27, 1–14. [Google Scholar] [CrossRef]
  7. Bashir, M.F.; Pan, Y.; Shahbaz, M.; Ghosh, S. How Energy Transition and Environmental Innovation Ensure Environmental Sustainability? Contextual Evidence from Top-10 Manufacturing Countries. Renew. Energy 2023, 204, 697–709. [Google Scholar] [CrossRef]
  8. Taghizadeh-Hesary, F.; Dong, K.; Zhao, C.; Phoumin, H. Can Financial and Economic Means Accelerate Renewable Energy Growth in the Climate Change Era? The Case of China. Econ. Anal. Policy 2023, 78, 730–743. [Google Scholar] [CrossRef]
  9. Barbier, E. The Policy Challenges for Green Economy and Sustainable Economic Development. Nat. Resour. Forum 2011, 35, 233–245. [Google Scholar] [CrossRef]
  10. Li, M.; Zhang, L. Haze in China: Current and Future Challenges. Environ. Pollut. 2014, 189, 85–86. [Google Scholar] [CrossRef]
  11. Hewett, C.; Ekins, P. Environmental Fiscal Reform in Europe. An Overview of Policy and Politics of Implementing Environmental Fiscal Reform in Europe Between 1990 and 2013; Institute for European Environmental Policy: Brussels, Belgium, 2014. [Google Scholar]
  12. Fan, H.; Liang, C. The Pollutant and Carbon Emissions Reduction Synergistic Effect of Green Fiscal Policy: Evidence from China. Financ. Res. Lett. 2023, 58, 104446. [Google Scholar] [CrossRef]
  13. Du, Z.; Wang, Y. Does Energy-Saving and Emission Reduction Policy Affects Carbon Reduction Performance? A Quasi-Experimental Evidence in China. Appl. Energy 2022, 324, 119758. [Google Scholar] [CrossRef]
  14. Bi, S.; Kang, C.; Bai, T.; Yi, X. The Effect of Green Fiscal Policy on Green Technological Innovation: Evidence from Energy Saving and Emission Reduction Fiscal Policy. Environ. Sci. Pollut. Res. 2024, 31, 10483–10500. [Google Scholar] [CrossRef] [PubMed]
  15. Jin, H.; Yang, J.; Chen, Y. Energy Saving and Emission Reduction Fiscal Policy and Corporate Green Technology Innovation. Front. Psychol. 2022, 13, 1056038. [Google Scholar] [CrossRef] [PubMed]
  16. Eurpean Protection Agency The EU Emissions Trading System. Available online: https://www.epa.ie/our-services/licensing/climate-change/eu-emissions-trading-system-/ (accessed on 20 August 2025).
  17. Dueñas, M.; Mandel, A. Are EU Low-Carbon Structural Funds Efficient in Reducing Emissions? Cornell University Library: Ithaca, NY, USA, 2025. [Google Scholar]
  18. U.S. Environmental Protection Agency Summary of Inflation Reduction Act Provisions Related to Renewable Energy. Available online: https://www.epa.gov/green-power-markets/summary-inflation-reduction-act-provisions-related-renewable-energy (accessed on 21 August 2025).
  19. Haseeb, M.; Hossain, M.E.; Hossain, M.R.; Rehman, M.Z.; Bekun, F.V. Do the United States’fiscal Decentralization, Money Supply, and Environmental Policies Promote the Clean Energy Transition? Environ. Dev. Sustain. 2025. [Google Scholar] [CrossRef]
  20. Kaufman, N.; Saha, S.; Bataille, C. Finance and Development, June 2023: Green Trade Tensions. Financ. Dev. 2023, 60, 44–47. [Google Scholar]
  21. Bai, J.; Ma, W.; Wang, Y.; Jiang, J. Political Incentives in Market-Based Environmental Regulation: Evidence from China’s Carbon Emissions Trading Scheme. Heliyon 2024, 10, e25730. [Google Scholar] [CrossRef]
  22. Xu, T.; Kang, C.; Zhang, H. China’s Efforts towards Carbon Neutrality: Does Energy-Saving and Emission-Reduction Policy Mitigate Carbon Emissions? J. Environ. Manag. 2022, 316, 115286. [Google Scholar] [CrossRef]
  23. Zhao, A.; Song, X.; Li, J.; Yuan, Q.; Pei, Y.; Li, R.; Hitch, M. Effects of Carbon Tax on Urban Carbon Emission Reduction: Evidence in China Environmental Governance. Int. J. Environ. Res. Public Health 2023, 20, 2289. [Google Scholar] [CrossRef]
  24. Lin, B.; Zhu, J. Is the Implementation of Energy Saving and Emission Reduction Policy Really Effective in Chinese Cities? A Policy Evaluation Perspective. J. Clean. Prod. 2019, 220, 1111–1120. [Google Scholar] [CrossRef]
  25. Wang, Z.; Qiu, S. Can “Energy Saving and Emission Reduction” Demonstration City Selection Actually Contribute to Pollution Abatement in China? Sustain. Prod. Consum. 2021, 27, 1882–1902. [Google Scholar] [CrossRef]
  26. Han, G.; Zhang, X.; Pan, X. Study on Agricultural Carbon Emission Efficiency Calculation and Driving Path of Grain Production Department in China. Qual. Assur. Saf. Crops Foods 2025, 17, 201–216. [Google Scholar] [CrossRef]
  27. European Comission. The European Green Deal Striving to Be the First Climate-Neutral Continent. Available online: https://commission.europa.eu/strategy-and-policy/priorities-2019-2024/european-green-deal_en (accessed on 20 August 2025).
  28. Sikora, A. European Green Deal: Legal and Financial Challenges of the Climate Change. ERA Forum 2020, 21, 681. [Google Scholar] [CrossRef]
  29. Azhgaliyeva, D.; Hollis, A.; Pogge, T.; Rahut, D.; Yao, Y. Financing a Green Future: The Energy Transition Mechanism (ETM) and the Green Impact Fund for Technology (GIFT). In Think7 G7; Global Solutions Initiative Foundation gGmbH: Berlin, Germany, 2022. [Google Scholar]
  30. FACT SHEET: How the Inflation Reduction Act’s Tax Incentives Are Ensuring All Americans Benefit from the Growth of the Clean Energy Economy. Available online: https://home.treasury.gov/news/press-releases/jy1830 (accessed on 21 August 2025).
  31. US Departament of Treasury FACT SHEET: Four Ways the Inflation Reduction Act’s Tax Incentives Will Support Building an Equitable Clean Energy Economy. Available online: https://home.treasury.gov/system/files/136/Fact-Sheet-IRA-Equitable-Clean-Energy-Economy.pdf (accessed on 20 June 2025).
  32. Koseoglu, A.; Yucel, A.G.; Ulucak, R. Green Innovation and Ecological Footprint Relationship for a Sustainable Development: Evidence from Top 20 Green Innovator Countries. Sustain. Dev. 2022, 30, 976–988. [Google Scholar] [CrossRef]
  33. Rubashkina, Y.; Galeotti, M.; Verdolini, E. Environmental Regulation and Competitiveness: Empirical Evidence on the Porter Hypothesis from European Manufacturing Sectors. Energy Policy 2015, 83, 288–300. [Google Scholar] [CrossRef]
  34. Liu, S.; Mai, Q.; Chen, X. The Province-Managing-County Reform and Green Innovation of Enterprises: Evidence from the Quasi-Natural Experiment. Environ. Sci. Pollut. Res. 2022, 29, 88823–88838. [Google Scholar] [CrossRef]
  35. Wang, T.; Song, Z.; Zhou, J.; Sun, H.; Liu, F. Low-Carbon Transition and Green Innovation: Evidence from Pilot Cities in China. Sustainability 2022, 14, 7264. [Google Scholar] [CrossRef]
  36. Guo, Y.; Xia, X.; Zhang, S.; Zhang, D. Environmental Regulation, Government R&D Funding and Green Technology Innovation: Evidence from China Provincial Data. Sustainability 2018, 10, 940. [Google Scholar] [CrossRef]
  37. Yusof, Z.B. Evaluating the Efficacy of Eco-Innovation Incentives in Stimulating Green Technology Adoption within the Agricultural Sector: A Cross-Country Policy Review. Trans. Digit. Soc. Hum. Behav. Socioecon. Stud. 2025, 15, 1–8. [Google Scholar]
  38. Liu, S.; Xu, P.; Chen, X. Green Fiscal Policy and Enterprise Green Innovation: Evidence from Quasi-Natural Experiment of China. Environ. Sci. Pollut. Res. 2023, 30, 94576–94593. [Google Scholar] [CrossRef]
  39. Sánchez-García, E.; Martínez-Falcó, J.; Marco-Lajara, B.; Sloniec, J. Unveiling Key Drivers of Green Operational Efficiency. J. Sci. Food Agric. 2025, 105, 8233–8244. [Google Scholar] [CrossRef]
  40. Hanna, T.M.; Bozuwa, J.; Rao, R. The Power of Community Utilities. Available online: https://climatechange.issuelab.org/resources/43709/43709.pdf (accessed on 21 August 2025).
  41. Li, Z.; Liu, Z. Does Environmental Regulation Affect Urban Green Technology Innovation in China? Evidence from the Low-Carbon City Pilot Policy. Front. Energy Res. 2023, 11, 1068563. [Google Scholar] [CrossRef]
  42. World Intellectual Property Organization. WIPO IP Facts and Figures 2023. Available online: https://tind.wipo.int/record/48648 (accessed on 1 September 2025).
  43. World Intellectual Property Indicators 2024: Highlights—Trademarks Highlights. Available online: https://www.wipo.int/web-publications/world-intellectual-property-indicators-2024-highlights/en/trademarks-highlights.html (accessed on 1 September 2025).
  44. World Intellectual Property Indicators Report: Record Number of Patent Applications Filed Worldwide in 2022. Available online: https://www.wipo.int/pressroom/en/articles/2023/article_0013.html (accessed on 1 September 2025).
  45. Nam, Y.; Barnett, G.A. Globalization of Technology: Network Analysis of Global Patents and Trademarks. Technol. Forecast. Soc. Change 2011, 78, 1471–1485. [Google Scholar] [CrossRef]
  46. Shu, L.; Wang, W. Human Capital and Trademarks: Evidence from Higher Education Expansion in China. Res. Policy 2023, 52, 104869. [Google Scholar] [CrossRef]
  47. Jensen, P.H.; Webster, E. Another Look at the Relationship Between Innovation Proxies. Aust. Econ. Pap. 2009, 48, 252–269. [Google Scholar] [CrossRef]
  48. Block, J.; Fisch, C.; Ikeuchi, K.; Kato, M. Trademarks as an Indicator of Regional Innovation: Evidence from Japanese Prefectures. Reg. Stud. 2022, 56, 190–209. [Google Scholar] [CrossRef]
  49. Castaldi, C.; Mendonça, S. Regions and Trademarks: Research Opportunities and Policy Insights from Leveraging Trademarks in Regional Innovation Studies. Reg. Stud. 2022, 56, 177–189. [Google Scholar] [CrossRef]
  50. Gotsch, M.; Hipp, C. Using Trademarks to Measure Innovation in Knowledge-Intensive Business Services. Technol. Innov. Manag. Rev. 2014, 4, 18–30. [Google Scholar] [CrossRef]
  51. Aaker, D. Innovation: Brand It or Lose It. Calif. Manag. Rev. 2007, 50, 8–24. [Google Scholar] [CrossRef]
  52. Brexendorf, T.O.; Keller, K.L. Leveraging the Corporate Brand: The Importance of Corporate Brand Innovativeness and Brand Architecture. Eur. J. Mark. 2017, 51, 1530–1551. [Google Scholar] [CrossRef]
  53. Meng, H.; Xu, X.; Tian, T. Empirical Study of Neo-Chinese Fashion Consumer Behaviour from the Perspectives of Cultural Identity and Emotional Self-Regulation Mechanism. Asia Pac. J. Mark. Logist. 2024, 37, 1591–1607. [Google Scholar] [CrossRef]
  54. Li, X.A.; Ahmed, U. Creating Cohesive Brand Experiences Through Integrated Campaigns. Available online: https://www.gbppublications.com/10-17605-2xuk4-7-7 (accessed on 1 September 2025).
  55. Zhu, D.; Lin, X. Trademarks and Related Rights in China. In Competition Law and Intellectual Property in China; Maniatis, S., Kokkoris, I., Wang, X., Eds.; Oxford University Press: Oxford, UK, 2019; ISBN 978-0-19-879352-6. [Google Scholar]
  56. Hong, J.; Edler, J.; Massini, S. Evolution of the Chinese Intellectual Property Rights System: IPR Law Revisions and Enforcement. Manag. Organ. Rev. 2022, 18, 755–787. [Google Scholar] [CrossRef]
  57. Vaught, J. Brand Innovation Trends That Drive Real Growth in 2025. 2024. Available online: https://www.smashbrand.com/articles/brand-innovation-trends/ (accessed on 1 September 2025).
  58. Beverland, M.B.; Wilner, S.J.S.; Micheli, P. Reconciling the Tension between Consistency and Relevance: Design Thinking as a Mechanism for Brand Ambidexterity. J. Acad. Mark. Sci. 2015, 43, 589–609. [Google Scholar] [CrossRef]
  59. Preece, C.; Kerrigan, F.; O’reilly, D. License to Assemble: Theorizing Brand Longevity. J. Consum. Res. 2019, 46, 330–350. [Google Scholar] [CrossRef]
  60. Beverland, M.B.; Napoli, J.; Farrelly, F. Can All Brands Innovate in the Same Way? A Typology of Brand Position and Innovation Effort. J. Prod. Innov. Manag. 2010, 27, 33–48. [Google Scholar] [CrossRef]
  61. Kotler, P.; Kartajaya, H.; Setiawan, I. Marketing 5.0: Technology for Humanity, 1st ed.; Wiley: Hoboken, NJ, USA, 2021; ISBN 978-1-119-66854-1. [Google Scholar]
  62. Lyu, Y.; Xiao, X.; Zhang, J. Green Finance Policy and Corporate Carbon Emissions: Advancing Corporate Sustainability. Humanit. Soc. Sci. Commun. 2025, 12, 1143. [Google Scholar] [CrossRef]
  63. Lee, K.-H.; Min, B. Green R&D for Eco-Innovation and Its Impact on Carbon Emissions and Firm Performance. J. Clean. Prod. 2015, 108, 534–542. [Google Scholar] [CrossRef]
  64. Huang, S.; Luan, Z. Can Green Finance Supports Improve Environmental Firm Performance? Evidence from Listed Environmental Firms in China. Financ. Res. Lett. 2024, 70, 106321. [Google Scholar] [CrossRef]
  65. Wu, S.; Lim, A.-F.; Lim, W.-Y. Driving Green Competitive Advantage: The Power of Knowledge, Innovation, Branding and CSR Credibility. J. Knowl. Manag. 2025, 29, 2647–2666. [Google Scholar] [CrossRef]
  66. Delivering the European Green Deal. Available online: https://commission.europa.eu/strategy-and-policy/priorities-2019-2024/european-green-deal/delivering-european-green-deal_en (accessed on 1 September 2025).
  67. Green Budgeting. Available online: https://commission.europa.eu/strategy-and-policy/eu-budget/performance-and-reporting/horizontal-priorities/green-budgeting_en (accessed on 1 September 2025).
  68. European Green Deal: Energy Efficiency Directive Adopted, Helping Make the EU ‘Fit for 55’. Available online: https://energy.ec.europa.eu/news/european-green-deal-energy-efficiency-directive-adopted-helping-make-eu-fit-55-2023-07-25_en (accessed on 1 September 2025).
  69. Collaborating for Climate Action Funding Opportunity. Available online: https://www.portland.gov/bps/cleanenergy/climate-investment/climate-investment-plan/collaborating-climate-action (accessed on 1 September 2025).
  70. Zhou, H.; Tian, X.; Zhao, Y.; Chang, C.; Lin, B. Investigation of Policy Tools for Energy Efficiency Improvement in Public Buildings in China—Current Situation, Obstacles, and Solutions. City Built Environ. 2024, 2, 2. [Google Scholar] [CrossRef]
  71. Tao, M.; Goh, L.T. Effects of Carbon Trading Pilot on Carbon Emission Reduction: Evidence from China’s 283 Prefecture-Level Cities. Chin. Econ. 2023, 56, 1–24. [Google Scholar] [CrossRef]
  72. Chakraborty, P.; Chatterjee, C. Does Environmental Regulation Indirectly Induce Upstream Innovation? New Evidence from India. Res. Policy 2017, 46, 939–955. [Google Scholar] [CrossRef]
  73. Shah, W.U.H.; Hao, G.; Yan, H.; Yasmeen, R.; Jie, Y. The role of energy policy transition, regional energy efficiency, and technological advancement in the improvement of China’s environmental quality. Energy Rep. 2022, 8, 9846–9857. [Google Scholar] [CrossRef]
  74. Silva, J.S.; Tenreyro, S. The log of gravity. In The Review of Economics and Statistics; MIT Press Journals: Cambridge, MA, USA, 2006; pp. 641–658. [Google Scholar]
  75. Marchi, V.D.; Maria, E.D.; Micelli, S. Environmental strategies, upgrading and competitive advantage in global value chains. Bus. Strategy Environ. 2013, 22, 62–72. [Google Scholar] [CrossRef]
  76. Gong, M.; You, Z.; Wang, L.; Cheng, J. Environmental regulation, trade comparative advantage, and the manufacturing industry’s green transformation and upgrading. Int. J. Environ. Res. Public Health 2020, 17, 2823. [Google Scholar] [CrossRef] [PubMed]
  77. Fernando, Y.; Jabbour, C.J.C.; Wah, W.X. Pursuing green growth in technology firms through the connections between environmental innovation and sustainable business performance: Does service capability matter? Resour. Conserv. Recycl. 2019, 141, 8–20. [Google Scholar] [CrossRef]
  78. Brännlund, R.; Lundgren, T. Environmental policy without costs? A review of the Porter hypothesis. Int. Rev. Environ. Resour. Econ. 2009, 3, 75–117. [Google Scholar] [CrossRef]
  79. Chen, Y.; Yao, Z.; Zhong, K. Do environmental regulations of carbon emissions and air pollution foster green technology innovation: Evidence from China’s prefecture-level cities. J. Clean. Prod. 2022, 350, 131537. [Google Scholar] [CrossRef]
  80. Qu, Y.; Tseng, M.L. The interaction effects of environmental regulation and technological innovation on regional green growth performance. J. Clean. Prod. 2017, 162, 894–902. [Google Scholar] [CrossRef]
  81. Popp, D. International Technology Transfer, Climate Change, and the Clean Development Mechanism. Rev. Environ. Econ. Policy 2011, 5, 131–152. [Google Scholar] [CrossRef]
  82. Noailly, J. Improving the energy efficiency of buildings: The impact of environmental policy on technological innovation. Energy Econ. 2012, 34, 795–806. [Google Scholar] [CrossRef]
Figure 1. Path diagrams.
Sustainability 17 09817 g001
Figure 2. Parallel trend test.
Sustainability 17 09817 g002
Figure 3. Placebo test.
Sustainability 17 09817 g003
Figure 4. Standardized bias of covariates (%).
Sustainability 17 09817 g004
Table 1. List of demonstration cities.
YearCitiesNumber of Cities
2011Beijing, Shenzhen, Chongqing, Hangzhou, Changsha, Guiyang, Jilin, Xinyu8
2013Shijiazhuang, Tangshan, Tieling, Qiqihar, Tongling, Nanping, Jingmen, Shaoguan, Dongguan, Tongchuan10
2014Tianjin, Linfen, Baotou, Xuzhou, Liaocheng, Hebi, Meizhou, Nanning, Deyang, Lanzhou, Haidong, Urumqi12
Source: compiled by the author.
Table 2. Descriptive statistics of key variables.
Variable NameVariable SymbolObservationsMeanStandard DeviationMinMax
Overall Brand Development PotentialBrand40596579.77524,362.4104549,340
Goods Brand Development PotentialGoods brand40594601.17815,092.6432308,659
Service Brand Development PotentialService brand40591978.5979699.0811267,861
Green Fiscal Policypolicy40590.0450.20801
City SizelnCS40505.8570.7152.9039.315
Economic Development LevellnGDP403816.0861.04212.76419.605
Financial Development LevelFIN40352.4501.9810.50838.237
Informatization LevellnINF40173.5871.1270.0238.552
Public Cultural Service LevellnPCS40254.6441.1340.0839.529
Industrialization LevellnIND40386.4831.1561.38610.631
Note: As shown in Table 2, the missing rate of variables used in the analysis of this study is relatively low (the missing data of key variables are all <0.1%). Assuming that the missing mechanism is MCAR, this method will not introduce significant bias. All statistical analyses were conducted using Stata17, and the modeling commands will automatically exclude cases with missing values in the list of analytical variables by default. The results of the robustness test meet the requirements of this study.
Table 3. Baseline regression results.
VariablesBrandGoods BrandService Brand
(1)(2)(3)(4)(5)(6)
Policy0.247 ***0.235 ***0.251 ***0.244 ***0.0660.084
(0.085)(0.071)(0.089)(0.071)(0.093)(0.078)
lnCS 0.111 *** 0.104 *** 0.112 ***
(0.034) (0.034) (0.042)
lnGDP 0.262 *** 0.244 *** 0.122
(0.076) (0.076) (0.085)
FIN 0.039 *** 0.035 *** 0.026 **
(0.012) (0.011) (0.012)
lnINF −0.068 −0.059 −0.033
(0.045) (0.039) (0.063)
lnPCS −0.042 −0.045 −0.012
(0.033) (0.033) (0.040)
lnIND 0.105 ** 0.137 *** 0.106
(0.048) (0.047) (0.067)
Time fixed effectsIncludedIncludedIncludedIncludedIncludedIncluded
City fixed effectsIncludedIncludedIncludedIncludedIncludedIncluded
Constant10.253 ***4.469 ***9.761 ***4.064 ***9.516 ***5.807 ***
(0.021)(1.523)(0.019)(1.539)(0.030)(1.534)
Observations405939804059398040593980
Adjusted R20.9890.9890.9890.9890.9890.989
Note: Robust standard errors clustered at the city level are presented in parentheses. *** and ** denote statistical significance at the 1% and 5% levels, respectively.
Table 4. Robustness tests.
Variables(1)(2)(3)(4)
PSM-DIDPrecise DIDExcluding Other PoliciesReplacing the Dependent Variable
Policy0.131 ** 0.226 ***0.197 ***
(0.063) (0.054)(0.062)
Did_jingzhun 0.256 ***
(0.077)
Did1 0.062
(0.053)
Did2 0.162 ***
(0.041)
Did3 0.041
(0.049)
Did4 0.024
(0.039)
Control variablesIncludedIncludedIncludedIncluded
Time fixed effectsIncludedIncludedIncludedIncluded
City fixed effectsIncludedIncludedIncludedIncluded
Constant0.8784.580 ***5.511 ***4.277 ***
(2.652)(1.472)(1.160)(1.598)
Observations974398039803980
Adjusted R20.9880.9880.9890.989
Note: Robust standard errors clustered at the city level are reported in parentheses. *** and ** indicate statistical significance at the 1% and 5% levels, respectively.
Table 5. Other robustness tests.
Variables(1)(2)(3)(4)
Excluding Provincial CapitalsExcluding Cities with Independent Planning StatusClustered at the City-Year LevelClustered at the Province-Year Level
Policy0.285 ***0.182 **0.235 ***0.235 ***
(0.079)(0.073)(0.080)(0.078)
lnCS0.101 ***0.070 ***0.1110.111 **
(0.036)(0.025)(0.072)(0.053)
lnGDP0.276 ***0.207 ***0.262 **0.262 **
(0.097)(0.076)(0.122)(0.125)
FIN0.039 ***0.031 ***0.039 *0.039 *
(0.013)(0.009)(0.020)(0.021)
lnINF−0.075−0.077 *−0.068−0.068
(0.054)(0.046)(0.053)(0.052)
lnPCS−0.030−0.055−0.042−0.042
(0.046)(0.034)(0.034)(0.037)
lnIND0.130 **0.091 *0.105 *0.105 *
(0.055)(0.051)(0.061)(0.064)
Constant3.896 **5.911 ***4.470 **4.470 **
(1.868)(1.527)(2.183)(2.144)
City fixed effectsIncludedIncludedIncludedIncluded
Time fixed effectsIncludedIncludedIncludedIncluded
Observations3674391239743974
Adjusted R20.9860.9880.9880.988
Note: ***, **, and * indicate statistical significance at the 1%, 5%, and 10% levels, respectively. Robust standard errors in columns (1) and (2) are clustered at the city level. Standard errors in columns (3) and (4) are clustered at the city-year and province-year levels, respectively.
Table 6. Regional heterogeneity.
VariablesEastern RegionCentral RegionWestern Region
BrandGoods BrandService BrandBrandGoods BrandService BrandBrandGoods BrandService Brand
(1)(2)(3)(4)(5)(6)(7)(8)(9)
Policy0.299 ***0.308 ***0.132−0.047−0.0590.145 **0.120 **0.103 *0.117 **
(0.087)(0.086)(0.095)(0.086)(0.085)(0.062)(0.056)(0.059)(0.050)
Control variablesIncludedIncludedIncludedIncludedIncludedIncludedIncludedIncludedIncluded
Time fixed effectsIncludedIncludedIncludedIncludedIncludedIncludedIncludedIncludedIncluded
City fixed effectsIncludedIncludedIncludedIncludedIncludedIncludedIncludedIncludedIncluded
Constant3.3302.8274.324 **3.841 ***3.307 ***4.667 ***8.006 ***8.999 ***6.241 ***
(2.212)(2.220)(1.789)(0.930)(1.012)(0.917)(2.355)(2.872)(1.998)
Observations139013901390139213921392119211921192
Adjusted R20.9890.9890.9890.9890.9890.9890.9890.9890.989
Note: Robust standard errors clustered at the city level are reported in parentheses. ***, **, and * indicate statistical significance at the 1%, 5%, and 10% levels, respectively.
Table 7. Brand heterogeneity: “time-honored Chinese brands”.
VariablesMore Time-Honored BrandsFewer Time-Honored Brands
BrandGoods BrandService BrandBrandGoods BrandService Brand
(1)(2)(3)(4)(5)(6)
Policy0.284 ***0.298 ***0.1280.010−0.015−0.063
(0.086)(0.085)(0.096)(0.060)(0.060)(0.057)
Control variablesIncludedIncludedIncludedIncludedIncludedIncluded
Time fixed effectsIncludedIncludedIncludedIncludedIncludedIncluded
City fixed effectsIncludedIncludedIncludedIncludedIncludedIncluded
Constant3.504 *3.1505.261 ***6.723 ***6.575 ***5.980 ***
(1.986)(1.990)(2.001)(1.130)(1.211)(1.163)
Observations208420842084189018901890
Adjusted R20.9840.9840.9840.9840.9840.984
Note: Robust standard errors clustered at the city level are reported in parentheses. *** and * indicate statistical significance at the 1% and 10% levels, respectively.
Table 8. Heterogeneity in research and development investment.
VariablesHigher Research and Development InvestmentLower Research and Development Investment
BrandGoods BrandService BrandBrandGoods BrandService Brand
(1)(2)(3)(4)(5)(6)
Policy0.246 ***0.256 ***0.096−0.040−0.046−0.021
(0.073)(0.074)(0.081)(0.045)(0.046)(0.108)
Control variablesIncludedIncludedIncludedIncludedIncludedIncluded
Time fixed effectsIncludedIncludedIncludedIncludedIncludedIncluded
City fixed effectsIncludedIncludedIncludedIncludedIncludedIncluded
Constant3.083 *2.7685.071 ***6.783 ***6.298 ***5.271 ***
(1.872)(1.884)(1.826)(1.115)(1.221)(1.380)
Observations271527152715122812281228
Adjusted R20.9450.9450.9450.9450.9450.945
Note: Robust standard errors clustered at the city level are reported in parentheses. *** and * indicate statistical significance at the 1% and 10% levels, respectively.
Table 9. Fiscal pressure heterogeneity.
VariablesHigh Fiscal PressureLow Fiscal Pressure
BrandGoods BrandService BrandBrandGoods BrandService Brand
(1)(2)(3)(4)(5)(6)
Policy0.1580.1180.0930.268 ***0.265 ***0.190 *
(0.105)(0.086)(0.104)(0.094)(0.093)(0.105)
Control variablesIncludedIncludedIncludedIncludedIncludedIncluded
Time fixed effectsIncludedIncludedIncludedIncludedIncludedIncluded
City fixed effectsIncludedIncludedIncludedIncludedIncludedIncluded
Constant7.093 ***7.501 ***3.408 **5.066 **4.669 **6.219 ***
(1.537)(1.450)(1.555)(2.049)(2.034)(2.215)
Observations269426942694125112511251
Adjusted R20.9890.9890.9890.9890.9890.989
Note: Robust standard errors clustered at the city level are reported in parentheses. ***, **, and * indicate statistical significance at the 1%, 5%, and 10% levels, respectively.
Table 10. Heterogeneity in urban resource endowment.
VariablesResource-Based CitiesNon-Resource-Based Cities
BrandGoods BrandService BrandBrandGoods BrandService Brand
(1)(2)(3)(4)(5)(6)
Policy0.0630.0690.0110.243 ***0.252 ***0.088
(0.101)(0.101)(0.134)(0.076)(0.078)(0.084)
Control variablesIncludedIncludedIncludedIncludedIncludedIncluded
Time fixed effectsIncludedIncludedIncludedIncludedIncludedIncluded
City fixed effectsIncludedIncludedIncludedIncludedIncludedIncluded
Constant3.951 ***4.007 ***0.8553.633 *3.365 *5.676 ***
(1.290)(1.366)(1.519)(1.885)(1.900)(1.830)
Observations159215921592238823882388
Adjusted R20.9890.9890.9890.9890.9890.989
Note: Robust standard errors clustered at the city level are reported in parentheses. *** and * indicate statistical significance at the 1% and 10% levels, respectively.
Table 11. Heterogeneity in the degree of marketization.
VariablesHigher Degree of MarketizationLower Degree of Marketization
BrandGoods BrandService BrandBrandGoods BrandService Brand
(1)(2)(3)(4)(5)(6)
Policy0.280 ***0.289 ***0.0940.0650.0630.046
(0.084)(0.084)(0.094)(0.056)(0.059)(0.070)
Control variablesIncludedIncludedIncludedIncludedIncludedIncluded
Time fixed effectsIncludedIncludedIncludedIncludedIncludedIncluded
City fixed effectsIncludedIncludedIncludedIncludedIncludedIncluded
Constant2.7212.4353.417 *8.850 ***8.922 ***9.038 ***
(2.061)(2.016)(1.844)(1.188)(1.235)(1.557)
Observations188018801880210021002100
Adjusted R20.9830.9830.9830.9830.9830.983
Note: Robust standard errors clustered at the city level are reported in parentheses. *** and * indicate statistical significance at the 1% and 10% levels, respectively.
Table 12. Mechanistic analysis.
VariablesIntellectual Property AwarenessIndustrial Energy Consumption
(1)(2)(3)(4)
LnzhishiBrandElecBrand
Policy0.368 ***0.210 ***−0.032 **0.239 ***
(0.104)(0.073)(0.015)(0.073)
lnzhishi 0.061 **
(0.025)
Elec −0.173 *
(0.093)
Control variablesIncludedIncludedIncludedIncluded
City fixed effectsIncludedIncludedIncludedIncluded
Time fixed effectsIncludedIncludedIncludedIncluded
Constant5.666 **4.057 ***−0.4644.539 ***
(2.668)(1.407)(0.501)(1.528)
Observations3693369338913891
Adjusted R20.9890.9890.9890.989
Note: Robust standard errors clustered at the city level are reported in parentheses. ***, **, and * indicate statistical significance at the 1%, 5%, and 10% levels, respectively.
Disclaimer/Publisher’s Note: The statements, opinions and data contained in all publications are solely those of the individual author(s) and contributor(s) and not of MDPI and/or the editor(s). MDPI and/or the editor(s) disclaim responsibility for any injury to people or property resulting from any ideas, methods, instructions or products referred to in the content.