Article

Integrating PolSAR and Optical Data for Forest Aboveground Biomass Estimation with an Interpretable Bayesian-Optimized XGBoost Model

1
College of Information and Electronic Engineering, Hunan City University, Yiyang 413000, China
2
Hunan Key Laboratory of Remote Sensing Monitoring of Ecological Environment in Dongting Lake Area, Changsha 410004, China
3
Institute of Geographic Sciences and Natural Resources Research, Chinese Academy of Sciences, Beijing 100101, China
4
Kunming Natural Resources Comprehensive Investigation Center, China GeologicalSurve/Technology Innovation Center for Natural Ecosystem Carbon Sequestration Engineering, MNR, Kunming 650100, China
5
Hunan Provincial Engineering Research Center of Dongting Lake Regional Ecological Dnviroment Intelligent Monitoring and Disaster Prevention and Mitigation Technology, Yiyang 413000, China
6
National-Local Joint Engineering Laboratory of Geo-Spatial Information Technology, Hunan University of Science and Technology, Xiangtan 411100, China
*
Author to whom correspondence should be addressed.
Sustainability 2025, 17(21), 9749; https://doi.org/10.3390/su17219749
Submission received: 27 August 2025 / Revised: 27 October 2025 / Accepted: 30 October 2025 / Published: 1 November 2025

Abstract

As a pivotal indicator in terrestrial ecosystems, forest aboveground biomass (AGB) reflects the capacity for carbon sequestration, the sustenance of biodiversity, and the provision of key ecosystem services. Precise quantification of AGB is therefore fundamental to evaluating forest quality and optimizing management strategies. However, there are bottlenecks in estimating forest AGB from a single data source, and traditional parameter optimization methods are not competent in complex environmental areas. This study proposes an interpretable Bayesian-optimized XGBoost model to improve forest AGB estimation, integrating polarimetric SAR (PolSAR) and optical remote-sensing data for forest AGB mapping in Quanzhou County, southern China. The results demonstrate that the proposed Bayesian-optimized XGBoost (BO-XGBoost) significantly outperforms traditional non-parametric models, achieving a final R2 of 0.75 and root-mean-square error (RMSE) of 9.82 Mg/ha. The integration of PolSAR and optical data improved forest AGB estimation accuracy compared with using single data sources alone, reducing the RMSEs by 36.2% and 20.9%, respectively. Furthermore, the proposed method enhances the interpretability of the contributions made by remote-sensing features to forest AGB modeling, offering a new reference for future forest surveys and resource monitoring, which is particularly valuable for sustainable forestry development.

1. Introduction

Accounting for roughly 30% of the Earth’s land surface, forests are pivotal ecosystems that harbor over 80% of its terrestrial carbon. This central role makes them indispensable for biosphere stability and climate change mitigation [1,2]. As a direct measure of forest quality and carbon sequestration potential, the accurate estimation of regional forest aboveground biomass (AGB) is crucial. It not only deepens our insight into the ecosystem carbon cycle but also offers an essential foundation for crafting carbon neutrality policies [3,4].
The primary remote-sensing data sources for estimating forest AGB can be categorized into three types: optical imagery, light detection and ranging (LiDAR) data, and synthetic aperture radar (SAR) data [5,6,7,8]. Optical remote-sensing data possess the longest time series and the most complete surface coverage, which have been widely used in areas such as land-use change assessment and disaster monitoring. Low-resolution optical data, represented by the Moderate-Resolution Imaging Spectroradiometer (MODIS), is free and open-source. The high re-entry efficiency enables capturing vegetation changes on continental or even global scales; however, the excessive mixed features in the pixels often limit the effectiveness of the application [9]. High-resolution data, such as WorldView-3 and GaoFen-2 data, enable more accurate feature identification and greatly reduce the presence of mixed pixels compared with low-resolution data. However, factors such as cloud coverage and high cost constrain their further widespread application. At present, the medium-resolution images represented by the Landsat series and Sentinel-2 data are still the most commonly used optical data for vegetation parameter estimation and monitoring [10]. The moderate resolution, rich spectral information, and time series make the medium-resolution data have high potential in forest resources monitoring. In particular, the red-edge band, which is very sensitive to capturing small changes in chlorophyll, is effective in realizing forest parameter estimation [11]. However, optical remote-sensing data primarily captures information from the forest canopy surface and lacks the capability to depict vertical forest structure. This limitation often triggers the light saturation effect in densely vegetated areas, consequently constraining the accuracy of forest AGB estimates [12].
LiDAR is an active remote-sensing technology that emits electromagnetic waves to acquire the location and attributes of a target and can penetrate the gaps in the forest canopy to acquire the forest’s three-dimensional structure, which can greatly improve the estimation accuracy of forest parameters [13]. Based on the platform used, LiDAR systems primarily encompass three categories: terrestrial laser scanning (TLS), unmanned aerial vehicle (UAV)–LiDAR, and space-borne LiDAR [14,15,16]. TLS and UAV-LiDAR can realize extremely accurate forest measurements, which can record the original state of the forest completely and, combined with advanced algorithms, can realize high-precision extraction of forest parameters. However, the limitations of the equipment prevent them from realizing large-scale data acquisition, thus limiting their application [14,15]. The high platform of spaceborne LiDAR can acquire large-scale three-dimensional information on the ground surface, but the discrete data acquisition method makes it difficult to acquire spatially continuous forest parameter distributions [16]. Synthetic aperture radar (SAR), another active remote-sensing technology, can ignore inclement weather, such as precipitation and clouds, to realize all-weather, all-day surface observation. Meanwhile, SAR can acquire information about the internal structure of the forest, which has the potential to mitigate the saturation effect compared with optical data. In addition, long-wave SAR has very high penetrability, which is of high application value for forest resource investigation and monitoring [17,18]. Combining multi-source remote-sensing images can realize complementary data observation, thus improving the effectiveness of remote-sensing information. Among them, the combined optical data and SAR data can simultaneously reflect the surface canopy information and internal structural information of forests, which can effectively improve the estimation accuracy of forest parameters. However, at present, the more frequently used data are mainly Sentinel-1 C-band SAR data, which acquire mainly forest horizontal canopy information due to their shorter wavelength, thus limiting their accuracy [19]. Long-wave SAR, represented by ALOS-2, has a stronger penetration ability and mainly interacts with tree trunks and branches, but the effectiveness of the combined optical data for forest AGB estimation requires further validation.
The selection of an appropriate model plays a pivotal role in the accuracy of forest AGB estimation. While parametric models, such as multiple linear regression (MLR), are valued for their simplicity and clear interpretation of linear relationships between features and AGB, their application is often constrained by the complexity of forest environments [20,21]. Non-parametric models, which are flexible in form and do not require a specific sample distribution, have been widely applied to vegetation growth monitoring [22,23]. Among them, an ensemble learning algorithm can reduce the bias and variance of individual models by combining the prediction results of multiple basic models, thus improving the overall prediction accuracy. In addition, ensemble learning can improve the model’s generalization ability and robustness and reduce the risk of overfitting [24]. XGBoost demonstrates remarkable advantages in forest parameter inversion. Its powerful nonlinear fitting capability enables precise capture of complex relationships between remote-sensing spectral features and forest structural parameters, effectively handling high-dimensional, multi-source heterogeneous data. Compared with traditional algorithms, XGBoost effectively suppresses overfitting via regularization constraints and second-order gradient optimization, enhancing the model’s generalization capability for inversion in unknown regions. Its inherent ability to handle missing values accommodates common data gaps and noise issues in remote-sensing data, while its parallel computing architecture significantly improves computational efficiency for large-scale regional inversion, ultimately achieving higher precision in forest parameter mapping and spatial distribution prediction. However, the hyperparameter setting significantly affects XGBoost’s prediction efficiency and accuracy. Hyperparameters are key factors in determining the prediction effect of ensemble learning algorithms, and a suitable set of hyperparameters can greatly improve the model’s prediction efficiency and accuracy [25]. Grid search and stochastic search are typical parameter optimization methods, but the computation is excessive, not applicable to continuous parameters, and may fall into local optimal solutions [26]. Bayesian optimization is a sequential optimization method based on Bayes’s theorem, which dynamically updates the distribution of the parameter search by building a probabilistic model of the objective function in the parameter space to efficiently search for the optimal solution [27]. Compared with grid search and stochastic search, Bayesian optimization can effectively deal with continuous parameter optimization problems without discretizing the parameter space, thus better preserving the continuity among parameters. In addition, Bayesian optimization can effectively handle the situation where there is noise or uncertainty in the objective function, improving the robustness and stability of the search [28]. Improving ensemble learning algorithms via Bayesian optimization is very promising in improving forest AGB estimation.
This study aimed to develop an interpretable, Bayesian-optimized XGBoost algorithm to improve forest AGB estimation in southern China. We hypothesized that (H1) integrating Sentinel-2 and ALOS-2 data would produce more accurate AGB estimates than using either data source alone by combining their complementary information, and (H2) the proposed Bayesian-optimized XGBoost model would demonstrate superior accuracy and robustness compared with other commonly used machine learning methods. Diverse feature sets were derived from both Sentinel-2 and ALOS-2 imagery to assess the individual contribution of each data source to evaluate these hypotheses. These features were subsequently integrated to leverage their synergistic potential for improved AGB estimation. To ensure a comprehensive comparison, we also implemented several widely used non-parametric models. The predictive performance of all models was then benchmarked against field-measured AGB data from the study area.

2. Materials and Methods

2.1. Study Area

Quanzhou County (longitude 110°37′–111°29′ E, latitude 25°29′–26°23′ N) is located in Guilin, Guangxi Autonomous Region, southern China (Figure 1). The region experiences a subtropical monsoon climate, characterized by a mean annual temperature of 19.2 °C, approximately 1404 h of sunshine, and an annual precipitation averaging 1565.9 mm. Quanzhou has a total area of 4021.2 km2, with a forest coverage rate of 68.19%, and the main tree species are Chinese fir (Cunninghamia lanceolata (Lamb.) Hook.), horsetail pine (Pinus massoniana Lamb.), and cypress (Cupressus funebris Endl.).

2.2. Measured Forest AGB Data Processing

According to the forest management inventory (FMI) database in Quanzhou County in 2019, the boundaries of arbor forests were screened [29]. A field survey was conducted involving 200 randomly established sample plots (25 m × 25 m) within the arbor forests. From these plots, key forest parameters—including tree species, diameter at breast height (DBH), and growing stem volume (GSV)—were extracted from the sub-compartment database. The biomass expansion factor (BEF) method was used to calculate the forest AGB values based on different tree species [30].
Finally, 180 sample plots were retained after the outliers were removed, and information on forest AGB values was statistically analyzed. The tree species in the sample plots were mainly Chinese fir, horsetail pine, and other broadleaf species (Castanopsis hystrix, Castanopsis eyrei, and Quercus shennongii). The study area was predominantly characterized by red soil, where the measured forest AGB exhibited considerable variation, ranging from 1.05 to 183.9 t/ha (mean = 67.5 t/ha; SD = 50.1 t/ha). The coefficient of variation for all samples was 74.1%, indicating strong heterogeneity in the distribution of measured forest AGB values (Table 1).

2.3. Remote-Sensing Data and Preprocessing

The Sentinel-2 satellite is equipped with a Multispectral Imager (MSI) capable of capturing data in 13 spectral bands, featuring a swath width of 290 km. Sentinel-2 includes multiple spatial resolutions with a re-entry period of only 5 days and is designed to provide data support for environmental monitoring, surface cover change, and disaster management globally [31]. To ensure pixel stability, a median composite was created from Sentinel-2 surface reflectance images captured during the vegetation growing season (July–September) of 2019 over Quanzhou County. These source images were sourced from the Google Earth Engine (GEE) platform (https://code.earthengine.google.com/; accessed on 15 July 2025) [32]. The Sentinel-2 image synthesized with RGB is shown in Figure 1b.
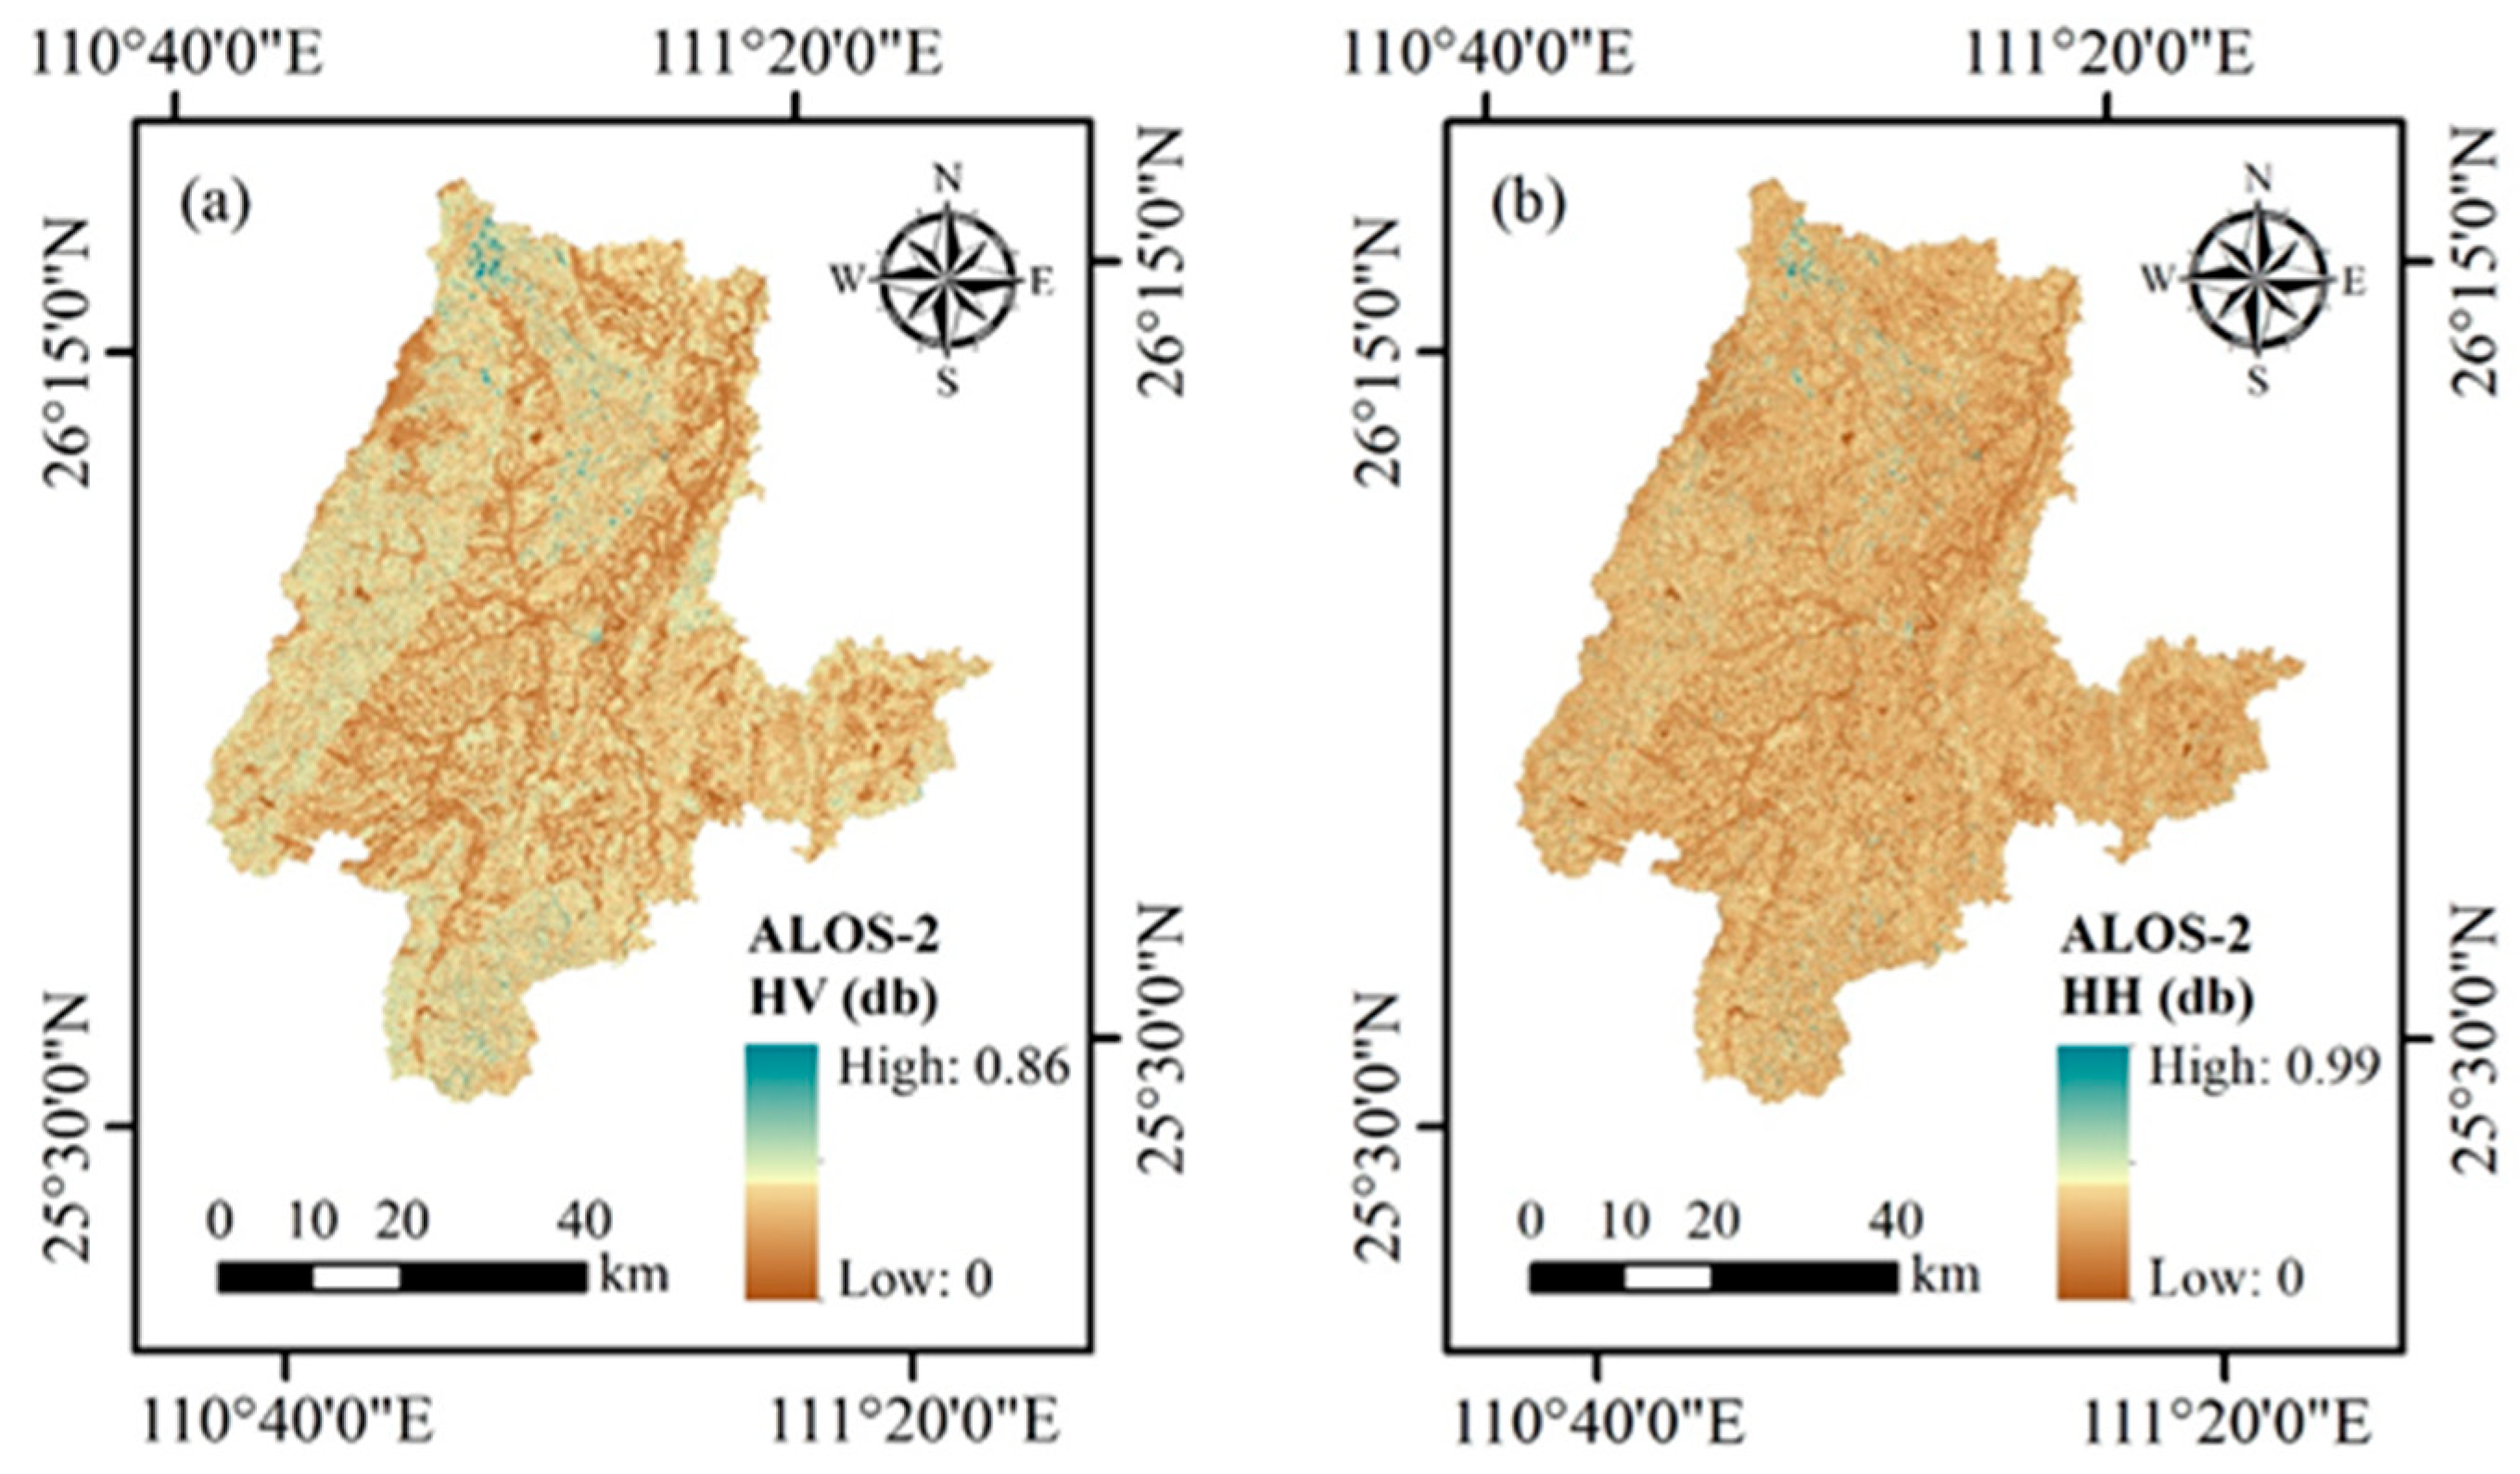
The L-band SAR data from ALOS-2/PALSAR-2 were utilized in this study. This advanced imaging system provides global coverage with enhanced capability for forest structure monitoring via its longer wavelength, which penetrates vegetation canopies to reveal internal structures correlated with biomass parameters [33]. The data were sourced from JAXA’s preprocessed global mosaic products, which combine orthorectified and radiometrically balanced images from both PALSAR-2 and its predecessor (GEE, https://www.eorc.jaxa.jp/ALOS/, accessed on 15 July 2025). These products offer improved geo-location accuracy and consistent radiometry across adjacent paths, with Gamma-0 backscatter values available in HH and HV polarizations at approximately 25 m resolution [34]. For our analysis, the mosaics covering the study area were downloaded and processed using mosaicking and boundary-cropping operations (Figure 2).

2.4. Feature Extraction and Selection

Spectral reflectance captures the absorption, reflection, and transmission characteristics of forest canopies across different wavelengths, enabling sensitive detection of vegetation biochemical components and structural features [35]. The spectral reflectance in the red-edge region demonstrates significant correlation with forest AGB. Furthermore, vegetation indices derived from spectral reflectance calculations enhance vegetation signals while effectively suppressing interference from soil background and atmospheric noise via mathematical combinations of multispectral band information [36]. Vegetation indices constructed using red-edge bands exhibit heightened sensitivity to forest canopy structure and biochemical properties, making them crucial input features for monitoring forest AGB [37]. Spectral reflectances from bands with a spatial resolution better than 20 m were extracted. Two categories of spectral indices were derived as potential predictors for forest AGB estimation: conventional indices, namely the Normalized Difference Vegetation Index (NDVI) and the Red-Green Vegetation Index (RGVI); and red-edge-based indices, such as the Red-Edge Normalized Difference Vegetation Index (RENDVI) and the Red-Edge Chlorophyll Index (RECI) [38,39,40]. All spectral features extracted from Sentinel-2 are presented in Table 2.
The backscattering coefficient is a fundamental parameter that quantitatively characterizes a target’s ability to scatter radar signals, defined as the ratio of the electromagnetic power reflected by the radar to the incident power per unit area. This coefficient effectively eliminates the influence of radar system parameters and range attenuation, directly revealing surface characteristics including roughness, dielectric properties, and geometric structure [41]. We extracted the backscattering coefficients from both HH and HV polarization channels using ALOS-2 data.
This study also extracted textural features to complement the spectral data, sourcing them from the red-edge bands of Sentinel-2 and the backscattering coefficients of the ALOS-2 dataset. For PolSAR data, texture features provide a more comprehensive characterization of spatial heterogeneity and local structural details compared with backscattering coefficients alone. While backscattering coefficients only offer single-pixel scattering intensity information, texture features effectively capture spatial distribution patterns, roughness variations, and structural organization by quantifying spatial correlations of gray-level values between pixels [42]. Moreover, texture features exhibit greater robustness to inherent speckle noise in SAR imagery, preserving structural information while suppressing noise, thereby significantly improving classification accuracy and target recognition capabilities in complex scenarios. A set of eight second-order texture features, which are commonly used in forest parameter estimation, were calculated using the Gray-Level Co-Occurrence Matrix (GLCM) method [43,44].
Excessive features involved in modeling can lead to reduced model efficiency and additional prediction errors. Selecting features with greater contributions to the model can significantly improve forest AGB prediction performance [45]. Compared with traditional linear and nonlinear evaluation metrics, relative importance characterizes the average gain of features used as splitting nodes in all trees during the decision tree construction process, capturing both nonlinear relationships between features and target variables, as well as interactions between features. A larger gain indicates a higher relative importance of the feature, meaning it contributes more to the model. It accurately reflects the actual contribution of features to model performance, particularly in ensemble learning algorithms. The expression for gain is defined as [46].
Gain = 1 2 G L 2 H L + λ + G R 2 H R + λ G L + G R 2 H L + H R + λ γ
where G L and G R are the sums of the first-order gradients for the left and right nodes after the split; H L and H R are the sums of the second-order gradients for the left and right nodes after the split, respectively; λ is the L 2 regularization coefficient; and γ is the complexity penalty term.
To provide interpretability for the model, the Shapley Additive exPlanations (SHAP) method was applied to quantify the contribution of each feature to the predictive performance [47]. Compared with feature importance assessment methods (e.g., Gain), the core advantage of SHAP lies in its rigorous mathematical foundation based on Shapley values from game theory, which simultaneously ensures both global consistency and local interpretability. SHAP not only accurately quantifies each feature’s overall contribution to model predictions but also precisely decomposes the marginal effects of individual features on single-sample predictions [48]. This approach maintains an equitable distribution between features while revealing complex feature interactions and nonlinear relationships. In contrast, traditional methods can only provide global importance rankings without guaranteeing the additive consistency of contributions.
In our study, models were iteratively constructed based on the feature ranking in both relative importance and SHAP values, and the optimal feature subset for modeling was determined by evaluating changes in the prediction error. Ultimately, the feature subset corresponding to the minimum error was identified as the optimal feature selection result.

2.5. Model Construction and Evaluation

2.5.1. Nonparametric Models

Algorithms including Support Vector Machine (SVM), k-Nearest Neighbor (kNN), Backpropagation Neural Networks (BPNNs), and Random Forest (RF) are frequently employed in forest parameter estimation, a prevalence owed to their strong predictive performance and adaptability [49,50,51,52].
The theoretical foundation of the Support Vector Machine (SVM) algorithm is structural risk minimization, which guides its approach to supervised learning problems. Its core idea is to achieve global optimization and improve generalization ability by constructing an optimal classification hyperplane. To address linearly inseparable problems, the SVM algorithm employs a kernel function to project the input data into a higher-dimensional space where an effective separation becomes feasible. It directly identifies the optimal classification hyperplane in linearly separable cases, while it employs kernel functions to compute inner products in high-dimensional space in nonlinear cases. Commonly used kernel functions include the linear kernel, polynomial kernel function, radial basis function (RBF), and sigmoid kernel, which are suitable for different data distribution characteristics [49]. The predictive stability of Support Vector Machines (SVMs) is influenced by their sensitivity to parameter settings and noise, which can also impact computational efficiency. To address these sensitivities, this study involved a thorough evaluation of multiple kernel functions and conducted hyperparameter optimization, specifically for the penalty coefficient (cost) and the kernel parameter (gamma). Ultimately, the SVM model with the RBF kernel achieved the lowest RMSE across all three feature sets. The optimal parameter combinations were determined as follows: cost = 0.1 and gamma = 36 for the Sentinel-2 feature set, cost = 0.1 and gamma = 47 for the ALOS-2 feature set, and cost = 0.2 and gamma = 12 for the combined Sentinel-2 and ALOS-2 feature set.
Owing to its simplicity and status as a non-parametric method that requires no pre-training, the k-Nearest Neighbor (kNN) algorithm is extensively utilized in domains such as data mining and image classification. The algorithm predicts the target value of a test sample by calculating its distance to all training samples, selecting the k-closest neighbors, and making predictions based on their attribute values [50]. The selection of the number of neighbors (k) is a primary factor that dictates the performance of the kNN algorithm. A k-value that is too small increases the model’s sensitivity to noise, while an excessively large k-value introduces greater approximation error. The optimal k-value is typically determined by minimizing model error. This study adopted Euclidean distance as the proximity measure. The optimal value for k, tested over a range of 1 to 50, was subsequently determined through a process of error minimization. Ultimately, the k-values for the three feature sets were determined to be 3, 12, and 7, respectively.
BPNNs are a typical representative of artificial neural networks, possessing strong capabilities in self-organization, self-learning, and handling nonlinear relationships. They have been widely applied to analyzing nonlinear systems involving numerous influencing factors. BPNN training consists of two core processes: forward propagation and backpropagation. Forward propagation transforms input features into network outputs, while backpropagation adjusts weights and biases based on output errors to optimize the model [51]. Although this algorithm demonstrates powerful nonlinear fitting capabilities and broad applicability, it suffers from drawbacks such as slow training speed and susceptibility to local optima. The number of hidden nodes is a key parameter in a BPNN, which was iteratively optimized in this study with a maximum set value of 100. In this study, the optimal numbers of hidden nodes determined from the three data sources were 18, 25, and 16, respectively.
Exhibiting considerable insensitivity to noisy data, RF is a non-parametric ensemble method that performs regression through the rapid building of multiple decision trees. RF effectively handles high-dimensional, large-scale datasets, a capability that distinguishes itself from many non-parametric methods as it operates without the need for prior distributional assumptions [52]. The algorithm’s efficiency stems from its rapid training and the introduction of randomness through aggregating multiple decision trees, an ensemble approach that effectively mitigates overfitting. In this framework, model performance is primarily governed by two parameters: mtry, controlling the number of variables per node, and ntrees, defining the total number of trees in the forest. Hyperparameter optimization was conducted in this study to enhance predictive performance: mtry was allowed to vary up to the total number of feature variables, while ntrees was capped at 500. The parameter combination yielding the lowest estimation error was selected as the final model configuration via iterative tuning.

2.5.2. The Bayesian-Optimized XGBoost Model (BO-XGBoost)

Fast computation, high predictive accuracy, and robust generalization capabilities are key advantages that have led to the widespread adoption of the XGBoost model in both classification and regression tasks. The core idea of XGBoost is to learn new features by adding trees to the prediction residuals, thereby fitting the final prediction results [46]. It obtains sample scores by summing the scores from each tree, yielding the final predicted score for the sample. The objective function of XGBoost is defined as
L = i = 1 n l x ^ i , x i + k = 1 K Ω f k
Ω f k = γ T + 1 2 λ m 2
where l is the loss function; x ^ i and x i are the predicted and measured values of the i th sample; K is the number of constructed trees; n is the number of training samples; Ω is the regularization term; T is the number of leaf nodes; m is the fraction of leaf nodes; and γ and λ represent the control coefficients to prevent overfitting.
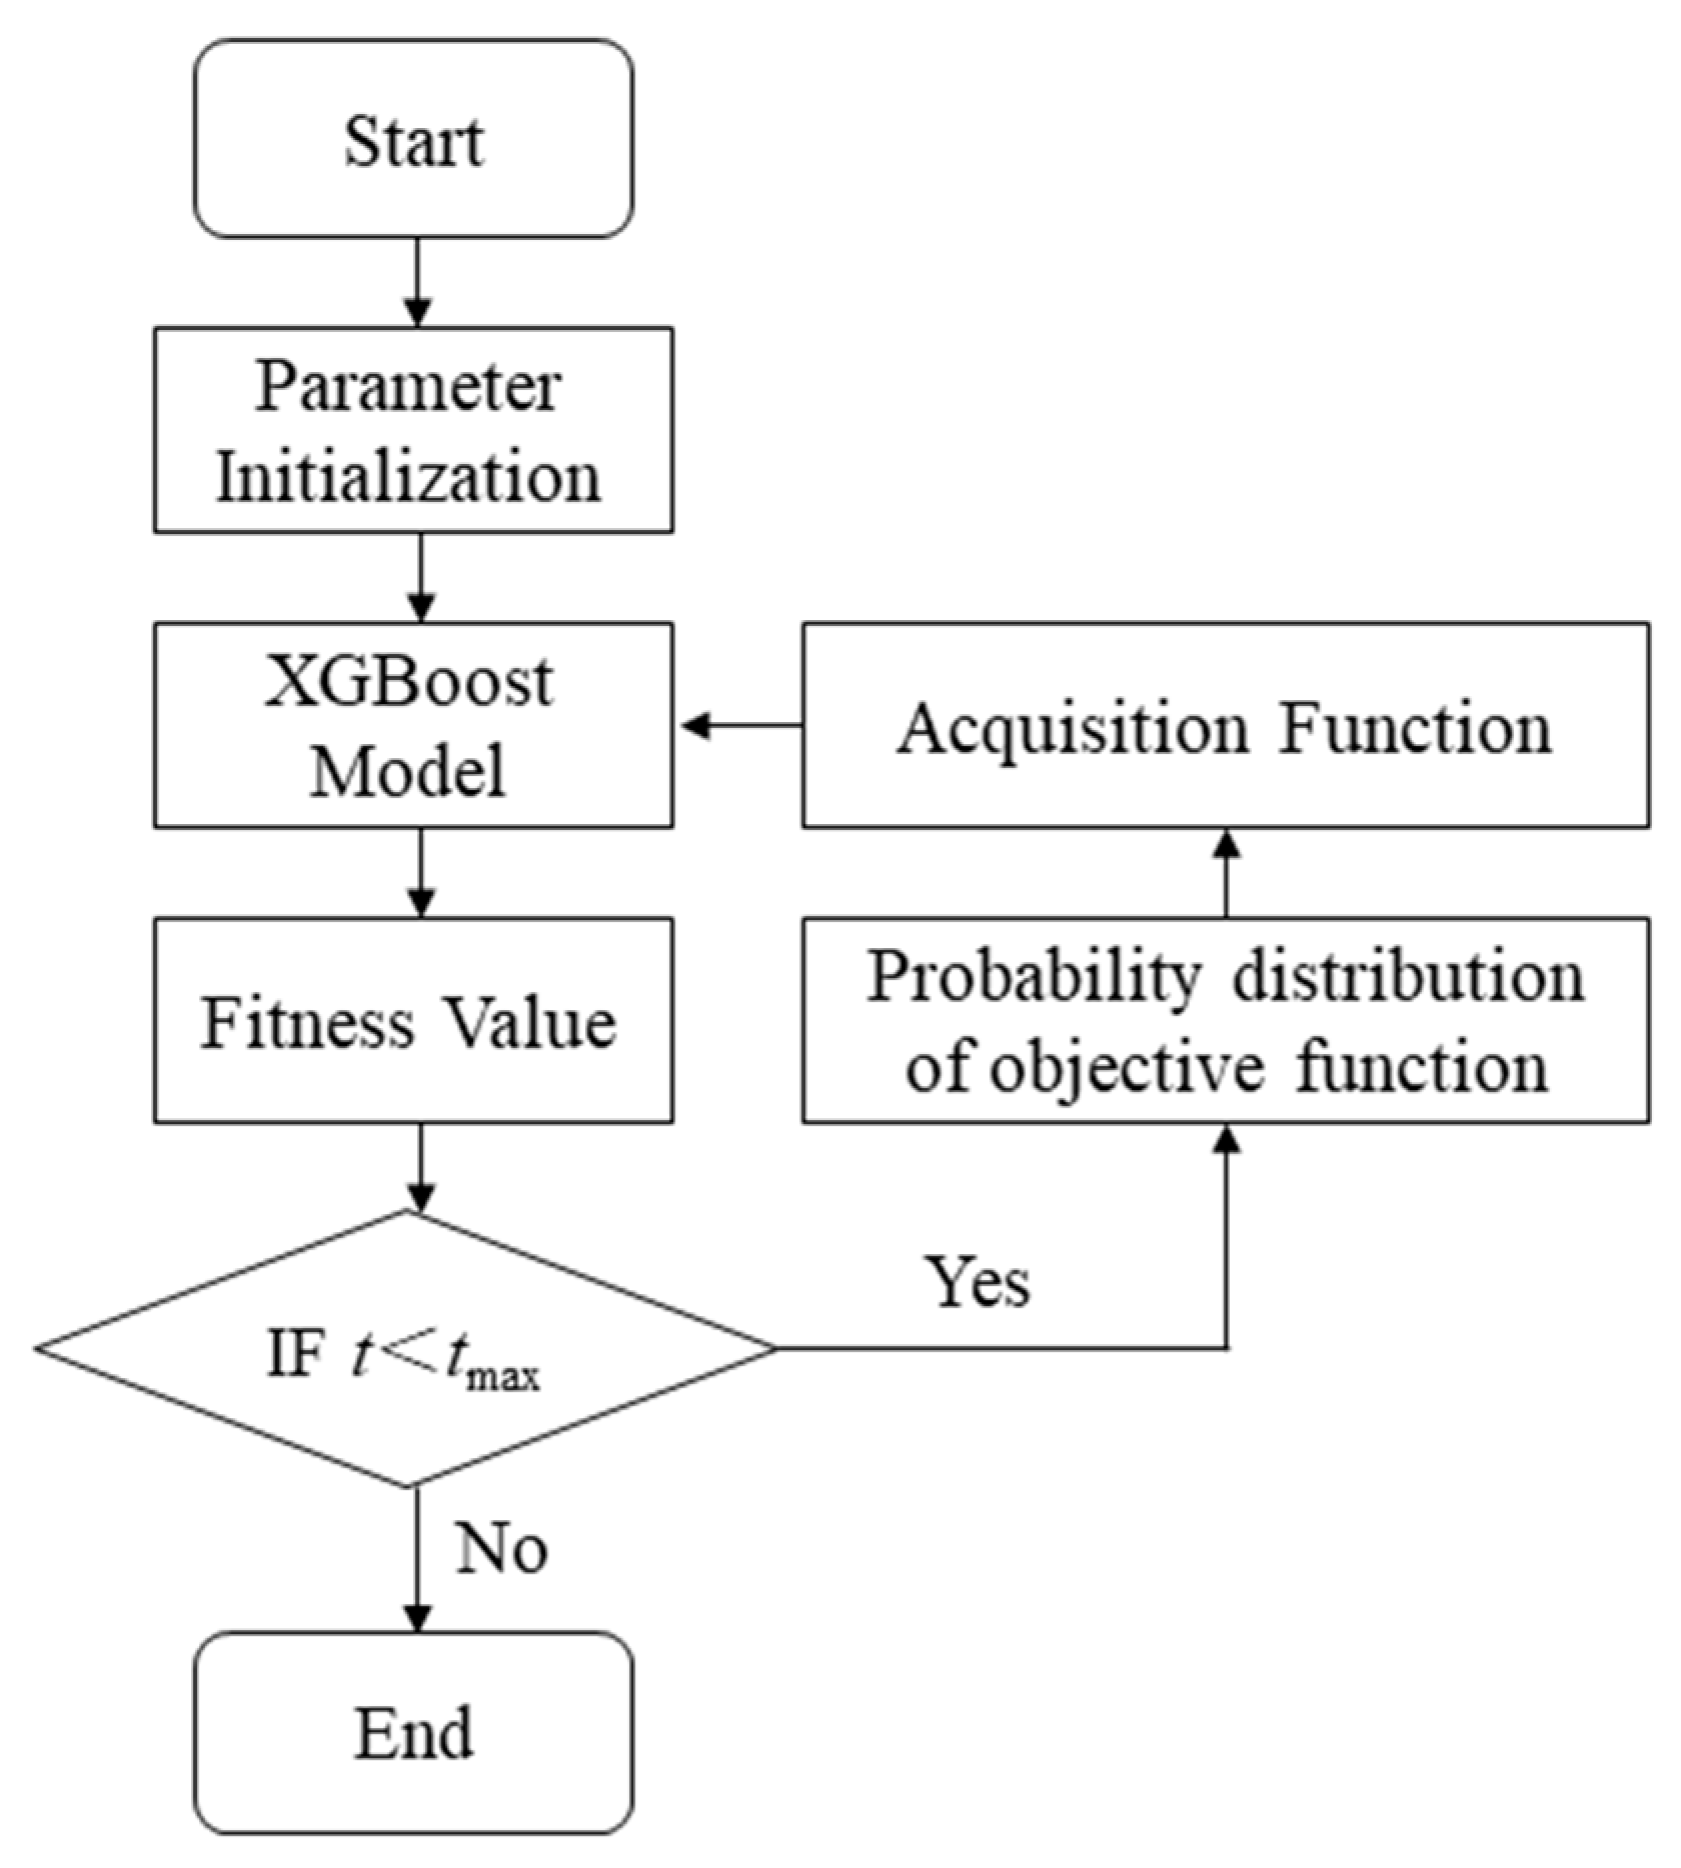
The predictive performance of XGBoost models is predominantly governed by several key hyperparameters, notably n_estimators, max_depth, and learning_rate. Among these, n_estimators, which specifies the total number of decision trees in the ensemble, is commonly configured to a value not exceeding 500. Max_depth controls the tree complexity, where excessively large values may lead to overfitting, and is usually limited to 10 or below. The learning rate, which defines the step size for weight updates during iteration, is generally set between 0.01 and 0.3. This study employed the Bayesian optimization algorithm to improve the XGBoost model. First, the RMSE value was determined as the fitness evaluation metric, and the initial parameters, along with their hyperparameter ranges for optimization, were defined. Expected improvement (EI) was selected as the acquisition function for Bayesian optimization, with the iteration count set to 100. By modeling the objective function’s probability distribution as a Gaussian process and employing an acquisition function to identify the most promising parameters, the optimization process was guided efficiently. These candidate parameters were then trained and validated using XGBoost to assess their performance. Finally, the optimal parameter combination was output upon reaching the maximum number of iterations. The flowchart of the Bayesian-optimized XGBoost model is illustrated as follows (Figure 3).

2.5.3. Model Accuracy Assessment

The dataset was partitioned using a stratified random-sampling approach, with 70% of the samples allocated to the training set. Model parameter tuning and performance evaluation were conducted via cross-validation within the training set. Finally, the model’s generalization capability was validated using an independent test set comprising 30% of the samples. Model performance was assessed using the coefficient of determination (R2), root-mean-square error (RMSE), and mean absolute error (MAE) to collectively capture complementary aspects of predictive accuracy [53]. Specifically, a high R2 value reflects a strong correlation between predictions and measurements, whereas low RMSE and MAE values indicate minimal deviation and error magnitude, respectively.
R 2 = 1 i = 1 n y i y ^ i 2 i = 1 n y i y ¯ i 2
RMSE = i = 1 n y i y ^ i 2 n
MAE = 1 n i = 1 n y ^ i y i
where y i represents the measured forest AGB values, y ^ i represents the predicted forest AGB values based on the models, y ¯ i is the mean value of the observed forest AGB values, and n is the sample size. All statistical analyses and modeling procedures were performed using the R software (version 4.5.0). The packages in R mainly include “e1071”, “randomForest”, “kknn”, “xgboost”, and “Bayesian”.

3. Results

3.1. Feature Evaluation and Selection

The top-ranked features based on relative importance is displayed in Figure 4. Texture features derived from ALOS-2 backscattering coefficients generally ranked higher, followed by the red-edge vegetation index extracted from Sentinel-2 and the HV backscattering coefficient. No single data source, particularly ALOS-2, demonstrated absolute dominance in the contribution. Instead, synergistic interactions were observed between ALOS-2 and Sentinel-2, indicating that both data sources contributed to the modeling process.
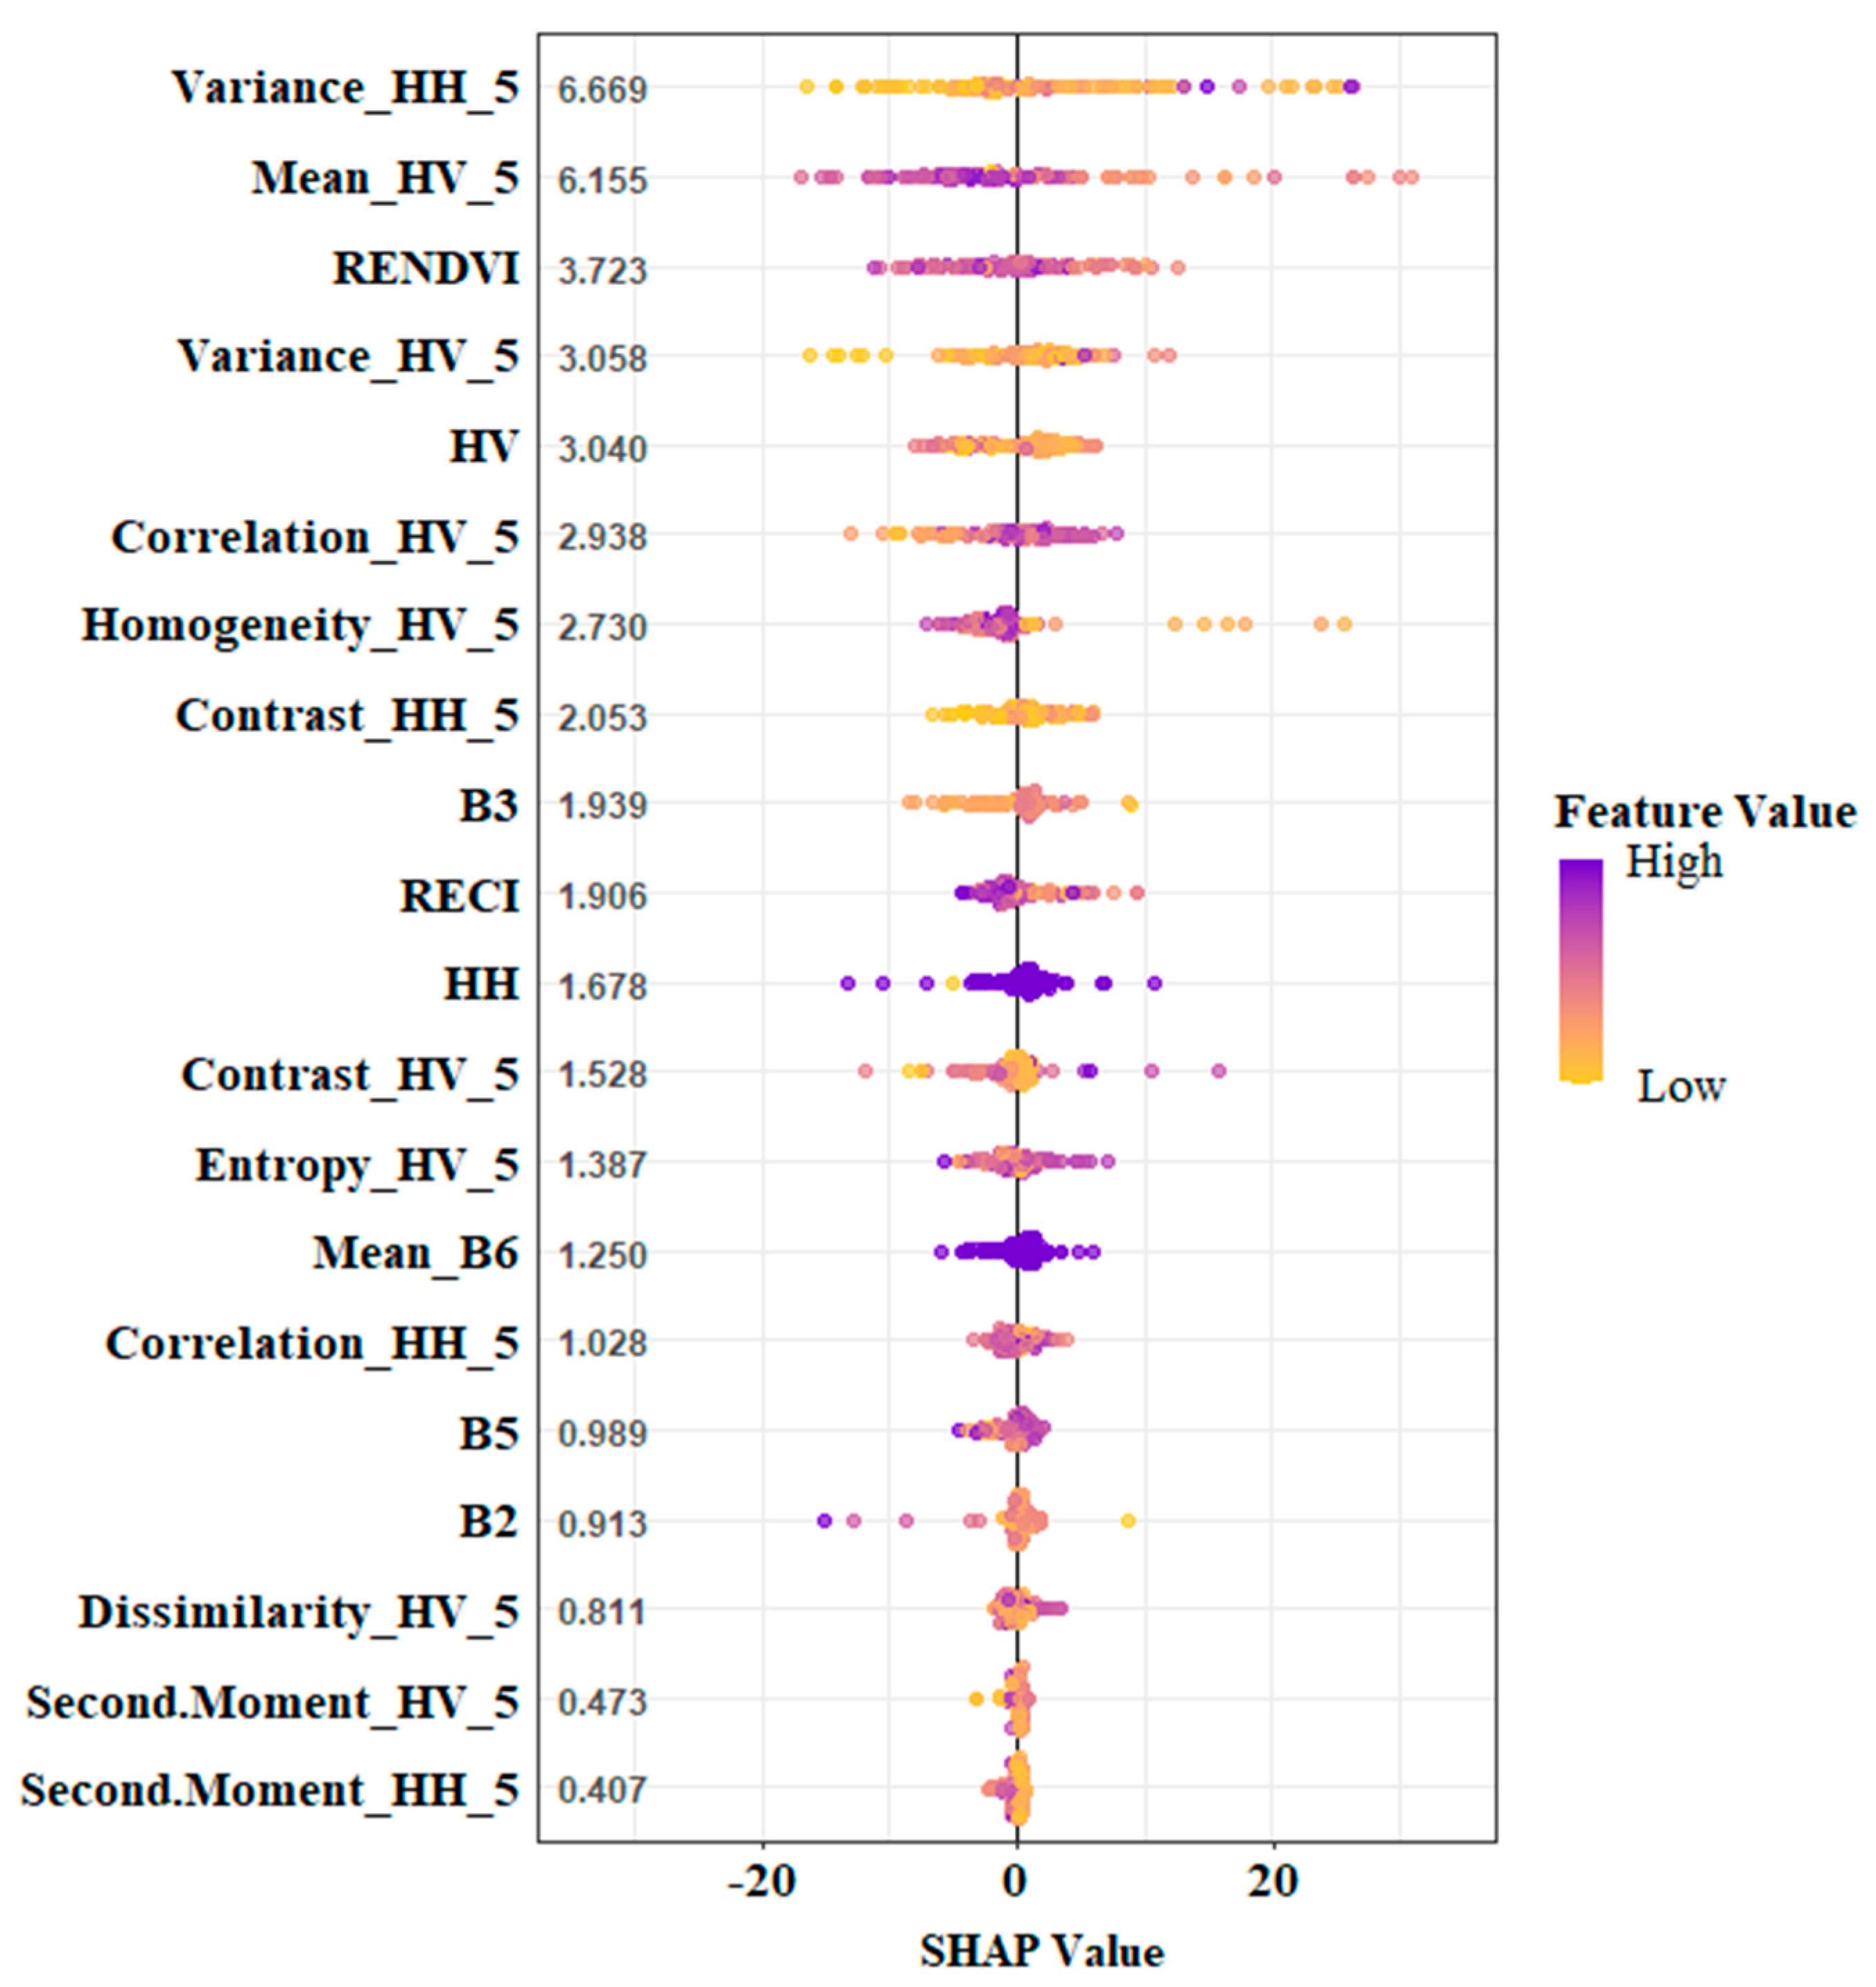
The feature evaluation results based on SHAP analysis are presented in Figure 5, showing that the overall feature ranking was largely consistent with the relative importance. We further obtained the marginal effects of features, including both direction and magnitude. The texture features of backscattering coefficients and RENDVI extracted from Sentinel-2 contributed more significantly to the model, thereby directly influencing the predictive performance. The models were sequentially constructed according to the ranking of feature relative importance and SHAP values. The top seven features were ultimately identified as the optimal feature combination for forest AGB modeling via error analysis.
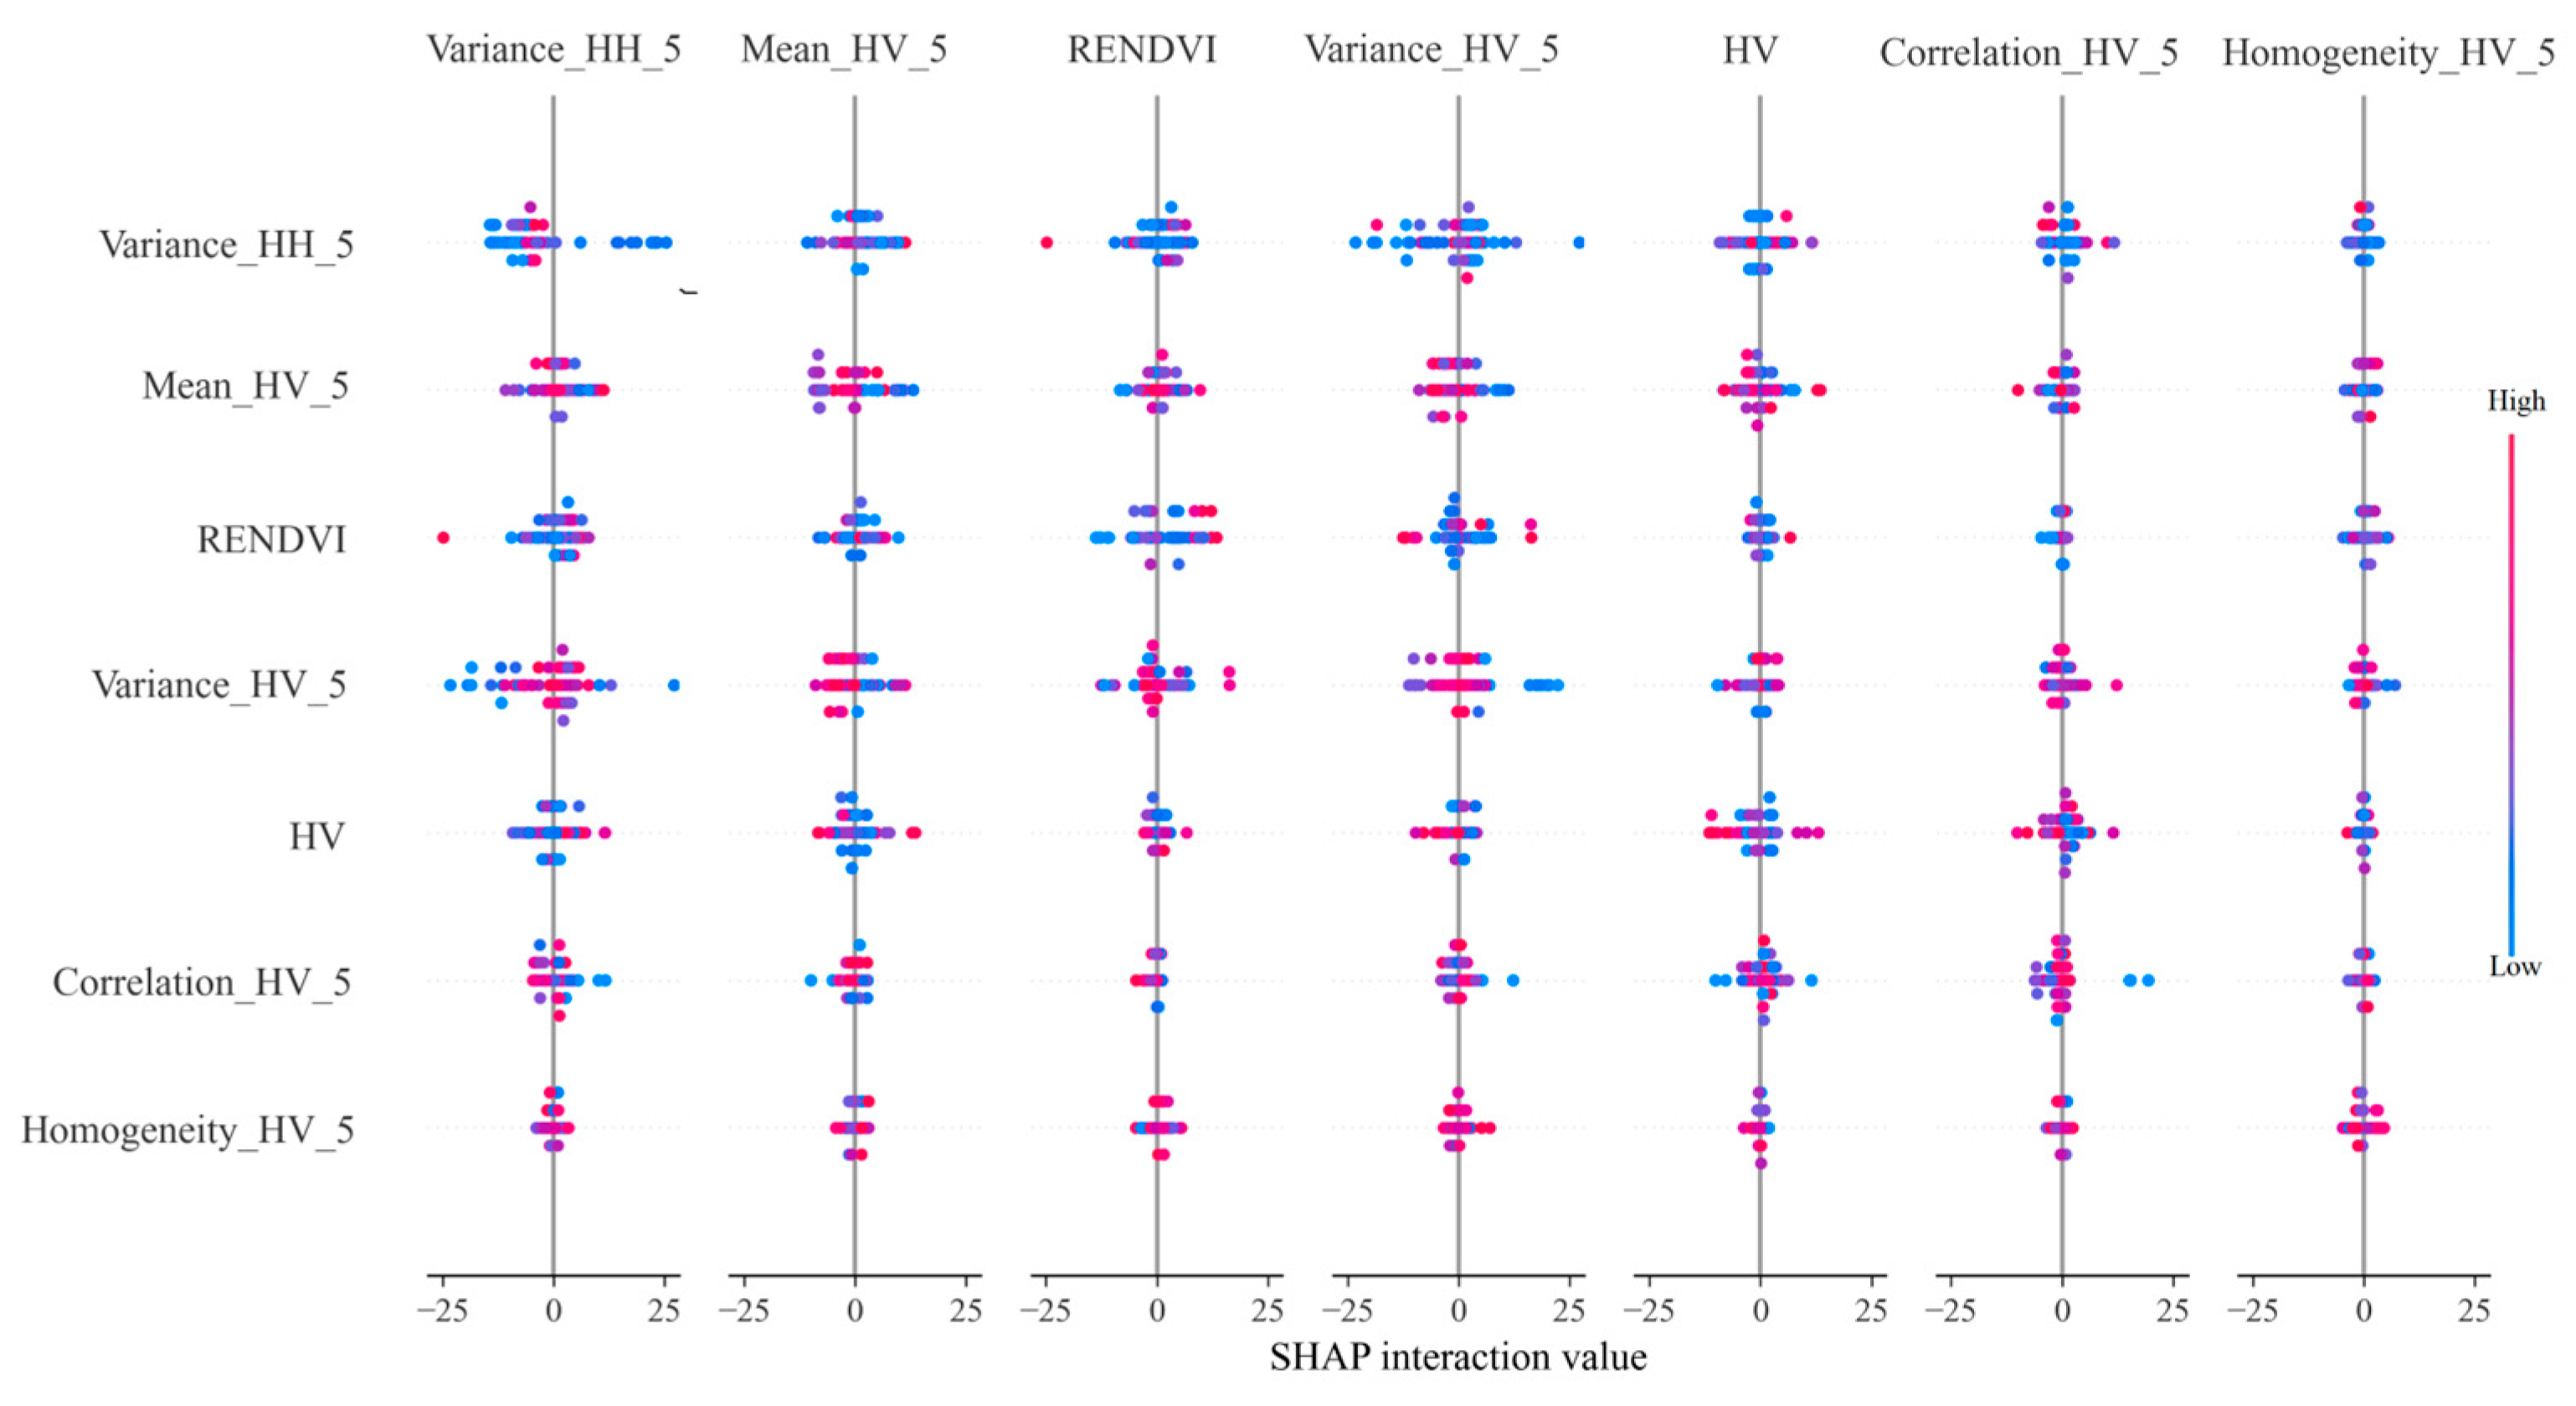
The final set of features selected for modeling included Variance_HH_5, Mean_HV_5, RENDVI, Variance_HV_5, HV, Correlation_HV_5, and Homogeneity_HV_5. These features effectively integrate textural and structural information from ALOS-2 backscattering coefficients with optical red-edge vegetation indices from Sentinel-2, forming a multidimensional and complementary feature system that significantly enhances the explanatory power for forest AGB (Figure 6). The mean value of HV polarization (Mean_HV_5) directly corresponds to AGB accumulation, while its variance (Variance_HV_5) and homogeneity (Homogeneity_HV_5) sensitively capture the complexity and spatial uniformity of the canopy structure. The correlation feature (Correlation_HV_5) helps identify structural patterns resulting from topography or the directional arrangement of trees. The variance in HH polarization (Variance_HH_5), which effectively reflects surface roughness and the double-bounce scattering mechanism between trunks and the ground, demonstrated high sensitivity in medium-to-high AGB regions. Meanwhile, RENDVI provides critical information on the physiological status of the canopy, compensating for the limited responsiveness of SAR data to vegetation biochemical properties. Together, this feature set constructs a comprehensive descriptive framework spanning from structural to physiological attributes and from understory to canopy levels. It improves the model’s robustness under complex forest conditions and offers an effective strategy to mitigate SAR signal saturation.

3.2. Results of Forest AGB Estimation

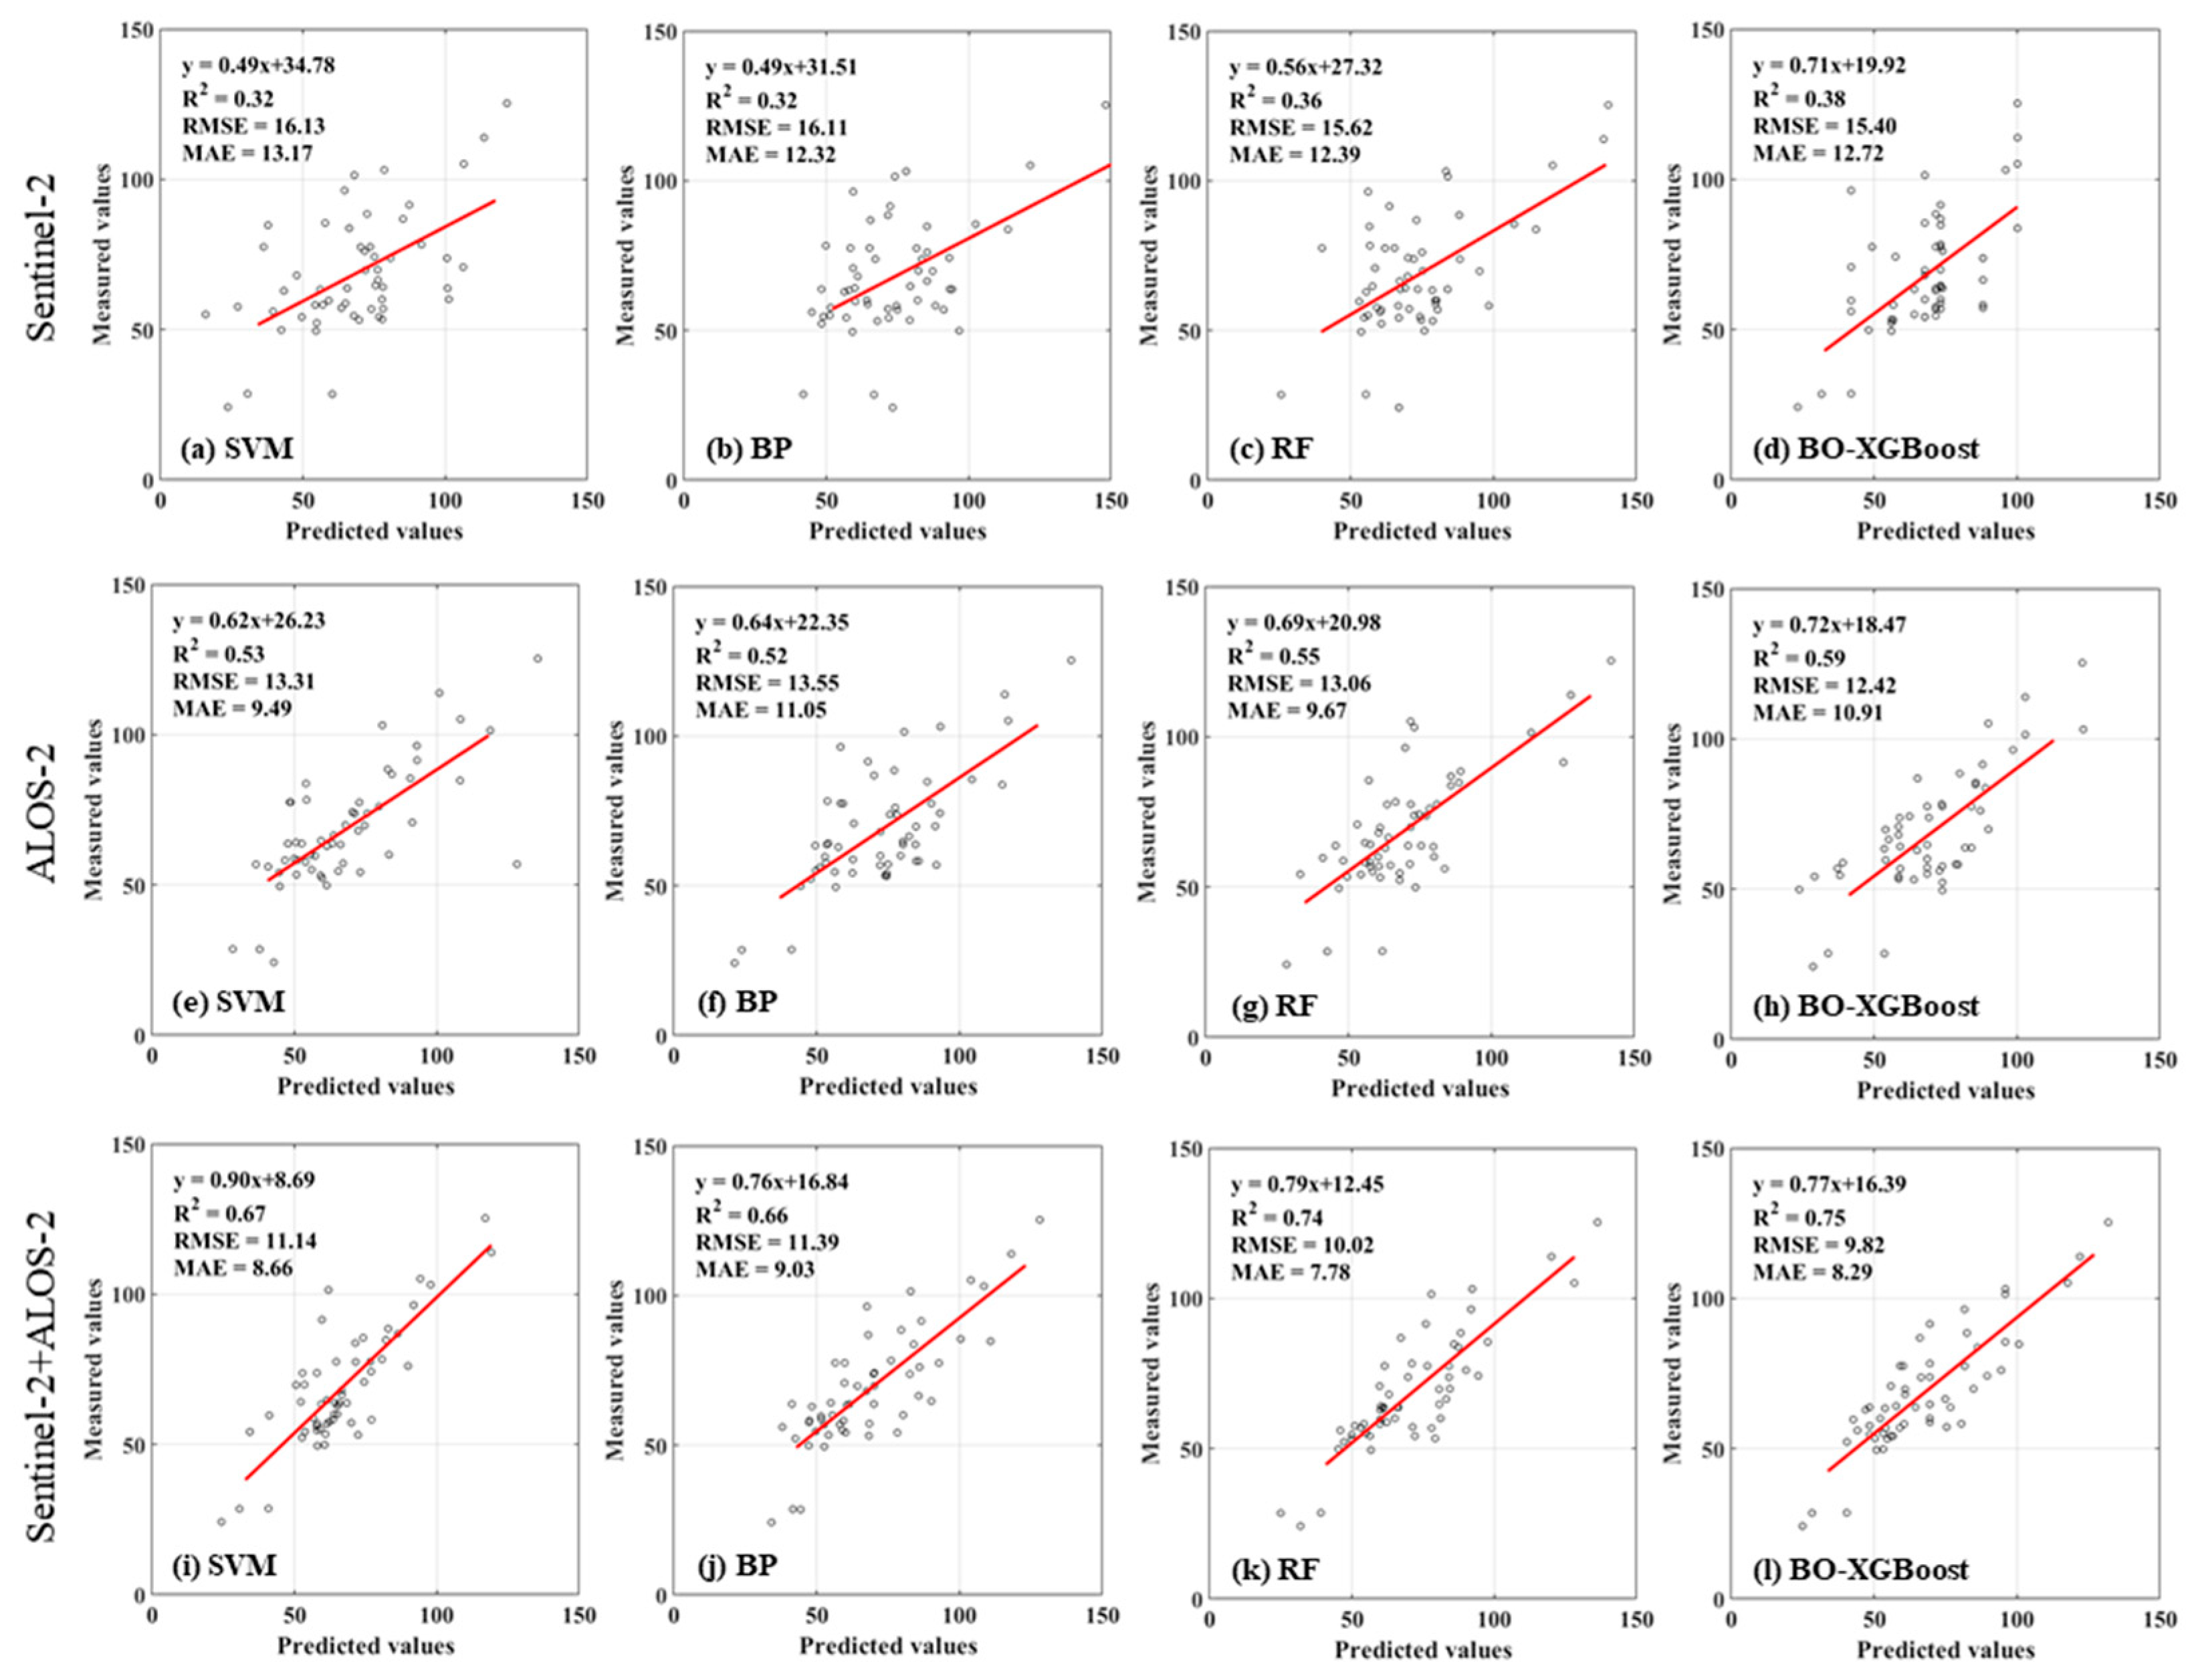
Table 3 presents the forest AGB prediction results of all models using Sentinel-2, ALOS-2, and the combined data sources, respectively. Both SVM and BP exhibited similar overall performance, maintaining high error levels with low coefficients of determination (p > 0.05). Random forest showed improved prediction accuracy compared with SVM and BP, with an overall reduction in errors. The BO-XGBoost model demonstrated superior performance across all data configurations, achieving the highest fitting accuracy and minimal error. Its optimal results were observed with the combined Sentinel-2 and ALOS-2 data, yielding a coefficient of determination of 0.75 and an RMSE of 9.82 Mg/ha. Models built with ALOS-2 generally demonstrated higher prediction accuracy than those with Sentinel-2, as the L-band’s superior forest canopy penetration capability captures internal forest structure information, thereby reducing saturation and lowering errors. The combined data sources significantly reduced errors compared with individual data sources, with the best-performing BO-XGBoost achieving RMSE reductions of 36.2% and 20.9%, respectively (p < 0.05). The combined data sources more effectively reflected forest AGB levels by integrating both canopy-level and internal structural information of forests. In the forest AGB modeling results based on three data sources, the residuals obtained by BO-XGBoost showed significant statistical differences compared with other models (p < 0.05).
Figure 7a–d present the forest AGB estimation results using Sentinel-2 as the independent data source. The SVM and BP models achieved similar fitting performance, but both exhibited RMSE values exceeding 16 Mg/ha. RF showed an improved coefficient of determination compared with the former, along with a slight reduction in the RMSE. The BO-XGBoost model demonstrated superior performance, yielding the highest predictive accuracy alongside the most minimal error. However, since Sentinel-2 can only capture the horizontal canopy information of forests, saturation effects occurred in high-biomass regions, leading to significant underestimation. In contrast, all forest AGB prediction models constructed using ALOS-2 data demonstrated superior fitting performance compared with Sentinel-2, with RMSE reductions ranging from 15.9% to 19.4% (Figure 7e–h). The integration of Sentinel-2 and ALOS-2 data led to a marked enhancement in the fitting performance across all models, which was accompanied by a substantial mitigation of both overestimation and underestimation biases. Among them, BO-XGBoost showed scatter plots evenly distributed on both sides of the regression line, and no obvious saturation was observed in high-biomass regions (Figure 7i–l). These findings validate that the multi-source data fusion effectively mitigates the signal saturation issue of optical imagery in dense forests, establishing a viable methodology for accurate forest AGB estimation.
For forest AGB estimation, model selection is pivotal, as it dictates both inversion accuracy and generalization power by bridging remote-sensing features with AGB. In contrast to traditional parametric approaches like multiple linear regression—which are constrained by strict assumptions regarding data distribution and form—non-parametric models are inherently agnostic to any predefined mathematical relationships. They can adaptively learn nonlinear mappings between features and forest AGB, making them particularly suitable for modeling the high-dimensional and nonlinear characteristics of remote-sensing data. However, these models exhibit weaker interpretability and greater sensitivity to the quantity and quality of training samples. Ensemble learning algorithms significantly enhance model stability and generalization capability by combining predictions from multiple base learners. Their adaptive weighting mechanisms effectively mitigate overfitting, demonstrating unique advantages in addressing the redundancy and heterogeneity of remote-sensing data. In this study, ensemble learning models—random forest and XGBoost—achieved lower forest AGB prediction errors compared with traditional non-parametric models. The fundamental distinction lies in their optimization focus: Random Forest (RF) primarily reduces variance through bagging, whereas XGBoost employs gradient boosting and regularization to mitigate bias and overfitting. This theoretical advantage of XGBoost translated into a tangible performance gain in our study, where the BO-XGBoost model achieved an average RMSE that was 2.8% lower than that of RF across the three data sources.

3.3. Continuous Mapping of Forest AGB

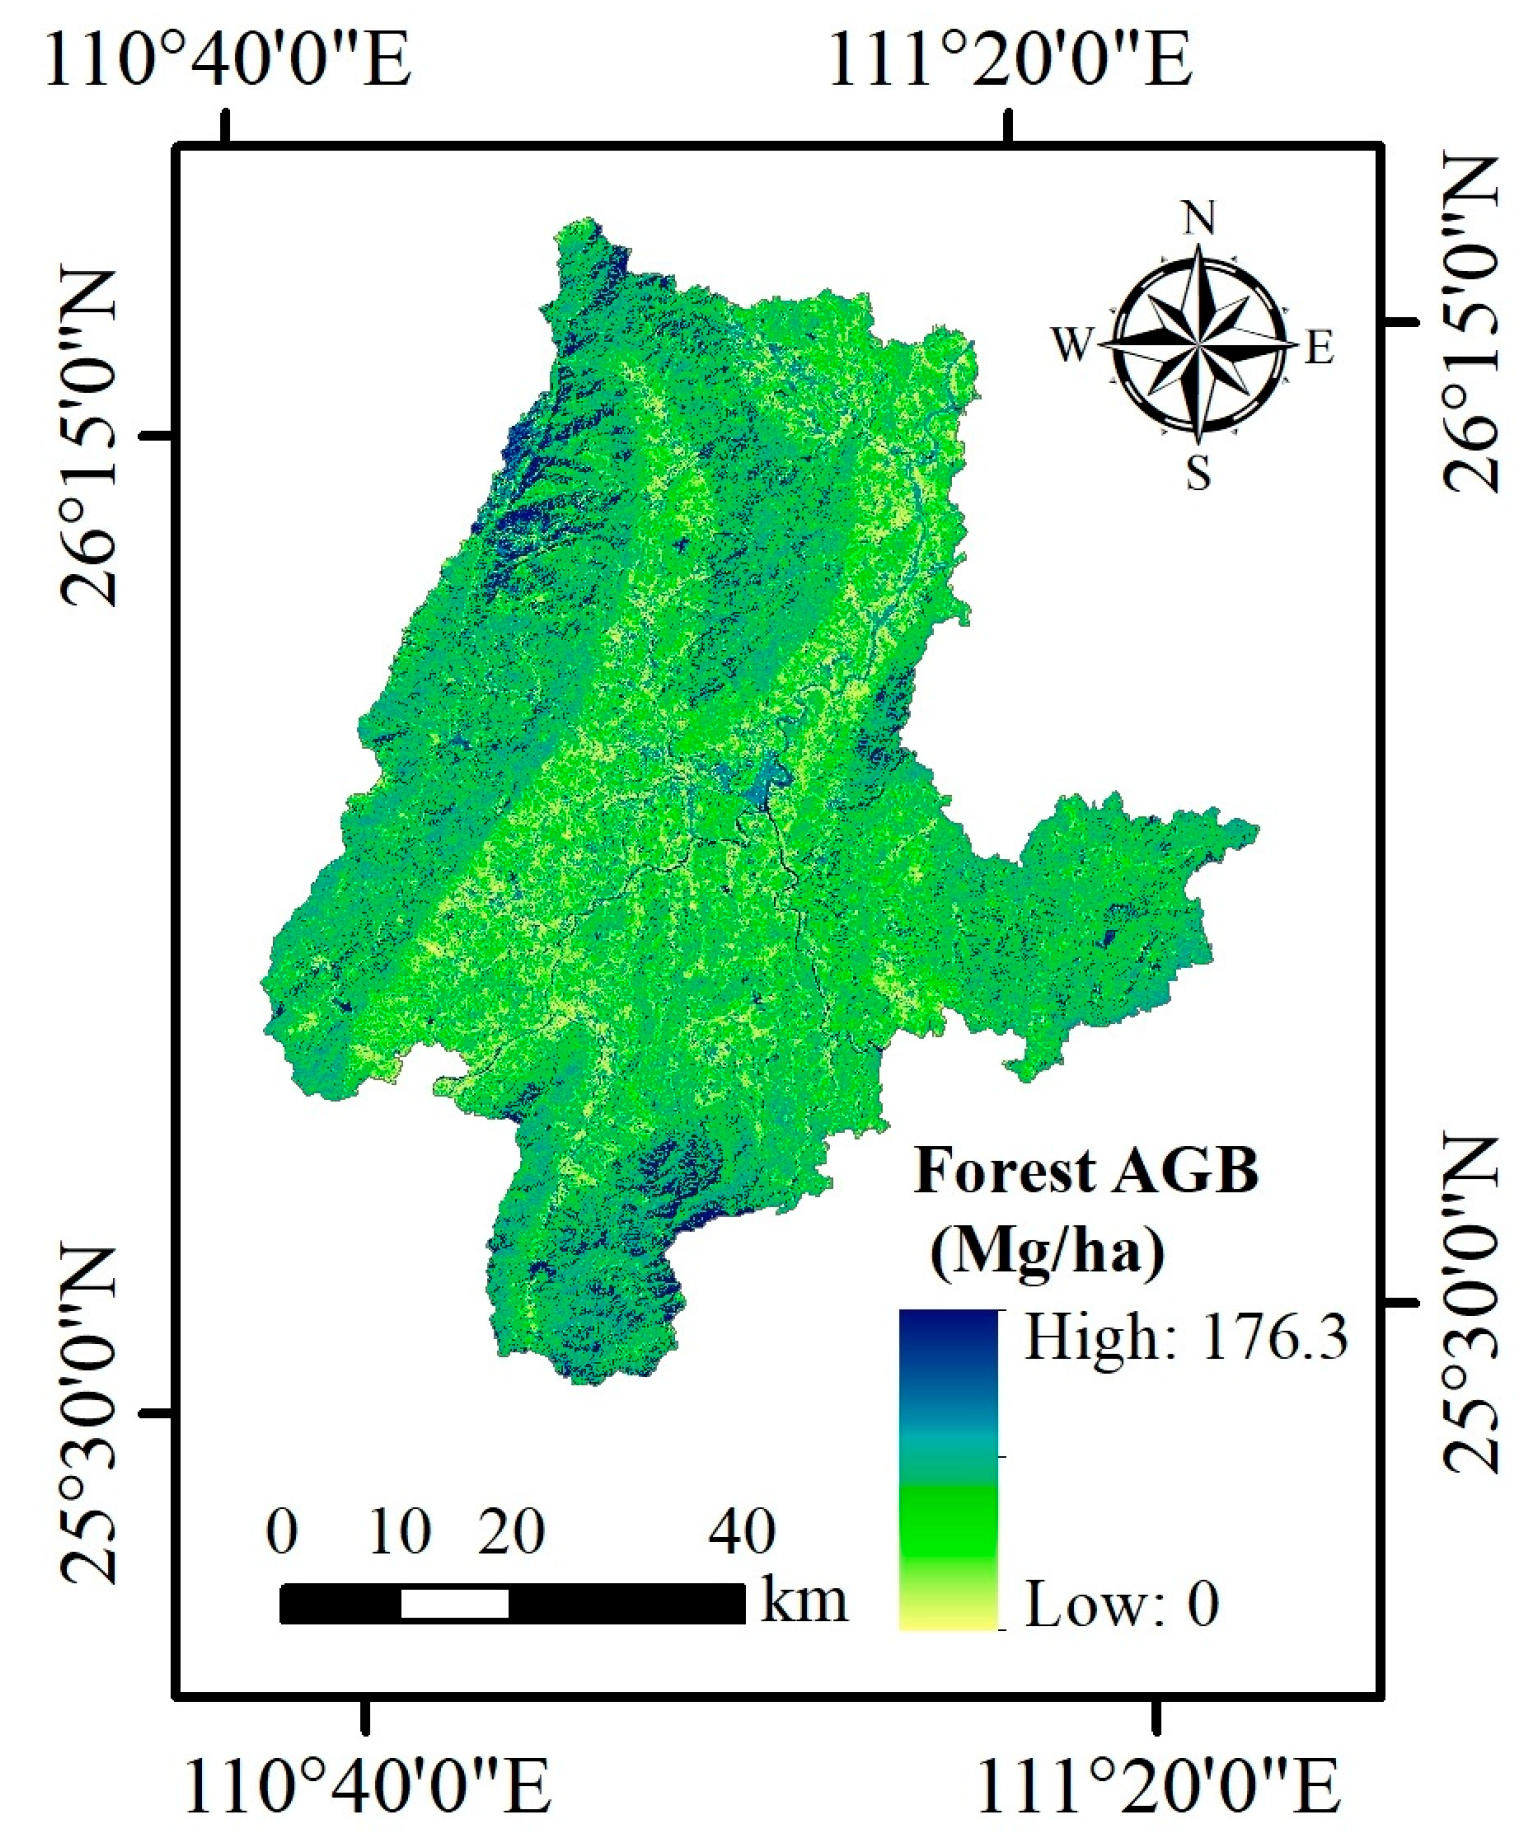
Figure 8 displays the spatial distribution of forest AGB in the study area obtained by integrating Sentinel-2 and ALOS-2 data using BO-XGBoost, with forest AGB values primarily ranging between 0 and 176.3 Mg/ha. Spatially, higher forest AGB predictions are concentrated in the southern and northwestern regions. These areas likely provide more favorable conditions for forest growth due to their unique geographical environment, climatic conditions, and minimal human disturbance, resulting in relatively higher forest AGB values. In contrast, forest AGB values are lower in some parts of the central and northeastern regions, which are more affected by human activities, consistent with the actual forest distribution in the study area. By combining active and passive remote-sensing data sources, more comprehensive forest information can be obtained, leading to more reasonable forest AGB estimation results, which can serve as a reference for forest surveys.

4. Discussion

The selection of remote-sensing data sources plays a pivotal role, as it fundamentally governs both the accuracy and practical applicability of forest aboveground biomass AGB estimation models. Optical remote sensing provides valuable spectral information that reflects vegetation status via various vegetation indices; nevertheless, its performance is constrained by cloud cover, rainfall, and limited vertical penetration capability, often leading to spectral saturation in dense forests [6]. In this study, the BO-XGBoost model using optical data achieved an RMSE of 15.40 Mg/ha, indicating moderate performance. In contrast, SAR data (e.g., ALOS-2) enable all-weather observation and capture sub-canopy structural features via microwave penetration, showing superior sensitivity in high-biomass areas. The SAR-based model reduced the RMSE to 12.42 Mg/ha, representing a 19.4% improvement over the optical approach and demonstrating clear advantages in forest AGB estimation. Nevertheless, SAR data are significantly influenced by surface roughness and moisture and lack direct spectral information [17]. Integrating the spectral characteristics of optical data with the structural features of SAR data enables complementary advantages: optical data compensate for SAR’s limitations in species identification and leaf area characterization, while SAR data overcome the constraints of optical data in vertical structure detection and weather dependencies. A key advantage of integrating multispectral vegetation indices from optical data with SAR-derived backscattering coefficients and texture features lies in its ability to significantly enhance AGB estimation accuracy in complex forest stands, while simultaneously compensating for the systematic biases inherent in any single data source [54]. This multi-source collaborative modeling strategy enhances feature diversity but also effectively suppresses data noise via feature-level fusion, providing a more robust solution for regional-scale AGB inversion. Our findings align with existing literature [55], confirming that the utility of Sentinel-2 data for forest AGB estimation is frequently limited by signal saturation in denser canopies. L-band SAR data can achieve higher accuracy than optical data, yet limitations persist due to insufficient information content [56]. While integrating Sentinel-1 and Sentinel-2 data improves prediction accuracy, Sentinel-1’s short wavelength limits penetration into the forest structure [57]. In contrast, this study synergistically fused Sentinel-2 and ALOS-2 data, combining their advantages to extract both horizontal and vertical forest structural information. In this study, all forest AGB prediction models developed using ALOS-2 data demonstrated superior fitting performances compared with those using Sentinel-2, with RMSE reductions ranging from 15.9% to 19.4%, confirming the effectiveness of SAR data in forest AGB estimation. Furthermore, the combined data sources achieved optimal prediction accuracy, showing additional RMSE reductions of 15.9% to 23.2% compared with ALOS-2 models, indicating that the synergistic integration of these two data sources can effectively realize complementary advantages and reduce forest AGB estimation errors. The culmination of our modeling efforts was the optimal model utilizing the combined Sentinel-2 and ALOS-2 data, which achieved the best fitting accuracy and recorded the lowest RMSE of 9.82 Mg/ha.
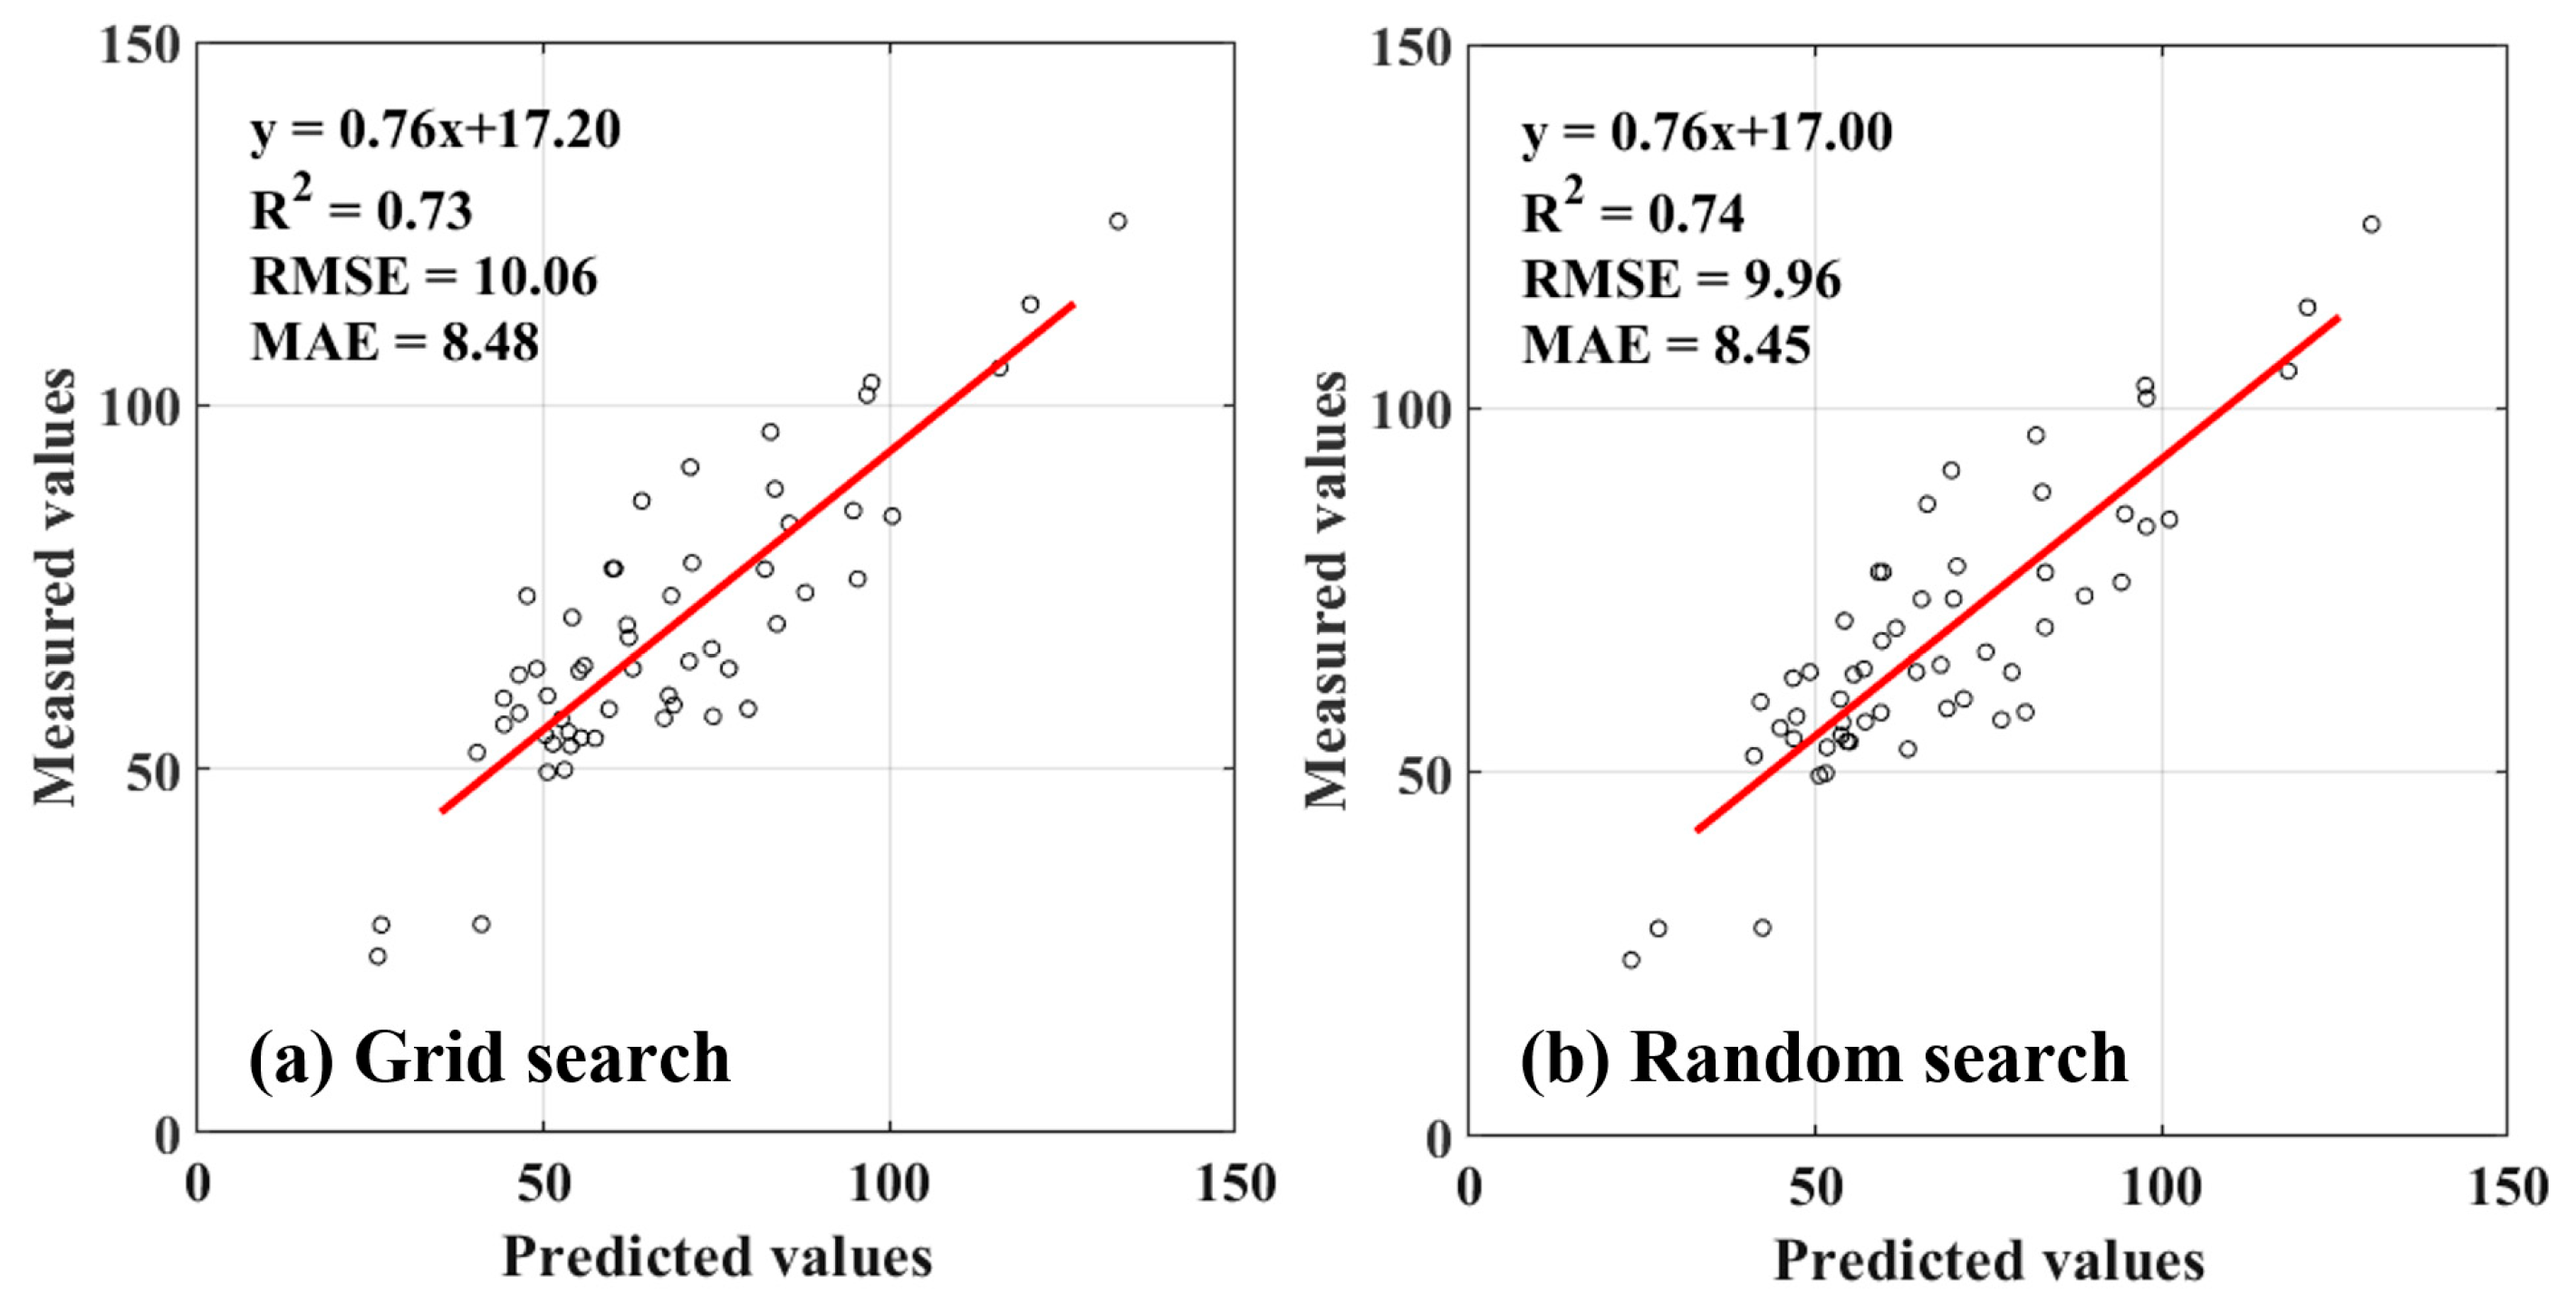
Furthermore, hyperparameter optimization systematically adjusts model structural parameters to balance bias and variance finely, fully unlocking model potential [25]. Grid search and random search are typical hyperparameter optimization methods. We further compared the efficacy of these two approaches using combined data sources. Grid search and random search achieved RMSE values of 10.06 and 9.96 Mg/ha, respectively, representing increases of 2.4% and 1.4% over Bayesian optimization (Figure 9). Hyperparameter optimization yielded a marked enhancement in XGBoost’s performance, as evidenced by an 8.7% reduction in RMSE for the BO-XGBoost model compared to its default configuration. Furthermore, the resulting spatial distribution of estimated forest AGB was closely aligned with the actual forest coverage, a finding that corroborates the observations made by Ma et al. [58]. However, our study achieved accurate prediction results by integrating L-band SAR. Bayesian optimization adaptively selects hyperparameter combinations by constructing surrogate models (e.g., Gaussian processes), proving more efficient than grid or random search in identifying superior solutions with fewer iterations. It balances exploration and exploitation, avoiding the curse of dimensionality in grid search and the randomness in random search, making it particularly suitable for forest AGB estimation, a conclusion consistent with Jiang’s findings [59].
By effectively fusing optical and SAR data, the Bayesian-optimized XGBoost model presented in this work establishes its strong potential for generating high-accuracy forest AGB maps in regions characterized by complex topography. This modeling framework exhibits considerable transferability and can be extended to larger regions or even global-scale forest carbon stock monitoring operations in the future, thereby providing a robust and reliable technical tool for precise carbon sink quantification in the context of climate change. To further enhance its practical utility, future research could focus on developing cross-sensor transfer learning schemes incorporating LiDAR data and integrating uncertainty quantification modules to evaluate the estimation results’ reliability more clearly.
This study leveraged forest resource inventory data to achieve high-precision spatial estimation of forest AGB by integrating multi-source remote sensing with a Bayesian-optimized ensemble learning approach. The methodology offers a reliable technical pathway for dynamic forest biomass monitoring at regional to national scales, effectively supplementing traditional inventories and enhancing the spatiotemporal resolution of carbon sink assessments. Moreover, accurate AGB estimation, as a key carbon storage proxy, refines the assessment of terrestrial carbon sequestration and deepens the understanding of the global carbon cycle. These findings provide critical scientific support for China’s forest inventory and carbon neutrality strategies. Furthermore, seasonal and topographic factors, which significantly influence vegetation phenology and forest growth conditions, warrant further quantitative exploration in future research.

5. Conclusions

Given the crucial role of accurate forest AGB estimation in assessing forest quality and enabling efficient resource monitoring, this study was designed to evaluate the potential of integrating Sentinel-2 and ALOS-2 data for this purpose. Integrating PolSAR data with optical data significantly improved model predictive performance compared with using a single data source. Furthermore, we proposed an interpretable Bayesian-optimized XGBoost model, which demonstrated substantial improvements in forest AGB estimation over conventional machine learning models. The developed methodology serves a dual purpose: it identifies key predictive features for forest AGB and facilitates the interpretation of their influence. Consequently, this research highlights the promise of multi-source data fusion and emphasizes that its success critically depends on implementing sophisticated hyperparameter tuning strategies. The conclusions can provide valuable references for large-scale forest quality evaluation and forest inventory. LiDAR can directly measure vertical parameters of forests, demonstrating significant potential for forest parameter estimation. A promising direction for future work lies in the synergistic integration of multi-source active and passive remote-sensing data. This approach is expected to yield a more holistic characterization of forest structure, paving the way for enhanced accuracy in AGB estimation.

Author Contributions

Conceptualization, X.Z.; data curation, C.L.; formal analysis, Z.W. (Zhiqiang Wang), Y.W. and T.H.; funding acquisition, X.Z.; investigation, Z.W. (Zhaosheng Wang), Y.W., C.L. and T.H.; methodology, X.Z. and Z.W. (Zhiqiang Wang); software, Z.W. (Zhaosheng Wang) and T.H.; validation, Z.W. (Zhaosheng Wang), Y.W. and C.L.; writing—original draft, X.Z.; writing—review and editing, Z.W. (Zhiqiang Wang) and C.L. All authors have read and agreed to the published version of the manuscript.

Funding

This research was funded by [National Key Research and Development Program of China ] grant number [2023YFB3907402]; [Science and Technology Program of Yunnan Province] grant number [202303AC100009]; [Open Project of Technology Innovation Center for Natural Ecosystem Carbon Sink] grant number [CS2023D06]; [Research project of Hunan Provincial Department of Education] grant number [22C0522].

Institutional Review Board Statement

Not applicable.

Informed Consent Statement

Not applicable.

Data Availability Statement

The original contributions presented in this study are included in the article. Further inquiries can be directed to the corresponding author.

Conflicts of Interest

The authors declare no conflicts of interest.

References

  1. Mokany, K.; Raison, R.J.; Prokushkin, A.S. Critical analysis of root: Shoot ratios in terrestrial biomes. Glob. Change Biol. 2006, 1, 84–96. [Google Scholar] [CrossRef]
  2. Wang, Y.; Wang, X.; Ji, P.; Li, H.; Wei, S.; Peng, D. Evaluating Forest Aboveground Biomass Products by Incorporating Spatial Representativeness Analysis. Remote Sens. 2025, 17, 2898. [Google Scholar] [CrossRef]
  3. Zhang, R.; Zhou, X.; Ouyang, Z.; Avitabile, V.; Qi, J.; Chen, J.; Giannico, V. Estimating aboveground biomass in subtropical forests of China by integrating multisource remote sensing and ground data. Remote Sens. Environ. 2019, 232, 111341. [Google Scholar] [CrossRef]
  4. Chen, Z.; Yang, X.; Pan, X.; Wu, T.; Lei, J.; Chen, X.; Li, Y.; Chen, Y. Estimating Forest Aboveground Biomass in Tropical Zones by Integrating LiDAR and Sentinel-2B Data. Sustainability. 2025, 17, 3631. [Google Scholar] [CrossRef]
  5. Cao, Y.; Zhao, Y.; Xu, J.; Fang, Q.; Xuan, J.; Huang, L.; Li, X.; Mao, F.; Sun, Y.; Du, H. UAV-LiDAR-Based Study on AGB Response to Stand Structure and Its Estimation in Cunninghamia Lanceolata Plantations. Remote Sens. 2025, 17, 2842. [Google Scholar] [CrossRef]
  6. Lu, D. The potential and challenge of remote sensing-based biomass estimation. Int. J. Remote Sens. 2006, 27, 1297–1328. [Google Scholar] [CrossRef]
  7. Pham, T.D.; Yokoya, N.; Bui, D.T.; Yoshino, K.; Friess, D.A. Remote sensing approaches for monitoring mangrove species, structure, and biomass: Opportunities and challenges. Remote Sens. 2019, 11, 230. [Google Scholar] [CrossRef]
  8. Wu, J.; Yao, W.; Choi, S.; Park, T.; Myneni, R.B. A Comparative Study of Predicting DBH and Stem Volume of Individual Trees in a Temperate Forest Using Airborne Waveform LiDAR. IEEE Geosci. Remote Sens. Lett. 2015, 12, 2267–2271. [Google Scholar] [CrossRef]
  9. Pham, L.T.H.; Brabyn, L. Monitoring mangrove biomass change in Vietnam using SPOT images and an object-based approach combined with machine learning algorithms. ISPRS J. Photogramm. 2017, 128, 86–97. [Google Scholar] [CrossRef]
  10. Zhu, Y.; Liu, K.; Liu, L.; Myint, S.W.; Wang, S.; Liu, H.; He, Z. Exploring the Potential of WorldView-2 Red-Edge Band-Based Vegetation Indices for Estimation of Mangrove Leaf Area Index with Machine Learning Algorithms. Remote Sens. 2017, 9, 1060. [Google Scholar] [CrossRef]
  11. Song, J.; Liu, X.; Adingo, S.; Guo, Y.; Li, Q. A Comparative Analysis of Remote Sensing Estimation of Aboveground Biomass in Boreal Forests Using Machine Learning Modeling and Environmental Data. Sustainability 2024, 16, 7232. [Google Scholar] [CrossRef]
  12. Wai, P.; Su, H.; Li, M. Estimating Aboveground Biomass of Two Different Forest Types in Myanmar from Sentinel-2 Data with Machine Learning and Geostatistical Algorithms. Remote Sens. 2022, 14, 2146. [Google Scholar] [CrossRef]
  13. Zolkos, S.G.; Goetz, S.J.; Dubayah, R. A meta-analysis of terrestrial aboveground biomass estimation using lidar remote sensing. Remote Sens. Environ. 2013, 128, 289–298. [Google Scholar] [CrossRef]
  14. Lee, M.-K.; Lee, Y.-J.; Lee, D.-Y.; Park, J.-S.; Lee, C.-B. Biomass Estimation of Apple and Citrus Trees Using Terrestrial Laser Scanning and Drone-Mounted RGB Sensor. Remote Sens. 2025, 17, 2554. [Google Scholar] [CrossRef]
  15. Li, W.; Guo, Q.; Jakubowski, M.K.; Kelly, M. A new method for segmenting individual trees from the LiDAR point cloud. Photogramm. Eng. Remote Sens. 2012, 78, 75–84. [Google Scholar] [CrossRef]
  16. Markus, T.; Neumann, T.; Martino, A.; Abdalati, W.; Brunt, K.; Csatho, B.; Farrell, S.; Fricker, H.; Gardner, A.; Harding, D.; et al. The Ice, Cloud, and Land Elevation Satellite-2 (ICESat-2): Science Requirements, Concept, and Implementation. Remote Sens. Environ. 2017, 190, 260–273. [Google Scholar] [CrossRef]
  17. Chen, X.; Sun, Q.; Hu, J. Generation of Complete SAR Geometric Distortion Maps Based on DEM and Neighbor Gradient Algorithm. Appl. Sci. 2018, 8, 2206. [Google Scholar] [CrossRef]
  18. Zhao, P.; Lu, D.; Wang, G.; Liu, L.; Li, D.; Zhu, J.; Yu, S. Forest aboveground biomass estimation in Zhejiang Province using the integration of Landsat TM and ALOS PALSAR data. Int. J. Appl. Earth. Obs. 2016, 53, 1–15. [Google Scholar] [CrossRef]
  19. Hu, Y.; Tian, B.; Yuan, L.; Li, X.; Huang, Y.; Shi, R.; Jiang, X.; Wang, L.; Sun, C. Mapping Coastal Salt Marshes in China Using Time Series of Sentinel-1 SAR. ISPRS J. Photogramm. Remote Sens. 2021, 173, 122–134. [Google Scholar] [CrossRef]
  20. Tang, X.; Fehrmann, L.; Guan, F.; Forrester, D.I.; Guisasola, R.; Kleinn, C. Inventory-based estimation of forest biomass in Shitai County, China: A comparison of five methods. Ann. For. Res. 2016, 59, 269–280. [Google Scholar] [CrossRef]
  21. Li, G.; Xie, Z.; Jiang, X.; Lu, D.; Chen, E. Integration of ZiYuan-3 Multispectral and Stereo Data for Modeling Aboveground Biomass of Larch Plantations in North China. Remote Sens. 2019, 11, 2328. [Google Scholar] [CrossRef]
  22. Whelan, A.W.; Cannon, J.B.; Bigelow, S.W.; Rutledge, B.T.; Meador, A.J.S. Improving generalized models of forest structure in complex forest types using area-and voxel-based approaches from LiDAR. Remote Sens. Environ. 2023, 284, 113362. [Google Scholar] [CrossRef]
  23. Tokola, T.; Pitkänen, J.; Partinen, S.; Muinonen, E. Point accuracy of a non-parametric method in estimation of forest characteristics with different satellite materials. Int. J. Remote Sens. 1996, 17, 2333–2351. [Google Scholar] [CrossRef]
  24. Tang, L.; Yu, L.; Wang, S.; Li, J.; Wang, S. A novel hybrid ensemble learning paradigm for nuclear energy consumption forecasting. Appl. Energy 2012, 93, 432–443. [Google Scholar] [CrossRef]
  25. Na, Q.; Lai, Q.; Bao, G.; Xue, J.; Liu, X.; Gao, R. Estimation of Gross Primary Productivity Using Performance-Optimized Machine Learning Methods for the Forest Ecosystems in China. Forests 2025, 16, 518. [Google Scholar] [CrossRef]
  26. Bui, Q.-T.; Pham, Q.-T.; Pham, V.-M.; Tran, V.-T.; Nguyen, D.-H.; Nguyen, Q.-H.; Nguyen, H.-D.; Do, N.T.; Vu, V.-M. Hybrid Machine Learning Models for Aboveground Biomass Estimations. Ecol. Inf. 2024, 79, 102421. [Google Scholar] [CrossRef]
  27. Fu, W.; Guo, H.; Li, X.; Tian, B.; Sun, Z. Extended Three-Stage Polarimetric SAR Interferometry Algorithm by Dual-Polarization Data. IEEE Trans. Geosci. Remote Sens. 2016, 54, 2792–2802. [Google Scholar]
  28. Jian, K.; Lu, D.; Lu, Y.; Li, G. Improving Forest Canopy Height Mapping in Wuyishan National Park Through Calibration of ZiYuan-3 Stereo Imagery Using Limited Unmanned Aerial Vehicle LiDAR Data. Forests 2025, 16, 125. [Google Scholar] [CrossRef]
  29. Zhao, M.; Yang, J.; Zhao, N.; Liu, Y.; Wang, Y.; Wilson, J.P.; Yue, T. Estimation of China’s forest stand biomass carbon sequestration based on the continuous biomass expansion factor model and seven forest inventories from 1977 to 2013. For. Ecol. Manag. 2019, 448, 528–534. [Google Scholar] [CrossRef]
  30. Fang, J.Y.; Chen, A.P.; Peng, C.H.; Zhao, S.Q.; Ci, L.J. Changes in forest biomass carbon storage in China between 1949 and 1998. Science 2001, 292, 2320–2322. [Google Scholar] [CrossRef]
  31. Gholizadeh, A.; Zizala, D.; Saberioon, M.; Boruvka, L. Soil Organic Carbon and Texture Retrieving and Mapping using Proximal, Airborne and Sentinel-2 Spectral Imaging. Remote Sens. Environ. 2018, 218, 89–103. [Google Scholar] [CrossRef]
  32. Jiang, F.; Zhao, F.; Ma, K.; Li, D.; Sun, H. Mapping the Forest Canopy Height in Northern China by Synergizing ICESat-2 with Sentinel-2 Using a Stacking Algorithm. Remote Sens. 2021, 13, 1535. [Google Scholar] [CrossRef]
  33. Mahdianpari, M.; Salehi, B.; Mohammadimanesh, F.; Motagh, M. Random forest wetland classification using ALOS-2 L-band, RADARSAT-2 C-band, and TerraSAR-X imagery. ISPRS J. Photogramm. Remote Sens. 2017, 130, 13–31. [Google Scholar] [CrossRef]
  34. Shimada, M. New global forest/non-forest maps from ALOS PALSAR data (2007-2010). Remote Sens. Environ. 2014, 155, 13–31. [Google Scholar] [CrossRef]
  35. Motohka, T.; Nasahara, K.N.; Oguma, H.; Tsuchida, S. Applicability of Green-Red Vegetation Index for Remote Sensing of Vegetation Phenology. Remote Sens. 2010, 2, 2369–2387. [Google Scholar] [CrossRef]
  36. Zhou, J.-J.; Zhou, Z.; Zhao, Q.; Han, Z.; Wang, P.; Xu, J.; Dian, Y. Evaluation of Different Algorithms for Estimating the Growing Stock Volume of Pinus massoniana Plantations Using Spectral and Spatial Information from a SPOT6 Image. Forests 2020, 11, 540. [Google Scholar] [CrossRef]
  37. Puliti, S.; Saarela, S.; Gobakken, T.; Ståhl, G.; Næsset, E. Combining UAV and Sentinel-2 auxiliary data for forest growing stock volume estimation through hierarchical model-based inference. Remote Sens. Environ. 2018, 204, 485–497. [Google Scholar] [CrossRef]
  38. Qi, J.G.; Chehbouni, A.R.; Huete, A.R.; Kerr, Y.H.; Sorooshian, S. A modified soil adjusted vegetation index. Remote Sens. Environ. 1994, 48, 119–126. [Google Scholar] [CrossRef]
  39. Sun, H.; Wang, Q.; Wang, G.; Lin, H.; Luo, P.; Li, J.; Zeng, S.; Xu, X.; Ren, L. Optimizing kNN for Mapping Vegetation Cover of Arid and Semi-Arid Areas Using Landsat images. Remote Sens. 2018, 10, 1248. [Google Scholar] [CrossRef]
  40. Dong, T.; Liu, J.; Shang, J.; Qian, B.; Ma, B.; Kovacs, J.M.; Walters, D.; Jiao, X.; Geng, X.; Shi, Y. Assessment of red-edge vegetation indices for crop leaf area index estimation. Remote Sens. Environ. 2019, 222, 133–143. [Google Scholar] [CrossRef]
  41. Chi, H.; Sun, G.; Huang, J.; Guo, Z.; Ni, W.; Fu, A. National Forest Aboveground Biomass Mapping from ICESat/GLAS Data and MODIS Imagery in China. Remote Sens. 2015, 7, 5534–5564. [Google Scholar] [CrossRef]
  42. Jiang, F.-G.; Li, M.-D.; Chen, S.-W. Adaptive Gaussian-PSO XGBoost Model for Alpine Forests Aboveground Biomass Estimation Using Spaceborne PolSAR and LiDAR Data. IEEE J. Sel. Top. Appl. Earth Obs. Remote Sens. 2025, 18, 10157–10171. [Google Scholar] [CrossRef]
  43. Baraldi, A.; Parmiggiani, F. Investigation of the textural characteristics associated with gray level cooccurrence matrix statistical parameters. IEEE Trans. Geosci. Remote Sens. 1995, 33, 293–304. [Google Scholar] [CrossRef]
  44. Lu, D. A survey of remote sensing-based aboveground biomass estimation methods in forest ecosystems. Int. J. Digit. Earth 2016, 9, 63–105. [Google Scholar] [CrossRef]
  45. Jain, A.; Zongker, D. Feature selection: Evaluation, application, and small sample performance. IEEE Trans. Pattern Anal. Mach. Intell. 1997, 19, 153–158. [Google Scholar] [CrossRef]
  46. Chen, T.; Guestrin, C. XGBoost: A scalable tree boosting system. In Proceedings of the 22nd ACM SIGKDD International Conference on Knowledge Discovery and Data Mining (KDD), San Francisco, CA, USA, 13–17 August 2016; pp. 785–794. [Google Scholar]
  47. Liao, B.; Zhou, T.; Liu, Y.; Li, M.; Zhang, T. Tackling the Wildfire Prediction Challenge: An Explainable Artificial Intelligence (XAI) Model Combining Extreme Gradient Boosting (XGBoost) with SHapley Additive exPlanations (SHAP) for Enhanced Interpretability and Accuracy. Forests 2025, 16, 689. [Google Scholar] [CrossRef]
  48. Liu, G.; Zheng, L.; Long, P.; Yang, L.; Zhang, L. Ensemble Learning and SHAP Interpretation for Predicting Tensile Strength and Elastic Modulus of Basalt Fibers Based on Chemical Composition. Sustainability 2025, 17, 7387. [Google Scholar] [CrossRef]
  49. Yuan, H.; Yang, G.; Li, C.; Wang, Y.; Liu, J.; Yu, H.; Feng, H.; Xu, B.; Zhao, X.; Yang, X. Retrieving Soybean Leaf Area Index from Unmanned Aerial Vehicle Hyperspectral Remote Sensing: Analysis of RF, ANN, and SVM Regression Models. Remote Sens. 2017, 9, 309. [Google Scholar] [CrossRef]
  50. Tomppo, E.O.; Gagliano, C.; De Natale, F.; Katila, M.; McRoberts, R.E. Predicting categorical forest variables using an improved k-Nearest Neighbour estimator and Landsat imagery. Remote Sens. Environ. 2009, 113, 500–517. [Google Scholar] [CrossRef]
  51. Lv, D.; Liu, G.; Ou, J.; Wang, S.; Gao, M. Prediction of GPS Satellite Clock Offset Based on an Improved Particle Swarm Algorithm Optimized BP Neural Network. Remote Sens. 2022, 14, 2407. [Google Scholar] [CrossRef]
  52. Breiman, L. Random Forests. Mach. Learn. 2001, 45, 5–32. [Google Scholar] [CrossRef]
  53. Wong, T.T. Performance evaluation of classification algorithms by k-fold and leave-one-out cross validation. Pattern Recognit. 2015, 48, 2839–2846. [Google Scholar] [CrossRef]
  54. Wang, Y.; Hancock, S.; Dong, W.; Ji, Y.; Zhao, H.; Wang, M. Analysis of the Application of Machine Learning Algorithms Based on Sentinel-1/2 and Landsat 8 OLI Data in Estimating Above-Ground Biomass of Subtropical Forests. Forests 2025, 16, 559. [Google Scholar] [CrossRef]
  55. Fu, Y.; Tan, H.; Kou, W.; Xu, W.; Wang, H.; Lu, N. Estimation of Rubber Plantation Biomass Based on Variable Optimization from Sentinel-2 Remote Sensing Imagery. Forests 2024, 15, 900. [Google Scholar] [CrossRef]
  56. Zhang, H.; Wang, C.; Zhu, J.; Fu, H.; Han, W.; Xie, H. Forest Aboveground Biomass Estimation in Subtropical Mountain Areas Based on Improved Water Cloud Model and PolSAR Decomposition Using L-Band PolSAR Data. Forests 2023, 14, 2303. [Google Scholar] [CrossRef]
  57. Wu, Y.; Chen, Y.; Tian, C.; Yun, T.; Li, M. Estimation of Subtropical Forest Aboveground Biomass Using Active and Passive Sentinel Data with Canopy Height. Remote Sens. 2025, 17, 2509. [Google Scholar] [CrossRef]
  58. Ma, Y.; Wu, H.; Xiong, S.; Li, Z.; Li, X. Remote sensing estimation of forest biomass based on IRS-P6 data: A case study of Yaoshan in Guilin. J. Hunan Univ. Sci. Technol. 2012, 27, 2. (In Chinese) [Google Scholar]
  59. Jiang, F.; Li, M.; Chen, S. PolSAR Forest Height Estimation Enhancement With Polarimetric Rotation Domain Features and Multivariate Sensitivity Analysis. IEEE J. Sel. Top. Appl. Earth Obs. Remote Sens. 2025, 18, 19470–19480. [Google Scholar] [CrossRef]
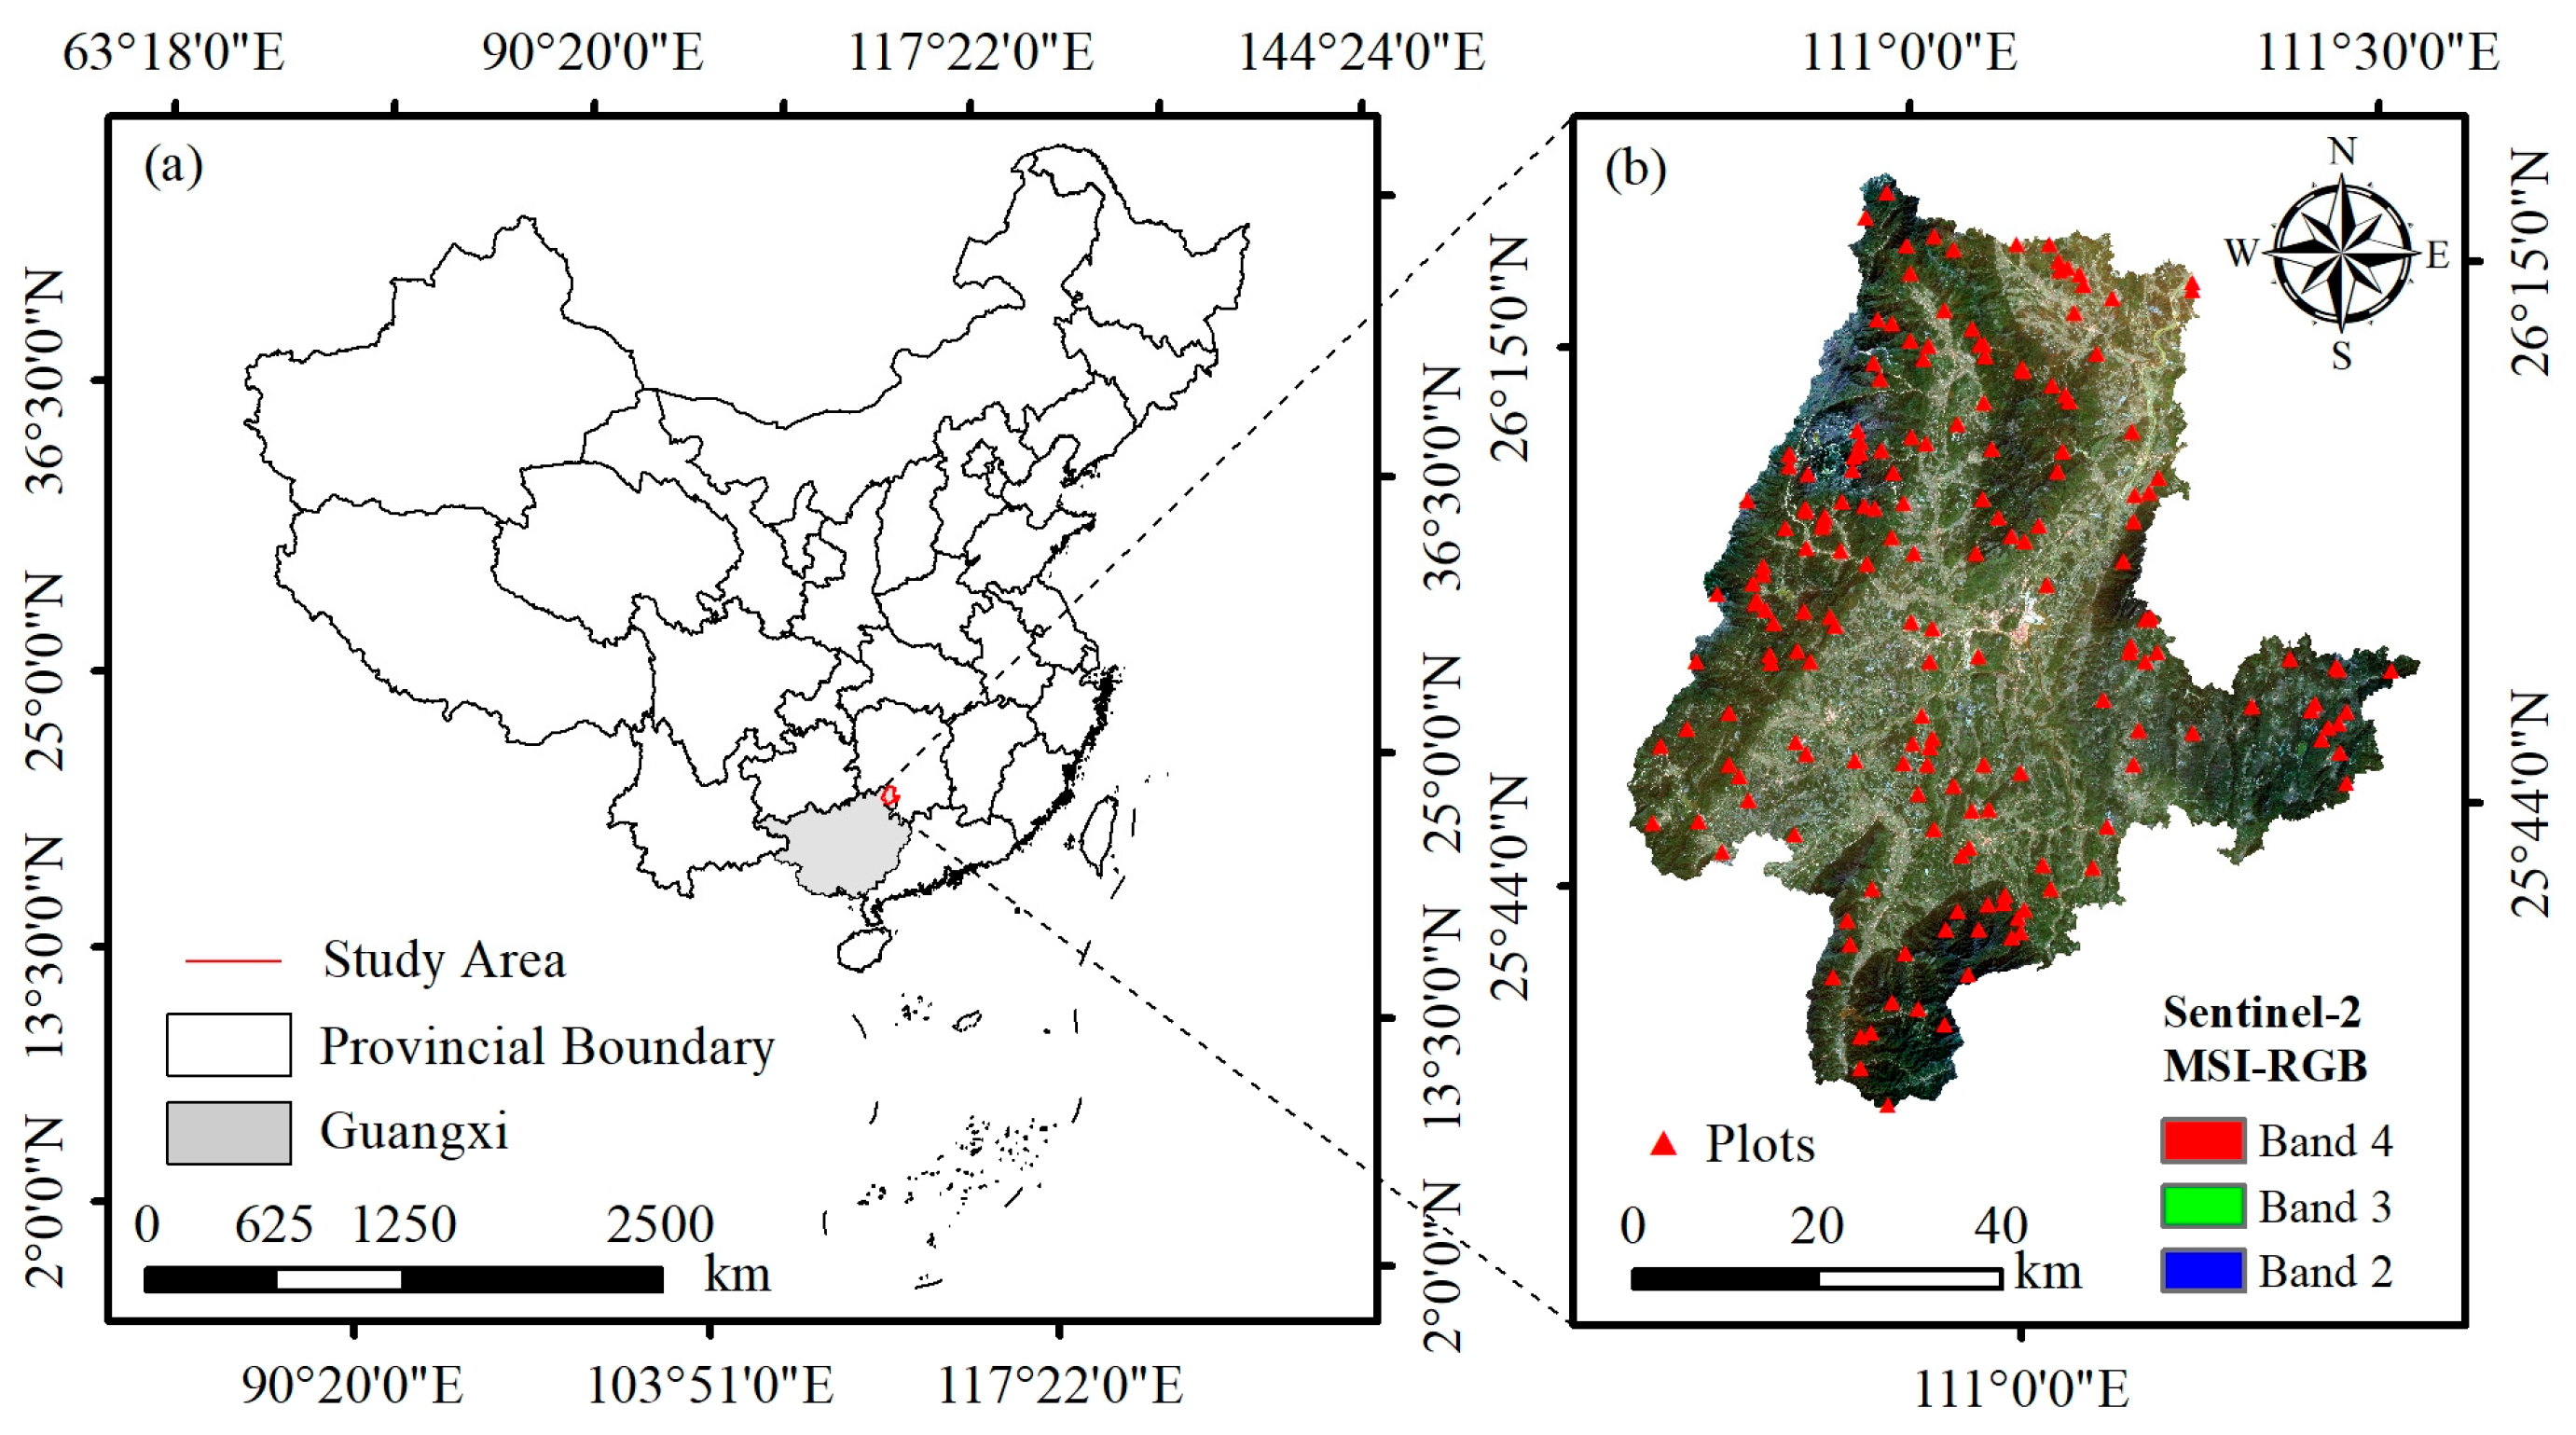
Figure 1. (a) Location of Quanzhou County and (b) distribution of field survey plots superimposed on a Sentinel-2 true-color base map of the study area.
Sustainability 17 09749 g001
Figure 2. The backscattering coefficient of preprocessed ALOS-2. (a) HV; (b) HV.
Sustainability 17 09749 g002
Figure 3. Schematic diagram of the Bayesian-optimized XGBoost modeling process.
Sustainability 17 09749 g003
Figure 4. Top-ranked features based on relative importance.
Sustainability 17 09749 g004
Figure 5. Summary plot of feature importance based on SHAP values.
Sustainability 17 09749 g005
Figure 6. The impact of feature interaction on forest AGB prediction.
Sustainability 17 09749 g006
Figure 7. Fitting diagrams of forest AGB estimation models based on different data sources. (ad) SVM, BP, RF, and BO-XGBoost with Sentinel-2 data; (eh) SVM, BP, RF, and BO-XGBoost with ALOS-2 data; and (il) SVM, BP, RF, and BO-XGBoost with Sentinel-2 and ALOS-2 data.
Sustainability 17 09749 g007
Figure 8. Spatial distributions of forest AGB in the study area.
Sustainability 17 09749 g008
Figure 9. Fitting diagram of forest AGB estimation results based on grid search and random search methods.
Sustainability 17 09749 g009
Table 1. Summary statistics of forest AGB values in Quanzhou County (Mg/ha).
Plot NumberRange of ValuesMeanStandard DeviationCoefficient of Variation (%)
1801.05–183.967.550.174.1
Table 2. Feature variables extracted from Sentinel-2 and ALOS-2 data in this study.
Data SourceFeature TypeFeature NameAbbreviation
Sentinel-2Spectral variableBand reflectance (band i; i = 5, 6, 7, 8A)Band i
Normalized difference vegetation indexNDVI
Red–green vegetation indexRGVI
Atmospherically resistant vegetation indexARVI
Enhanced vegetation indexEVI
Visible atmospherically resistant indexVARI
Soil-adjusted vegetation indexSAVI
Modified soil-adjusted vegetation indexMSAVI
Red-edge normalized difference vegetation indexRENDVI
Red-edge chlorophyll indexRECI
Red-edge spectral ratio indexRESR
ALOS-2Backscattering coefficientHH-
HV-
Table 3. Accuracy comparison of forest AGB predicted by Sentinel-2 and ALOS-2 data and the combined data source using different models.
Data SourceModelR2RMSE (Mg/ha)MAE (Mg/ha)
Sentinel-2SVM0.3216.1313.17
BP0.3216.1112.32
RF0.3615.6212.39
BO-XGBoost0.3815.4012.72
ALOS-2SVM0.5313.3113.55
BP0.5213.5511.05
RF0.5513.069.67
BO-XGBoost0.5912.4210.91
Sentinel-2 + ALOS-2SVM0.6711.148.66
BP0.6611.399.03
RF0.7410.027.78
BO-XGBoost0.759.828.29
Disclaimer/Publisher’s Note: The statements, opinions and data contained in all publications are solely those of the individual author(s) and contributor(s) and not of MDPI and/or the editor(s). MDPI and/or the editor(s) disclaim responsibility for any injury to people or property resulting from any ideas, methods, instructions or products referred to in the content.