Abstract
This study explores the potential connections between the digital economy and water conservation technologies in the context of China’s water resource consumption from 2008 to 2021. The research employs a state-of-the-art M-MQR technique, including the PCA index, and yields several significant findings. Empirical results reveal that digital technologies play a crucial role in reducing water consumption: Mobile technology decreases water use by −0.00001 to −0.00002 across quantiles, while internet access cuts consumption by −0.0000306 at lower quantiles and −0.0000167 at higher quantiles. The digital economy index shows an overall reduction in water consumption of −0.0537 at lower quantiles and −0.0292 at higher quantiles. Water conservation technologies, such as sprinkler irrigation, also contribute significantly, with reductions of −0.005 at the 10th quantile. Furthermore, water-saving investments show a positive effect on reducing water consumption, with reductions of −0.0105 at the 95th quantile. The study emphasizes that digitalization moderates the impact of water-saving technologies, reducing consumption by −0.0124 to −0.0118 at lower quantiles and −0.00812 to −0.00761 at middle quantiles. These results highlight the potential of digital infrastructure and water-saving investments to improve water use efficiency and address China’s water resource challenges. This study proposes that digital water supply and distribution system devices can help develop smart water infrastructure, reduce waste, and improve efficiency.
1. Introduction
Water is fundamental for the sustenance and welfare of all organisms and essential for economic success. However, countries worldwide are experiencing rising threats to water security due to a discrepancy between the growing need for and the decreasing availability of this essential resource [1]. The World Resources Institute (WRI) predicts that the global freshwater shortage will reach 56% by 2030, up from 40% in 2015, if drastic measures are not taken [2]. Therefore, managing water resources holds great importance as it is crucial in providing clean and sufficient water supplies to meet various needs, addressing water scarcity, stimulating economic growth in different sectors, supporting efficient agricultural practices, and preserving ecosystems [3]. In particular, digital economic development plays a pivotal role in mitigating water scarcity by leveraging digital technologies such as data-driven water management systems, real-time monitoring, and predictive analytics. These innovations enhance the efficiency of water use, reduce waste, and enable better allocation of water resources, thereby helping to address the challenges of water scarcity while promoting sustainable growth. Moreover, implementing effective water management practices enhances water utilization efficiency, yields economic advantages, and fosters ecological stewardship [4]. It mitigates the strain on finite water resources and effectively tackles the adverse ecological ramifications linked to the overconsumption of water, such as the depletion of groundwater reserves and the degradation of the marine environment [5].
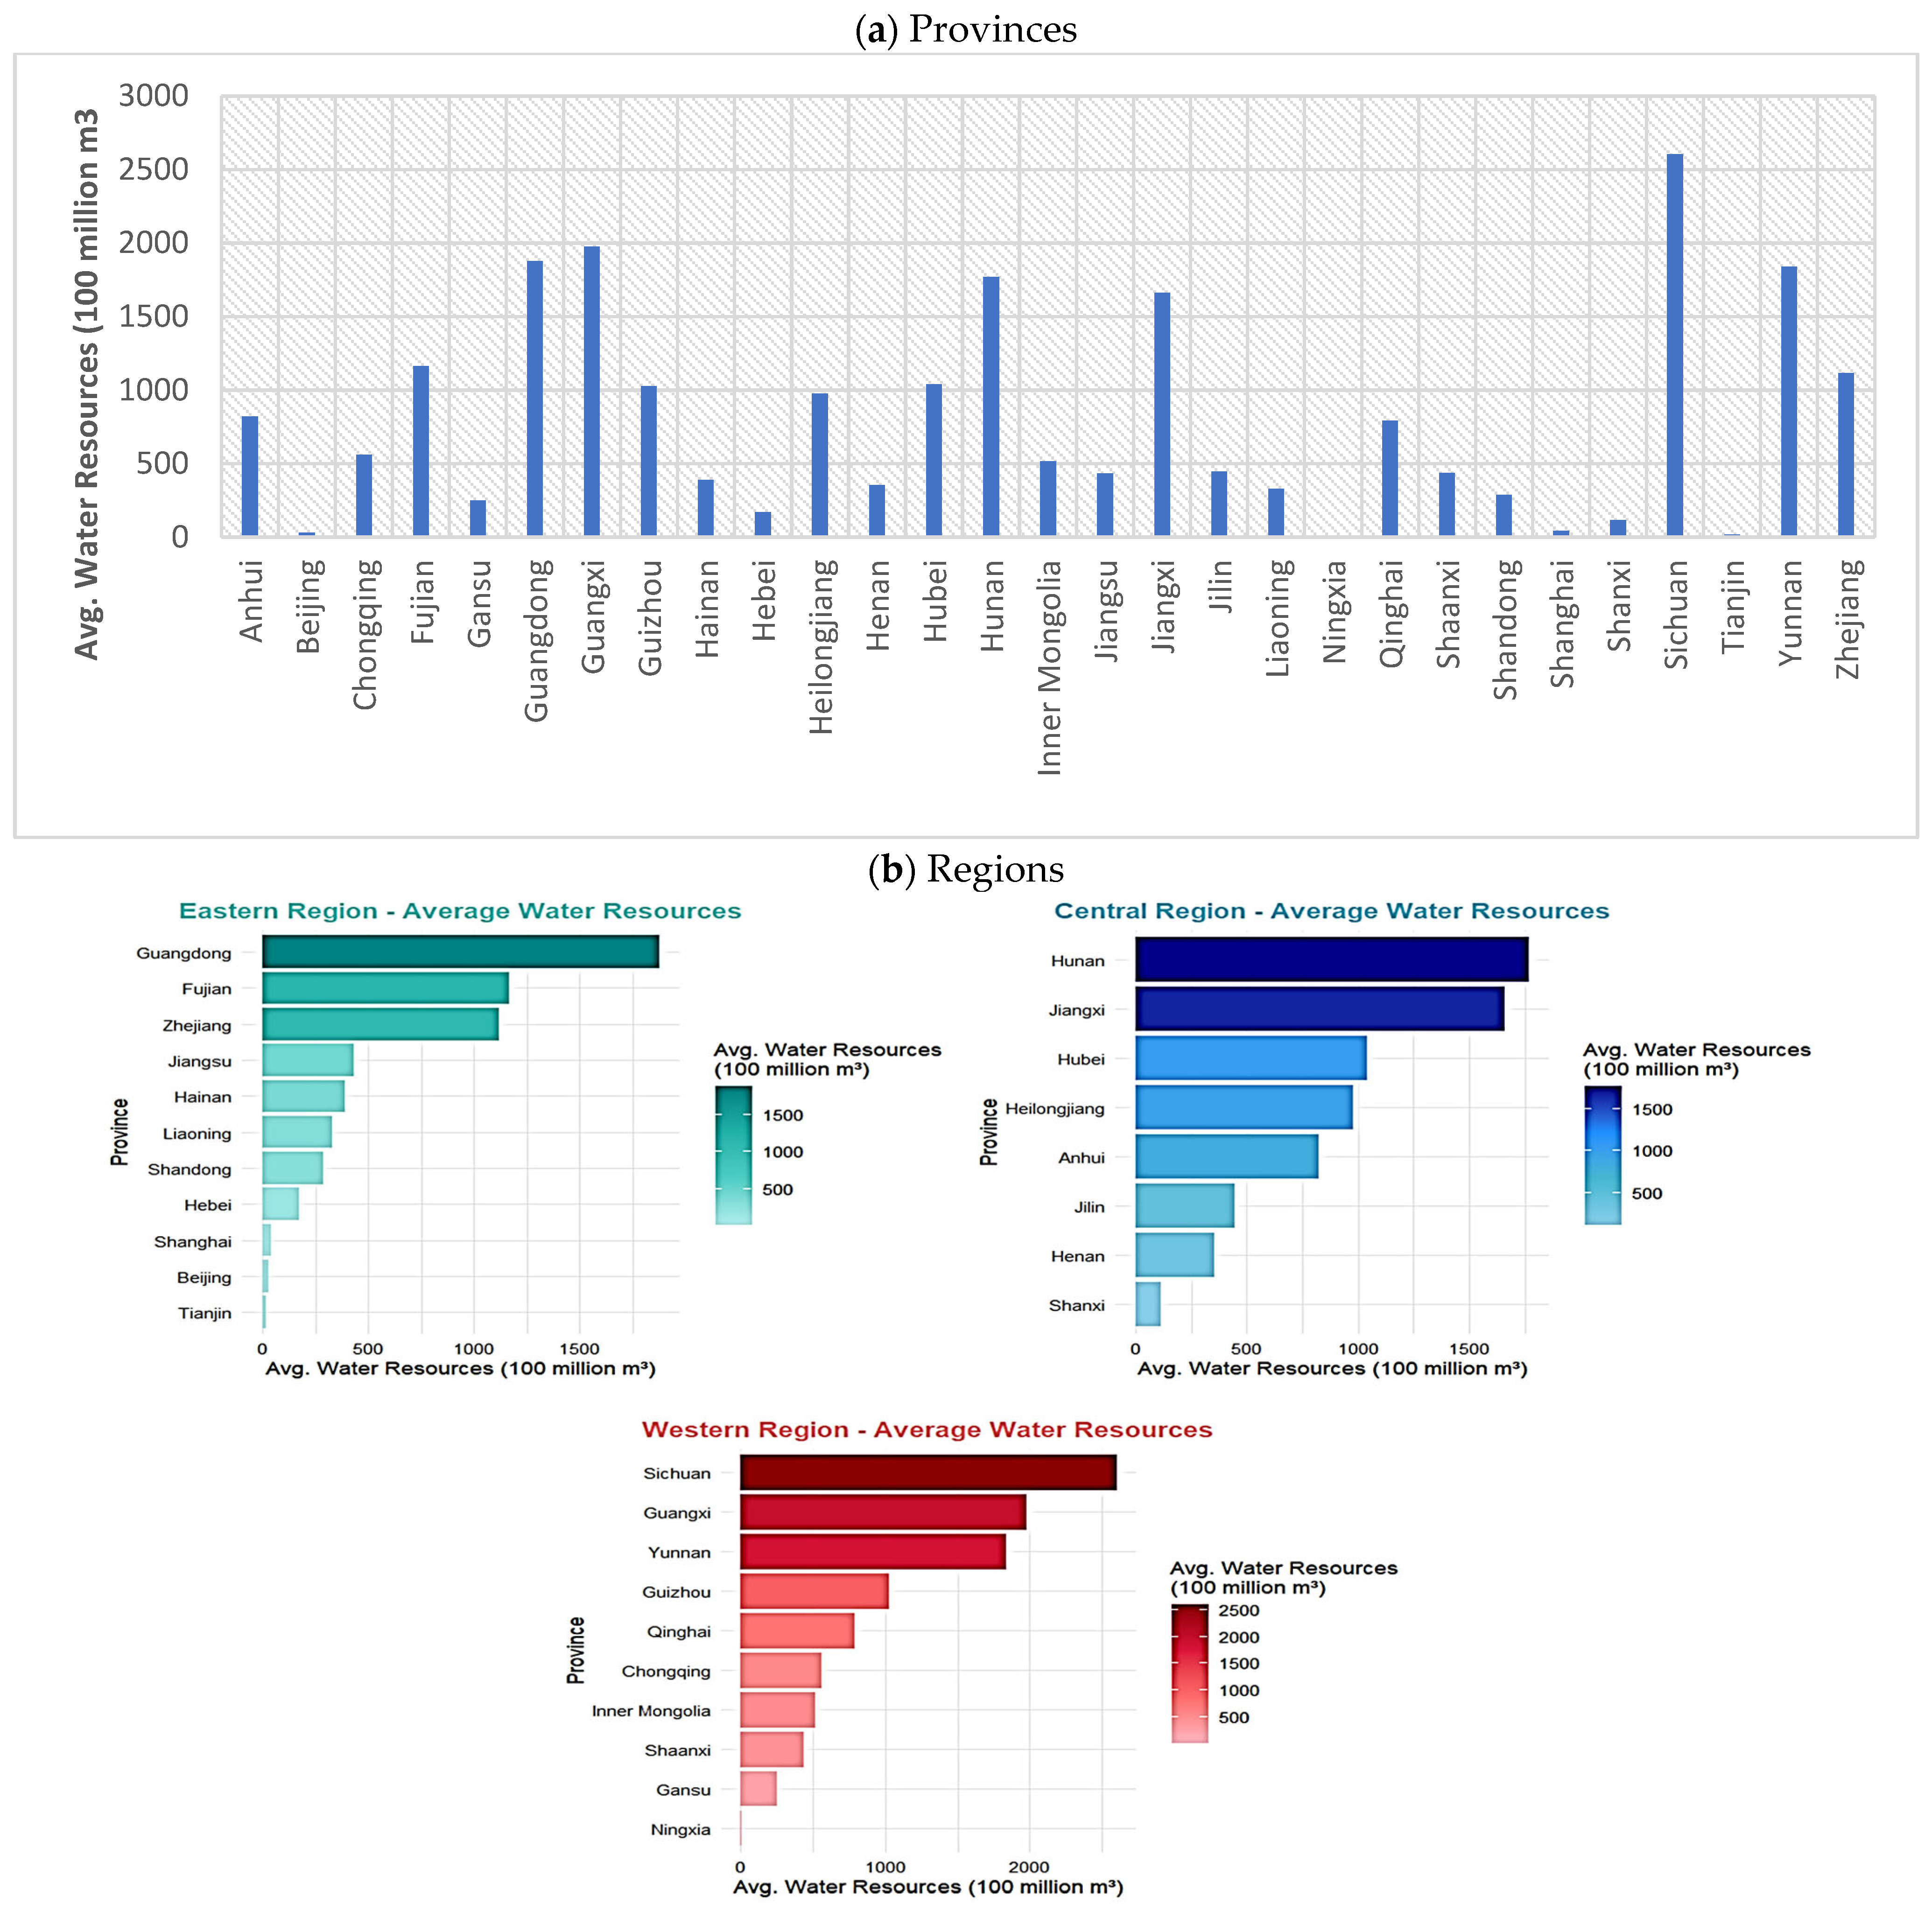
China is also grappling with a substantial challenge as the accessibility of water resources begins to restrict the country’s economic and social advancement [6]. China’s gross domestic product per water unit is considerably lower than the global average [7]. On a global scale, the average GDP per cubic meter of water is approximately USD 36, whereas in China, it is roughly USD 3.50 [8]. China thus needs more water to thrive economically. Increasing product production in China requires an increasing amount of water, yet these must be produced with fewer resources [9]. Furthermore, the differences in China’s water resources among provinces are another challenge. Figure 1a,b shows the average total water resources of China’s provinces and regions from 2008 to 2021. It shows that the provinces of Ningxia, Beijing, Shanghai, and Tianjin have the lowest amount of water resources (supply of water resources) (ranging from 10.37 to 43.12 m3). Meanwhile, the total water resources in ten provinces (Jilin, Shaanxi, Jiangsu, Hainan, Henan, Liaoning, Shandong, Gansu, Hebei, and Shanxi) are in the lower–middle range (116.67–446.69 m3). The total water resources in Heilongjiang, Xinjiang, Anhui, Qinghai, Chongqing, and Inner Mongolia possess range from 516.80 to 977.08 m3. The rest of the provinces; for instance, Guangxi and Sichuan have the highest total water resources (avg 1976.309m3 and 2603.495 m3, respectively). Figure 1b shows the average total water resources of China’s regions.
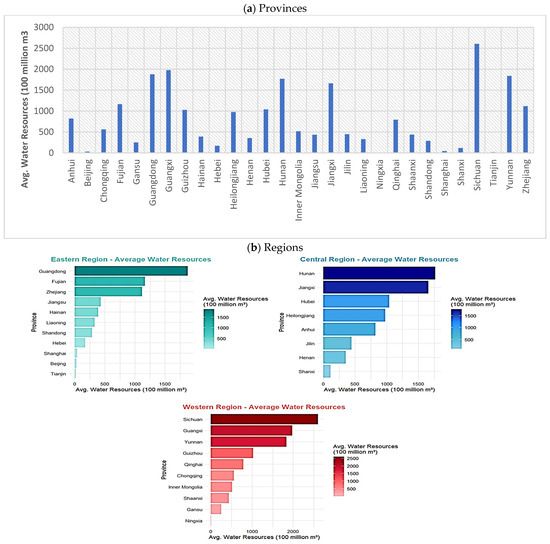
Figure 1.
Total water resources (average) of provinces and regions during the 2008–2021 period.
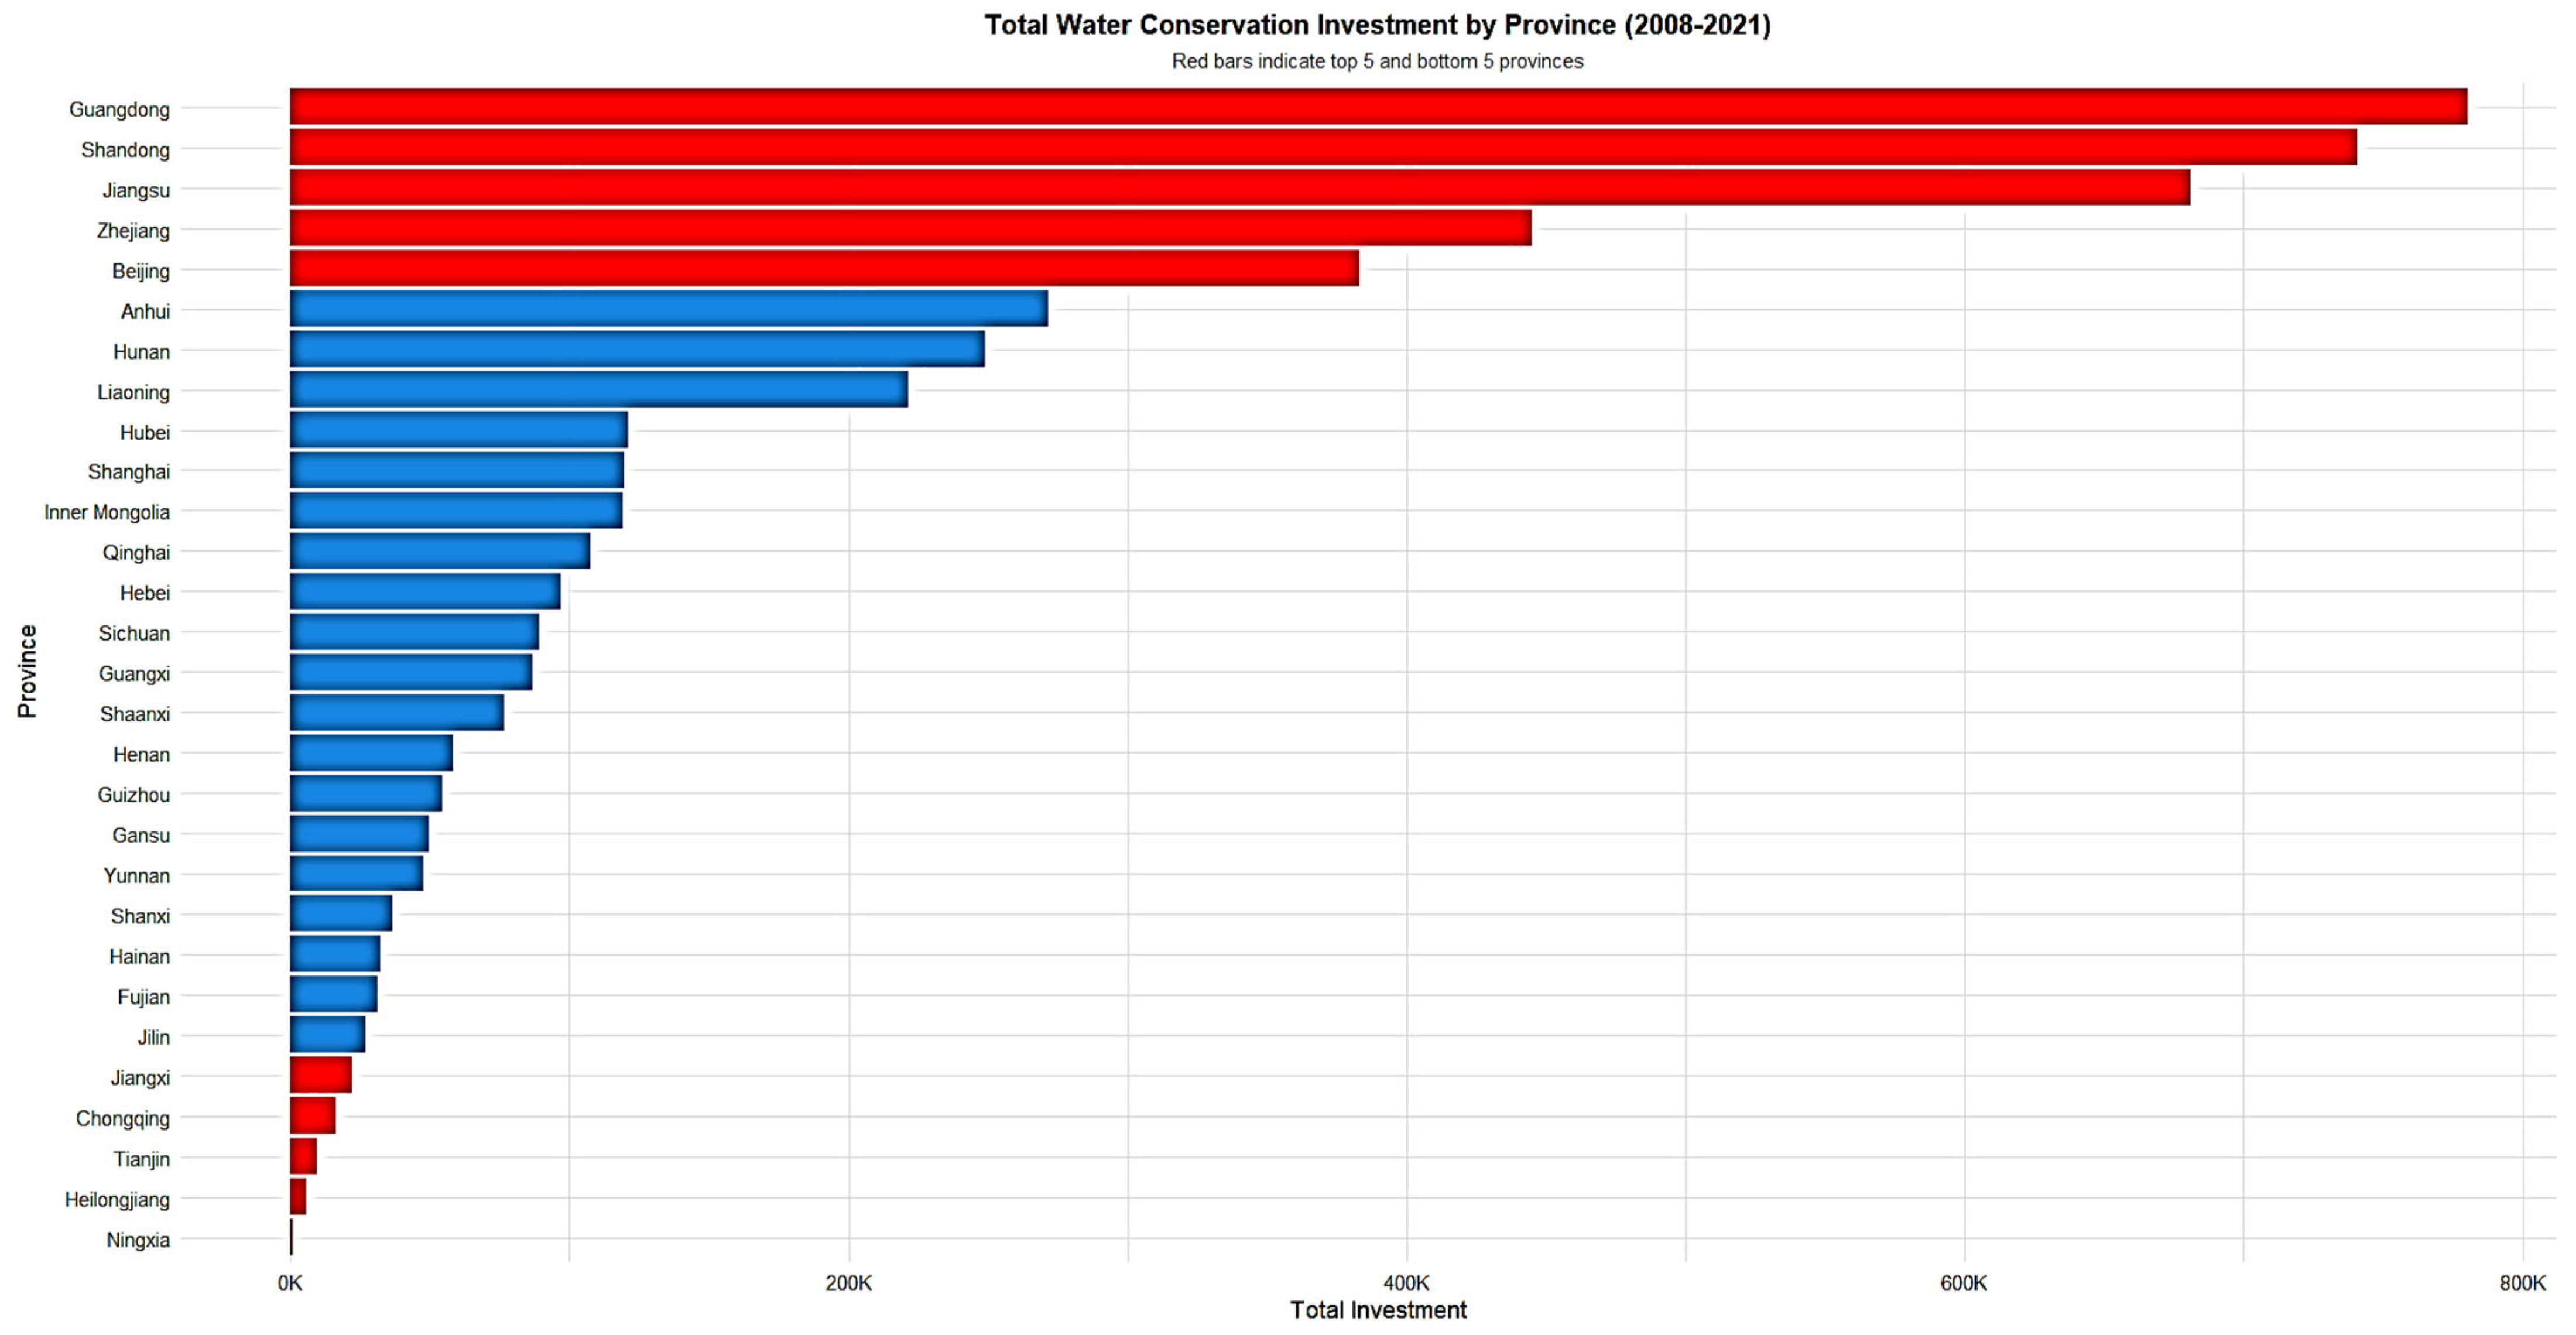
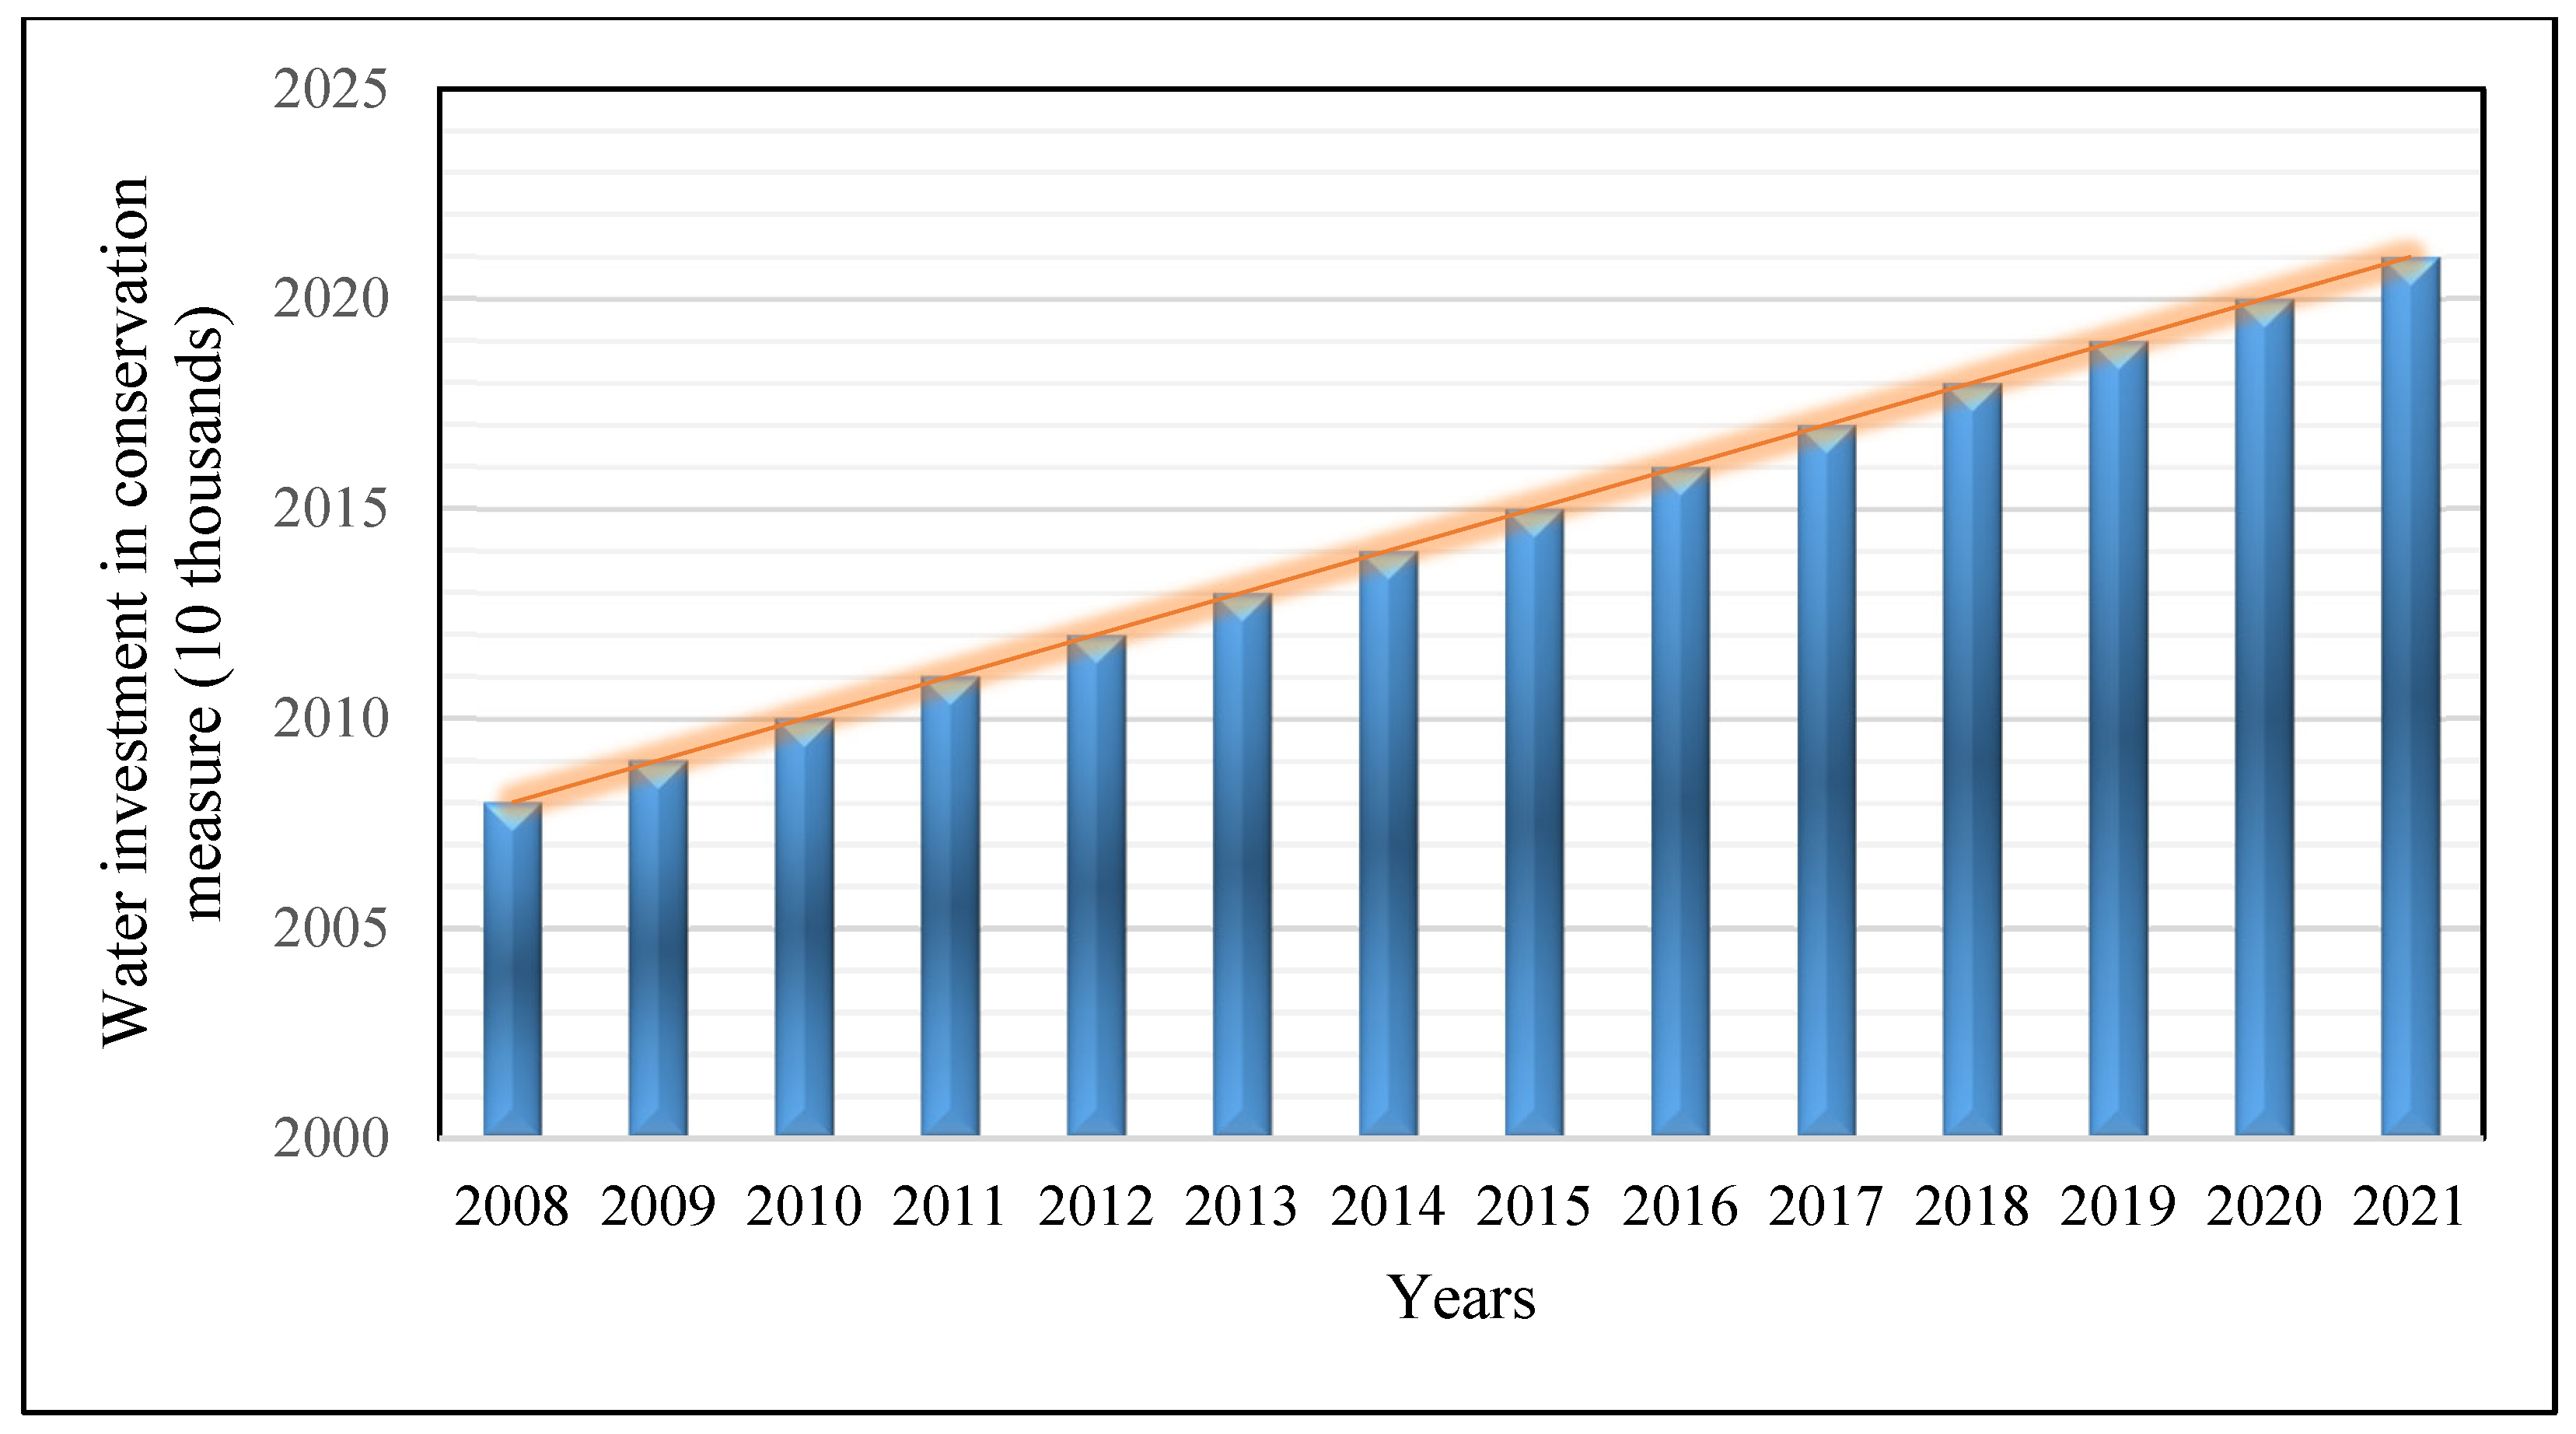
Tibet province is home to large glaciers, high-altitude lakes, and Asia’s major rivers, such as the Yangtze, Mekong, and Brahmaputra. The province’s glaciers and snowpacks supply freshwater to downstream China and neighboring countries [10]. Relatively scarce water resources characterize the central region of China compared to the Western and Eastern regions. As water demand rises, China must explore technological solutions to manage water resources and increase water usage efficiency, with water-conserving technologies such as sprinkler irrigation, water recycling, and reservoirs being the most promising options. Sprinkler irrigation systems have been designed to distribute water to crops effectively, hence reducing losses caused by evaporation and runoff [11,12]. This water-efficient approach in agriculture has the dual benefit of also enhancing agricultural yields. In the realm of water management, water recycling has emerged as a viable solution [13,14]. This procedure involves treating wastewater and reproducing it for non-potable uses such as industrial operations and landscape irrigation [15]. It alleviates the strain on freshwater resources, leading to water conservation and pollution reduction. Moreover, constructing reservoirs through damming rivers or streams allows water to be stored during seasons of high precipitation, guaranteeing a reliable and uninterrupted water supply, especially in areas characterized by seasonal variations in rainfall patterns. China is also developing technologies and investing in water conservation measures. However, Figure 2 shows the disparities in water investment across provinces. Guangdong, Shandong, and Jiangsu show higher investment ratios for water-saving measures than other provinces. Despite that, Figure 3 shows the investment in water conservation increased from 2008 to 2021.
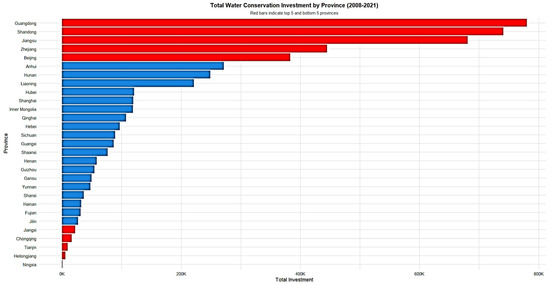
Figure 2.
Investment in water conservation across provinces over the years (2008–2021). The measurement unit is total investment in water-conservation measures (10 thousand).
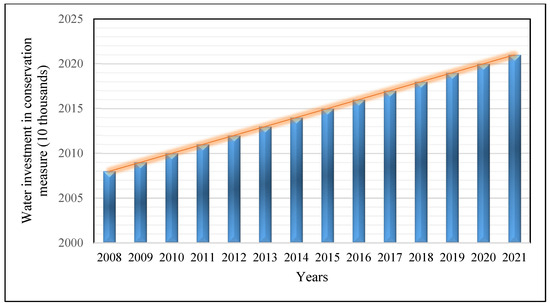
Figure 3.
Investment in water conservation across Chinese provinces by year (2008–2021). The measurement unit is total investment in water-conservation measures (10 thousand).
However, while traditional water conservation methods have made progress, integrating digital technologies into water management systems presents new opportunities. The combination of digital economy principles with smart water conservation technologies offers a promising approach to promote more effective and sustainable water management. Combining digital solutions into water management practices makes it possible to create intelligent water systems that monitor and respond to changing conditions in real time. Furthermore, the digital economy can establish enhanced water management infrastructure, wastewater treatment, and irrigation systems with improved efficiency [16,17]. Water usage can also be revolutionized through digital technologies, including the Internet of Things (IoT), e-commerce, artificial intelligence, sensors, and smart water management machinery [18,19]. The implementation of a digital network for distribution enables water utilities to enhance operational efficiency and mitigate water loss, thereby safeguarding this valuable resource [20].
Internet technology and data-driven methods can improve water management, reduce waste, improve water quality, and help water utilities and organizations to make better decisions [21,22]. These technologies assist in addressing water scarcity and sustainability issues in a changing world [23]. In addition, the digital economy facilitates the implementation of predictive maintenance, leak detection, and real-time data sharing throughout numerous sectors.
This study aims to evaluate the potential of integrating the digital economy and advanced water conservation technologies to enhance China’s water resource management. By examining the synergistic effects of these factors, the study contributes to understanding how digital tools and conservation technologies can optimize water usage in the face of 21st-century challenges. This research contributes to the literature in several key ways. First, it assesses the impact of core digital economy parameters—such as mobile access, internet broadband, internet usage, and telecom businesses—on China’s water resource consumption. Second, we calculate the digital economy index using Principal Component Analysis (PCA) to comprehensively measure its influence on water consumption. Third, the effect of water conservation technologies—such as sprinkler irrigation, wastewater recycling, and reservoirs—on water usage is evaluated. We also develop a conservation technology index to assess their overall impact on water resources. Fourth, we explore the moderating role of the digital economy in enhancing the effectiveness of water conservation technologies. Fifth, we examine how investments in water conservation measures can steer these technologies for better management of water resources. Finally, we control for key influencing factors, including education, economic growth, and population, to ensure robust and reliable results.
2. Literature Review and Hypothesis Development
According to the World Economic Forum (2023), the inadequacy of water supply is expected to reach 40% worldwide by 2030. According to projections by the World Bank, the potential impact of water scarcity on GDP growth in certain countries might reach up to 11.5% by 2050. Therefore, researchers are exploring solutions in different directions. Here, we focus on two approaches from the literature.
2.1. Digital Economy, Water Resources Consumption
The first branch of the literature sheds light on the role of the digital economy in water resource management. Digital technologies can revolutionize water resource consumption patterns. For instance, Sivaiah et al. [24] used IoT for water monitoring. Their research showed that implementing a water monitoring system can reduce water wastage and decrease electricity use. Perumal et al. [25] noted that IoT technology has great potential to solve problems such as irrigation control at low cost. AlMetwally et al. [26] utilized the IoT to measure water quality factors such as PH, temperature, and turbidity for home applications.
The latter study stated that IoT is essential for monitoring and controlling water quality in real time. A smart meter (digital) controller that displays precise water usage and communicates directly with the water city network eliminates manual errors in measuring consumption. Since it optimizes water use, this could eliminate the need for human work. The purpose of this system is to prevent resource shortages due to uncertain consumption patterns [27]. Based on the previous literature, we can postulate the following hypothesis for the digital economy.
Hypothesis 1.
The development of the digital economy (including internet technologies) positively influences water resource utilization efficiency in China.
Hypothesis 1.1.
The integration of internet and mobile technologies enhances water resource utilization by facilitating seamless data collection, analysis, and decision-making.
Hypothesis 1.2.
The use of tele business and smart building technologies improves water resource utilization by optimizing the control of water-consuming systems and irrigation, thereby reducing water wastage.
2.2. Water Conservation Technologies and Water Resources Consumption
The second branch of the literature focuses on the use of conservative technologies to improve water usage efficiency. Qiao et al. [28] investigate the economic aspects of water technology within the water scarcity framework. The study’s findings indicate that water technologies positively impact gross domestic product (GDP) growth. Furthermore, advancements in water science and technology serve as the impetus for all water-related developments. For example, Yang et al. [29] examine the effects of advances in water technology on water conservation in China. Their study demonstrates that the impact of technical advancement differs among locations in China, with the industrial composition exerting a notable influence on the reduction in water usage. Qiao et al. [30] investigate the nexuses between water technology and sustainable development. They found that using water technology enhances the beneficial effect of water resources on economic development. The study posits that policy-driven measures can facilitate water technology development in water-scarce emerging nations in the short term; however, long-term advancements are primarily driven by changes in pricing. Similarly, some other studies use technology factors to evaluate water efficiency, resulting in technological progress (and technical efficiency) driving freshwater total factor productivity [31,32,33].
Molinos-Senante et al.’s [34] study on water usage in England shows an increase in productivity with technological improvement. Zou and Cong [35] developed a comprehensive assessment index system to assess the efficiency of water resource usage. Their findings indicate that technological advancements have improved efficiency, particularly in the eastern coastal region. However, the efficiency level in central and western China remains suboptimal. According to the study conducted by Liao and Ren [36], there exists a relationship between the level of technical advancement and resource utilization efficiency. Specifically, technological progress had a favorable effect on resource utilization efficiency when it fell below a certain threshold.
Conversely, when the level of technological progress exceeded this threshold, it negatively influenced resource utilization efficiency. In brief, technological advancement yields both positive and negative consequences. The study conducted by Yang et al. [29] assessed the impact of water technical progress in China, specifically focusing on the effects of scale and intensity. The study revealed that advancements in water technology play a significant role in promoting water conservation. However, it was observed that the impact of technological advances on water conservation varied across different locations in China. Based on this in-depth review of these studies, a discernible relationship can be established:
Hypothesis 2.
Water conservation technologies may enhance the water resource utilization in China and mitigate the water scarcity problem.
Hypothesis 2.1.
Recycling methods are effective in increasing water usage efficiency in China by facilitating the reuse of this finite resource.
Hypothesis 2.2.
The adoption of the sprinkler irrigation method minimizes water wastage water and increases water resource consumption efficiency in China.
Hypothesis 2.3.
Water reservoirs enable storage and regulated release, ensuring a consistent supply and efficient distribution of water resources in China and thus improving water consumption efficiency.
2.3. Moderating Effect—Knowledge Gaps
There is a lack of comprehensive research on the combined effect of the digital economy and water conservation technologies on water resource consumption. Firstly, we have not found extensive work on how internet and mobile access (digital economy) impacts water resource consumption and improves efficiency. Secondly, no study has evaluated the role of telecom business in water resource management. The existing literature deals with the impact of IoT and water sector conservation technology on water resource efficiency. However, no research has theoretically modeled the combined role of conservation technology and the digital economy (internet technology) to manage water resource consumption in China at a comprehensive level. Thus, our research fills essential gaps in the existing literature by analyzing various digital economy (mobile, internet, telecom business) and water conservation technology (recycling, sprinkler irrigation, water reservoirs) indicators. To this end, we develop the following hypothesis:
Hypothesis 3.
The synergy (moderating influence) of the digital economy and advanced water conservation technologies effectively improves water resource consumption in China.
Further, this study estimates the influence of investment in water conservation measures on water resource consumption, which provides a critical contribution to the literature. While previous studies have explored the impact of digital technologies on resource management, many have overlooked the regional heterogeneity in water consumption. Additionally, existing methods often do not account for the varying effects of digital economy interventions across different quantiles of water use.
3. Model Development and Methodology
The digitalization of water systems and its role in mitigating water sector challenges are now debated globally. In this regard, the United Nations held the first conference on “Water” in March 2023 (https://smartwatermagazine.com/news/smart-water-magazine/digital-transformation-water-sector-a-game-changer, accessed on 1 December 2024). According to discussions held at the conference, the digital transition of the water sector can play a key role in accelerating progress in safely managed water and sanitation. It has been suggested that adopting and integrating digital transformation and innovative technology is necessary. Internet and mobile are two important digital technologies for water processes, reducing waste and enabling real-time monitoring [37]. The utilization of sophisticated data analytics and machine learning methods enables the examination of extensive datasets to detect patterns and abnormalities, hence facilitating the enhancement of water utilization across diverse sectors [38]. The utilization of internet technology facilitates the attainment of up-to-date data about water consumption, quality, and the state of infrastructure, enabling the development of well-informed programs for water conservation. In addition to water conservation technologies such as sprinkler irrigation, reservoirs, and recycling can optimize water usage in agriculture, urban areas, and industry [39]. Through these technologies, China can minimize water wastage and ensure the sustained availability of clean water supplies in the long run [40].
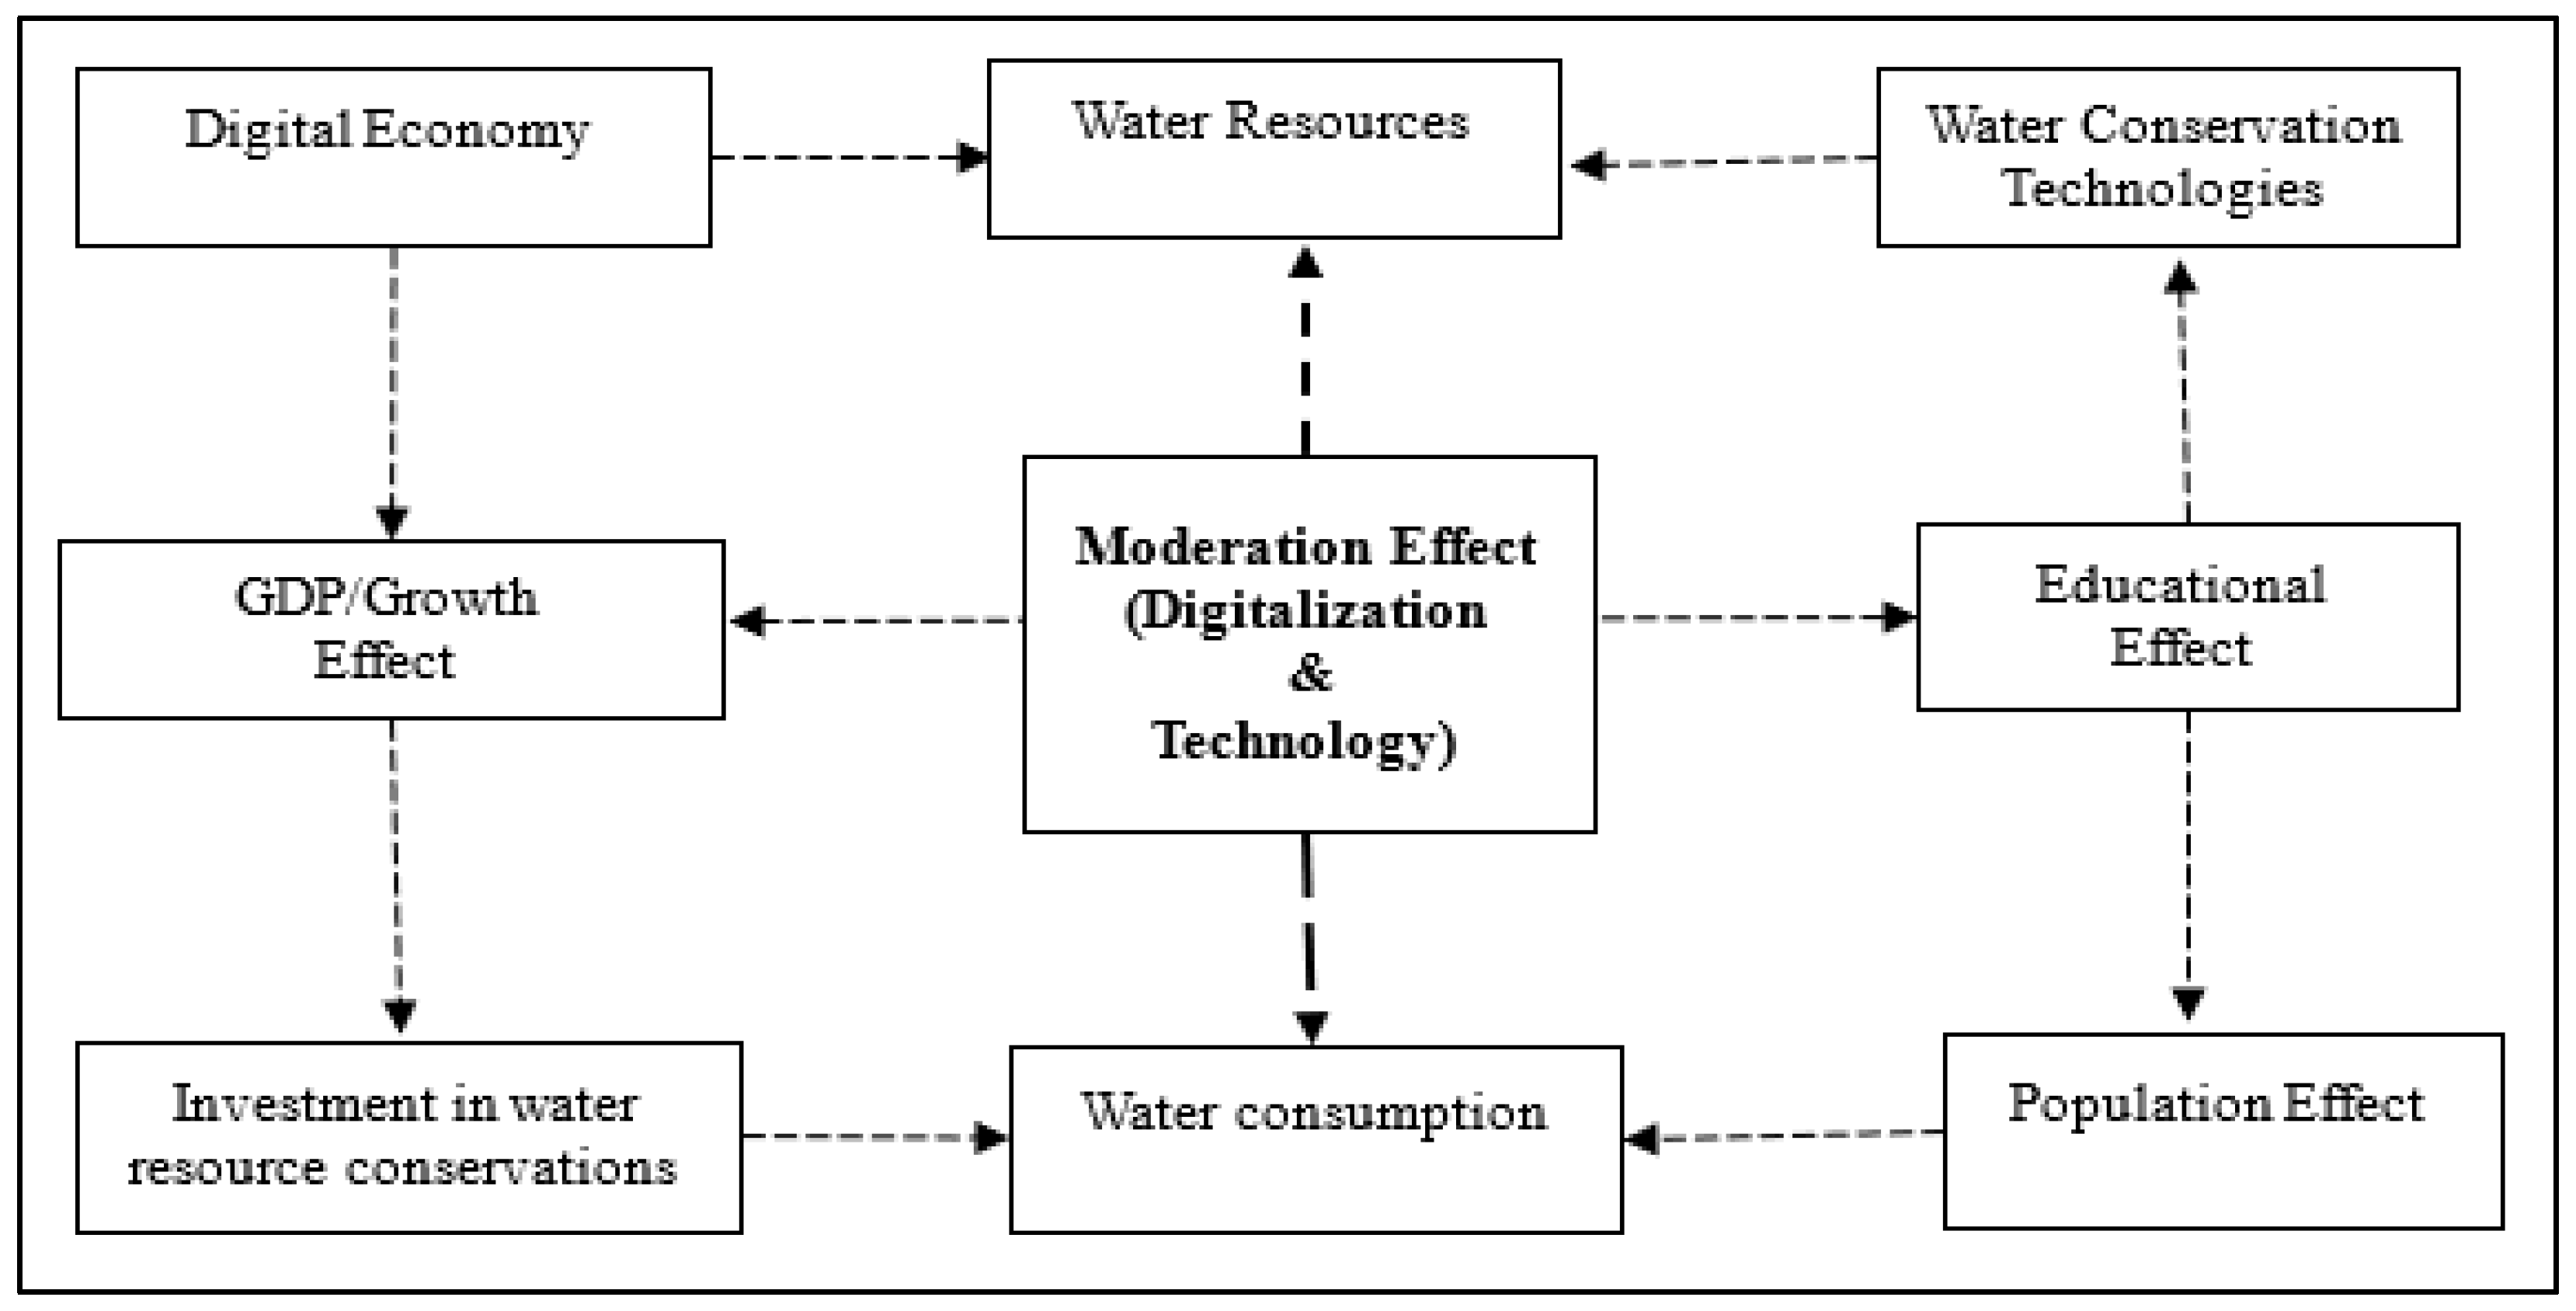
Therefore, including digital economy and conservation technology is important to improve water resource consumption efficiency. In addition, we include the interaction effect (moderation) of the digital economy with water conservation technologies on water consumption to highlight the need for digital infrastructure development to enhance the potential of water conservation efforts in China. Further, we incorporate investment in water conservation with control parameters, including water resources, GDP, higher education, and population, for a comprehensive assessment. A looped chain between the variables is presented in Figure 4.
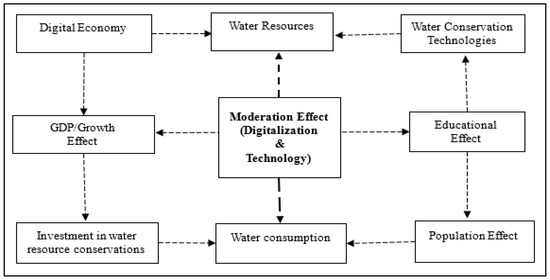
Figure 4.
The chain between the digital economy, water resources, conservation technologies, and water consumption. Note: This conceptual framework illustrates the moderating effect of the digital economy on water conservation technologies. The directional arrows represent the flow of influence between variables, with digital technologies acting as a moderator to enhance the effectiveness of conservation technologies.
Model Construction
Based on the theoretical argument, we add various parameters of the digital economy and water conservation technologies for game-changer evaluation assessments in water resource consumption. Furthermore, understanding the moderating impact of these two variables would be valuable in the literature. To strengthen the model, we assess the impact of economic growth, measured using income, on water consumption, population, investment, and higher education in the empirical formulation. We specify our baseline model in Equation (1).
In Equation (1), is used to assess water resource consumption, and signifies water resources. Areas with abundant water resources typically exhibit greater per capita water consumption due to the ready availability of water for many purposes. On the contrary, areas characterized by restricted water resources necessitate a more meticulous approach to water management, resulting in diminished per capita water availability. So, the expected impact is positive in this domain . (mobile, internet user, internet access, and telecom business) represents the digital economy index. We apply Principal Component Analysis (PCA) to develop the DGE index (see Table A3). A digital economy may increase water resource consumption efficiency. However, mismanagement can reduce its efficiency and create a negative effect. Therefore, either negative or positive impacts can be expected in the study, i.e., .
denotes water conservation technologies (water sprinklers, water recycling, and water reservoirs). Due to differences in water conservation technologies across regions, the bearing effect can be either positive or negative, i.e., . signifies the investment in water conservation measures. Regions with a more robust economy can allocate more funds for water-saving technologies. Consequently, these technologies can directly impact and preserve water resource consumption. However, as water resources are saved, it may increase consumption. So, the possibility of an expected impact can be positive or negative, i.e., . stands for gross domestic product per capita (GDP). A rising GDP often results in heightened investment in technology. Further economic growth enables the allocation of additional resources towards advancing research and development and the deployment of water-conservation technology. However, increasing economic activity can place increased pressure on the economy due to greater water consumption. So, the impact of GDP can be either positive or negative for water resource consumption . Meanwhile, a higher education () level may positively influence water consumption patterns. The influence can be encouraging in the context of water resource consumption, . The relationship between higher education and water consumption can be either positive, driven by increased income and urbanization, or negative, through enhanced environmental awareness and adoption of water-saving practices.
However, water use in households, farms, factories, and municipalities rises in tandem with the population ). The total amount of water used increases as more people need it for drinking, cooking, sanitation, and other daily activities. The expected impact can be negative for water consumption, .
Next, the model is extended to evaluate the moderating impact of the interaction between digital economy and water conservation technologies on water resource consumption, as follows:
where is the moderating impact of the digital economy () and water resources () on water consumption. As expected, the digital economy facilitates and promotes water conservation technologies and preserves water resources, .
In this equation, we assess the combined effect of the digital economy and water technology on China’s water resource consumption.
Further, we extend the above equation to include the influence of the interaction with water resources.
where is the interaction impact of the digital economy (), water conservation technologies , and water resources (. If the resources are well allocated and monitored properly, then the possible influence can be beneficial for improving the water system and thus its consumption, . The interaction of digital technologies, water conservation, and proper management is expected to improve water usage efficiency, which might slightly increase water consumption in sectors with higher efficiency.
4. Data and Methodology
4.1. Data
Table A1 provides a summary of the variables’ descriptions and sources. Data for the variables were collected from various sources for the period of 2008–2021. We selected 29 provinces of China due to data availability limitations (see Table A2). Tibet and Xinjiang have dropped in estimation due to data shortages for some variables. Table 1 summarizes the descriptive statistics of the variables under study. Missing or abnormal data were handled by imputation techniques for missing values and exclusion or correction of outliers to ensure the robustness of the analysis.

Table 1.
Descriptive statistics of the concerned variables.
4.2. Methodology
The selection of an appropriate approach is of utmost importance to obtain unbiased estimation results that can offer valuable knowledge about policies [41]. To initiate the estimation process, we employed various methodologies to examine the existence of cross-sectional dependence and slope heterogeneity in panel data. These methodologies include the cross-dependence approach introduced by Pesaran [42] and the scaled-LM approach developed by Pesaran [43]. Further, we applied the delta (Δ) and Δ-adjusted strategies proposed by Pesaran and Yamagata [44] to evaluate the presence of cross-sectional dependence and heterogeneity in the studied panel sample. Our study aimed to assess the stationarity of the variables under investigation. To address the issue of cross-sectional dependence, we utilized the second-generation cross-sectionally augmented (CIPS) panel unit test developed by Pesaran [45], also widely employed in recent scholarly investigations [46].
According to a study conducted by Binder and Coad [47], empirical data suggest that the conventional fixed effects (FEs) regression method primarily focuses on mean effects, which might potentially result in either an over- or underestimation of regression coefficients. Given that panel quantile regression is central to our investigation, we believe its findings will yield superior outcomes. The Method of Moments Quantile Regression (M-MQR) proposed by Machado and Silva [48] was used to estimate the combined impact of the digital economy and water conservation technologies on China’s water resource consumption. The M-MQR considers the conditional heterogeneity in covariance effects of the factors influencing water resource utilization efficiency. This is achieved by allowing the individual effects to impact the overall distribution. It addresses the challenges posed by structural breaks, economic changes, or heterogeneity, which have the potential to result in under- or overestimation of regression parameters. This strategy works well when individual effects are observed in the panel data model and endogenous regressors are also involved [49]. It is particularly suited for handling regional heterogeneity, such as variations in water consumption across diverse provinces, which traditional fixed/random effect or GMM models may struggle to capture. By accounting for individual impacts on the entire conditional distribution, M-MQR offers a more accurate estimation of the relationship between the digital economy and water resource utilization. The M-MQR method avoids complex calculations and unexpected conceptualization challenges when estimating the individual impacts, in contrast to the traditional quantile regression approaches [50].
Consequently, unlike prior quantile regression methods, M-MQR allows individual impacts to affect the conditional distribution of data as a whole rather than as location-shifting estimators. Further, the issue of endogenous variables in panel data is also addressed well by MQR [48]. The panel quantile estimate is presented in Equation (4).
The generalization of the median regression analysis to other quintiles is as follows:
The conditional quantile of a random variable can be stated as
where and show the regressand and regressor variables, while are parameters to be measured. The probability = 1. ( represents the discrete fixed effects. In regression, represents the k-vector of recognized modules of . The distinguishable alterations with j are as follows:
shows an unobserved random variable distributed across individuals and is orthogonal to , satisfying Machado and Silva’s (2019) [48] moment conditions. Thus, Equation (6) suggests the following;
In the equation, describes the quantile distribution of the regressands. capture the scalar coefficient [], and is the sample quantile is the k-vector.
The M-MQR version, which includes the relevant variables of the basic model, is stated as follows:
Moderator equations (moderation of digital economy and conservation technologies) are as follows:
The variables have been described earlier.
5. M-MQR Main-Findings
Empirical findings from the M-MQR method are described in Table 2. The quantile findings are emphasized for lower (10th), middle (50th), and higher (95th) quantiles of China’s water resource consumption. The M-MQR findings involve three main domains of the models. The first domain (Models 1–6) highlights the importance of the digital economy’s impact on water resource consumption. For that, this study used the four main internet technologies (mobile, internet users, internet access, and tele business) that represent economic digitalization. Model 1 shows that mobile technology reduces the total water resource consumption in China’s provinces. The reduction intensity, though lower, is highly significant throughout the quantiles.

Table 2.
M-MQR parametric estimation findings.
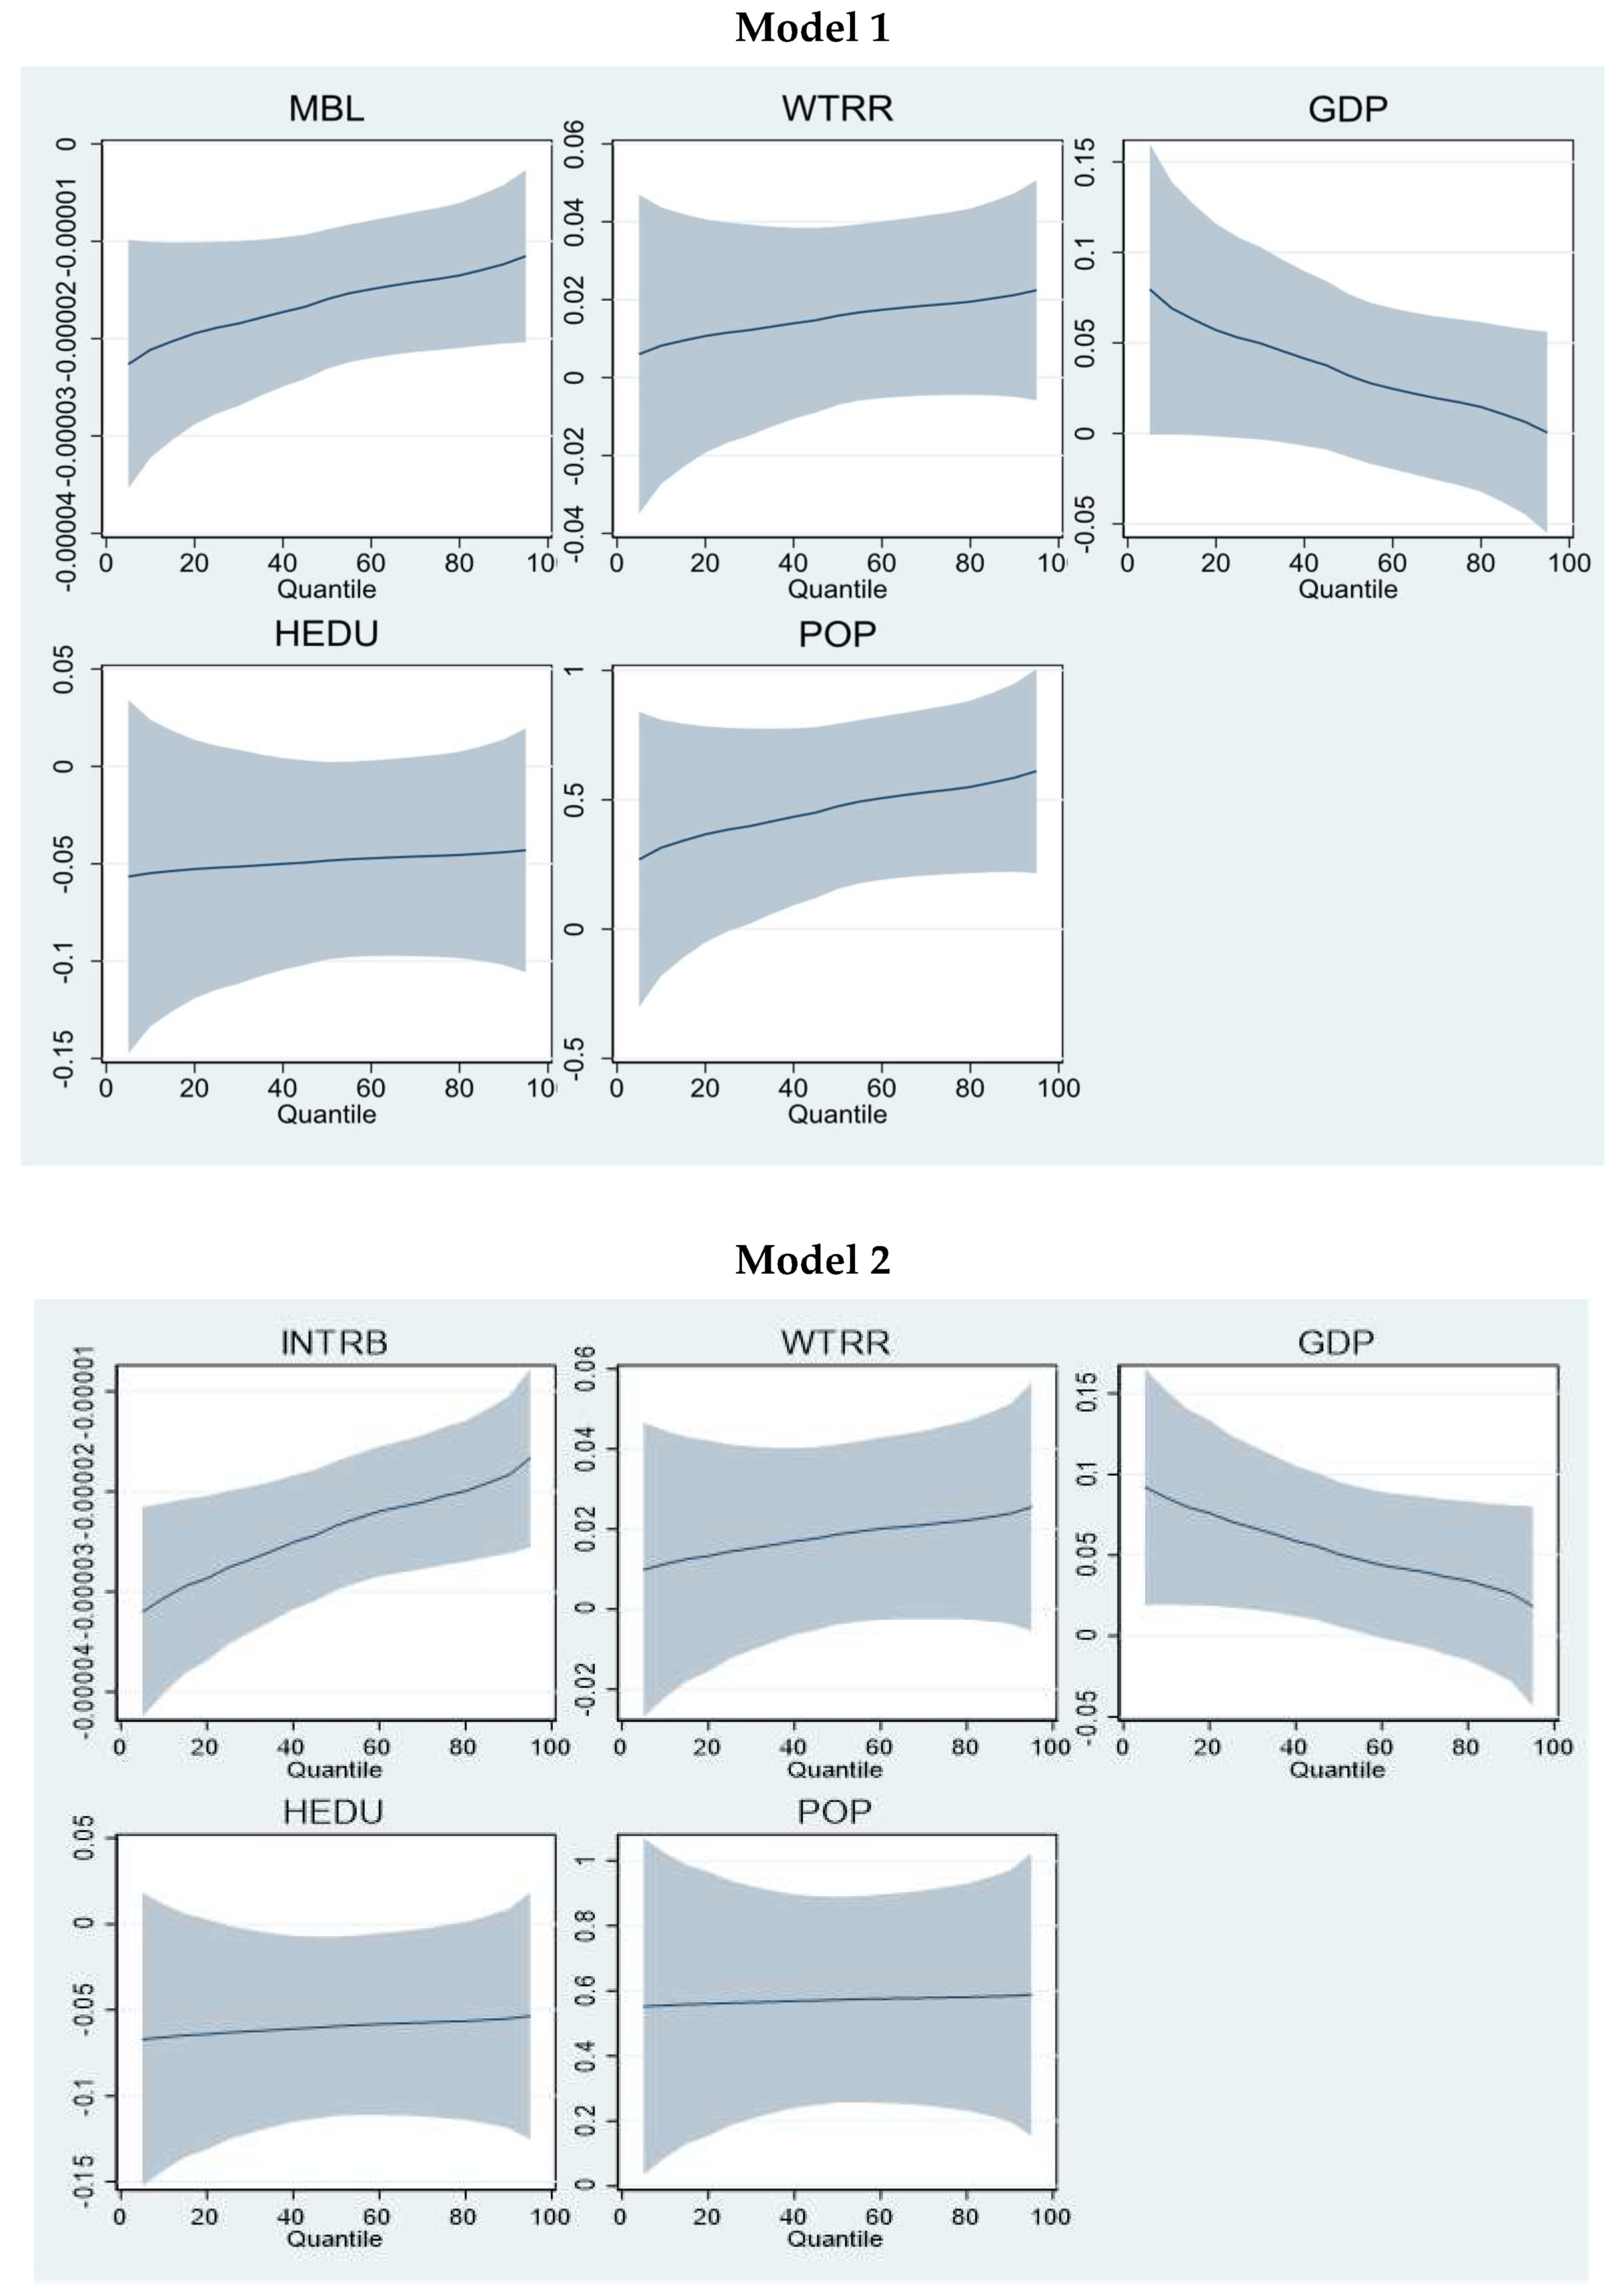
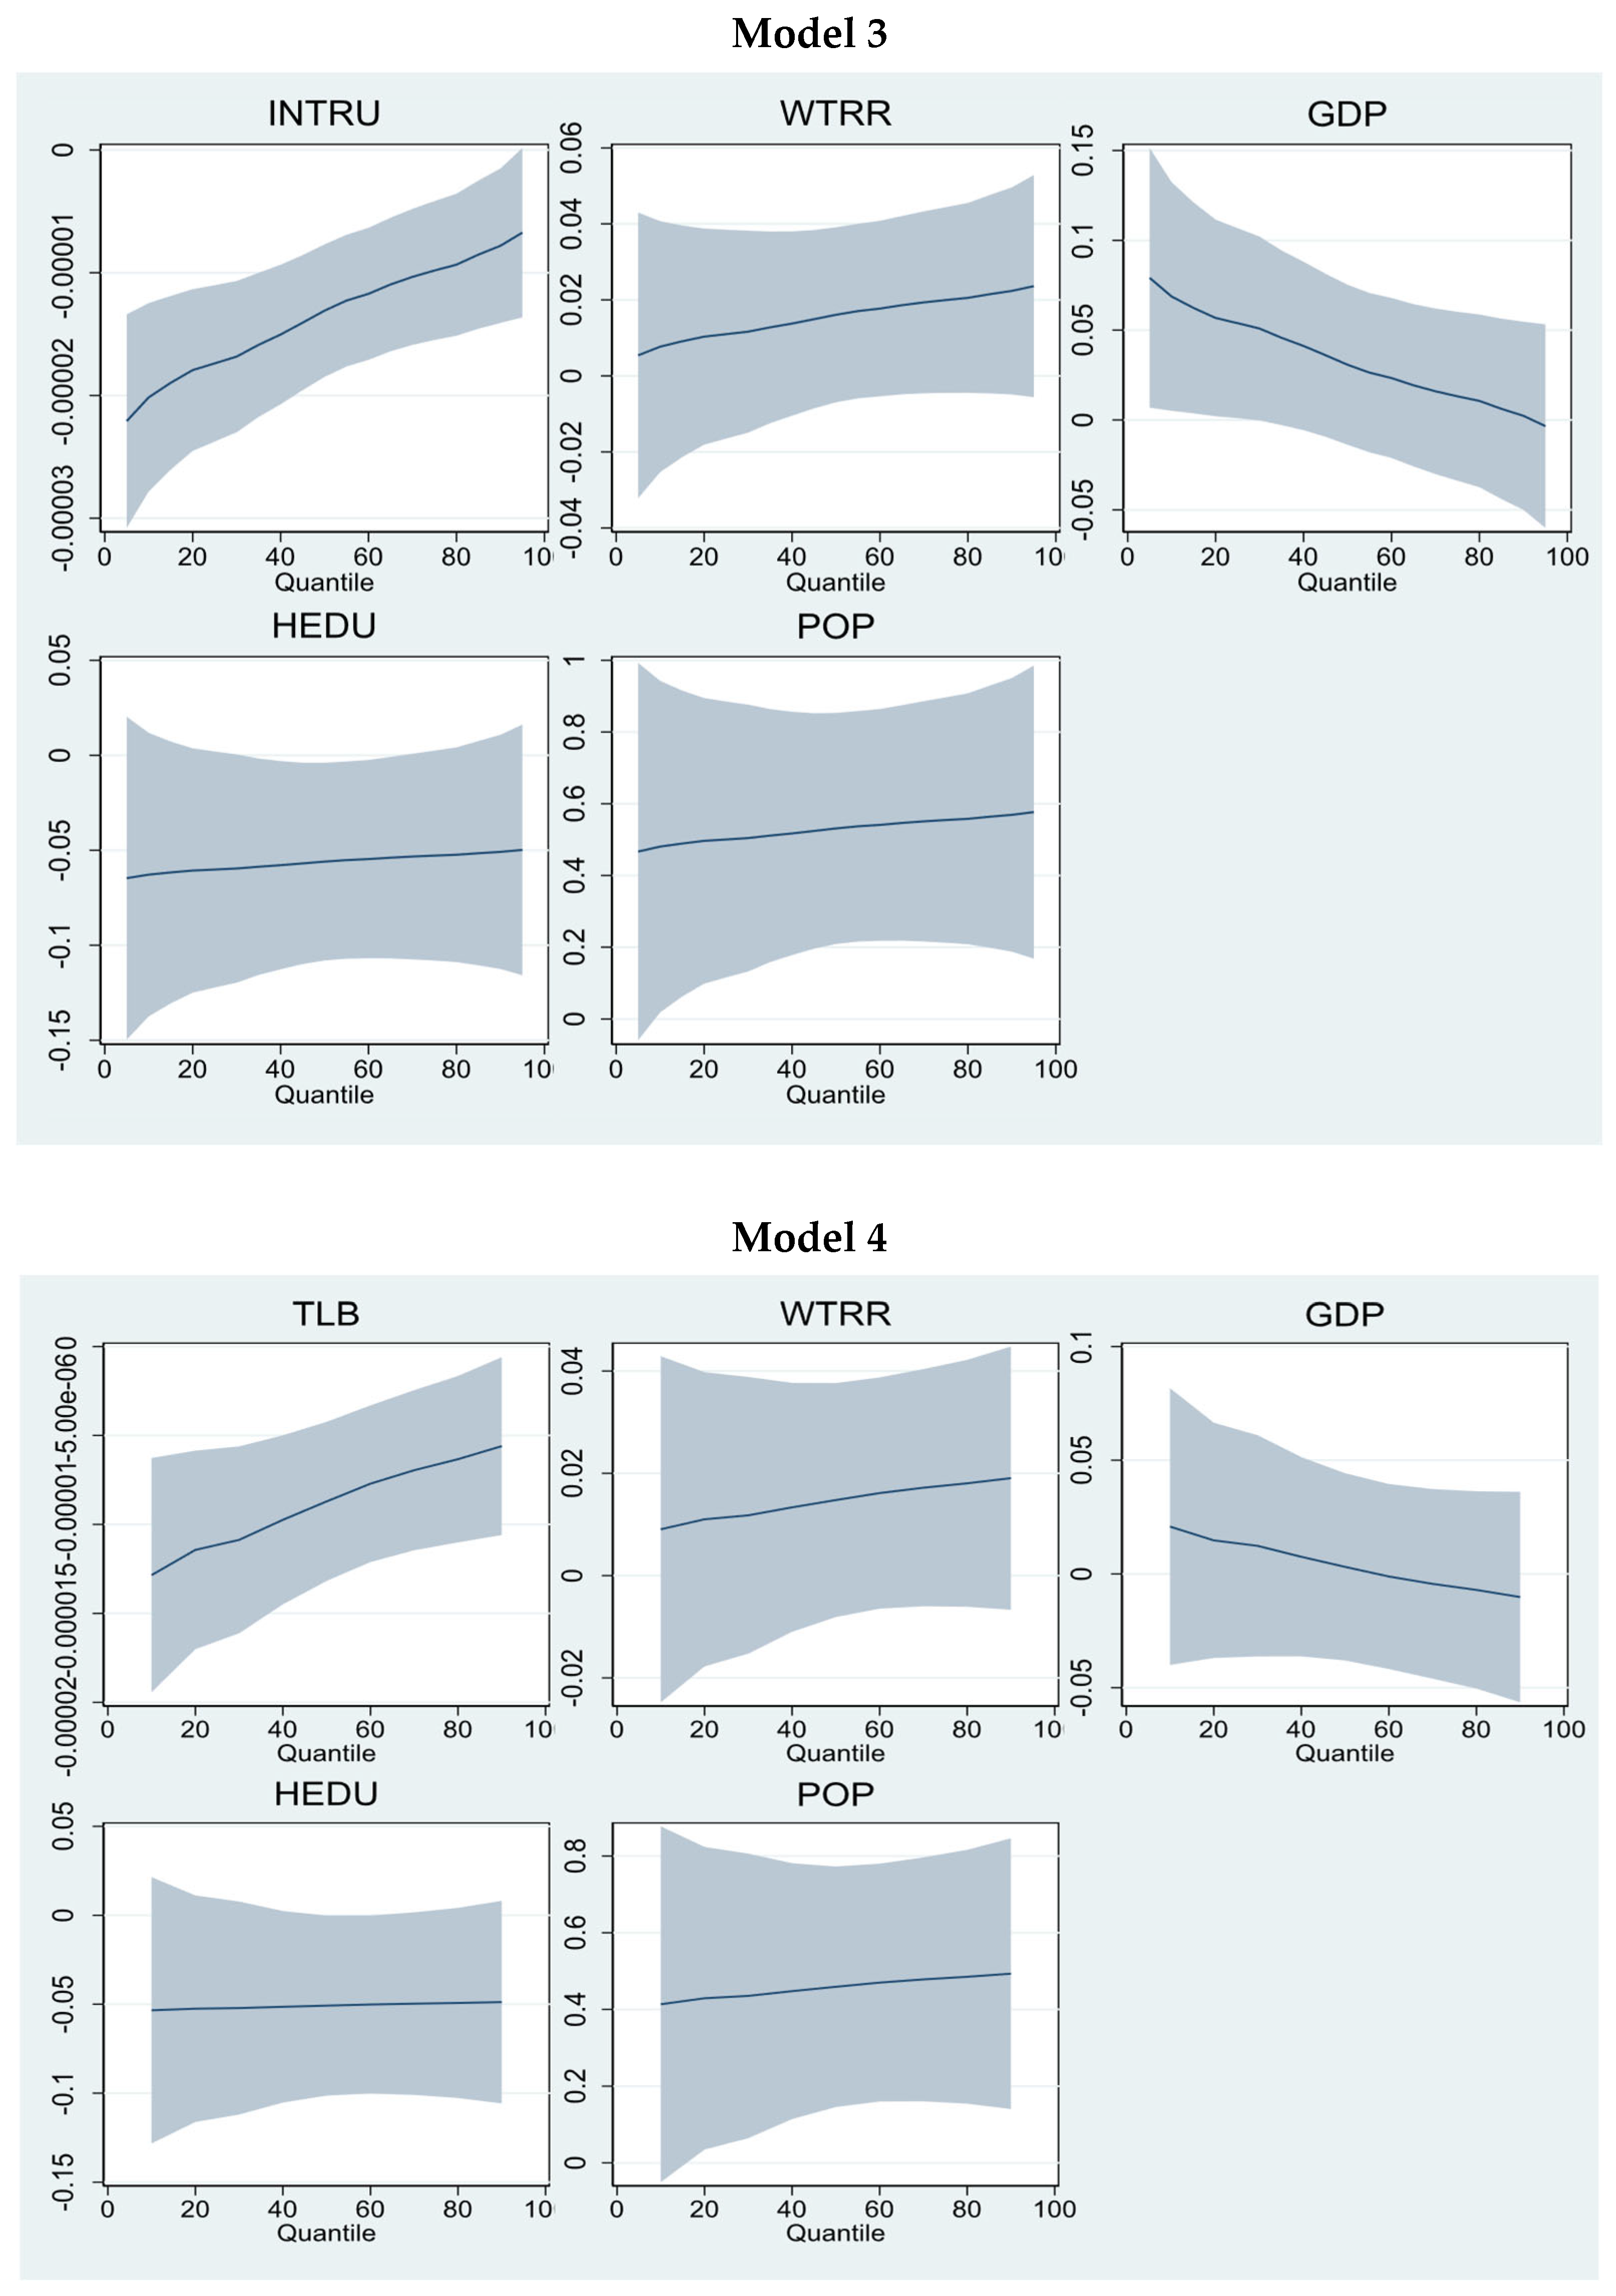
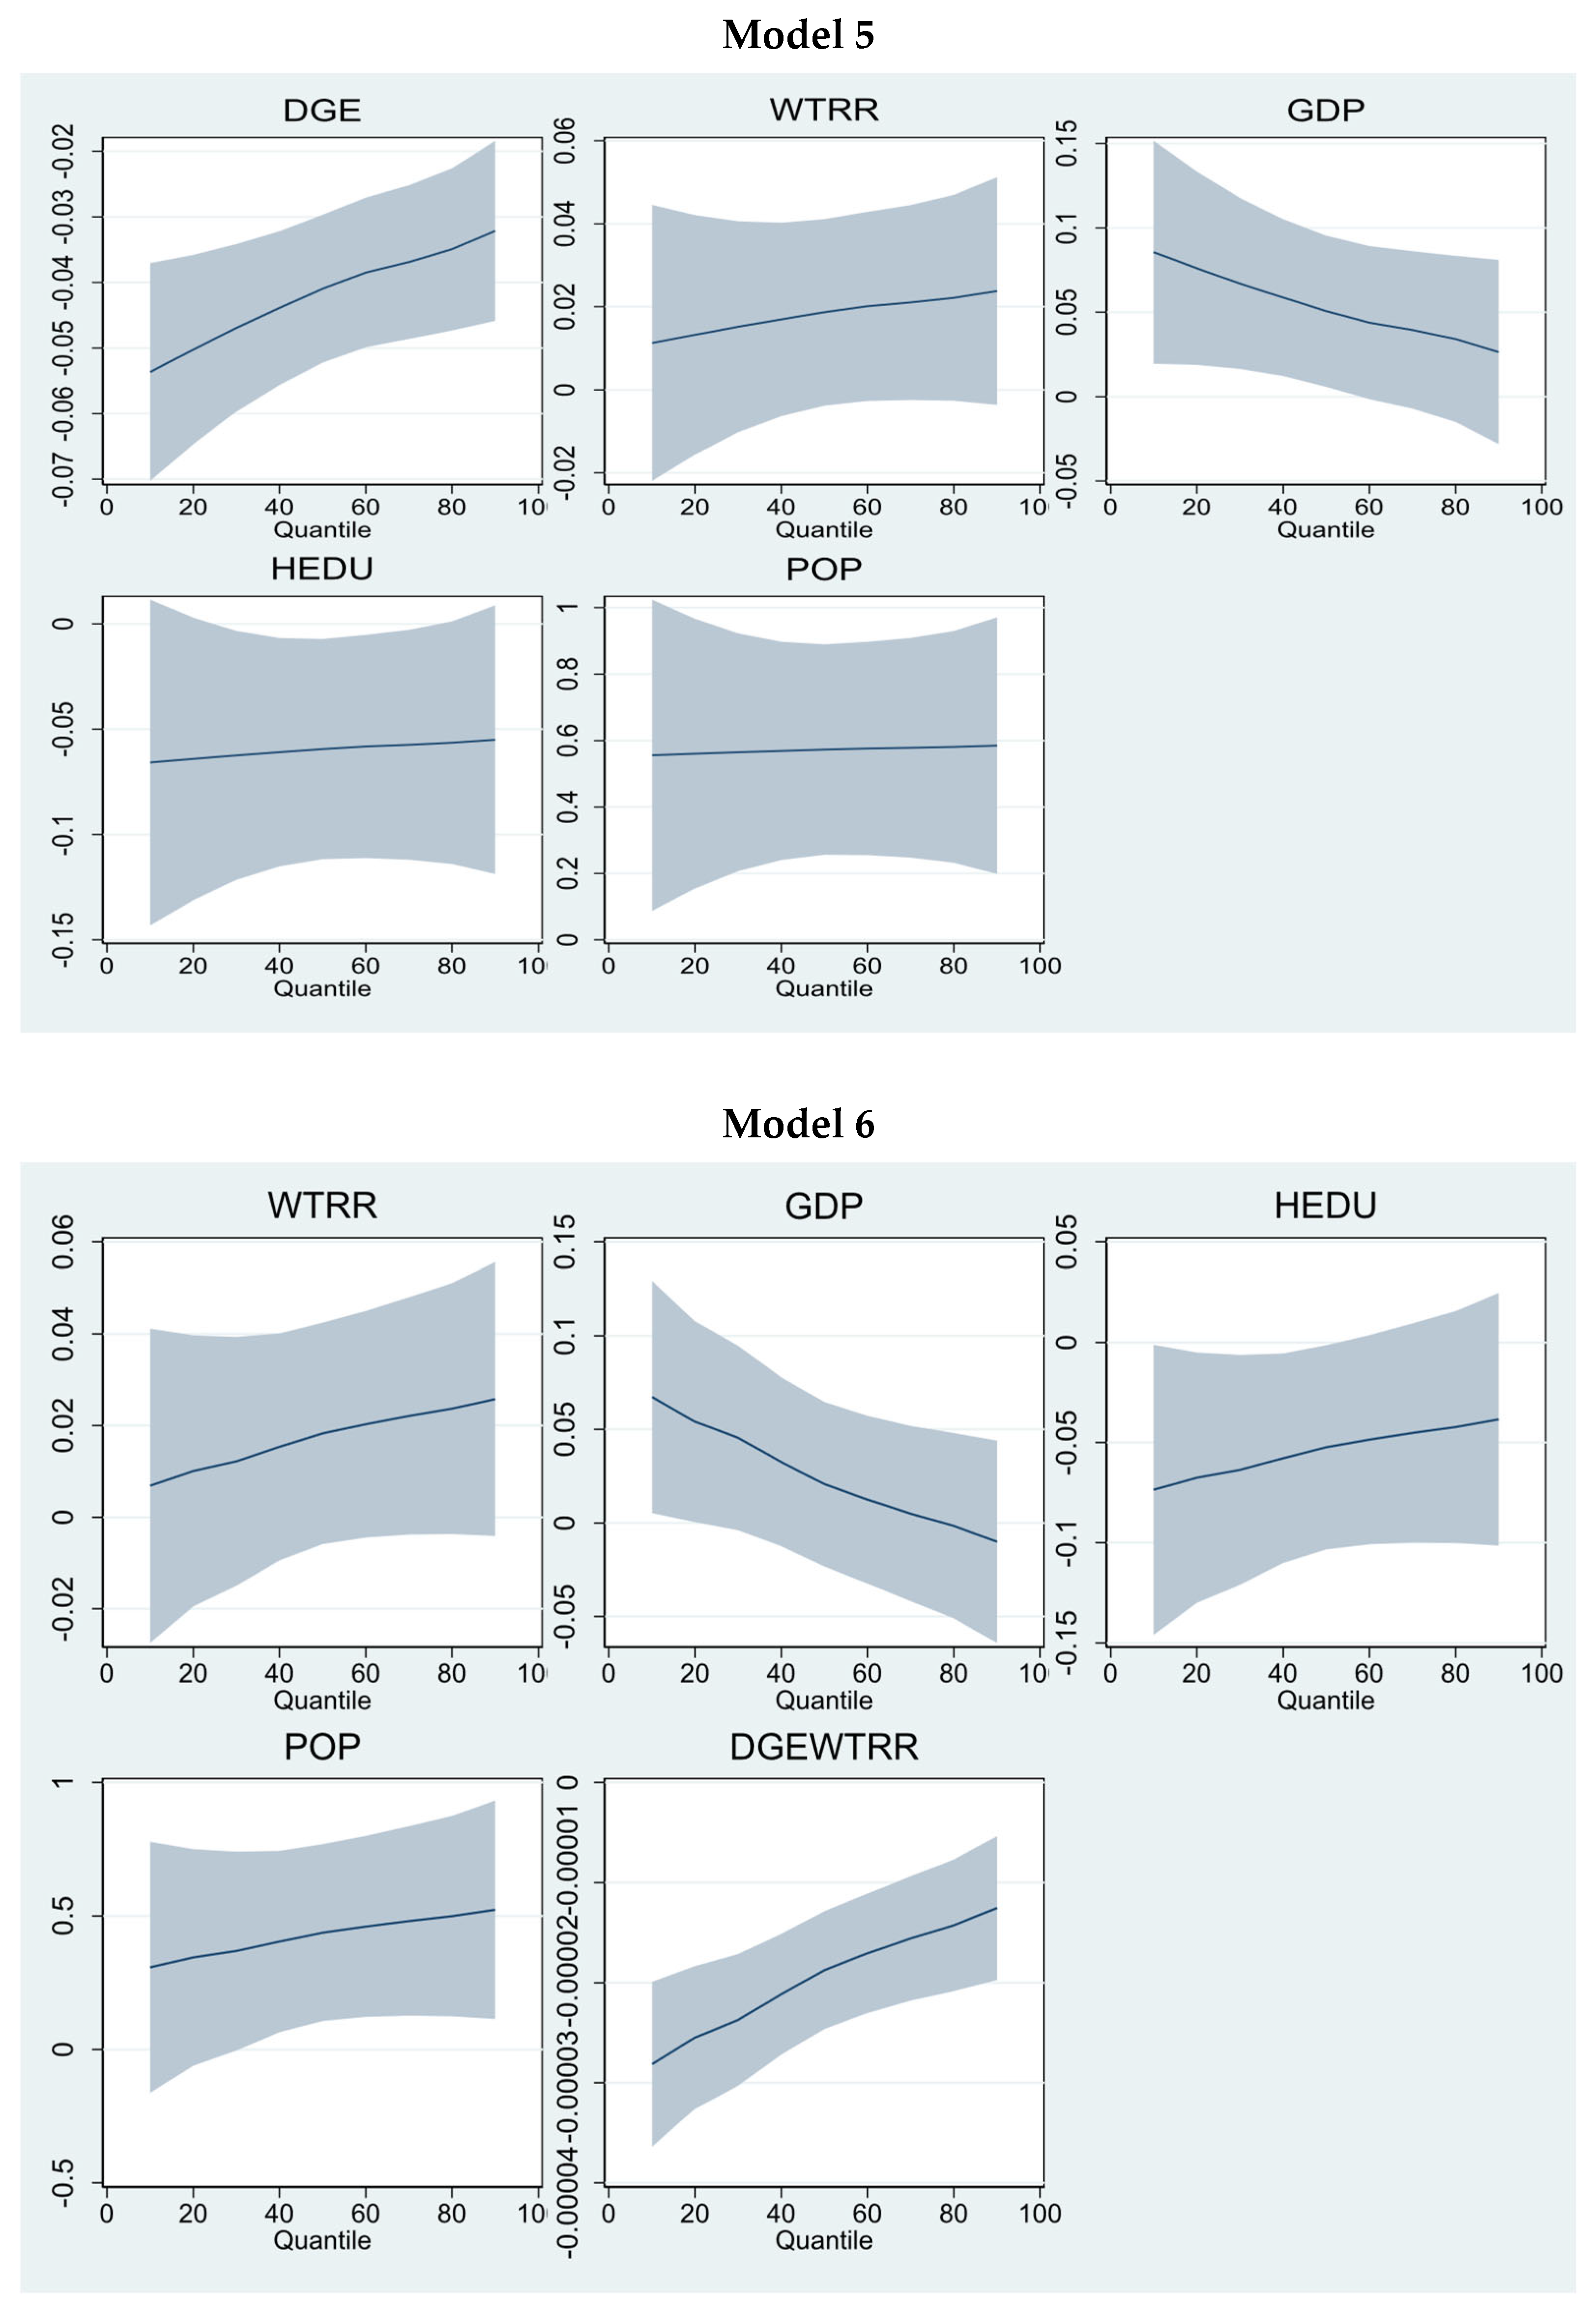
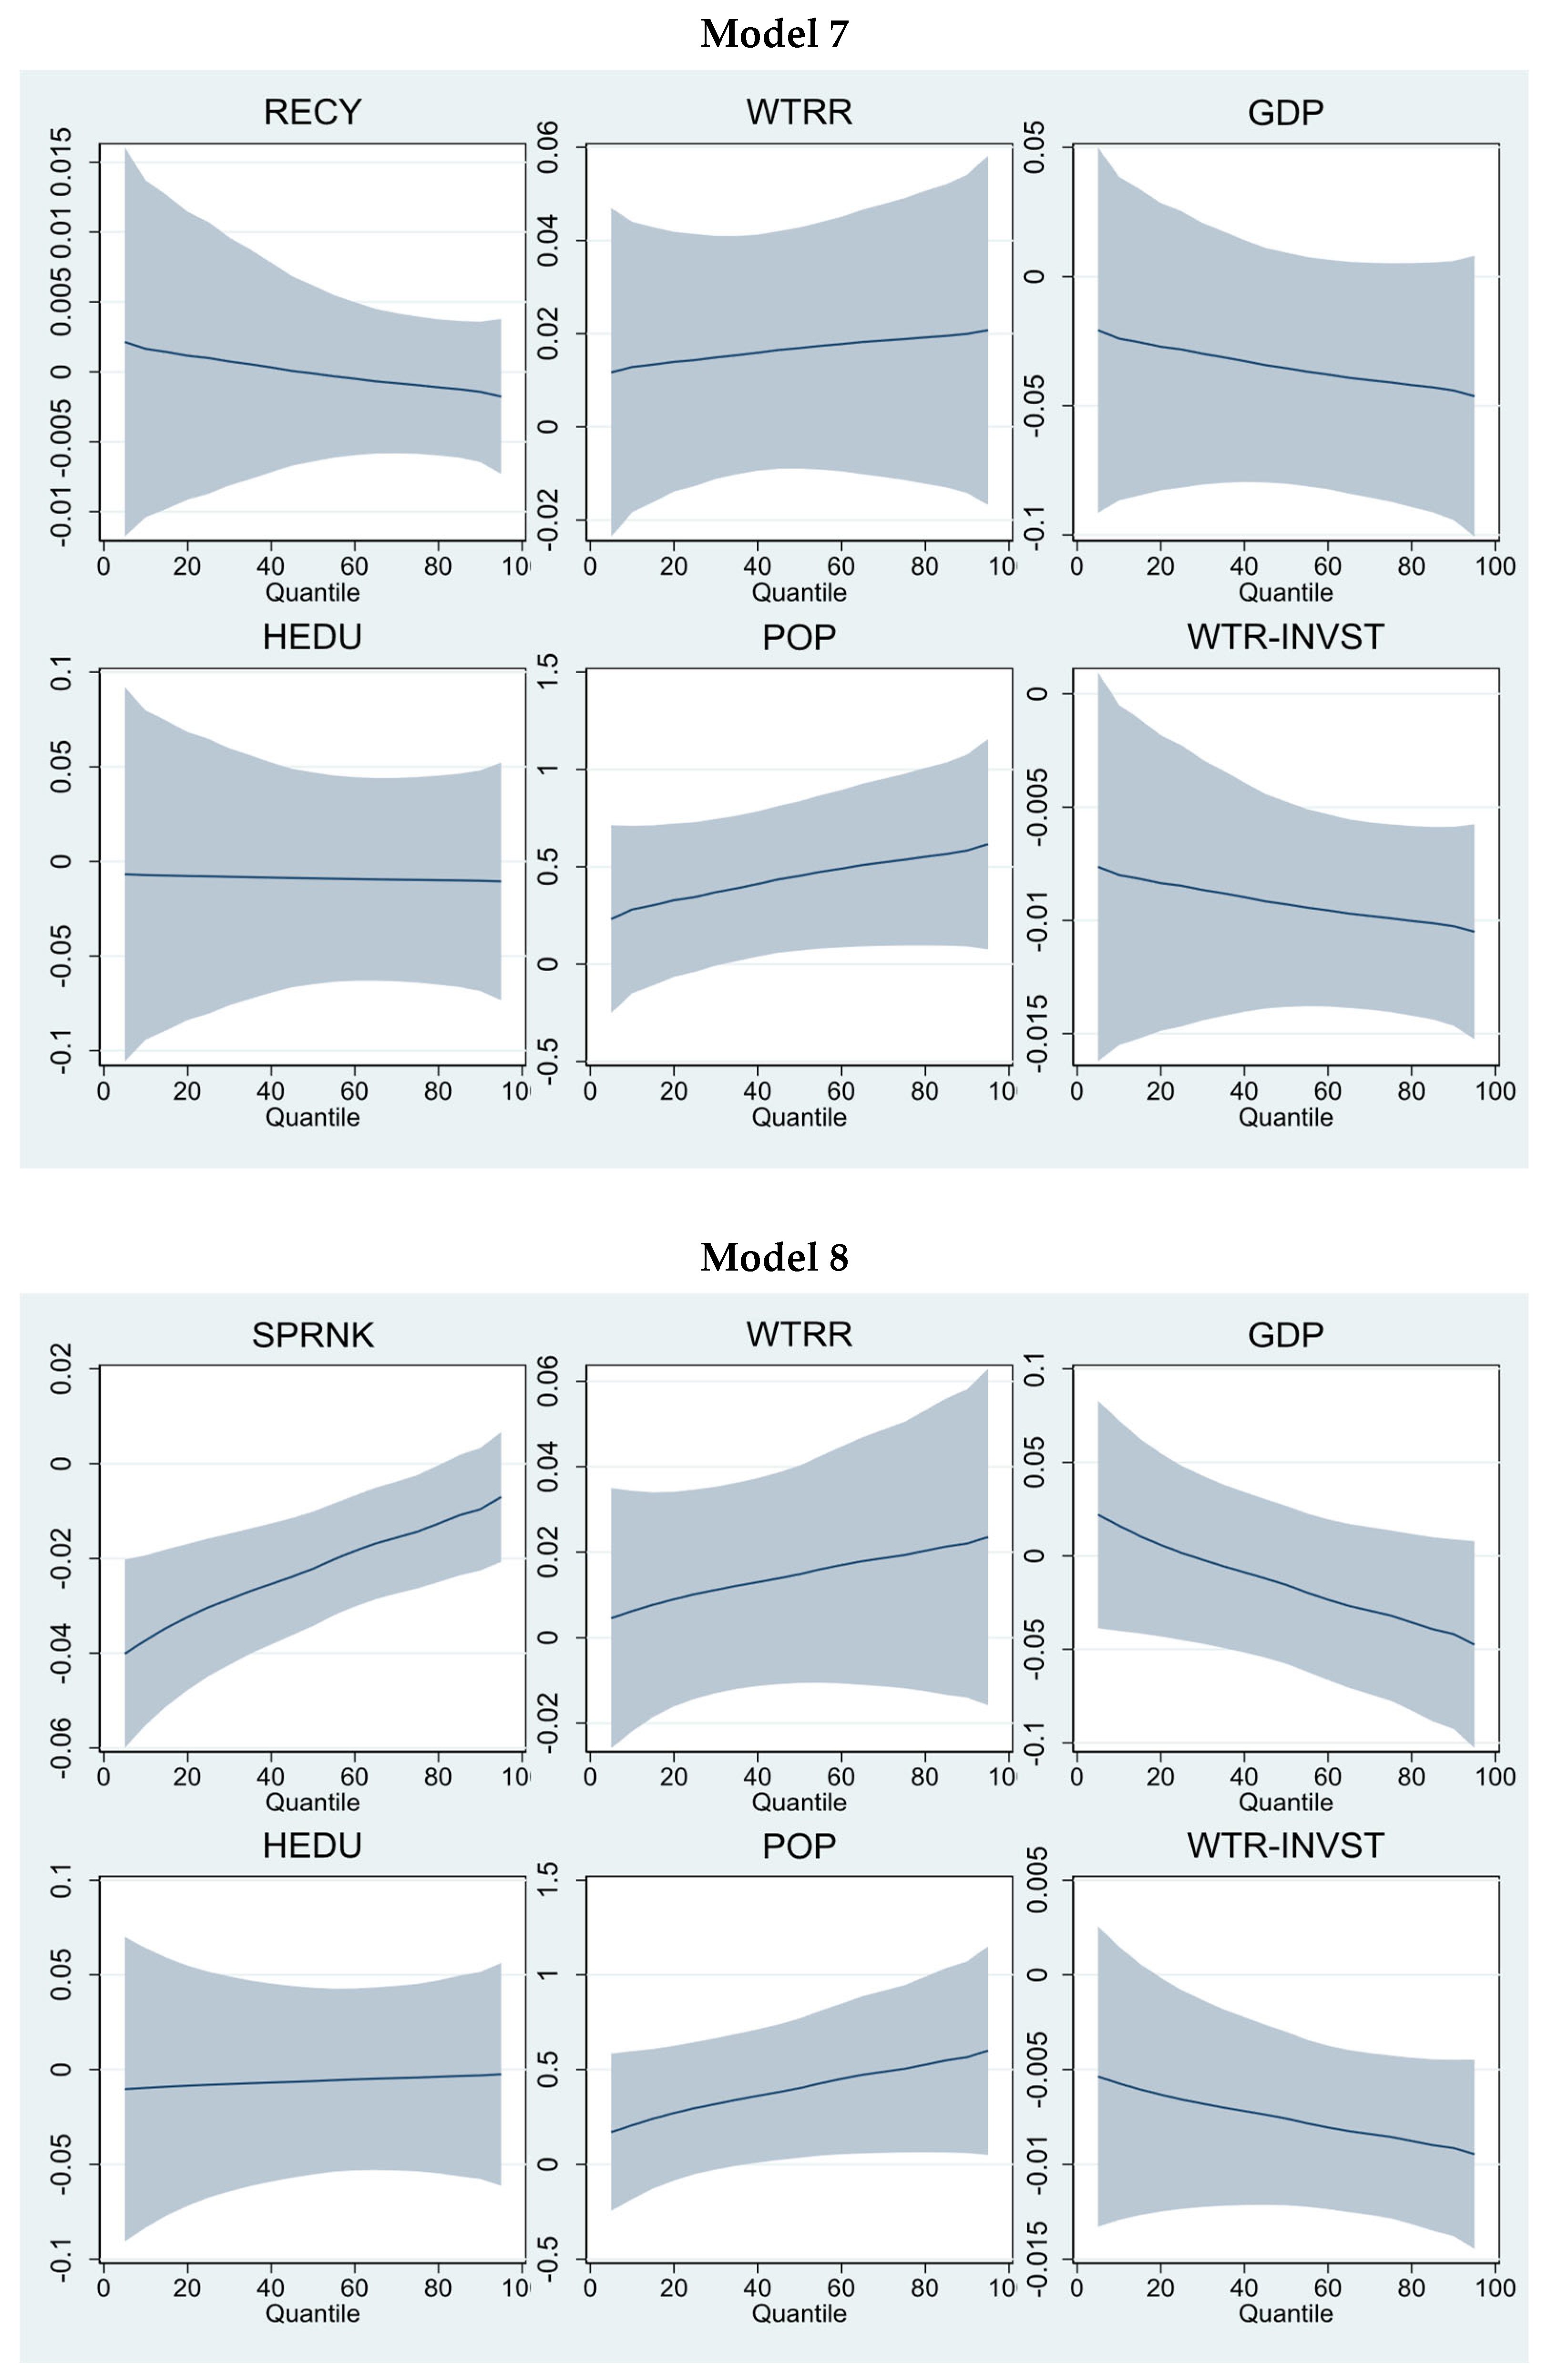
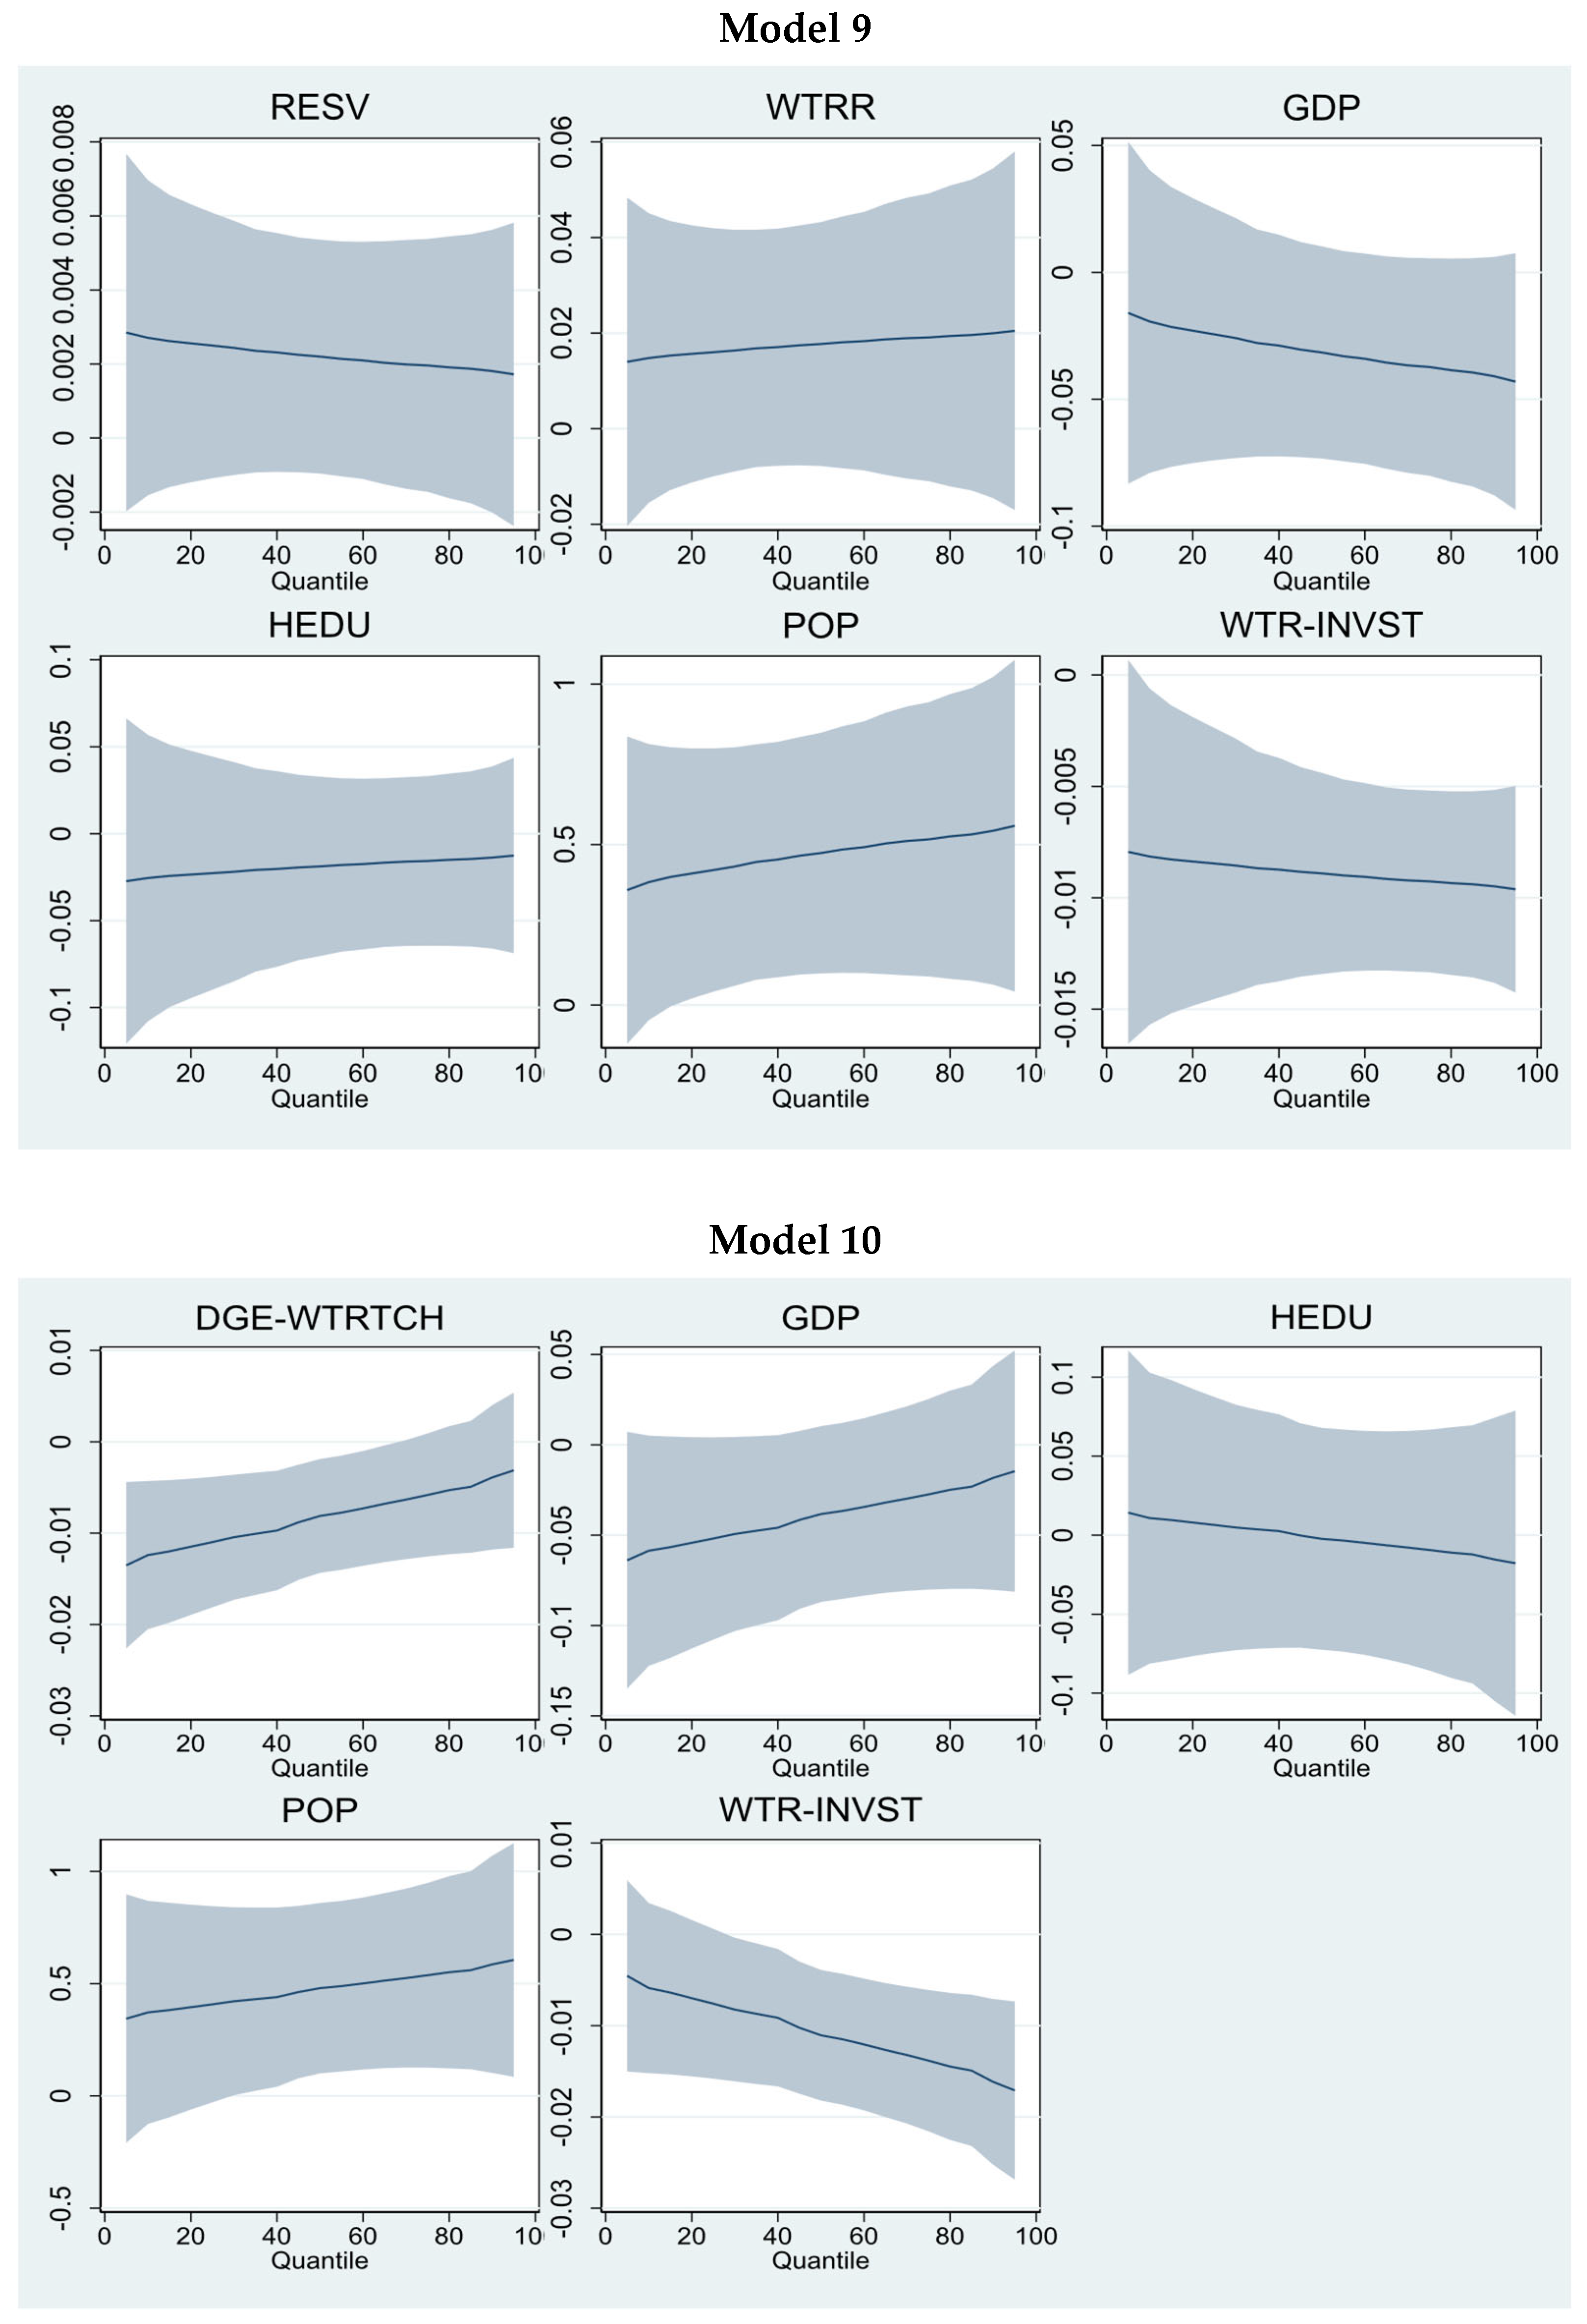
The use of a mobile application can lower the water consumption pressure by roughly −0.00001 to −0.00002 throughout lower to higher quantiles. Internet access (Model 2) significantly cuts water resource consumption by −0.0000306 at a lower and −0.0000167 at a higher quantile. These findings indicate the positive role of the digital economy in preserving China’s water resources. Similarly, internet use shrinks water consumption by −0.0000202 at a lower and −0.00000673 at a higher quantile. Telecom business also effectively lowers the water consumption in China by −0.0000128 (95th quantile) and −0.00000465 (95th quantile). In Model 5, we used the digital economy index. The findings show that the overall impact of the digital economy (internet technologies) on water resource consumption positively reduces the pressure and preserves water resources. The impact of digitalization on water resources consumption is −0.0537 at lower and −0.0292 at higher quantiles, encouraging the digitalization transformation system. At the higher quantile, this reduction is somewhat smaller at −0.0292, reflecting the fact that water-saving potential may be lower in areas that already use more water. Nevertheless, this still represents a meaningful reduction in water consumption. For example, in Model 2, internet access cuts water consumption by −0.0000306 at the lower quantile and −0.0000167 at the higher quantile, signifying the positive role of the digital economy in preserving water resources across all consumption levels. Similarly, internet use and telecom businesses show significant reductions in water consumption, with results indicating that digital technologies play a strong, positive role in reducing water usage. These findings underscore the importance of promoting digital transformation in China, as it can substantially contribute to water conservation efforts, particularly in areas with lower consumption levels. Moderator 1 shows that digitalization effectively conserves the total water resources and, thereby, less water consumption. Similar findings can be found in Figure 5.
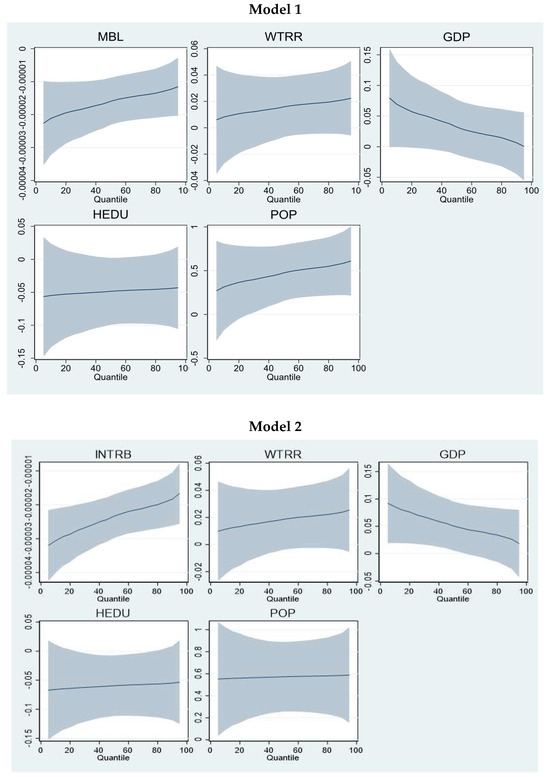
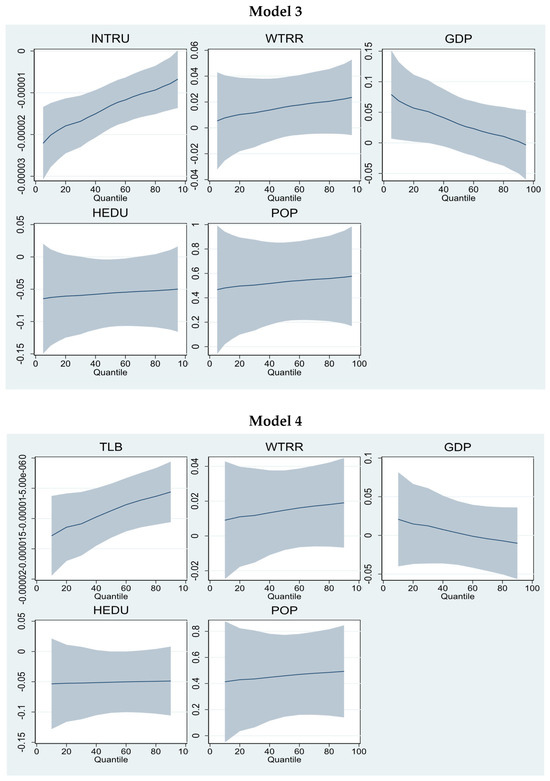
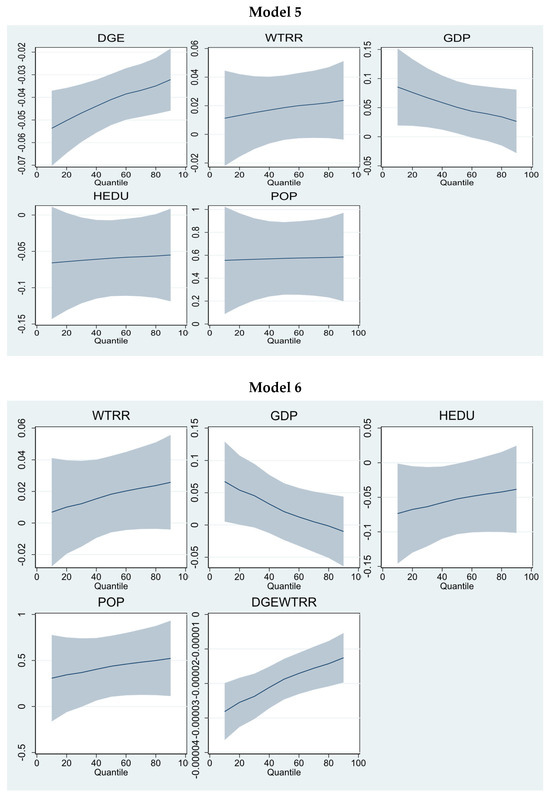
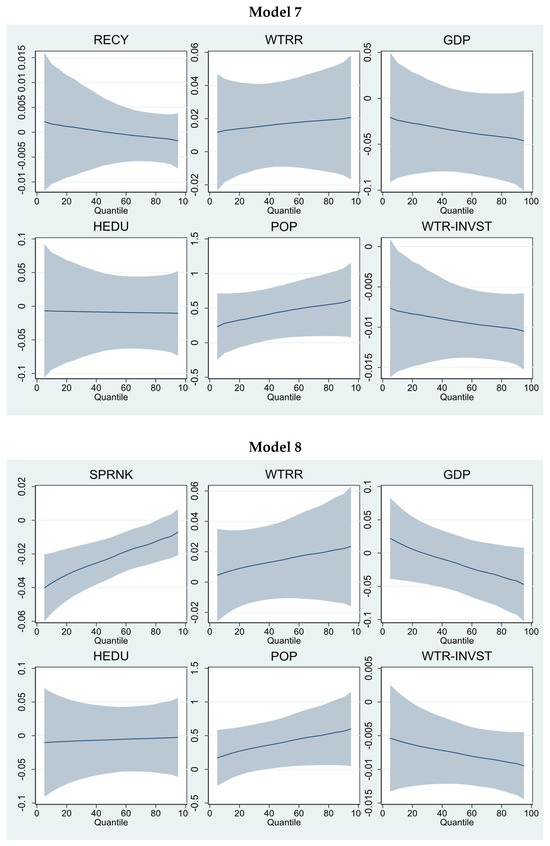
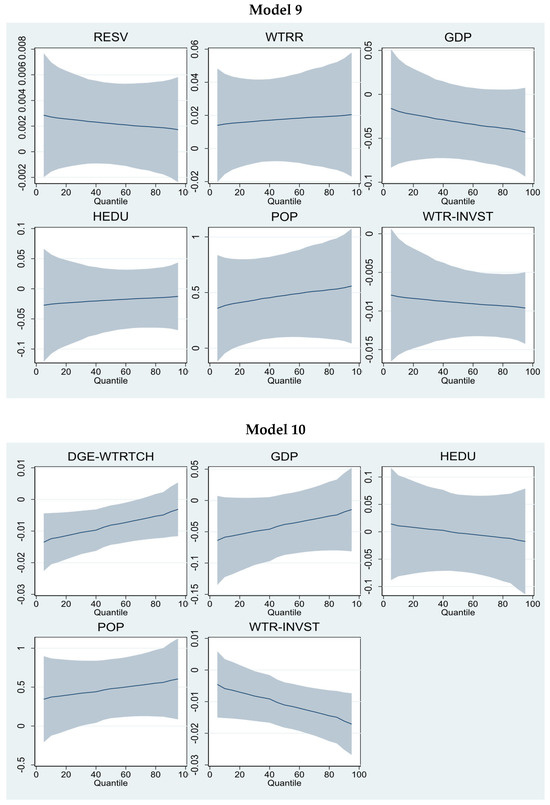
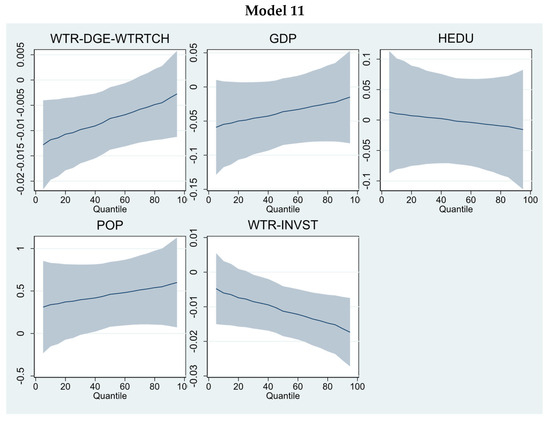
Figure 5.
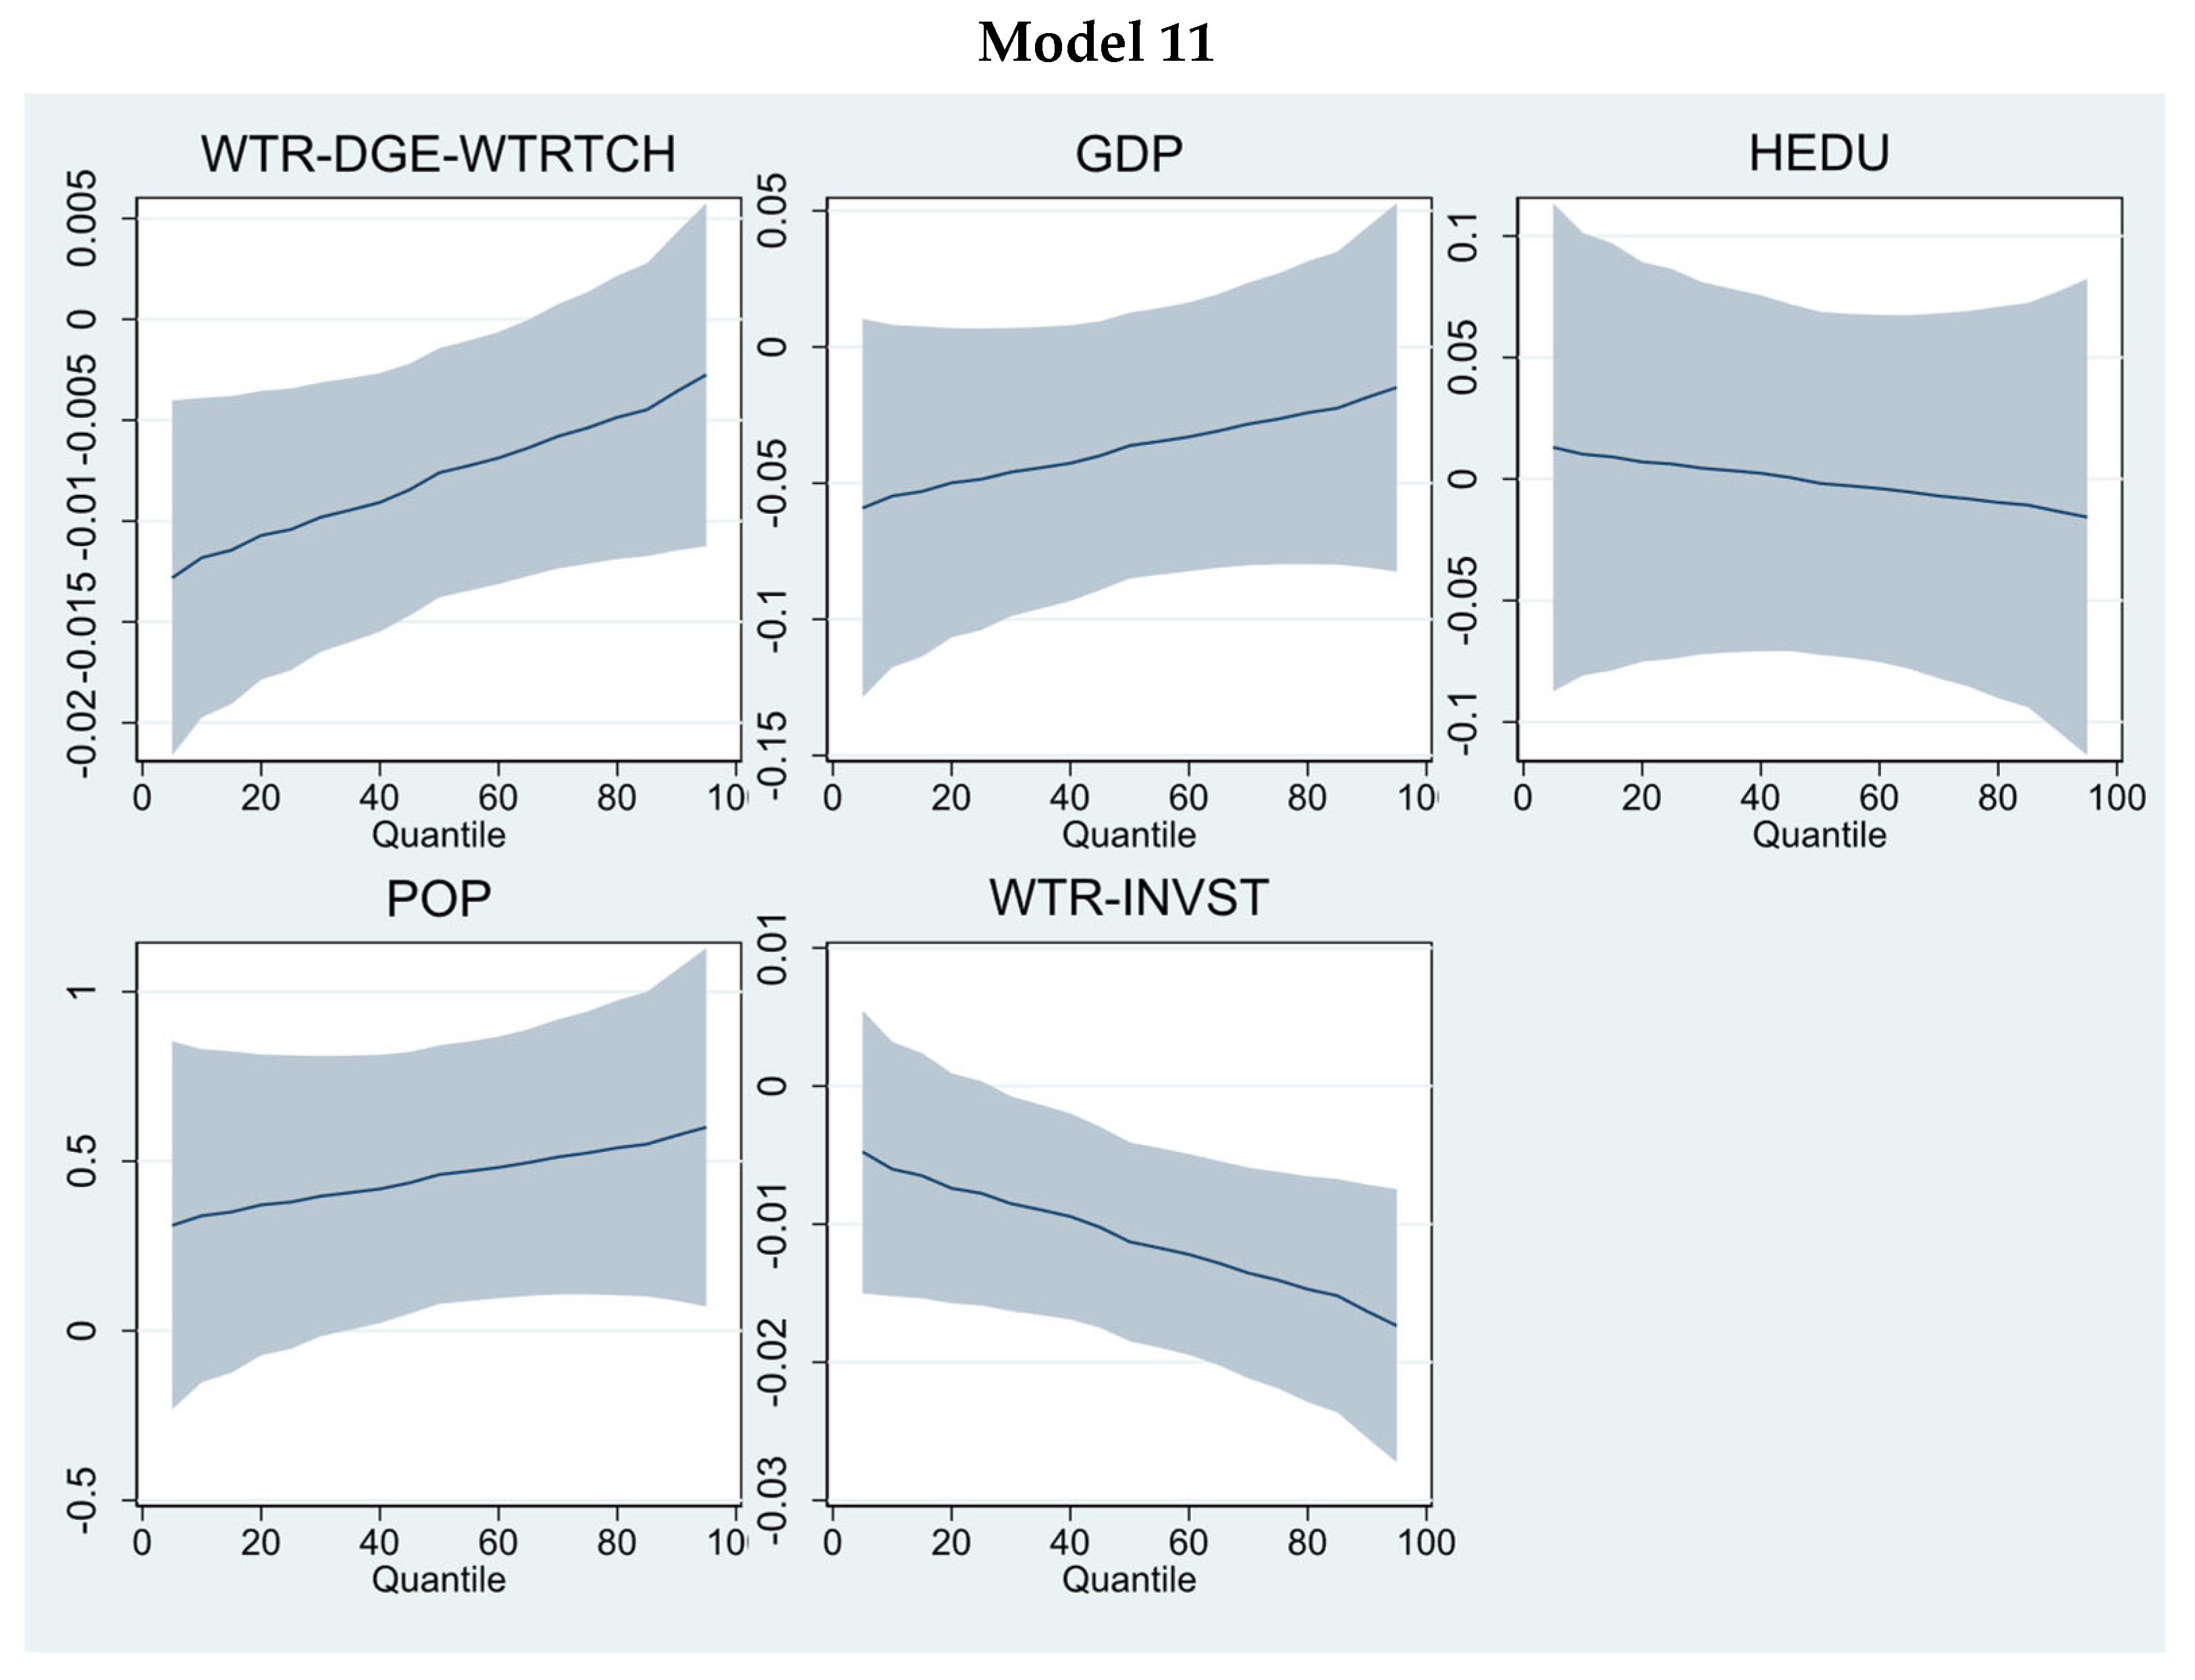
Profiles of M-MQR parameter estimates.
Models 7 and 9 incorporate water conservation technologies related to water recycling, sprinkler irrigation methods, and water reservoirs. The findings show that water recycling and sprinkler irrigation can reduce water resource consumption. However, water recycling is statistically insignificant. In contrast, sprinkler irrigation is significant at lower and higher quantities only. Similar findings can be found in Figure 5. However, a positive but statistically insignificant trend was found for water reservoirs. The most important finding is the impact of water-saving technology investment. The findings reveal that investment plays a positive role in reducing water resource consumption pressure. The co-efficient impact at higher quantiles is −0.0105 (Model 7), −0.00946 (Model 8), and −0.00962 (Model 9), showing its strength in water resource conservation. Similar findings are presented in Figure 6. Models 10 and 11 show that Moderators 2 and 3 can potentially reduce water resource consumption. However, these are more robust at lower (−0.0124, −0.0118) and middle (−0.00812, −0.00761) quantiles rather than higher quantiles.
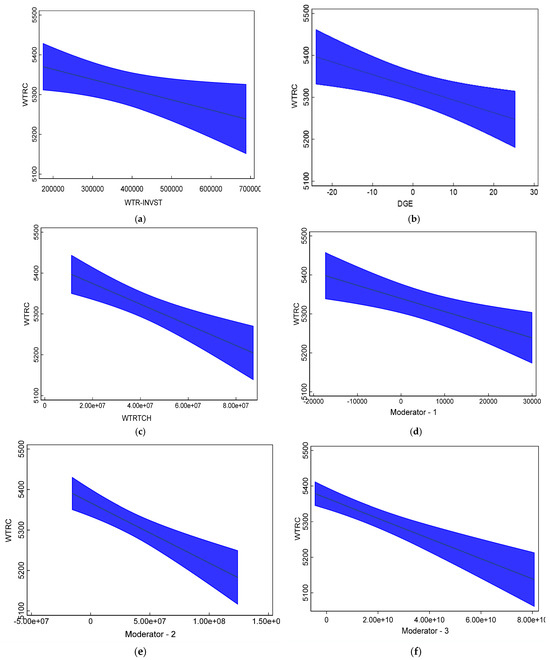
Figure 6.
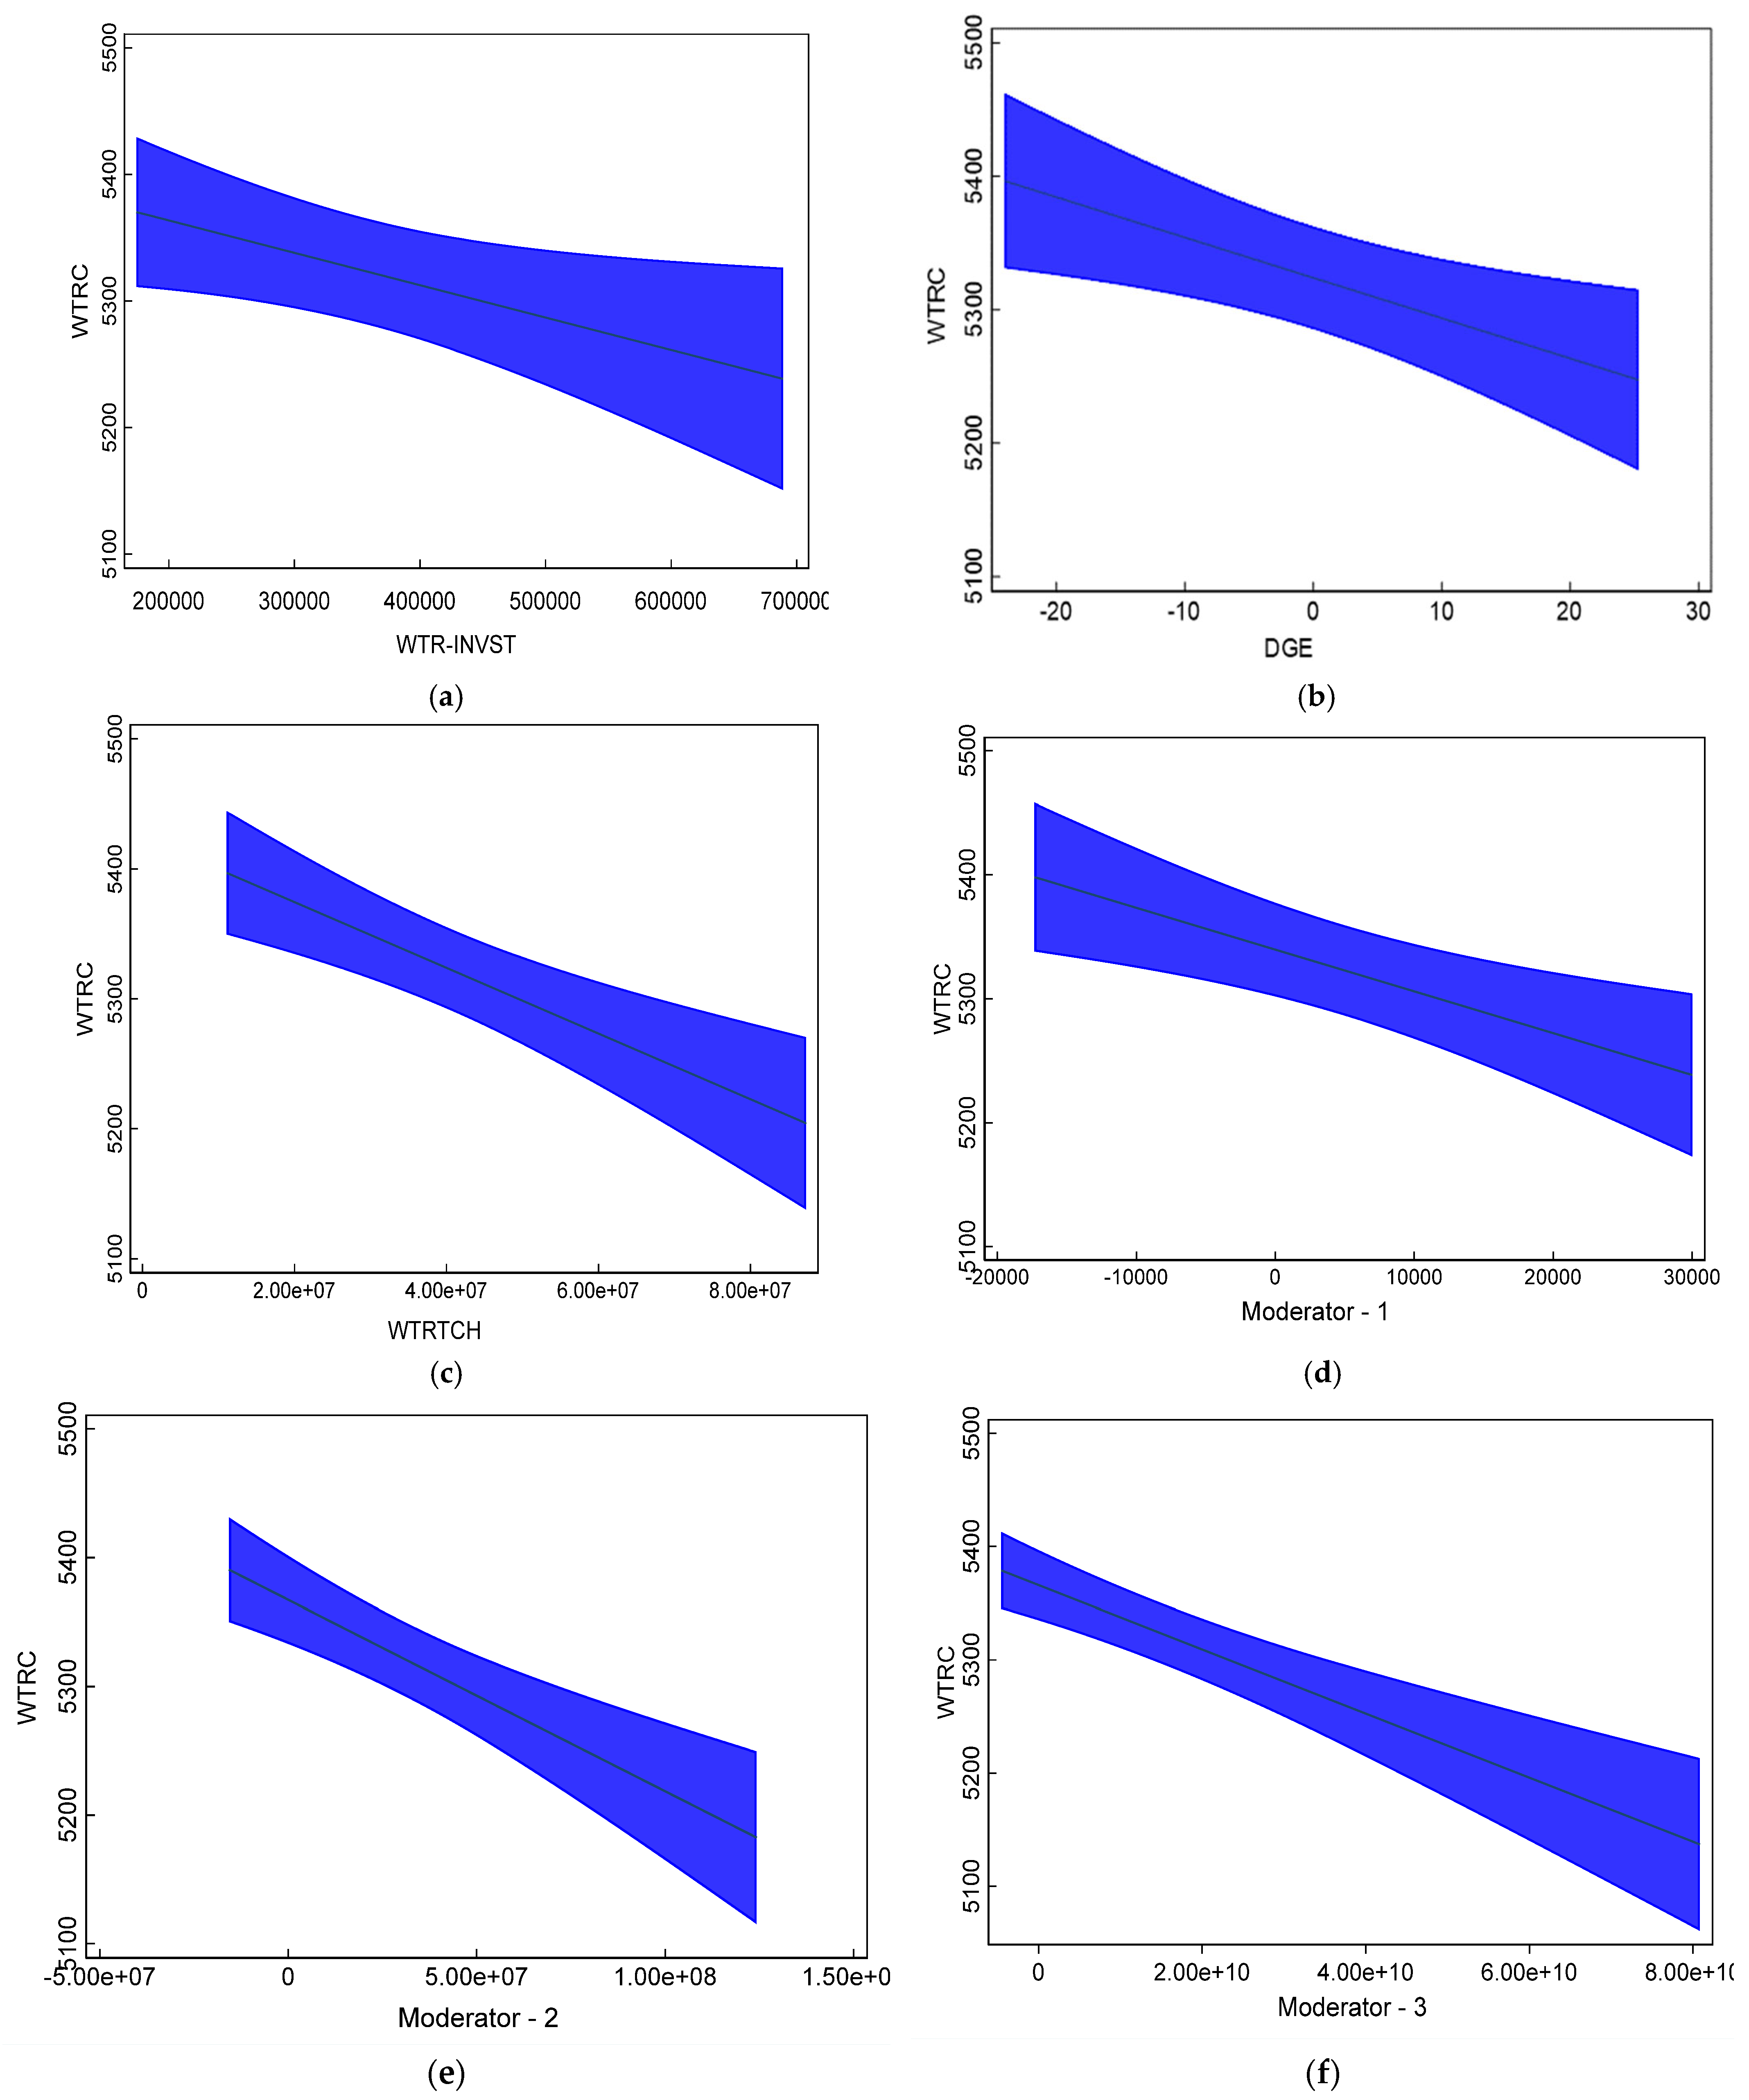
(a–f) Two-way trending relationship between water resource consumption, digital economy, water conservation technologies, and water investment (plotted using data from the 2008–2021 period).
5.1. Discussion of Findings
Based on the M-MQR findings, the positive impact of the digital economy (internet-based technologies) on reducing water consumption can be attributed to the efficient use of digital information, systems, and real-time monitoring. Through internet technologies, people can track their water consumption and become more aware of their water usage patterns [51]. The findings of this study are supported by those presented in [18]. The production of devices with internet access and smart home systems has facilitated the remote monitoring and control of water-related equipment for consumers and companies. By utilizing concurrent data, altering settings can result in enhanced efficiency in the use of water resources.
Further, online markets allow consumers to conveniently access an extensive range of products, encompassing water-efficient appliances, fittings, and technology [52]. In this way, it is possible to implement water conservation measures in residential and commercial settings [53]. Internet technology can facilitate optimized supply chains that help reduce the water used in shipping [54]. In the digital economy, resources can be managed efficiently [55]. According to Jagtap et al. [56], IoT sensors can be employed inside industrial environments to monitor and enhance water consumption in manufacturing and production operations. This has the potential to result in substantial water conservation within industrial sectors. Digital systems can consistently monitor water quality, optimizing water treatment procedures and minimizing unnecessary flushing and treatment requirements. IoT-based irrigation systems can respond to changes in soil moisture, plant requirements, and predicted weather. This prevents wasteful watering and promotes efficient water use in farming and landscaping. Our second finding highlights that water conservation technologies can potentially preserve water resources through recycling water and sprinkler irrigation methods. However, the insignificance of the recycling co-efficient shows its inadequacy. Zhang et al. [57] stated that the application of recycled water is determined by external elements related to location-specific features and internal factors that directly impact the demand–supply system. Moreover, the water reuse cycle encompasses several barriers and motivations, as highlighted by Lee and Jepson [58], manifesting across production, supply, and consumption stages. In addition, there are many other factors, such as a lack of adequate treatment facilities hindering production and supply [59,60,61], insufficient investment [62,63], and limited technological capabilities. Our research findings can be supported by those of Li et al. [64]; a lack of public acceptance slows down the adoption rate of recycled water in China despite its potential to alleviate the strain on water resources. Our findings are also consistent with those of Yan et al. [65], who asserted that the ongoing advancements in sprinkler irrigation technology have led to significant advantages in managing water resources. However, water reservoirs are found to be positive for increasing China’s water resource consumption. This positive influence is explained by Zhang et al. [66]. They argued that water reservoirs have the potential to exert a positive impact on water resource management and consumption in China through their ability to offer storage.
The moderating impact of the interaction between digital economy and water conservation technologies was found to increase water resource management and reduce water consumption. The results can be explained in light of the above study. These findings show that the digital economy can facilitate technology and provide the foundation for significant implications and monitoring for water resource management. However, the success of the technology depends on the investment. This study’s findings show the positive role of investment in water-saving measures. The results are consistent with [67], asserting that China can effectively reduce water consumption per CNY 10,000 GDP by increasing water-saving investments and developing water-saving behaviors.
Other findings involving control parameters (water resources, GDP, population, and higher education) show different attitudes toward water consumption. The factor with the greatest impact is population; increasing population strains China’s resources and increases water consumption. However, higher education plays a role in controlling the water consumption in China. Tian et al. [68] researched the water literacy of urban residents in China and found that the water literacy score is relatively high, but the water behavior score is relatively low. They advocated that China could improve its water resources status and distribution through water literacy.
Growth impact (GDP) showed positive and negative attitudes in different models, implying that growth impacts can vary depending on various factors. Governments and policymakers must implement strategies and policies that promote sustainable water management practices as GDP grows to mitigate negative consequences on water resources and ensure water security for future generations.
The influence of economic growth on GDP also shows positive and negative trends across different models, suggesting that the direction of this impact might vary based on a range of circumstances.
Governments and policymakers must prioritize implementing plans and policies that foster sustainable water management, even in the face of economic growth, to limit adverse impacts on water resources and safeguard water security for future generations. The positive and negative findings can be explained by [69], who found an N-shaped relationship between water consumption and GDP, implying that growth may drive up water consumption. However, increasing GDP can allow governments to invest more in water infrastructure, including water delivery, wastewater treatment, and irrigation.
This investment can improve water management and efficiency. Gu et al. [70] also found an inverted U-shaped curve between water consumption and GDP, verifying that the effect of this relationship can differ at different growth stages. Accordingly, our findings may also be changed if the second growth stage is included in the estimation. As expected, the co-efficient of water resources has a positive relationship with water consumption, but this is statistically insignificant. This might be due to the strain on the limited water resources in China. Given these findings, our results proved that the digitalization of the economy is not just bound to one sector but can represent a foundation for managing water resources and thus lessen water-related problems. Further, it can help to achieve the sixth sustainable development goal (SDGs).
5.2. Cross-Robustness Test of Findings
Figure 6 presents a graph assessing the relationships between the core regressors. Figure 6a shows that the impact of water-saving investment trends negatively. This validates the findings of this study and emphasizes the importance of investment for handling China’s water issues. Figure 6b,c highlight the importance of the digital economy and water conservation technologies to improve the water consumption pattern. In Figure 6d–f, the moderators are plotted against water resource consumption to assess the significance of the digital economy and water conservation technologies in preserving water resources by reducing water consumption. The prevailing trend across all graphs is negative, implying that technologies significantly reduce water resource consumption in China. Accordingly, these findings strengthen the conclusions presented above and support the idea that the digital economy can enable China to be more efficient in water management through the adoption of internet, smart grid, and water conservation technologies.
Table 3 reveals that the digital economy consistently increases water consumption across all regions, but this effect varies significantly by water resource context. In water-abundant regions (Q1), digital technologies increase water consumption with a coefficient of 0.628 (p < 0.001). However, this effect weakens in moderate (Q2: 0.325, 48% weaker) and limited (Q3: 0.445, 29% weaker) water resource regions. Most notably, in water-scarce regions (Q4), the digital economy exhibits the strongest increasing effect on water consumption (0.797, 27% stronger than abundant regions). This paradoxical finding suggests that while digital technologies may improve efficiency, they could also enable increased water usage—particularly in water-stressed areas where technological adoption might facilitate access to previously constrained water resources

Table 3.
Heterogeneous Complementarities of the Digital Economy on Water Consumption, by Baseline Water Resource Context.
6. Conclusions
This study enriches the literature by emphasizing the significant moderating effect of the digital economy on preserving and managing water resources through the adoption of internet and water-conservation technologies and water-saving investment in China (2008–2021). We applied a cutting-edge M-MQR research technique and derived the subsequent findings:
First, this study found a disparity in water resource availability between the provinces and regions. Ningxia, Beijing, Shanghai, and Tianjin provinces have the lowest total water resources, while Tibet and Sichuan comparatively show higher water resources (4429.98 m3 and 2603.495 m3, respectively). Second, this study found that the digital economy can be a promising solution to conserve water resources in China. In the digital economy, usage monitoring, distribution, and accurate data collection can all be influenced to improve water resource utilization. Further, through digital economy devices such as mobile, internet users, and the telecom business, it becomes possible to identify the areas where water conservation efforts are needed.
Additionally, the digital economy index also shows the potential of the digital economy to mitigate the water resource consumption issues in China from −0.0292 to −0.0537. These results support the idea that digital technology can reduce water resource consumption in China. Third, the recycling of wastewater and sprinkler irrigation are valuable. However, sprinkler irrigation is comparatively more effective than recycling. Fourth, regarding the moderation of the digital economy and water conservation technologies, the digital economy negatively moderates the impact of water resources and conservation technologies on water use, implying that the digital economy (digital devices) can be integrated into water supply and distribution systems to create smart water infrastructure. These systems can monitor water flow, detect leaks, and optimize water distribution in real time, reducing wastage and ensuring efficient water consumption.
Water use can also be optimized through water conservation technologies and digitalization devices in agriculture-intensive sectors. Lastly, this study highlights the importance of water-saving investments to improve water resource consumption. In addition, education seems to be a source of preserving water through awareness. However, the results on economic growth are mixed, highlighting that this factor should be investigated in further depth to reach a conclusion. Population, compared to other parameters, puts stress on water resource consumption. This study contributes to SDG 6 (Clean Water and Sanitation) by demonstrating that the digital economy, through technologies such as mobile access and internet broadband, can help to optimize water management and reduce consumption, especially in water-scarce regions. Our findings show that these technologies can significantly improve water use efficiency and promote sustainability. Additionally, SDG 9 (Industry, Innovation, and Infrastructure) is supported by our results, which highlight how the integration of smart water systems and digital solutions in infrastructure can enhance water efficiency, reduce waste, and support sustainable practices in water-intensive industries.
6.1. Policy Implications
Based on the empirical outcomes, near-term policies should prioritize scaling targeted provincial water-saving investment programs with measurable performance contracts, while piloting integrated digital irrigation deployments in lower-consumption provinces where complementarities are largest. Program design must include standardized metering, leak detection, and irrigation scheduling tools, and should be coupled with public education campaigns that effectively promote conservation habits, particularly among educated demographics. Regional strategies must be sharply differentiated: water-scarce regions such as Ningxia and Beijing should prioritize sector-wide efficiency, recycling, and wise distribution, while water-abundant regions such as Tibet and Sichuan should focus on sustainable storage and demand management to prevent overconsumption. This multi-pronged approach will effectively decouple economic growth from water use and guide China toward sustainable water management.
6.2. Limitations and Future Research
This study is limited by data unavailability for certain variables and regional disparities in data quality, which may affect the comprehensiveness and robustness of the analysis. Future studies could explore the impact of the digital economy on water quality, including pollution reduction and treatment. Additionally, research could examine the role of digitalization in water resource management across sectors such as agriculture, industry, and urban areas, and consider cross-national comparisons to understand its broader effects.
Author Contributions
Conceptualization, R.T., R.Y. and C.T.; Methodology, R.T.; Software, R.Y.; Validation, C.T.; Formal analysis, R.Y.; Resources, R.T., Y.L. and C.T.; Data curation, R.Y.; Writing—original draft, R.Y. and C.T.; Writing—review & editing, R.T. and Y.L.; Supervision, R.T. and Y.L.; Project administration, Y.L. All authors have read and agreed to the published version of the manuscript.
Funding
This research was funded by Sichuan Provincial Key Laboratory Project on Strategic Vanadium and Titanium Resources Innovative Development and Decision Science (Project No.: FTZDS-YB-2502), Sichuan Resource-Based City Development Research Center Project (Project No.: ZYZX-YB-2502), Panzhihua Common Prosperity Pilot Zone Research Center Project (Project No.: GFZ24-02) and Sichuan Provincial Philosophy and Social Science Project (Project No.: SC24E031).
Institutional Review Board Statement
Not applicable.
Informed Consent Statement
Not applicable.
Data Availability Statement
Data were collected from these sources: Provincial Bureau of Statistics. National Bureau of Statistics. Ministry of Housing and Urban-Rural Development. China Agricultural Machinery Industry Yearbook. Ministry of Environmental Protection of China. Using Wind and CSMAR.
Conflicts of Interest
The authors declare no conflict of interest.
Appendix A

Table A1.
Data and sources.
Table A1.
Data and sources.
| Variable(s) | Data Used (Measurement) | Labels | Data Sources |
|---|---|---|---|
| Water resources consumption | Total water use (100 million m3) | WTRC | Provincial Bureau of Statistics. National Bureau of Statistics. Ministry of Housing and Urban-Rural Development. China Agricultural Machinery Industry Yearbook. Ministry of Environmental Protection of China. |
| Water resources | Total water resources (100 million m3) | WRR | |
| Mobile use | Mobile Phone Subscriber (Ten thousand) | MBL | |
| Internet access | Internet Broadband Access Port (Ten thousand) | INTRB | |
| Internet users | Internet Users | INTRU | |
| Telecom business | Total Telecom Business (billion) | TLB | |
| Recycling | Recycling of Wastewater (10,000 tons) | RECY | |
| Sprinkler technology | Sprinkler Irrigation (1000 hectares) | SPRNK | |
| Reservoirs | Number of reservoirs | RESV | |
| Gross domestic per capita | GDP per Capita (Yuan) | GDP | |
| Higher Education | Number of Degrees Granted by Higher Education Institutions | HEDU | |
| Population | Population (total) | POP | |
| Investment in water conservation | Total Investment in Water-conservation Measures (10 thousand) | WTR-INVST |

Table A2.
Province list.
Table A2.
Province list.
| Anhui | Heilongjiang | Qinghai |
| Beijing | Henan | Shaanxi |
| Chongqing | Hubei | Shandong |
| Fujian | Hunan | Shanghai |
| Gansu | Inner Mongolia | Shanxi |
| Guangdong | Jiangsu | Sichuan |
| Guangxi | Jiangxi | Tianjin |
| Guizhou | Jilin | Yunnan |
| Hainan | Liaoning | Zhejiang |
| Hebei | Ningxia |

Table A3.
Construction of PCA Index for DGE index.
Table A3.
Construction of PCA Index for DGE index.
| Variable(s) | Comp-1 | Comp-2 | Comp-3 | Comp-4 | Factor Loading | Conceptual Role in DGE Index |
|---|---|---|---|---|---|---|
| INTRU (Internet Usage) | 0.5309 | −0.1769 | −0.0497 | −0.8273 | 0.5309 | Reflects the role of internet usage in the digital economy, capturing its influence on data accessibility and connectivity. |
| TLB (Telecom Business) | 0.4362 | 0.8922 | 0.0811 | 0.0843 | 0.8922 | Represents the strength and accessibility of telecommunications infrastructure, a key enabler for digital technologies. |
| INTRB (Internet Access) | 0.5176 | −0.2288 | −0.7074 | 0.4236 | 0.5176 | Indicates the level of internet bandwidth availability, reflecting digital economy’s capacity for data transfer and connectivity. |
| MBL (Mobile Users) | 0.5099 | −0.3469 | 0.7004 | 0.3593 | 0.7004 | Measures mobile internet access and its role in supporting digital services, communication, and commerce. |
Appendix B

Table A4.
Cross-sectional dependence and slope heterogeneity findings.
Table A4.
Cross-sectional dependence and slope heterogeneity findings.
| Model(s) Testing | Pesaran CD (2004) [42] | Pesaran CD (2015) [43] | Pesaran and Yamagata Significance [44] | |
|---|---|---|---|---|
| Digital Model-1 | 1.941(0.0523) | 2.231(0.026) | ∆ = 6.691(0.000) | ∆-adj = 9.676(0.000) |
| Digital Model-2 | 3.598(0.0003) | 2.792(0.005) | ∆ = 5.864(0.000) | ∆-adj = 8.480(0.000) |
| Digital Model-3 | 2.814(0.005) | 3.177(0.0015) | ∆ = 6.288(0.000) | ∆-adj = 9.093(0.000) |
| Digital Model-4 | 2.892(0.0038) | 2.111(0.035) | ∆ = 6.474(0.000) | ∆-adj = 9.363(0.000) |
| Digital Model-5 | 2.646(0.0081) | 2.122(0.034) | ∆ = 6.362(0.000) | ∆-adj = 9.200(0.000) |
| Moderator (1) Model-6 | 2.452 (0.0142) | 2.016(0.044) | ∆ = 5.002(0.000) | ∆-adj = 7.874(0.000) |
| Model-7 RECY (Tech-1) | 1.651(0.0986) | 2.437(0.015) | ∆ = 8.450(0.000) | ∆-adj = 11.366(0.000) |
| Model-8 SPRNK (Tech-2) | 2.536(0.0112) | 2.052(0.040) | ∆j = 4.919(0.000) | ∆-adj = 7.744(0.000) |
| Model-9 RESV (Tech-3) | 2.426(0.0153) | 2.031(0.042) | ∆ = 4.652(0.000) | ∆-adj = 7.322(0.000) |
| Moderator (2) Model-10 | 2.372(0.0177) | 1.969(0.049) | ∆ = 4.915(0.000) | ∆-adj = 7.737(0.000) |
| Moderator (3) Model-11 | 2.452(0.0142) | 2.016(0.044) | ∆ = 5.002(0.000) | ∆-adj = 7.874(0.000) |

Table A5.
Panel CIPS unit root findings.
Table A5.
Panel CIPS unit root findings.
| Variable(s) | CIPS—Level | CIPS—First Difference | ||
|---|---|---|---|---|
| Trend—Exclusive | Trend—Inclusive | Trend—Exclusive | Trend—Inclusive | |
| WTRC | −1.479 | −2.646 * | −3.778 *** | −3.699 *** |
| WRR | −2.373 | −2.724 * | −3.859 *** | −3.533 *** |
| MBL | −1.920 | −2.269 | −3.096 *** | −3.160 *** |
| INTRB | −2.507 * | −2.603 * | −3.605 *** | −4.009 *** |
| INTRU | −3.151 *** | −3.835 *** | −4.294 *** | −4.579 |
| TLB | −2.105 | −2.865 * | −3.901 *** | −3.689 *** |
| DGE | −2.507 * | −2.603 | −3.605 *** | −4.009 *** |
| RECY | −1.349 | −1.668 | −2.152 * | −2.887 ** |
| SPRNK | −0.854 | −1.485 | −4.126 *** | −4.587 *** |
| RESV | −4.121 *** | −4.016 *** | −4.916 *** | −4.769 *** |
| GDP | −1.256 | −1.779 | −2.794 * | −3.095 *** |
| HEDU | −2.352 | −2.653 * | −3.261 *** | −3.318 *** |
| POP | −1.646 | −1.867 | −2.848 * | −3.164 *** |
| WTR-INVST | −2.487 | −2.707 * | −4.013 | −4.352 |
| Moderator-1 | −3.492 *** | −3.280 *** | −3.280 *** | −3.993 *** |
| Moderator-2 | −1.337 | −1.692 | −2.549 * | −3.306 |
| Moderator-3 | −3.887 *** | −3.933 *** | −4.968 *** | −4.811 *** |
*** p < 0.01, ** p < 0.05, * p < 0.1 shows the significance level.
References
- Tellman, B.; Bausch, J.C.; Eakin, H.; Manuel-Navarrete, D.; Redman, C.L.; Anderies, J.M.; Mazari-Hiriart, M. Adaptive pathways and coupled infrastructure: Seven centuries of adaptation to water risk and the production of vulnerability in Mexico City. Ecol. Soc. 2018, 23, 1. [Google Scholar] [CrossRef]
- Cerilli, M. Driving Resilience and Responsible Water Use with Digital Solutions. 2022. Available online: https://www.watertechonline.com/water-reuse/article/14223984/driving-resilience-and-responsible-water-use-with-digital-solutions (accessed on 30 September 2023).
- Tzanakakis, V.A.; Paranychianakis, N.V.; Angelakis, A.N. Water supply and water scarcity. Water 2020, 12, 2347. [Google Scholar] [CrossRef]
- Foster, S.; Custodio, E. Groundwater resources and intensive agriculture in Europe–can regulatory agencies cope with the threat to sustainability? Water Resour. Manag. 2019, 33, 2139–2151. [Google Scholar] [CrossRef]
- Everard, M. A socio-ecological framework supporting catchment-scale water resource stewardship. Environ. Sci. Policy 2019, 91, 50–59. [Google Scholar] [CrossRef]
- Jiang, Y. China’s water scarcity. J. Environ. Manag. 2009, 90, 3185–3196. [Google Scholar] [CrossRef]
- Zhao, H.; Miller, T.R.; Ishii, N.; Kawasaki, A. Global spatio-temporal change assessment in interregional water stress footprint in China by a high resolution MRIO model. Sci. Total Environ. 2022, 841, 156682. [Google Scholar] [CrossRef]
- Yuan, B.; Li, C.; Xiong, X. Innovation and environmental total factor productivity in China: The moderating roles of economic policy uncertainty and marketization process. Environ. Sci. Pollut. Res. 2021, 28, 9558–9581. [Google Scholar] [CrossRef]
- He, C.; Harden, C.P.; Liu, Y. Comparison of water resources management between China and the United States. Geogr. Sustain. 2020, 1, 98–108. [Google Scholar] [CrossRef]
- Yao, T.; Bolch, T.; Chen, D.; Gao, J.; Immerzeel, W.; Piao, S.; Su, F.; Thompson, L.; Wada, Y.; Wang, L. The imbalance of the Asian water tower. Nat. Rev. Earth Environ. 2022, 3, 618–632. [Google Scholar] [CrossRef]
- Gamal, Y.; Soltan, A.; Said, L.A.; Madian, A.H.; Radwan, A.G. Smart irrigation systems: Overview. IEEE Access 2023, 13, 66109–66121. [Google Scholar] [CrossRef]
- Li, H.; Issaka, Z.; Jiang, Y.; Tang, P.; Chen, C. Overview of emerging technologies in sprinkler irrigation to optimize crop production. Int. J. Agric. Biol. Eng. 2019, 12, 1–9. [Google Scholar] [CrossRef]
- Warsinger, D.M.; Chakraborty, S.; Tow, E.W.; Plumlee, M.H.; Bellona, C.; Loutatidou, S.; Karimi, L.; Mikelonis, A.M.; Achilli, A.; Ghassemi, A. A review of polymeric membranes and processes for potable water reuse. Prog. Polym. Sci. 2018, 81, 209–237. [Google Scholar] [CrossRef] [PubMed]
- Kumar, A.; Goyal, K. Water reuse in India: Current perspective and future potential. In Advances in Chemical Pollution, Environmental Management and Protection; Elsevier: Amsterdam, The Netherlands, 2020; Volume 6, pp. 33–63. [Google Scholar]
- Bauer, S.; Wagner, M. Possibilities and challenges of wastewater reuse—Planning aspects and realized examples. Water 2022, 14, 1619. [Google Scholar] [CrossRef]
- Griffith, C.; Heydon, G.; Lamb, D.; Lefort, L.; Taylor, K.; Trotter, M.; Wark, T. Smart Farming: Leveraging the Impact of Broadband and the Digital Economy; CSIRO: Armidale, Australia; University of New England: Armidale, Australia, 2013. [Google Scholar]
- Zhang, W.; Zhao, S.; Wan, X.; Yao, Y. Study on the effect of digital economy on high-quality economic development in China. PLoS ONE 2021, 16, e0257365. [Google Scholar] [CrossRef]
- Andrić, I.; Vrsalović, A.; Perković, T.; Čuvić, M.A.; Šolić, P. IoT approach towards smart water usage. J. Clean. Prod. 2022, 367, 133065. [Google Scholar] [CrossRef]
- Ahmed, S.; Hossain, M.F.; Kaiser, M.S.; Noor, M.B.T.; Mahmud, M.; Chakraborty, C. Artificial intelligence and machine learning for ensuring security in smart cities. In Data-Driven Mining, Learning and Analytics for Secured Smart Cities: Trends and Advances; Springer: Cham, Switzerland, 2021; pp. 23–47. [Google Scholar]
- Velayudhan, N.K.; Pradeep, P.; Rao, S.N.; Devidas, A.R.; Ramesh, M.V. IoT-enabled water distribution systems—A comparative technological review. IEEE Access 2022, 10, 101042–101070. [Google Scholar] [CrossRef]
- Abu-Mahfouz, A.M.; Hamam, Y.; Page, P.R.; Adedeji, K.B.; Anele, A.O.; Todini, E. Real-time dynamic hydraulic model of water distribution networks. Water 2019, 11, 470. [Google Scholar] [CrossRef]
- Li, J.; Yang, X.; Sitzenfrei, R. Rethinking the framework of smart water system: A review. Water 2020, 12, 412. [Google Scholar] [CrossRef]
- Stewart, R.A.; Nguyen, K.; Beal, C.; Zhang, H.; Sahin, O.; Bertone, E.; Vieira, A.S.; Castelletti, A.; Cominola, A.; Giuliani, M. Integrated intelligent water-energy metering systems and informatics: Visioning a digital multi-utility service provider. Environ. Model. Softw. 2018, 105, 94–117. [Google Scholar] [CrossRef]
- Sivaiah, N.; Sowmya, K.; Susmitha, K.; Sai, N.A.; Suma, N. Internet of things (Iot) enabled water monitoring system. Iconic Res. Eng. J. 2018, 1, 40–43. [Google Scholar]
- Perumal, T.; Sulaiman, M.N.; Leong, C.Y. Internet of Things (IoT) enabled water monitoring system. In Proceedings of the 2015 IEEE 4th Global Conference on Consumer Electronics (GCCE), Osaka, Japan, 27–30 October 2015; pp. 86–87. [Google Scholar]
- AlMetwally, S.A.H.; Hassan, M.K.; Mourad, M.H. Real time internet of things (IoT) based water quality management system. Procedia CIRP 2020, 91, 478–485. [Google Scholar] [CrossRef]
- Joseph, J.; Manju, K.; Sajith, M.; Nair, S.; Viay, V.P.; Krishnan, S. Water management system using IoT. Int. Res. J. Eng. Technol. 2018, 5, 1887–1890. [Google Scholar]
- Qiao, N.; Fang, L.; Mu, L. Evaluating the impacts of water resources technology progress on development and economic growth over the Northwest, China. PLoS ONE 2020, 15, e0229571. [Google Scholar] [CrossRef]
- Yang, X.; Chen, W.; Jiang, M.; Jiang, P.; Shen, X. Dual effects of technology change: How does water technological progress affect China’s water consumption? iScience 2022, 25, 104629. [Google Scholar] [CrossRef]
- Qiao, N.; Yue, A.; Guan, H.; Mu, L.; Ding, Y. How effective is water technology as a water scarcity remedy for the economy in China? Water 2022, 14, 3056. [Google Scholar] [CrossRef]
- Molinos-Senante, M.; Maziotis, A. Drivers of productivity change in water companies: An empirical approach for England and Wales. Int. J. Water Resour. Dev. 2020, 36, 972–991. [Google Scholar] [CrossRef]
- Hu, J.-L.; Wang, S.-C.; Yeh, F.-Y. Total-factor water efficiency of regions in China. Resour. Policy 2006, 31, 217–230. [Google Scholar] [CrossRef]
- Zhong, S.; Li, A.; Wu, J. The total factor productivity index of freshwater aquaculture in China: Based on regional heterogeneity. Environ. Sci. Pollut. Res. 2022, 29, 15664–15680. [Google Scholar] [CrossRef]
- Molinos-Senante, M.; Maziotis, A.; Sala-Garrido, R. Assessment of the total factor productivity change in the English and Welsh water industry: A Färe-primont productivity index approach. Water Resour. Manag. 2017, 31, 2389–2405. [Google Scholar] [CrossRef]
- Zou, D.; Cong, H. Evaluation and influencing factors of China’s industrial water resource utilization efficiency from the perspective of spatial effect. Alex. Eng. J. 2021, 60, 173–182. [Google Scholar] [CrossRef]
- Liao, M.; Ren, Y. The ‘double-edged effect’of progress in energy-biased technology on energy efficiency: A comparison between the manufacturing sector of China and Japan. J. Environ. Manag. 2020, 270, 110794. [Google Scholar] [CrossRef]
- Geetha, S.; Gouthami, S. Internet of things enabled real time water quality monitoring system. Smart Water 2016, 2, 1. [Google Scholar] [CrossRef]
- Idachaba, F.E.; Olowoleni, J.O.; Ibhaze, A.E.; Oni, O.O. IoT enabled real-time fishpond management system. In Proceedings of the World Congress on Engineering and Computer Science, San Francisco, CA, USA, 25–27 October 2017; pp. 25–27. [Google Scholar]
- Bdour, A.N.; Hamdi, M.R.; Tarawneh, Z. Perspectives on sustainable wastewater treatment technologies and reuse options in the urban areas of the Mediterranean region. Desalination 2009, 237, 162–174. [Google Scholar] [CrossRef]
- Al Hamedi, F.H.; Kandhan, K.; Liu, Y.; Ren, M.; Jaleel, A.; Alyafei, M.A.M. Wastewater irrigation: A promising way for future sustainable agriculture and food security in the United Arab Emirates. Water 2023, 15, 2284. [Google Scholar] [CrossRef]
- He, K.; Mi, Z.; Coffman, D.M.; Guan, D. Using a linear regression approach to sequential interindustry model for time-lagged economic impact analysis. Struct. Change Econ. Dyn. 2022, 62, 399–406. [Google Scholar] [CrossRef]
- Pesaran, M.H. General diagnostic tests for cross section dependence in panels. Cambridge Working Paper. Economics 2004, 1240, 1. [Google Scholar]
- Pesaran, M.H. Testing weak cross-sectional dependence in large panels. Econom. Rev. 2015, 34, 1089–1117. [Google Scholar] [CrossRef]
- Pesaran, M.H.; Yamagata, T. Testing slope homogeneity in large panels. J. Econom. 2008, 142, 50–93. [Google Scholar] [CrossRef]
- Pesaran, M.H. A simple panel unit root test in the presence of cross-section dependence. J. Appl. Econom. 2007, 22, 265–312. [Google Scholar] [CrossRef]
- Chandio, A.A.; Ozdemir, D.; Gokmenoglu, K.K.; Usman, M.; Jiang, Y. Digital agriculture for sustainable development in China: The promise of computerization. Technol. Soc. 2024, 76, 102479. [Google Scholar] [CrossRef]
- Binder, M.; Coad, A. From Average Joe’s happiness to Miserable Jane and Cheerful John: Using quantile regressions to analyze the full subjective well-being distribution. J. Econ. Behav. Organ. 2011, 79, 275–290. [Google Scholar] [CrossRef]
- Machado, J.A.; Silva, J.S. Quantiles via moments. J. Econom. 2019, 213, 145–173. [Google Scholar] [CrossRef]
- Chandio, A.A.; Amin, A.; Khan, I.; Rehman, A.; Memon, A. Can digitalization improve agriculture? Exploring the impact of ICT on grain food production in SAARC countries. Inf. Dev. 2024, 02666669231225945. [Google Scholar] [CrossRef]
- Galvao, A.F.; Kato, K. Quantile regression methods for longitudinal data. In Handbook of Quantile Regression; Chapman and Hall/CRC: Boca Raton, FL, USA, 2017; pp. 363–380. [Google Scholar]
- Liao, W. How does the digital economy affect the development of the green economy? Evidence from Chinese cities. PLoS ONE 2023, 18, e0289826. [Google Scholar] [CrossRef]
- Jawa, H.; Chaichi, K. Factors influencing consumer behavior towards online shopping in Saudi Arabia. Int. J. Multicult. Multireligious Underst. 2015, 2, 1–10. [Google Scholar] [CrossRef][Green Version]
- Antwi, S.H.; Rolston, A.; Linnane, S.; Getty, D. Communicating water availability to improve awareness and implementation of water conservation: A study of the 2018 and 2020 drought events in the Republic of Ireland. Sci. Total Environ. 2022, 807, 150865. [Google Scholar] [CrossRef]
- Tan, W.C.; Sidhu, M.S. Review of RFID and IoT integration in supply chain management. Oper. Res. Perspect. 2022, 9, 100229. [Google Scholar] [CrossRef]
- Litvinenko, V. Digital economy as a factor in the technological development of the mineral sector. Nat. Resour. Res. 2020, 29, 1521–1541. [Google Scholar] [CrossRef]
- Jagtap, S.; Garcia-Garcia, G.; Rahimifard, S. Optimisation of the resource efficiency of food manufacturing via the Internet of Things. Comput. Ind. 2021, 127, 103397. [Google Scholar] [CrossRef]
- Zhang, T.; Guna, A.; Yu, W.; Shen, D. The recycled water use policy in China: Evidence from 114 cities. J. Clean. Prod. 2022, 344, 131038. [Google Scholar] [CrossRef]
- Lee, K.; Jepson, W. Drivers and barriers to urban water reuse: A systematic review. Water Secur. 2020, 11, 100073. [Google Scholar] [CrossRef]
- Bichai, F.; Grindle, A.K.; Murthy, S.L. Addressing barriers in the water-recycling innovation system to reach water security in arid countries. J. Clean. Prod. 2018, 171, S97–S109. [Google Scholar] [CrossRef]
- Cherchi, C.; Kesaano, M.; Badruzzaman, M.; Schwab, K.; Jacangelo, J.G. Municipal reclaimed water for multi-purpose applications in the power sector: A review. J. Environ. Manag. 2019, 236, 561–570. [Google Scholar] [CrossRef]
- Hosseinnejad, A.; Saboohi, Y.; Zarei, G.; Shayegan, J. An exergoeconomic-based method for forming water quality pyramid and assessing the sustainability of recycling processes—A greenhouse case study. Sustain. Energy Technol. Assess. 2023, 59, 103408. [Google Scholar] [CrossRef]
- Bischel, H.N.; Simon, G.L.; Frisby, T.M.; Luthy, R.G. Management experiences and trends for water reuse implementation in Northern California. Environ. Sci. Technol. 2012, 46, 180–188. [Google Scholar] [CrossRef]
- Radcliffe, J.C.; Page, D. Water reuse and recycling in Australia—History, current situation and future perspectives. Water Cycle 2020, 1, 19–40. [Google Scholar] [CrossRef]
- Li, L.; Liu, X.; Zhang, X. Public attention and sentiment of recycled water: Evidence from social media text mining in China. J. Clean. Prod. 2021, 303, 126814. [Google Scholar] [CrossRef]
- Yan, H.; Hui, X.; Li, M.; Xu, Y. Development in sprinkler irrigation technology in China. Irrig. Drain. 2020, 69, 75–87. [Google Scholar] [CrossRef]
- Zhang, Y.; Deng, J.; Qin, B.; Zhu, G.; Zhang, Y.; Jeppesen, E.; Tong, Y. Importance and vulnerability of lakes and reservoirs supporting drinking water in China. Fundam. Res. 2023, 3, 265–273. [Google Scholar] [CrossRef] [PubMed]
- Zhao, Y.; Li, M. Effect of water-saving society policy on water consumption in the cities of china: A propensity score matching analysis. Int. J. Environ. Res. Public Health 2020, 17, 8171. [Google Scholar] [CrossRef]
- Tian, K.; Wang, H.; Wang, Y. Investigation and evaluation of water literacy of urban residents in China based on data correction method. Water Policy 2021, 23, 77–95. [Google Scholar] [CrossRef]
- Hao, Y.; Hu, X.; Chen, H. On the relationship between water use and economic growth in China: New evidence from simultaneous equation model analysis. J. Clean. Prod. 2019, 235, 953–965. [Google Scholar] [CrossRef]
- Gu, A.; Zhang, Y.; Pan, B. Relationship between industrial water use and economic growth in China: Insights from an environmental Kuznets curve. Water 2017, 9, 556. [Google Scholar] [CrossRef]
Disclaimer/Publisher’s Note: The statements, opinions and data contained in all publications are solely those of the individual author(s) and contributor(s) and not of MDPI and/or the editor(s). MDPI and/or the editor(s) disclaim responsibility for any injury to people or property resulting from any ideas, methods, instructions or products referred to in the content. |
© 2025 by the authors. Licensee MDPI, Basel, Switzerland. This article is an open access article distributed under the terms and conditions of the Creative Commons Attribution (CC BY) license (https://creativecommons.org/licenses/by/4.0/).

