Abstract
Cultural ecosystem services (CES) represent fundamental expressions of human-environment interactions. A comprehensive assessment of CES supply and demand offers a robust scientific foundation for optimizing the transformation of ecosystem service values to improve human well-being. This study integrates multi-source datasets and employs Maximum Entropy (MaxEnt) modeling with the ArcGIS platform to analyze the spatial distribution of CES supply and demand in Hunan Province, a typical mountain tourism regions in China. Furthermore, geographical detector methods were used to identify and quantify the driving factors influencing these spatial patterns. The findings reveal that: (1) Both CES supply and demand demonstrate pronounced spatial heterogeneity. High-demand areas are predominantly concentrated around prominent scenic locations, forming a “multi-core, clustered” pattern, whereas high-supply areas are primarily located in urban centers, water systems, and mountainous regions, exhibiting a gradient decline along transportation corridors and river networks. (2) According to the CES supply-demand pattern, Hunan Province can be classified into demand, coordination, and enhancement zones. Coordination zones dominate (45–70%), followed by demand zones (20–30%), while enhancement zones account for the smallest proportion (5–20%). (3) Urbanization intensity and land use emerged as the primary drivers of CES supply-demand alignment, followed by vegetation cover, distance to water bodies, and population density. (4) The explanatory power of two-factor interactions across all eight CES categories surpasses that of any individual factor, highlighting the critical role of synergistic multi-factorial influences in shaping the spatial pattern of CES. This study provides a systematic analysis of the categories and driving factors underlying the spatial alignment between CES supply and demand in Hunan Province. The findings offer a scientific foundation for the preservation of ecological and cultural values and the optimization of spatial patterns in mountain tourist areas, while also serving as a valuable reference for the large-scale quantitative assessment of cultural ecosystem services.
1. Introduction
Cultural ecosystem services (CES) encompass the non-material benefits that humans derive from ecosystems, including spiritual enrichment, cognitive development, introspection, recreation, and esthetic appreciation, as defined by the Millennium Ecosystem Assessment [1]. CES are increasingly recognized as essential to human well-being across diverse socioeconomic contexts, particularly in industrialized nations, where their demand is projected to exceed that of other ecosystem service categories [2,3]. This growing demand is largely driven by a societal shift toward greater investment in leisure and recreational activities [4]. Yet, despite their widespread recognition and strong public support—as consistently demonstrated in perception-based studies—CES remain significantly underrepresented in policy and land use planning. Decision-makers frequently prioritize economic growth or ecological conservation, often at the expense of cultural dimensions embedded within ecosystems [5]. This persistent gap highlights the need for a science-based decision-making framework that explicitly incorporates both the spatial heterogeneity of CES and the dynamics of supply-demand relationships. Such a framework is critical for promoting sustainable ecosystem management while ensuring that cultural values are systematically integrated into environmental governance and policy-making.
To date, a substantial body of research has systematically elucidated CES through a wide array of conceptual frameworks and methodological approaches. Many of these studies employed monetary valuation techniques, such as the travel cost method, contingent valuation, and willingness-to-pay models, to assess CES demands [6,7,8]. However, these methods are predominantly suited to CES categories with explicit economic value, particularly recreation and tourism [9], and often fail to capture the multifaceted and intrinsic values of CES. In response to the limitations inherent in monetary approaches, scholars have increasingly adopted non-monetary evaluation techniques, including preference-based surveys [10], biophysical indices [11], and participatory mapping [12]. Although these approaches are more reflective of actual user perceptions and values, their effectiveness is constrained by issues such as subjectivity, limited sample representativeness, high costs, and challenges in quantification [13]. Concurrently, the supply capacity of CES is primarily assessed using value accounting techniques [14], land use matrix approaches [15], and simulation-based modeling methods [16]. Nevertheless, despite the growing volume of research in this domain, existing evidence on the non-material dimensions of human-nature interactions remains highly fragmented, particularly concerning their actual linkages to human well-being and the ways in which these relationships are expressed. This fragmentation largely stems from the inherently context-specific nature of both non-material CES provision and their associated contributions to well-being, which poses significant challenges for generalization and hinders the development of a coherent and scalable analytical framework across different geographic and sociocultural contexts [17].
A precise evaluation of the supply and demand of CES is essential for understanding their interconnections with human well-being. However, the intangible and non-consumptive characteristics of CES present considerable methodological challenges [18]. Recent developments in computational technologies, coupled with the increasing availability of large-scale online data, offer promising opportunities to overcome these constraints [19]. With the accelerated proliferation of smart technologies and widespread internet accessibility, digital platforms that facilitate route planning and user-generated content have emerged as pivotal instruments that influence tourist decision-making processes [20]. These platforms disseminate comprehensive information about destinations, including user ratings, reviews, and travel recommendations. The data generated through these interactions encapsulate visitors’ experiences and perceptions across multiple dimensions, offering an innovative and scalable means of understanding and quantifying CES [21]. In this context, the MaxEnt model offers distinct methodological advantages. By integrating geospatial data with environmental variables, the model enables both the quantitative estimation of regional CES supply potential [22] and the generation of response curves that reflect the sensitivity of the CES supply to environmental gradients [23]. These capabilities constitute a robust analytical framework for exploring supply-demand dynamics. For instance, Chen et al. [24] employed the MaxEnt model alongside multi-source datasets to evaluate the spatiotemporal dynamics of recreational services in Beijing’s urban green spaces. Similarly, Zhao et al. [16] integrated MaxEnt modeling with social media data to examine CES coupling patterns within the Wuling Mountain conservation area.
Environmental variables constitute essential inputs for the operation of MaxEnt, with variations in dataset composition and the number of variables exerting a significant impact on model performance and predictive accuracy [25]. Nevertheless, most MaxEnt applications in CES assessment emphasize natural geographic attributes and spatial distance metrics [26,27,28], whereas socioeconomic indicators reflecting human activities and anthropogenic disturbances are frequently underrepresented. This disproportion may compromise the comprehensiveness and accuracy of potential CES evaluations. Furthermore, current research on CES supply-demand dynamics primarily focuses on localized, high-service areas, such as urban parks, watersheds, rural settlements, and protected regions [29,30]. Consequently, investigations conducted at broader spatial scales remain limited, thereby constraining the understanding of the large-scale spatial heterogeneity that characterizes CES distribution and demand.
Mountain tourism is crucial to the development of regional tourism [31]. According to the Asia-Pacific Mountain Tourism Development Report (2025 Edition), mountain tourism attracts approximately 375 million tourists annually, contributing 15% to 20% of global tourism revenue. Benefiting from high-quality ecological environments and abundant cultural resources, mountain tourism destinations are increasingly favored by tourists seeking a return to nature and cultural experiences. As a key ecological security zone in central China, Hunan Province possesses abundant mountain ecological resources, providing a solid foundation for the sustained enhancement of mountain ecosystem functions. However, the inherent fragility of mountain ecosystems, coupled with the rapid increase in tourism-driven CES demand, has intensified the imbalance between the supply and demand of CES in the region [32]. Therefore, identifying critical CES conflict zones and developing systematic coordination strategies are essential to achieving synergy between ecological conservation and tourism development, optimizing natural resource allocation, and promoting the sustainable evolution of mountain tourism systems.
Against this background, this study selected Hunan Province as a representative mountain tourism area to test the following hypotheses: (1) Whether the MaxEnt model is applicable and effective in evaluating the supply capacity of CES at a large-scale regions; (2) Whether there is significant spatial heterogeneity in hot and cold areas of supply and demand across different CES categories; (3) Whether socioeconomic factors such as urbanization intensity have a significant impact on the supply capacity and the spatial configuration of CES supply-demand patterns.
2. Materials and Methods
2.1. Study Area Overview
Hunan Province (108°47′–114°15′ E, 24°38′–30°08′ N), located in the middle reaches of the Yangtze River, serves as a strategic transition zone between China’s eastern coastal region and its western inland areas. Covering 211,800 km2, the province features a mountainous terrain enclosing its eastern, southern, and western boundaries, accounting for more than half of its land area (Figure 1). Hunan hosts rich natural and cultural resources, including two UNESCO World Natural Heritage Sites—Zhangjiajie and Langshan—and landmarks such as Mount Heng, the Xiang River, and Dongting Lake. As the birthplace of revolutionary leaders Mao Zedong and Liu Shaoqi and home to eight ethnic groups (e.g., Tujia, Miao, Dong), Hunan embodies both historical and ethnocultural diversity. These attributes have shaped a distinctive cultural landscape and positioned the province as a major tourism destination, receiving 658 million visitors and generating RMB 956.52 billion in revenue in 2023.
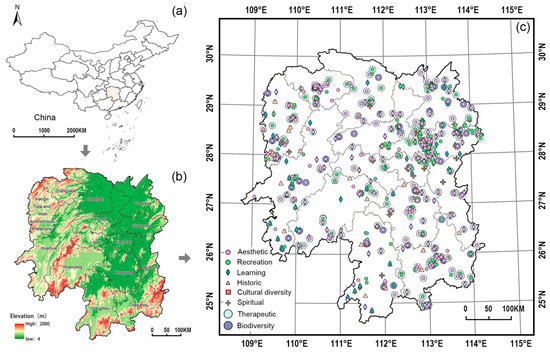
Figure 1.
(a–c) Overview of the study area and spatial distribution map of scenic spots in Hunan Province.
2.2. Overall Research Framework
Based on social media data and multiple analytical models, this study developed an integrated framework for assessing and mapping the supply-demand pattern of CES (Figure 2). The framework comprises four key components: (1) Building CES types indicators; (2) Evaluating and mapping the demand level and supply capacity of CES; (3) Analyzing the spatial distribution characteristics of CES supply-demand matching; (4) identifying and examining the major driving factors influencing the CES supply-demand pattern.
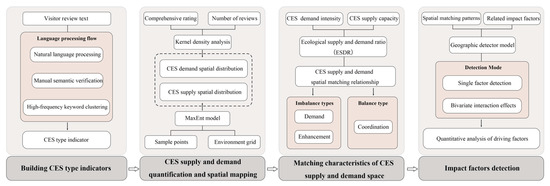
Figure 2.
Schematic representation of the integrated methodological framework for the evaluation and spatial mapping of CES.
2.3. Data Collection and Processing
To analyze the supply and demand pattern of different CES in Hunan Province, a comprehensive multi-source database was established, integrating attraction data, user evaluation related data and environmental raster data (Table 1).

Table 1.
Data collection and processing.
2.3.1. Attraction Data
Attraction data were collected from the Ctrip platform and Baidu Maps API [v 3.0] to support spatial analysis. The dataset included all officially registered tourist attractions in Hunan Province with corresponding names, coordinates, and administrative divisions. After spatial correction and data cleaning, 946 validated attractions were retained, providing a solid basis for CES supply–demand analysis.
2.3.2. User Review Data
To quantify the level of CES demand, user-generated content (UGC) from the Ctrip platform (updated to June 2024) was extracted using Python-based web scraping and preprocessing procedures. To ensure representativeness and reduce noise, samples with fewer than 10 reviews or missing rating values were excluded. Textual data were rigorously filtered by retaining only the most recent valid review per user ID and removing irrelevant, off-topic, or exaggerated comments [33].
2.3.3. Environmental Variables
To accurately simulate the supply capacity of CES, environmental variables for the MaxEnt model were selected from three dimensions—natural environment, spatial accessibility, and socio-economic factors—based on the characteristics of Hunan Province. All variables were standardized, and multicollinearity testing in SPSS 27.0 showed VIF values below 3, indicating acceptable independence for subsequent modeling.
2.4. Analytical Methods
2.4.1. Construction of the CES Classification Framework
To analyze differences in supply–demand patterns of different CES types, a localized CES classification was developed based on the Millennium Ecosystem Assessment framework [34] and the regional characteristics of Hunan Province. Specifically: (1) extracting high-frequency keywords from UGC data; (2) screening and determining representative keywords through natural language processing (NLP) technology and manual semantic verification; (3) thematically clustering the keywords, based on which 946 scenic spots were divided into eight types of CES (Table 2).
Table 2.
The basis for CES-type classification in Hunan province and the number of attractions included.
2.4.2. Quantification and Spatial Mapping of CES Demand
To quantify CES demand in Hunan Province, this study integrated two key indicators derived from the Ctrip platform: the composite rating of attractions (visitor satisfaction) and the number of user reviews (public attention and visitation frequency). These metrics jointly represent public preference intensity across CES categories [35]. For attractions associated with multiple CES attributes, each site was assigned to all relevant categories to capture the multidimensional nature of CES perception [36]. To minimize bias from extreme variations in review counts, a stratified weighting scheme was applied: [10–20] = 10; [21–100] = 20; [101–500] = 30; [501–1000] = 40; [>1000] = 50. Sensitivity analysis indicated that spatial patterns of CES demand remained stable across weighing intervals, confirming the robustness of the scheme. The CES demand value was calculated as:
where denotes the CES demand value of site i; represents the composite rating score; and is the review-weighted value derived from the total review counts.
To visually reveal the spatial clustering characteristics of CES demand, kernel density estimation was applied to map its spatial distribution. To improve regional comparability, the density surface was reclassified using the quantile method: the top 20% were defined as high-demand areas, the middle 60% as medium-demand areas, and the bottom 20% as low-demand areas, assigned demand indices of 3, 2, and 1, respectively.
2.4.3. Quantification and Spatial Mapping of CES Supply
To quantify the spatial distribution of CES supply in Hunan Province, this study employed the MaxEnt model. The model estimates occurrence probabilities by contrasting known sample points with background environmental attributes [37]. Owing to its low parameter dependence and high robustness, MaxEnt is well suited to large-scale CES studies characterized by limited or unevenly distributed samples.
Geographic coordinates of CES samples and environmental raster data were standardized in ArcGIS 10.8 and exported in CSV and ASC formats for MaxEnt modeling. To ensure the reliability of model evaluation, 75% of samples were used for training and 25% for validation, with the Bootstrap method applied for 10 iterations to obtain mean results [38]. Model performance was evaluated using the Area Under the Receiver Operating Characteristic Curve (AUC), where values closer to 1 indicate better performance. The resulting ASCII raster representing CES supply potential was imported into ArcGIS for visualization, and classified into high, medium, and low supply levels (indices 3, 2, and 1) using the quantile method to generate CES supply hotspot maps.
2.4.4. Analysis of CES Supply and Demand Alignment
To quantitatively assess spatial mismatches between CES supply and demand in Hunan Province, the Ecological Supply–Demand Ratio (ESDR) was used as the core evaluation metric. The ESDR is a widely recognized indicator that measures the balance between CES supply and demand, providing an intuitive quantification of regional surpluses or deficits [39]. The ESDR was calculated as follows:
In this equation, ESDR denotes the CES supply–demand ratio, where S and D are the normalized values of supply and demand, respectively, and Smax and Dmax correspond to their maximum normalized values. The ESDR ranges from −1 to 1: positive values indicate supply exceeds demand, values near zero indicate balance, and negative values indicate a supply shortfall.
Based on the calculated ESDR values, the spatial pattern of CES supply and demand in Hunan Province was classified into three categories: demand zones (ESDR < 0), coordination zones (ESDR = 0), and enhancement zones (ESDR > 0).
2.4.5. Analysis of Factors Influencing Supply-Demand Matching
To explore the mechanisms driving the spatial distribution of CES supply and demand, this study applied the GeoDetector model. The model quantifies the explanatory power of potential drivers by assessing spatial consistency between dependent and independent variables based on spatial stratified heterogeneity [40]. Free from linear assumptions, GeoDetector effectively captures nonlinear and non-normal relationships, enabling robust interpretation of complex socio-ecological interactions.
The analytical procedure was as follows. First, multiple environmental raster datasets and the pattern distribution of CES supply and demand were preprocessed in GIS. To improve analytical precision and spatial resolution, the study area was divided into uniform grid cells of 5000 × 5000 m using the Create Fishnet tool in ArcGIS 10.8. After removing incomplete edge cells, a total of 8480 valid analysis units were retained. Subsequently, using the Spatial Analyst tool, ESDR values and environmental variables were extracted from each cell centroid and exported for analysis. Finally, the standardized dataset was analyzed using the GeoDetector model to quantitatively assess the influence of each environmental factor on the spatial pattern of CES supply and demand in Hunan Province and to identify the dominant driving factors.
3. Results
3.1. Spatial Patterns of CES Demand
The spatial distribution of CES demand across Hunan Province exhibits pronounced heterogeneity among the eight evaluated CES categories (Figure 3). High-demand areas are primarily concentrated around urban hubs and major scenic locales, collectively forming a characteristic multi-nodal spatial configuration. Among all categories, high-demand areas for biodiversity and learning services were the most extensive, accounting for 13.7% and 13.2% of the province’s total area, respectively, while spiritual services exhibited the smallest spatial extent (3.0%). The remaining categories ranked by the proportion of high-demand areas were as follows: therapeutic (12.1%), esthetic (11.0%), historic (10.1%), cultural diversity (8.8%), and recreation (6.9%).
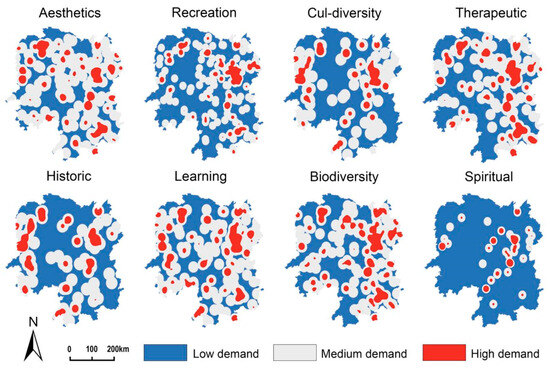
Figure 3.
Spatial distribution patterns of demand for eight categories of CES in Hunan province.
Distinct spatial patterns were evident for various categories of CES: (1) Demand for esthetic and learning services was concentrated in ecologically scenic areas such as Mangshan, Hengshan, and the Dehang Grand Canyon, where magnificent landscapes and unique landforms are regarded as key sources of natural beauty and environmental knowledge. (2) Recreational demand was predominantly focused in urbanized areas, closely associated with high population density and economic development, particularly within the Chang-Zhu-Tan metropolitan area. (3) Historic and cultural diversity demands were mainly distributed in regions rich in historical landmarks and cultural heritage, including Chang-Zhu-Tan, Hengyang, and Xiangxi. (4) Therapeutic and biodiversity demands were prominent along the Xiang River, Dongting Lake ecological corridor, and key ecological regions such as Wuling Mountains and Nanling Mountains. These areas serve as critical habitats and align with public demand for nature-based health benefits. (5) Spiritual service demand exhibited a linear distribution pattern associated with well-known religious landmarks, extending across Changsha, Xiangtan, Hengyang, and Yongzhou.
3.2. Spatial Patterns of CES Supply
The AUC values of both the training and validation datasets in the MaxEnt model exceeded 0.85, with more than half of them above 0.90, indicating high predictive accuracy and model stability [41] (Table 3). The model outputs revealed that all eight categories of CES in Hunan Province exhibited substantial supply potential. High-supply areas predominantly concentrated across urban centers, major water systems, mountain ranges, and cultural heritage sites, extending outward along transportation networks and water systems, with supply capacity gradually decreasing across space (Figure 4). Among the various services, esthetic and therapeutic services constitute the largest proportion (19.7%), followed by biodiversity (19.0%), recreation and learning services (18.8%), while spiritual services exhibited the smallest share (9.3%).
Table 3.
The area under the characteristic curve (AUC) values of the standard deviation, training subset, and testing subset of the eight types of cultural services in Hunan province.
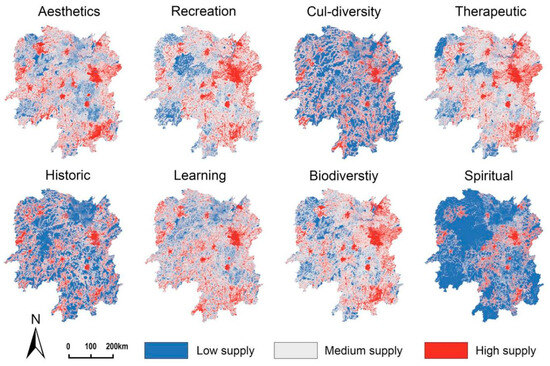
Figure 4.
Spatial distribution patterns of supply for eight categories of CES in Hunan province.
Distinct spatial characteristics were observed among different CES supply types: (1) Esthetic, therapeutic, and biodiversity high-supply areas were predominantly provided in ecologically superior lake and mountain regions, such as Dongting Lake, Tianmen Mountain, and Mangshan. (2) Recreational services were mainly concentrated in the central areas of economically developed cities, particularly Changsha, Yueyang, Changde, and Hengyang. (3) Learning, historic, and cultural diversity services were primarily sustained by national and provincial historical and cultural cities and their surrounding areas, notably Changsha, Fenghuang County, Yueyang, and Yongzhou. (4) Spiritual services were distributed in regions with a rich religious heritage and a high density of sacred sites, such as Changsha, Hengyang, Chenzhou, and Xiangxi.
3.3. Spatial Patterns of CES Supply and Demand
In the overall spatial distribution of various CES categories in Hunan Province, coordination zones constituted the largest proportion (45–70%), followed by demand zones (20–30%), with enhancement zones accounting for the smallest share (5–20%). (Figure 5 and Figure 6; Table 4). This pattern indicates that although CES supply is generally adequate across the province, certain areas continue to experience issues such as underutilization of resources and low efficiency in CES value transformation. The detailed findings are as follows:
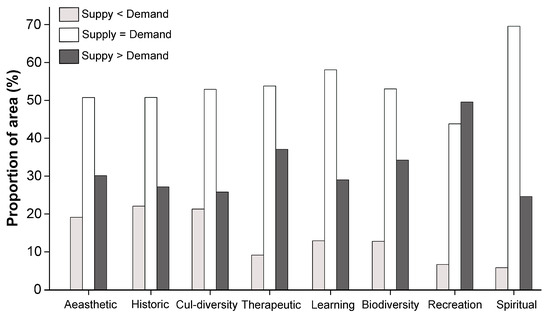
Figure 5.
Supply-demand matching types and the proportion of area for eight categories of cultural service in Hunan province.
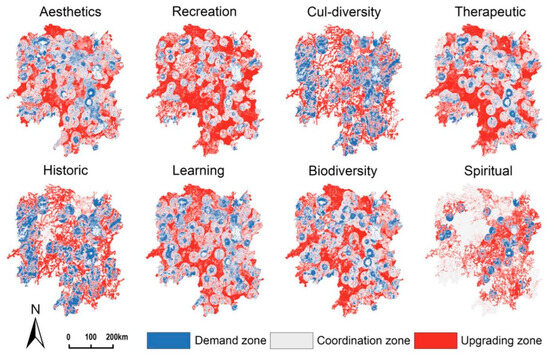
Figure 6.
Spatial distribution patterns of supply-demand matching across eight categories of CES in Hunan province.
Table 4.
Eight categories of cultural service supply-demand matching types and the proportion of area in Hunan province.
3.3.1. Demand Zones
The demand zones for different CES categories in Hunan Province were relatively limited in extent, generally characterized by a “low-supply–medium-demand” structure. Among all service types, (1) historic (22.1%), cultural diversity (21.3%), and esthetics (19.1%) had the largest demand zones, mainly distributed in culturally rich regions such as Xiangxi, Yongzhou, Changde, and Yueyang County. (2) Learning (12.9%) and biodiversity (12.8%) demand zones exhibited considerable spatial overlap, concentrated in ecologically favorable areas such as Wuling Mountains, Mount Heng, and Dongting Lake. (3) Recreational demand zones (6.7%) were mostly located in the buffer areas surrounding major scenic attractions, including Xiangxi, Wulingyuan, and Yueyang Tower. (4) Therapeutic demand zones (9.1%) were clustered around Junshan Island, Mangshan, and hot spring areas such as Jiangya and Haitang. (5) Spiritual demand zones accounted for the smallest proportion (5.8%), dispersed among well-known religious sites including Nanyue Temple, Wanfosi Temple, and Bailu Temple.
Overall, CES demand zones tended to cluster around scenic areas with superior natural conditions and convenient transportation, reflecting high service demand and increasing resource pressure driven by tourism development.
3.3.2. Coordination Zones
Coordination zones dominated the spatial structure of CES in Hunan Province, primarily characterized by a “moderate-supply–medium-demand” pattern. Specifically, spiritual coordination zones accounted for the highest proportion (69.6%), mainly concentrated in Xiangxi, while recreational coordination zones occupied the smallest share (43.8%), predominantly distributed along the Xiang River Basin. Cultural diversity (52.8%) and historic value (50.8%) coordination zones were concentrated in the peripheral counties of Shaoyang, Loudi, Zhangjiajie, Changde, and Chenzhou. These areas, though relatively limited in cultural infrastructure, have low population densities and moderate CES demand, which helps maintain supply-demand equilibrium. The coordination zones of other CES categories were more scattered.
In general, Hunan Province exhibited good overall CES coordination; however, targeted improvements remain necessary, particularly in recreational and historic services.
3.3.3. Enhancement Zones
Enhancement zones occupy over 20% of the land area, generally exhibiting a “medium-supply–low-demand” structure. Among all categories, Recreational services comprise the largest proportion (49.5%), followed by therapeutic (37.1%) and biodiversity (34.2%), while spiritual services hold the least proportion (24.6%). The proportions of other CES categories were relatively similar.
Spatially, the spiritual service enhancement zones formed a corridor linking Yueyang, Changsha, Loudi, and Shaoyang. The esthetic, recreational, learning, biodiversity, and therapeutic enhancement zones were mainly concentrated in the Wuling Mountains (Xiangxi), the Xuefeng Mountains (western Shaoyang), and the Luoxiao Mountains (eastern Chenzhou). These areas are rich in natural resources and ethnic cultural heritage; however, disadvantages such as poor transportation accessibility and low regional visibility limit the transformation and utilization of cultural services.
Overall, although the CES enhancement zones in Hunan Province possess a solid ecological and cultural resource foundation, the value of CES has not been fully realized due to constraints related to transportation accessibility, infrastructure development, and public awareness.
3.4. Detection of Driving Factors Influencing CES Supply-Demand Matching
3.4.1. Single-Factor Analysis
The single-factor analysis (Table 5) indicated that urbanization intensity and land use type are the primary drivers of the cultural ecosystem service (CES) supply–demand patterns in Hunan Province. Further analysis reveals that urbanization intensity plays a dominant role across multiple CES categories, exerting the strongest influence on esthetic and recreational services. Land use patterns profoundly shape regional cultural diversity, educational values, and historical heritage by regulating the continuity of cultural practices, integrity of heritage conservation, and structure of natural landscapes. In addition, NDVI, proximity to water bodies, and population density significantly contribute to the spatial heterogeneity of CES.
Table 5.
Geographic detector single factor detection results.
3.4.2. Interactions Among Driving Factors
The explanatory power of two-factor interactions exceeds that of any single factor in accounting for the supply–demand matching patterns of the eight CES categories in Hunan Province (Figure 7). These findings indicate that these patterns are governed by the synergistic effects of multiple factors rather than the linear influence of individual variables. Specifically, the interplay between factors influencing esthetic and learning values is primarily marked by nonlinear enhancement, whereas the other six CES categories mainly exhibit bi-factor enhancement patterns. Further investigation indicates that, except for spiritual services, the most significant interactive effects among the other seven CES categories consistently involve the NDVI (X6) paired with other variables. This highlights NDVI’s crucial role in influencing CES spatial distribution and underscores the fundamental ecological importance of vegetation cover.
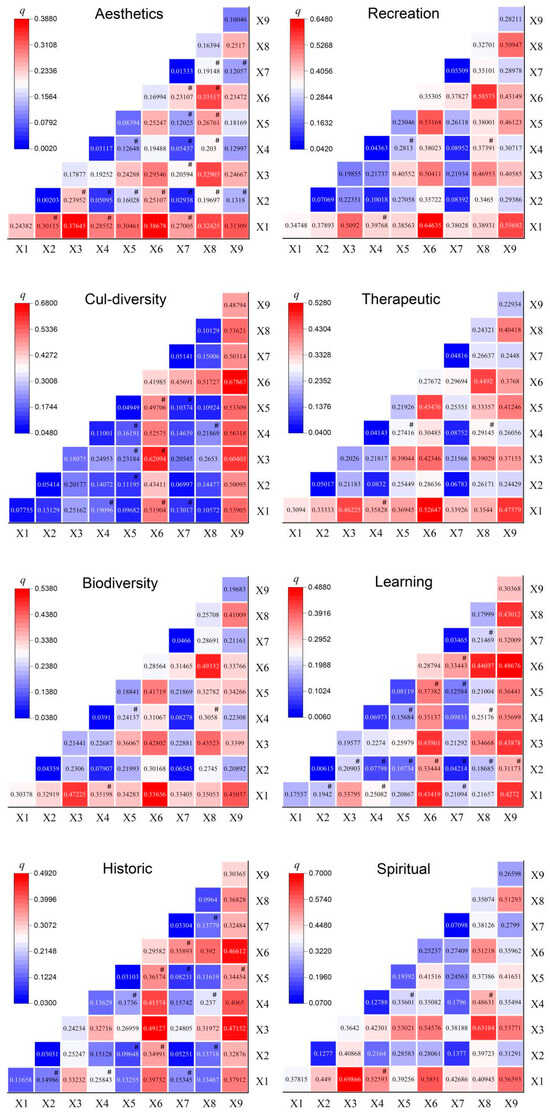
Figure 7.
Heatmap illustrating the interaction detection results for the eight categories of CES dual factors in Hunan province. # denotes nonlinear enhancement; no symbol indicates bivariate enhancement; X1: Urbanization intensity; X2: Elevation; X3: Distance to roads; X4: Distance to water bodies; X5: Per capita GDP; X6: Vegetation cover; X7: Slope; X8: Population density; X9: Land use.
4. Discussion
4.1. Regional-Scale Assessment of CES Supply and Demand
Discrepancies between the supply and demand of CES undermine both their ecological and social benefits [27]. Consequently, the spatial mapping of these mismatches is essential for evidence-based resource management and sustainable development planning. This study was conducted in Hunan Province and employed an integrated approach combining ArcGIS spatial analysis with the MaxEnt modeling framework to quantify supply and demand across eight CES categories. The analysis used a comprehensive dataset incorporating online tourist reviews, attraction ratings, and multi-source environmental variables. In contrast to prior research, which often focused on parks, urban green spaces, or nature reserves [29,30], this study fully incorporates social-media data, characterized by broad spatial coverage, high update frequency, and independence from administrative boundaries [22]. This integration enabled the fine-scale, province-wide mapping of CES supply-demand relationships, offering a scalable framework to inform regional coordination and ecological conservation strategies.
4.2. MaxEnt Model and Predictive Performance
This research advances previous applications of the MaxEnt model [24,26] by integrating socioeconomic indicators—namely, urbanization level, population density, and per capita gross domestic product (GDP)—into the suite of environmental variables, alongside biophysical and geographical factors. This comprehensive “nature–society” analytical framework strengthens the model’s ability to capture the multifaceted mechanisms governing the supply of CES and facilitates a deeper examination of the interactions between regional socioeconomic dynamics and ecosystem service provision. In this study, the model demonstrated high prediction accuracy, highlighting the robustness and reliability of the MaxEnt model in characterizing the spatial heterogeneity of CES supply and demand at the regional scale. The findings affirm that, even in regions with limited access to conventional statistical data, the distribution of CES can be effectively evaluated and spatially inferred by integrating social media data with machine learning methodologies.
4.3. Spatial Heterogeneity and Consistency Validation of CES Supply and Demand
The spatial distribution of CES supply and demand in Hunan Province exhibits pronounced heterogeneity, demonstrating a typical pattern of “concentrated urban demand and dispersed ecological supply.” This pattern is primarily driven by two factors: The process of urbanization has fostered concentrated demand for cultural consumption and activities, while natural resource endowments determine the potential and distribution of services from the supply side. This finding is highly consistent with the research results of Vrbičanová [42] and Alvarez-Codoceo [43], indicating that the spatial separation of supply and demand of CES is likely the inevitable result of the combined effects of urbanization and regional differentiation of natural endowments, revealing the fundamental division of labor in cultural service functions between urban and rural systems.
This study further reveals that balanced CES regions are primarily located in the transitional zones between cities and scenic spots. These areas feature both high population density and strong ecological foundations, effectively bridging concentrated cultural demand with continuous ecological supply. This “transition zone balance” aligns with the spatial flow model of cultural services proposed by Li [44], highlighting the pivotal role of urban fringes as “spatial carriers” and “functional hubs” for coordinating supply and demand. Rather than serving merely as buffers for urban overflow, these areas are key nodes for the transformation and circulation of ecological service values.
4.4. Drivers of CES Supply and Demand Patterns
GeoDetector analysis shows that urbanization intensity and land use structure are the primary determinants of the spatial pattern of CES supply and demand in Hunan Province, reinforcing the assertion that CES patterns are closely related to regional development gradients [45]. Urbanization drives the conversion of natural ecological spaces into construction land. This process systematically weakens the supply of cultural services while simultaneously driving up demand due to population and economic concentration. The resulting spatial imbalance between supply and demand reveals the inherent structural contradictions in cultural services during urbanization, highlighting the need for refined spatial governance and ecological planning to promote balanced regional development.
The results of the bivariate interaction detection further showed that the interaction between the Normalized Difference Vegetation Index (NDVI) and other driving factors exerted the strongest explanatory power, highlighting the critical role of vegetation cover in maintaining ecosystem service functions and regulating spatial supply-demand patterns [46]. Vegetation not only directly contributes to esthetic value and psychological well-being, but also plays a vital role in mitigating the urban heat island effect and enhancing ecological livability, underscoring its importance in sustaining balanced cultural ecosystem services across urban–rural gradients.
4.5. Implications for Planning Management
This study emphasizes that regional planning should be committed to coordinating the supply and demand of ecosystem services, comprehensively managing urban growth boundaries and ecological protection spaces, scientifically guiding the optimization of land use structure, and forming an ecological pattern with a reasonable layout and functional connectivity.
For Hunan Province, it is essential to develop region-specific strategies for tourism resource management to promote sustainable and high-quality tourism development. This can be advanced through three key approaches:
- (1)
- Optimize spatial layout and strengthen coordination. Given the significant spatial heterogeneity of high-value CES supply–demand areas, it is necessary to systematically identify the distribution and types of imbalanced regions, make rational use of transitional zones, and enhance spatial connectivity between high-supply and high-demand areas to achieve effective matching of tourism resources and regional synergy.
- (2)
- Enhance the supply capacity of demand-driven cultural service areas. By improving tourism infrastructure, diversifying products and routes, and advancing ecological restoration and environmental management, the growing demand from tourists can be effectively met.
- (3)
- Improve the value transformation efficiency of supply oriented cultural service areas. Through strategies such as digital promotion, collaborations with popular IPs, and improved transportation accessibility, the ecological and cultural advantages can be transformed into tourism attractiveness and economic benefits, thereby supporting the sustainable use of ecosystem services and the long-term development of the tourism industry.
4.6. Study Limitations and Future Research Directions
This study systematically reveals the spatial pattern and driving mechanism of CES supply and demand at the provincial level, but it also has certain limitations. First, the data mainly comes from user-generated content (UGC) on the Ctrip platform. Although it has advantages such as wide coverage and strong timeliness, its user group is mainly digitally active people, which may underestimate the cognition and demand of marginal groups such as the elderly and children for CES [47]. Second, although using the provincial level as the analysis unit helps to grasp the overall spatial heterogeneity, it is difficult to deeply reveal the socio-economic and governance mechanisms that lead to local supply and demand imbalances.
Future research can be improved in two aspects. At the data level, multi-data integration should be promoted to improve sample representativeness. Specifically, the following paths can be taken: (1) Integrate data from multiple tourism platforms to build a more comprehensive user portrait and correct single-source bias; (2) Combine offline survey methods (such as questionnaires or interviews for the elderly) to achieve mutual verification of online findings and offline cognition. At the scale level, it is recommended to conduct case studies in typical areas of supply and demand imbalance to enhance the actual explanatory power and policy applicability of the macro pattern and provide a more scientific and operational basis for regional ecological service management and sustainable tourism development.
5. Conclusions
Taking Hunan Province as a representative mountain tourism region, this study integrated multi-source data to analyze and detect the spatial matching patterns and driving factors of CES supply and demand. The main findings are as follows:
- (1)
- High-supply and -demand CES areas exhibit pronounced spatial heterogeneity. High-demand areas are characterized by a “multi-core, clustered” distribution centered on major scenic attractions, whereas high-supply areas predominantly cluster around urban hubs, water systems, and mountain ranges, extending outward along transportation corridors and river systems with a gradual decrease in intensity.
- (2)
- According to the CES supply-demand pattern, Hunan Province can be classified into demand, coordination, and enhancement zones. Coordination zones dominate (45–70%), followed by demand zones (20–30%), while enhancement zones account for the smallest proportion (5–20%).
- (3)
- Urbanization intensity and land use patterns constitute the major drivers of CES supply-demand congruence, followed by vegetation cover, proximity to water, and population density.
- (4)
- The explanatory power of two-factor interactions exceeds that of individual factors across all eight CES categories, highlighting the critical role of synergistic multi-factor in shaping the spatial patterns of CES.
The comprehensive research framework for CES supply and demand patterns constructed in this study is highly portable and scalable, providing a methodological reference for resource management and spatial planning in other mountainous regions. The research findings not only contribute to tourism development and ecological conservation practices in Hunan Province, but also provide practical analytical tools and decision-making support for promoting sustainable mountain tourism development globally.
Author Contributions
Conceptualization, Z.S., J.L. and Z.H.; methodology, Z.S., J.L. and Z.H.; software, Z.S.; Investigation, Z.S. and J.L.; Data curation, Z.S. and J.L.; formal analysis, Z.S. and J.L.; writing—original draft, Z.S. and Z.H.; writing—review and editing, J.L. and Z.H.; visualization, Z.S., and J.L.; supervision, Z.H.; project administration, Z.H.; funding acquisition, Z.H. All authors have read and agreed to the published version of the manuscript.
Funding
This research was funded by National Natural Science Foundation of China (Grant No. 32471596; 31700196) and Natural Science Foundation of Hunan Province (Grant No. 2020JJ5477).
Data Availability Statement
The data that support the findings of this study are openly available at Figshare: https://doi.org/10.6084/m9.figshare.30490046.
Conflicts of Interest
The authors declare no conflicts of interest.
References
- Sarukhán, J.; Whyte, A. (Eds.) Ecosystems and Human Well-Being: Synthesis (Millennium Ecosystem Assessment); Island Press: Washington, DC, USA; World Resources Institute: Washington, DC, USA, 2005. [Google Scholar]
- Carpenter, S.R.; Mooney, H.A.; Agard, J.; Capistrano, D.; DeFries, R.S.; Díaz, S.; Dietz, T.; Duraiappah, A.K.; OtengYeboah, A.; Miguel, H.; et al. Science for managing ecosystem services: Beyond the Millennium Ecosystem Assessment. Proc. Natl. Acad. Sci. USA 2009, 106, 1305–1312. [Google Scholar] [CrossRef]
- Ingold, K.; Zimmermann, W. How and why forest managers adapt to socio-economic changes: A case study analysis in Swiss forest enterprises. For. Policy Econ. 2011, 13, 97–103. [Google Scholar] [CrossRef]
- Tribe, J. The Economics of Recreation, Leisure and Tourism; Routledge: Oxfordshire, UK, 2020. [Google Scholar]
- De Groot, R.S.; Alkemade, R.; Braat, L.; Hein, L.; Willemen, L. Challenges in integrating the concept of ecosystem services and values in landscape planning, management and decision making. Ecol. Complex. 2010, 7, 260–272. [Google Scholar] [CrossRef]
- Funsten, C.; Di Franco, C.; Borsellino, V.; Surano, N.; Asciuto, A.; Schimmenti, E. The recreational value of botanic garden events: A case study of the Zagara plant fair in Palermo, Italy. J. Outdoor Recreat. Tour. 2022, 39, 100565. [Google Scholar] [CrossRef]
- Lausi, L.; Amodio, M.; Sebastiani, A.; Fusaro, L.; Manes, F. Assessing cultural ecosystem services during the COVID-19 pandemic at the garden of ninfa (Italy). Ann. Di Bot. 2022, 12, 63–75. [Google Scholar]
- Tian, Y.; Wu, H.; Zhang, G.; Wang, L.; Zheng, D.; Li, S. Perceptions of ecosystem services, disservices and willingness-to-pay for urban green space conservation. J. Environ. Manag. 2020, 260, 110140. [Google Scholar] [CrossRef] [PubMed]
- Cheng, X.; Van Damme, S.; Li, L.; Uyttenhove, P. Evaluation of cultural ecosystem services: A review of methods. Ecosyst. Serv. 2019, 37, 100925. [Google Scholar] [CrossRef]
- Gai, S.; Fu, J.; Rong, X.; Dai, L. Users’ views on cultural ecosystem services of urban parks: An importance-performance analysis of a case in Beijing, China. Anthropocene 2022, 37, 100323. [Google Scholar] [CrossRef]
- Cui, F.; Tang, H.; Zhang, Q.; Wang, B.; Dai, L. Integrating ecosystem services supply and demand into optimized management at different scales: A case study in Hulunbuir, China. Ecosyst. Serv. 2019, 39, 100984. [Google Scholar] [CrossRef]
- Smart, L.S.; Vukomanovic, J.; Sills, E.O.; Sanchez, G. Cultural ecosystem services caught in a ‘coastal squeeze’ between sea level rise and urban expansion. Glob. Environ. Change 2021, 66, 102209. [Google Scholar] [CrossRef]
- Buchel, S.; Frantzeskaki, N. Citizens’ voice: A case study about perceived ecosystem services by urban park users in Rotterdam, the Netherlands. Ecosyst. Serv. 2015, 12, 169–177. [Google Scholar] [CrossRef]
- Costanza, R.; d’Arge, R.; de Groot, R.; Farber, S.; Grasso, M.; Hannon, B.; Limburg, K.; Naeem, S.; O’Neill, R.V.; Paruelo, J.; et al. The value of the world’s ecosystem services and natural capital. Nature 1997, 387, 253–260. [Google Scholar] [CrossRef]
- Vihervaara, P.; Kumpula, T.; Tanskanen, A.; Burkhard, B. Ecosystem services—A tool for sustainable management of human–environment systems. Case study Finnish Forest Lapland. Ecol. Complex. 2010, 7, 410–420. [Google Scholar] [CrossRef]
- Zhao, Y.; You, W.; Lin, X.; He, D. Assessing the supply and demand linkage of cultural ecosystem services in a typical county-level city with protected areas in China. Ecol. Indic. 2023, 147, 109992. [Google Scholar] [CrossRef]
- Gould, R.K.; Schultz, P. Challenges to understanding nonmaterial dimensions of human-nature connections, and how to address them. Ecol. Soc. 2021, 26, 14. [Google Scholar] [CrossRef]
- Bing, Z.; Qiu, Y.; Huang, H.; Chen, T.; Zhong, W.; Jiang, H. Spatial distribution of cultural ecosystem services demand and supply in urban and suburban areas: A case study from Shanghai, China. Ecol. Indic. 2021, 127, 107720. [Google Scholar] [CrossRef]
- Zhang, H.; Huang, R.; Zhang, Y.; Buhalis, D. Cultural ecosystem services evaluation using geolocated social media data: A review. Tour. Geogr. 2022, 24, 646–668. [Google Scholar] [CrossRef]
- Xiang, Z.; Magnini, V.P.; Fesenmaier, D.R. Information technology and consumer behavior intravel and tourism: Insights from travel planning using the internet. J. Retail. Consum. Serv. 2015, 22, 244–249. [Google Scholar] [CrossRef]
- Li, J.; Gao, J.; Zhang, Z.; Fu, J.; Shao, G.; Zhao, Z.; Yang, P. Insights into citizens’ experiences of cultural ecosystem services in urban green spaces based on social media analytics. Landsc. Urban Plan. 2024, 244, 104999. [Google Scholar] [CrossRef]
- Clemente, P.; Calvache, M.; Antunes, P.; Santos, R.; Cerdeira, J.O.; Martins, M.J. Combining social media photographs and species distribution models to map cultural ecosystem services: The case of a Natural Park in Portugal. Ecol. Indic. 2019, 96, 59–68. [Google Scholar] [CrossRef]
- Elith, J.; Phillips, S.J.; Hastie, T.; Dudík, M.; Chee, Y.E.; Yates, C.J. A statistical explanation of MaxEnt for ecologists. Divers. Distrib. 2011, 17, 43–57. [Google Scholar] [CrossRef]
- Chen, T.; Zhao, Y.; Yang, H.; Wang, G.; Mi, F. Recreational services from green space in Beijing: Where supply and demand meet? Forests 2021, 12, 1625. [Google Scholar] [CrossRef]
- Zeng, Y.; Low, B.W.; Yeo, D.C. Novel methods to select environmental variables in MaxEnt: A case study using invasive crayfish. Ecol. Model. 2016, 341, 5–13. [Google Scholar] [CrossRef]
- Arslan, E.S.; Örücü, Ö.K. MaxEnt modelling of the potential distribution areas of cultural ecosystem services using social media data and GIS. Environ. Dev. Sustain. 2021, 23, 2655–2667. [Google Scholar] [CrossRef]
- Shi, Q.; Chen, H.; Liang, X.; Liu, D.; Geng, T.; Zhang, H. Combination of participatory mapping and Maxent model to visualize the cultural ecosystem services at county scale. Ecosyst. Serv. 2025, 72, 101710. [Google Scholar] [CrossRef]
- He, S.; Su, Y.; Shahtahmassebi, A.R.; Huang, L.Y.; Zhou, M.M.; Gan, M.Y.; Deng, J.S.; Zhao, G.; Wang, K. Assessing and mapping cultural ecosystem services supply, demand and flow of farmlands in the Hangzhoumetropolitan area, China. Sci. Total Environ. 2019, 692, 756–768. [Google Scholar] [CrossRef]
- Yang, L.; Cao, K. Cultural ecosystem services research progress and future prospects: A review. Sustainability 2022, 14, 11845. [Google Scholar] [CrossRef]
- He, W.; Wang, H.M.; Liu, G.; Bai, Y.; Xue, S.; Fang, Z.; Xiao, Y.; Wang, Y.X.; Wang, W.Q. Can ecosystem services supply match local residents’ perception: Linking macro-ESs and micro-individual perceptions in the Yellow River Basin. J. Environ. Manag. 2025, 374, 124116. [Google Scholar] [CrossRef]
- Shams, A. Tourism flow and the consumption of aesthetic landscape values in high-elevation mountain areas in the Alps: A cartographic and spatio-market methodology. J. Outdoor Recreat. Tour. 2025, 51, 100911. [Google Scholar] [CrossRef]
- Zhao, Y.; Zhou, R.; Yu, Q.; Zhao, L. Revealing the contribution of mountain ecosystem services research to sustainable development goals: A systematic and grounded theory driven review. J. Environ. Manag. 2025, 373, 123452. [Google Scholar] [CrossRef]
- Zelenka, J.; Azubuike, T.; Pásková, M. Trust model for online reviews of tourism services and evaluation of destinations. Adm. Sci. 2021, 11, 34. [Google Scholar] [CrossRef]
- Millenium Ecosystem Assessment. Ecosystems and Human Well-Being: Our Human Planet; Island Press: Washington, DC, USA, 2005. [Google Scholar]
- Zhang, J.; He, C.; Huang, Q.; Li, J.; Qi, T. Evaluating the supply and demand of cultural ecosystem services in the Tibetan Plateau of China. Landsc. Ecol. 2022, 37, 2131–2148. [Google Scholar] [CrossRef]
- Huang, W.; Lu, S.; Guo, Y. Measuring the perceived heterogeneity of cultural ecosystem services in national cultural parks: Evidence from China. Sustainability 2023, 15, 9428. [Google Scholar] [CrossRef]
- Phillips, S.J.; Dudík, M. Modeling of species distributions with Maxent: New extensions and a comprehensive evaluation. Ecography 2008, 31, 161–175. [Google Scholar] [CrossRef]
- Radosavljevic, A.; Anderson, R.P. Making better Maxent models of species distributions: Complexity, overfitting and evaluation. J. Biogeogr. 2014, 41, 629–643. [Google Scholar] [CrossRef]
- Li, J.H.; Jiang, H.W.; Bai, Y.; Alatalo, J.M.; Li, X.; Jiang, H.W.; Liu, G.; Xu, J. Indicators for spatial–temporal comparisons of ecosystem service status between regions: A case study of the Taihu River Basin, China. Ecol. Indic. 2016, 60, 1008–1016. [Google Scholar] [CrossRef]
- Song, Y.; Wang, J.; Ge, Y.; Xu, C. An optimal parameters-based geographical detector model enhances geographic characteristics of explanatory variables for spatial heterogeneity analysis: Cases with different types of spatial data. GISci. Remote Sens. 2020, 57, 593–610. [Google Scholar] [CrossRef]
- Lissovsky, A.A.; Dudov, S.V.; Obolenskaya, E.V. Species-distribution modeling: Advantages and limitations of its application. 1. General approaches. Biol. Bull. Rev. 2021, 11, 254–264. [Google Scholar] [CrossRef]
- Vrbičanová, G.; Kaisová, D.; Močko, M.; Petrovič, F.; Mederly, P. Mapping cultural ecosystem services enables better informed nature protection and landscape management. Sustainability 2020, 12, 2138. [Google Scholar] [CrossRef]
- Alvarez-Codoceo, S.; Cerda, C.; Perez-Quezada, J.F. Mapping the provision of cultural ecosystem services in large cities: The case of The Andean piedmont in Santiago, Chile. Urban For. Urban Green. 2021, 66, 127390. [Google Scholar] [CrossRef]
- Li, L.; Bai, Y.; Yuan, X.; Li, F. Assessing the Supply–Demand Matching and Spatial Flow of Urban Cultural Ecosystem Services: Based on Geospatial Data and User Interaction Data. Land 2025, 14, 773. [Google Scholar] [CrossRef]
- Herrero-Jáuregui, C.; Arnaiz-Schmitz, C.; Herrera, L.; Smart, S.M.; Montes, C.; Pineda, F.D.; Schmitz, M.F. Aligning landscape structure with ecosystem services along an urban–rural gradient. Trade-offs and transitions towards cultural services. Landsc. Ecol. 2019, 34, 1525–1545. [Google Scholar] [CrossRef]
- Isbell, F.; Calcagno, V.; Hector, A.; Connolly, J.; Harpole, W.S.; Reich, P.B.; Scherer-Lorenzen, M.; Schmid, B.; Tilman, D.; van Ruijven, J.; et al. High plant diversity is needed to maintain ecosystem services. Nature 2011, 477, 199–202. [Google Scholar] [CrossRef] [PubMed]
- Li, C.; Liang, Q.; Lin, B.; Zhai, J. Landscape management and planning as a spatial organization method connecting CES supply-demand assessment and sustainable tourism development. J. Outdoor Recreat. Tour. 2023, 44, 100705. [Google Scholar] [CrossRef]


Disclaimer/Publisher’s Note: The statements, opinions and data contained in all publications are solely those of the individual author(s) and contributor(s) and not of MDPI and/or the editor(s). MDPI and/or the editor(s) disclaim responsibility for any injury to people or property resulting from any ideas, methods, instructions or products referred to in the content. |
© 2025 by the authors. Licensee MDPI, Basel, Switzerland. This article is an open access article distributed under the terms and conditions of the Creative Commons Attribution (CC BY) license (https://creativecommons.org/licenses/by/4.0/).