Article

The Considering Sales Manipulation of Fresh Product Enterprises Game

1
School of Emergency Management, Wuxi University, Wuxi 214105, China
2
School of Management Science and Engineering, Nanjing University of Information Science & Technology, Nanjing 210044, China
3
School of Economics and Management, Anhui Jianzhu University, Hefei 230022, China
4
The Research Institute for Risk Governance and Emergency Decision-Making, Collaborative Innovation Center on Forecast and Evaluation of Meteorological Disasters (CIC-FEMD), School of Management Science and Engineering, Nanjing University of Information Science & Technology, Nanjing 210044, China
5
School of Management, Shanghai University, Shanghai 200444, China
*
Author to whom correspondence should be addressed.
Sustainability 2025, 17(21), 9688; https://doi.org/10.3390/su17219688
Submission received: 22 September 2025 / Revised: 28 October 2025 / Accepted: 28 October 2025 / Published: 30 October 2025

Abstract

Due to the highly perishable nature of fresh products, consumers often worry about product quality, which significantly dampens their purchase intentions. To address this and boost consumers’ willingness to pay, many fresh foods enterprises resort to sales manipulation tactics as a way to attract customers and gain a competitive edge. To further explore whether such yields net benefits to competing firms and the fresh product market, this research develops a game model involving two competing members selling fresh products. The model analyzes how sales manipulation affects the product prices, market shares, and profits of both firms across four scenarios. Finally, numerical analysis supports the robustness of findings and provides insights for establishing management guidelines for fresh product enterprises and the market.

1. Introduction

As global health awareness increases, consumers are paying more attention to dietary health. Fresh products, especially nutrient-rich fruits, vegetables, fish, and fresh milk, have become essential components of a healthy diet. According to a survey by Zhongyan Network, the transaction volume of fresh food has maintained steady growth in recent years in China. However, because fresh produce typically has a very short and perishable shelf life. As a result, consumers often worry about product quality, including its impact on taste, nutritional value, and even safety. According to a survey by China Quality News Network, 74.20% of consumers prioritize product quality when purchasing fresh goods.
In response to consumers’ concerns about fresh product quality, some fresh product enterprises strive to stand out in the industry by employing sales manipulation strategies to enhance their market competitiveness and gain a larger market share [1,2,3,4]. Sales manipulation refers to marketing tactics in which companies or sales personnel influence consumer purchasing decisions by artificially inflating sales figures [2]. For example, from January 2023, a pump manufacturing company in Zhejiang Province operated ten online stores on a certain e-commerce platform. By artificially inflating product sales figures and falsely boosting search rankings, the company gained platform traffic, resulting in 63,141 additional transaction orders and an inflated transaction value exceeding 38.47 million yuan. Similarly, “Aishang Flowers” recorded 8701, 90,900, and 163,700 fake transactions in 2013, 2014, and 2015, respectively, accounting for 4.95%, 24.05%, and 42.02% of its total sales during those years. When consumers search for products, listings with higher sales volumes tend to appear higher in platform search results. For most consumers, high sales often signify high-quality products. As a result, they are more likely to purchase popular products, meaning those with higher sales. This consumer behavior creates a natural breeding ground for sales manipulation, for example, manipulating Amazon category rankings by directing traffic to product pages via external tools (such as Google Ads), whilst simultaneously employing virtual order tools to fabricate surges in sales volume, thereby rapidly boosting Best Seller Rank (BSR). Once rankings improve, genuine order volumes increase, further consolidating positions and creating a virtuous cycle. However, it remains unclear whether sales manipulation can truly lead to higher sales and profits for fresh food companies.
Based on this, this paper develops a two-stage game model involving two competing fresh product enterprises. Both enterprises engage in self-production and direct sales, offering products of the same category, such as fruits or fish. However, the two products differ in quality: one enterprise sells relatively higher-quality products, while the other sells relatively lower-quality products. From the consumer’s perspective, they estimate fresh product quality before purchasing, refer to the relative sales volume of each enterprise in the previous stage, form a comparative sales utility, and make purchasing decisions based on product prices.
This paper considers the following four scenarios: neither fresh enterprise engages in sales manipulation; only fresh enterprise G engages in sales manipulation; only fresh enterprise D engages in sales manipulation; both fresh enterprises engage in sales manipulation. The study primarily addresses the following issues:
(1) What is the impact of sales manipulation by fresh product enterprises on product prices, market share, and firm profitability? Is sales manipulation beneficial or detrimental to fresh product enterprises, their competitors, and the fresh product market?
(2) For two enterprises selling the same type of fresh products but with different quality levels, is the sales manipulation strategy equally attractive? How should fresh product enterprises make their decisions?
This paper finds the following: fresh food companies may not always benefit from sales manipulation. Firstly, regarding fresh product prices, when only one enterprise engages in sales manipulation unilaterally or manipulates more than its competitor, its manipulation always increases its product price but simultaneously harms the competing enterprise’s product price. Secondly, in terms of market share, if only one enterprise engages in sales manipulation, its market share increases, while the competing enterprise’s market share decreases. However, when both enterprises engage in sales manipulation, the enterprise that manipulates less than its competitor will experience a reduction in market share. Interestingly, when a lower-quality fresh product enterprise engages in sales manipulation or manipulates more, more consumers enter the market to purchase products. In contrast, sales manipulation by a high-quality fresh product enterprise decreases overall consumer trust in the fresh product market, leading to a reduction in total market share. Thirdly, regarding firm profitability, if only one enterprise engages in sales manipulation, when manipulation costs are low or a company possesses the capacity for large-scale manipulation, its profits increase. However, if the manipulation cost is high and the enterprise can only perform small-scale manipulation, refraining from sales manipulation is the better strategy. When both enterprises engage in sales manipulation, they can only improve profitability if both employ high levels of sales manipulation. Moreover, once an enterprise opts for sales manipulation, it tends to maximize its manipulation efforts, leading to a prisoner’s dilemma. Finally, this study also employs numerical simulations to further validate these conclusions.

2. Literature Review

This paper is primarily related to two research fields: sales manipulation and fresh products. Based on this, this paper will review studies in these two areas and explore their connection to this paper.

2.1. Sales Manipulation Research

With the advancement of the information age, consumers increasingly rely on extensive product information in their purchasing decisions. Among these factors, product sales volume serves as an intuitive market indicator that effectively reduces decision-making uncertainty. Many scholars have conducted research on product sales volume.
In terms of product sales volume, Nie et al. found that increased battery sales and electric vehicle manufacturers’ preference for low-carbon sourcing can increase the probability of adopting recycling strategies and recyclable design strategies among both cathode and battery pack makers [5]. Kim et al. investigated the effects of star ratings, the number of ratings, and qualitative and quantitative aspects of customer reviews on actual sales in online marketplaces [2]. Xia et al. found that carbon trading promotes the sales of such products only when manufacturers produce only carbon emission reduction products [3]. Fernandes et al. built an online sales prediction model based on online reviews in the restaurant [6]. Yannopoulou et al. explain the effect of misinformation on sales within the context of socially responsible branding [7]. Schwarz et al. examined the issue of product replacement cycles [4]. Some scholars, such as Cai et al., listed the “most popular” dishes based on the actual sales of meals from the previous week and found that displaying the popularity rankings to customers increased demand [8]. Chen suggested that consumers frequently choose popular brands because they associate popularity with higher quality [9].
Given this, the importance of sales volume to enterprises is self-evident. Consequently, many companies have attempted sales manipulation—exaggerating sales volume through fake transactions—which undermines the credibility of sales [10] and subtly integrates into consumers’ shopping experiences, becoming a widespread social issue. For enterprises, Zhou et al. built a two-stage model based on the observation that consumers tend to make purchasing decisions based on sales volume. The model included a leading firm present in both periods and a follower firm entering the market only in the second period, exploring the impact of this behavior on competitive strategies [11]. For platforms, Liu et al. used game theory to analyze retailers’ fake sales behaviors on online marketplaces, considering the practice of ranking product listings based on sales volume. They found that if a platform charges commissions based on sales volume, there is a pure strategic equilibrium when there is no false sales by retailers, provided that the commission rate is sufficiently high [12]. Long and Liu examined the motivation behind false sales and seller rankings in online retail markets, discovering that platforms might manipulate low-quality sellers’ products to appear more attractive, thereby intensifying competition for advertising bids among sellers [13]. For consumers, Jin et al. studied search ranking manipulation through fake sales. They considered a high-type seller and a low-type seller, modeling their fake sales strategies and their impact on consumer behavior [1]. Zhang et al. used a game model to examine sales manipulation strategies employed by high-quality and low-quality firms on e-commerce platforms, identifying the conditions under which firms engage in sales manipulation [14].

2.2. Fresh Products Research

As consumer demand for healthy and natural foods has increased, the fresh produce market has grown rapidly in recent years. The purchase of fresh products is not merely a matter of price but also involves multiple considerations regarding product quality and safety.
In terms of fresh products quality, Liu et al. found that, under the blockchain, the supplier to heighten preservation efforts in the distribution process [15]. Liu et al. developed a flexible coordination contract for a second-level supply chain consisting of retailers and logistics service providers to encourage third-party logistics providers to adopt fresh-keeping measures required by retailers [16]. Ma and Li developed a fresh produce investment decision game model. This model aims to find how different packaging strategies impact revenue enhancement and sustainable development within fresh produce [17]. Yuan et al. used a game-theoretic approach to optimize the traceability program for fresh and non-fresh produce in a competitive environment. They discovered that per-unit product costs had no impact on supply chain traceability decisions [18]. Yu et al. explained the relevance between blockchain technology and food quality retrospective analysis and dynamic monitoring [19]. Chen et al. examined information disclosure strategies within fresh agricultural product supply chains, showing that the impact of information disclosure on member performance is relevant both to the freshness resilience of geographically indicated fresh agricultural products and to their quality advantages [20]. Feng et al. found that extending shelf life through investment in preservation technology significantly increases total profits, whilst only marginally raising the unit price of fresh produce and extending the turnover cycle [21].
In terms of fresh produce price, Waqas Iqbal et al. developed a game model to optimize pricing, fresh-keeping investments, and product life-cycle decisions [22]. Yu and Xiao constructed a game model comprising the supplier, retailer, and third-party logistics to explore charge and level of service decisions of the fresh produce [23]. Mohan Modak et al. compared centralized and decentralized models before and after blockchain implementation, finding that wholesale prices, retail prices in physical and online channels, and optimal fresh-keeping efforts were inversely proportional to fraudulent parameters [24]. Dan et al. identified two key factors influencing fresh product price fluctuations: price sensitivity and supply scale. They found that agricultural subsidy policies could increase the supply of fresh products and lower their prices [25]. Liu et al. conducted an online survey of 515 consumers to investigate the factors influencing repeat purchasing behavior of fresh produce. Their results showed that product quality and price, as well as service attributes, significantly affected consumer satisfaction [26]. Fan et al. proposed a dynamic programming model incorporating consumer choice behavior. By solving the model, they developed a multi-batch dynamic pricing strategy for fresh agricultural products that aligns with real-time freshness levels [27]. Liu et al. examined how supermarkets should appropriately select and balance investments in freshness preservation technologies with pricing strategies for fresh food products within an imperfectly competitive market environment [28]. Wang et al. examined the community fresh produce group-buying model, wherein the platform employs a full prepayment sales model while suppliers face supply uncertainties [29]. Özbilge et al. investigated the operational planning challenges faced by a socially responsible fresh food retailer concerning perishable inventory over two time periods, requiring simultaneous consideration of donation mechanisms and quality-sensitive customer segments [30].
In summary, this study makes three key contributions. Firstly, most existing research on fresh products focuses only on pricing or quality. With the development of internet technologies, more and more companies increase consumers’ willingness to buy fresh products by manipulating sales volume. However, this marketing strategy may mislead consumer purchasing decisions, undermine market integrity, and negatively impact the healthy development of the entire industry. In response, this study provides targeted insights into how sales manipulation strategies affect product pricing, market share, and corporate profitability in the fresh product market. Secondly, most previous studies have only considered the effect of definite sales on consumer purchasing behavior. In contrast, this study simultaneously takes into account sales manipulation, product quality, and consumers’ comparative utility from sales, providing a new perspective on the advantages and disadvantages of sales manipulation strategies for fresh product enterprises. Finally, the advantages and disadvantages of sales manipulation in fresh product enterprises have not yet been studied. Therefore, this paper focuses on the fresh product sector to explore whether sales manipulation benefits or harms fresh product enterprises and the overall fresh market.

3. Model

3.1. Basic Assumptions

This study develops a two-stage game model in which two competing fresh product enterprises sell fresh products on the same sales platform while considering consumers’ comparative utility from sales. The model is used to explore the effect of sales manipulation on the price, market share, and profit of competing fresh product enterprises.
During the two periods (t = 1, 2), firm i can independently produce fresh food products and sell them on the same platform, with production costs assumed to be zero. The subscript i { G , D } denotes the two enterprises, where G represents the high-quality fresh product enterprise, and D represents the low-quality fresh product enterprise. Both firms sell products of the same category, differing only in quality: firm G sells fresh product G, while firm D sells fresh product D. Since fresh products typically have a short shelf life and are highly perishable, consumers often have concerns about product quality. Therefore, referring to Tan and Zeng [31], we assume that before purchasing, consumers form an expected quality estimate γ i based on the information disclosed and promoted by the enterprise, where 0 < γ D < γ G < 1 . Meanwhile, to simplify the model, we refer to [14,16,32], assume consumer valuation M for fresh product i follows a uniform distribution over [0, 1], with total market share normalized to 1. In this model, the superscript j (j ∈ {NN, YN, NY, YY} represents the sales manipulation strategies of the two fresh product enterprises. And NN indicates that neither fresh product enterprise engages in sales manipulation in either period, YN indicates that fresh product enterprise G engages in sales manipulation, NY indicates that fresh product enterprise D engages in sales manipulation, and YY indicates that both fresh product enterprises engage in sales manipulation.
During the two stages, the competing enterprises sell fresh products on the same sales platform, and the game flow is shown in Figure 1. To simplify the model, following References [4,14,33], it is assumed that production costs are internalized within the sales price, i.e., production costs are zero. These production costs do not affect the conclusions of the article. In the first stage (t = 1), neither enterprise engages in sales manipulation. They sell fresh products G and D while simultaneously setting retail prices p i , 1 j . Consumers make purchasing decisions based on fresh product prices and expected product quality, meaning that at this stage, consumers’ economic utility function only includes the economic utility of purchasing the product.
In the second stage, the enterprises simultaneously decide on their retail prices p i , 2 j and whether to engage in sales manipulation. Since sales manipulation incurs a cost, referring to [33,34], we assume this cost c is linearly related to the sales manipulation volume X i j , where 0 X i j 1 , and c is a constant, where 0 < c 1 . Consumers make purchasing decisions based on fresh product prices, expected product quality, and sales information from the previous stage. At this stage, consumers’ economic utility consists of both the economic utility of purchasing the product and the comparative utility derived from sales. The comparative utility is determined by the relative sales volumes of the two competing fresh product enterprises displayed on the platform and consumers’ sensitivity to relative sales volume β [35].
The parameter descriptions are shown in Table 1.

3.2. The Game Model

Based on these assumptions, this paper investigates how sales manipulation affects competing firms’ prices, market shares, and profits under four distinct scenarios.

3.2.1. Model with Neither Fresh Product Firm Engages in Sales Manipulation: NN Model

In the NN model, the consumer’s economic utility function in the first stage only includes the economic utility of purchasing fresh products, expressed as:
u G , 1 = γ G m p G , 1 j u D , 1 = γ D m p D , 1 j
Since, in the YN model, NY model, and YY model, there are no historical sales for either company in the first stage, and no sales manipulation is carried out, the results are the same as in the first stage of the NN model. Therefore, it will not be repeated in the following discussion.
Consumers whose internal valuation is m G , 1 j are indifferent to purchasing either product G or product D. That is, γ G m p G , 1 j = γ D m p D , 1 j . The economic utility functions for purchasing product G and product D are the same. Therefore, we have:
m G , 1 j = p D , 1 j p G , 1 j γ D γ G
As a result, only consumers whose internal valuation exceeds a certain threshold will purchase product G. Therefore, the market share of fresh product G in the first stage is:
F G , 1 j = 1 m G , 1 j = γ D γ G + p G , 1 j p D , 1 j γ D γ G
At the same time, to simplify the model, we refer to the article by Zhang et al. [14] and set the upper limit of the market share for each stage as 1.
Similarly, consumers whose internal valuation is m D , 1 j are indifferent to purchasing product D or not purchasing the product at all. That is γ D m p D , 1 j = 0 , the economic utility functions for purchasing product D and not making a purchase are the same at this point. Therefore, we have:
m D , 1 j = p D , 1 j γ D
Therefore, only consumers whose internal valuation is greater than m D , 1 j and less than m G , 1 j will purchase product D. The market share of fresh product D in the first stage is:
F D , 1 j = m G , 1 j m D , 1 j = γ D p G , 1 j γ G p D , 1 j γ D ( γ G γ D )
The profit of the enterprise in the first stage is:
π i , 1 j = p i , 1 j F i , 1 j ( i { G , D } )
First, for enterprise i, according to Formula (3), the second-order derivative of π i , 1 j about p i , 1 j ,
2 π G , 1 j ( p G , 1 j ) 2 = 2 γ D γ G , 2 π D , 1 j ( p D , 1 j ) 2 = 2 γ G γ D ( γ D γ G ) γ D
Since γ D < γ G , 2 π G , 1 j ( p G , 1 j ) 2 < 0 , 2 π D , 1 j ( p D , 1 j ) 2 < 0 , π G , 1 j is a concave function with respect to p G , 1 j . Therefore, it has a maximum value. Make the first-order derivative of π i , 1 j about p i , 1 j = 0 , the optimal product prices for fresh enterprises G and D in the first stage are:
p G , 1 j = ( γ D 4 γ G ) ( γ D γ G ) 4 ( 2 γ G γ D )
p D , 1 j = γ D ( γ D γ G ) 2 ( γ D 2 γ G )
Secondly, substituting Equations (4) and (5) into Equations (1) and (2), the optimal market share functions of fresh product enterprise G and fresh product enterprise D in the first stage can be obtained:
F G , 1 j = γ D 4 γ G 4 ( γ D 2 γ G )
F D , 1 j = 1 4
Substituting Equations (4)–(7) into Equation (3), the optimal enterprise profits of fresh product enterprise G and fresh product enterprise D in the first stage can be obtained:
π G , 1 j = ( γ D 4 γ G ) 2 ( γ G γ D ) 16 ( γ D 2 γ G ) 2
π D , 1 j = γ D ( γ D γ G ) 8 ( γ D 2 γ G )
In the second stage, the consumer’s sales comparison utility is influenced by the relative sales of the two fresh product enterprises in the previous stage and the consumer’s preference for the relative sales of fresh products. Therefore, the consumer utility functions for purchasing products G and D in the second stage are:
u G , 2 N N = γ G m p G , 2 N N + β ( F G , 1 N N F D , 1 N N ) u G , 2 N N = γ D m p D , 2 N N + β ( F D , 1 N N F G , 1 N N )
The consumer with an intrinsic valuation of m G , 2 N N is indifferent between purchasing product G or product D, i.e.,
m G , 2 N N = p D , 2 N N p G , 2 N N + 2 β ( F G , 1 N N F D , 1 N N ) γ D γ G
Thus, the market share of product G in the second stage is:
F G , 2 N N = 1 m G , 2 N N = γ D γ G + p G , 2 N N p D , 2 N N 2 β ( F G , 1 N N F D , 1 N N ) γ D γ G
Similarly, the consumer with an intrinsic valuation of m D , 2 N N is indifferent between purchasing product D or not purchasing at all, i.e.,
m D , 2 N N = p D , 2 N N + β ( F G , 1 N N F D , 1 N N ) γ D
Thus, the market share of product D in the second stage is:
F D , 2 N N = m G , 2 N N m D , 2 N N = γ G p D , t N γ D p G , 2 N N β ( F D , 1 N N F G , 1 N N ) ( γ D + γ G ) γ D ( γ D γ G )
In the second stage, the revenue of member i is:
π i , 2 N N = p i , 2 N N F i , 2 N N ( i { G , D } )
First, for enterprise i, according to Formula (12), the second-order derivative of π i , 2 N N about p i , 2 N N ,
2 π G , 2 N N ( p G , 2 N N ) 2 = 2 γ D γ G ,   2 π D , 2 N N ( p D , 2 N N ) 2 = 2 γ G γ D ( γ D γ G ) γ D
Since γ D < γ G , 2 π G , 2 N N ( p G , 2 N N ) 2 < 0 , 2 π D , 2 N N ( p G , 2 N N ) 2 < 0 , π i , 2 N N is a concave function with respect to p i , 2 N N . Therefore, it has a maximum value. Make the first derivative of π i , 2 N N with respect to p i , 2 N N = 0 , the optimal product prices for fresh enterprises G and D in the second stage are:
p G , 2 N N = K 1 K 2 4 ( γ D 2 γ G ) 2
p D , 2 N N = γ D ( γ D γ G ) ( γ D 2 γ G ) β γ G 2 2 ( γ D 2 γ G ) 2
where K 1 = 8 γ G 3 2 β γ G γ D + 3 β γ G 2 , K 2 = γ D 3 7 γ D 2 γ G + 14 γ D γ G 2 .
Secondly, substituting Equations (10)–(13), the optimal market share functions of fresh product enterprise G and fresh product enterprise D in the second stage can be obtained:
F G , 2 N N = K 2 K 1 4 ( γ D 2 γ G ) 2 ( γ D γ G )
F D , 2 N N = γ D ( γ D γ G ) ( γ D 2 γ G ) β γ G 2 4 γ D ( γ D γ G ) ( γ D 2 γ G )
Substituting Equations (13)–(16) into Equation (12), the optimal enterprise profits of fresh product enterprise G and fresh product enterprise D in the second stage can be obtained:
π G , 2 N N = ( K 1 K 2 ) 2 16 ( γ D 2 γ G ) 4 ( γ G α γ D )
π D , 2 N N = [ γ D ( α γ D γ G ) ( γ D 2 γ G ) β γ G 2 ] 2 8 α γ D ( γ D 2 γ G ) 3 ( γ D γ G )

3.2.2. Model with the Fresh Firm G Engages in Sales Manipulation: YN Model

In the second stage, since only fresh product enterprise G has engaged in sales manipulation, its displayed sales volume on the platform consists of both actual sales volume and manipulated sales volume. Therefore, the consumer utility function for purchasing fresh product G in the second stage is:
u G , 2 Y N = γ G m p G , 2 Y N + β ( F G , 1 Y N + X G Y N F D , 1 Y N )
Enterprise D does not engage in sales manipulation. Therefore, the consumer utility function for purchasing fresh product D in the second stage is:
u D , 2 Y N = γ D m p D , t Y N + β ( F D , 1 Y N F G , 1 Y N X G Y N )
The consumer with an intrinsic valuation of m G , 2 Y N is indifferent between purchasing product G or product D, i.e.,
m G , 2 Y N = p D , 2 Y N p G , 2 Y N 2 β ( F G , 1 Y N + X G Y N F D , 1 Y N ) γ D γ G
Thus, the market share of product G in the second stage is:
F G , 2 Y N = 1 m G , 2 Y N = γ D γ G + p G , 2 Y N p D , 2 Y N 2 β ( F G , 1 Y N + X G Y N F D , 1 Y N ) γ D γ G
Similarly, the consumer with an intrinsic valuation of m D , 2 Y N is indifferent between purchasing product D or not purchasing at all, i.e.,
m D , 2 Y N = p D , 2 Y N β ( F G , 1 Y N + X G Y N F D , 1 Y N ) γ D
Thus, the market share of product D in the second stage is:
F D , 2 Y N = m G , 2 Y N m D , 2 Y N = γ G p D , 2 Y N γ D p G , 2 Y N β ( F D , 1 Y N F G , 1 Y N X G Y N ) ( γ D + γ G ) γ D ( γ D γ G )
Then, in the second stage, the revenue of enterprise G and D is:
π G , 2 Y N = p G , 2 Y N F G , 2 Y N c X G Y N
π D , 2 Y N = p D , 2 Y N F D , 2 Y N
Similar to the calculation process in the previous model. First, for enterprise i, according to Formulas (21) and (22), the second-order derivative of π i , 2 Y N about p i , 2 Y N :
2 π G , 2 Y N ( p G , 2 Y N ) 2 = 2 γ D γ G ,   2 π D , 2 Y N ( p D , 2 Y N ) 2 = 2 γ G γ D ( γ D γ G ) γ D
Since γ D < γ G , 2 π G , 2 Y N ( p G , 2 Y N ) 2 < 0 , 2 π D , 2 Y N ( p G , 2 Y N ) 2 < 0 , π i , 2 Y N is a concave function with respect to p i , 2 Y N . Therefore, it has a maximum value. Make the first derivative of π i , 2 Y N with respect to p i , 2 Y N = 0 . The optimal product prices for fresh enterprises G and D in the second stage are:
p G , 2 Y N = 2 X G Y N β ( γ D 2 γ G ) ( 2 γ D 3 γ G ) + K 1 K 2 4 ( γ D 2 γ G ) 2
p D , 2 Y N = γ D ( γ D γ G ) ( γ D 2 γ G ) β γ G 2 + 2 X G Y N β γ G ( γ D 2 γ G ) 2 ( γ D 2 γ G ) 2
Secondly, substituting Equations (23) and (24) into Equations (19) and (20), the optimal market share functions of fresh product enterprise G and fresh product enterprise D in the second stage can be obtained:
F G , 2 Y N = 2 X G Y N β ( γ D 2 γ G ) ( 2 γ D 3 γ G ) + K 2 K 1 4 ( γ D 2 γ G ) 2 ( γ G γ D )
F D , 2 Y N = γ D ( γ D γ G ) ( γ D 2 γ G ) β γ G 2 + 2 X G Y N β γ G ( γ D 2 γ G ) 4 γ D ( γ D γ G ) ( γ D 2 γ G ) )
Substituting Equations (23)–(26) into Equations (21) and (22), the optimal enterprise profits of fresh product enterprise G and fresh product enterprise D in the second stage can be obtained:
π G , 2 Y N = 4 X G Y N 2 β 2 ( 2 γ D 3 γ G ) 2 ( γ D 2 γ G ) 2 + ( K 1 K 2 ) 2 16 ( γ d 2 γ g ) 4 ( γ g α γ d ) + X G Y N ( γ D 2 γ G ) [ 4 c ( γ D 2 γ G ) 3 ( γ D γ G ) β ( 2 γ D 3 γ G ) ( K 2 K 1 ) ] 4 ( γ D 2 γ G ) 4 ( γ G α γ D )
π D , 2 Y N = [ γ D ( γ D γ G ) ( γ D 2 γ G ) β γ G 2 + 2 X G Y N β γ G ( γ D 2 γ G ) ] 2 8 γ D ( γ D 2 γ G ) 3 ( γ D γ G )

3.2.3. Model with the Fresh Firm D Engages in Sales Manipulation: NY Model

In the second stage, since fresh produce firm G does not engage in sales manipulation while fresh produce firm D does, the consumer utility function for purchasing fresh produce G is:
u G , 2 N Y = γ G m p G , 2 N Y + β ( F G , 1 N Y F D , 1 N Y X D N Y )
The consumer utility function for purchasing fresh product D in the second stage is:
u D , 2 N Y = γ D m p D , 2 N Y + β ( F D , 1 N Y F G , 1 N Y + X D N Y )
The consumer with an intrinsic valuation of m G , 2 N Y is indifferent between purchasing product G or product D, i.e.,
m G , 2 N Y = p D , 2 N Y p G , 2 N Y 2 β ( F D , 1 N Y + X D N Y F G , 1 N Y ) γ D γ G
Thus, the market share of product G in the second stage is:
F G , 2 N Y = 1 m G , 2 N Y = γ D γ G + p G , 2 N Y p D , 2 N Y + 2 β ( F D , 1 N Y + X D N Y F G , 1 N Y ) γ D γ G
Similarly, the consumer with an intrinsic valuation of m D , 2 N Y is indifferent between purchasing product D or not purchasing at all, i.e.,
m D , 2 N Y = p D , 2 N Y + β ( F G , 1 N Y F D , 1 N Y X D N Y ) γ D
Thus, the market share of product D in the second stage is:
F D , 2 N Y = γ G p D , 2 N Y γ D p G , 2 N Y β ( F D , 1 Y N + X D N Y F G , 1 N Y ) ( γ D + γ G ) γ D ( γ D γ G )
Then, in the second stage, the revenue of enterprise G and D is:
π G , 2 N Y = p G , 2 N Y F G , 2 N Y
π D , 2 N Y = p D , 2 N Y F D , 2 N Y c X D N Y
Similar to the calculation process in the previous model, first, for enterprise i, according to Formulas (31) and (32), the second-order derivative of π i , 2 N Y is about p i , 2 N Y :
2 π G , 2 N Y ( p G , 2 N Y ) 2 = 2 γ D γ G ,   2 π D , 2 N Y ( p D , 2 N Y ) 2 = 2 γ G γ D ( γ D γ G ) γ D
Since γ D < γ G , 2 π G , 2 N Y ( p G , 2 N Y ) 2 < 0 , 2 π D , 2 N Y ( p D , 2 N Y ) 2 < 0 , π i , 2 N Y is a concave function with respect to p i , 2 N Y . Therefore, it has a maximum value. Make the first derivative of π i , 2 N Y be about p i , 2 N Y = 0 . The optimal product prices for fresh enterprises G and D in the second stage are:
p G , 2 N Y = K 1 K 2 2 X D N Y β ( γ D 2 γ G ) ( 2 γ D 3 γ G ) 4 ( γ D 2 γ G ) 2
p D , 2 N Y = γ D ( γ D γ G ) ( γ D 2 γ G ) β γ G 2 2 X D N Y β γ G ( γ D 2 γ G ) 2 ( γ D 2 γ G ) 2
Secondly, substituting Formulas (33) and (34) into Formulas (29) and (30), the optimal market share functions of fresh product enterprise G and fresh product enterprise D in the second stage can be obtained:
F G , 2 N Y = K 1 K 2 2 X D N Y β ( γ D 2 γ G ) ( 2 γ D 3 γ G ) 4 ( γ D 2 γ G ) 2 ( γ G α γ D )
F D , 2 N Y = γ D ( α γ D γ G ) ( α γ D 2 γ G ) β γ G 2 2 X D N Y β γ G ( γ D 2 γ G ) 4 γ D ( γ D γ G ) ( γ D 2 γ G )
Substituting Equations (33)–(36) into Equations (31) and (32), the optimal enterprise profits of fresh product enterprise G and fresh product enterprise D in the second stage can be obtained:
π G , 2 N Y = [ 2 X D N Y β ( 2 γ D 3 γ G ) ( γ D 2 γ G ) + ( K 2 K 1 ) ] 2 16 ( γ d 2 γ g ) 4 ( γ g γ d )
π D , 2 N Y = [ γ D ( γ D γ G ) ( γ D 2 γ G ) β γ G 2 2 X D N Y β γ G ( γ D 2 γ G ) ] 2 8 γ D ( γ D 2 γ G ) 3 ( γ D γ G ) c X D N Y

3.2.4. Model with Both Fresh Product Firms Engage in Sales Manipulation: YY Model

In the second stage, since both fresh produce firms engage in sales manipulation, they generate a corresponding sales manipulation volume and incur a sales manipulation cost c. Therefore, the consumer utility functions for both fresh produce enterprises are as follows:
u G , 2 Y Y = γ G m p G , 2 Y Y + β ( F G , 1 Y Y + X G Y Y F D , 1 Y Y X D Y Y ) u D , 2 Y Y = γ D m p D , 2 Y Y + β ( F D , 1 Y Y + X D Y Y F G , 1 Y Y X G Y Y )
The consumer with an intrinsic valuation of m G , 2 Y Y is indifferent between purchasing product G or product D, i.e.,
m G , 2 Y Y = p D , 2 N Y p G , 2 N Y 2 β ( F D , 1 N Y + X D N Y F G , 1 N Y ) γ D γ G
Thus, the market share of product G in the second stage is:
F G , 2 Y Y = γ D γ G + p G , 2 Y Y p D , 2 Y Y + 2 β ( F D , 1 Y Y + X D Y Y F G , 1 Y Y X G Y Y ) γ D γ G
Similarly, the consumer with an intrinsic valuation of m D , 2 y Y is indifferent between purchasing product D or not purchasing at all, i.e.,
m D , 2 Y Y = p D , 1 Y Y + β ( F G , 1 Y Y + X G Y Y F D , 1 Y Y X D Y Y ) γ D
Thus, the market share of product D in the second stage is:
F D , 2 Y Y = γ G p D , 2 Y Y γ D p G , 2 Y Y β ( F D , 1 Y Y + X D Y Y F G , 1 Y Y X G Y Y ) ( γ D + γ G ) γ D ( γ D γ G )
Then, the profit of enterprise G and D in the second stage is:
π i , 2 Y Y = p i , 2 Y Y F i , 2 Y Y c X i Y Y ( i { G , D } )
Similar to the calculation process in the previous model, first, for enterprise i, according to Formula (41), the second-order derivative of π i , 2 Y Y is about p i , 2 Y Y :
2 π G , 2 Y Y ( p G , 2 Y Y ) 2 = 2 γ D γ G ,   2 π D , 2 Y Y ( p D , 2 Y Y ) 2 = 2 γ G γ D ( γ D γ G ) γ D
Since γ G > γ D , 2 π G , 2 Y Y ( p G , 2 Y Y ) 2 < 0 , 2 π D , 2 Y Y ( p D , 2 Y Y ) 2 < 0 , π i , 2 Y Y is a concave function with respect to p i , 2 Y Y . Therefore, it has a maximum value. By setting the first derivative of π i , 2 Y Y with respect to p i , 2 Y Y equal to 0, the optimal product prices for fresh enterprises G and D in the second stage are:
p G , 2 Y Y = K 1 K 2 2 β ( X D Y Y X G Y Y ) ( γ D 2 γ G ) ( 2 γ D 3 γ G ) 4 ( γ D 2 γ G ) 2
p D , 2 Y Y = γ D ( γ D γ G ) ( γ D 2 γ G ) β γ G 2 2 β γ G ( X D Y Y X G Y Y ) ( γ D 2 γ G ) 2 ( γ D 2 γ G ) 2
Secondly, substituting Formulas (42) and (43) into Formulas (39) and (40), the optimal market share functions of fresh product enterprise G and fresh product enterprise D in the second stage can be obtained:
F G , 2 Y Y = K 2 K 1 + 2 β ( X D Y Y X G Y Y ) ( γ D 2 γ G ) ( 2 γ D 3 γ G ) 4 ( γ D 2 γ G ) 2 ( γ G γ D )
F D , 2 Y Y = γ D ( γ D γ G ) ( γ D 2 γ G ) β γ G 2 2 β γ G ( X D Y Y X G Y Y ) ( γ D 2 γ G ) 4 γ D ( γ D γ G ) ( γ D 2 γ G ) )
Substituting Equations (42)–(45) into Equation (41), the optimal enterprise profits of fresh product enterprise G and fresh product enterprise D in the second stage can be obtained:
π G , 2 Y Y = 4 β 2 ( X D Y Y X G Y Y ) 2 ( 2 γ D 3 γ G ) 2 ( γ D 2 γ G ) 2 + ( K 1 K 2 ) 2 16 ( γ d 2 γ g ) 4 ( γ g γ d ) + ( X D Y Y X G Y Y ) β ( 2 γ D 3 γ G ) ( γ D 2 γ G ) ( K 1 K 2 ) 4 ( γ D 2 γ G ) 4 ( γ G α γ D ) c X G Y Y
π D , 2 Y Y = [ γ D ( γ D γ G ) ( γ D 2 γ G ) β γ G 2 2 β γ G ( X D Y Y X G Y Y ) ( γ D 2 γ G ) ] 2 8 γ D ( γ D 2 γ G ) 3 ( γ D γ G ) c X D Y Y
In summary, to ensure that both competing enterprises remain in the market, and the total displayed market share does not exceed 1, p i , t j > 0 , F i , t j > 0 , F G , t j + F D , t j 1 , π i , t j > 0 .
That is, β 01 < β < β 02 , 0 < X G j < X G 0 , 0 < X D j < X D 0 , 0 < c < c 0 , where:
β 01 = K 2 K 1 3 ( γ D 2 γ G ) 3 ( γ D γ G ) γ G ( γ D 2 γ G )
β 02 = γ D ( γ D γ G ) ( γ D 2 γ G ) γ G 2
X G 0 = β γ G 2 γ D ( γ D γ G ) ( γ D 2 γ G ) 2 β γ G ( γ D 2 γ G )
X D 0 = m i n { K 1 K 2 2 β ( γ D 2 γ G ) ( 2 γ D 3 γ G ) , γ D ( γ D γ G ) β γ G 2 β ( γ D 2 γ G ) }
c 0 = m i n { c 01 , c 02 , c 03 , c 04 }
c 01 = [ 2 X G j β ( 2 γ D 3 γ G ) ( γ D 2 γ G ) + K 1 K 2 ] 2 16 ( γ d 2 γ g ) 4 ( γ g γ d ) X G Y N
c 02 = [ γ D ( γ D γ G ) ( γ D 2 γ G ) β γ G 2 2 X D j β γ G ( γ D 2 γ G ) ] 2 8 γ D ( γ D 2 γ G ) 3 ( γ D γ G ) X D N Y
c 03 = [ 2 β ( X D j X G j ) ( 2 γ D 3 γ G ) ( γ D 2 γ G ) + K 2 K 1 ] 2 16 ( γ d 2 γ g ) 4 ( γ g γ d )
c 04 = [ γ D ( γ D γ G ) ( γ D 2 γ G ) β γ G 2 2 β γ G ( X D j X G j ) ( γ D 2 γ G ) ] 2 8 γ D ( γ D 2 γ G ) 3 ( γ D γ G ) X D Y Y
where X G 0 < X D 0 . This is because the product quality of the fresh product enterprise G is higher than that of enterprise D. Therefore, if enterprise D engages in sales manipulation, the maximum market share it captures through this behavior must be greater than the maximum market share that enterprise G can capture in order to force enterprise G out of the market.
Thus, this paper will conduct subsequent analyses based on the above threshold conditions.

4. Model Comparative

In the section, we comparative of the impact of sales manipulation on product prices, market share, and firm profits under the four scenarios in the second stage.

4.1. The Effect of Sales Manipulation on Product Prices

We discuss the effect of sales manipulation of product prices and derive Proposition 1 as follows:
Proposition 1.
The optimal product price satisfies the following:
(1)
Only firm G is manipulating sales; we have p G , 2 Y N > p G , 2 N N , p D , 2 Y N < p D , 2 N N .
(2)
Only firm D is manipulating sales; we have p G , 2 N Y < p G , 2 N N , p D , 2 N Y > p D , 2 N N .
(3)
Both firms are manipulating sales:
(i)
When X G Y Y > X D Y Y , we have p G , 2 Y Y > p G , 2 N N and p D , 2 Y Y < p D , 2 N N .
(ii)
When X G Y Y < X D Y Y , we have p G , 2 Y Y < p G , 2 N N and p D , 2 Y Y > p D , 2 N N .
Proof.
By comparing the optimal product prices under the YN model, NY model, and YY model with the optimal product prices under the NN model, we obtain:
p G , 2 Y N p G , 2 N N = X G Y N β ( 2 γ D 3 γ G ) 2 ( γ D 2 γ G ) > 0 , p D , 2 Y N p D , 2 N N = X G Y N β γ G γ D 2 γ G < 0
p G , 2 N Y p G , 2 N N = X D N Y β ( 2 γ D 3 γ G ) 2 ( γ D 2 γ G ) < 0 , p D , 2 N Y p D , 2 N N = X D N Y β γ G γ D 2 γ G > 0
p G , 2 Y Y p G , 2 N N = ( X G Y Y X D Y Y ) β ( 2 γ D 3 γ G ) 2 ( γ D 2 γ G ) , p D , 2 Y Y p D , 2 N N = ( X G Y Y X D Y Y ) β γ G γ D 2 γ G
Proposition 1 (1) indicates that under the YN model, the price of fresh product G is always higher than its price under the NN model, while the price of product D is always lower than NN model. Specifically, since only fresh enterprise G engages in sales manipulation, consumers’ sales comparison utility for purchasing product D decreases. As a result, product G becomes more attractive, leading consumers to prefer purchasing it. Consequently, enterprise G raises its product price to gain more profit, while enterprise D lowers its price to attract more consumers.
Proposition 1 (2) indicates that under the NY model, the price of fresh product D is always higher than its price under the NN model, while the price of product G is always lower than NN model, for reasons similar to the case where only enterprise G engages in sales manipulation.
Proposition 1 (3) indicates that under the YY model, the prices of products G and D do not increase or decrease in sync with the sales manipulation volume but exhibit asymmetric changes. Specifically, when fresh enterprise G manipulates sales to a greater extent, the price of fresh product G is always higher than its price under the NN model, while the price of product D is always lower than NN model (similar to the case where only enterprise G engages in sales manipulation). At this time, although fresh enterprise D also engages in sales manipulation, its manipulation intensity is weaker, making it more affected by the overall manipulation of both enterprises. As a result, its sales comparison utility still decreases, forcing fresh enterprise D to lower its price to attract more consumers. Conversely, when fresh enterprise D manipulates sales to a greater extent, the price changes resemble those in the case where only enterprise D engages in sales manipulation. In this scenario, although enterprise G also engages in sales manipulation, it is more affected by enterprise D’s manipulation, leading to a decrease in the price of product G, thus resulting in an asymmetric relationship between price changes and sales manipulation.
Although sales manipulation can temporarily enhance the price of fresh products in the short term, in the long run, consumers may develop suspicion and dissatisfaction with dishonest pricing strategies, leading to a significant decline in trust in the brand. As information becomes more widely available and consumers demand greater market transparency, an increasing number of consumers will choose competitors that uphold higher integrity, transparency, and fair competition. Consequently, fresh enterprises engaging in sales manipulation may ultimately suffer losses.

4.2. The Effect of Sales Manipulation on Market Share

Next, we discuss the effect of sales manipulation on market share functions and derive Proposition 2 as follows:
Proposition 2.
The optimal market share function satisfies:
(1)
Only firm G is manipulating sales; we have  F D , 2 Y N < F D , 2 N N , F G , 2 Y N > F G , 2 N N , F G , 2 Y N + F D , 2 Y N < F G , 2 N N + F D , 2 N N .
(2)
Only firm D is manipulating sales; we have  F D , 2 N Y > F D , 2 N N , F G , 2 N Y < F G , 2 N N , F G , 2 N Y + F D , 2 N Y > F G , 2 N N + F D , 2 N N .
(3)
Both firms are manipulating sales:
(i)
When  X G Y Y > X D Y Y ,   w e   h a v e F G , 2 Y Y > F G , 2 N N ,   F D , 2 Y Y < F D , 2 N N ,   F G , 2 Y Y + F D , 2 Y Y < F G , 2 N N + F D , 2 N N .
(ii).
When X G Y Y < X D Y Y , we have    F G , 2 Y Y < F G , 2 N N ,   F D , 2 Y Y > F D , 2 N N ,   F G , 2 Y Y + F D , 2 Y Y > F G , 2 N N + F D , 2 N N .
Proof.
By comparing the optimal market share functions under the YN model, NY model, and YY model with the optimal market share functions under the NN model, we obtain:
F G , 2 Y N F G , 2 N N = X G Y N β ( 2 γ D 3 γ G ) 2 ( γ D 2 γ G ) ( γ D γ G ) > 0 , F D , 2 Y N F D , 2 N N = X G Y N β γ G 2 γ D ( γ D γ G ) < 0
( F G , 2 Y N + F D , 2 Y N ) ( F G , 2 N N + F D , 2 N N ) = X G Y N β ( γ D γ G ) α γ D ( γ D 2 γ G ) < 0
F G , 2 N Y F G , 2 N N = X D N Y β ( 2 γ D 3 γ G ) 2 ( γ D 2 γ G ) ( γ D γ G ) < 0 , F D , 2 N Y F D , 2 N N = X D N Y β γ G 2 γ D ( γ D γ G ) > 0
( F G , 2 N Y + F D , 2 N Y ) ( F G , 2 N N + F D , 2 N N ) = X D N Y β ( γ D γ G ) γ D ( γ D 2 γ G ) > 0
F G , 2 Y Y F G , 2 N N = ( X D Y Y X G Y Y ) β ( 2 γ D 3 γ G ) 2 ( γ D 2 γ G ) ( γ D γ G ) , F D , 2 Y Y F D , 2 N N = ( X G Y Y X D Y Y ) β γ G 2 γ D ( γ D γ G )
( F G , 2 Y Y + F D , 2 Y Y ) ( F G , 2 N N + F D , 2 N N ) = β ( X D Y Y X G Y Y ) ( γ D γ G ) γ D ( γ D 2 γ G )
Proposition 2 (1) indicates that under the YN model, the market share of fresh product G is always higher than that under the NN model, while the market share of fresh product D is always lower than that under the NN model. However, interestingly, the total market share in the YN model is always smaller than the NN. Specifically, although the price of fresh product G increases, consumers’ sales comparison utility for purchasing G increases significantly when only fresh enterprise G engages in sales manipulation. As a result, consumers become more inclined to buy product G, leading to an increase in its market share. Meanwhile, despite the price decrease for product D, the sharp decline in its sales comparison utility, coupled with its inherently lower quality compared to product G, results in reduced willingness among consumers to purchase product D. Consequently, the market share loss of fresh enterprise D outweighs the market share gain of enterprise G, causing the artificial market expansion effect to gradually fade and the total market share to decline. This also implies that although fresh enterprises can gain market share through sales manipulation, such behavior ultimately harms the market. Therefore, fresh enterprises should adopt a long-term sustainable development strategy and avoid relying on short-term tactics like sales manipulation to gain market share.
Proposition 2 (2) indicates that under the NY model, the market share of fresh product D is always higher than that under the NN model, while the market share of fresh product G is always lower than that under the NN model. However, unlike the YN model, the total market share under the NY model is always greater than that under the NN model. This is because when the sales volume of product D is artificially inflated, the increase in its sales comparison utility compensates for its lower product quality, attracting more consumers into the market and leading to a short-term increase in total market share. However, rather than focusing on the temporary rise in total market share, establishing a stable and long-term consumer relationship is more important. Transparent and honest business practices help build consumer trust, enhance customer loyalty, and create a positive feedback loop.
Proposition 2 (3) indicates that under the YY model, the market shares of fresh products G and D also exhibit asymmetric changes with respect to sales manipulation. Specifically, when fresh enterprise G engages in more sales manipulation, the market share of fresh product G is always higher than that under the NN model, while the market share of product D is always lower than that under the NN model (similar to the scenario where only enterprise G manipulates sales). Although fresh enterprise D also engages in sales manipulation in this case, the lower quality of product D compared to product G makes enterprise D more vulnerable to the impact of competitive sales manipulation, leading to a further decrease in its sales comparison utility and, consequently, a reduction in its market share. Conversely, when enterprise D engages in more sales manipulation, market share changes resemble those observed when only enterprise D manipulates sales, resulting in an asymmetric relationship between market share and sales manipulation. Therefore, even though both fresh enterprises engage in sales manipulation, such behavior does not necessarily lead to the expected increase in market share. For enterprises, mutual sales manipulation is ultimately harmful. Thus, companies should avoid relying on short-term tactics like sales manipulation to gain market share. Instead, they should focus on enhancing their core competitiveness through innovation, quality improvement, and brand building to establish a strong position in a highly competitive market.

4.3. The Effect of Sales Manipulation on Firm Profit

Next, we discuss the effect of sales manipulation of corporate profits and derive Proposition 3 as follows:
Proposition 3.
The optimal profit function satisfies:
(1)
Only firm G is manipulating sales:
(i)
For firm G:  0 < c < c 1 , π G , 2 Y N > π G , 2 N N ; When c 1 < c < c 0 and 0 < X G Y N < X G 1 , π G , 2 Y N < π G , 2 N N ; When c 1 < c < c 0 and X G 1 < X G Y N < X G 0 , π G , 2 Y N > π G , 2 N N , where:
c 1 = β ( 2 γ D 3 γ G ) ( K 2 K 1 ) 4 ( γ D 2 γ G ) 3 ( γ D γ G ) , X G 1 = b 1 a 1 , a 1 = β 2 ( 2 γ D 3 γ G ) 2 ( γ D 2 γ G ) ,
b 1 = β ( 2 γ D 3 γ G ) ( K 2 K 1 ) 4 c ( γ D γ G ) ( γ D 2 γ G ) 3
(ii)
For firm D: π D , 2 Y N < π D , 2 N N
(2)
Only firm D is manipulating sales:
(i)
For firm G, π G , 2 N Y < π G , 2 N N
(ii)
For firm D, when  0 < c < c 2 , π D , 2 N Y > π D , 2 N N ; when c 2 < c < c 0  and  0 < X D N Y < X D 1 , π D , 2 N Y < π D , 2 N N ; when c 2 < c < c 0  and  X D 1 < X D N Y < X D 0 , π D , 2 N Y > π D , 2 N N , where:
c 2 = β γ G [ β γ G 2 γ D ( γ D γ G ) ( γ D 2 γ G ) ] 2 γ D ( γ D 2 γ G ) 2 ( γ D γ G ) , X D 1 = b 2 a 2 , a 2 = β 2 γ G 2 ( γ D 2 γ G )
b 2 = β γ G [ β γ G 2 γ D ( γ D γ G ) ( γ D 2 γ G ) ] 2 c γ D ( γ D 2 γ G ) 2 ( γ D γ G )
(3)
When both firms engage in sales manipulation:
(i)
For firm G, when  0 < X G Y Y < X G 2 , π G , 2 Y Y < π G , 2 N N ; when X G 2 < X G Y Y < X G 0 , π G , 2 Y Y > π G , 2 N N , where:
X G 2 = β ( 2 γ D 3 γ G ) ( K 2 K 1 ) + 2 X D Y Y β 2 ( 2 γ D 3 γ G ) 2 ( γ D 2 γ G ) 4 c ( γ D 2 γ G ) 3 ( γ D γ G ) K 3 2 β 2 ( 2 γ D 3 γ G ) 2 ( γ D 2 γ G )
K 3 = 16 c 2 ( 2 γ G γ D ) 6 ( γ G γ D ) 2 + 8 c β ( 3 γ G 2 γ D ) ( γ D 2 γ G ) 3 ( γ D γ G ) [ ( K 2 K 1 ) + 2 X D Y Y β ( γ D 2 γ G ) ( 2 γ D 3 γ G ) ] + β 2 ( 2 γ D 3 γ G ) 2 ( K 2 K 1 ) 2
For firm D, when 0 < X D Y Y < X D 2 , π D , 2 Y Y < π D , 2 N N ; when X D 2 < X D Y Y < X D 0 , π D , 2 Y Y > π D , 2 N N , where:
X D 2 = 2 c γ D ( γ D 2 γ G ) 2 ( γ D γ G ) + β γ G [ γ D ( γ D γ G ) ( γ D 2 γ G ) β γ G 2 + 2 X G Y Y β γ G ( γ D 2 γ G ) ] + K 4 2 β 2 ( 2 γ D 3 γ G ) 2 ( γ D 2 γ G )
K 4 = 4 X G Y Y β 3 γ G 3 ( 2 γ G γ D ) [ γ D ( γ G γ D ) ( 2 γ G γ D ) β γ G 2 + X G Y Y β γ G ( γ D 2 γ G ) + 2 c γ D ( γ D 2 γ G ) 2 ( γ G γ D ) + β γ G [ γ D ( γ G γ D ) ( 2 γ G γ D ) β γ G 2 + 2 X G Y Y β γ G ( γ D 2 γ G ) ] 2
Proof.
By comparing the optimal profit function under the YN model with the optimal profit function under the NN model, we obtain:
π G , 2 Y N π G , 2 N N = X G Y N ( a 1 X G Y N + b 1 ) 4 ( γ D 2 γ G ) 3 ( γ D γ G )
π D , 2 Y N π D , 2 N N = X G Y N β [ β γ G ( γ D 2 γ G ) X G Y N + γ D ( γ D γ G ) ( γ D 2 γ G ) β γ G 2 ] 2 γ D ( γ D 2 γ G ) 2 ( γ D γ G )
For firm G, since a 1 > 0 , when b 1 > 0 , i.e., 0 < c < c 1 , then a 1 X G Y N + b 1 > 0 ; thus, π G , 2 Y N > π G , 2 N N is always established. When b 1 < 0 , i.e., c 1 < c < c 0 , then a 1 X G Y N + b 1 < 0 . At this moment, when 0 < X G Y N < X G 1 , π G , 2 Y N < π G , 2 N N . When X G 1 < X G Y N < X G 0 , π G , 2 Y N > π G , 2 N N .
For firm D, since 0 < X G Y N < X G 0 , then β γ G ( 2 γ G γ D ) X G Y N + γ D ( γ G γ D ) ( 2 γ G γ D ) β γ G 2 > 0 is always established; therefore π D , 2 Y N < π D , 2 N N .
By comparing the optimal profit function under the NY model with the optimal profit function under the NN model, we obtain:
π G , 2 N Y π G , 2 N N = X D N Y β ( 2 γ D 3 γ G ) [ β ( 2 γ D 3 γ G ) ( γ D 2 γ G ) X D N Y + ( K 2 K 1 ) ] 4 ( γ D 2 γ G ) 3 ( γ D γ G )
π D , 2 N Y π D , 2 N N = X D N Y ( a 2 X D N Y + b 2 ) 2 γ D ( γ D 2 γ G ) 2 ( γ D γ G )
For firm G, since 0 < X D N Y < X D 0 , then β ( 2 γ D 3 γ G ) ( γ D 2 γ G ) X D N Y + ( K 2 K 1 ) < 0 is always established, π G , 2 N Y < π G , 2 N N .
For firm D, since a 2 < 0 , when b 2 < 0 , i.e., 0 < c < c 2 , then a 2 X D N Y + b 2 < 0 ; thus, π D , 2 N Y > π D , 2 N N is always established. When b 2 > 0 , i.e., c 2 < c < c 0 , then a 2 X D N Y + b 2 > 0 . At this moment, when 0 < X D N Y < X D 1 , then π D , 2 N Y < π D , 2 N N . When X D 1 < X D N Y < X D 0 , π D , 2 N Y > π D , 2 N N .
By comparing the optimal profit function under the YY model with the optimal profit function under the NN model, we obtain:
π G , 2 Y Y π G , 2 N N = a 1 X G Y Y 2 + b 3 X G Y Y + n 1 4 ( γ D 2 γ G ) 3 ( γ D γ G )
π D , 2 Y Y π D , 2 N N = a 2 X D Y Y 2 + b 4 X D Y Y + n 2 2 γ D ( γ D 2 γ G ) 2 ( γ D γ G )
b 3 = β ( 2 γ D 3 γ G ) ( K 2 K 1 ) 4 c ( γ G γ D ) ( 2 γ G γ D ) 3 + 2 β 2 X D Y Y ( 2 γ D 3 γ G ) 2 ( γ D 2 γ G )
n 1 = X D Y Y β ( 2 γ D 3 γ G ) [ β ( 2 γ D 3 γ G ) ( γ D 2 γ G ) X D Y Y + ( K 2 K 1 ) ]
b 4 = β γ G [ β γ G 2 γ D ( γ D γ G ) ( γ D 2 γ G ) ] 2 c γ D ( γ D 2 γ G ) 2 ( γ D γ G ) 2 β 2 γ G 2 X G Y Y ( γ D 2 γ G )
n 2 = X G Y Y β [ β γ G ( 2 γ G γ D ) X G Y Y + γ D ( γ G γ D ) ( 2 γ G γ D ) β γ G 2 ]
Thus, for firm G, since a 1 > 0 , n 1 < 0 , when 0 < X G Y Y < X G 2 , π G , 2 Y Y < π G , 2 N N ; when X G 2 < X G Y Y < X G 0 , π G , 2 Y Y > π G , 2 N N .
For firm G, since a 2 < 0 , n 2 > 0 , when 0 < X D Y Y < X D 2 , π D , 2 Y Y < π D , 2 N N ; when X D 2 < X D Y Y < X D 0 , π D , 2 Y Y > π D , 2 N N .□
Proposition 3 (1) states that under the YN model, for fresh food firm G, different conditions require different sales manipulation decisions based on the cost and expected benefits of manipulation. When sales manipulation costs are low or when the firm has the capacity for large-scale manipulation, engaging in sales manipulation is clearly beneficial. However, when manipulation costs are high and the firm can only engage in small-scale manipulation, refraining from sales manipulation is the better option. Specifically, first, when sales manipulation costs are low, firm G can always obtain higher product prices and market share through sales manipulation, and the resulting benefits exceed the cost of manipulation, ensuring that any level of manipulation leads to higher profits compared to the NN model. Second, when sales manipulation costs are high and the manipulation volume is relatively low, the invested manipulation cost does not lead to a significant increase in product prices or market share, making the return on investment unattractive. In this case, the firm’s profits will even be lower than in the NN model, meaning fresh food firm G should forgo sales manipulation. Finally, when manipulation costs are high but the manipulation volume is large, consumers may be influenced by the perception of a “bestselling” product and decide to purchase, leading to an actual increase in market share. Additionally, the profits generated by large-scale sales manipulation can compensate for the cost, allowing fresh food firm G to benefit from the strategy. For fresh food firm D, as long as firm G engages in sales manipulation, firm D’s profits will inevitably suffer. Since under the YN model, firm D experiences both lower product prices and market share, its profits will decline as a result.
Proposition 3 (2) states that when only fresh food firm D engages in sales manipulation, firm G’s profits will inevitably be harmed. For firm D itself, if sales manipulation costs are low or it can conduct large-scale manipulation, it may choose to engage in sales manipulation. However, if manipulation costs are high and the firm can only conduct small-scale manipulation, it should opt out of sales manipulation.
Proposition 3 (1) and (2), it can be concluded that when only firm G or D engages in sales manipulation, this behavior does not necessarily lead to increased profits. Sales manipulation disrupts the fair competition environment, putting honest pricing and compliant firms under greater market pressure. The negative impact on competing fresh food firms is unavoidable, exacerbating resource waste and price wars within the industry, ultimately leading to lower overall industry profitability. Therefore, using sales manipulation to establish monopoly power or suppress competitors is unwise and undesirable. Instead, firms should focus on building brand value, fostering cooperative and mutually beneficial strategies, and ensuring long-term market stability and healthy development.
Proposition 3 (3) states that when both firms engage in sales manipulation, it is unwise if their manipulation volumes are small, but if both engage in large-scale manipulation, they can benefit. Specifically, when both firms engage in small-scale manipulation, competition for market share intensifies, leading to excessive competition. However, small-scale sales manipulation does not generate a strong enough market impact to yield significant economic benefits, while firms still incur additional manipulation costs. As a result, both firms earn lower profits compared to when neither engages in manipulation, making it evident that avoiding sales manipulation is the wiser decision. Conversely, when both firms engage in large-scale manipulation, the increased sales comparison utility and resulting higher profits can offset the cost of manipulation, leading to higher profits than in the NN model. However, in the long run, if consumers discover the sales manipulation tactics, public trust in the firms will decline sharply. Damage to brand reputation and reduced credibility will inevitably lead to customer loss, ultimately harming the firm’s profitability.

5. Numerical Analysis

Numerical analysis is used to discuss the effect of sales manipulation of product prices, market share, and company revenues, further assessing the advantages and disadvantages of this behavior for both companies and the market. Based on the assumptions made earlier in the paper and referring to the parameter settings in the relevant literature, a numerical simulation analysis is conducted [17,18,21]. The parameter settings are shown in Table 2.
To ensure that neither of the two competing companies exits the market and that the total market share displayed at each stage does not exceed 1, the conditions 0 < X G j < 0.172 , 0 < X D j < 0.635 must be met.

5.1. The Effect of Sales Manipulation for Product Prices

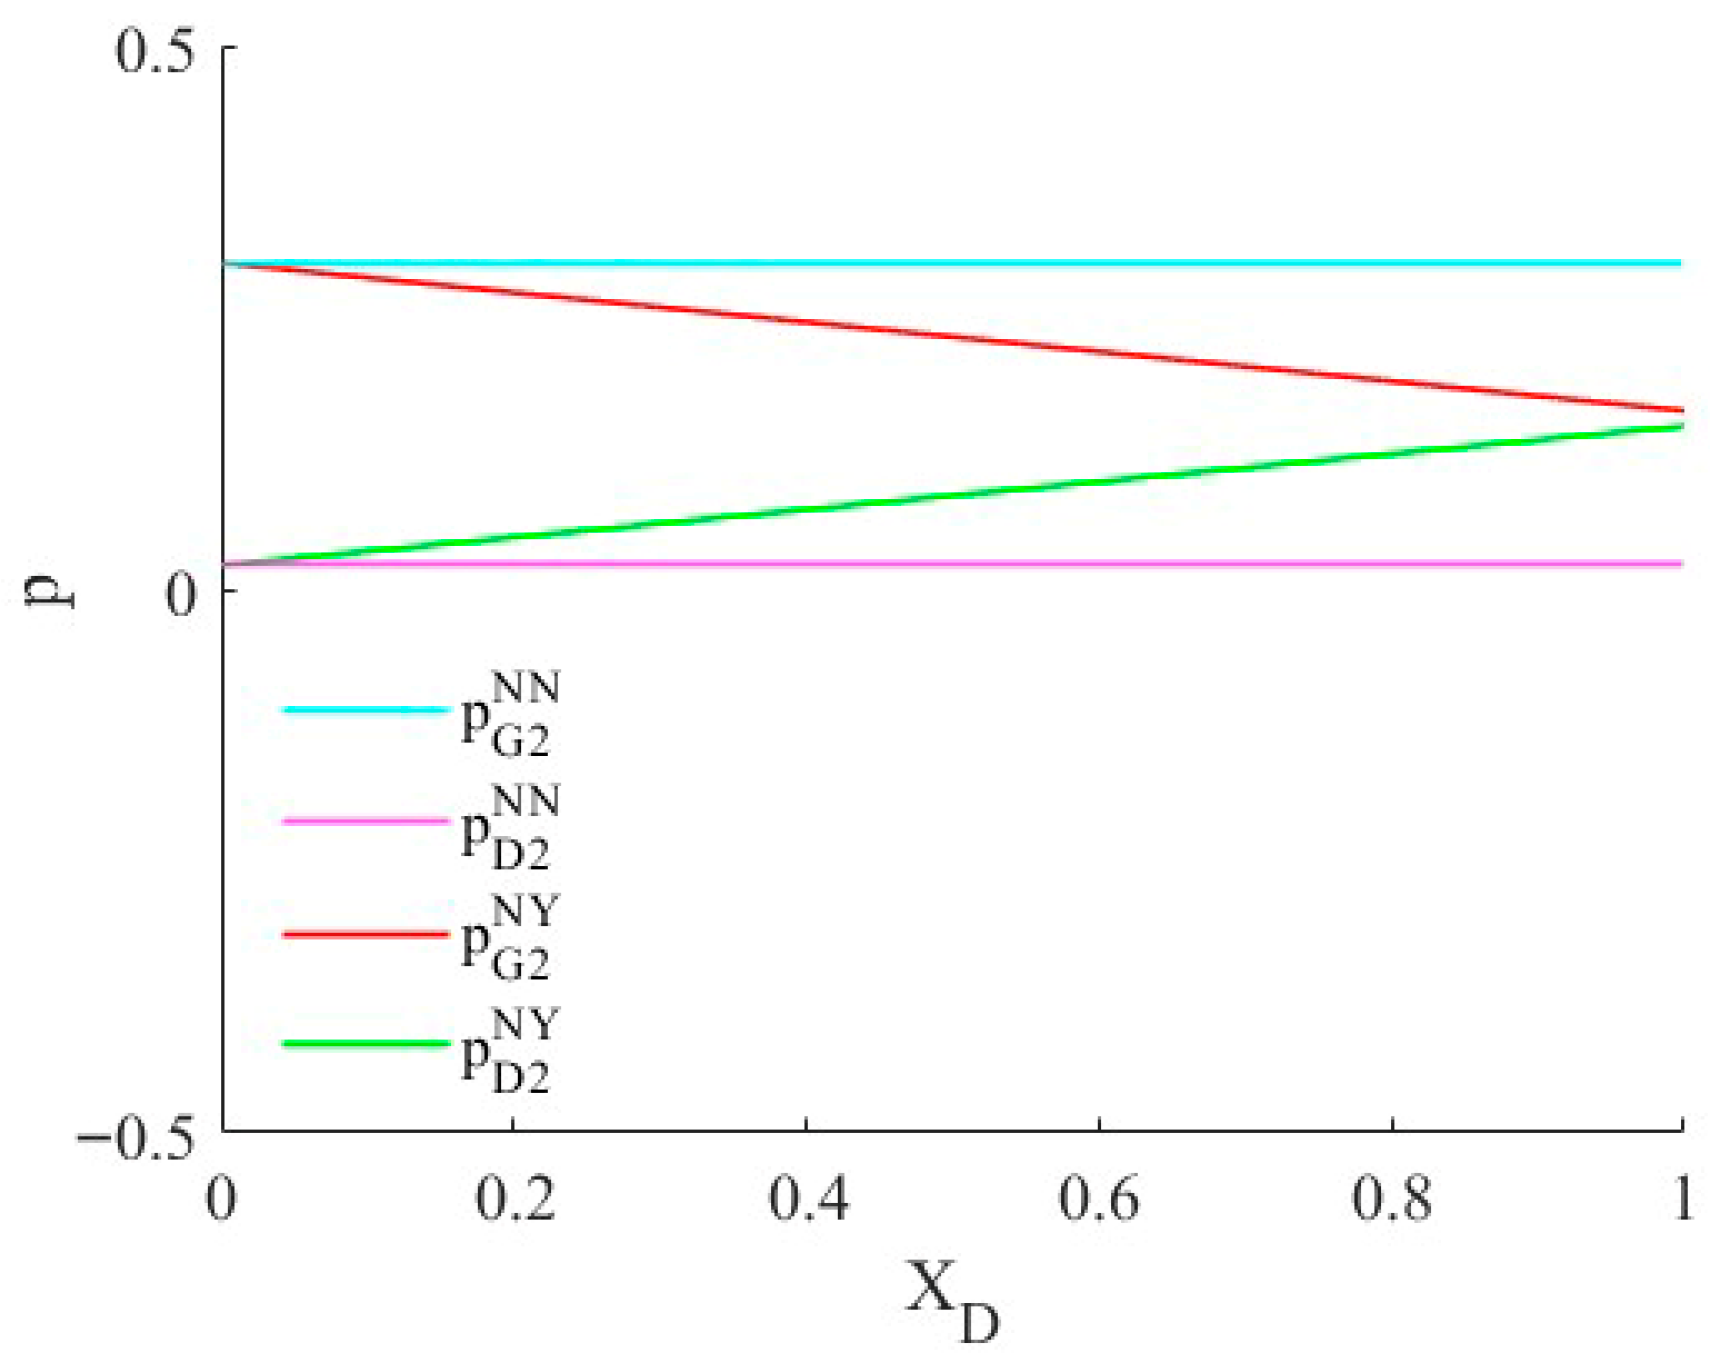
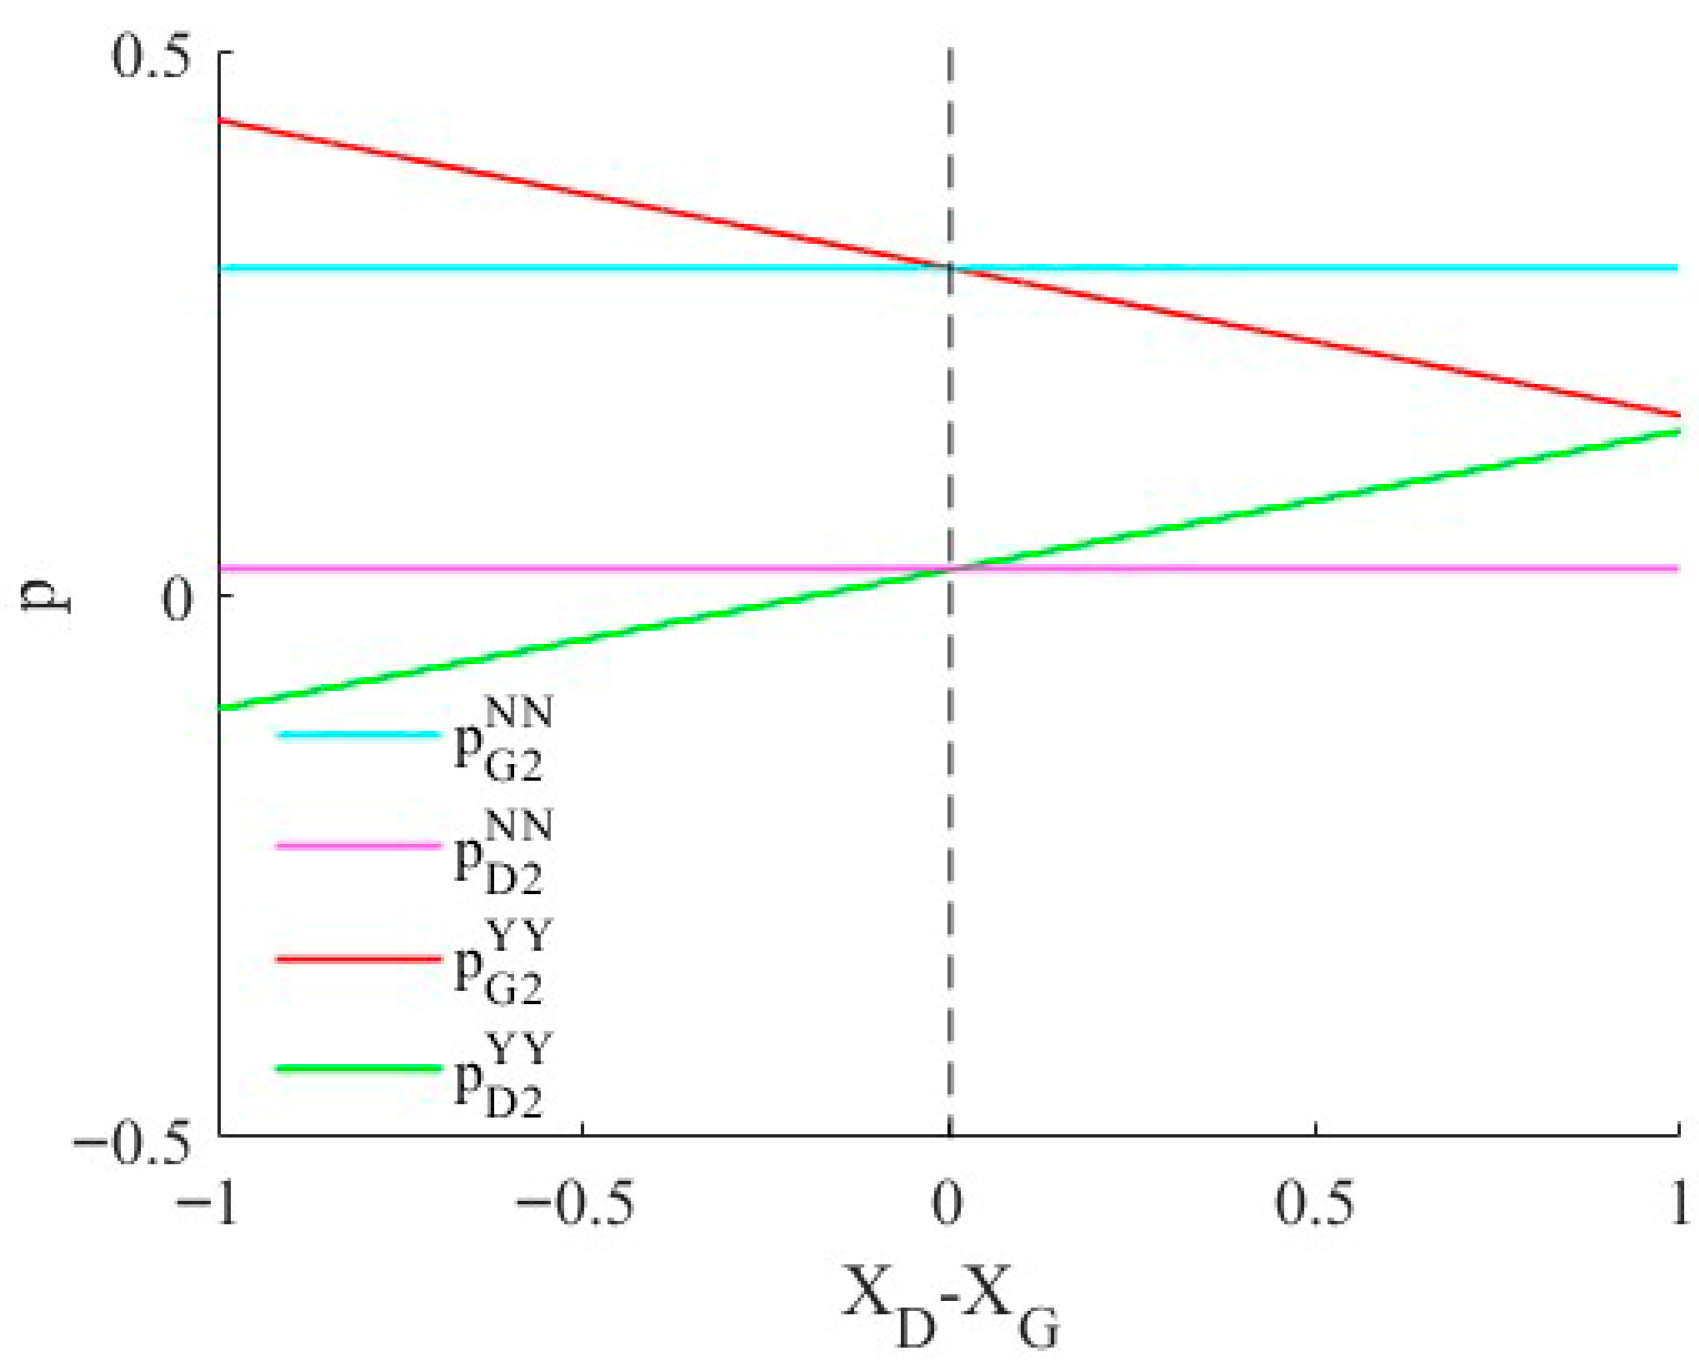
In this section, the product prices under the YN, NY, and YY models are compared with the NN model. The results are presented separately in Figure 2, Figure 3 and Figure 4 for clearer visualization.
Firstly, as shown in Figure 2 and Figure 3, when only fresh product firm i engages in sales manipulation, the behavior benefits the product price of firm i, which is consistently higher than in the NN model. At the same time, this manipulation harms the competitor’s product price, making it consistently lower than under the NN model. Propositions 1 (1) and (2) have been verified. Secondly, as shown in Figure 4, under symmetric sales manipulation—when both fresh product firms engage in manipulation—the relative manipulation volume of firms D and G is negative impact with product G of the price and positive direction with product D. If firm i manipulates more, its product price will always be higher than in the case where neither firm manipulates, while the competitor’s product price will be lower than in the non-manipulated scenario. Finally, when neither firm engages in manipulation, the price of product G is always higher than that of product D, and since there is no manipulation involved, the product price remains unrelated to X i j . Proposition 1 (3) has been verified.
Figure 2, Figure 3 and Figure 4 illustrate that when only one firm manipulates, it always gains in terms of product price, but always at the expense of its competitor. When both firms manipulate, the one that manipulates more enjoys a higher price, while the other suffers a price drop. Undoubtedly, this creates a severe blow to the competing firm. As a result, both firms typically have the incentive to engage in sales manipulation to achieve a better price. However, when fresh product firms manipulate sales—especially given the perishable nature of fresh products—consumers are unable to assess true product quality through real sales or market feedback. When they discover the actual quality falls short of the marketed claims, it significantly undermines their purchase experience and erodes trust in the brand. Over time, such dishonest practices will cause consumers to lose trust in the entire market, damaging the long-term health of the industry. Therefore, companies should recognize that sustained brand reputation and consumer trust are the keys to long-term success. Short-term sales manipulation may bring temporary gains but can lead to serious reputational damage. Instead, firms should focus on building a strong corporate image, engaging in honest business practices, taking social responsibility seriously, and exploring win–win collaborations with other firms to resist the temptations brought by artificial price increases through sales manipulation.

5.2. The Effect of Sales Manipulation for Market Share

To more intuitively compare the effect of sales manipulation on the market shares of the two competing firms, this subsection conducts a simulation analysis to further verify the propositions discussed earlier.
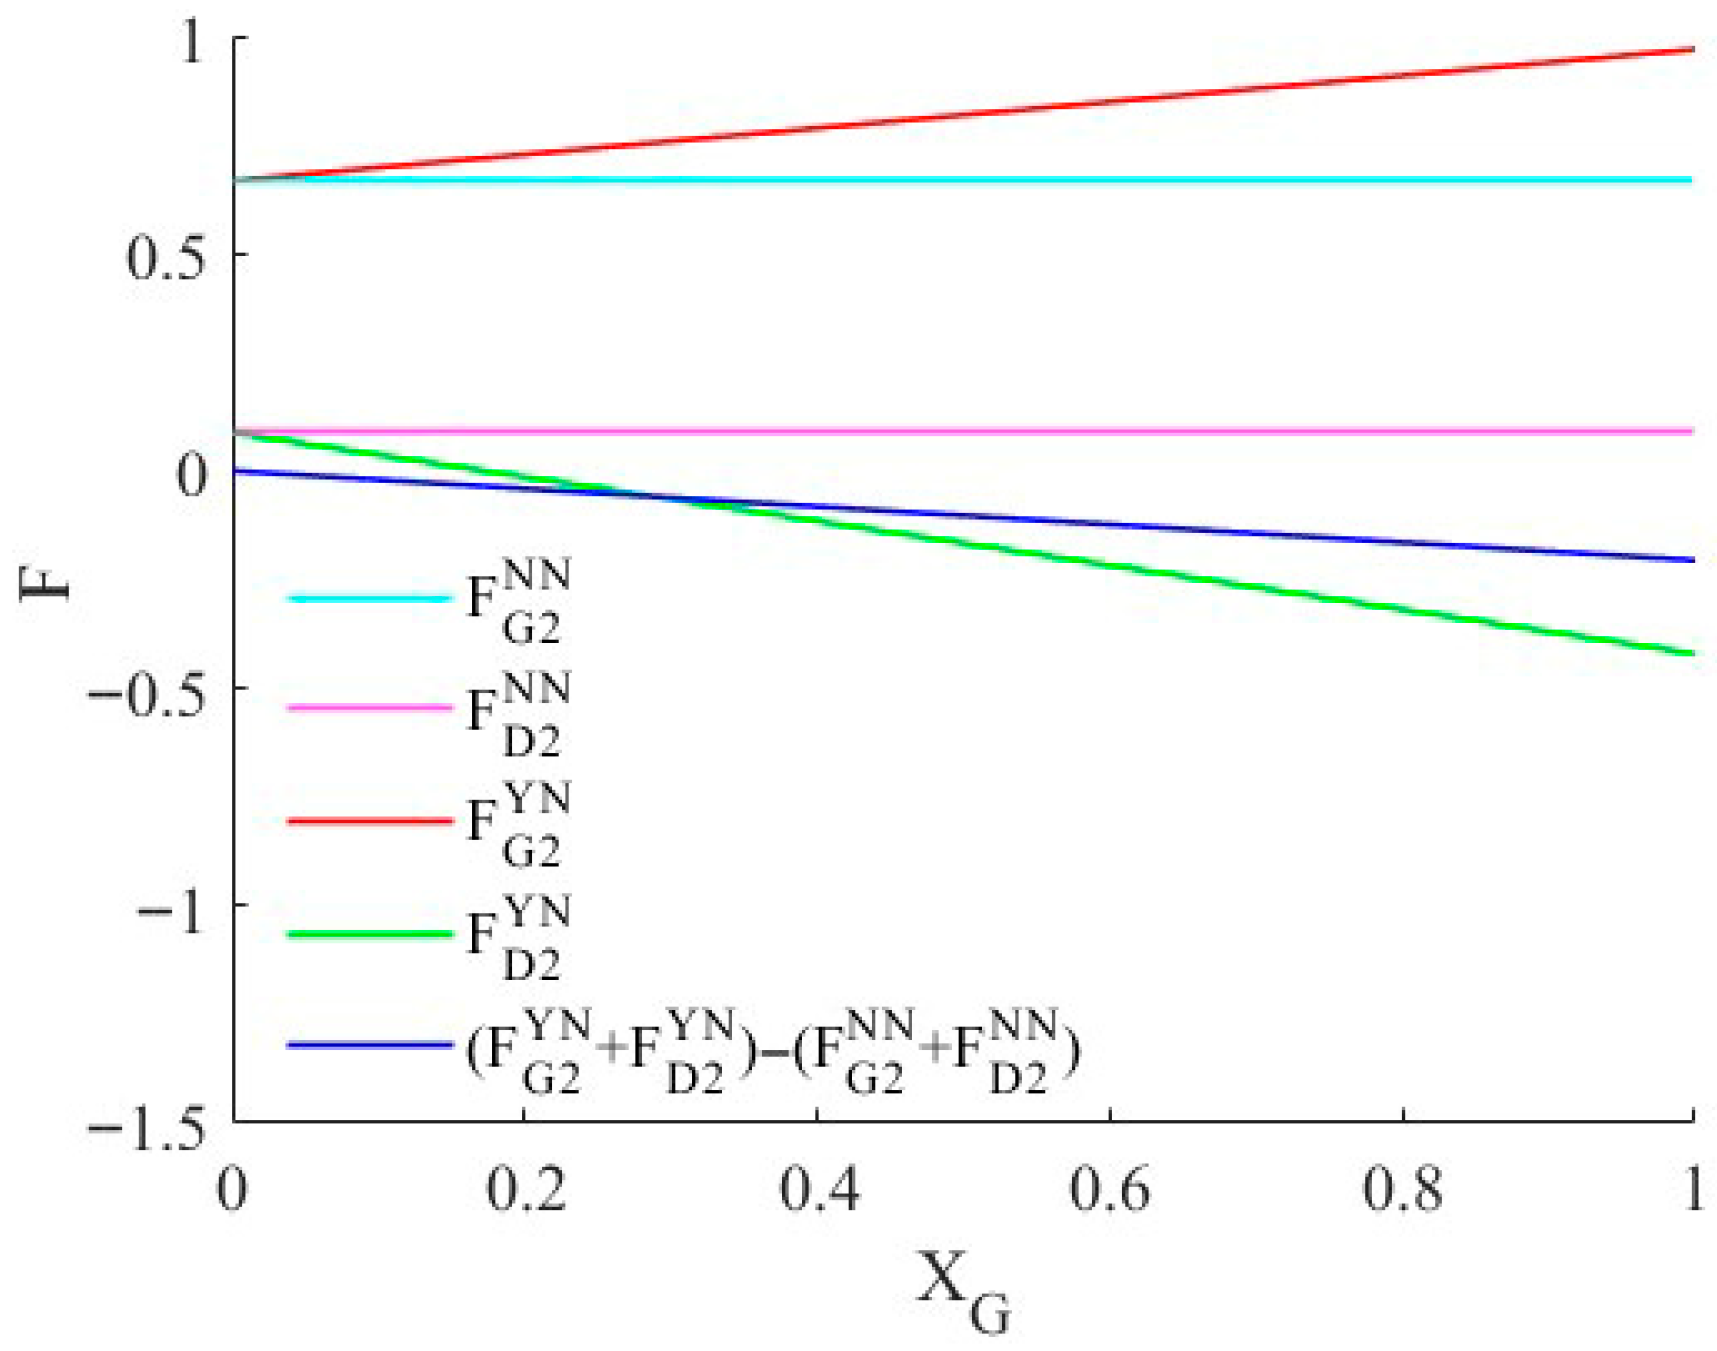
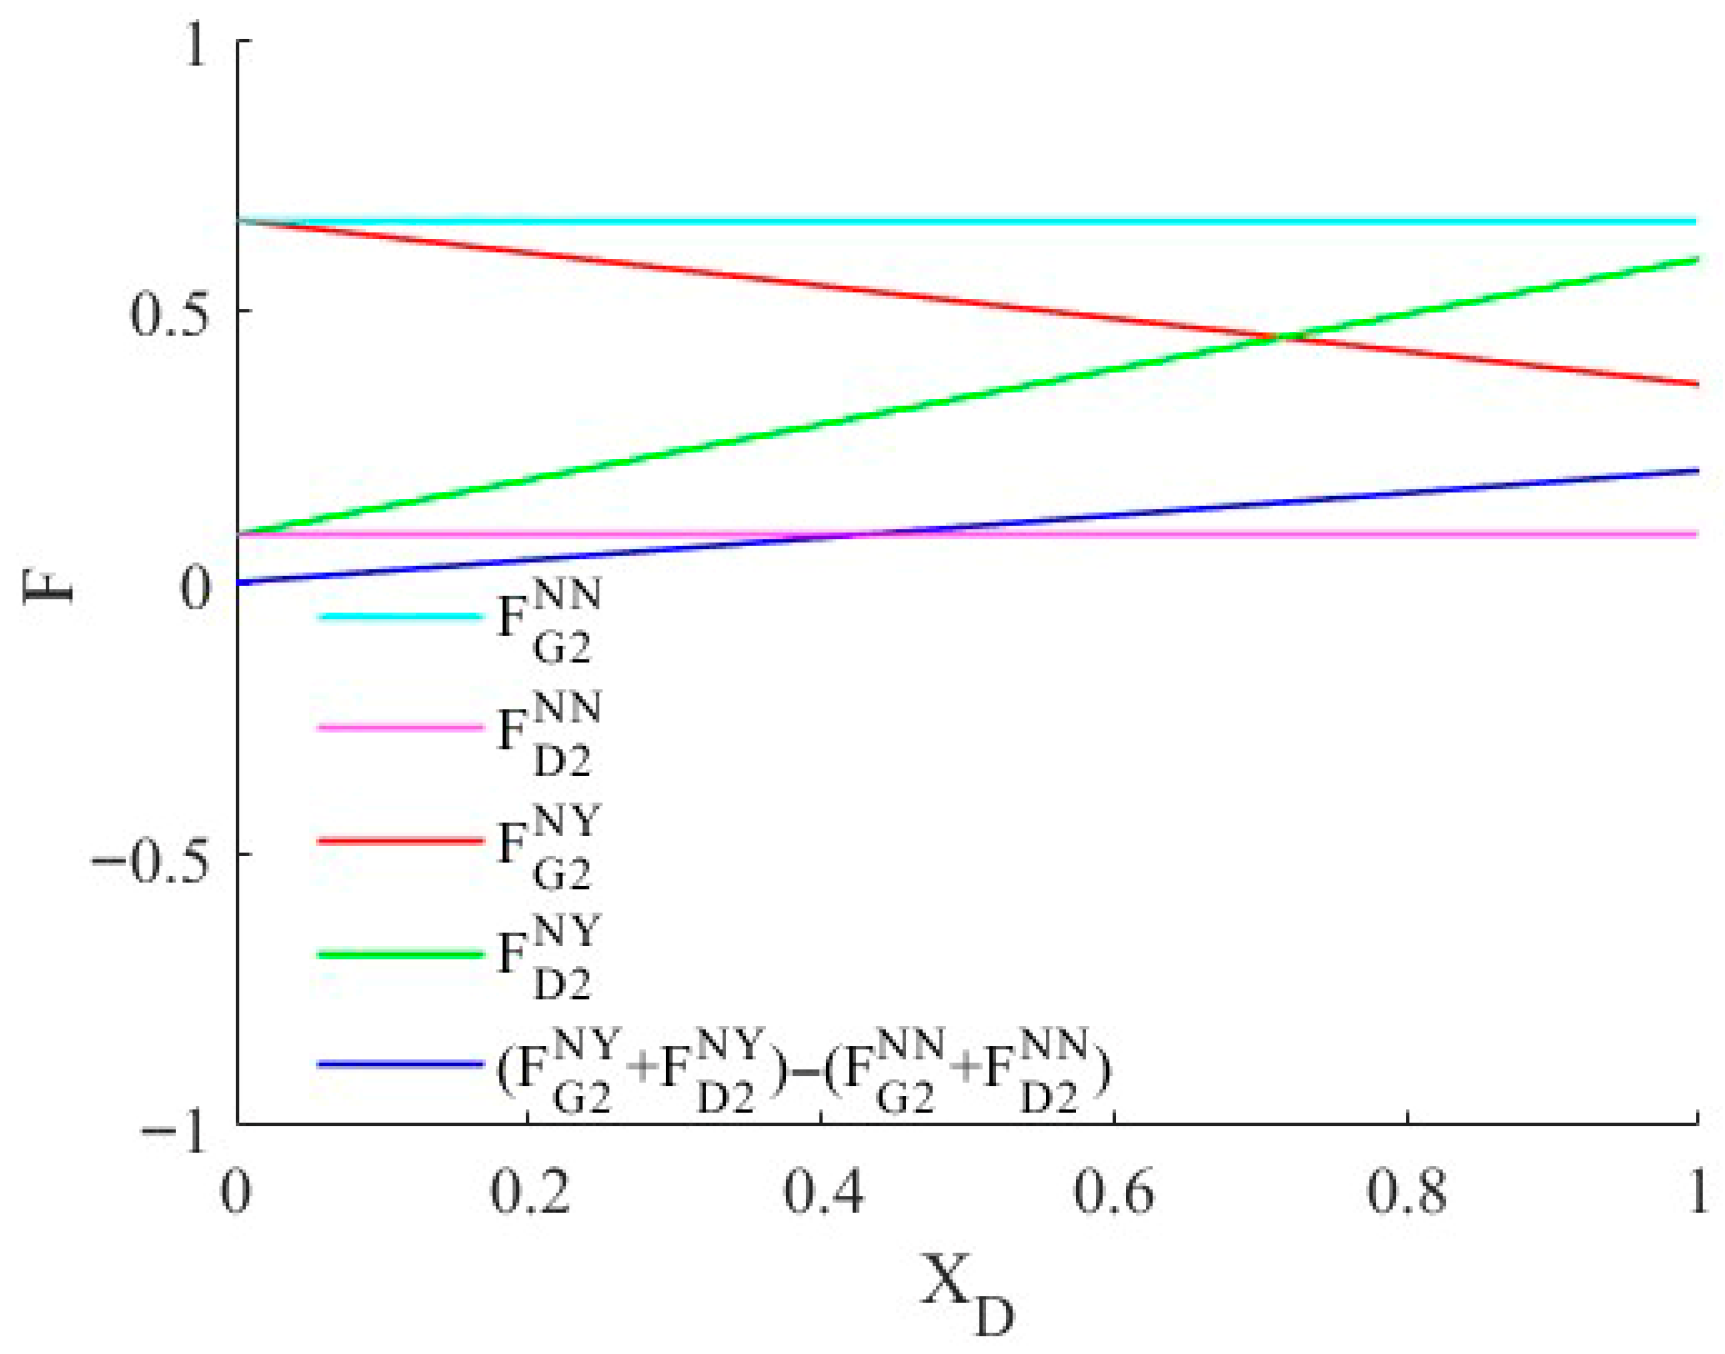
Firstly, as shown in Figure 5, Figure 6 and Figure 7, when only fresh product firm i engages in manipulation—its market share increases with the level of manipulation and always remains higher than under the NN model. At the same time, its competitor’s market share decreases with the increase in manipulation and remains consistently lower than under the NN model. The total market share of both firms increases when firm D engages in sales manipulation, but decreases when firm G does so. Proposition 2 (1)–(2) has been verified. Secondly, as shown in Figure 7, under symmetric sales manipulation, both firms engage in sales manipulation.
G negatively affects the market share of product G but positively affects the market share of product D. If firm i has a higher level of sales manipulation, then its market share always exceeds the corresponding share under the NN model, while its competitor’s market share always falls below that benchmark. Finally, in the NN model, the market share of product G is consistently higher than that of product D, and since no manipulation occurs, the market share is unrelated to any manipulation behavior. Proposition 2 (3) has been verified.
Figure 5, Figure 6 and Figure 7 illustrate that when a firm with lower product quality engages in sales manipulation, the total market share tends to rise. In such cases, market regulators may choose to “turn a blind eye” and adopt a non-intervention stance toward the manipulative behavior. Weak regulatory oversight or insufficient penalties allow lower-quality firms to improve their market performance through manipulation and further expand their market share. However, this increase in market share is marginal and does not indicate a true improvement in competitive strength. On the contrary, it may worsen unfair competition and distort the market environment. When only one party manipulates, that firm may temporarily benefit by increasing its market share. Yet, as manipulation intensifies, competitors suffer from market share erosion, and the fairness of competition gradually collapses. Over time, sales volumes no longer reflect the true value of products. When both firms engage in manipulation, the one that manipulates more will capture more market share, while the other loses out. In this scenario, the resources used for manipulation could—and should—have been invested in quality enhancement and service improvement. Instead, they are misallocated to artificially boost sales volume. This misallocation not only weakens the firm’s capacity for innovation but also leads more companies to focus on manipulating sales rather than improving product quality and customer experience. Over time, this will suppress the overall innovation capacity of the industry and lead to increasingly inefficient allocation of resources across the sector, for example, manipulating Amazon category rankings by directing traffic to product pages via external tools (such as Google Ads), whilst simultaneously employing virtual order tools to fabricate surges in sales volume, thereby rapidly boosting Best Seller Rank (BSR). Once rankings improve, genuine order volumes increase, further consolidating positions and creating a virtuous cycle.

5.3. The Effect of Sales Manipulation for Firm Profit

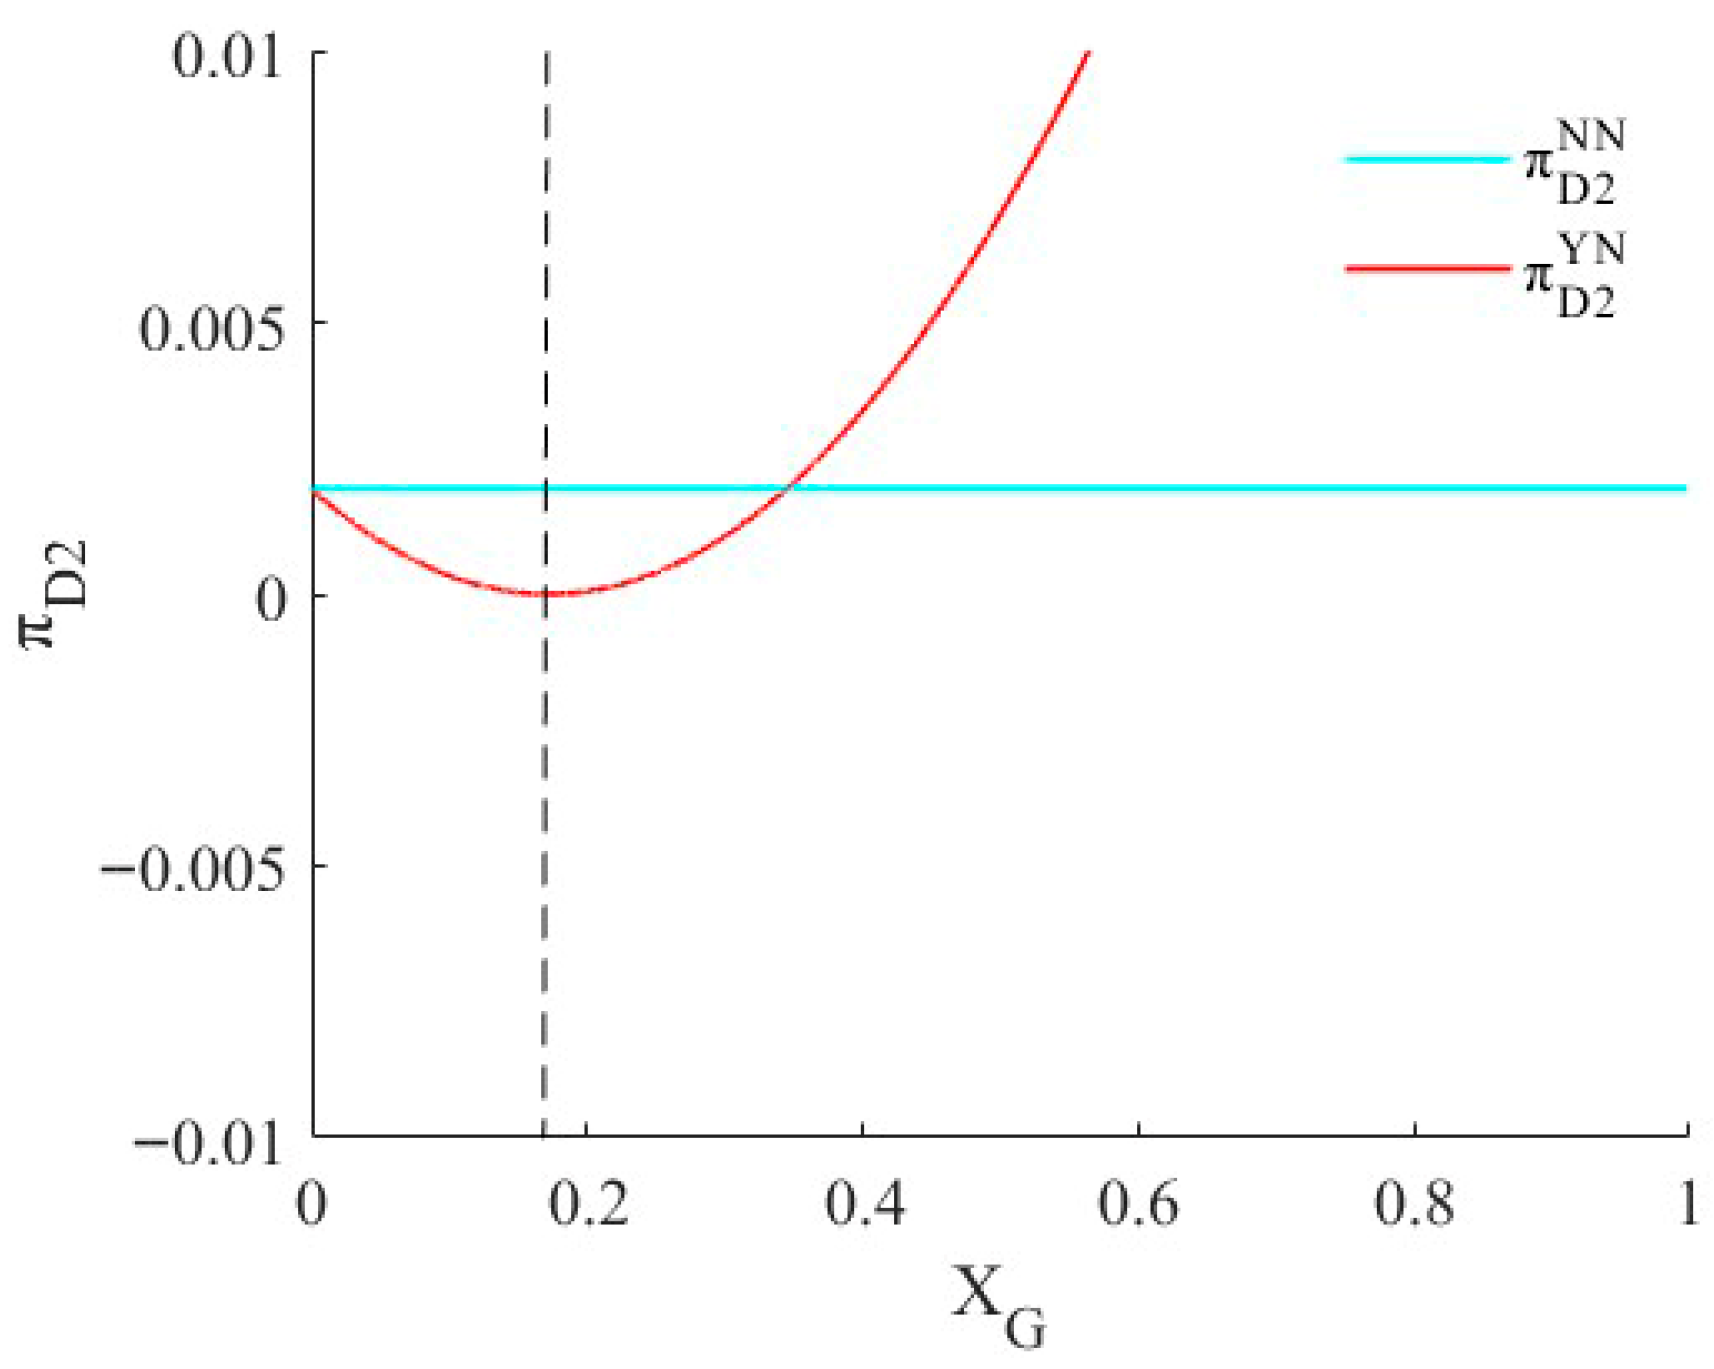
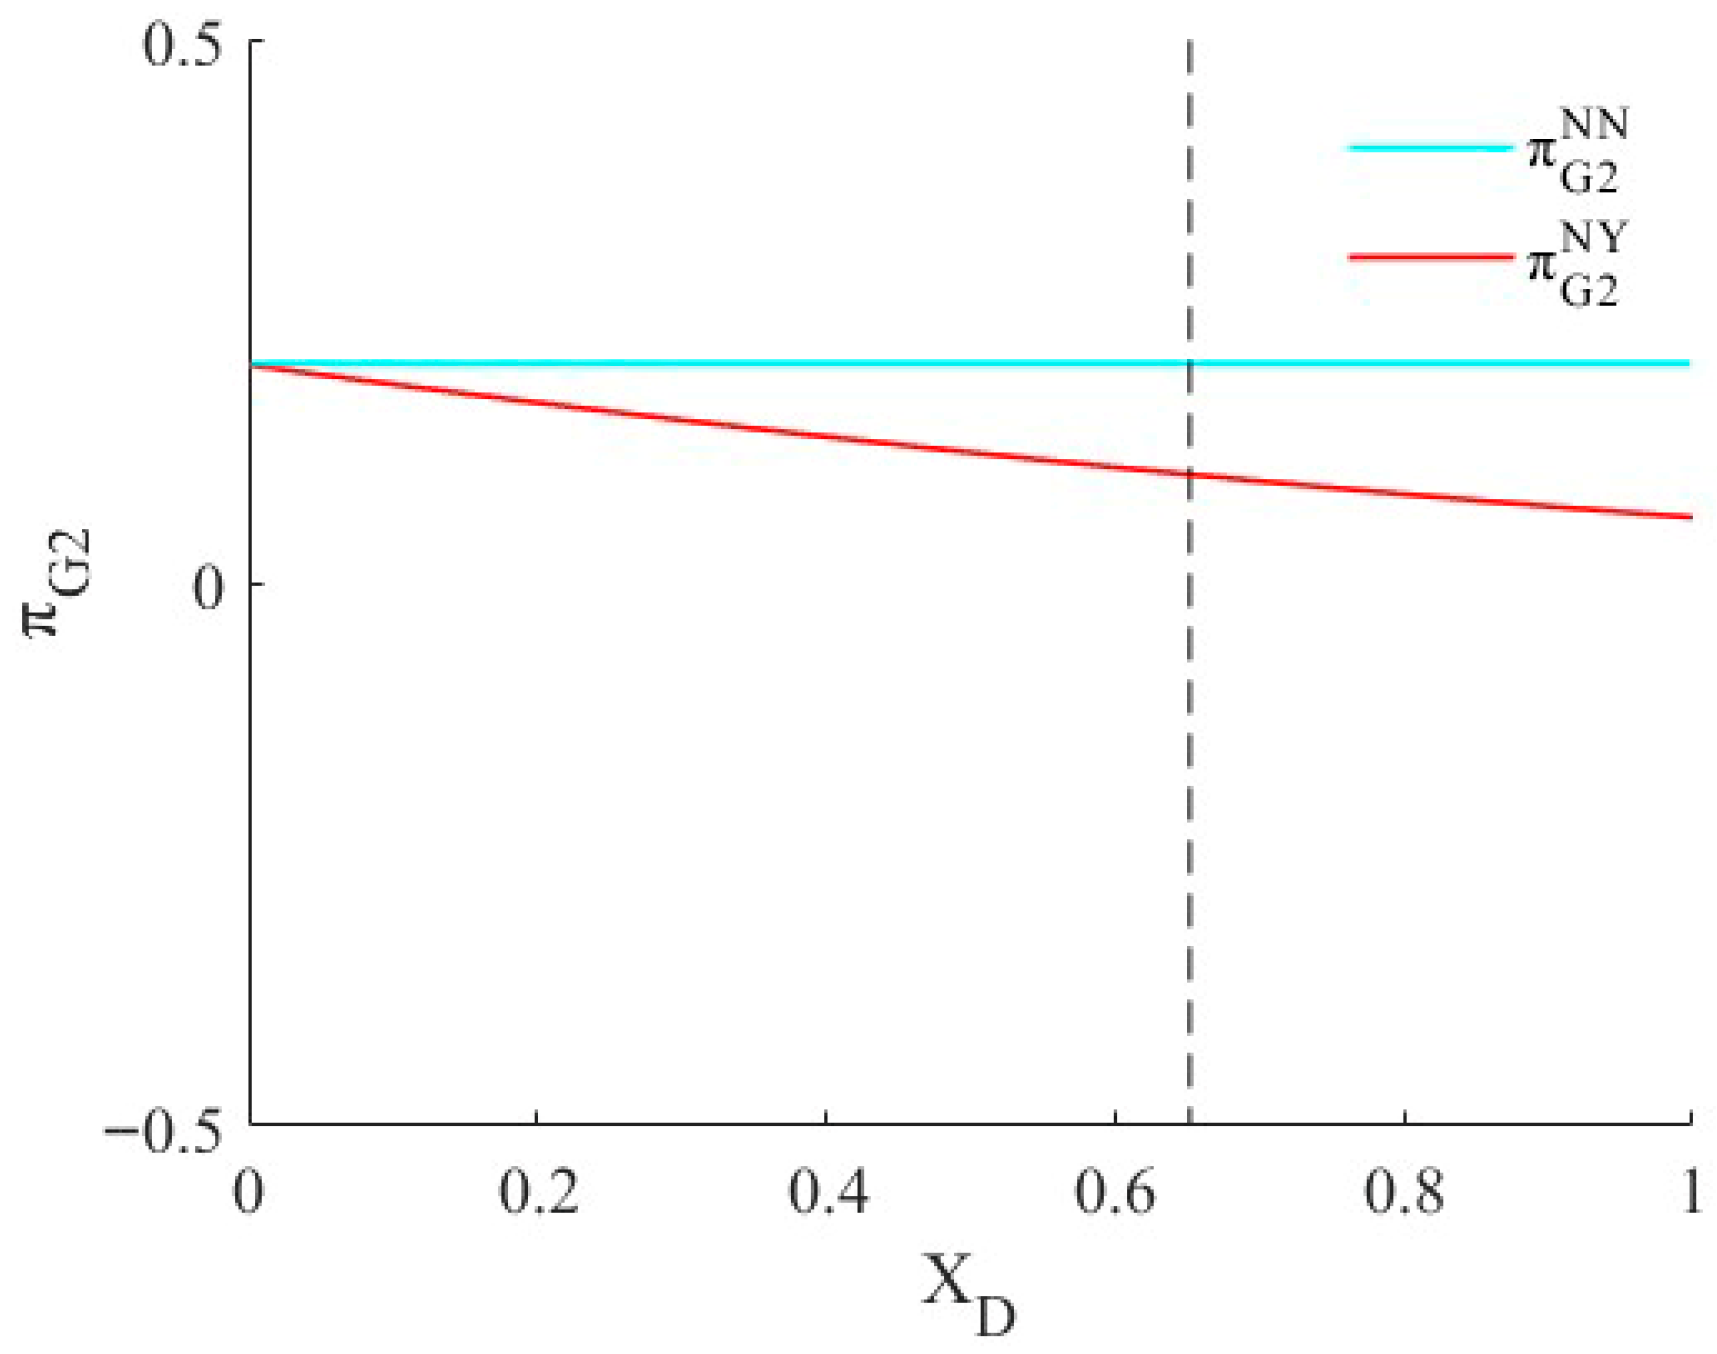
In this section, simulation analysis is used to further verify the propositions discussed earlier. The firm profits of the two firms under the YN model, NY model, and YY model are compared with those under the NN model through both two-dimensional and three-dimensional graphs, which are individually presented in Figure 8, Figure 9, Figure 10, Figure 11, Figure 12 and Figure 13 to provide clearer insights.
First, as shown in Figure 8, Figure 9, Figure 10 and Figure 11, under the YN and NY models, for the firm that engages in sales manipulation, if the cost is low or the manipulation quantity is sufficiently large, its profit will be higher than the profit under the NN model. Proposition 3 has been verified. However, if the cost is high and the manipulation quantity is small, the firm’s profit will be lower than the profit under the NN model, and the profit under the firm’s manipulation will intersect with the profit under the NN model. To the left of this intersection point, sales manipulation will result in profit, while to the right, the firm will incur losses and may exit the market. For the firm that does not engage in sales manipulation, no matter how much the competitor manipulates sales, the profit of the firm that does not manipulate sales will always be lower than that of the NN model. Furthermore, as shown in Figure 12 and Figure 13, under the YY model, since both firms engage in sales manipulation, both need to bear the cost of sales manipulation. Therefore, the firm’s profit is not affected by the sales manipulation cost. When both firms have a relatively high cost of sales manipulation (but still below the maximum manipulation quantity), they can benefit from the sales manipulation. Otherwise, the firm’s profit will have a negative correlation with the sales manipulation quantity.
Figure 8, Figure 9, Figure 10, Figure 11, Figure 12 and Figure 13 demonstrate that under asymmetric sales manipulation, engaging in sales manipulation does not always guarantee higher profits. Whether a firm benefits from sales manipulation depends on the manipulation cost and quantity. Under symmetric sales manipulation, whether a firm benefits depends on the sales manipulation quantity. Therefore, firms should think carefully before engaging in sales manipulation. In most cases, sales manipulation by fresh firms harms the firms themselves, their competitors, and the market. Firms should consider the market failures and consumer trust crises caused by sales manipulation, advocate for honest operations, and develop long-term brand strategies. They could also voluntarily disclose sales data, product evaluations, and other relevant information to enhance market transparency. Meanwhile, governments and relevant regulatory agencies should consider establishing data monitoring systems to track sales data in real-time, allowing for faster and more accurate analysis of sales fluctuations. By identifying any suspicious fluctuations, swift action can be taken to prevent the long-term spread of sales manipulation and promote a healthier market system.

6. Conclusions

Due to consumers’ concerns about their quality, fresh companies often adopt various strategies to increase consumers’ willingness to pay. In their pursuit of profit maximization and market share growth, one such strategy is sales manipulation—using fake sales volumes to attract consumers, which has gradually become a means for many fresh produce companies to boost sales, mislead consumers into making purchasing decisions, and gain a competitive advantage. Therefore, whether sales manipulation can indeed bring more profits to a company and give it a favorable position in price competition has become an important research topic. This study investigates the effect of sales manipulation on the prices, market share, and profits of fresh companies, both for the company itself and its competitors, by establishing four game models: one where neither company manipulates sales, one where only Company G manipulates sales, one where only Company D manipulates sales, and one where both companies manipulate sales. The following conclusions and managerial implications are drawn:
First, regarding fresh product prices, sales manipulation does not always benefit product prices. When only one company engages in sales manipulation, its manipulation will always increase its product price but will harm the competitor’s product price. In the case where both companies engage in sales manipulation, the company that manipulates more will have a higher product price but will also reduce the competitor’s price, as shown in Proposition 1 and Figure 2, Figure 3 and Figure 4. Therefore, companies should avoid sales manipulation to prevent the fresh industry from falling into a vicious competitive cycle. When both competitors manipulate sales, the long-term effects should be carefully evaluated, with a focus on actual consumer needs and building long-term brand reputation for sustainable development.
Second, regarding market share, sales manipulation does not always lead to increased market share. When only one company engages in sales manipulation, the manipulation is positively correlated with its market share but negatively correlated with the competitor’s share. When both companies manipulate sales, the sales manipulation volume causes asymmetrical changes in market share. A company must manipulate more than its competitor to increase market share, as shown in Proposition 2 and Figure 5, Figure 6 and Figure 7. Interestingly, when a company with lower product quality manipulates sales or manipulates more, it attracts more consumers to the market, but this increase in market share is minimal. Conversely, when a company with higher product quality manipulates sales, it may drive more consumers away, reducing overall market share. Therefore, companies should carefully consider the negative impacts and market consequences of sales manipulation, especially high-quality companies, which should balance the strengths and weaknesses while considering market health and conducting honest business practices to enhance their core competitiveness.
Finally, regarding profits, companies do not necessarily benefit from sales manipulation when only one company’s sales are manipulated; whether it benefits depends on the manipulation cost and quantity. If the cost is low or the company has the capacity for large-scale manipulation, profits will increase. However, if the cost is high and the company can only manipulate on a small scale, profits will decrease. When both companies engage in sales manipulation, profits will increase only if both companies manipulate sales at a high level; otherwise, manipulation will damage profits, as shown in Proposition 3 and Figure 8, Figure 9, Figure 10, Figure 11, Figure 12 and Figure 13. Therefore, companies should adopt a long-term perspective and avoid blindly pursuing short-term profits at the expense of brand building and market stability.
Based on this, future research can further explore the following areas: firstly, this paper focuses only on fresh companies that are both producers and retailers. However, in real life, many companies do not have full production capabilities and need to purchase products from suppliers. Therefore, future research can expand to examine the business strategies of fresh produce companies within a supply chain environment. This would involve exploring the negative effects of sales manipulation within the supply chain system, as well as how pricing strategies between fresh suppliers and retailers affect market stability and consumer welfare. Secondly, this paper assumes that the cost and the volume of sales manipulation have a linear relationship. However, in real life, the volume of sales manipulation is related to many factors, and its relationship with the cost of sales manipulation is often nonlinear. Therefore, future research can further provide the advantages and disadvantages of sales manipulation when the cost of sales manipulation and the volume of sales manipulation have a nonlinear relationship. Finally, this paper considers only sales manipulation behavior and its impact on product prices, market share, and corporate profits. However, in reality, governments or regulatory bodies will take regulatory measures against companies’ sales manipulation behaviors. Future research could incorporate government regulation factors to explore how different regulatory policies impact fresh companies’ sales manipulation behavior. This would allow for a more comprehensive analysis of how market mechanisms constrain corporate decision-making.

Author Contributions

Conceptualization was performed by N.S. and S.Q.; methodology was performed by N.S.; validation was performed by N.S.; formal analysis was performed by S.Q.; data curation was performed by S.Q.; original draft preparation was performed by Y.J.; review and editing were performed by S.Q. and Y.J.; visualization was performed by N.S.; supervision was performed by Y.J. All authors have read and agreed to the published version of the manuscript.

Funding

This research received no external funding.

Institutional Review Board Statement

Not applicable.

Informed Consent Statement

Not applicable.

Data Availability Statement

The original contributions presented in this study are included in the article. Further inquiries can be directed to the corresponding author.

Conflicts of Interest

The authors declare no conflicts of interest.

References

  1. Jin, C.; Yang, L.; Hosanagar, K. To Brush or Not to Brush: Product Rankings, Consumer Search, and Fake Orders. Inf. Syst. Res. 2023, 34, 532–552. [Google Scholar] [CrossRef]
  2. Kim, D.Y.; Kim, S.Y. The Impact of Customer-Generated Evaluation Information on Sales in Online Platform-Based Markets. J. Retail. Consum. Serv. 2022, 68, 103016. [Google Scholar] [CrossRef]
  3. Xia, X.; Li, C.; Zhu, Q. Game Analysis for the Impact of Carbon Trading on Low-Carbon Supply Chain. J. Clean. Prod. 2020, 276, 123220. [Google Scholar] [CrossRef]
  4. Schwarz, J.A.; Tan, B. Optimal Sales and Production Rollover Strategies under Capacity Constraints. Eur. J. Oper. Res. 2021, 294, 507–524. [Google Scholar] [CrossRef]
  5. Nie, S.; Cai, G.; Huang, Y.; He, J. Deciphering Stakeholder Strategies in Electric Vehicle Battery Recycling: Insights from a Tripartite Evolutionary Game and System Dynamics. J. Clean. Prod. 2024, 452, 142174. [Google Scholar] [CrossRef]
  6. Fernandes, E.; Moro, S.; Cortez, P.; Batista, F.; Ribeiro, R. A Data-Driven Approach to Measure Restaurant Performance by Combining Online Reviews with Historical Sales Data. Int. J. Hosp. Manag. 2021, 94, 102830. [Google Scholar] [CrossRef]
  7. Yannopoulou, N.; Chandrasapth, K.; Bian, X.; Jin, B.; Gupta, S.; Liu, M.J. How Disinformation Affects Sales: Examining the Advertising Campaign of a Socially Responsible Brand. J. Bus. Res. 2024, 182, 114789. [Google Scholar] [CrossRef]
  8. Cai, H.; Chen, Y.; Fang, H. Observational Learning: Evidence from a Randomized Natural Field Experiment. Am. Econ. Rev. 2009, 99, 864–882. [Google Scholar] [CrossRef]
  9. Chen, Y.-F. Herd Behavior in Purchasing Books Online. Comput. Hum. Behav. 2008, 24, 1977–1992. [Google Scholar] [CrossRef]
  10. Wang, L.; Mo, J.; Li, B. Fake It Till You Make It: An Empirical Investigation of Sales Fraud in E-Commerce. In Proceedings of the PACIS, Xi’an, China, 8–12 July 2019. [Google Scholar]
  11. Zhou, J.; Xu, R.; Jiang, C. Sales Volume and Online Reviews in a Sequential Game. J. Oper. Res. Soc. 2023, 74, 2277–2288. [Google Scholar] [CrossRef]
  12. Liu, Y.; Jiang, M.; Wu, H. The Brushing Game in Online Marketplaces. Int. J. Electron. Commer. 2023, 27, 163–184. [Google Scholar] [CrossRef]
  13. Long, F.; Liu, Y. Platform Manipulation in Online Retail Marketplace with Sponsored Advertising. Mark. Sci. 2024, 43, 317–345. [Google Scholar] [CrossRef]
  14. Zhang, Q.; Li, J.; Xiao, T. Sales Manipulation Strategies of Competitive Firms on an E-commerce Platform: Beneficial or Harmful? Decis. Sci. 2024, 55, 491–509. [Google Scholar] [CrossRef]
  15. Liu, X.; He, Y.; Hooshmand Pakdel, G.; Li, S. Dynamic Optimization of E-Commerce Supply Chains for Fresh Products with Blockchain and Reference Effect. Technol. Forecast. Soc. Change 2025, 214, 124040. [Google Scholar] [CrossRef]
  16. Liu, C.; Lv, J.; Hou, P.; Lu, D. Disclosing Products’ Freshness Level as a Non-Contractible Quality: Optimal Logistics Service Contracts in the Fresh Products Supply Chain. Eur. J. Oper. Res. 2023, 307, 1085–1102. [Google Scholar] [CrossRef]
  17. Ma, Z.; Li, R. Consideration of Quantity Loss in Packaging Strategies for the Fresh Agricultural Products Supply Chain. Sustain. Oper. Comput. 2025, 6, 104–115. [Google Scholar] [CrossRef]
  18. Yuan, H.; Zhang, L.; Cao, B.-B.; Chen, W. Optimizing Traceability Scheme in a Fresh Product Supply Chain Considering Product Competition in Blockchain Era. Expert. Syst. Appl. 2024, 258, 125127. [Google Scholar] [CrossRef]
  19. Yu, Q.; Zhang, M.; Mujumdar, A.S. Blockchain-Based Fresh Food Quality Traceability and Dynamic Monitoring: Research Progress and Application Perspectives. Comput. Electron. Agric. 2024, 224, 109191. [Google Scholar] [CrossRef]
  20. Chen, Z.; Dan, B.; Lei, T.; Ma, S. Demand Information Disclosure in Fresh Produce Supply Chain Considering Competition between Geographical Indication and Local Suppliers. Socio-Econ. Plan. Sci. 2025, 98, 102177. [Google Scholar] [CrossRef]
  21. Feng, L.; Wang, W.-C.; Teng, J.-T.; Cárdenas-Barrón, L.E. Pricing and Lot-Sizing Decision for Fresh Goods When Demand Depends on Unit Price, Displaying Stocks and Product Age under Generalized Payments. Eur. J. Oper. Res. 2022, 296, 940–952. [Google Scholar] [CrossRef]
  22. Waqas Iqbal, M.; Iqbal Malik, A.; Babar Ramzan, M.; Saad Memon, M.; Irshad Mari, S.; Salman Habib, M. Consumer Response to Adjustable Price and Shelf-Life of Fresh Food Products under Effective Preservation Policy. Comput. Ind. Eng. 2024, 188, 109897. [Google Scholar] [CrossRef]
  23. Yu, Y.; Xiao, T. Pricing and Cold-Chain Service Level Decisions in a Fresh Agri-Products Supply Chain with Logistics Outsourcing. Comput. Ind. Eng. 2017, 111, 56–66. [Google Scholar] [CrossRef]
  24. Mohan Modak, N.; Senapati, T.; Simic, V.; Pamucar, D.; Saha, A.; Cárdenas-Barrón, L.E. Managing a Sustainable Dual-Channel Supply Chain for Fresh Agricultural Products Using Blockchain Technology. Expert. Syst. Appl. 2024, 244, 122929. [Google Scholar] [CrossRef]
  25. Dan, B.; Lei, T.; Zhang, X.; Liu, M.; Ma, S. Modeling of the Subsidy Policy in Fresh Produce Wholesale Markets under Yield Uncertainty. Econ. Model. 2023, 126, 106413. [Google Scholar] [CrossRef]
  26. Liu, M.; Jia, W.; Yan, W.; He, J. Factors Influencing Consumers’ Repurchase Behavior on Fresh Food e-Commerce Platforms: An Empirical Study. Adv. Eng. Inform. 2023, 56, 101936. [Google Scholar] [CrossRef]
  27. Fan, T.; Xu, C.; Tao, F. Dynamic Pricing and Replenishment Policy for Fresh Produce. Comput. Ind. Eng. 2020, 139, 106127. [Google Scholar] [CrossRef]
  28. Liu, L.; Zhao, L.; Ren, X. Optimal Preservation Technology Investment and Pricing Policy for Fresh Food. Comput. Ind. Eng. 2019, 135, 746–756. [Google Scholar] [CrossRef]
  29. Wang, X.; He, T. The Community Group Buying Models and Strategic Management for Fresh Food under Supply Uncertainty. Comput. Ind. Eng. 2025, 204, 111083. [Google Scholar] [CrossRef]
  30. Özbilge, A.; Hassini, E.; Parlar, M. Optimal Pricing and Donation Policy for Fresh Goods. Eur. J. Oper. Res. 2024, 312, 198–210. [Google Scholar] [CrossRef]
  31. Tan, C.; Zeng, Y. Two-Stage Pricing Strategy of the O2O Supply Chain for Fresh Produce Based on Blockchain Technology. Chin. J. Manag. 2023, 20, 904–915. [Google Scholar]
  32. Li, S.; Qu, S.; Wahab, M.I.M.; Ji, Y. Low-Carbon Supply Chain Optimisation with Carbon Emission Reduction Level and Warranty Period: Nash Bargaining Fairness Concern. Int. J. Prod. Res. 2024, 62, 6665–6687. [Google Scholar] [CrossRef]
  33. Zhao, S.; Cao, X. Sustainable Suppliers-to-Consumers’ Sales Mode Selection for Perishable Goods Considering the Blockchain-Based Tracking System. Sustainability 2024, 16, 3433. [Google Scholar] [CrossRef]
  34. Pan, H.; Song, X.; Hou, J.; Tan, S. Evolutionary Game Analysis Between Large Power Consumers and Power Sellers in the Context of Big-Data-Driven Value-Added Services. Sustainability 2024, 16, 8974. [Google Scholar] [CrossRef]
  35. Berger, J.; Sorensen, A.T.; Rasmussen, S.J. Positive Effects of Negative Publicity: When Negative Reviews Increase Sales. Mark. Sci. 2010, 29, 815–827. [Google Scholar] [CrossRef]
Figure 1. The sequence of events.
Sustainability 17 09688 g001
Figure 2. Model YN and NN: the effect of sales manipulation behavior on p.
Sustainability 17 09688 g002
Figure 3. Model NY and NN: the effect of sales manipulation behavior on p.
Sustainability 17 09688 g003
Figure 4. Model YY and NN: the effect of sales manipulation behavior on p.
Sustainability 17 09688 g004
Figure 5. Model YN and NN: the effect of sales manipulation behavior for F.
Sustainability 17 09688 g005
Figure 6. Model NY and NN: the effect of sales manipulation behavior for F.
Sustainability 17 09688 g006
Figure 7. Model YY and NN: the effect of sales manipulation behavior for F.
Sustainability 17 09688 g007
Figure 8. For firm G: the effect of sales manipulation behavior for π in the YN and NN models.
Sustainability 17 09688 g008
Figure 9. For firm D: the effect of sales manipulation behavior for π in the YN and NN models.
Sustainability 17 09688 g009
Figure 10. For firm G: the effect of sales manipulation behavior for π in the YN and NN models.
Sustainability 17 09688 g010
Figure 11. For firm D: the impact of sales manipulation behavior for π in the YN and NN models.
Sustainability 17 09688 g011
Figure 12. For firm G: the effect of sales manipulation behavior for π in the YY and NN models (when X D Y Y = 0.2 ).
Sustainability 17 09688 g012
Figure 13. For firm D: the effect of sales manipulation behavior for π in the YY model and NN models (when X G Y Y = 0.1 ).
Sustainability 17 09688 g013
Table 1. Parameter descriptions.
NotationsDefinitions
tperiod, t = 1, 2
iThe subscript i represents the fresh product firm, where G denotes the high-quality fresh product firm, and D denotes the low-quality fresh product firm. Firm G sells product G, while firm D sells product D
jThe superscript j represents the sales manipulation strategy adopted by the firms, where NN indicates that neither fresh product firm engages in sales manipulation, YN indicates that fresh product firm G engages in sales manipulation, NY indicates that fresh product firm D engages in sales manipulation, and YY indicates that both fresh product firms engage in sales manipulation
mthe consumer’s internal valuation of the product, and m follows a uniform distribution over the interval [0, 1]
γ i Consumers’ expected quality of the product, and 0 < γ D < γ G < 1
β Consumers’ preference to the relative sales of a company’s product
p i , t j Fresh product retail price
u i , t j Consumer economic utility
π i , t j Firm profit
F i , t j Firm market share
X i j Sales manipulation volume, where 0 X i j 1 , and constant in each stage
cThe constant that represents the linear relationship between sales manipulation cost and sales manipulation volume
m G , t j Consumers who have no preference between purchasing product G and product D in stage t
m D , t j Consumers in stage t who are indifferent between purchasing product D and not making a purchase
Table 2. Parameter settings.
ParameterβγGγD
Value0.20.80.35
Disclaimer/Publisher’s Note: The statements, opinions and data contained in all publications are solely those of the individual author(s) and contributor(s) and not of MDPI and/or the editor(s). MDPI and/or the editor(s) disclaim responsibility for any injury to people or property resulting from any ideas, methods, instructions or products referred to in the content.