Abstract
This study investigates landslide occurrence in Taiwan, a region highly susceptible to landslides due to steep mountains and frequent typhoons (TYPs). The primary objective is to understand how both geomorphological factors and TYP characteristics contribute to landslide occurrence, which is essential for improving hazard prediction and risk management. The research analyzed landslide events that occurred during the TYP seasons of 2019 and 2023. The methodology involved using satellite-derived landslide inventories from SPOT imagery for events larger than 0.1 hectares, tropical cyclone track and intensity data from IBTrACS v4 (classified by Saffir–Simpson Hurricane Scale), and detailed topographic variables (elevation, slope, aspect, Stream Power Index) extracted from a 30 m Shuttle Radar Topography Mission Digital Elevation Model (SRTM-DEM). Land use and land cover classifications were based on Landsat imagery. To establish a timeline, landslides were matched with TYPs within a ±3-day window, and proximity was analyzed using buffer zones ranging from 50 to 500 km around storm centers. Key findings revealed that landslide susceptibility results from a complex interplay of meteorological, topographic, and land cover factors. The critical controls identified include elevations above 2000 m, slope angles between 30 and 45 degrees, southeast- and south-facing aspects, and low Stream Power Index values typical of headwater and upper slope locations. Landslides were most frequent during Category 3 TYPs and were concentrated 300 to 350 km from storm centers, where optimal rainfall conditions for slope failures exist. Interestingly, despite the stronger storms in 2023, the number of landslides was higher in 2019. This emphasizes the importance of interannual variability and terrain preparedness. These findings support sustainable disaster risk reduction and climate-resilient development, aligning with Sustainable Development Goals 11 (Sustainable Cities and Communities) and 13 (Climate Action). Furthermore, they provide a foundation for improving hazard assessment and risk mitigation in Taiwan and similar mountainous, TYP-prone regions.
1. Introduction
Climate change is projected to increase both the frequency and intensity of extreme tropical cyclones (TCs), leading to heavier rainfall and more severe slope instability [1,2]. These intensified storms pose a significant threat to mountainous, storm-vulnerable zones such as Taiwan. Scientific evidence has shown that TC rainfall rates have been rising globally, especially in the Western North Pacific (WNP), where Taiwan is located [3,4]. In Taiwan, this increase has been further strengthened by the effects of mountains, resulting in increased rainfall during typhoons (TYP) [5,6]. According to the latest IPCC Sixth Assessment Report (AR6), East Asia, including Taiwan, is projected to experience continued warming, more extreme precipitation extremes, and a higher frequency of intense typhoon occurrences under high-emission scenarios. These anticipated climatic changes suggest greater hydro-meteorological risks and a higher likelihood of landslides in mountainous areas. As rainfall extremes intensify due to climate change, slope stability in steep terrain becomes more vulnerable, increasing the risk of landslides across the island [7].
Taiwan is particularly susceptible to landslides due to its steep topography, active tectonics, and frequent exposure to TYPs. On average, the island experiences approximately four TYPs per year, bringing intense rainfall and strong winds that often trigger slope failures and widespread damage [8]. The combination of steep mountainous terrain, where more than 200 peaks exceed 3000 m in elevation, and high annual precipitation, which surpasses 3000 mm in some regions, creates critical conditions for landslide initiation [9]. These physical factors, along with rapid tectonic uplift and frequent seismic activity, present persistent challenges to infrastructure, ecosystems, and human safety across the island [10,11].
Over the past decades, much of the scientific investigation into landslide activity in Taiwan has emphasized the role of rainfall intensity and duration [12,13,14,15]. For instance, debris flows and slope failures are often associated with specific short-term rainfall (measured hourly) as well as long-term accumulations over daily or multi-day periods. Case studies such as TYP Morakot in 2009 and TYP Nari in 2001 have demonstrated that rainfall accumulation and intensity are critical determinants of landslide occurrence, especially in regions with steep topography and fragile slopes [16,17,18]. While rainfall thresholds have long been central to landslide research, less attention has been given to how other TYP characteristics, such as intensity, path, and proximity, affect the timing and location of slope failures [19,20,21]. This gap in understanding makes it difficult to fully capture the complex ways TYPs influence landslide activity, especially when similar rainfall totals can lead to different outcomes depending on the storm’s structure and position.
This study addresses that gap by evaluating landslide occurrence in Taiwan during two recent TYP seasons (2019 and 2023) using a combined analysis of meteorological and environmental variables. We analyze the best-track data and wind intensities classified according to the Saffir–Simpson Hurricane Scale (SSHS). These TYP characteristics are integrated with topographic factors, including elevation, slope angle, and aspect, as well as land cover types derived from recent datasets. By examining the relationship between landslide distribution and storm strength, as well as spatial proximity to TYP paths, this study aims to enhance our understanding of the spatial and temporal dynamics of TYP-induced landslides and inform more targeted hazard mapping and risk mitigation efforts. The findings also contribute to sustainable disaster risk reduction, supporting Sustainable Development Goals (SDGs), specifically SDG 11 (Sustainable Cities and Communities) and SDG 13 (Climate Action) by informing targeted hazard mapping, climate-resilient land use planning, and risk mitigation strategies.
2. Materials and Methods
2.1. Study Area
Taiwan is an island located in the WNP, positioned between approximately 22° N and 25.5° N latitude and 120° E to 122° E longitude. It features steep mountainous terrain, complex geological structures, and a subtropical to tropical climate, which makes it highly susceptible to landslides induced by TYPs. As illustrated in Figure 1a, the island’s topography is dominated by a prominent north–south trending mountain range through the central and eastern portions, with elevations reaching over 3000 m in the central mountain range and gradually decreasing toward the western coastal plains, where elevations approach sea level. Approximately 70% of Taiwan’s land area consists of mountainous and hilly terrain, with the steepest slopes concentrated in the central mountain backbone [22].
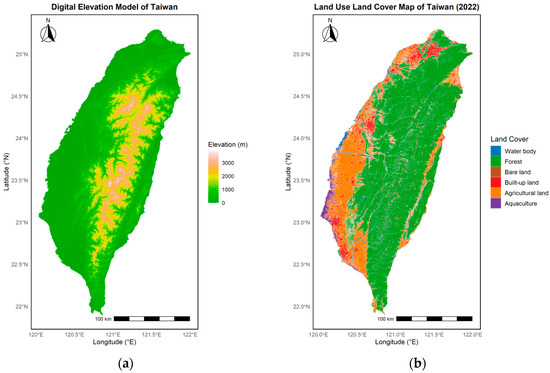
Figure 1.
(a) Digital Elevation Model (DEM) and (b) LULC of Taiwan.
The island experiences frequent TYPs and heavy rainfall during the summer and autumn months, contributing to widespread slope instability across these elevated regions [23,24]. Figure 1b illustrates the distribution of land use and land cover (LULC) in 2022. It shows that dense forest coverage (in green) dominates the mountainous central and eastern regions, while agricultural land (in orange) and built-up areas (in red) are primarily concentrated in the western coastal plains and northern regions. The spatial distribution also highlights aquaculture areas (in purple) along the southwestern coast, bare land (brown) in scattered locations, and water bodies (in blue) throughout the island. In Taiwan, steep forested mountains lie close to crowded cities and farming areas, making it a key place to study when and where landslides happen during extreme weather, especially where forests meet developed land.
2.2. Datasets
2.2.1. Landslide Map Layers
This study utilizes annual landslide map layers for Taiwan corresponding to the years 2019 and 2023. These landslide inventories were interpreted from SPOT satellite imagery captured between January and December of each respective year. These datasets were contributed from the Ministry of Digital Affairs and the Ministry of Agriculture, and can be downloaded through the Taiwan central government open data portal (https://data.gov.tw/ accessed on 15 June 2025). The years 2019 and 2023 were selected because high-quality data are only available for these seasons, and they include TYPs of varying intensity and track characteristics. While focusing on these two years may introduce sampling bias and does not capture long-term interannual variability, the selected datasets allow for a reliable comparison of landslide responses under different storm conditions. To ensure spatial consistency and analytical accuracy, only landslides with a minimum area of 0.1 hectares were included. Both datasets are provided in shapefile (SHP) format and contain key attribute fields: DATE (image acquisition date), X and Y coordinates (landslide location), Area (projected area in square meters), Slope_Area (slope-corrected area in square meters), Slope (average slope in degrees), and Min_DTM (minimum elevation in meters above sea level). Under the Varnes [25] landslide classification scheme, all documented landslides in this study are considered slides, which include both rotational and translational mechanisms. Figure 2 illustrates the spatial distribution of annual landslides across Taiwan for the years 2019 and 2023. The maps reveal notable variations in landslide occurrence and density across different regions and terrain types.
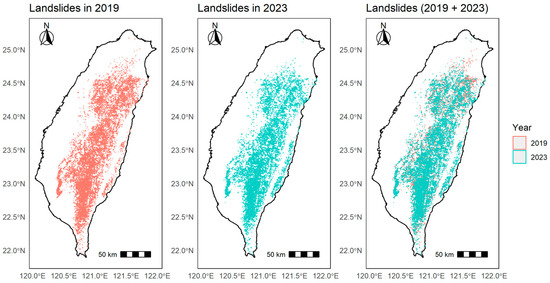
Figure 2.
Annual landslide maps of Taiwan for the years 2019 and 2023.
2.2.2. TYP Tracks
This study uses TYP track data from the International Best Track Archive for Climate Stewardship (IBTrACS) version 4, a globally recognized tropical cyclone dataset maintained by the National Oceanic and Atmospheric Administration (NOAA) [26]. The IBTrACS v4 data, accessed on 15 June 2025, include detailed storm parameters such as position (latitude and longitude), date and time, central pressure, and maximum sustained wind speed. For this analysis, TYPs that potentially affected Taiwan were identified based on their proximity and official warnings issued by the Central Weather Administration (CWA) of Taiwan. A total of ten TYPs were selected: DANAS, LEKIMA, BAILU, MITAG, MAWAR, DOKSURI, KHANUN, SAOLA, HAIKUI, and KOINU (see Figure 3). The track data enabled a spatial and temporal assessment of TYP and landslide interactions, supporting the evaluation of how TYP characteristics such as intensity, trajectory, and timing influenced landslide occurrence across Taiwan. The IBTrACS version 4 dataset is publicly accessible at https://www.ncei.noaa.gov/products/international-best-track-archive (accessed on 15 June 2025), with detailed documentation of the CSV and shapefile data columns available at https://www.ncei.noaa.gov/sites/default/files/2021-07/IBTrACS_v04_column_documentation.pdf (accessed on 15 June 2025). TYP intensities were classified according to the SSHS based on the maximum sustained wind speeds reported in the IBTrACS dataset. Wind speeds were categorized into Tropical Depression, Tropical Storm, and five hurricane categories (1 through 5) following the established SSHS thresholds.
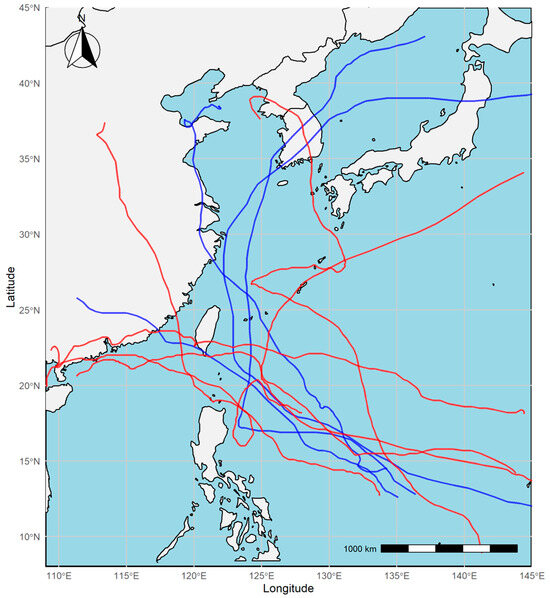
Figure 3.
TYP tracks over the WNP for the years 2019 and 2023. Blue lines represent tracks from 2019, while red lines represent tracks from 2023.
2.2.3. DEM Dataset
The DEM used in this study was obtained from the Shuttle Radar Topography Mission (SRTM) (https://eospso.nasa.gov/missions/shuttle-radar-topography-mission accessed on 15 June 2025), which provides near-global elevation data at a spatial resolution of 30 m. The SRTM dataset is widely recognized for its reliability and suitability for terrain analysis and hydrological modeling, particularly in mountainous and landslide-prone regions. The DEM was downloaded in GeoTIFF format. Preprocessing steps included clipping the data to the study area boundary, projecting it to a common coordinate reference system, and performing sink-filling to ensure hydrological consistency (see Figure 1a). This DEM served as the basis for deriving key topographic parameters such as elevation, slope, aspect, and Stream Power Index (SPI), which are critical for assessing landslide susceptibility and understanding terrain-driven processes.
2.3. Methods
This study employed a multi-step methodological framework combining temporal filtering, spatial analysis, and machine learning techniques to investigate the interactions between landslides, TYPs, DEM, and LULC characteristics.
2.3.1. Date Matching of Landslides and TYPs
To identify TYP-related landslide events, we matched landslide occurrence dates with TYP timelines from the IBTrACS dataset. A landslide was classified as TYP-induced if it occurred within a ±3-day window of the nearest TYP’s passage over Taiwan. This time buffer captures both immediate and delayed landslide responses to heavy rainfall and strong winds. The analysis focused on the years 2019 and 2023 to account for differences between TYP seasons.
2.3.2. Spatial Mapping and Proximity Analysis
Using spatial analysis in a Geographic Information System (GIS) environment, all landslide points were mapped and overlaid with TYP tracks. Circular buffer zones ranging from 50 to 500 km in 50 km increments were generated around each TYP eye point to quantify the proximity of each landslide to the storm center (as shown in Figure 4). This approach allowed classification of landslides based on their spatial relationship to TYP influence zones. Additional spatial joins were used to extract TYP characteristics, such as wind speed and distance, at each landslide location.
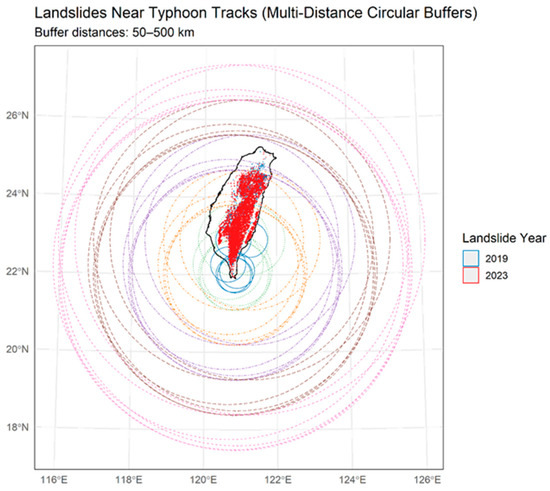
Figure 4.
Buffer analysis showing the proximity of landslides to TYP tracks. Circular buffers of 50 km (solid blue), 100 km (dotted green), 200 km (dot-dash orange), 300 km (two-dash purple), 400 km (long-dash brown), and 500 km (dashed pink) were generated around typhoon track points. Landslide occurrences are overlaid and color-coded by year: 2019 (blue) and 2023 (red).
2.3.3. LULC Classification with Random Forest (RF)
To develop the 2022 LULC map, we adapted the methodology detailed by Liou et al. [27]. Landsat TM/OLI imagery at 30 m resolution served as the primary data source, and classification was performed using a supervised RF algorithm [28]. The workflow included satellite image preprocessing, training sample selection via Google Earth, hyperparameter tuning through Grid Search, and classification into six major LULC categories: waterbody, forest, agricultural land, built-up land, bare land, and aquaculture. Validation curve analysis identified optimal RF parameters of 50 trees and a maximum depth of 20. The final LULC map for 2022 achieved an overall accuracy of 97.4% and a Kappa coefficient of 97.2%.
2.3.4. Extraction of Terrain Factors from DEM Data
Topographic variables derived from the DEM play a vital role in understanding and modeling landslide susceptibility. In this study, elevation, slope, aspect, and the SPI were extracted from the SRTM 30 m DEM using the “terra” package (version 1.6-17) in R version 4.1.2. Elevation was directly retrieved from the DEM, providing information on the vertical position above sea level, which influences climatic conditions and vegetation cover. Slope was calculated to represent the steepness of the terrain, a key factor controlling gravitational instability and surface runoff. Aspect, which indicates the compass direction a slope faces, was derived to assess potential variations in solar radiation and soil moisture, both of which can impact vegetation growth and soil drying. The SPI was computed to quantify the erosive potential of overland flow across the landscape. It was derived based on two main components: the specific catchment area, which represents the amount of upslope area contributing flow to a point, and the local slope angle, expressed in radians. Areas with larger contributing catchments and steeper slopes yield higher SPI values, indicating a greater potential for concentrated surface runoff and soil erosion. Such areas are typically more prone to shallow landslides and channel incision due to the increased energy of flowing water.
All raster layers were clipped to the study area, projected to a consistent coordinate reference system using TWD97/TM2 zone 121 (EPSG:3826), and aligned in spatial resolution and extent. This ensured compatibility with other environmental and hazard-related datasets used in the landslide susceptibility modeling framework.
3. Results
3.1. Landslides and LULC Characteristics
Figure 5 shows an analysis of landslide occurrences across various LULC types in 2019 and 2023, revealing that forested areas are overwhelmingly the most affected. Forests experienced over 21,000 landslides in 2019 and about 17,000 in 2023, remaining the most susceptible land cover. This high frequency is likely attributable to factors such as steep terrain and soil saturation, which are common in the mountainous regions where forests typically grow. Following forests, bare land registered the second-highest frequency of landslides, with around 13,000 events in 2019 and 12,000 in 2023. The absence of stabilizing vegetation on bare land contributes to its vulnerability to erosion and slope failure. In stark contrast, other land cover types exhibited minimal landslide activity. Water bodies and agricultural lands recorded very low to moderate counts, while built-up areas and aquaculture sites showed virtually no landslide events, reflecting their typically stable and managed terrain. A notable trend across most categories was a reduction in landslide frequency from 2019 to 2023. The most significant absolute decrease occurred in forested areas, which saw approximately 4000 fewer events. This overall pattern underscores that natural, undeveloped landscapes like forests and bare land are significantly more susceptible to landslides than human-modified environments, which demonstrate a much lower risk.
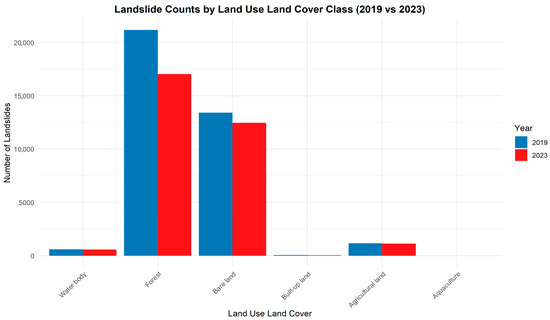
Figure 5.
Landslide counts by LULC class.
A comparison of landslide frequency across elevation ranges reveals a clear correlation between altitude and landslide occurrences. The data indicate that landslide incidents rise with elevation, peaking in areas above 2000 m. Lower elevations (0–500 m) recorded the fewest landslides, with only minor fluctuations between the two years. A significant surge in landslide events is evident in the mid-elevation ranges. Moving from the 500–1000 m bracket to the 1000–1500 m range, the frequency of landslides shows a substantial increase. The highest elevations, particularly those exceeding 1500 m, consistently demonstrated a high number of landslides. When comparing the two years, a general downward trend in landslide frequency is noticeable across most elevation categories in 2023 compared to 2019. This reduction was most pronounced in the elevation bands of 1000–1500 m and 1500–2000 m (see Figure 6a). The most significant absolute drop in landslide events occurred in the highest elevation category, above 2000 m.
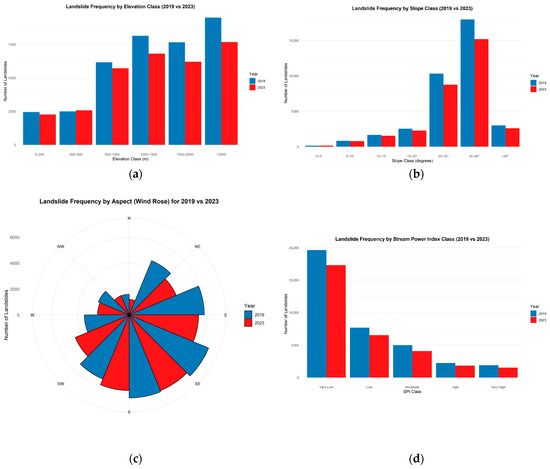
Figure 6.
Comparison between 2019 and 2023: (a) Elevation, (b) slope, (c) aspect, (d) SPI.
The results in Figure 6b indicate a distinct and non-linear relationship between the angle of slope and the frequency of landslides. Analysis of the data reveals that landslide occurrences do not increase uniformly with slope steepness but are instead concentrated within a specific range. The highest frequency of landslides was observed in the 30–45° slope class, which recorded approximately 18,000 events in 2019 and 15,000 in 2023. This range represents the critical threshold where slope instability is most pronounced. In contrast, gentle slopes (0–15°) exhibited very low landslide activity. A significant rise in landslide frequency was noted on moderate slopes (15–30°), where events increased from roughly 2000 to over 10,000, signifying a key transition to higher instability. On very steep slopes (>45°), the frequency of landslides was moderate, with approximately 2500 to 3000 events recorded in both years. A temporal comparison shows a general decrease in landslide events across most slope categories from 2019 to 2023. The most substantial absolute reduction occurred within the peak-risk 30–45° range, with about 3000 fewer landslides. The frequency of events on the steepest slopes (>45°) remained relatively stable between the two years. These findings identify moderate-to-steep slopes, particularly between 30° and 45°, as the terrain most susceptible to landslide hazards.
The results presented in Figure 6c illustrate a significant correlation between slope aspect and landslide frequency. The data indicate a clear directional bias, with landslide events not being uniformly distributed across all slope orientations. The highest landslide frequencies were recorded on southeast (SE) and south (S) facing slopes. Specifically, southeast-facing slopes accounted for the most events, with approximately 6800 landslides in 2019, which decreased to about 6400 in 2023. South-facing slopes also demonstrated high susceptibility, with around 6600 landslides in 2019 declining to approximately 5800 in 2023. East-facing slopes showed substantial activity with about 5800 landslides in 2019, decreasing to roughly 5200 in 2023. Moderate landslide activity was observed on northeast (NE) and southwest (SW) facing slopes. Northeast slopes recorded approximately 4600 events in 2019, declining to about 3900 in 2023, while southwest-facing slopes showed about 5200 landslides in 2019, dropping significantly to approximately 4500 in 2023. In contrast, north (N), west (W), and northwest (NW) facing slopes exhibited relatively low landslide frequencies. North-facing slopes recorded the lowest activity with about 1600 events in 2019 and 1200 in 2023. West-facing slopes showed approximately 3400 landslides in 2019, decreasing to about 2400 in 2023, while northwest slopes had roughly 2600 events in 2019, declining to about 1600 in 2023.
The results from Figure 6d indicate a distinct inverse relationship between the SPI and the frequency of landslides. The analysis shows that areas characterized by very low SPI values are associated with the highest landslide activity, whereas areas with very high SPI values exhibit the lowest frequency of such events. The “Very Low” SPI class is the dominant risk zone, accounting for the vast majority of landslides with approximately 19,500 events in 2019 and 17,500 in 2023. As the SPI value increases, there is a corresponding stepwise decrease in landslide occurrences. The “Low” SPI class recorded around 7500 events in 2019 and 6500 in 2023, followed by the “Moderate” SPI class with approximately 5000 and 4000 events in the respective years. The “High” and “Very High” SPI classes showed the lowest frequencies, with about 2000 and 1500 events, respectively, in both years.
3.2. Landslide Counts and Areas by TYP
The date-matching analysis presented in Table 1 provides a detailed overview of landslide activity associated with TYP events in 2019 and 2023. The results reveal notable variability in the impact of individual TYPs, with only five out of ten storms leading to measurable landslide occurrences. No landslides were recorded in association with TYPs LEKIMA, BAILU, DOKSURI, SAOLA, or KOINU. Among the storms that induced landslides, TYP DANAS in 2019 was the most impactful, triggering approximately 11,877 landslides over nine days, covering a total area of around 135.57 km2. The second most significant event was TYP MAWAR in 2023, which resulted in 4428 landslides across 56.08 km2 during a 16-day period. Moderate impacts were observed for TYP MITAG (2019), which caused 494 landslides over 2.36 km2, and TYP KHANUN (2023), which generated 321 events over 1.75 km2. In contrast, TYP HAIKUI (2023) had a minimal effect, with only 18 landslides covering 0.06 km2.
Temporally, the 2019 TYP season exhibited more severe landslide activity, largely driven by the substantial impact of DANAS. The 2023 season, while still affected by significant events such as MAWAR, was comparatively moderate in terms of overall landslide extent and frequency. The lack of landslides in some TYP events highlights the complex interplay of storm intensity, rainfall, soil moisture, and local terrain.

Table 1.
Names of TYPs with landslides occur at the corresponding time.
Table 1.
Names of TYPs with landslides occur at the corresponding time.
| TYP Name | Start Date * | End Date * | Total Landslide Area (m2) | Landslide Count | Map |
|---|---|---|---|---|---|
| DANAS | 14 July 2019 | 23 July 2019 | 135,572,754.4 | 11,877 | Figure 7a |
| LEKIMA | 2 August 2019 | 14 August 2019 | 0 | 0 | Figure 7b |
| BAILU | 19 August 2019 | 26 August 2019 | 0 | 0 | Figure 7j |
| MITAG | 24 September 2019 | 5 October 2019 | 2,358,878.91 | 494 | Figure 7f |
| MAWAR | 18 May 2023 | 3 June 2023 | 56,078,623 | 4428 | Figure 7g |
| DOKSURI | 20 July 2023 | 30 July 2023 | 0 | 0 | Figure 7c |
| KHANUN | 26 July 2023 | 11 August 2023 | 1,747,317 | 321 | Figure 7d |
| SAOLA | 22 August 2023 | 3 September 2023 | 0 | 0 | Figure 7i |
| HAIKUI | 27 August 2023 | 10 September 2023 | 61,028 | 18 | Figure 7h |
| KOINU | 27 September 2023 | 9 October 2023 | 0 | 0 | Figure 7e |
* Start and end dates are extracted from the IBTrACS v4 dataset.

Figure 7.
Tracks of TYPs from 2019 to 2023: (a) DANAS, (b) LEKIMA, (c) DOKSURI, (d) KHANUN, (e) KOINU, (f) MITAG, (g) MAWAR, (h) HAIKUI, (i) SAOLA, and (j) BAILU.
3.3. Landslide Occurrence as Influenced by Slope and TYP Intensity
The results presented in Figure 8 illustrate a complex and non-linear relationship between TYP intensity and the resulting landslide activity. Although the storms in 2023 were generally stronger (predominantly Category 3 and 4) compared to those in 2019 (primarily Category 2), storm intensity alone was not a direct predictor of landslide frequency. The data reveals a trend where more intense TYPs tend to trigger landslides on steeper terrain. The average slope angle of affected areas increased with storm intensity, ranging from approximately 35.5° for Tropical Storms to a peak of about 43° for Category 3 TYPs. Notably, the most landslide-productive event, a Category 3 storm in 2019, was associated with these steepest average slopes.
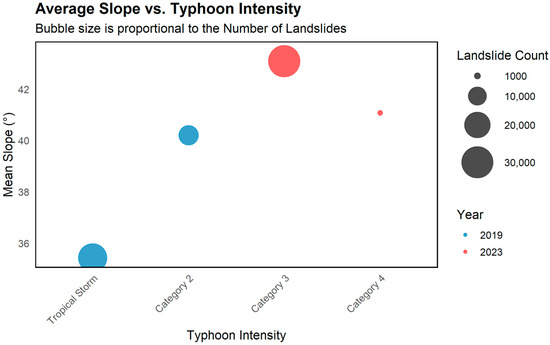
Figure 8.
Average slope and TYP intensity in landslides.
A key finding is that Category 3 storms appeared to create optimal conditions for landslide generation. The 2019 Category 3 TYP produced the highest number of landslides observed. In contrast, the Category 4 TYP in 2023, despite being the most intense storm, generated a relatively low number of landslides. This disparity indicates that maximum storm intensity does not necessarily lead to the maximum landslide response. Temporally, the 2019 TYP season was significantly more productive in terms of landslides than the 2023 season. The higher landslide counts in 2019, even with generally less intense storms, suggest that factors beyond storm intensity, such as antecedent moisture, rainfall distribution, and cumulative seasonal effects, play a critical role in determining an area’s susceptibility to landslides.
The results from Figure 9 reveal a distinct spatial pattern in the relationship between landslide frequency and the distance from a TYP’s eye. The most prominent finding is an exceptionally high concentration of landslide activity within the 300–350 km distance bin, which accounts for over 10,000 recorded events. This dramatic peak significantly surpasses all other ranges, identifying this specific distance as the critical zone for TYP-induced slope failures.
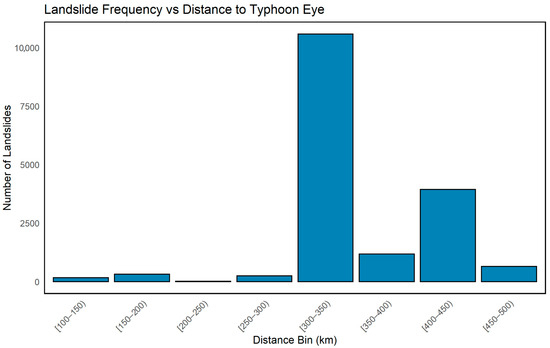
Figure 9.
Landslides and distance to the TYP eye.
The data also reveals a bimodal distribution, with a notable secondary peak of approximately 4000 landslides occurring further from the storm’s center, in the 400–450 km range. In contrast, landslide frequency was minimal in the zones both nearer to and farther from the TYP’s eye. Areas within 100–300 km of the eye, as well as those beyond 450 km, consistently recorded fewer than 500 landslides. The zone between the two peaks (350–400 km) also showed relatively low activity, with about 1000 events.
4. Discussion
The comprehensive analysis reveals that landslide susceptibility in Taiwan’s mountainous terrain arises from complex interactions between topographic, hydrological, and climatic conditions rather than from any single dominant factor. Previous studies have documented the link between typhoon-induced rainfall and landslides in Taiwan, but they often rely on aggregate metrics, such as total rainfall or peak intensity, treating storms as spatially uniform. This limits understanding of how landslide distribution varies with distance from the storm center and track geometry. Even recent models that incorporate terrain and precipitation rarely quantify the explicit role of storm proximity or test whether specific distance zones show different susceptibility. This study fills this gap by systematically analyzing the spatial relationship between typhoon track proximity and landslide occurrence, revealing distinct distance-dependent patterns that challenge the assumption of uniform storm effects. Rainfall-threshold-based models, which have dominated landslide forecasting frameworks, face inherent limitations in typhoon contexts. These models establish empirical relationships between rainfall duration and intensity (e.g., I-D curves) without considering spatial distribution relative to storm structure. Consequently, they cannot distinguish between equivalent rainfall from different typhoon zones (eyewall versus outer rainbands), despite potentially different landslide outcomes due to variations in rainfall consistency, wind-driven infiltration, or how orographic enhancement interacts with specific radial positions. This spatially aggregated treatment limits predictive specificity for identifying which mountainous regions face elevated risk as a storm approach along a given track.
The elevation-dependent patterns, with peak activity above 2000 m, suggest intensified weathering processes at higher altitudes, where freeze–thaw cycling, orographic precipitation concentration, and potentially deeper weathering profiles collectively reduce slope stability. The concentration of landslides in the 30-to-45-degree slope range reflects fundamental geomechanical principles. This critical zone represents the threshold where gravitational stress maximizes relative to material strength, creating optimal conditions for failure initiation. The lower landslide frequency on extremely steep slopes (>45°) likely indicates that these surfaces have either already evacuated unstable material through progressive failure or that they experience alternative failure mechanisms, such as rockfall and toppling rather than translational debris flows.
The directional bias toward southeast- and south-facing slopes reveals the influence of differential weathering and moisture dynamics. Our findings align with Chen et al. [29], who reported similar patterns in the Shihmen and Xindian, though our island-wide analysis extends these observations across diverse geological settings. This directional preference can be mechanistically explained by several interacting processes: enhanced chemical weathering from greater solar radiation exposure, asymmetric moisture retention patterns controlled by prevailing wind directions, and potentially differential root strength development in response to microclimate variations. These aspect-controlled processes modulate the critical threshold between stabilizing forces and gravitational stress, making slope orientation a key variable in regional hazard assessments. Comparisons with regional studies show similar patterns in Japan, where landslides during TYPs are concentrated on steep, southeast-facing slopes, and in the Philippines, where landslide occurrence is strongly influenced by storm track and rainfall distribution, highlighting the role of peripheral rainfall in triggering failures [30,31]. These studies suggest that, while local geology and climate modulate responses, the underlying mechanisms of distance- and terrain-dependent susceptibility are broadly applicable across typhoon-prone East and Southeast Asia.
The inverse relationship between the SPI and landslide frequency provides critical insight into failure mechanisms. The predominance of landslides in low-SPI zones, such as headwater areas, ridgelines, and upper slopes, indicates that precipitation-induced pore pressure accumulation, rather than fluvial undercutting, serves as the primary destabilizing mechanism. In these locations, rapid infiltration during intense rainfall events reduces effective stress in shallow soil mantles, without the counterbalancing effect of continuous material removal by stream incision. This finding has important implications because it suggests that landslide initiation in Taiwan’s mountains is primarily controlled by the subsurface hydrological response to rainfall rather than by progressive stream erosion, which explains why failures concentrate in topographically high positions during extreme precipitation events.
The apparent paradox of high landslide frequency in forested areas, despite vegetation’s known stabilizing effects, reflects the spatial coincidence of forests with Taiwan’s steepest and most geologically complex terrain rather than a causal relationship. Forests in Taiwan naturally occupy mountainous regions where slope angles, weathering intensity, and seismic activity already predispose the landscape to instability. The low landslide activity in built-up and agricultural areas results not only from terrain modification and engineering interventions but also from the fundamental selection bias inherent in development patterns, as humans preferentially occupy stable, low-gradient terrain and avoid high-risk zones. This pattern underscores the importance of accounting for terrain coincidence when interpreting land cover and landslide relationships.
The influence of TYPs further underscores the complexity of landslide dynamics. Temporal analysis reveals that landslide occurrence is not solely dependent on TYP intensity. For instance, Category 3 TYPs were found to produce the most landslides, indicating that an optimal balance of rainfall intensity, duration, and spatial extent may be more critical than peak wind speeds. The identification of a 300-to-350 km optimal distance from TYP eyes as the most landslide-prone zone suggests that peripheral regions, where prolonged rainfall occurs without the most extreme wind damage, create the most favorable conditions for slope failure. This finding is particularly important for early-warning systems, as it helps prioritize monitoring and hazard alerts for areas most likely to experience landslides during approaching TYPs. Furthermore, the contrast in landslide productivity between the 2019 and 2023 TYP seasons, despite similar or stronger storms in 2023, emphasizes the importance of antecedent soil moisture, cumulative seasonal effects, and recovery dynamics from past disturbances. Recent climate projections from the IPCC AR6 indicate that Taiwan and the broader WNP region will likely experience an increase in the frequency and intensity of extreme tropical cyclones, as well as enhanced rainfall rates under warmer atmospheric conditions. Such projected climatic shifts imply a heightened probability of compound hazards, where intense precipitation, typhoon-induced wind damage, and subsequent slope failures could occur in close succession. This complexity may intensify in the future, with projected increases in the probability of strong typhoon events and higher rainfall intensity during TYPs under a changing climate [32,33,34].
Several limitations constrain these interpretations. The two-year study period may not capture the full range of interannual variability or long-term trends in typhoon-landslide relationships. In addition, the study does not incorporate certain environmental and geotechnical variables, such as soil type, soil moisture, and subsurface conditions, which limits the ability to explore the physical mechanisms driving slope failure. The evaluation of TYP impacts was based primarily on storm track proximity and SSHS wind intensity, which may not fully represent the spatial complexity of storm-related influences.
Future research would benefit from including a broader set of variables and extending the temporal scope to improve the robustness and generalizability of the findings. Additionally, these findings have practical implications for hazard management and policy. The identification of the 300–350 km storm-eye distance as the most landslide-prone zone, along with terrain-dependent susceptibility, can help prioritize early-warning efforts and targeted disaster preparedness. Future work should aim to integrate high-resolution typhoon track data, satellite-derived landslide inventories, and topographic variables into predictive hazard models, enhancing risk-informed land use planning, infrastructure design, and real-time disaster response in typhoon-prone regions. These applications advance SDGs 11 and 13 by guiding climate-resilient planning and supporting sustainable disaster risk reduction.
5. Conclusions
This study provides new insights into the spatial and temporal patterns of landslides in Taiwan, emphasizing the multifactorial nature of slope failure during TYP events. The findings contribute to a better understanding of how topographic features and storm characteristics interact to influence landslide susceptibility. Key conclusions include:
- Landslide occurrence is governed by a complex interplay of topographic and meteorological factors, with no single dominant predictor.
- Elevation above 2000 m, slope angles between 30 and 45°, and southeast/south-facing aspects are identified as high-susceptibility terrain.
- Landslides tend to cluster in areas with low SPI, indicating a prevalence in headwater and upper-slope regions rather than in zones of active stream erosion.
- TYP-induced landslides are most associated with Category 3 storms and occur predominantly at 300–350 km from TYP centers, suggesting optimal triggering conditions exist at moderate intensities and distances.
- Despite stronger storms in 2023, more landslides occurred in 2019, highlighting the role of interannual variability and longer-term terrain readiness in landslide susceptibility.
- Forested and undeveloped areas show the highest landslide occurrence, while built-up areas have lower susceptibility, indicating the importance of land use in hazard mapping.
These findings support the development of improved risk assessment tools that integrate terrain attributes, TYP characteristics, and seasonal variability for better disaster preparedness and land use planning. Moreover, they directly contribute to the United Nations SDGs by informing SDG 11 through risk-aware urban planning, resilient infrastructure design, and targeted early-warning systems. The study also advances SDG 13 by providing insights for climate-adaptive strategies that reduce landslide risks associated with extreme weather events, thereby enhancing community resilience and promoting sustainable development in typhoon-prone mountainous regions.
Author Contributions
Conceptualization, T.V.L.; data curation, K.A.N. and T.V.L.; formal analysis, K.A.N. and T.V.L.; funding acquisition, K.A.N.; investigation, T.V.L.; methodology, T.V.L.; project administration, K.A.N.; resources, K.A.N.; software, K.A.N. and T.V.L.; supervision, K.A.N.; validation, T.V.L.; visualization, T.V.L.; writing—original draft preparation, K.A.N. and T.V.L.; writing—review and editing, K.A.N. and T.V.L. All authors have read and agreed to the published version of the manuscript.
Funding
This study was partially supported by the National Science and Technology Council (Taiwan) under Research Project Grant Numbers NSTC 113-2625-M-027-007.
Institutional Review Board Statement
Not applicable.
Informed Consent Statement
Not applicable.
Data Availability Statement
The original contributions presented in this study are included in the article. Further inquiries can be directed to the corresponding author.
Acknowledgments
This study uses ChatGPT-5, a large language model developed by OpenAI, to improve the readability and language of the manuscript. All AI-generated content was thoroughly reviewed and revised by the authors, who assume full responsibility for the final version of the publication.
Conflicts of Interest
The authors declare no conflicts of interest.
Abbreviations
The following abbreviations are used in this manuscript:
| TYP | Typhoon |
| IBTrACS v4 | International Best Track Archive for Climate Stewardship version 4 |
| SSHS | Saffir–Simpson Hurricane Scale |
| DEM | Digital Elevation Model |
| SRTM-DEM | Shuttle Radar Topography Mission Digital Elevation Model |
| LULC | Land use and land cover |
| RF | Random Forest |
| WNP | Western North Pacific |
| NOAA | National Oceanic and Atmospheric Administration |
| CWA | Central Weather Administration |
| SPI | Stream Power Index |
| GIS | Geographic Information System |
| N | North |
| NE | Northeast |
| E | East |
| SE | Southeast |
| S | South |
| SW | Southwest |
| W | West |
| NW | Northwest |
References
- Knutson, T.R.; Chung, M.V.; Vecchi, G.; Sun, J.; Hsieh, T.L.; Smith, A.J.P. ScienceBrief Review: Climate Change Is Probably Increasing the Intensity of Tropical Cyclones. In Critical Issues in Climate Change Science; Le Quéré, C., Liss, P., Forster, P., Eds.; ScienceBrief: Norwich, UK, 2021. [Google Scholar]
- Shi, X.; Liu, Y.; Chen, J.; Chen, H.; Wang, Y.; Lu, Z.; Ng, C.W. Escalating Tropical Cyclone Precipitation Extremes and Landslide Hazards in South China under Global Warming. NPJ Clim. Atmos. Sci. 2024, 7, 107. [Google Scholar] [CrossRef]
- Guzman, O.; Jiang, H. Global Increase in Tropical Cyclone Rain Rate. Nat. Commun. 2021, 12, 5344. [Google Scholar] [CrossRef]
- Tran, T.L.; Ritchie, E.A.; Perkins-Kirkpatrick, S.E.; Bui, H.; Luong, T.M. Variations in Rainfall Structure of Western North Pacific Landfalling Tropical Cyclones in the Warming Climates. Earth’s Future 2024, 12, e2024EF004808. [Google Scholar] [CrossRef]
- Chang, C.P.; Yang, Y.T.; Kuo, H.C. Large Increasing Trend of Tropical Cyclone Rainfall in Taiwan and the Roles of Terrain. J. Clim. 2013, 26, 4138–4147. [Google Scholar] [CrossRef]
- Chiang, S.H.; Chang, K.T. The Potential Impact of Climate Change on Typhoon-Triggered Landslides in Taiwan, 2010–2099. Geomorphology 2011, 133, 143–151. [Google Scholar] [CrossRef]
- Ho, K.K.S.; Lacasse, S.; Picarelli, L. Preparedness for Climate Change Impact on Slope Safety. In Slope Safety Preparedness for Impact of Climate Change; CRC Press: Boca Raton, FL, USA, 2017; pp. 1–42. [Google Scholar]
- Tseng, C.M.; Chen, Y.R.; Chang, C.M.; Chue, Y.S.; Hsieh, S.C. Assessment of Rainfall-Induced Landslide Distribution Based on Land Disturbance in Southern Taiwan. ISPRS Int. J. Geo-Inf. 2021, 10, 209. [Google Scholar] [CrossRef]
- Chung, C.C.; Li, Z.Y. Rapid Landslide Risk Zoning toward Multi-Slope Units of the Neikuihui Tribe for Preliminary Disaster Management. Nat. Hazards Earth Syst. Sci. Discuss. 2022, 22, 1777–1794. [Google Scholar] [CrossRef]
- Lin, C.W.; Liu, S.H.; Lee, S.Y.; Liu, C.C. Impacts of the Chi-Chi Earthquake on Subsequent Rainfall-Induced Landslides in Central Taiwan. Eng. Geol. 2006, 86, 87–101. [Google Scholar] [CrossRef]
- Chen, C.W.; Tung, Y.S.; Chu, F.Y.; Li, H.C.; Chen, Y.M. Assessing Landslide Risks across Varied Land-Use Types in the Face of Climate Change. Landslides 2024, 22, 2867–2881. [Google Scholar] [CrossRef]
- Chen, C.W.; Saito, H.; Oguchi, T. Rainfall Intensity–Duration Conditions for Mass Movements in Taiwan. Prog. Earth Planet. Sci. 2015, 2, 14. [Google Scholar] [CrossRef]
- Chang, J.M.; Chen, H.; Jou, B.J.D.; Tsou, N.C.; Lin, G.W. Characteristics of Rainfall Intensity, Duration, and Kinetic Energy for Landslide Triggering in Taiwan. Eng. Geol. 2017, 231, 81–87. [Google Scholar] [CrossRef]
- Su, S.H.; Chang, Y.H.; Liu, C.H.; Chen, W.T.; Chang, W.Y.; Chen, J.P.; Yang, M.J. Observing Severe Precipitation near Complex Topography during the Yilan Experiment of Severe Rainfall in 2020 (YESR2020). Q. J. R. Meteorol. Soc. 2022, 148, 1663–1682. [Google Scholar] [CrossRef]
- Liou, Y.A.; Lin, J.J. Characterizing the Antecedent Rainfall and ATI-MODIS-Derived Soil Moisture Content of Shallow Landslides in Taiwan. Landslides 2025, 22, 2237–2272. [Google Scholar] [CrossRef]
- Yu, F.C.; Chen, T.C.; Lin, M.L.; Chen, C.Y.; Yu, W.H. Landslides and Rainfall Characteristics Analysis in Taipei City during the Typhoon Nari Event. Nat. Hazards 2006, 37, 153–167. [Google Scholar] [CrossRef]
- Liu, C.N.; Dong, J.J.; Chen, C.J.; Lee, W.F. Typical Landslides and Related Mechanisms in Ali Mountain Highway Induced by Typhoon Morakot: Perspectives from Engineering Geology. Landslides 2012, 9, 239–254. [Google Scholar] [CrossRef]
- Yang, S.Y.; Jan, C.D.; Wang, J.S. Landslides Triggered by Typhoon Morakot in Taiwan. In Environmental Risks; IntechOpen: London, UK, 2018; pp. 161–164. [Google Scholar]
- Chang, K.T.; Chiang, S.H.; Lei, F. Analysing the Relationship between Typhoon-Triggered Landslides and Critical Rainfall Conditions. Earth Surf. Process. Landf. 2008, 33, 1261–1271. [Google Scholar] [CrossRef]
- Chung, M.C.; Tan, C.H.; Chen, C.H. Local Rainfall Thresholds for Forecasting Landslide Occurrence: Taipingshan Landslide Triggered by Typhoon Saola. Landslides 2017, 14, 19–33. [Google Scholar] [CrossRef]
- Segoni, S.; Piciullo, L.; Gariano, S.L. A Review of the Recent Literature on Rainfall Thresholds for Landslide Occurrence. Landslides 2018, 15, 1483–1501. [Google Scholar] [CrossRef]
- Lin, C.T.; Li, C.F.; Zelený, D.; Chytrý, M.; Nakamura, Y.; Chen, M.Y.; Chiou, C.R. Classification of the High-Mountain Coniferous Forests in Taiwan. Folia Geobot. 2012, 47, 373–401. [Google Scholar] [CrossRef]
- Chen, C.S.; Chen, Y.L. The Rainfall Characteristics of Taiwan. Mon. Weather Rev. 2003, 131, 1323–1341. [Google Scholar] [CrossRef]
- Henny, L.; Thorncroft, C.D.; Hsu, H.H.; Bosart, L.F. Extreme Rainfall in Taiwan: Seasonal Statistics and Trends. J. Clim. 2021, 34, 4711–4731. [Google Scholar] [CrossRef]
- Varnes, D.J. Slope Movement and Types and Processes. In Landslides—Analysis and Control; Schuster, R.L., Krizek, R.J., Eds.; Special Report 176; National Academy of Sciences: Washington, DC, USA, 1978; pp. 11–33. [Google Scholar]
- Knapp, K.R.; Kruk, M.C.; Levinson, D.H.; Diamond, H.J.; Neumann, C.J. The International Best Track Archive for Climate Stewardship (IBTrACS) Unifying Tropical Cyclone Data. Bull. Am. Meteorol. Soc. 2010, 91, 363–376. [Google Scholar] [CrossRef]
- Liou, Y.A.; Tran, D.P.; Nguyen, K.A. Spatio-Temporal Patterns and Driving Forces of Surface Urban Heat Island in Taiwan. Urban Clim. 2024, 53, 101806. [Google Scholar] [CrossRef]
- Breiman, L. Random Forests. Mach. Learn. 2001, 45, 5–32. [Google Scholar] [CrossRef]
- Chen, C.W.; Tung, Y.S.; Liou, J.J.; Li, H.C.; Cheng, C.T.; Chen, Y.M.; Oguchi, T. Assessing Landslide Characteristics in a Changing Climate in Northern Taiwan. Catena 2019, 175, 263–277. [Google Scholar] [CrossRef]
- Sassa, K.; Fukuoka, H.; Wang, F.; Wang, G. Landslides Induced by a Combined Effect of Earthquake and Rainfall. In Progress in Landslide Science; Springer: Berlin/Heidelberg, Germany, 2007; pp. 193–207. [Google Scholar]
- Pulhin, J.M.; Tapia, M.A.; Perez, R.T. Integrating Disaster Risk Reduction and Climate Change Adaptation: Initiatives and Challenges in the Philippines. In Climate Change Adaptation and Disaster Risk Reduction: An Asian Perspective; Emerald Group Publishing Limited: Bingley, UK, 2010; Volume 5, pp. 217–235. [Google Scholar]
- Emanuel, K. Increasing Destructiveness of Tropical Cyclones over the Past 30 Years. Nature 2005, 436, 686–688. [Google Scholar] [CrossRef] [PubMed]
- Tu, J.Y.; Chou, C.; Chu, P.S. The Abrupt Shift of Typhoon Activity in the Vicinity of Taiwan and Its Association with Western North Pacific–East Asian Climate Change. J. Clim. 2009, 22, 3617–3628. [Google Scholar] [CrossRef]
- Liang, A.; Oey, L.; Huang, S.; Chou, S. Long-Term Trends of Typhoon-Induced Rainfall over Taiwan: In Situ Evidence of Poleward Shift of Typhoons in Western North Pacific in Recent Decades. J. Geophys. Res. Atmos. 2017, 122, 2750–2765. [Google Scholar] [CrossRef]
Disclaimer/Publisher’s Note: The statements, opinions and data contained in all publications are solely those of the individual author(s) and contributor(s) and not of MDPI and/or the editor(s). MDPI and/or the editor(s) disclaim responsibility for any injury to people or property resulting from any ideas, methods, instructions or products referred to in the content. |
© 2025 by the authors. Licensee MDPI, Basel, Switzerland. This article is an open access article distributed under the terms and conditions of the Creative Commons Attribution (CC BY) license (https://creativecommons.org/licenses/by/4.0/).