Abstract
Rainfall-induced cut-slope failures are one of the main causes of traffic disruptions in road networks, consuming 30–50% of annual road maintenance budgets. Therefore, it is crucial to analyze how traffic disruptions, resulting from cut-slope failures, impact the overall operation of road networks. In addition, as climate change alters the precipitation patterns, the frequency of these phenomena is expected to increase. For these reasons, it is essential to develop a methodology, from a risk perspective, to understand and assess how cut-slope failures impact the normal operation of road networks. This article introduces a methodology to assess the risk of traffic disruption caused by rainfall-induced cut-slope failure, in terms of Origin–Destination travel time increases. The methodology comprises three stages: (1) modeling the rainfall hazard, (2) estimating the road network’s vulnerability to slope instability, and (3) quantifying risk through resulting travel time increases. A case study was performed on a road network highly vulnerable to cut-slope failure in the Biobío Region of southern Chile. The analysis using the GIS-based software revealed that rainfalls lasting more than 12 h increase average travel times by 20%, with maximum increases of about 40% for 24 h rainfalls, affecting travel between the main cities in the Biobio region and the Concepción metropolitan area. These results may be critical for decision-makers to identify highly exposed and vulnerable road sections in order to recommend effective mitigation strategies to reduce the risk of cut slope failures.
1. Introduction
Hydrometeorological events such as floods, waterlogging, landslides, and debris flows represent a constant hazard to road infrastructure all over the world [1,2,3]. These events can cause significant damage and generally manifest themselves in three ways. First, they can have a direct impact, physically damaging road assets and endangering road users. Second, they can cause the disconnection of critical road networks, resulting in severe economic damage, social impacts, and safety issues [4,5,6]. Finally, they can trigger interdependent failures with other essential services, where the inability to access and repair the disrupted roads also prevents the recovery of other critical networks that rely on them.
Some reported cases of the severity of these disturbances include, for example, a rainfall event in the United Kingdom in 2004, which led to the closure of major highways for four days due to landslides, which disrupted connectivity between cities and remote communities [5]. Similarly, in Chile, data from the Ministry of Public Works reveals that over 52% of roads damaged from natural events between 2011 and 2021 were related to rainfall-induced cut-slope failures, resulting in direct repair costs of $19.3 million US dollars [7]. These examples underscore the vulnerability of road networks to such hazards.
Road infrastructure is essential for social, economic, and safety purposes [2,5]. Among its key components, highway cut-slopes are particularly susceptible to failure caused by hydrometeorological events [8]. Rainfall is a primary trigger for these failures, often leading to partial or complete blockage of road segments and compromising the operational performance of the entire road network [9,10]. The resulting landslide poses a secondary threat, causing traffic disruptions as debris or the displaced soil volume obstructs the road.
Risk is the probability of an undesired event multiplied by the consequences [11,12]. In the context of rainfall-induced landslides, risk estimation integrates the probability of landslide occurrence with the consequences of slope failure on affected road sections, linking the physical damage to slopes with operational disruptions in the road network. This approach emphasizes the cascading effects of rainfall events, where the probability and severity of adverse consequences must consider the uncertainty or likelihood of hazard events and their outcomes [13].
Rainfall hazard modeling involves statistical approaches based on historical rainfall data to understand patterns, probabilities, and characteristics of extreme events. Standard methods include the use of extreme value probability distributions, such as Gumbel Type I or II, and Generalized Extreme Value (GEV), which estimate the likelihood of high-intensity or long-duration rainfall events [14,15]. These models are often applied to derive intensity-duration-frequency (IDF) curves that relate rainfall intensity and duration to specific return periods, providing critical insights into the recurrence of extreme events [16,17]. Additionally, meteorological and climate models like the Weather Research and Forecasting (WRF) model and ERA5 reanalysis simulate atmospheric processes to forecast rainfall patterns [18], while global and regional climate models assess long-term trends under different climate scenarios [19].
Physical vulnerability assessments of road infrastructure use probabilistic models to study slope stability under variable conditions. These models address uncertainties in critical soil properties and external solicitations such as rainfall intensity and duration [20,21]. Fragility functions, derived from these models, are instrumental in quantifying the vulnerability of slopes by linking rainfall characteristics with the probability of reaching a damage state. These curves integrate slope property uncertainties and hazard characteristics into a unified assessment, providing actionable insights for risk management [22,23,24]. Beyond physical damage, slope failure can disrupt connectivity, reduce traffic capacity, cause longer travel times, or result in complete disruptions. Traffic assignment models analyze these impacts by reassigning flows to alternative routes and estimating increased travel costs, highlighting the ripple effects of failures and underscoring the need to integrate physical damage estimates with network performance analyses [9,25,26].
Risk assessment methods applied to cut slopes, such as the “Unstable Slope Management System” [27] and similar frameworks developed in South Africa [28] and Mexico [29] have focused primarily on prioritizing slope repair based on physical damage, repair costs, and user safety. However, these approaches often disregard the broader impacts on road network operations. More recent frameworks, developed by Chamorro et al. [30], shift the focus to network-level risk assessment, combining failure probabilities with operational consequences. Based on their framework, Chamorro et al. [30] implemented SiGeR-RV, a piece of software that assesses risk using models to represent asset vulnerability and estimates risk based on increases in travel times by applying a traffic assignment model from a topological point of view [31]. For instance, Meyer et al. [9] used graph theory to estimate annual detour costs from landslides in Norway by incorporating topographic susceptibility models, hydrometeorological conditions, and traffic load redistribution. Hybrid methods discussed by Hackl et al. [32] and Pregnolato et al. [33] combine these techniques with traffic assignment models to evaluate user costs under various hazard scenarios, providing frameworks adaptable to flood and mudflow risk assessment.
Traditional risk analyses for road networks have predominantly focused on the direct economic losses associated with physical infrastructure repair, neglecting the significant indirect costs assumed by road users due to loss of connectivity and travel delays. While recent studies have begun to incorporate user-related costs [10,34,35], a clear gap remains in developing integrated methodologies that can quantitatively link the probabilistic nature of a rainfall hazard to the systemic, network-level consequences of traffic disruption. Existing models often struggle to couple geotechnical slope failure analysis with traffic assignment models in a spatially explicit manner that captures the full range of socioeconomic impacts.
To address this gap, this research proposes a methodology to evaluate the risk of traffic disruptions resulting from spatially distributed, rainfall-induced cut-slope failures. This methodology shifts the focus from the physical failure event to its operational consequences. The risk is subsequently quantified in terms of the differential in travel time between normal and disrupted network conditions. The risk assessment is performed under various rainfall scenarios, considering return periods from 5 to 100 years. The proposed approach follows an interdisciplinary risk perspective, integrating (1) hazard modeling, (2) asset vulnerability evaluation using a probabilistic assessment of cut-slope failure based on rainfall triggers, (3) assessment of road exposure in the face of cut-slope failures identifying road blockages, and (4) evaluation of consequences in road networks simulating traffic rerouting through a traffic assignment model. This methodology uses the GIS-based software SIGER-RV [30] to analyze a road network in southern Chile and provides a more general and user-centric approach to risk assessment, offering valuable insights for transportation managers.
2. Proposed Methodology to Assess Precipitation-Induced Cut-Slope Failure Risk in Road Networks
Figure 1 shows the methodology to estimate the risk of precipitation-induced cut-slope failure in the road network. It considers three steps: (1) Hazard modeling; (2) Road network vulnerability evaluation; and (3) Risk assessment.
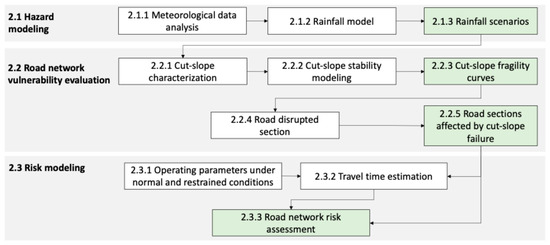
Figure 1.
Methodology to estimate risk on road networks resulting from rainfall-induced cut-slope failure.
2.1. Hazard Modeling
This step consists of analyzing meteorological and hydrological conditions to define possible risk scenarios. The following is an example of a procedure that can be applied to carry out this step.
2.1.1. Meteorological Data Analysis
The hazard modeling process begins with the pre-processing of meteorological data, emphasizing the preparation and refinement of rainfall records to ensure the accuracy of subsequent analyses. Daily precipitation data from meteorological stations are selected based on their proximity to the study area and their data completeness. To address gaps in the records, interpolation is conducted using the Inverse Distance Weighted (IDW) method with a quadratic decay factor, as described in Equation (1). Equation (1) integrates stochastic noise to simulate variability better.
where P is the interpolated precipitation value in a given location, are neighboring rainfall values available in n station, is the Euclidean distance from the stations to the given location weighted by power parameter p, which is determined empirically by minimizing prediction error through a cross-validation process. is the average coefficient of determination of the linear relationship between the filling stations and the station to be filled, δ is a random variable with a standard normal distribution [0, 1], and S is the monthly standard deviation of the target station. Verification procedures discard stations if the data filling process causes monthly variations exceeding ±25% in more than two non-consecutive months.
2.1.2. Rainfall Model
In this methodological step, processed meteorological data are used to characterize precipitation histograms on temporal and spatial scales. Hourly records from ERA5 [18,36] are used to refine precipitation data. ERA5 data are aggregated into daily scales, compared with observed station data for bias correction, and then downscaled into hourly values. This corrected dataset, ERA5-BC, integrates temporal distributions derived from ERA5’s original hourly records to ensure temporal coherence.
IDF curves were subsequently developed by means of duration and frequency coefficients defined for different urban centers, which are considered to be independent [37]. The duration coefficient quantifies the proportion of rainfall in a storm of “D” hours relative to a 24-h storm. In contrast, the frequency coefficient “F” expresses the ratio of T-year return period rainfall to 10-year return period rainfall. These coefficients were considered independent. Regionalized Intensity-Duration-Frequency (IDF) curves were then established for each station by assigning the coefficients from the nearest urban center.
The construction of IDF curves is critical in understanding precipitation dynamics across various temporal scales. IDF curves represent the relationship between annual maximum rainfall intensity, duration, and return period. This approach allows the estimation of extreme precipitation events for different return periods and their spatial representation, supported by references such as Pizarro et al. [38] and Vörösmarty et al. [39].
2.1.3. Rainfall Scenarios
Here we use historical rainfall records to generate scenarios that depict potential rainfall-induced hazard conditions. IDF data can be complemented by the K-Nearest Neighbor (K-NN) resampling approach [40] to establish the temporal distribution within storm events (i.e., rainfall hyetograph). The K-NN is a data driven approach that generates synthetic rainfall sequences by resampling historical precipitation records. The method identifies historical storm patterns (‘neighbors’) that exhibit general characteristics like the target event, potentially defined by parameters such as return period and duration derived from IDF analysis. This data-driven approach preserves the temporal structures inherent in observed rainfall. Applying K-NN enables the stochastic generation of realistic precipitation time series for specific storm events that preserves the temporal structures inherent in observed rainfall. These synthetic events simulate plausible precipitation scenarios for subsequent stability modeling, facilitating the assessment of potential slope failures and associated risks.
2.2. Road Network Vulnerability Evaluation
This step assesses the vulnerability of the road network based on the interaction between hazards and road cut-slopes.
2.2.1. Cut-Slope Characterization
The first task is to obtain the geometry and properties of the slopes adjacent to roads. Variables such as slope height, inclination, and soil type are critical. Soil properties (cohesion, friction angle, density, and permeability) are crucial for evaluating cut-slope stability. These data can be extracted from topographic surveys, geotechnical investigations, or GIS databases with the appropriate spatial resolution.
2.2.2. Cut-Slope Stability Modeling
In the second task, slope stability is assessed under the influence of precipitation using the input parameters from the characterization stage. Examples of methods to model cut-slope stability are the limit equilibrium methods (e.g., Fellenius, [41]; Bishop, [42]) or strength reduction approaches with finite element analysis [43,44] which compute the factor of safety of the cut slope under specific rainfall scenarios, including the simulation of the infiltration process.
The effect of infiltration on slope stability can be assessed using the Van Genuchten [45] or the Jimenez-Ramos et al. [24] approaches, to relate the changes in soil saturation to soil suction.
The soil suction is related to its shear strength using an appropriate model incorporating partial saturation effects which influence their stability (e.g., Vanapalli et al., [46]). It is applied iteratively for each precipitation scenario, considering the intensity and duration of the rainfall event over time.
2.2.3. Cut-Slope Fragility Probability Curves
From the stability analysis of cut slopes, the factor of safety (FoS) under different precipitation scenarios is used to estimate the probability of failure.
Failure probability curves represent the probability of slope failure as a function of precipitation intensity, typically described by duration or total rainfall. Analytical methods often rely on probabilistic tools, such as Monte Carlo simulations or reliability indices, to incorporate uncertainties of input variables such as soil properties or groundwater level location. Conversely, empirical approaches used historical failure data to establish these relationships. For example, Zhang et al. [21] and Jiménez-Ramos et al. [24] parameterized fragility curves based on rainfall characteristics (intensity or duration) or slope geometry (inclination angle, height). Regardless of the method employed, the outcome is a failure probability curve essential for assessing risks related to extreme rainfall events.
2.2.4. Road-Disrupted Section
This methodological step evaluates the extent of road segments affected by slope failures. The disruption in the road is described by the decrease in road capacity, as a function of the volume displaced due to the cut-slope failure.
One possible method for estimating this restriction condition is the relationship proposed by Jiménez-Ramos et al. [24]. In this method, when a slope exceeds a certain threshold of probability of failure, a state of damage to the roadway is estimated according to the height of the slope. It was assumed that the slope displaces soil toward the road when the failure probability exceeds 0.8. Under this condition, a damage state is assigned to the road as a function of the height of the slope:
- Low: If the slope has a height of less than 8 m, the soil covers only part of the clear zone of the road and the shoulder, so there is no traffic interruption. The capacity does not change.
- Medium: If the slope is between 8 and 16 m high, the soil covers part of a road lane, reducing the capacity between 30% and 60%. The speed is assumed to be 20 km per hour (km/h), considering that a work area has been implemented to remove the material.
- Extensive: If the slope is higher than 16 m, the soil covers two lanes, i.e., capacity and speed are restricted.
2.2.5. Road Sections Affected by Cut-Slope Failures
This analysis identifies and maps specific road sections disrupted by cut-slope failures. The approach overlays the road network inventory with spatial data on failed slopes, enabling the affected road sections to be accurately identified. The road inventory incorporated essential attributes such as road class, dimensions, and operational parameters, facilitating a detailed evaluation of potential disruptions. This integration ensured a comprehensive understanding of how slope failures impacted different road sections.
2.3. Risk Modeling
This step integrates hazard and vulnerability assessments to quantify the overall risk to the road network. The consequences of infrastructure damage were estimated over the network level of service (LoS) measured as a travel time increase.
2.3.1. Operational Parameters Under Normal and Restricted Conditions
The analysis of operating parameters under normal and restrained conditions involved defining the baseline functionality of the road network using attributes such as network topology, road hierarchy, and link lengths. For restricted conditions, the analysis examined the operational impacts caused by cut-slope failures, including reduced capacity and blocked lanes.
2.3.2. Travel Time Estimation
Travel time under normal and restrained conditions was modeled using a traffic assignment model to simulate changes in traffic flow because of road disruptions caused by cut-slope failures. The methodology leveraged static traffic assignment (STA) models, suitable for rural road networks, to estimate additional travel times and costs. STA models, such as the equilibrium approach by Wardrop [47] and the optimization framework by Beckmann et al. [48], calculated travel costs across network links, assuming average conditions over peak periods [49]. These models were efficient for evaluating steady-state traffic flow, providing insights into the impact of rerouted traffic during disruptions.
For example, the traffic assignment model (TAM) based on the foundational work of Beckmann et al. [48], with the extensions proposed by Nie et al. [49], works by distributing traffic across a given road network. The model is formulated as an optimization problem where the objective is to minimize the sum of integrals of link travel time functions.
The core of the TAM model is an optimization that seeks the most efficient distribution of traffic. Travel time on each link is not fixed, but increases with the amount of traffic. This relationship is defined by a volume-delay function, which calculates travel time based on the link’s free-flow travel time, its capacity, and calibrated parameters that reflect road characteristics such as road type and terrain. The necessary data, including the road network, traffic demand, and link capacities, are typically obtained from national inventories and traffic studies.
2.3.3. Road Network Risk Assessment
This step assesses the risk posed to the road network by cut slope failures, quantified in terms of operational impacts such as increased travel times from normal conditions (in percentages) or the related indirect costs. Travel time increases relative to normal traffic conditions are calculated based on the cut slopes that, as a result of its failure, interrupted roads under different rainfall scenarios simulated in Section 2.1, usually defined for return periods ranging from 2 to 500 years. These return periods represent different rainfall intensity and duration levels, allowing for the analysis of a broad spectrum of possible events, from frequent low-impact storms to extreme events.
3. Application to the Biobío Region, Southern Chile
3.1. Study Area Description
The Biobío region of southern Chile, situated between coordinates 36°36′23.9″ S, 72°6.206′ W and 36°49′37.2″ S, 73°2.986′ W (as presented in Figure 2), exhibits a complex geomorphology that renders it an exemplary area for studying the impact of precipitation on road infrastructure. The principal cities within the study area are Concepción (the region’s main metropolis), located in the west (coastal zone), Chillán and Los Ángeles situated in the east (central depression), and Lebu, located in the southwest (coastal zone). The study focuses on corridors linking the central depression and coastal cities, vital for regional connectivity and economic development. To estimate the affected slopes and the associated risk as a function of travel time increase, the GIS-based software, SiGeR-RV, was used. SiGeR-RV is described in Chamorro et al. [30].
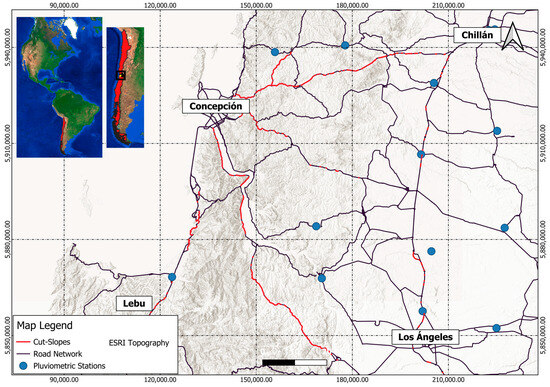
Figure 2.
Location and general characteristics of the study area.
The geomorphological setting is defined by five primary units distributed east–west: coastal plains (10–50 masl, predominantly fluvial sediments with silts and clays near the Coastal Range); the Coastal Range (elevations over 1000 masl, traversed by major road networks), which is the zone with a significant concentration of cut-slopes (~63%), due to the topography; the Central Depression (undulating plains with higher road density and urban concentration); the Precordillera (300–850 masl, sedimentary soils with clays and gravels); and the Andes (1700–1800 masl, rocky substrates and sparse road network).
Precipitation variability is strongly influenced by geomorphology, as recorded by 16 rainfall stations with a minimum of 30 years of data. Annual precipitation averages 1000 mm along the coast and the Coastal Range, 1300 mm in the Central Depression, and 1400 to 2000 mm in the Precordillera and Andes [50].
Between 2010 and 2024, the Chilean Highway Agency reported 284 road emergencies affecting normal traffic conditions, of which 104 events (37%) were attributed to soil cut-slope failures. Of these emergencies, 39% were classified as minor, involving no traffic disruption; 53% as moderate, with partial lane blockages; and 8% as severe, leading to complete road closures. A total of 138 km of road segments were affected [7].
The road network in the study area and its specific characteristics were obtained from the geodatabase of roads from the Chilean Ministry of Public Works [51,52] in shape format. Files contain the attributes of each road, such as road ID, roadway type, orientation, and road class. The roads were classified into multilane, two-way, two-lane class 1 roads and two-way, two-lane class 2 roads according to the average speed and road capacity (see Table 1). The principal road network consists of 284 km of multilane highways and 2148 km of two-way, two-lane, Class 1 and Class 2 roads; all the roads are paved. On multilane roads, each carriageway cross-section consists of two lanes (each 3.5 m wide), a 2.5-m-wide shoulder, and a 6-m-wide median. On bidirectional two-lane roads, the cross-section consists of one lane per roadway direction with a lane width of 3.5 m and shoulders of 1.5 m.

Table 1.
Operating parameters under normal conditions.
The annual average daily traffic (AADT), average travel speed, and road capacity were estimated utilizing the traffic database provided by the Chilean Ministry of Public Works [53], which is available online. All parameters were estimated under unsaturated flow conditions, allowing traffic assignment models to be applied. On multilane roads, the average AADT is 5224 vehicles/day-year (1568 pcu/h/lane). For Class 1 roads, the average AADT is 8682 vehicles/day-year (1300 pcu/h/lane), while for Class 2 roads, the average AADT is 3356 vehicles/day-year (503 pcu/h/lane). The design speed and highway capacities under normal operating conditions were obtained from MOP [52,54].
3.2. Rainfall Modeling
The primary objective of this rainfall modeling was to generate spatial representations, in the form of isohyets, of total precipitation for rainfall events corresponding to return periods between 5 and 100 years and various durations. This was achieved by following the methodology described as an example in Section 2.1, systematically analyzing the precipitation records of 16 weather stations within the study area (Figure 2), each possessing at least 15 years of data.
The cumulative precipitation from these generated events per station was then spatially interpolated to create a Triangulated Irregular Network (TIN). These TINs represent the total rainfall height (mm) for design storm events. As an example of these outputs, Figure 3 illustrates the spatial distribution of precipitation for 5, 50, and 100-year return periods (T), each with a 24 h duration (D). The generated outputs include TINs for return periods of 5, 10, 25, 50, and 100 years, and for storm durations of 1, 6, 12, and 24 h.
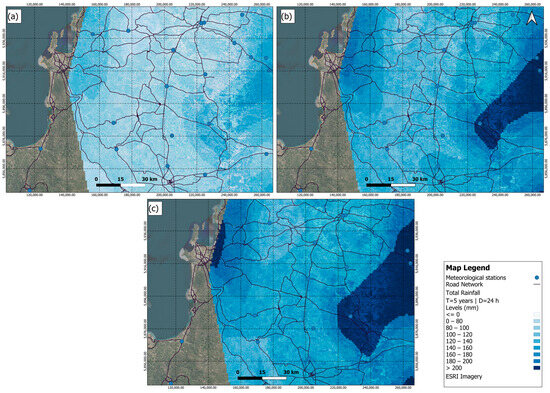
Figure 3.
Graphical representation of the total rainfall (in mm) for a 24 h rainfall event for return periods of (a) 5 years, (b) 50 years, and (c) 100 years.
Figure 3 indicates that rainfall events with the highest accumulated precipitation are concentrated in the coastal zone and the intermediate depression, proximate to the Andean foothills. For storms with a 5-year return period, total event precipitation ranges from 33 mm to 232 mm. For a 50-year return period, these values range from 47 mm to 335 mm; for a 100-year return period, the range is between 52 mm and 364 mm.
3.3. Road Network Vulnerability
To evaluate road network vulnerability against the rainfall simulated in Section 3.2, a georeferenced and attributed inventory of the regional road network’s main routes was compiled to identify cut-slopes for the study.
3.3.1. Cut-Slope Characterization
The cut-slope inventory, to characterize cut-slope attributes, presented in Figure 2 (lines in red) was developed using information gathered from fieldwork conducted in conjunction with the Chilean Highway Agency of the Ministry of Public Works, alongside virtual surveys utilizing Google Street View. Dimensions were estimated from Google Street View imagery based on pixel size, using the software MB Ruler v5.4 [55]. A total of 1041 cut-slopes were identified, and most of these were validated through on-site fieldwork.
The recorded cut-slopes exhibited heights ranging from 2 to 17 m (mean: 6 m) and inclinations between 40° and 80° (mean: 59°). This study considered cut-slopes greater than 3 m in height and angles exceeding 35°. Cut-slopes with structural support measures (0.7%) and those composed of rock (1.2%) were excluded from the study.
3.3.2. Cut-Slope Fragility Probability Curves
Subsequently, the probability of slope failure was estimated based on the duration and intensity of the rainfall events. This estimation utilized the precipitation data derived from the maps presented in Figure 3 and the cut-slope location detailed in Figure 2. The curves plotted in Figure 4, adopted from Jiménez-Ramos et al., [24], were used to estimate the probability of failure in the cut-slopes of the study area. These curves are parameterized only by slope inclinations α ranging from 30° to 60°, which implicitly considers the predominant soil type of the slope. The development of these curves inherently includes the variability of soil strength parameters through probabilistic analysis as indicated in Jiménez-Ramos et al. [24]. Their analysis used the probability distributions of soil parameters proposed by Sivakumar Babu and Muthi [56] including a wide range of potential soil behaviors.
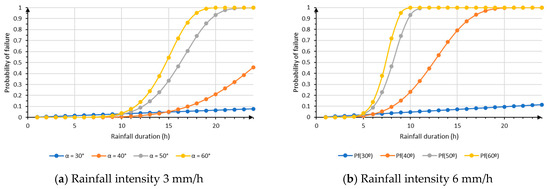
Figure 4.
Probability curves to estimate cut-slope failure [24].
To estimate the affected cut-slopes, the input data and procedures were integrated into the SiGeR-RV software [30]. This integration obtained failure probabilities for each inventoried cut-slope as a function of simulated precipitation events.
To facilitate the interpretation of failure probability, in Figure 5, three potential physical damage states for the cut-slope were arbitrarily defined: slight, moderate, and severe, each associated with a specific range of failure probability. A “slight” damage state corresponds to a failure probability range of 0.0 to 0.4; a “moderate” damage state encompasses probabilities from 0.4 to 0.8; and a “severe” damage state is assigned for probabilities ranging from 0.8 to 1.0.
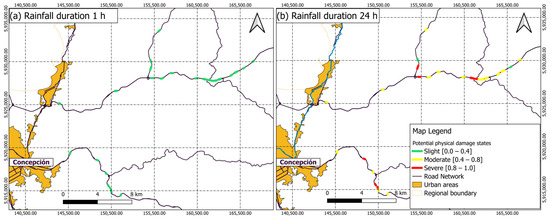
Figure 5.
Potential states of physical damage associated with failure probability on cut slopes of a section of a highway that connects Chillán to Concepción for a 100-year return period with rainfall durations of (a) 1 h, and (b) 24 h.
Figure 6 shows a section of the road connecting Chillán and Concepción, illustrating these three states of damage associated with precipitation events with a return period of 100 years. These were correlated with available Google Street View imagery from May 2024; severe damage is associated with a completely failed cut slope, moderate damage corresponds to a slope exhibiting superficial failure similar to an erosion process, and slight damage indicates no apparent failure. It is important to note that this procedure was conducted primarily to verify the operational functionality of the proposed methodology and does not constitute a formal validation, as specific information regarding the causative rainfall events and the precise dates of the failures observed in the photographs was unavailable.
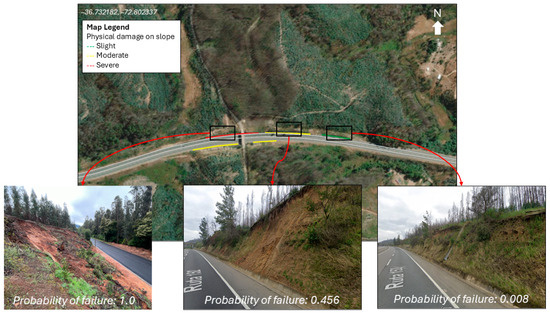
Figure 6.
Representation of physical damage in cut-slopes associated with failure probability.
3.4. Estimating Travel Time Increases
The operational conditions of the road network are adjusted post-event according to the methodology detailed in Section 3.2. Specifically, as per Step 2, if the probability of cut-slope failure surpasses 0.8, a traffic interruption state—Low, Medium, or Extensive—is determined by the height of the failed slope. This assignment then dictates the subsequent changes to the road’s capacity and average travel speed from their initial, pre-event levels, which are defined by road category (e.g., Multilane, Two-way two-lane Class 1, or Two-way two-lane Class 2, as per the provided baseline data).
For the traffic modeling in this study, the capabilities of the SiGeR-RV software Version 2020 [30] were utilized. As a result of the traffic modeling, travel times associated with the simulated rainfall scenarios were obtained. The following results (summarized in the table below) are related to different Origin–Destination (O-D) trips within the study area. Specifically, connections to and from Concepción and the Lebu-Chillán connection were analyzed, the latter representing a route spanning two extremes of the study zone.
The estimated travel times in Table 2 indicate how travel duration varies for each O-D pair under different rainfall conditions. These results demonstrate that as the return period and/or duration of the rainfall event increases, there are corresponding increases in travel times. These increases are attributed to traffic rerouting, a consequence of cut-slope failures and subsequent road capacity reductions, as conceptually illustrated in Figure 7, to the connection between Concepción and Chillán.
Table 2.
Travel time increases (in min and %) for different rainfall events and O-D pairs.
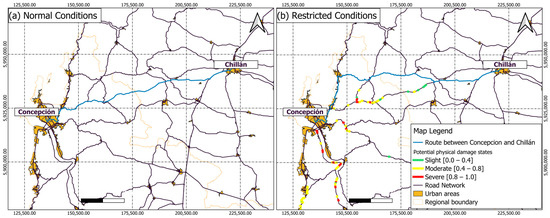
Figure 7.
Connection route between Concepción-Chillán under (a) normal conditions and (b) altered conditions resulting from simulated precipitation scenarios (T = 100 years, duration from 1 to 24 h).
Figure 7 illustrates the shortest route under normal conditions (without landslide impacts) and the alternative route, under restricted conditions, required during a 100-year return period rainfall event with a 24 h duration. The original route takes 55 min to complete. However, after 24 h of rainfall, the optimal path changes significantly, requiring vehicles to be redirected along an alternative northern route. This detour increases travel time by 24% and becomes necessary because sections of the original route become impassable due to slope failures.
4. Discussion
4.1. Discussion of the Case Study
Based on the estimated travel times presented in Table 2, several key observations can be made regarding the impact of precipitation scenarios on different origin–destination pairs within the study area. For a return period of 5 years, the most pronounced increase in travel time is observed for the Concepción-Chillán and Chillán-Concepción connections. Specifically, under a 24-h rainfall duration, these routes experience approximately a 24% increase in travel times (from 55 to 68 min for C-C, and 53 to 66 min for C-C return) (Figure 7). In contrast, the other evaluated connections, such as Lebu-Chillán and Chillán-Lebu, show a comparatively minor average increase of around 10% for the same 24-h duration. For rainfall durations shorter than 24 h within the 5-year return period, no significant increases in travel times are observed across any of the analyzed connections. This suggests that the primary route linking Chillán and Concepción is particularly vulnerable to disruptions under these conditions, likely due to its critical role and potentially limited alternative routes. At the same time, other connections benefit from greater network redundancy or are less susceptible to slope failures triggered by these rainfall events.
Examining higher return periods reveals a breakpoint where the impact of rainfall events extends more significantly to other connections. For instance, considering a return period of 10 years, while the 24 h duration still heavily impacts the Concepción-Chillán corridor (with similar increases to the 5-year return period), the Chillán-Lebu connection also begins to show a more noticeable increase in travel time, rising from 127 min to 140 min (~10% increase) for the 24 h duration. This trend becomes more evident at the 25 and 50-year return periods, where both the Lebu-Chillán and Chillán-Lebu routes consistently show increased travel times for 12 and 24 h durations. At the 100-year return period, the most severe scenario (24 h duration) results in the most significant proportional increase for the Lebu-Chillán route, reaching 168 min (~28% increase from the baseline of 131 min for shorter durations). This increase in travel times across multiple O-D pairs with longer return periods and durations indicates that more severe rainfall events trigger a wider range of slope failures, impacting a larger portion of the network and reducing the effectiveness of alternative routes. The observed increases highlight the growing vulnerability of the entire network, beyond just the primary Concepción-Chillán corridor, as the intensity and duration of precipitation events become more extreme (Figure 7).
Comparing Figure 3 and Figure 7, it can be seen that as the return period increases from 5 years (map 3.a) to 50 years (map 3.b) and finally to 100 years (map 3.c), the intensity and spatial extent of the heaviest rainfall (represented by the darker blue tones) become more pronounced. This visually confirms that rarer events are associated with significantly higher rainfall volumes. The legend in Figure 3 quantifies these precipitation levels, where the darkest blue indicates precipitation greater than 200 mm. The greater presence of this dark blue area in maps 3.(b) and 3.(c) highlights the higher risk in those scenarios.
Although the case study demonstrated the applicability of the methodology, some limitations must be stated. The hazard modeling was represented for defined rainfall return periods and durations. This limits the extrapolation or analysis of independent events, but allows for a study at the planning level.
Regarding the estimation of slope failure probabilities, the curves adopted from Jiménez-Ramos et al. (2023) [24] did not include explicitly specific geotechnical properties of the slope in the analysis, such as soil type, strength and hydraulic properties or current water table level.
The traffic assignment analysis was limited to analyzing different connections between origin and destination without incorporating other travel patterns or changes in the origin–destination matrix. This simplification highlights a gap in capturing broader regional impacts, particularly in scenarios involving variable travel demands.
4.2. Discussion of the Proposed Methodology
From the application, it can be observed that there is a spatially distributed response of the road network to slope failures. This is mainly reflected in the existence of road sections with different states of interruption, as well as the existence of alternative routes.
The results allow the user to identify the most affected segments on Biobio Region. Knowing the assets most vulnerable to rainfall-induced cut-slope failure allows the focus of resources on implementing mitigation actions appropriate to the hazard and expected damage.
In this research, several assumptions were considered that can be refined. The probability curves do not consider the type of soil on the slope or the current state of the slope, such as its level of erosion or the location of the groundwater table before the storm. The traffic model can be improved by considering when failures occur and how soon optimal traffic conditions can be recovered.
While SiGeR-RV implements a specific traffic assignment model, it is essential to note that various alternative models could be employed for this purpose, provided they can adequately estimate traffic reassignment patterns in response to alterations in the physical or operational characteristics of links within a road network. The core requirement is the ability to predict how traffic flows are redistributed when network segments are affected, for instance, by capacity reductions or closures due to slope failures.
5. Conclusions
This paper proposed a methodology to assess the risk in road networks resulting from rainfall-induced cut-slope failure. The methodology was tested in a case study in southern Chile, a region particularly susceptible to such events due to its geographical and climatic characteristics, and where the road network is vital for regional connectivity. For this purpose, the risk management software SiGeR-RV was employed, integrating rainfall data and slope information specific to the study area.
The impact of rainfall on slopes, in terms of failure probability, was evaluated based on rainfall intensity and duration to estimate the likelihood of slope failure. However, these are not the only variables that could be considered hazard factors. Future research could benefit from incorporating other variables such as the cumulative rainfall which strongly influences the soil moisture conditions, and therefore the cut-slope failure susceptibility. Moreover, a fundamental step is to integrate the effects of climate change, assessing how increases in the intensity, frequency, and patterns of extreme rainfall events will alter the likelihood of landslides and, consequently, road disruptions, to ensure the resilience of long-term risk assessment.
In addition, specific slope characteristics were not included in the analysis, such as the soil type, the current condition of the slope regarding surface erosion levels, the presence of vegetation, or other forms of slope covering. Incorporating these factors into future assessments could enhance the accuracy of failure probability estimates and provide a more comprehensive understanding of the variables influencing slope stability under rainfall events. It is essential that the effectiveness of these future assessments be validated with field data, thereby addressing the current limitations outlined above.
Furthermore, we recognize that the damage states approach used to link the cut-slope failure with traffic disruption requires additional refinement and will be addressed in future stages of the research. Traffic disruption will be linked more precisely to key physical parameters, such as slope geometry, estimated landslide volume, or rainfall thresholds. These parameters could be correlated with landslides modeling strategies, to create a more robust quantitative assessment of the impact on the capacity of the road.
The effect of the volume displaced onto roads due to slope failures is a critical point that needs to be improved in future research. In the case study, specific criteria were assumed, which were obtained from the literature. However, this analysis requires further analysis, not only focused on how the materiality and geometry of the slopes define the volume of the failure, but also on how this impacts the capacity of the roads and the speed of vehicle traffic.
A key direction for future research related to travel time estimation is to advance this work by developing a traffic assignment model that integrates the effect of soil sliding on road platform in capacity as a tool to estimate the travel time increase. Furthermore, future studies should address the current limitation by incorporating a variable origin–destination matrix and diverse travel patterns. This will enable a more realistic simulation of how transportation demand is redistributed during adverse events, such as extreme rainfall, providing a more comprehensive understanding of regional impacts.
Although the case study centers on the main corridors of the Biobío region, the methodological framework is broadly applicable and not confined to this specific context. The proposed methodology is structured to be modular and updatable. It can be adapted to the future inclusion of secondary or redundant routes by incorporating their respective slope inventories. Fundamentally, the methodology also allows for the revision of basic components, such as fragility curves and traffic simulation models, ensuring that risk analysis can evolve with new information. These expansion capabilities provide solid guidance for future research and a more comprehensive approach to managing road network disruptions.
Despite the limitations of the case study presented in this article, the proposed methodology successfully estimates travel time impacts. It provides valuable preliminary insights into potential risks within road networks caused by cut-slope failures. By simulating the relationship between slope instability and operational disruptions, the methodology serves as a practical tool for identifying areas of concern and supporting decision-making in managing road network vulnerabilities. This initial risk estimation methodology can effectively guide further, more detailed analyses and inform the development of proactive mitigation strategies to enhance network resilience against slope-related hazards, ultimately contributing to safer and more reliable transportation systems in susceptible regions.
Author Contributions
Conceptualization, M.C.-J. and A.C.; Methodology, M.C.-J., A.C., C.S. and T.E.; State of the art, M.C.-J. and T.E.; Data analysis: M.C.-J., C.S. and J.G.; Writing—Original Draft Preparation, M.C.-J.; Writing—Review & Editing, M.C.-J., A.C., T.E., E.S. and C.A.B.; Visualization, M.C.-J.; Project Administration, A.C. and T.E.; Funding Acquisition, M.C.-J., A.C., T.E. and C.A.B. All authors have read and agreed to the published version of the manuscript.
Funding
This research was funded by the National Agency of Research and Development of Chile (ANID) through multiple funding mechanisms: the FONDEF Project “Development and application of a traffic interruption model due to road slope failure caused by extreme weather event” (Grant no. ANID/FONDEF/ID22I10037), the Research Center for Integrated Disaster Risk Management (CIGIDEN) (Grant no. ANID/FONDAP/1523A0009), and the Doctoral Scholarship Program (DOCTORADO NACIONAL/20121—21221223).
Institutional Review Board Statement
Not applicable.
Informed Consent Statement
Not applicable.
Data Availability Statement
The data presented in this study are available on request from the corresponding author.
Acknowledgments
Authors would like to acknowledge the financial support provided by the National Agency of Research and Development of Chile (ANID), and the Research Center for Integrated Disaster Risk Management (CIGIDEN) (Grant no. ANID/FONDAP/1523A0009).
Conflicts of Interest
The authors declare no conflicts of interest.
References
- Keller, G.; Sherar, J. Low-volume roads engineering: Best management practices. Transp. Res. Rec. 2003, 1819, 174–181. [Google Scholar] [CrossRef]
- Tacnet, J.-M.; Mermet, E.; Maneerat, S. Analysis of importance of road networks exposed to natural hazards. In Proceedings of the AGILE 2012 International Conference on Geographic Information Science, Avignon, France, 24–27 April 2012; pp. 24–27. [Google Scholar]
- Argyroudis, S.A.; Mitoulis, S.A.; Winter, M.G.; Kaynia, A.M. Fragility of transport assets exposed to multiple hazards: State-of-the-art review toward infrastructural resilience. Reliab. Eng. Syst. Saf. 2019, 191, 106567. [Google Scholar] [CrossRef]
- Xie, W.; Li, N.; Li, C.; Wu, J.D.; Hu, A.; Hao, X. Quantifying cascading effects triggered by disrupted transportation due to the Great 2008 Chinese Ice Storm: Implications for disaster risk management. Nat. Hazards 2014, 70, 337–352. [Google Scholar] [CrossRef]
- Winter, M.G.; Harrison, M.; Macgregor, F.; Shackman, L. Landslide hazard and risk assessment on the Scottish road network. Proc. Inst. Civ. Eng. Geotech. Eng. 2013, 166, 522–539. [Google Scholar] [CrossRef]
- Allen, E.; Costello, S.B.; Henning, T.F. Contribution of network redundancy to reducing criticality of road links. Transp. Res. Rec. 2024, 2678, 1574–1590. [Google Scholar] [CrossRef]
- SIEMOP-FEMN. Ministry of Public Works Emergency and Operational Visor [In Spanish]. Ministry of Public Works Emergency Information System. Available online: https://ide.mop.gob.cl/Emergencias/#/index (accessed on 30 June 2024).
- Huang, Y.; Cheng, H. The impact of climate change on coastal geological disasters in southeastern China. Nat. Hazards 2013, 65, 377–390. [Google Scholar] [CrossRef]
- Meyer, N.K.; Schwanghart, W.; Korup, O.; Nadim, F. Roads at risk: Traffic detours from debris flows in southern Norway. Nat. Hazards Earth Syst. Sci. 2015, 15, 985–995. [Google Scholar] [CrossRef]
- Zhang, N.; Alipour, A. Integrated framework for risk and resilience assessment of the road network under inland flooding. Transp. Res. Rec. 2019, 2673, 182–190. [Google Scholar] [CrossRef]
- Kron, W. Flood risk = hazard • values • vulnerability. Water Int. 2005, 30, 58–68. [Google Scholar] [CrossRef]
- Peduzzi, P.; Dao, H.; Herold, C.; Mouton, F. Assessing global exposure and vulnerability towards natural hazards: The Disaster Risk Index. Nat. Hazards Earth Syst. Sci. 2009, 9, 1149–1159. [Google Scholar] [CrossRef]
- Aven, T. A risk concept applicable for both probabilistic and non-probabilistic perspectives. Saf. Sci. 2011, 49, 1080–1086. [Google Scholar] [CrossRef]
- Anghel, C.G. Revisiting the use of the gumbel distribution: A comprehensive statistical analysis regarding modeling extremes and rare events. Mathematics 2024, 12, 2466. [Google Scholar] [CrossRef]
- Osei, M.A.; Amekudzi, L.K.; Omari-Sasu, A.Y.; Yamba, E.I.; Quansah, E.; Aryee, J.N.; Preko, K. Estimation of the return periods of maxima rainfall and floods at the Pra River Catchment, Ghana, West Africa using the Gumbel extreme value theory. Heliyon 2021, 7, e06980. [Google Scholar] [CrossRef]
- Koutsoyiannis, D.; Kozonis, D.; Manetas, A. A mathematical framework for studying rainfall intensity-duration-frequency relationships. J. Hydrol. 1998, 206, 118–135. [Google Scholar] [CrossRef]
- Yeo, M.H.; Nguyen, V.T.V.; Kim, Y.S.; Kpodonu, T.A. An integrated extreme rainfall modeling tool (SDExtreme) for climate change impacts and adaptation. Water Resour. Manag. 2022, 36, 3153–3179. [Google Scholar] [CrossRef]
- Hersbach, H.; Bell, B.; Berrisford, P.; Hirahara, S.; Horányi, A.; Muñoz-Sabater, J.; Nicolas, J.; Peubey, C.; Radu, R.; Schepers, D.; et al. The ERA5 global reanalysis. Q. J. R. Meteorol. Soc. 2020, 146, 1999–2049. [Google Scholar] [CrossRef]
- Kharin, V.V.; Zwiers, F.W.; Zhang, X.; Hegerl, G.C. Changes in temperature and precipitation extremes in the IPCC ensemble of global coupled model simulations. J. Clim. 2007, 20, 1419–1444. [Google Scholar] [CrossRef]
- Li, K.S.; Lumb, P. Probabilistic design of slopes. Can. Geotech. J. 1987, 24, 520–535. [Google Scholar] [CrossRef]
- Zhang, J.; Huang, H.W.; Zhang, L.M.; Zhu, H.H.; Shi, B. Probabilistic prediction of rainfall-induced slope failure using a mechanics-based model. Eng. Geol. 2014, 168, 129–140. [Google Scholar] [CrossRef]
- Porter, K.A. Beginner’s guide to fragility, vulnerability, and risk. In Encyclopedia of Earthquake Engineering; Beer, M., Kougioumtzoglou, I., Patelli, E., Au, I.K., Eds.; Springer: Berlin/Heidelberg, Germany, 2015. [Google Scholar]
- Schultz, M.T.; Gouldby, B.P.; Simm, J.D.; Wibowo, J.L. Beyond the Factor of Safety: Developing Fragility Curves to Characterize System Reliability; US Army Corps of Engineers: Washington, DC, USA, 2010; p. 51. [Google Scholar]
- Jiménez-Ramos, G.; Echaveguren, T.; Vargas-Baecheler, J.; Chamorro, A. Traffic interruption risk induced by cut-slope failure: The rainfall effect. Transp. Geotech. 2023, 41, 100993. [Google Scholar] [CrossRef]
- Berdica, K. An introduction to road vulnerability: What has done is done and should be done. Transp. Policy 2002, 9, 117–127. [Google Scholar] [CrossRef]
- Mühlhofer, E.; Koks, E.E.; Kropf, C.M.; Sansavini, G.; Bresch, D.N. A generalized natural hazard risk modelling framework for infrastructure failure cascades. Reliab. Eng. Syst. Saf. 2023, 234, 109194. [Google Scholar] [CrossRef]
- Ho, C.L.; Norton, S.S. Development of an Unstable Slope Management System; FINAL REPORT (No. WA-RD 270.1); Washington State Transportation of Department: Olympia, WA, USA, 1991. Available online: http://www.wsdot.wa.gov/research/reports/fullreports/270.1.pdf (accessed on 15 January 2025).
- Leyland, R.; Paige-Green, P. A simple slope hazard management system for the South African primary road network. In Proceedings of the 8th International Conference on Managing Pavement Assets (ICMPA2011), Santiago, Chile, 15–19 November 2011; Available online: http://worldcat.org/isbn/9789561412309 (accessed on 15 January 2025).
- Anguas, P.G.; Culebro, J.A.R. Gestión de Terraplenes y Riesgos Ante la Inestabilidad. Publicación Técnica. Instituto Mexicano del Transporte, Sanfandila, Mexico. 2014. Available online: http://www.imt.mx/archivos/Publicaciones/PublicacionTecnica/pt423.pdf (accessed on 15 January 2025).
- Chamorro, A.; Echaveguren, T.; Pattillo, C.; Contreras-Jara, M.; Contreras, M.; Allen, E.; Nieto, N.; de Solminihac, H. SIGeR-RV: A Web-Geographic Information System-Based System for Risk Management of Road Networks Exposed to Natural Hazards. Transp. Res. Rec. 2023, 2677, 754–769. [Google Scholar] [CrossRef]
- Allen, E.; Chamorro, A.; Poulos, A.; Castro, S.; de la Llera, J.C.; Echaveguren, T. Sensitivity analysis and uncertainty quantification of a seismic risk model for road networks. Comput. Aided Civ. Infrastruct. Eng. 2022, 37, 516–530. [Google Scholar] [CrossRef]
- Hackl, J.; Lam, J.C.; Heitzler, M.; Adey, B.T.; Hurni, L. Estimating network related risks: A methodology and an application in the transport sector. Nat. Hazards Earth Syst. Sci. 2018, 18, 2273–2293. [Google Scholar] [CrossRef]
- Pregnolato, M.; Ford, A.; Glenis, V.; Wilkinson, S.M.; Dawson, R.J. Impact of Climate Change on Disruption to Urban Transport Networks from Pluvial Flooding. J. Infrastruct. Syst. 2017, 23, 04017015. [Google Scholar] [CrossRef]
- Wang, W.; Yang, S.; Gao, J.; Hu, F.; Zhao, W.; Stanley, H.E. An Integrated Approach for Assessing the Impact of Large-Scale Future Floods on a Highway Transport System. Risk Anal. 2020, 40, 1780–1794. [Google Scholar] [CrossRef] [PubMed]
- Winter, M.; Wong, J. The assessment of quantitative risk to road users from debris flow. Geoenviron. Disasters 2020, 7, 4. [Google Scholar] [CrossRef]
- Bell, B.; Hersbach, H.; Simmons, A.; Berrisford, P.; Dahlgren, P.; Horányi, A.; Muñoz-Sabater, J.; Nicolas, J.; Radu, R.; Schepers, D.; et al. The ERA5 global reanalysis: Preliminary extension to 1950. Q. J. R. Meteorol. Soc. 2021, 147, 4186–4227. [Google Scholar] [CrossRef]
- MOP. Urban Drainage Manual [In Spanish]. Ministry of Public Works. Chilean Water Engineering Agency. Chile. 2013. Available online: https://repositoriodirplan.mop.gob.cl/biblioteca/items/4379116e-eceb-479c-ad6b-fdfc6b3b3a8c/full (accessed on 15 January 2025).
- Pizarro, R.; Valdés, R.; Abarza, A.; Garcia-Chevesich, P. A simplified storm index method to extrapolate intensity–duration–frequency (IDF) curves for ungauged stations in central Chile. Hydrol. Process. 2015, 29, 641–652. [Google Scholar] [CrossRef]
- Vörösmarty, C.J.; de Guenni, L.B.; Wollheim, W.M.; Pellerin, B.; Bjerklie, D.; Cardoso, M.; D’ALmeida, C.; Green, P.; Colon, L. Extreme rainfall, vulnerability and risk: A continental-scale assessment for South America. Philos. Trans. R. Soc. A Math. Phys. Eng. Sci. 2013, 371, 20120408. [Google Scholar] [CrossRef] [PubMed]
- Sharif, M.; Burn, D.H. Simulating climate change scenarios using an improved K-nearest neighbor model. J. Hydrol. 2006, 325, 179–193. [Google Scholar] [CrossRef]
- Fellenius, W. Statens Jarnvagars Geotekniska Kommission: Slutbetankande; Technical Report; Järnvägsstyhelsen [Railway Board]: Stockholm, Sweden, 1922; p. 1018. (In Swedish) [Google Scholar]
- Bishop, A.W. The use of the slip circle in the stability analysis of slopes. Géotechnique 1955, 5, 7–17. [Google Scholar] [CrossRef]
- Griffiths, D.V.; Lane, P.A. Slope stability analysis by finite elements. Geotechnique 1999, 49, 387–403. [Google Scholar] [CrossRef]
- Zheng, H.; Liu, D.F.; Li, C.G. Slope stability analysis based on elasto-plastic finite element method. Int. J. Numer. Meth. Eng. 2005, 64, 1871–1888. [Google Scholar] [CrossRef]
- van Genuchten, M.T. A closed-form equation for predicting the hydraulic conductivity of unsaturated soils. Soil Sci. Soc. Am. J. 1980, 44, 892–898. [Google Scholar] [CrossRef]
- Vanapalli, S.K.; Fredlund, D.G.; Pufahl, D.E.; Clifton, A.W. Model for the prediction of shear strength with respect to soil suction. Can. Geotech. J. 1996, 33, 379–392. [Google Scholar] [CrossRef]
- Wardrop, J. Some theoretical aspect of road traffic research. Road Paper Nº 36. Road Engineering Division Meeting. Proc. Inst. Civ. Eng. 1952, 1, 325–362. [Google Scholar] [CrossRef]
- Beckmann, M.; McGuire, C.; Winsten, C. Studies in the Economics of Transportation; Yale University Press: New Haven, CT, USA, 1956. [Google Scholar]
- Nie, Y.; Zhang, H.M.; Lee, D.-H. Models and algorithms for the traffic assignment problem with link capacity constraints. Transp. Res. Part B Methodol. 2004, 38, 285–312. [Google Scholar] [CrossRef]
- DGA. Hydrogeological Study of the Bío Bío Basin; General Water Directorate of the Ministry of Public Works: Santiago, Chile, 2012. (In Spanish) [Google Scholar]
- MOP. National Road Network—Dimensions and Characteristics; Ministry of Public Works. Chilean Highway Agency: Santiago, Chile, 2020. Available online: https://mapas.mop.gov.cl/ (accessed on 15 February 2025).
- MOP. National Road Network 2020 [Data Set]; Ministry of Public Works, Highways Directorate: Santiago, Chile, 2023; Available online: http://www.mapas.mop.cl/ (accessed on 5 January 2025).
- MOP. National Census Plan 2022 [Data Set]; Ministry of Public Works, Highways Directorate: Santiago, Chile, 2022; Available online: http://sitministerial.maps.arcgis.com/apps/webappviewer/index.html?id=91ae27f8339a44f2bf0790da6ca47d36 (accessed on 5 January 2024).
- MOP. Road Design Guidelines. Volume 3. Highways Manual. Ministry of Public Works. Chilean Highway Agency. Chile. 2024; Available online: https://mc.mop.gob.cl (accessed on 15 February 2025). (In Spanish)
- Markus Bader. MB Ruler Software v5.4. 2025. Available online: http://www.markus-bader.de/MB-Ruler/index.php (accessed on 15 January 2025).
- Sivakumar Babu, G.L.; Murthy, D.S. Reliability analysis of unsaturated soil slopes. J. Geotech. Geoenviron. Eng. 2005, 131, 1423–1428. [Google Scholar] [CrossRef]
Disclaimer/Publisher’s Note: The statements, opinions and data contained in all publications are solely those of the individual author(s) and contributor(s) and not of MDPI and/or the editor(s). MDPI and/or the editor(s) disclaim responsibility for any injury to people or property resulting from any ideas, methods, instructions or products referred to in the content. |
© 2025 by the authors. Licensee MDPI, Basel, Switzerland. This article is an open access article distributed under the terms and conditions of the Creative Commons Attribution (CC BY) license (https://creativecommons.org/licenses/by/4.0/).