Article

An Evaluation of a New Building Energy Simulation Tool to Assess the Impact of Water Flow Glazing Facades on Maintaining Comfortable Temperatures and Generating Renewable Energy

by
Fernando Del Ama Gonzalo
1,*,
Belén Moreno Santamaría
2 and
Juan Antonio Hernandez Ramos
3
1
Department of Sustainable Product Design and Architecture, Keene State College, 229 Main St, Keene, NH 03435, USA
2
Department of Construction and Architectural Technology, Technical School of Architecture of Madrid, Universidad Politécnica de Madrid, Av., 28040 Madrid, Spain
3
Department of Applied Mathematics, School of Aeronautical and Space Engineering, Technical University of Madrid (UPM), 28040 Madrid, Spain
*
Author to whom correspondence should be addressed.
Sustainability 2025, 17(21), 9669; https://doi.org/10.3390/su17219669
Submission received: 8 September 2025 / Revised: 14 October 2025 / Accepted: 28 October 2025 / Published: 30 October 2025

Abstract

Reducing energy consumption in buildings presents a challenge for the construction and architectural industries. Stakeholders in the building sector require innovative products and systems to reduce energy usage effectively. Building Energy Simulation (BES) tools are essential for understanding energy-related issues during the design phase. However, the existing BES tools are often complex and costly, making them inaccessible to many architects and engineers who lack the software expertise for integrating new systems into existing Building Energy Simulation frameworks. To address this gap, the authors of this article have developed a new tool that enables early-stage evaluation of building performance. Additionally, the tool includes Water Flow Glazing (WFG) as a construction element that is part of both the facade and the building’s heating and cooling system. The authors validated the methodology by comparing the results from the new tool with those from the commercial BES tool Indoor Climate and Energy IDA-ICE 5.0 in accordance with ASHRAE standards. The same cases were tested by comparing the indoor temperature of a room with the power absorbed by the water, as measured by both tools. A WFG facade can effectively help maintain comfortable room temperatures throughout both winter and summer while producing renewable thermal energy via water heat absorption. The accuracy of this tool was validated using the normalized root mean square error between results from the new tool and those from IDA-ICE 5.0, which remained below the maximum allowable error established by ASHRAE. Validation of the tool using an experimental prototype showed that a coefficient of determination (R2) of 0.91 can be achieved through iterative refinement between the model and measured data.

1. Introduction

The revised version of the Energy Performance of Buildings Directive (EPBD) encourages the adoption of innovative building techniques and materials by 2050 [1]. These materials can help designers accomplish the objective of zero-energy buildings, designed to generate an amount of energy from renewable technologies equivalent to their overall energy consumption. Public buildings with large glazing areas face challenges related to overheating and insufficient thermal and visual comfort, especially in Mediterranean climates. Adapting buildings to their environmental contexts, enhancing energy efficiency, and ensuring thermal and visual comfort are essential goals in architectural design [2].
The exterior walls, particularly the glazing, are the essential elements for reducing heating and air conditioning loads in buildings. The extensive use of glazed facades, coupled with inefficient cooling systems, increases the cooling loads and, therefore, electricity consumption [3,4]. The g-factor of the selected glass must be low because solar radiation accounts for most of the cooling load. Short-wave radiation passes through the window and is converted into long-wave radiation, thereby retaining the energy inside the room as heat. Hence, a low g-factor prevents direct solar radiation from getting into the building [5].
In the context of innovative glazing solutions to enhance the performance of building envelopes, several emerging technologies include aerogel-infused materials, glazing systems integrating photovoltaic cells, and electrochromic facades [6,7,8]. Previous articles studied the ability of Water Flow Glazing (WFG) to improve the energy efficiency of building envelopes [9,10,11]. Some authors have used prototypes to assess various glazing options, and the simulation results concluded that lowering the g-factor yields greater efficiency for thermal performance than increasing the U-value of the glazing [12]. As a heating and cooling device, WFG is compatible with hydronic technologies such as radiant floors and water-to-water heat pumps [13]. Increasing the radiant area and reducing the gap between comfortable and radiant temperatures increased the coefficient of performance of the heat pumps [14,15]. To understand the integration between WFG and existing energy sources, accurate building energy simulation tools provide users with the necessary frameworks for evaluating these systems. By utilizing these simplified simulation tools, designers can predict how WFG systems will perform under various conditions, ensuring that energy efficiency goals are met effectively [16,17].
Building Energy Simulation tools can be divided into special-purpose and general-purpose ones. The former utilizes standard algorithms for simulation and expedites calculations, although it is not flexible enough to simulate non-standard problems. EnergyPlus is an example of a special-purpose one. The latter allows users to redefine their simulation models. Therefore, they are well suited to implement disruptive technologies, such as Water Flow Glazing. However, they require increased complexity and slower calculation speeds and are not recommended for preliminary whole-building simulations [18]. As a general-purpose tool, IDA-ICE can implement new mathematical models using FORTRAN and C++. Some scientific described the equations implemented in IDA-ICE [19,20]. Advanced software tools import geometries from 3D modeling tools or use free and very basic modeling software. However, it is necessary to modify or enhance the imported supplemented walls, or eliminate irrelevant graphic options. Another reason for selecting IDA-ICE as a general-purpose tool was its seamless import of BIM 3D models [21].
The creation of a new tool arises from the complexity associated with existing Building Energy Simulation tools, such as IDA-ICE. Although using these tools is essential for understanding the energy consumption of buildings over the year, their complexity can be a barrier for users, especially for architects in the early stages of design, when quick decisions are often required [22,23]. The proposed tool considers two different scenarios: steady conditions and transient conditions. Simulating steady conditions provides the user with a quick response and understanding of the thermal problem. However, the steady-state model is not reliable for analyzing thermal performance when solar radiation, indoor and outdoor temperature, occupancy, and HVAC systems are time-dependent and non-linear parameters [24]. Additionally, the temperature of each wall is different because of the absorption of direct solar radiation that enters through the windows [25]. The energy that is not absorbed by the walls is diffusely reflected and then absorbed by each indoor surface. Therefore, a steady case simulation does not reflect the complexity of the problem [26].
Conversely, under transient conditions, the tool considers fluctuations in the environment and the effect of energy absorption in the glazing and the interior walls. WFG’s main feature is the ability to absorb a significant part of solar radiation before entering the building and a portion of the reflected energy if it is not absorbed indoors [27]. The authors of this article have previously developed equations to consider multiple direct and diffuse reflections between glazing and other surfaces [28]. In the simulation tool tested in this research, the thermal performance of the glazing is determined by the absorptions of its layers, implementing the equations, and providing the user with the option to select steady-state or transient conditions.
The primary objective of this article is to validate a new building energy simulation tool against the outputs of the only commercial software currently available that includes Water Flow Glazing (WFG) as part of the building envelope and an HVAC system. Two cases have been tested: an isolated glass panel and a room composed of three opaque walls and a glass facade. The new proposed tool has two objectives. Firstly, the users can compare the performance of the WFG and evaluate its capabilities as a heating or cooling device, as well as its ability to absorb heat, similar to a traditional solar collector. Secondly, the new simulation tool can be used to validate the contribution of WFG as a facade in the whole thermal problem of a simple case study at early stages of the design process.

2. Materials and Methods

This section describes the proposed tool and its features, including the integration with IDA-ICE 5.0. First, it defines the thermal and spectral parameters that explain Water Flow Glazing. Second, it addresses the implementation of WFG as a part of the building envelope in IDA-ICE 5.0. The section concludes with the description of the tested WFG case studies, including an experimental prototype.

2.1. Description of Proposed Simulation Tool

The proposed tool for building designers includes an app, a software library for developers, and documented instructions for implementing Water Flow Glazing modules in existing software codes. The tool has several graphical interfaces. The first includes energy balance considerations for potential solar radiation for specific locations. The second allows the user to select the glazing’s spectral properties based on the different glass types and coatings. The third runs a thermal simulator of the selected WFG type considering its absorption and spectral properties. Finally, a thermal simulator of simplified rooms includes insulated opaque walls, roofs and floors, and WFG facades. Essential geometrical aspects and location are needed to determine the solar irradiance that the simulated building can manage depending on its location, and orientation. The tool considers a yearly energy simulation to assess the energy demand. To fulfill the energy requirements, the user can modify the project’s first draft with a very intuitive graphical user. Energy balance graphs are shown for the selected period: day, week, month, or year. Energy balance graphics are presented for specified time intervals, including daily, weekly, monthly, and yearly datasets. This interface allows users to select the amount of thermal mass to mitigate temperature fluctuations over the simulation period.
The second phase aims to select the glazing from a catalog. The tool determines the spectral properties of a specific Water Flow Glazing composition. Transmittance, reflectance, and absorptance can be presented as a function of the wavelength of solar radiation and the angle of incidence of solar beam radiation. The tool features four different WFG configurations. Nevertheless, the user can calculate the thermal performance for any configuration of water flow glazing, with the restriction of only one water chamber. After selecting the WFG panel, the user must simulate the thermal behavior of the isolated glazing by imposing boundary conditions, such as outdoor temperature, beam and diffuse solar irradiance, indoor temperature, and water inlet temperature into the WFG. These boundary conditions can be either steady or transient. If actual outdoor conditions are selected based on a specific location, the user can select the season or period of the simulation.
The tool includes an EnergyPlus weather file that enables users to select locations and types of incoming solar energy (direct or diffuse) [29]. The simplified building is defined by six surfaces—north, east, south, west, roof, and floor—characterized by their dimensions, thermal transmittance, g-factors, energy transmittances, photovoltaic potential, indoor conditions, and orientation. Users can generate various graphs, including potential solar energy in kWh, which shows the solar energy on the building envelope over a specific period with parametric curves for each facade. It also displays potential solar power in kW, representing the instantaneous solar power for the facades. The energy demand in kWh illustrates the required energy for maintaining indoor comfort, while the power demand in kW indicates the instantaneous power needed to maintain a comfortable temperature. Figure 1 shows the parametric curves of potential solar energy (kWh) absorbed and the impinging solar power (kW) on different surfaces (facades and roofs) in Madrid, Spain on 5 July, from the EnergyPlus Weather (EPW) file for Madrid [30].
The discussed modeling method introduces significant innovations compared to other Building Energy Simulation tools. A simple interface with limited options simplifies the user experience. It requires less time and expertise than sophisticated tools available in the market. Selecting the right component of the HVAC system at the early stages does not impact the final design of a building. This approach prevents the issues that may arise when the design is complete, yet the mechanical systems have not been considered. This innovation enables faster decision-making processes. However, one limitation is the lack of connections with other building systems, especially the ventilation strategies.

2.1.1. Spectral Problem of Water Flow Glazing

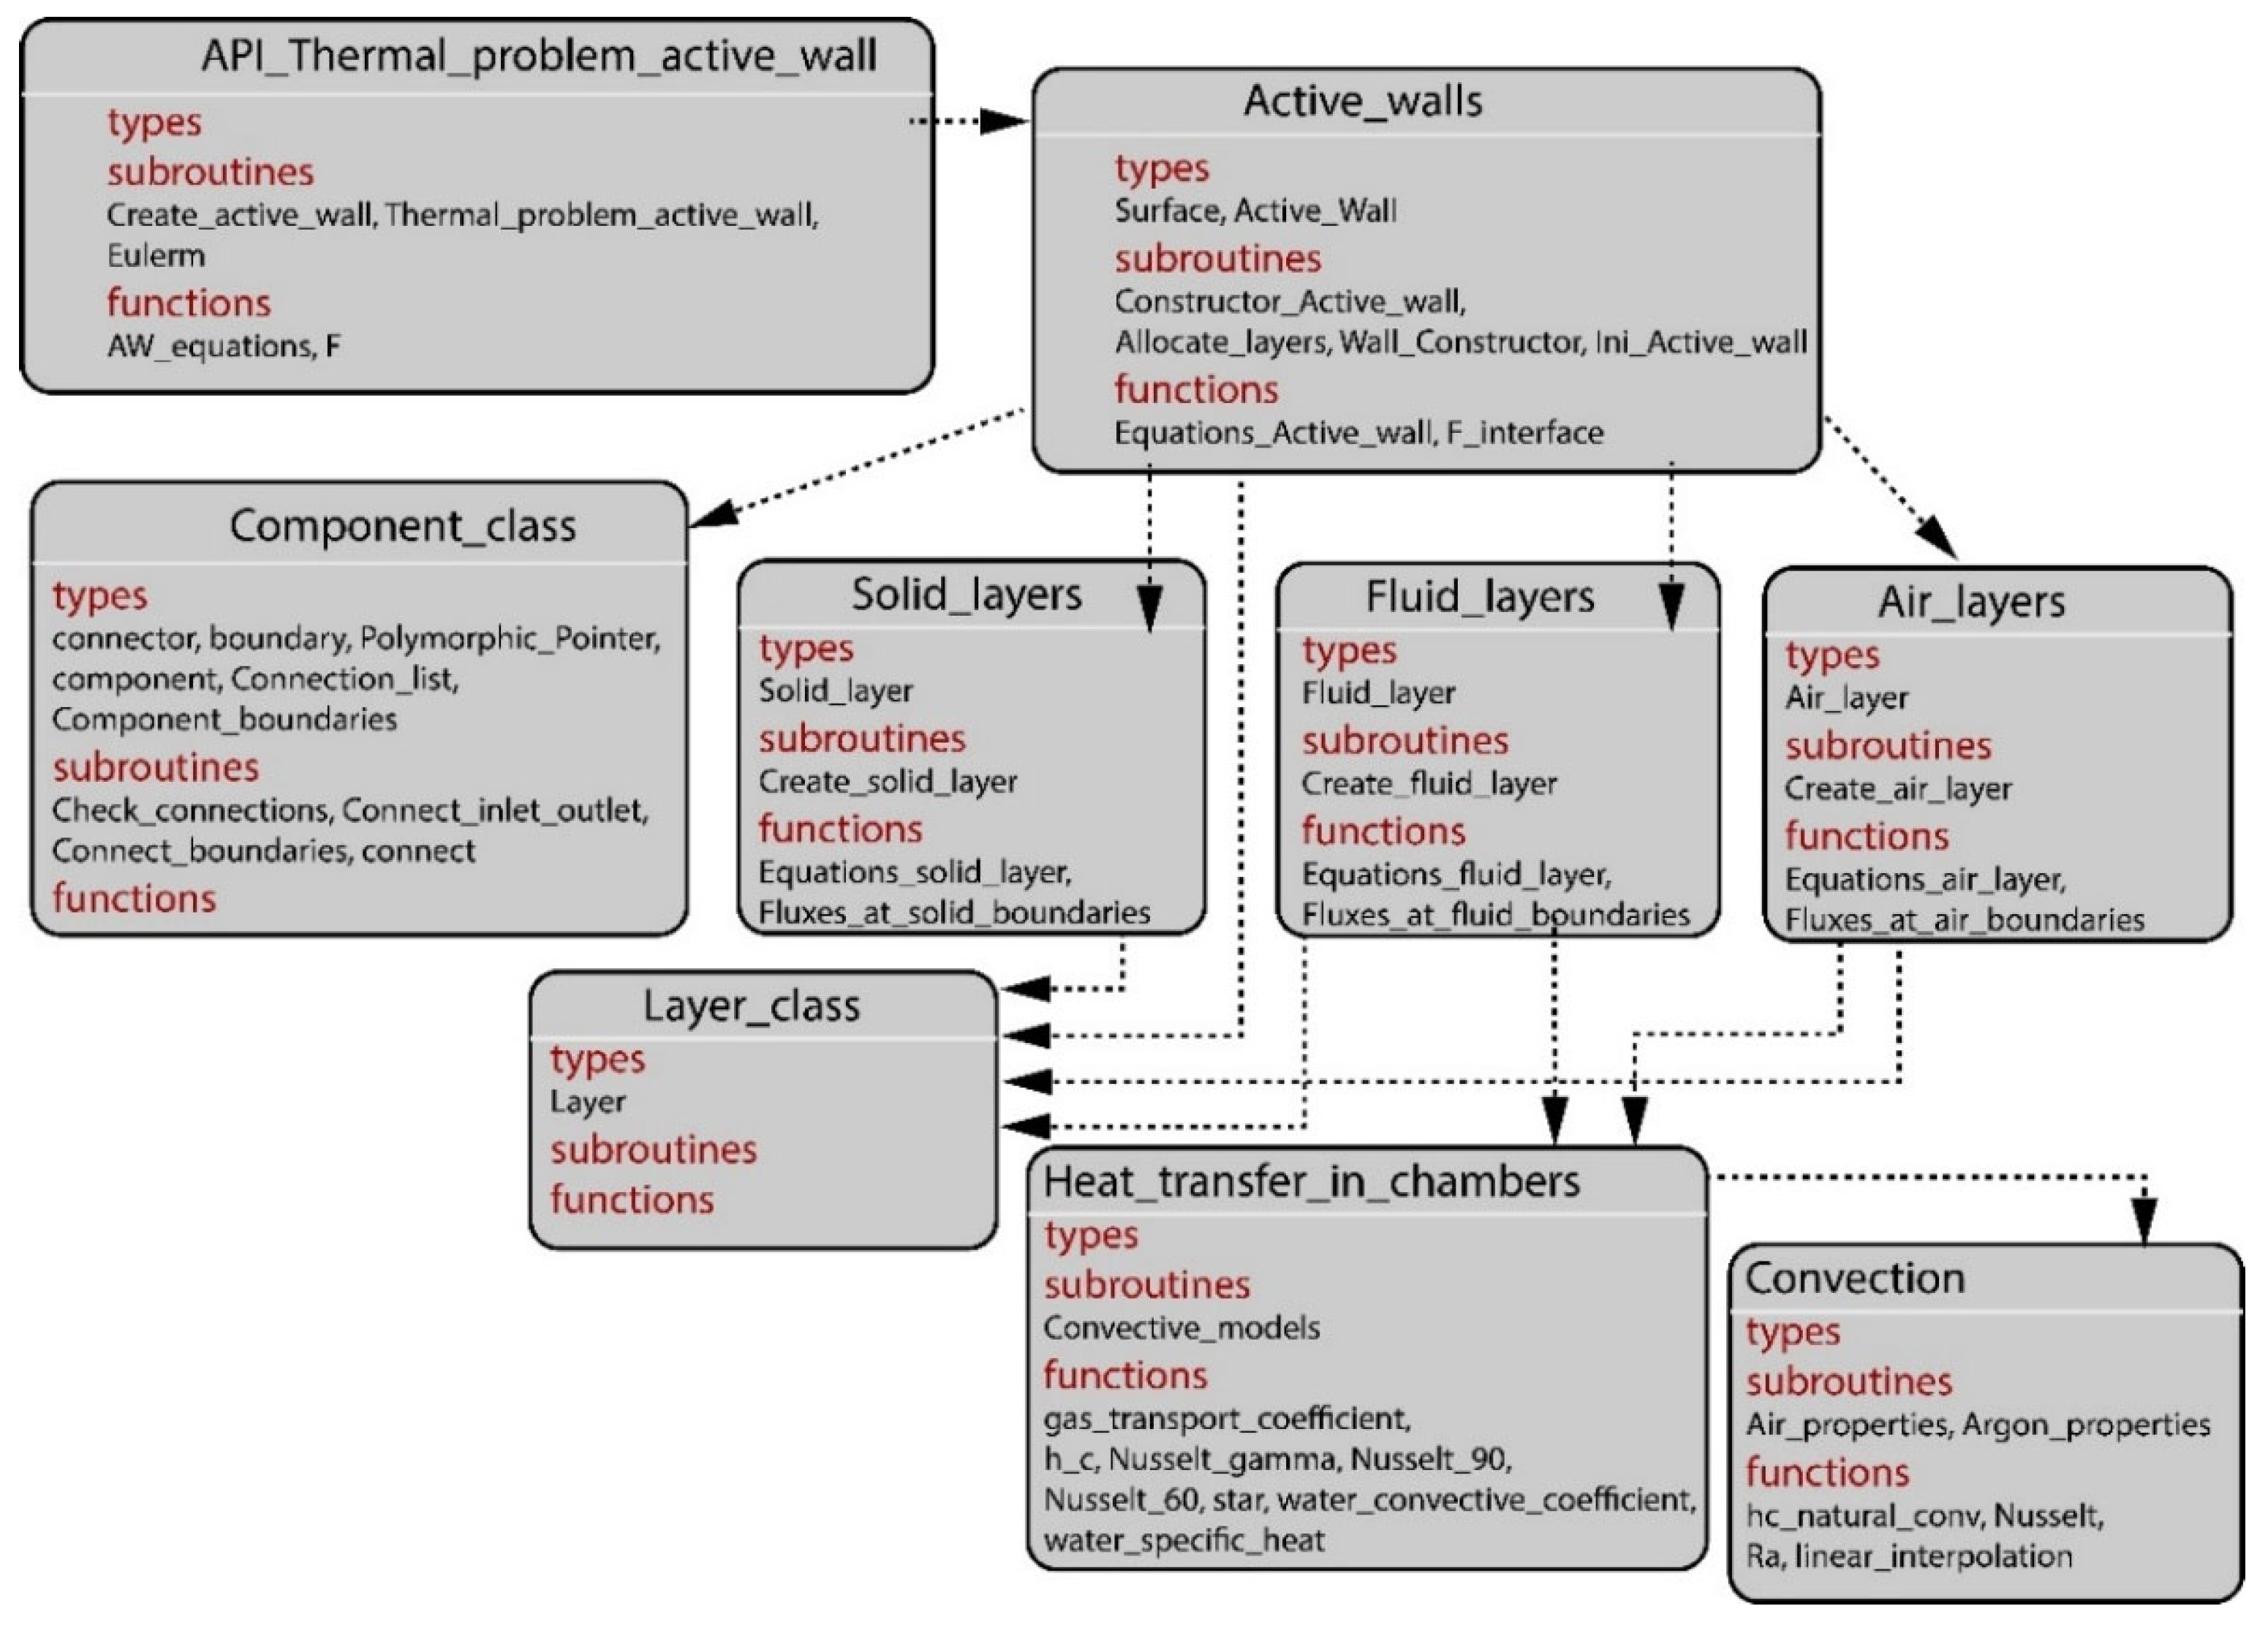
This spectral library provides public subroutines that enable users to solve the spectral problem associated with multilayer glazing. Figure 2 illustrates the structure of this Application Programming Interface (API), where the nodes represent software modules and the arrows indicate file dependencies between these modules.
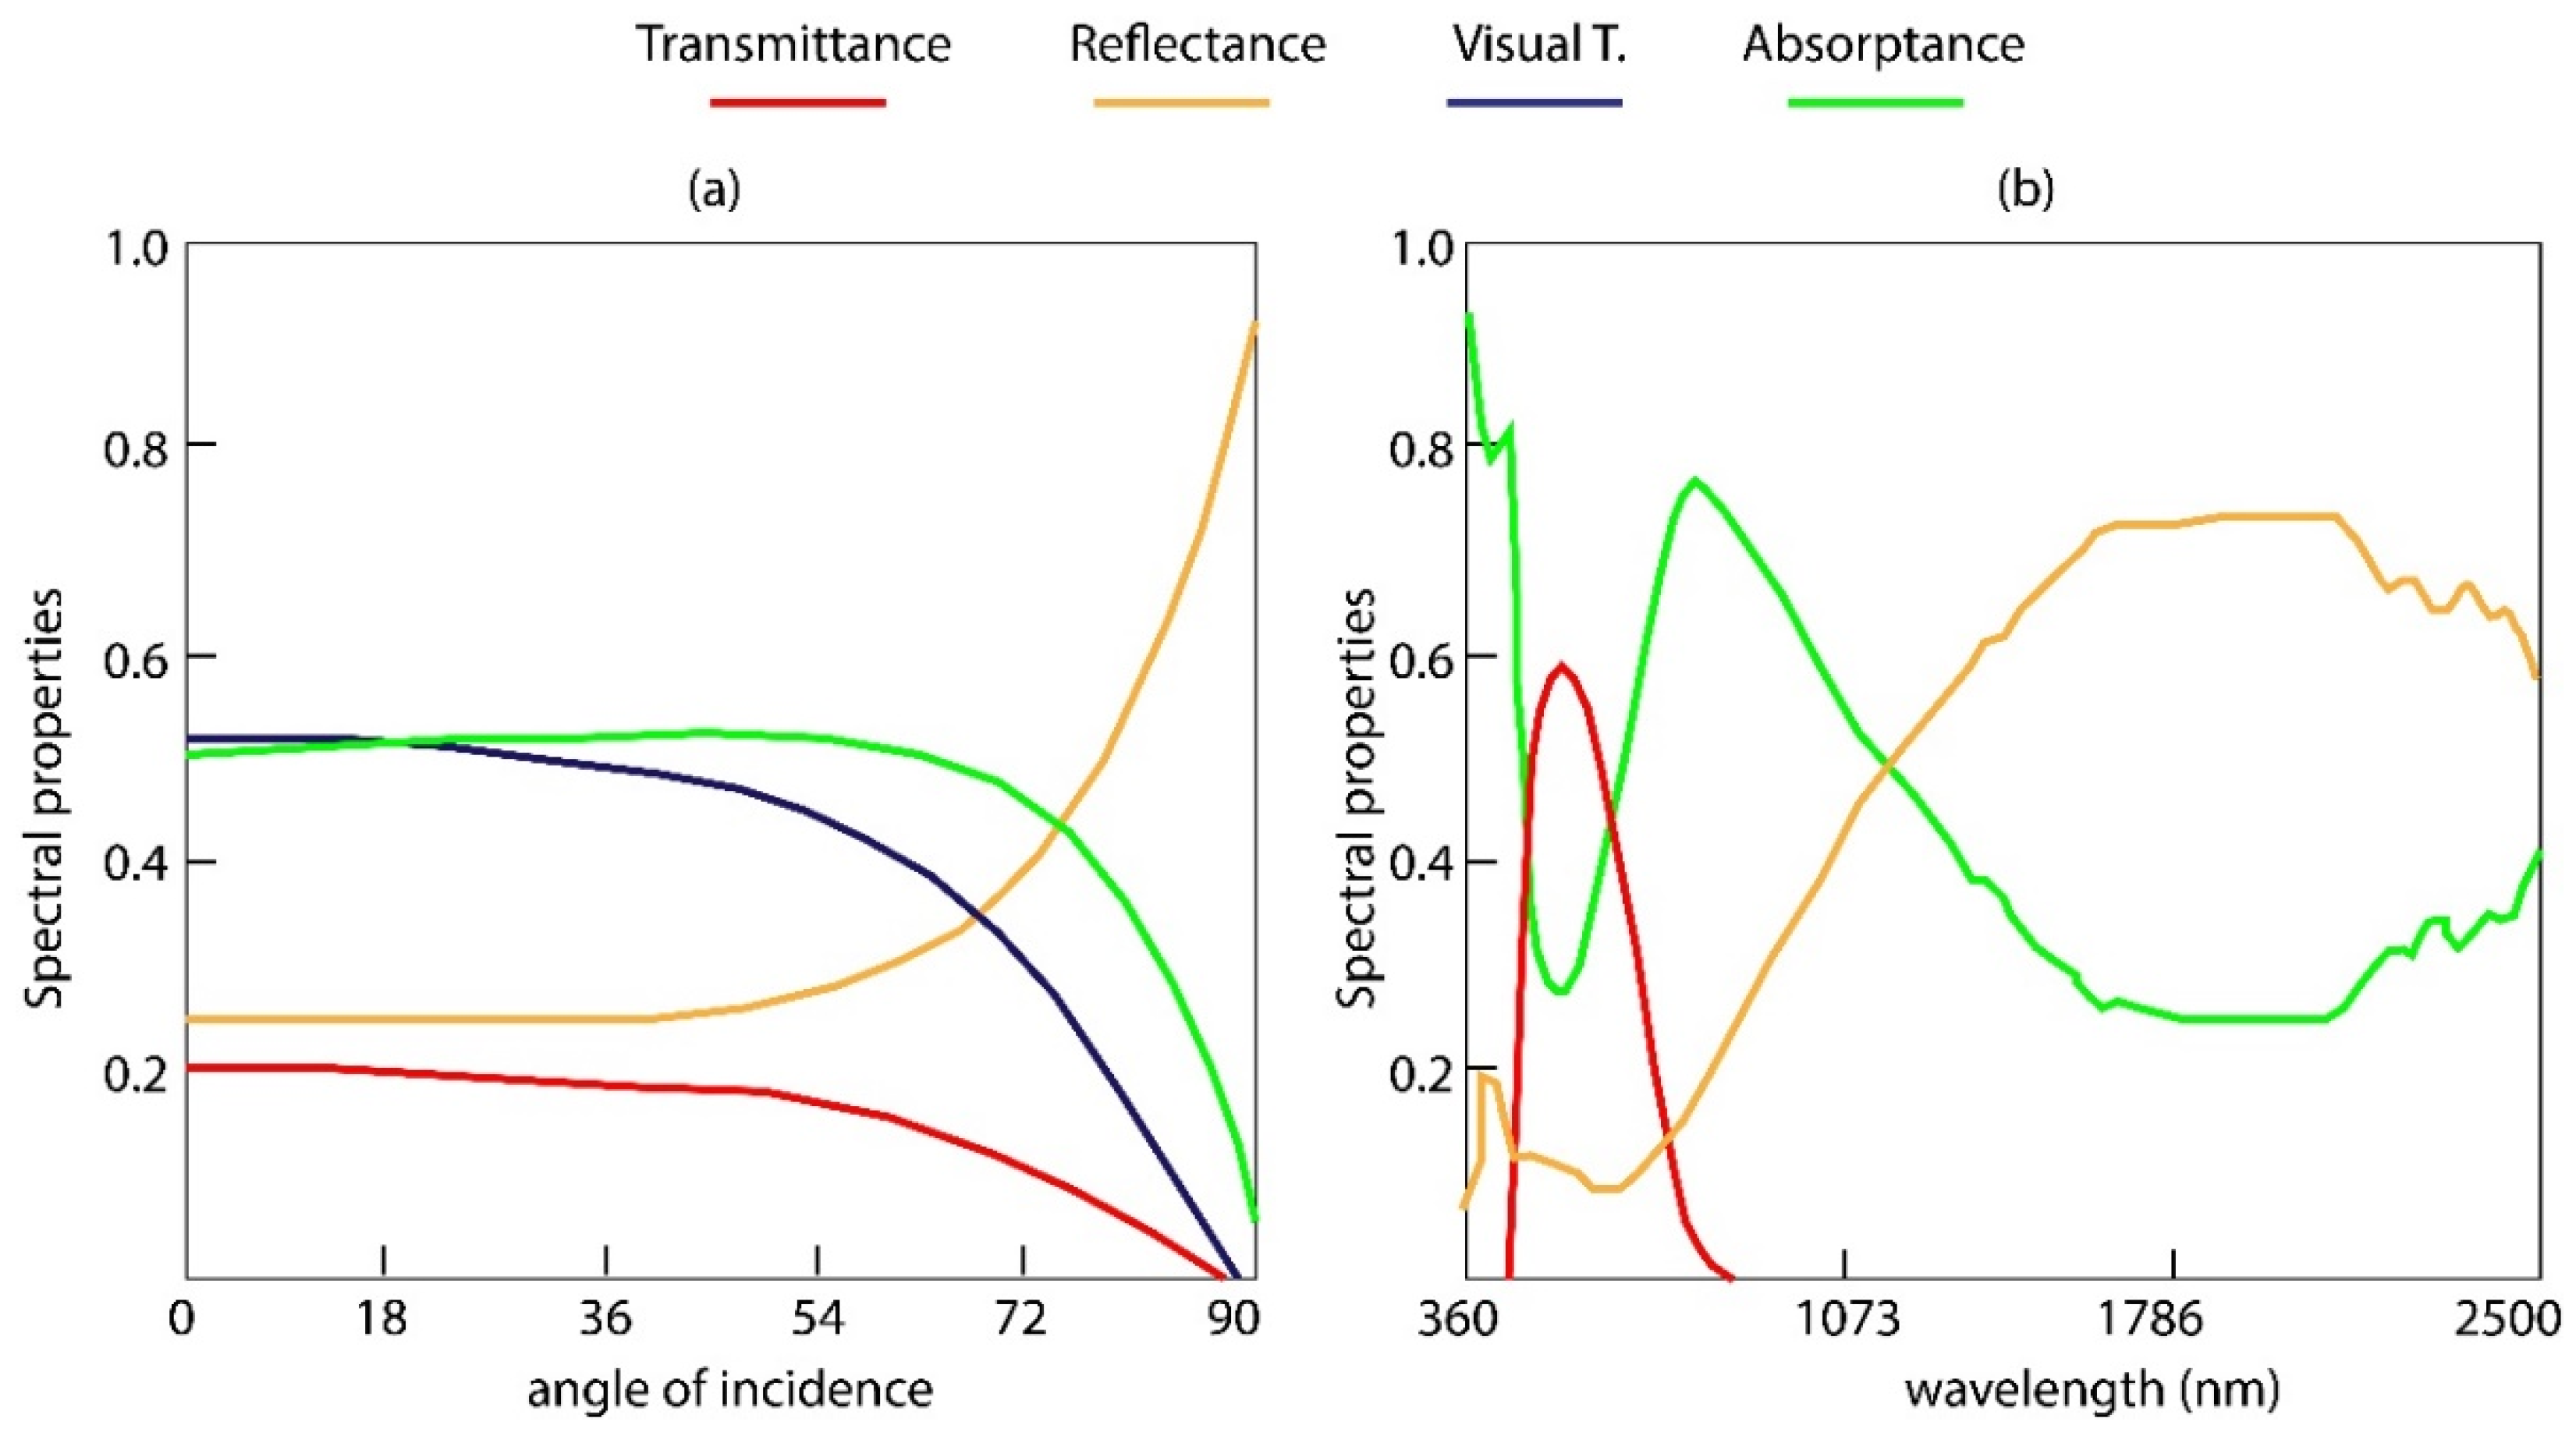
The “Coatings” section describes coating types and contains subroutines designed to compute the spectral properties of coatings. Two subroutines, “spectral_properties_coated_glass” and “properties,” are employed to demonstrate these spectral characteristics. In addition, the definition of the coating type is linked to the “Layers” module. Each coating consists of a glass substrate and a coated glass layer, both of which serve as distinct layers. The layer object contains functions pertinent to data management and retrieval from the International Glazing Database (IGDB) [31]. The “Spectral_Problem” module addresses the complexity associated with multiple reflections, deriving the spectral properties for the entire glazing assembly. Matrices and their associated operations are defined to facilitate the resolution of the differential equation. The “Interpolation” module generates values from discrete data points, enabling users to obtain spectral properties at specific angles of incidence that are interpolated from a limited set of discrete angles. Figure 3 shows an example taken from a WFG panel analyzed with the tool. It illustrates spectral and angular properties, such as Thermal and Visual Transmittance, Reflectance, and Absorptance, depending on wavelength and angle of incidence, respectively.

2.1.2. Thermal Problem of Water Flow Glazing

The thermal problem involves numerous parameters that need to be assessed. The tool offers two modeling approaches: a Simplified mathematical model and a Complete model. The Simplified model disregards the thermal mass of the various components and resolves a set of algebraic equations. In contrast, the Complete model acknowledges the thermal mass and considers each component as a partial differential equation, requiring greater computational effort. Despite the different approaches, temperature simulations from both models exhibit negligible differences, with only specific test cases revealing any substantial variations. This work focuses on formulating a simplified algebraic model to obtain the outlet temperature of the WFG panel, the temperature profile, and the heat flux in each layer. By doing so, the tool calculates the energy absorbed by the water chamber, enabling the analysis of its energy performance over the course of a year. The simplified model enables a shorter simulation time with a suitable level of precision. An experimental setup has also been constructed to generate measured data as a benchmark for comparing and validating the results derived from the proposed simplified model. The description of this problem contains various aspects, including the outdoor and indoor boundary conditions, and convective models.
The exterior boundary conditions can be set as “Constant BCs” or the “EnergyPlus weather file” of a specific location [32]. By default, interior boundary conditions are associated with the parameters of interior spaces. However, internal room parameters are not applicable when the “Isolated Glazing” option is selected. When the user selects a glazing system in an insulated room, it is necessary to specify thermal parameters such as room temperature, glazing type, absorption, mass, and U-value.
The tool allows users to choose between constant values or advanced models from ISO 15099:2003 [33] for calculating convective heat transfer coefficients, hi for interior and he for exterior. By default, the tool utilizes constant values, but these coefficients are computed more precisely when the ISO model is selected. The convective heat transfer dynamics within the fluid chambers are characterized by the coefficients hg for gas and hw for water. Similar to the previous coefficients, these can be treated as constant or obtained from more advanced modeling approaches. The ISO model is set as the default option for the gas chamber of the glazing (hg).
The Thermal Problem library utilizes the absorption data of each material, which have been previously computed using the tool’s spectral library. Figure 4 shows the general structure of the software library, where every node defines a software module, and every arrow represents the use of one module by another.
An “Active_wall” is a polymorphic layer that derives its properties from the object component, which includes inlet and outlet connectors with specific inlet and outlet temperatures and flow rates. In contrast, interface temperatures and heat flux values characterize the object boundaries. These components are conceptualized as one-dimensional open systems that facilitate the exchange of heat through their boundaries and engage in energy interchange between the inlet and outlet because of temperature differences. A “Connection_list” object is used to structure comprehensive energy circuits by integrating various components. The modules “Water_layers,” “Air_layers,” and “Glass_layers” establish new objects for formulating equations that assess the internal thermal behavior of each layer, along with boundary conditions to ensure that interface values align with those of adjacent layers. Additionally, these polymorphic layers inherit the features defined in the “Layer_class” module. The “Active_windows” module, used by the “API_Thermal_problem” module, builds the object “Active_Window” using the “Glass_layers” and “Air_layers” modules. This module contains methods and functions, such as “Constructor_Active_Window” and “Equation_Active_Window”, to simulate the thermal performance of WFG panels. These methods compile equations of every layer and resolve a non-linear system to determine the heat flux at the interfaces. The “API_Spectral_problem” calculates the absorption of each layer, which informs the thermal equations. “Layer_class” holds the typical spectral and thermal properties of a layer. “Air_layers” and “Water_layers” refer to fluids with a convection transfer mechanism calculated in the module “Heat_transfer_in_chambers.

2.1.3. Numerical Implementation of the Proposed Tool

When it comes to temporal discretization, the proposed tool uses the Euler method to approximate the solution of differential equations by dividing time into discrete intervals. The determination of the time step size is in accordance with EnergyPlus, which operates at a frequency of up to one hour. The simplified model of the proposed simulation tool can run at lower time steps. The selected time step for this research was 2 per hour, which indicates a simulation time step of 30 min. A complete model is also available. The subroutine resolves partial differential equations, considering solar absorptances in glass or water layers with significant thermal mass. To achieve the steady state, the problem iterates n = 100 time steps of dt = 300 s. As a result, the computational effort of this simulation is six times that of the simplified method. The spatial discretization determines the count of nodes across each material layer. The WFG layers are reduced to two nodes. This assumption presents the disadvantage of lacking meaningful temperature profiles within the glass layers. Nevertheless, this simplified method is considered valid because the characteristic thickness of the glass layers ranges from 4 to 10 mm, and the gas and water layers, from 12 to 24 mm. The advantage of this model lies in its reduction in processing time, while keeping a known level of precision.

2.2. Setting the Parameters of Water Flow Glazing in IDA-ICE

This section describes the model that defines the Water Flow Glazing behavior implemented in IDA-ICE. This professional software enables dynamic thermal simulation, evaluation of natural and artificial lighting, and simulation of systems by adding components. Moreover, it is a very productive tool because it imports BIM files with accurate geometries. IDA-ICE can be used to conduct energy studies and complete design, encompassing the envelope, HVAC, and control systems. IDA-ICE facilitates the development of software that adapts to local requirements and extends it with new modeling capabilities. To verify the correct installation of the new WFG module, the authors run a complete, isolated, and transient case study. A transient case requires a climate file and the .idm file, which is the design of the room. The EnergyPlus weather (EPW) file must be placed in the folder: C/Programfiles (X86)/IDA/climate. The next step was to start IDA-ICE .idm file, run the simulation, and open the “Output-File” to visualize the results [34].
To create a new glazing in the database, it is necessary to define a new type of window, a WinType object, and a Detwind model. Firstly, the user must create a new Building project; secondly, the new window can be edited and configured layer by layer. Both glazing types and panes can be loaded from the database; additionally, frame options and the frame-to-window ratio can be selected. After creating and saving a new window in the database, the user must create a simulation model by selecting the simulation tab and the “Build model” button. The new WinType model will be displayed in “Window types,” and the new Detwind in the “Zone” interface. Table 1 defines parameters and variables listed in the software tool. There is a distinction between inputs, outputs and local variables. The user must select some features of the WFG (S_P) whereas other parameters are computed (C_P). The spectral and thermal properties of the Water Flow Glazing can be found in a text file with a “.plt” extension, located in the “materials” drop-down menu.
The azimuth and sun elevation are inputs provided by the weather file. The relative position of the window (orientation and slope) depends on the architectural design interface. Finally, the surface temperature of the water flow glazing is calculated using a convective model. Certain boundary conditions, such as the exterior solar irradiance, the water flow rate, and the inlet temperature, are essential parameters for simulating the thermal change of WFG panels. After solving the thermal problem, the software outputs are the transmitted energy and the outlet temperature of the water.

2.3. Description of Water Flow Glazing Types

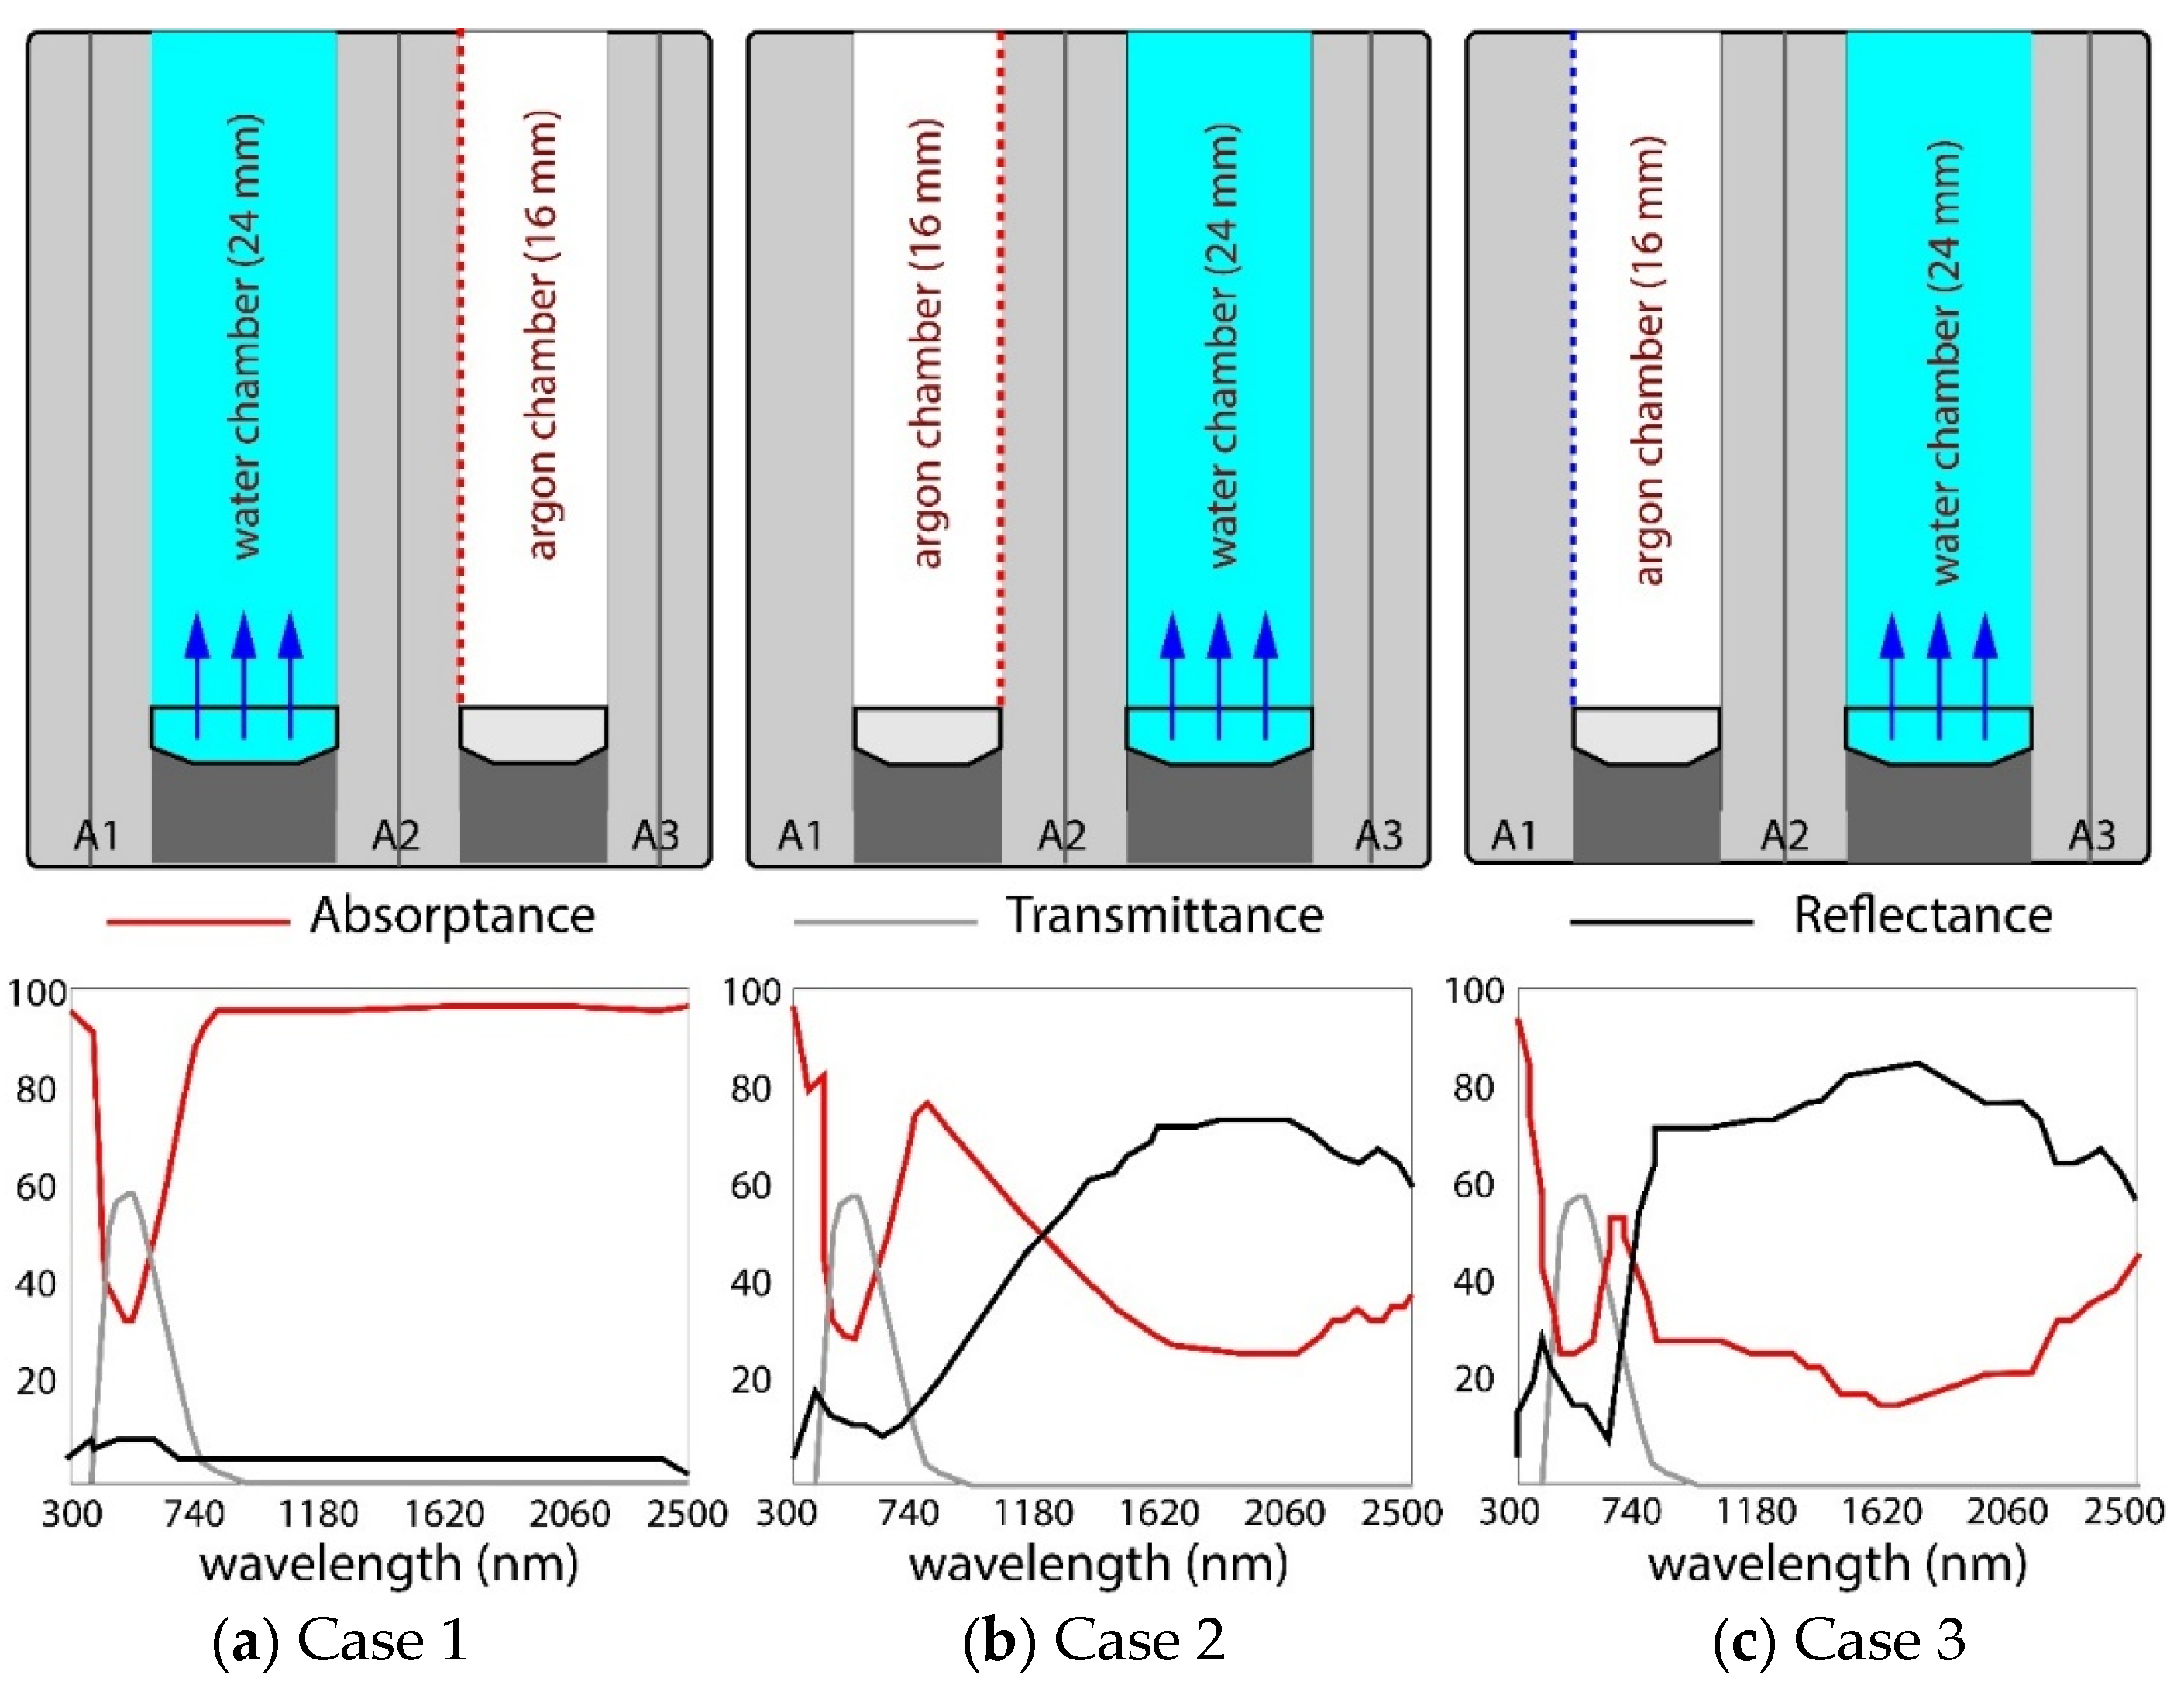
All case studies feature triple glazing, which combines three single glass panes, laminated glass with a polyvinyl butyral (PVB) interlayer, a 16mm argon chamber, a 24 mm fluid chamber, low-emissivity (Low-E) coatings, and high-selective solar coatings. Figure 5 illustrates the three WFG cases tested. It shows the types of glass and coatings used in the glazing, along with the spectral properties as a function of the wavelength in nm from the studied tool.
The parameters that impact the heat flux through any glazing are the temperature difference between indoors and outdoors (θeθi) and both diffuse and direct solar irradiance, denoted as i0. The heat flow through WFG panels is illustrated in Equation (1), which is valid under steady conditions, assuming that the thermal resistance of the glass panes and the water is negligible, and the water flow is uniform. The authors of this research have previously published a solution to this problem and explained the following assumptions [35]. The model considers conduction, convection, and Far InfraRed radiation (FIR) as heat transfer mechanisms. It is assumed that the temperature at the inlet remains constant. The convective heat transfer within the cavity is directly related to the temperature difference between the parallel glass panes, multiplied by a constant heat transfer coefficient, hg. The thermal mass of the air chamber is considered negligible, and heat exchange due to radiation and convection can be assumed to be proportional to the temperature difference multiplied by a convective coefficient, hg. Finally, the thermal resistance of a glass pane is calculated as its thickness divided by its conductivity.
q = U θ e θ i + U w θ I N θ i + g i 0 ,
where θIN is the inlet temperature of the fluid into the WFG system, θe is the outdoor temperature, θi is the indoor temperature, Uw is the thermal transmittance between the water chamber and the interior, and U is the thermal transmittance of the glazing. Equations (2) and (3) show the expressions of Uw and U, respectively, as presented in previous articles [35].
U = U i   U e m ˙ c + U e + U i ,
U w = U i   m ˙ c m ˙ c + U e + U i ,
where ṁc is the heat capacity of the fluid, Ui, Ue are thermal transmittances derived from the heat coefficients he, hi, hg, hw. Water flow glazing can alter the thermal performance by modifying the mass flow rate per unit area, , considered uniform inside the glass pane. Therefore, the expression of the g-factor shown in Equation (4) is affected by the variation in ṁ. Aw is the water absorptance, whereas A1, A2, A3 are the glass panes absorptances. Ai is a secondary internal heat transfer factor and T, the energy transmittance [36].
g = U i   m ˙ c + U e + U i A 1 U e h e + A 2 1 h g + 1 h e U e + A 3 U e h i + A w + A i + T .

2.4. Description of Experimental Prototype

Focused on evaluating the thermal performance of water flow glazing in comparison with software tools, a scaled prototype was built and tested in Madrid, Spain. The prototype’s dimensions are 100 cm in height, 100 cm in width, and 75 cm in depth. A Peltier unit connected to a buffer tank regulates the temperature of the water inlet. The prototype consists of a steel structure with roofs, floors, and opaque walls. A white aluminum sandwich panel incorporating 100mm of extruded polystyrene was placed as the opaque envelope. For the transparent south facade, a Water Flow Glazing panel, as defined in Case 3, was selected. Figure 6 depicts the dimensions and a view of the built prototype, along with its main components.

3. Results

The goal of this section is to outline various test cases that facilitate the comparison of numerical simulations with the proposed tool and to assess and compare the thermal characteristics of different glazing types.

3.1. Results from Studied Tool

This section presents the outputs yielded by the studied tool, focusing on the thermal and spectral parameters of different WFG panels. The tool allows users to generate steady-state and transient reports. The steady-state analysis provides a preliminary assessment of the efficiency of each Water Flow Glazing (WFG) panel, considering both indoor and outdoor temperatures, as well as solar irradiance. After selecting the optimal WFG based on the steady-state analysis, researchers can conduct a transient study to assess the seasonal performance of the panel.

3.1.1. Spectral Results of the WFG Case Studies

Table 2 shows a description of the thermal and spectral parameters from the studied tool, considering three cases described in Section 2.3. The table compares the glass panes and water absorptances (A1, A2, A3, Aw, total absorptance of water flow glazing (Av), interior thermal transmittance (Ui), exterior thermal transmittance (Ue), thermal transmittance of triple glazing (U), thermal transmittance from water chamber to interior (Uw), and energy transmittance (T). The thermal parameters depend on the mass flow rate. When the flow rate is zero, the thermal transmittance, U, depends on the gas chamber [37]. However, at the design flow rate (0.028 kg/(s m2), U was almost zero. The first case features a WFG panel with an exterior water chamber and a low-emissivity coating on face 4. At the operating , the g-factor became 0.22, Uw is 0.977 W/(m2 K), and the U is 0.128 W/(m2 K). The second case has an indoor water chamber with a low-emissivity coating applied to face 3. The U-value is 0.066 W/(m2 K), and the variable g-factor is 0.24 when fluid is flowing through the window. The third case has a solar control coating in face 2. It yields a U-value of 0.063 W/(m2 K). The g-value is 0.22. The energy transmittance, T, ranges from 0.20 in Case 1 to 0.21 in Cases 2 and 3.

3.1.2. Thermal Results

The thermal problem associated with WFG panels can be effectively separated from the thermal interactions within the other system components. The resolution of the thermal problem may show non-steady behaviors influenced by variable climatic conditions and the thermal mass of each layer. In scenarios where boundary conditions remain constant, the steady-state solutions become independent of the thermal mass and specific heat of the components involved. Thus, utilizing test cases predicated on steady boundary conditions is an optimal initial approach for validating thermal models [38].
In the context of system operation, the flow rate is calibrated to a design rate of 2 L per minute per square meter. At the same time, the inlet temperature (θINLET) is maintained at a fixed value, whereas the outlet temperature (θOUTLET) depends on the water’s ability to absorb energy. Equation (5) shows the output derived from these experimental conditions containing the water heat gain (WHG) absorbed by the mass flow rate () depending on the fluid specific heat (c) and the water heat gain (θOUTLETθINLET). The latter is quantitatively defined as the sum of the absorbed beam solar irradiance (TIb) and the indoor heat flux (qi), in addition to the heating or cooling power involved in the thermal dynamics of the system. Water heat gain (WHG) is measured in watts.
W H G = m ˙ c θ O U T L E T θ I N L E T .
Equation (6) shows the expression for the outdoor heat flux.
q e   = h e   θ n e θ s e ,
where the outdoor convective coefficient, he can be considered a constant or can be calculated using more accurate models. The surface temperature of the outer glass pane, θse, and the outdoor temperature, θne, are essential variables in this framework. The latter can either be a constant value or reflect the actual environmental conditions, incorporating factors such as heat contributions from adjacent radiating structures, ground surfaces, or atmospheric influences [39]. Furthermore, to adequately establish the outdoor boundary conditions, it is imperative to incorporate parameters such as beam and diffuse solar irradiances, and the incidence angle of solar radiation. In terms of indoor boundary conditions, Equation (7) expresses the indoor heat flux.
q i   = h i   θ s i θ n i ,
where hi represents the indoor convective coefficient. The environmental indoor temperature, θni, can be a constant value or it can be calculated by the tool. Finally, θsi is the surface temperature of the inner glass pane. To establish the indoor boundary conditions, it is necessary to provide or calculate both beam and diffuse solar irradiance.
Newton’s law explains the heat transfer through gas chambers. Equation (8) shows the heat flux in a gas between parallel solid materials, whose temperatures are θ1 and θ2 respectively, and hg is the heat transfer coefficient of gas chambers that considers the natural convective effect and the radiative heat transfer [40]. As stated previously, this coefficient may be represented as a constant or derived through calculations that incorporate the emissivity of the glass surfaces and convective transport mechanisms.
q g   = h g   θ 1 θ 2 .
The heat flux in the water chamber is directly proportional to the temperature gradient between the water (θw) and the surfaces of the glass panes (θ1 and θ2). This coefficient effectively captures the heat transport mechanism driven by the convective flow of water within the chamber. Given that water absorbs infrared radiation, the heat transfer due to radiation is notably absent in this environment. Equations (9) and (10) illustrate the heat flux across the two glass panes.
q 1   = h w   θ 1 θ w ,
q 2   = h w   θ w θ 2 ,
where hw is the heat transfer coefficient for the water chamber.
The simulation includes three different scenarios involving Water Flow Glazing (WFG) panels. The first scenario examines an isolated WFG panel, in which steady-state boundary conditions are assessed. The second scenario considers the same panel under transient boundary conditions. Finally, the third one assesses the integration of the WFG panel into the facade of a square room characterized by insulated walls, roof, and floor. Exterior boundary conditions (outdoor temperature and solar irradiance) are determined by the EPW file described in the Materials and Methods Section. The opaque enclosure and the transparent WFG facade define indoor boundary conditions. The opaque envelope features include orientation of the simulated prototype, indoor mass and thermal inertia, the thermal transmittance, the interior convective coefficient, and the absorption coefficients (αNIR and αFIR) of the indoor surfaces. The boundary conditions in the transparent WFG panel include interior and exterior convective coefficients, as well as the transmittance and absorptance of each WFG component (glass, water, and gas chamber).
Figure 7 shows that the water inlet temperature (θINLET) remains constant across all tested cases, set at 17 °C for the summer season and 21 °C for winter, whereas the outlet temperature (θOUTLET) is an output. In the steady-state configuration of the WFG panel, both indoor and outdoor temperatures (θi and θe) are prescribed as fixed values. At the same time, the solar irradiance (I) is held constant and oriented perpendicularly to the panel. In the transient scenarios of the WFG panel, only the interior temperature is held steady; the exterior temperature and solar irradiance are given by a weather file representing real-world conditions. The performance of an insulated room is evaluated, using the same weather file to provide the outdoor temperature. The resultant indoor temperature is determined through thermal simulation utilizing the method described in previous articles published by the authors of this research [28].

3.2. Water Flow Glazing Panel

The simulation of a simple isolated glazing can demonstrate the accuracy of the proposed tool in addressing the thermal behavior of Water Flow Glazing panels (scenarios (a) and (b) of Figure 6). The first subsection describes the simulation of steady-state conditions of three different case studies, setting indoor and outdoor temperatures and solar irradiance. The following subsection encompasses a transient-state simulation using the EnergyPlus Weather (EPW) file for Madrid, Spain. The goal is to provide users with a quick method for evaluating optimal glazing options corresponding to various orientations. In the context of net-zero and positive-energy buildings, WFG can be a viable strategy for reducing thermal heat gains in buildings and generating renewable energy [41,42].

3.2.1. WFG Panel: Steady State

For this analysis, the interior temperature is a fixed parameter, while the diffuse irradiance is not considered, simplifying the problem’s complexity. This approach effectively replicates the imposition of indoor boundary conditions for the isolated glazing system. Furthermore, two distinct test cases are studied: one involving steady boundary conditions and the other addressing transient boundary conditions. This series of test cases operates under the premise of a normal angle of incidence, thereby minimizing uncertainties related to the absorptance dependency of each layer on varying incidence angles. The mass flow rate is set at 0.028 kg/(s m2) and the fluid specific heat is 3600 J/(Kg°C) Two distinct steady states are analyzed: winter and summer. Table 3 illustrates the winter and summer boundary conditions. Convection coefficients are constant over the year. Indoor and outdoor temperatures, inlet temperature of the water chamber, as well as beam solar irradiance, Ib, are considered constant, although their values vary over the seasons. The diffuse solar irradiance, Id, is neglected.
Table 4 shows water heat gain, WHG, transmitted solar beam radiation, TIb, the room thermal heat gain, qi, and the inlet and outlet temperature, θINLET and θOUTLET, of the water in both winter and summer conditions for different glazing types in a steady state.
When evaluating water heat gain in winter, Case 2 shows the highest heat gain in winter, compared to the other alternatives. Its water heat gain is ten times greater than that of Case 1. On the other hand, Case 1 shows a water heat gain of 556.1 W/(m2) in the summer, which is more significant than the 413.3 W/(m2) recorded in Case 2 and 127.2 W/(m2) in Case 3. A high heating capacity, qi, might be convenient in winter for reducing the heating load. Data presented in the table indicate that when it comes to the internal heat gain in winter qi, Case 2 shows a value twice that of Case 1. In summer, cooling capacity could be a criterion to select the best glazing option. Case 3 is the optimal glazing, showing a similar performance to Case 2. However, to reach this cooling load, Case 3 must dissipate 127 W/(m2), whereas Case 2 has to dissipate 413 W/(m2). Therefore, Case 2 needs more than twice the power of Case 3 to obtain a similar cooling capacity. Cases 2 and 3 are selected to perform a transient state analysis, which requires more computational power.

3.2.2. WFG Panel: Transient State

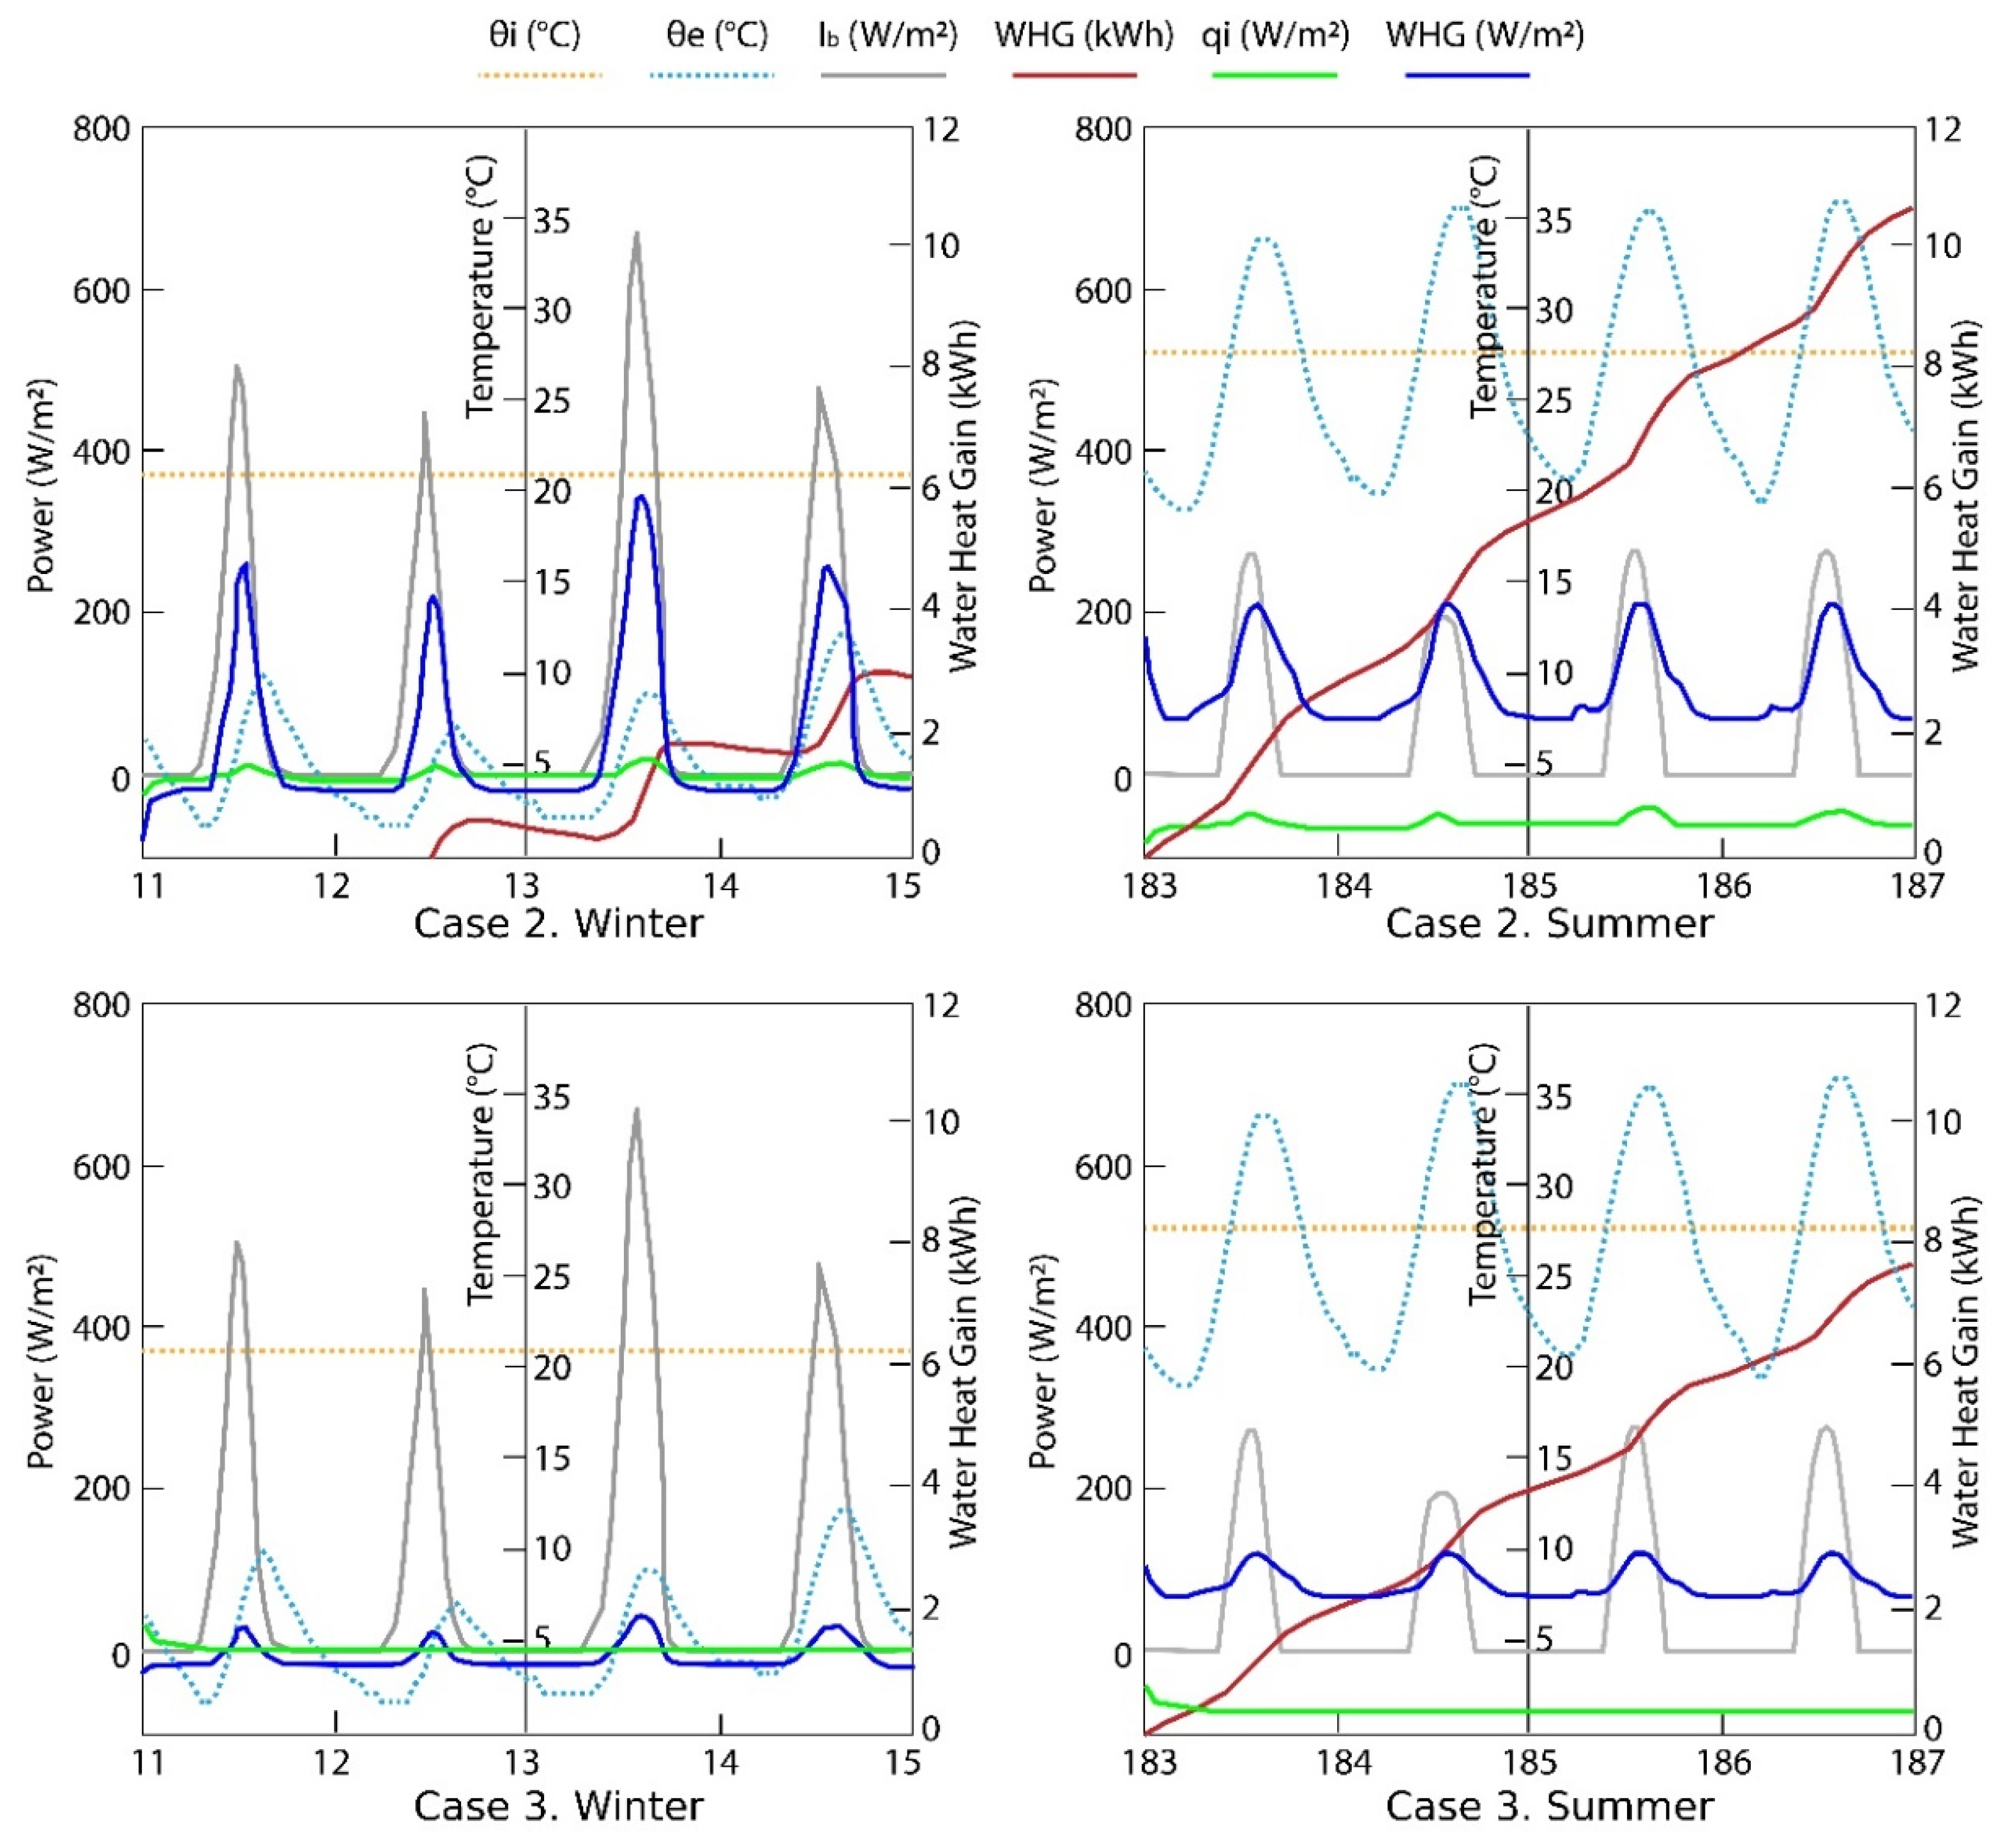
Transient behavior in thermal dynamics is observed when outdoor temperature and solar irradiance fluctuate throughout the day. In subsequent test cases, the thermal parameters are time-dependent, and the indoor temperature is established as constant. The transport coefficients are maintained at constant values to mitigate uncertainties in the validation process. The case studies described in this research are placed in Madrid, Spain. The EPW file was downloaded from the EnergyPlus website. The water flow rate and the inlet temperature are set as constant values, as detailed in Table 3. The winter simulation is conducted over the period from 12 January to 16 January, while the summer simulation spans from 3 July to 7 July. Figure 8 shows the performance of Case 2 and Case 3 WFG panels in winter and summer conditions. Indoor temperatures are set at 21 °C in winter and 27 °C in summer. In winter, outdoor temperatures fluctuate between 2 °C and 12 °C, while in summer they range from 19 °C to 35 °C. Solar irradiance on the WFG panel reaches a peak of 600 W/m2 in winter and 270 W/m2 in summer. Analyzing the results from Case 2, the daily absorbed energy per unit of area over the summer days is approximately 2.6 kWh per day, in contrast to a significantly lower absorption of around 0.75 kWh in winter. When considering the room thermal heat gain, qi, the results align with the predictions of the steady-state analysis. Heat gains are observed in winter through the Water Flow Glazing facade. Conversely, in summer, the water circulating through the glazing at a temperature below the comfortable indoor temperature facilitates heat removal from the interior environment.
In Case 3, boundary conditions are the same as in Case 2. The application of a reflective coating results in higher near-infrared (NIR) reflectance, leading to a reduction in Water Heat Gain compared to Case 2. As predicted by the steady-state simulation, the room thermal heat gain, qi, yields negative values, which indicates that heat is extracted from the indoor environment. Nevertheless, the energy absorbed by the water flow is 25% less than that of Case 2. In Case 3, it is expected that the daily absorbed energy per unit of area is not relevant in winter. However, over the summer days, it is approximately 2 kWh per day.

3.3. Water Flow Glazing Facade in an Insulated Room: Transient State

The problem becomes more challenging when an insulated room with a Water Flow Glazing facade is considered. The authors of this article have conducted extensive research on long-wave solutions, short-wave solutions, solar energy distribution, the reflection of solar beam radiation, and the diffuse radiation transmitted through the glazing. In addition, there are two kinds of reflections: direct ones occurring between the glazing and parallel surfaces, and indirect reflections among the glazing, parallel, and perpendicular surfaces. The simulation models are taken from previous research [28,35]. To simplify this test case, a square room with a south-facing glazing is considered. The dimensions of the room are specified as follows: a height of 3 m, a length of 7 m, and a width of 7 m. The near and far infrared absorption coefficients are assumed to be uniform across all interior walls, with αNIR set at 0.4 and αFIR at 0.9. The thermal transmittance of the opaque wall has been established at zero for this analysis. Two factors affect the thermal performance of the WFG facade: the interior temperature, which depends on the opaque envelope’s thermal insulation, and the absorbed back irradiance. Therefore, the water heat gain can be significantly different from that of isolated glazing described in Section 3.2.2.
Figure 9 illustrates the performance of WFG panels as a facade in the insulated room. The outdoor temperature ranges from 2 °C to 12 °C in winter and from 20 °C to 36 °C in summer. The indoor temperature, derived as an outcome of the simulation, exhibits oscillations ranging from 16 °C to 24 °C during the winter months and from 18 °C to 22 °C throughout the summer. The total accumulated energy over four summer days amounts to 7 kWh in Case 2. This value is significantly lower than the energy accumulated in the isolated WFG panel under transient conditions. The difference can be attributed to the indoor temperature setting of 28 °C in the isolated panel test, in contrast to the fluctuating indoor temperatures observed in the room simulation, which range from 18 °C to 22 °C.
In Case 3 under winter conditions, with the exterior temperature consistently below 5 °C, the interior temperature is maintained within a comfortable range because the WFG inlet temperature is set at 21 °C. However, there is no accumulated energy over 4 days in winter due to thermal losses occurring to the outdoor environment during nighttime hours. In Case 3, the accumulated energy during summer days is reduced compared to Case 2 due to a solar control coating in face 2. This coating prevents a significant portion of incoming solar radiation from being transferred to the flowing water.

4. Discussion

This section compares the results from the studied tool with those of the software IDA-ICE 5.0. The focus of the analysis is an insulated room with a Water Flow Glazing facade, which is analyzed under both steady-state and transient weather conditions. For the steady-state analysis, the outdoor temperatures are set at 35 °C in summer and 0 °C in winter, respectively. The indoor temperatures are maintained at 28 °C in summer and 21 °C in winter. Finally, the inlet temperature of the water flow glazing panel is set at 17 °C in summer and 21 °C in winter. For the transient analysis, the standard EnergyPlus Weather (EPW) file for Madrid defines the outdoor temperatures and solar irradiance, while the simulation tools determine the indoor temperature. The WFG panel is the only heating and cooling device used in the room. The test cases that were examined with the tool in the previous section are replicated in IDA-ICE 5.0.

4.1. Water Flow Glazing Facade in an Insulated Room: Steady State

When boundary conditions remain constant, the resulting solution becomes steady and uniform once equilibrium is achieved. These simulations consider normal incidence conditions to mitigate uncertainties arising from the angle-dependent absorptance characteristics of various layers. Two distinct steady-state scenarios are examined: winter and summer. For the water flow glazing, Table 2 and Table 3 show the values used in these simulations. In addition, each interior surface has a different temperature because of the varying intensity of direct sunlight. Since the WFG faces south and the solar beam is perpendicular to the glazing, the north facade is illuminated. The interior wall absorbs a portion of this incident solar energy, while the remainder is diffusely reflected. Later, this irradiance is absorbed by each indoor surface. Hence, in this test case, the water flow glazing absorbs additional energy from indoor irradiance. Table 5 and Table 6 outline the outputs from a winter and summer analysis of the room described in Section 3.3: water heat gain (WHG), the transmitted solar beam radiation (TIb), the room thermal heat gain (qi), and the water inlet and outlet temperature (θINLET and θOUTLET). The solar beam radiation remains constant and perpendicular to the glazing, while diffuse radiation is not considered in the three test cases.
Analyzing the results from Table 5 and focusing attention on the water outlet temperature (θOUTLET) and the Water Heat Gain (WHG), the values are consistent with those shown in the analysis of the isolated WFG panel under steady conditions, calculated using the analyzed tool in Table 4. Case 2 has the highest water heat gain, at 335.6 W/m2. This value exceeds the 227.4 W/m2 recorded for the isolated WFG panel (as mentioned in Table 4) due to the reflected radiation from the room walls and its subsequent absorption by the flowing water. Comparing the results from the tool and IDA-ICE, they are similar in both Water Heat Gain and water outlet temperature, showing an average deviation of 2.7% across all results.
The summer conditions from Table 6 exhibit consistency regarding the water outlet temperature (θOUTLET) and Water Heat Gain (WHG). Case 1 has the highest water heat gain, at 697.1 W/m2, surpassing the 556 W/m2 registered for the isolated WFG panel (as mentioned in Table 4). Comparing the results from the tool and IDA-ICE, they are similar in both Water Heat Gain and water outlet temperature, suggesting the reliability of the methods employed.

4.2. Water Flow Glazing Facade in an Insulated Room: Transient-State Cases 2 and 3

This section compares the simulation results from the studied tool and IDA-ICE, with a focus on Cases 2 and 3 under summer conditions. Outdoor temperatures fluctuated between 19.6 °C and 36 °C, while the inlet water running through the WFG at 17 °C helped maintain a comfortable indoor temperature over the simulation period. Figure 10 displays the outputs from the investigated tools in terms of indoor temperature and Water Heat Gain, expressed in W/m2. Although there was a clear difference in the slope of their graphical outputs, both simulation tools demonstrated analogous trends and peak Water Heat Gain values. The results indicate that the Water Heat Gain values are closely aligned, and the indoor temperature ranges between 17 °C and 22 °C in both cases.
This study employs a cross-validation method, in which a previously validated software is used to assess other tools, facilitating a comparative analysis of results obtained from multiple software tools [43]. The deviations were evaluated utilizing hourly data for indoor temperature and Water Heat Gain over four days in summer. The authors employed graphical validation by plotting measured data and simulated results to illustrate their temporal changes. The selected method in this study was the Weather-Day-Type 24-Hour Profile Plots described in ASHRAE Guideline 14, Appendix C [44]. Acceptable calibration has been declared when models match to within ±20% for a minimum of 20 out of 24 h for each day type [44]. While graphical methods help facilitate this process, the definitive evaluation of acceptable calibration will ultimately be conducted through statistical analysis.
Equation (11) defines the Root Mean Square Error (RMSE) and Equation (12), the Normalized Root Mean Square Error (NRMSE). Both expressions utilize the value from IDA-ICE as a reference normalization metric [45,46].
R M S E = i = 1 n S S i A R i 2 n ,
N R M S E = 1 n m i = 1 n S S i A R i 2 n ( % ) ,
where SSi is the simulated value, ARi is the reference value, n is the number of samples, and nm is a normalization mean defined by Equation (13). ASHRAE recommends that the normalization mean be the reference values ARi, considering only numbers higher than zero, nARi.
n m   a v > 0 = i = 1 n A R i n A R i > 0 .
Table 7 presents the RMSE and NRMSE values for indoor temperature in °C and Water Heat Gain in W/(m2). Those indices were calculated hourly for each WFG case study over 4 days in summer.
The ASHRAE calibration criteria state that the hourly NRMSE must be less than 30% [47,48]. This condition was met in all cases, except for Water Heat Gain in Case 3, where it slightly surpassed the threshold with 32.69%. The results showed a good agreement between the analytical tools, although the analysis might change using a more extensive dataset, specifically hourly data collected throughout the entire year. Additionally, the thresholds proposed by ASHRAE Guideline 14-2014 may result in different interpretations about the validity of results with low Water Heat Gain, especially in seasons when the solar irradiance is very low.

4.3. Experimental Validation in a Prototype with a Water Flow Glazing Facade: Transient-State Case 3

In alignment with the recommendations by ASHRAE Guideline 14, this section describes an experimental setup and performs a statistical analysis of the simulated results against measured data. The test system for the new tool was based on the pure calibration technique of ASHRAE BESTEST-EX [49]. In this case, the Mean Bias Error (MBE) was not considered, as its correlation is nearly identical to that of NRMSE and NMBE due to their mathematical definitions. As per ASHRAE guidelines, the Coefficient of Determination (R2) was used to analyze the differences between simulated and recorded results across various iterations until the value was above the acceptable standard of R2 > 0.85. Equation (14) describes the expression for R2.
R 2 = 1 i = 1 n S S i A R i 2 i = 1 n A R i A R i ¯ 2 ,
where Ri is the mean value.
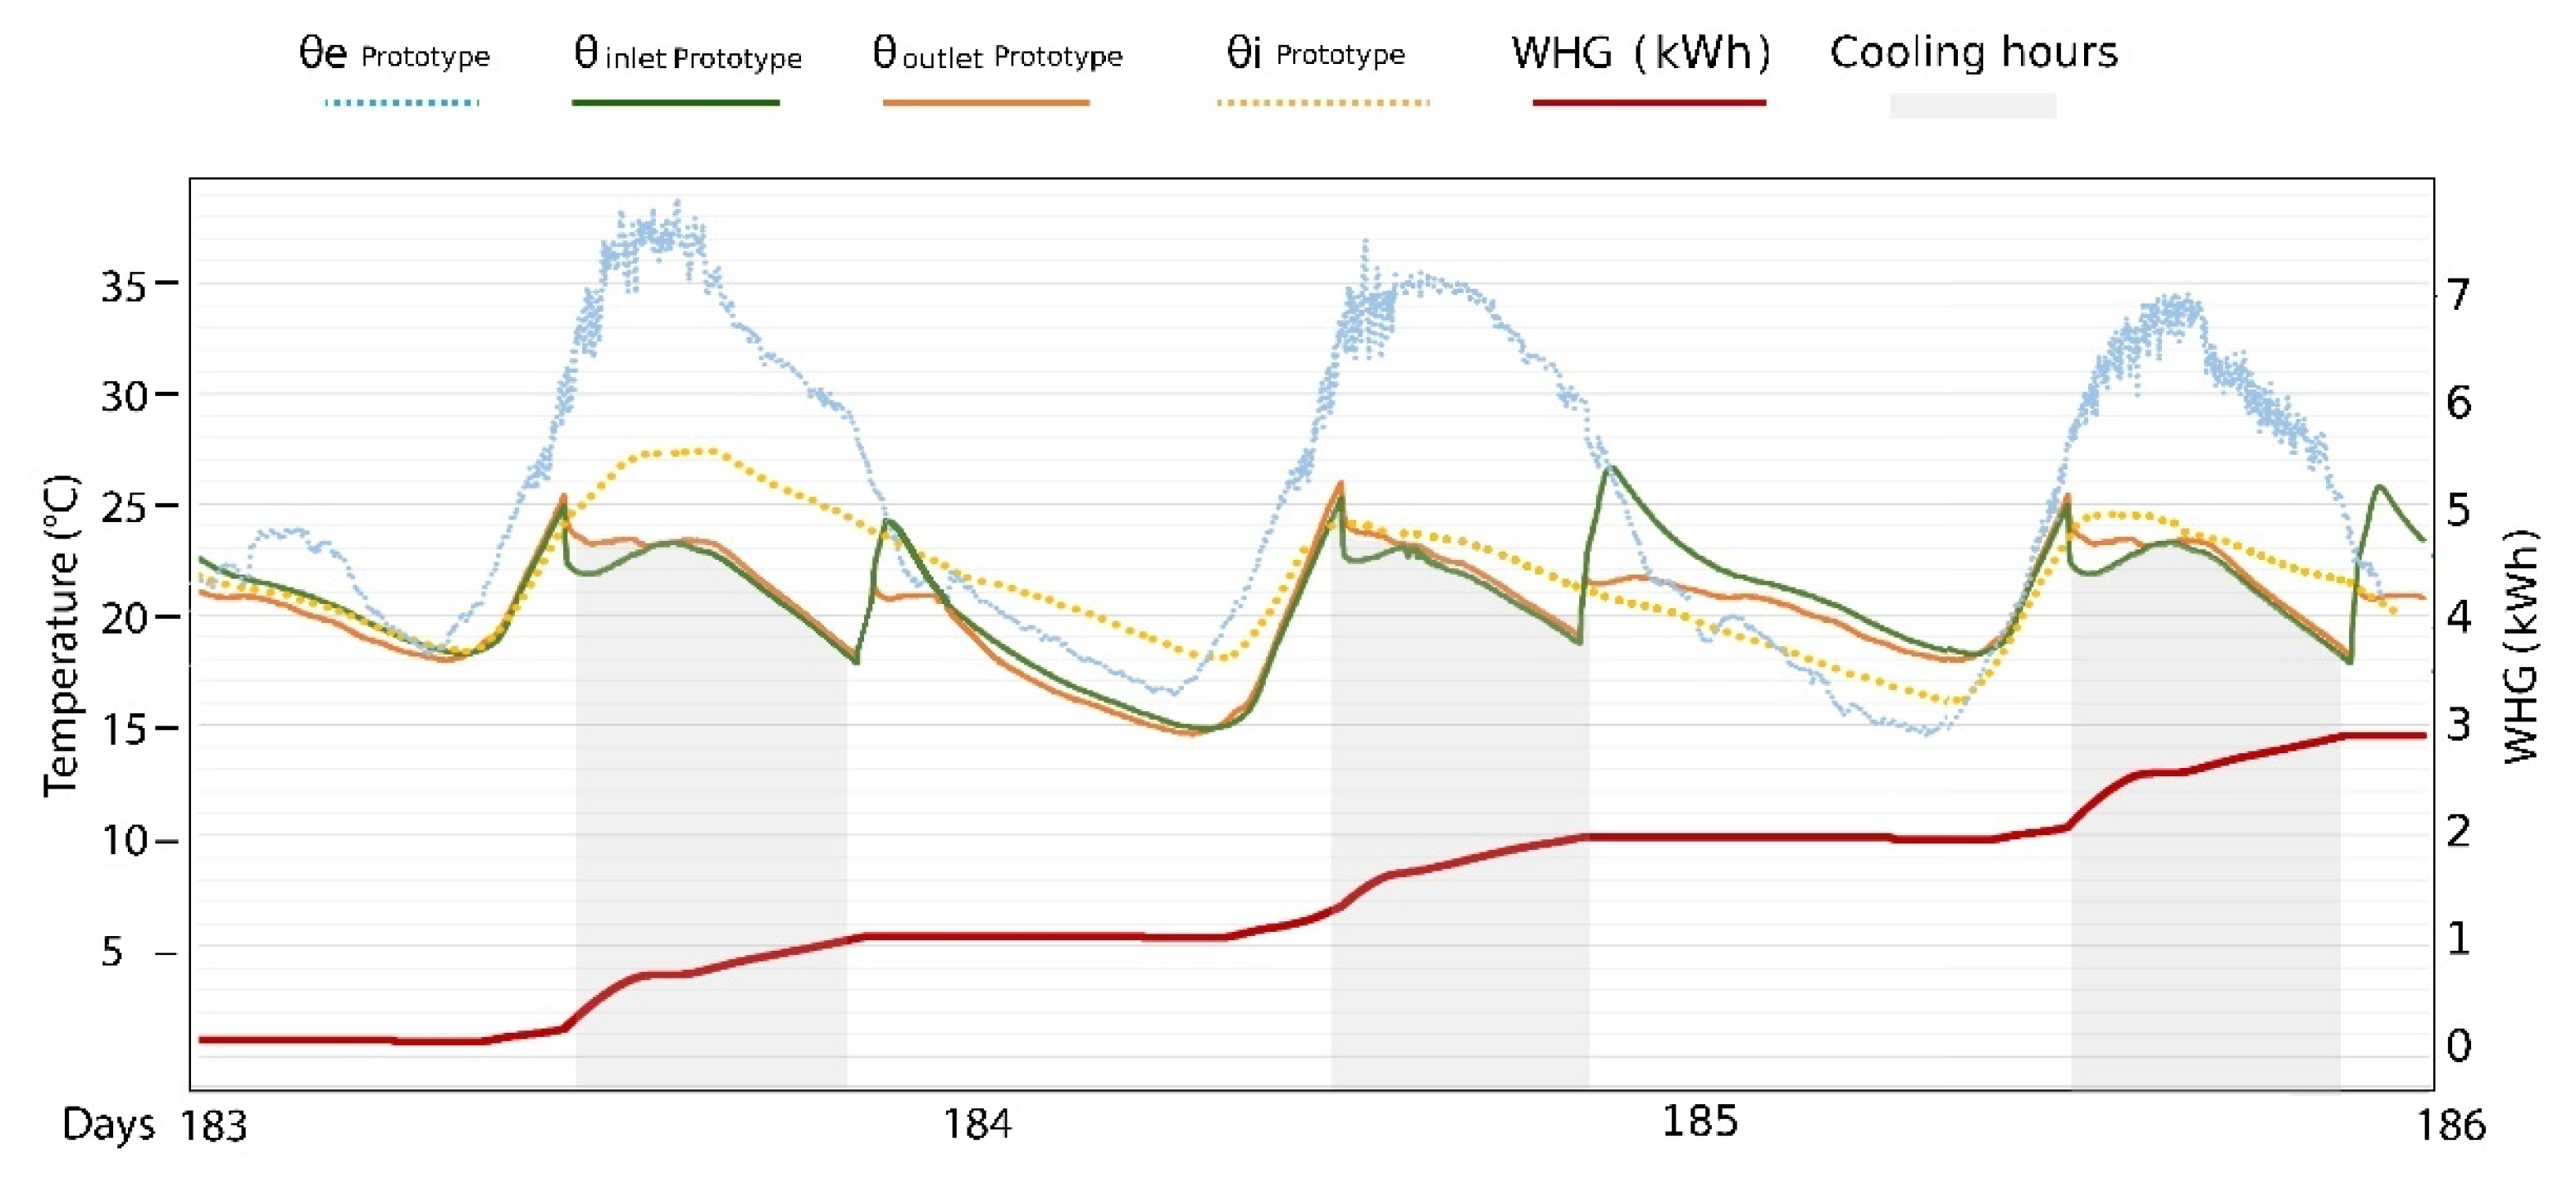
Model calibration is an iterative process that adjusts model inputs and compares the results with measured hourly weather data. A model is considered calibrated when the statistical indices of calibration are met. The sensors deployed in the prototype described in Section 2.4 measured the water heat gain of the WFG module. Inlet and outlet temperature probes were located to determine the flow rate and the total thermal power of the module. Then, the data monitored by the prototype was compared with the simulation results. Figure 11 illustrates a three-day analysis, where the outdoor temperature (θe Prototype) matched the temperature of the file used for simulation. The inlet and outlet temperatures of the water (θINLET Prototype and θOULET Prototype) were determined by the operating time of the Peltier device. Between 12:30 and 8:00 pm, the outlet temperature exceeded the inlet temperature. The outdoor temperature (θe Prototype) ranged from 38 °C to 15 °C. The Peltier device was unable to maintain a fixed inlet temperature throughout its operating time. The inlet temperature ranged from 22 °C at the start of operation to 18 °C at the end.
A comparison between Figure 9 and Figure 11 showed similarities in the experimental and simulated outputs. The Water Flow Glazing facade maintained a comfortable indoor temperature (θi Prototype) during the hottest hours of the day. The water heat gain (WHG) is calculated with a mass flow rate of 0.028 kg/(s m2), the fluid’s specific heat, and the difference between the inlet and outlet water temperatures, as described in Equation (5). The WHG in kWh is 2.95 kWh over three days, which aligns well with the simulation results.
However, notable differences between the measured and simulated results were observed. The measured outdoor temperature on the first day of data collection was warmer than that used in the simulation file. The simulated temperature ranged between 19 °C and 36 °C, whereas the measured data showed peaks of 38 °C. When the outdoor temperature reached those peaks, the indoor temperature (θi Prototype) was close to 38 °C. When the outdoor temperature remained below 35 °C, the recorded peak indoor temperature was 24 °C, slightly above the maximum indoor temperature in the simulation, which was 22 °C. The variation can be attributed to the working period of the Peltier device, which starts at noon. If the Peltier device had started its operation earlier, the indoor temperature peak would have been reduced. Another difference noted in the results was that the simulated water inlet temperature was set at 17 °C. In comparison, the observed results ranged between 18 °C and 22 °C due to the constraints of the Peltier device in achieving a steady water temperature.
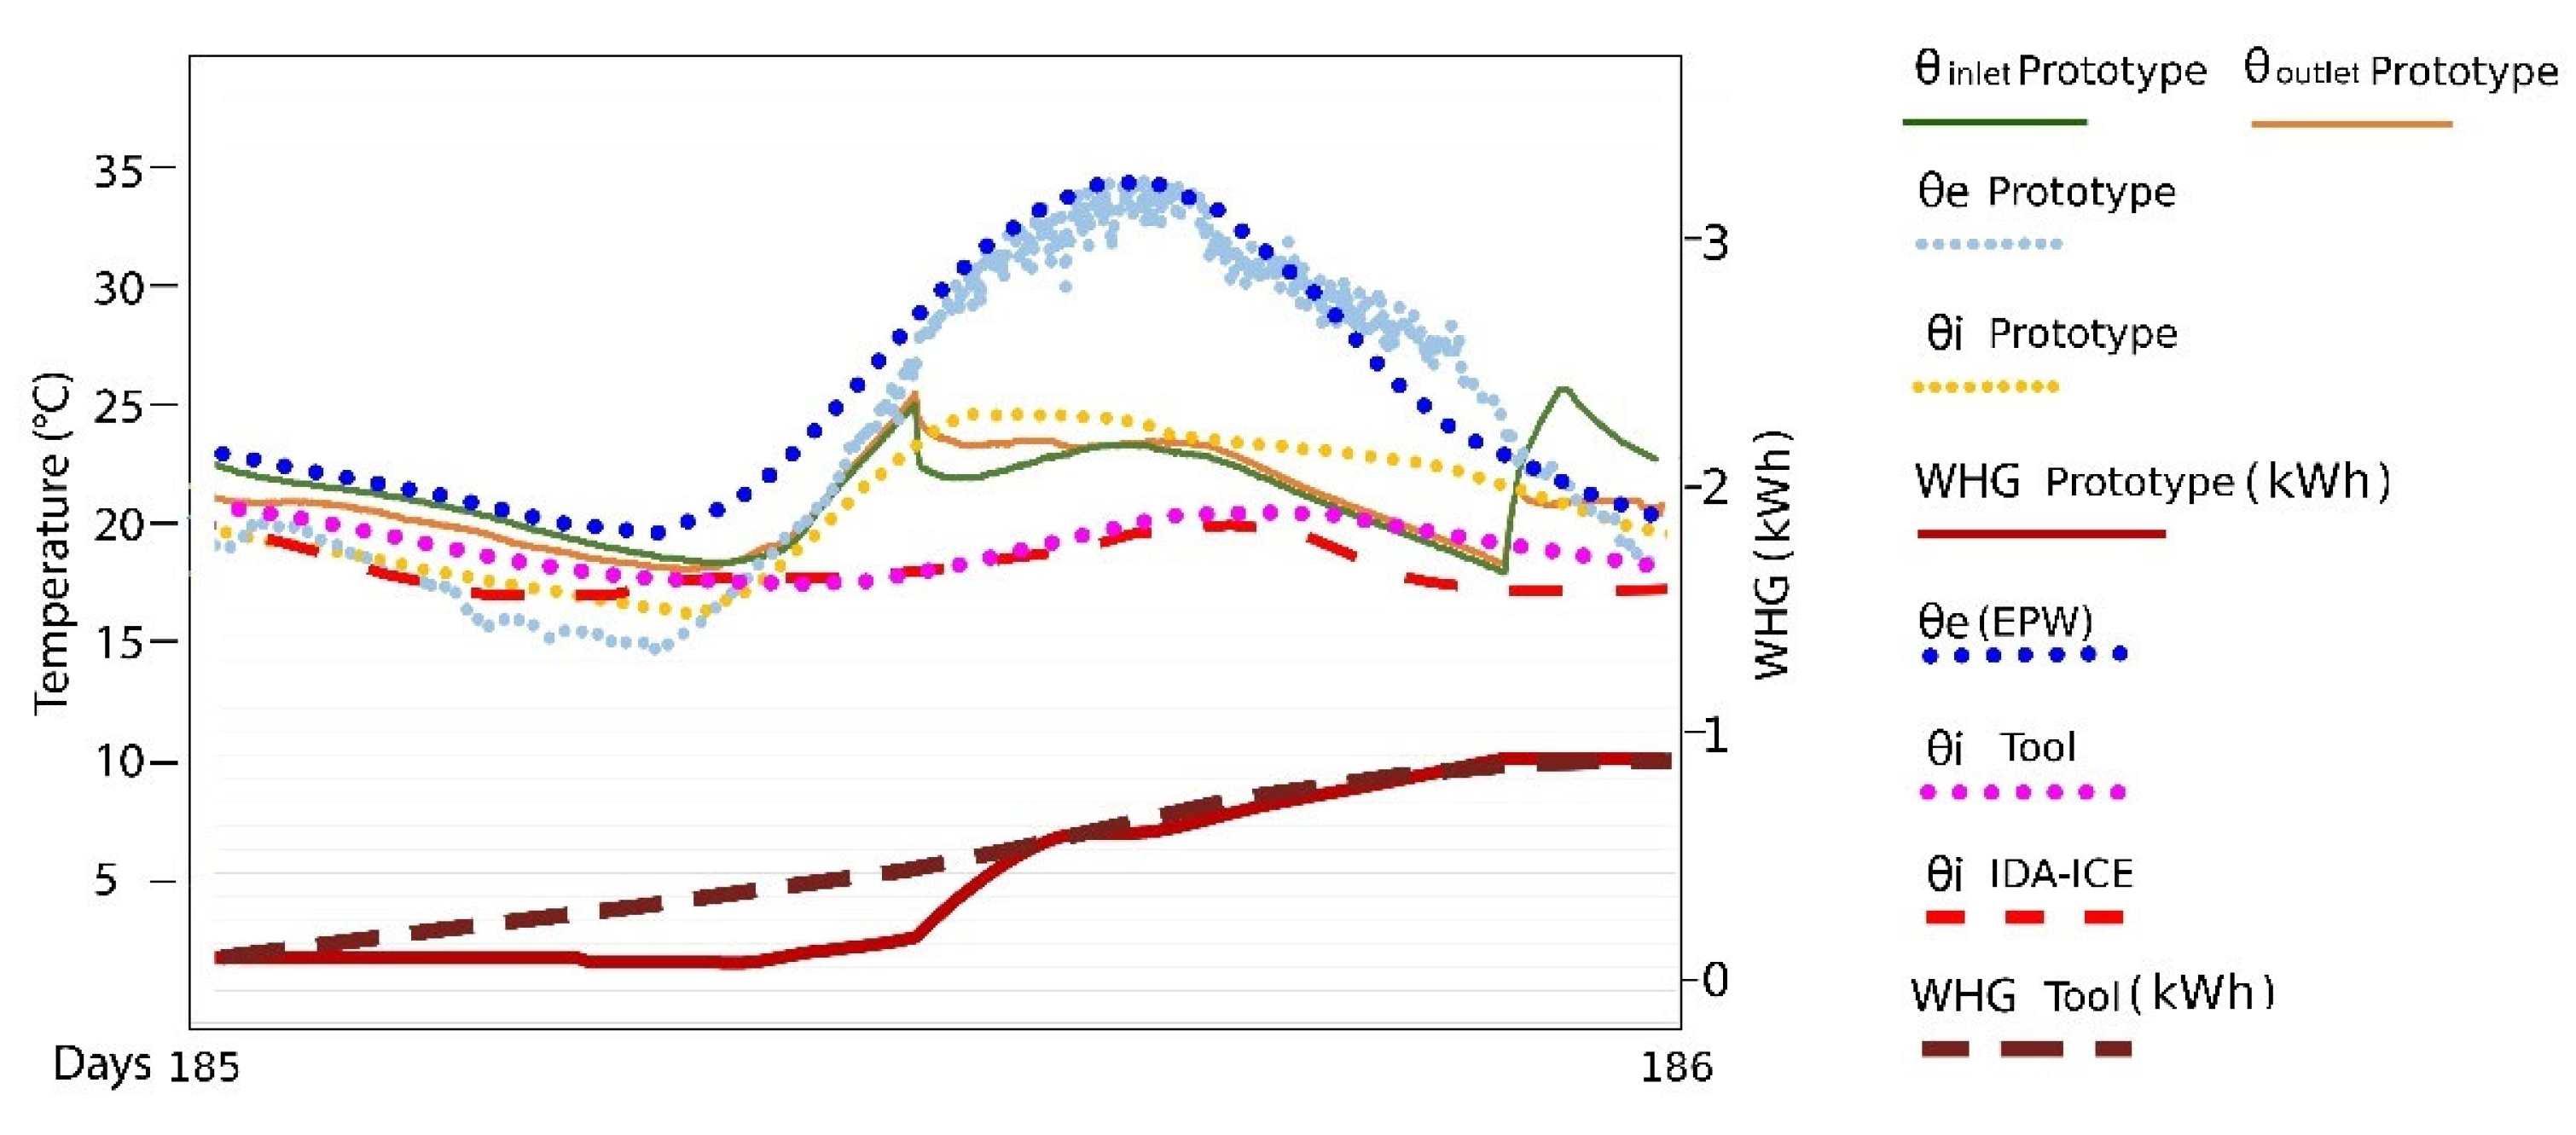
Figure 12 illustrates a comparative analysis between the two simulation tools and the experimental setup. The results from the prototype indicated that the daily solar energy absorbed (WHG Prototype) by a southern WFG facade in summer conditions is 0.93 kWh/m2, with a maximum outdoor temperature (θe Prototype) of 35 °C. These results align with simulation data from both software tools (θe EPW). The steep slope of the absorbed energy in the recorded data can be explained because the Peltier device commenced operation at noon and absorbed most of the internal heat over the first few hours of operation. In contrast, in the simulated cases, the heat absorption occurs throughout the day if the indoor and outdoor temperatures are above the water inlet temperature of 17 °C.
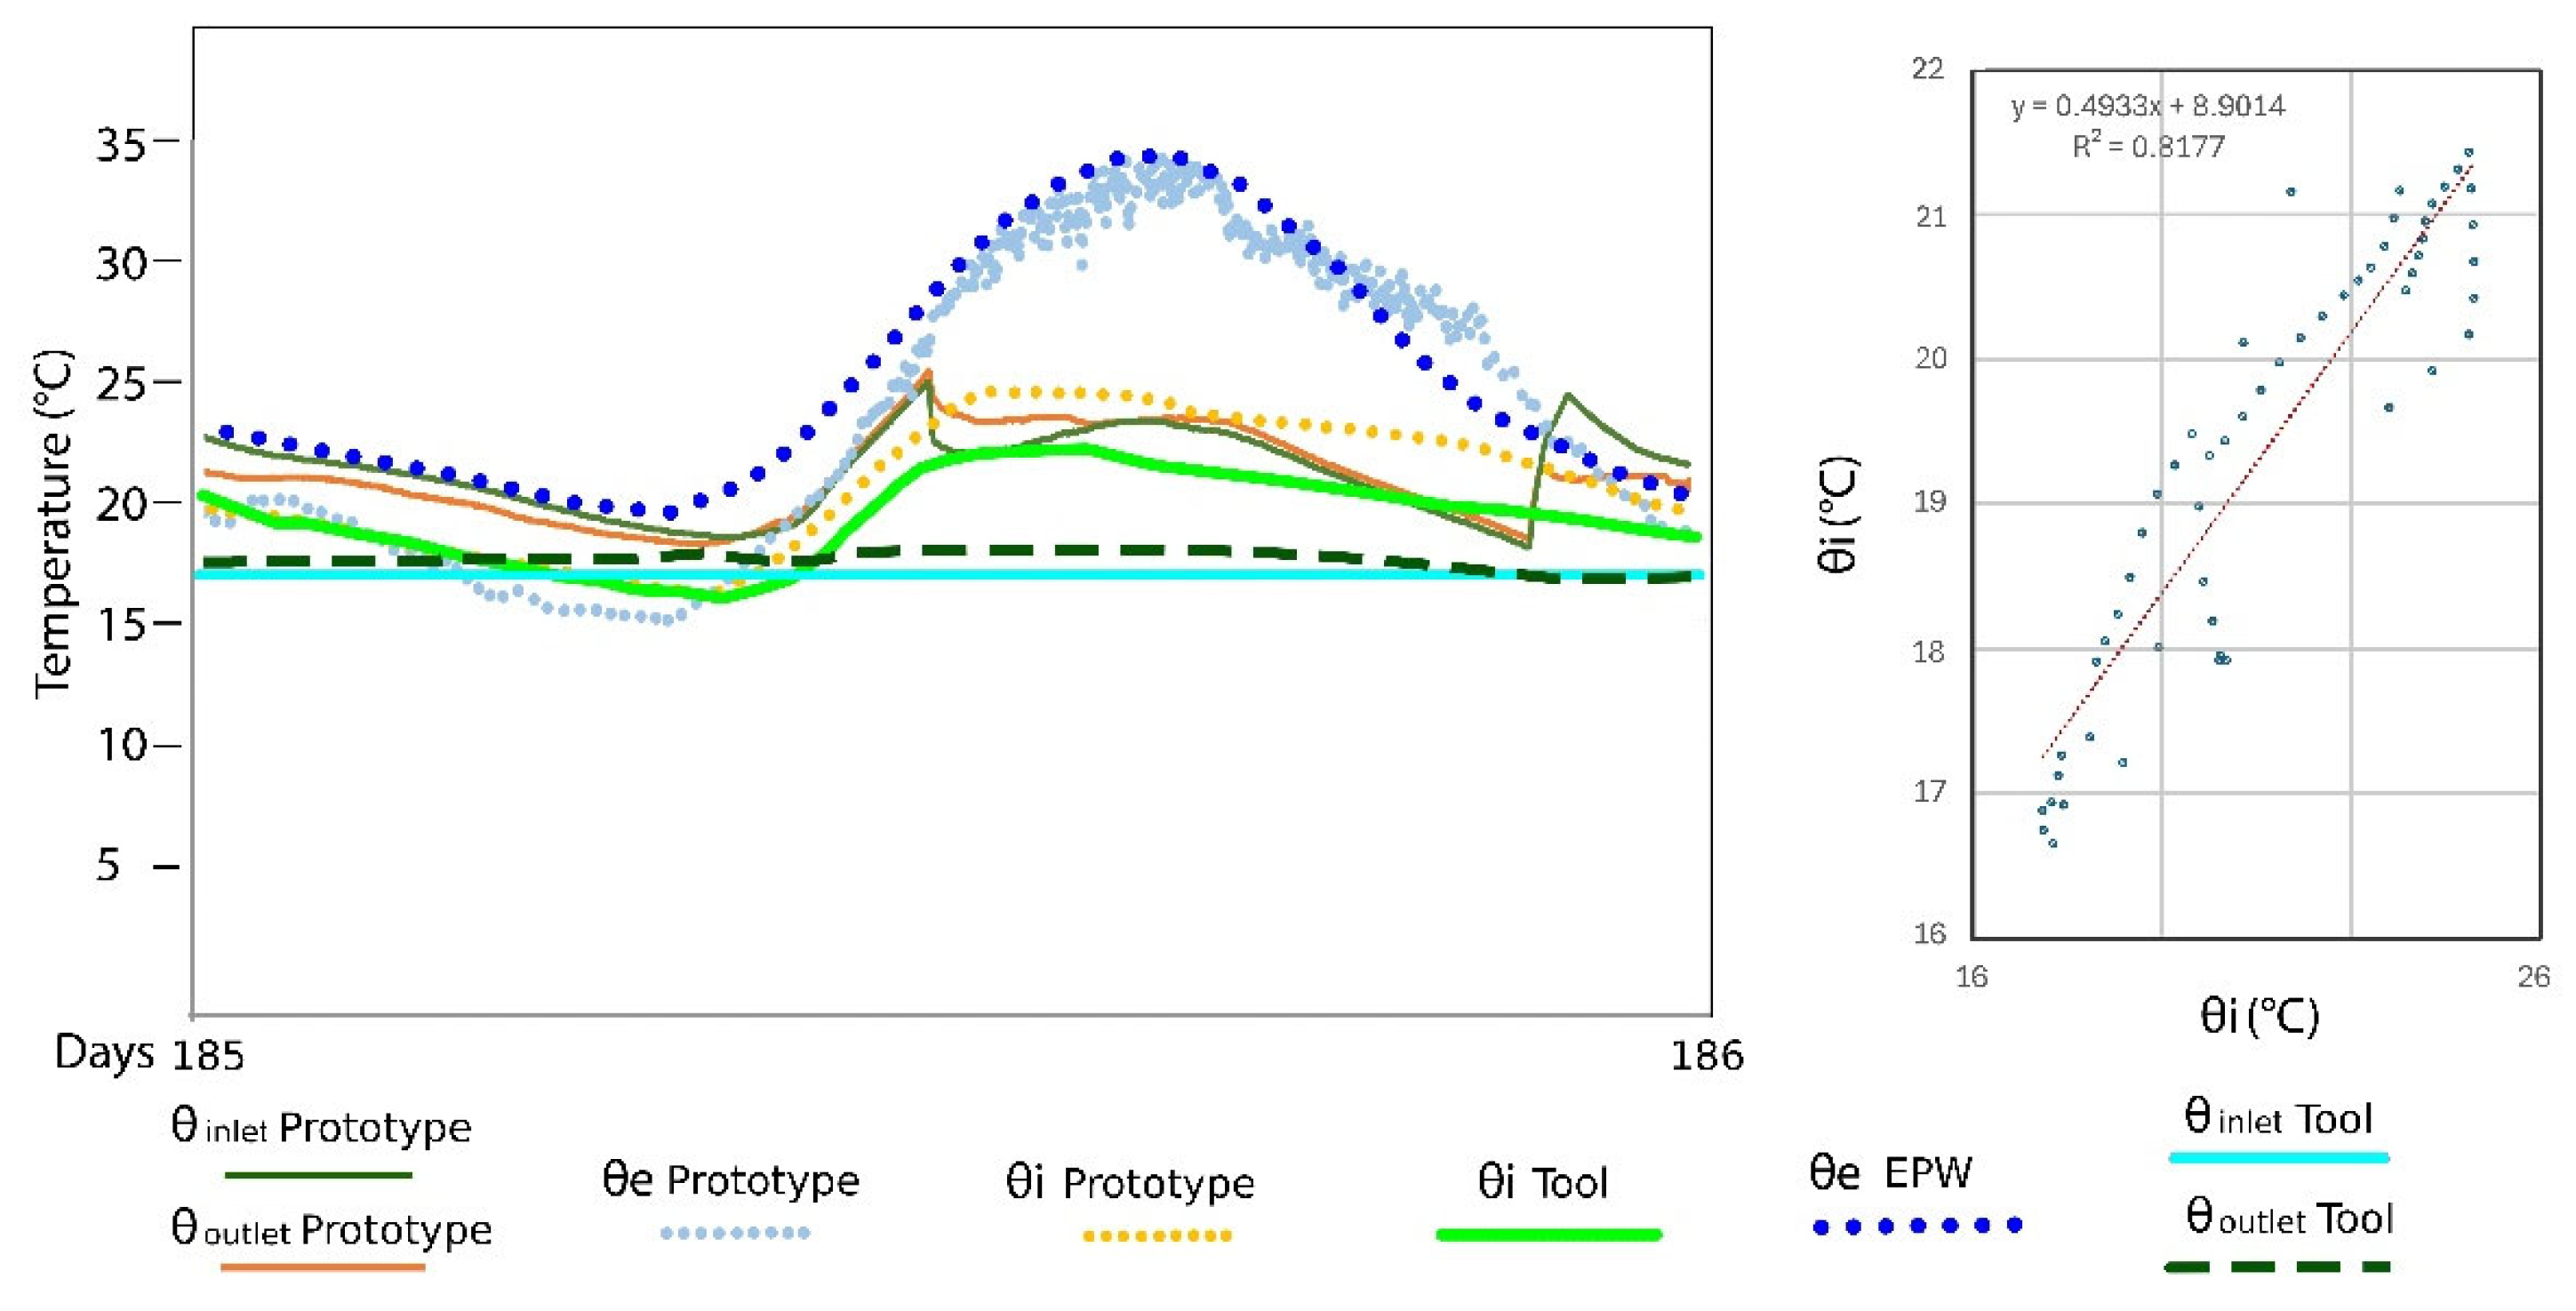
The WFG facade increases thermal inertia compared to traditional glazing, reducing extreme thermal oscillations between day and night. The recorded indoor air temperature (θi Prototype) of the WFG prototype reached a maximum value of 24.5 °C during the day and a minimum value of 16.3 °C at night. The main difference between recorded and simulation data lies in the peak indoor temperature. This discrepancy may be attributed to several factors, such as the prototype size, the interior thermal mass assigned in the simulation, and the limitations of the Peltier device in maintaining a steady inlet temperature. The prototype was constructed using the same materials specified in the simulation, with an opaque enclosure made of aluminum panels with thermal insulation. The size of the simulated case study was 7 m by 7 m by 3 m, whereas the actual prototype’s volume was less than 1 m3. This size difference resulted in a lower thermal mass and reduced capacity to absorb heat. On the other hand, the inlet temperature (θINLET Tool and θINLET IDA-ICE) set in both simulation tools was 17 °C. The Peltier device used in the experimental prototype began operating at noon, maintaining an inlet temperature (θINLET Prototype) between 22 °C and 18 °C. The next step in assessing the accuracy of the tool was to implement a new case study with analogous characteristics to those of the prototype. The revised simulation was equivalent to the previous one, with a significant change: the new dimensions were 1 m by 1 m by 1, with a glass facade of 1 m2 facing south. Figure 13 presents a comparative study of the simulation and the prototype, along with the coefficient of determination (R2) for the interior temperature, comparing measured and simulated values.
The indoor temperature in the prototype (θi Prototype) and the simulation (θi Tool) followed similar trends, although the peak value was 3 °C higher in the measured data. The water inlet temperature (θINLET Tool) was considered a steady input in the simulation tool at 17 °C, allowing for the ability to maintain a lower interior space temperature. The coefficient of determination (R2) between the two temperature measurements (θi Prototype and θi Tool) indicated an improvement over the previous analysis, achieving a value of 0.81, which is notably close to the acceptable threshold of 0.85.
The next iteration aimed to improve the accuracy of the tool by implementing the measured water inlet temperature (θINLET Prototype) as an input in this new simulation. Figure 14 illustrates the results of comparing θi Prototype and θi Tool, which have a coefficient of determination above 0.9, with values of RMSE and NRMSE of 0.51 and 2.41, respectively.
Table 8 presents the values of RMSE, NRMSE, and the coefficient of determination (R2) for the indoor temperature (θi Prototype and θi Tool). These indices were calculated by taking a 30 min time step during a summer day. The table presents the values derived from the statistical analysis across three different iterations. The first analysis examines the case described in Figure 12, where the simulated room size in the tool was 7 m by 7 m by 3 m, and the inlet temperature in the WFG panel remained constant throughout the studied day. The second iteration focuses on a simulated room that aligns with the dimensions of the experimental setup illustrated in Figure 13 with a constant inlet temperature. Lastly, the third analysis showcases the results from a simulated room with an inlet temperature corresponding to the experimental data (θINLET Prototype), as described in Figure 14.

5. Conclusions

This article described a graphical tool developed by the authors that includes a Fortran library to simulate Water Flow Glazing facades, enabling future developers to integrate Water Flow Glazing envelopes into existing energy simulation tools. The feedback provided by the tool enables users to perform iterations with design decisions, such as orientation, dimensions, and glazing properties.
The steady-state analysis provided a preliminary assessment of the efficiency of each Water Flow Glazing (WFG) panel. Three case studies were described and analyzed in this article. Cases 2 and 3 were selected for analysis under transient conditions in both winter and summer, serving as a facade of a room. Finally, an experimental setup was built in Madrid, Spain, to compare the simulated results of Case 3 with recorded data from the prototype.
Case 2 achieved a tenfold increase in water heat gain compared to the other two options for winter conditions. On the other hand, Case 3 was the optimal choice for summer conditions, as it shielded and reflected solar energy. The performance of Case 3 was similar to that of Case 2 in terms of solar energy transmission. However, it is essential to note that Case 2 required over twice the energy as Case 3 to achieve a similar cooling capacity.
Another goal of this article was to validate the results from the newly developed tool, which was explicitly designed to assess the thermal behavior of Water Flow Glazing, against the modeling approaches of the commercial dynamic simulation tool, IDA-ICE. The analysis of indoor temperature results revealed that both simulation tools produced identical maximum and minimum values. However, a notable divergence in the slope of the resulting graphs was observed. This variation suggests that the two tools may employ differing methods for considering interior thermal mass.
A quantitative validation method suggested by ASHRAE Guideline 14-2014 for hourly values was used to assess the results from the newly developed tool. The value from IDA-ICE was set as the reference value, and the Normalized Root Mean Square Error (NRMSE) was used to understand the degree of agreement between the tools. The results from Cases 2 and 3 under transient conditions revealed acceptable NRMSE values, which were below the ASHRAE maximum allowable error of 30%, in the assessment of the room’s indoor temperature. The values of the Water Heat Gain were slightly above the limit stated by ASHRAE due to the different implementations of the interior thermal mass in both tools.
Comparing the simulation tools with an experimental setup yielded similar results in terms of Water Heat Gain over three days in summer, when the EPW file used for simulation replicated the measured outdoor conditions. Significant discrepancies were found between the measured and simulated indoor temperatures, with an initial coefficient of determination (R2) of 0.41. Two iterations improved the simulation; adjusting the room geometry resulted in an R2 of 0.81, and integrating measured inlet temperature data increased it to 0.97.
The simulation software tool is currently in the experimental phase, so further development is necessary, especially regarding the user interface. The first limitation is that incorporating more Water Flow Glazing options and case studies requires proficiency in programming software such as FORTRAN and C++, so lay users cannot create their own WFG panels. Therefore, the users of this tool can only work with limited WFG options. A closer relationship with industry stakeholders and glass manufacturers is essential for selecting valid WFG compositions suitable for each climate and energy strategy. Another limitation of the proposed tool is the use of a simplified model that disregards the thermal mass of the various WFG layers and resolves a system of algebraic equations. A complete model that acknowledges the thermal mass and considers each layer as a partial differential equation requires greater computational effort. The tool must be tested against more empirical data from prototypes in various locations to validate the accuracy of the simplified model.
Overall, the findings of this report contribute to a deeper understanding of the diverse capabilities of different building energy simulation (BES) tools. Further studies must continue to carry out these comparisons to establish a set of parameters that can help building designers increase their confidence and understanding of using Building Energy Simulation software. Additionally, the proposed methodology must be tested in buildings with more complex heating, ventilation, and air conditioning systems and compared with recorded values from monitoring systems.

Author Contributions

Conceptualization, B.M.S., F.D.A.G. and J.A.H.R.; methodology, J.A.H.R. and F.D.A.G.; software, J.A.H.R.; formal analysis, B.M.S. and F.D.A.G.; data curation, J.A.H.R.; writing—original draft preparation, J.A.H.R.; writing—review and editing, F.D.A.G.; visualization, B.M.S. and F.D.A.G.; supervision, J.A.H.R.; project administration, B.M.S.; funding acquisition, F.D.A.G. All authors have read and agreed to the published version of the manuscript.

Funding

This work was supported by Keene State College Faculty Development Grant program.

Institutional Review Board Statement

Not applicable.

Informed Consent Statement

Not applicable.

Data Availability Statement

More detailed documentation of the tool can be found in “Industrial Development of Water Flow Glazing Systems” Innovation action project funded under Horizon 2020. https://www.indewag.eu/manuals.php (accessed on 12 July 2025). The InDeWaG Software Tool is available at GitHub. https://github.com/jahrWork/InDeWaG-software-tool/tree/master (accessed on 12 July 2025).

Conflicts of Interest

The authors declare no conflicts of interest.

References

  1. European Union. Directive (EU) 2018/844 of the European Parliament and of the Council of 30 May 2018. Amending Directive 2010/31/EU on the Energy Performance of Buildings and Directive 2012/27/EU on Energy Efficiency. 2018. Available online: https://eur-lex.europa.eu/legal-content/EN/TXT/PDF/?uri=CELEX:32018L0844&from=EN (accessed on 10 June 2025).
  2. Sudhakar, K.; Winderl, M.; Shanmuga Priya, S. Net-zero building designs in hot and humid climates: A state-of-art. Case Stud. Therm. Eng. 2019, 13, 100400. [Google Scholar] [CrossRef]
  3. Katili, A.R.; Boukhanouf, R.; Wilson, R. Space cooling in buildings in hot and humid climate—A review of the effect of humidity on the applicability of existing cooling techniques. In Proceedings of the International Conference on Sustainable Energy Technologies—SET, Nottingham, UK, 25–27 August 2015. [Google Scholar]
  4. Dhariwal, J.; Banerjee, R. An approach for building design optimization using design of experiments. Build. Simul. 2017, 10, 323–336. [Google Scholar] [CrossRef]
  5. Lai, C.M.; Wang, Y.H. Energy-saving potential of building envelope design in residential house in Taiwan. Energies 2011, 4, 2061–2076. [Google Scholar] [CrossRef]
  6. Jia, Z.; Xiang, C. Smart solar windows for an adaptive future: A comprehensive review of performance, methods and applications. Energy Build. 2025, 346, 116227. [Google Scholar] [CrossRef]
  7. Wu, S.; Sun, H.; Duan, M.; Mao, H.; Wu, Y.; Zhao, H.; Lin, B. Applications of thermochromic and electrochromic smart windows: 574 Materials to buildings. Cell Rep. Phys. Sci. 2023, 4, 101370. [Google Scholar] [CrossRef]
  8. Zhang, S.; Liu, J.; He, E.; Li, D.; Si, W.; Wei, B.; Wang, G. Photothermal performance investigation of a reversible window combining paraffin and silica aerogel. Energy 2025, 329, 136646. [Google Scholar] [CrossRef]
  9. Gutai, M.; Kheybari, A.G. Energy consumption of water-filled glass (WFG) hybrid building envelope. Energy Build. 2020, 218, 110050. [Google Scholar] [CrossRef]
  10. Nur-E-Alam, M.; Vasiliev, M.; Yap, B.K.; Islam, M.A.; Fouad, Y.; Kiong, T.S. Design, fabrication, and physical properties analysis of 567 laminated Low-E coated glass for retrofit window solutions. Energy Build. 2024, 318, 114427. [Google Scholar] [CrossRef]
  11. Chow, T.T.; Li, C.; Lin, Z. Thermal characteristics of water-flow double-pane window. Int. J. Therm. Sci. 2010, 50, 140–148. [Google Scholar] [CrossRef]
  12. Rashevski, M.; Slavtchev, S.; Stoyanova, M. Natural and mixed convection in a vertical water-flow chamber in the presence of solar radiation. Eng. Sci. Technol. Int. J. 2022, 33, 101073. [Google Scholar] [CrossRef]
  13. Torregrosa-Jaime, B.; Martínez, P.J.; González, B.; Payá-Ballester, G. Modelling of a variable refrigerant flow system in EnergyPlus for building energy simulation in an Open Building Information modelling environment. Energies 2019, 12, 22. [Google Scholar] [CrossRef]
  14. Priarone, A.; Silenzi, F.; Fossa, M. Modelling Heat Pumps with Variable EER and COP in EnergyPlus: A Case Study Applied to Ground Source and Heat Recovery Heat Pump Systems. Energies 2020, 13, 794. [Google Scholar] [CrossRef]
  15. Lee, S.H.; Jeon, Y.; Chung, H.J.; Cho, W.; Kim, Y. Simulation-based optimization of heating and cooling seasonal performances of an air-to-air heat pump considering operating and design parameters using genetic algorithm. Appl. Therm. Eng. 2018, 144, 362–370. [Google Scholar] [CrossRef]
  16. Xamán, J.; Olazo-Gómez, Y.; Chávez, Y.; Hinojosa, J.; Hernández-Pérez, I.; Hernández-López, I.; Zavala-Guillén, I. Computational fluid dynamics for thermal evaluation of a room with a double glazing window with a solar control film. Renew. Energy 2016, 94, 237–250. [Google Scholar] [CrossRef]
  17. Sorooshnia, E.; Rashidi, M.; Rahnamayiezekavat, P.; Mahmoudkelayeh, S.; Pourvaziri, M.; Kamranfar, S.; Gheibi, M.; Samali, B.; Moezzi, R. A novel approach for optimized design of low-E windows and visual comfort for residential spaces. Energy Built Environ. 2025, 6, 27–42. [Google Scholar] [CrossRef]
  18. Sowunmi, A.R.; Anafi, F.O.; Folayan, C.O.; Ajayi, O.A.; Omisanya, N.O. TRNSYS 16: A veritable solar modelling and programming simulation tool used in the design of a continuous solar powered adsorption refrigeration system. J. Mech. Eng. Res. 2021, 12, 49–60. [Google Scholar]
  19. Mazzeo, D.; Matera, N.; Cornaro, C.; Oliveti, G.; Romagnoni, P.; Santoli, L. EnergyPlus, IDA ICE and TRNSYS predictive simulation accuracy for building thermal behaviour evaluation by using an experimental campaign in solar test boxes with and without a PCM module. Energy Build. 2020, 212, 109812. [Google Scholar] [CrossRef]
  20. Bring, A.; Sahlin, P.; Vuolle, M. Models for Building Indoor Climate and Energy Simulation, a Report of IEA SHC Task 22: Building Energy Analysis Tools, Subtask B: Model Documentation. 1999. Available online: https://www.equa.se/dncenter/T22Brep.pdf (accessed on 5 June 2025).
  21. Del Ama Gonzalo, F.; Moreno Santamaría, B.; Montero Burgos, M.J. Assessment of Building Energy Simulation Tools to Predict Heating and Cooling Energy Consumption at Early Design Stages. Sustainability 2023, 15, 1920. [Google Scholar] [CrossRef]
  22. U.S. Department of Energy. Building Energy Software Tools Directory. Available online: https://www.energy.gov/eere/buildings/listings/software-tools (accessed on 15 July 2025).
  23. Magni, M.; Ochs, F.; de Vries, S.B.; Maccarini, A.; Sigg, F. Detailed cross-comparison of building energy simulation tools results using a reference office building as a case study. Energy Build. 2021, 250, 111260. [Google Scholar] [CrossRef]
  24. Kim, M.; Jung, S.; Kang, J. Artificial Neural Network-Based Residential Energy Consumption Prediction Models Considering Residential Building Information and User Features in South Korea. Sustainability 2020, 12, 109. [Google Scholar] [CrossRef]
  25. Zevenhoven, R.; Fält, M.; Gomes, L.P. Thermal radiation heat transfer: Including wavelength dependence into modelling. Int. J. Therm. Sci. 2014, 86, 189–197. [Google Scholar] [CrossRef]
  26. Baetens, R.; Jelle, B.P.; Gustavsen, A. Properties, requirements and possibilities of smart windows for dynamic daylight and solar energy control in buildings: A state-of-the-art review. Sol. Energy Mater. Sol. Cells 2010, 94, 87–105. [Google Scholar] [CrossRef]
  27. Echarri, V.; Espinosa, A.; Rizo, C. Thermal Transmission through Existing Building Enclosures: Destructive Monitoring in Intermediate Layers versus Non-Destructive Monitoring with Sensors on Surfaces. Sensors 2017, 17, 2848. [Google Scholar] [CrossRef] [PubMed]
  28. Moreno, B.; Hernández, J.A. Analytical solutions to evaluate solar radiation overheating in simplified glazed rooms. Build. Environ. 2018, 140, 162–172. [Google Scholar] [CrossRef]
  29. Energy Plus. Available online: https://energyplus.net/documentation (accessed on 15 July 2025).
  30. Energy Plus. Available online: https://energyplus.net/weather-location/europe_wmo_region_6/ESP/ESP_Madrid.082210_IWEC (accessed on 15 July 2025).
  31. REF Berkeley Lab. Available online: https://windows.lbl.gov/igdb-knowledge-base (accessed on 24 July 2025).
  32. Zhang, R.; Hong, T. Modeling and Simulation of Operational Faults of HVAC Systems using EnergyPlus. In Proceedings of the ASHRAE/IBPSA-USA Building Simulation Conference SimBuild, Salt Lake City, UT, USA, 10–12 August 2016. [Google Scholar]
  33. ISO 15099:2003; Thermal Performance of Windows, Doors and Shading Devices—Detailed Calculations. International Organization for Standardization: Geneva, Switzerland, 2003.
  34. Schaffer, M.; Bugenings, L.A.; Andersen, K.H.; Melgaard, S.P. Experience-Based User Guide for IDA-ICE; Department of the Built Environment, Aalborg University: Aalborg, Sweden, 2023. [Google Scholar]
  35. Sierra, P.; Hernandez, J.A. Solar heat gain coefficient of water flow glazing. Energy Build. 2017, 139, 133–145. [Google Scholar] [CrossRef]
  36. Moreno Santamaria, B.; Gonzalo, F.d.A.; Pinette, D.; Lauret Aguirregabiria, B.; Hernandez Ramos, J.A. Industrialization and Thermal Performance of a New Unitized Water Flow Glazing Facade. Sustainability 2020, 12, 7564. [Google Scholar] [CrossRef]
  37. Arroyo, J.; Spiessens, F.; Helsen, L. Comparison of optimal control techniques for building energy management. Front. Built Environ. 2022, 8, 849754. [Google Scholar] [CrossRef]
  38. D’Agostino, D.; Landolfi, R.; Nicolella, M.; Minichiello, F. Experimental Study on the Performance Decay of Thermal Insulation and Related Influence on Heating Energy Consumption in Buildings. Sustainability 2022, 14, 2947. [Google Scholar] [CrossRef]
  39. Royapoor, M.; Roskilly, T. Building model calibration using energy and environmental data. Energy Build. 2015, 94, 109–120. [Google Scholar] [CrossRef]
  40. Magrini, A.; Lentini, G. NZEB Analyses by Means of Dynamic Simulation and Experimental Monitoring in Mediterranean Climate. Energies 2020, 13, 4784. [Google Scholar] [CrossRef]
  41. Jones, P.; Li, X.; Coma Bassas, E.; Perisoglou, E.; Patterson, J. Energy-Positive House: Performance Assessment through Simulation and Measurement. Energies 2020, 13, 4705. [Google Scholar] [CrossRef]
  42. Shaw, T.A.; Stevens, B. The other climate crisis. Nature 2025, 639, 877–887. [Google Scholar] [CrossRef]
  43. Neymark, J.; Judkoff, R.; Knabe, G.; Le, H.T.; Dürig, M.; Glass, A.; Zweifel, G. Applying the building energy simulation test (BESTEST) diagnostic method to verification of space conditioning equipment models used in whole-building energy simulation programs. Energy Build. 2002, 34, 917–931. [Google Scholar] [CrossRef]
  44. ASHRAE Guideline 14-2014; Measurement of Energy and Demand Savings. American Society of Heating Refrigerating and Air-Conditioning Engineers: Atlanta, GA, USA, 2014.
  45. Raftery, P.; Keane, M.; Costa, A. Calibrating whole building energy models: Detailed case study using hourly measured data. Energy Build. 2011, 43, 3666–3679. [Google Scholar] [CrossRef]
  46. Hensen, J.L.M.; Lamberts, R. Building Performance Simulation for Design and Operation; Routledge: London, UK, 2019. [Google Scholar]
  47. Alghoul, K.S. A Comparative Study of Energy Consumption for Residential HVAC Systems Using EnergyPlus. Am. J. Mech. Ind. Eng. 2017, 2, 98. [Google Scholar] [CrossRef]
  48. Lam, K.P.; Zhao, J.; Ydstie, B.E.; Wirick, J.; Qi, M.; Park, J. An Energyplus Whole Building Energy Model Calibration Method for Office Buildings Using Occupant Behavior Data Mining and Emprirical Data. In Proceedings of the ASHRAE/IBPSA-USA Building Simulation Conference, Atlanta, GA, USA, 10–12 September 2014; pp. 160–167. [Google Scholar]
  49. Judkoff, R.; Polly, B.; Marcus, B.; Neymark, J.; Kennedy, M. Building Energy Simulation Test for Existing Homes (BESTEST-EX): Instructions for Implementing the Test Procedure, Calibration Test Reference Results, and Example Acceptance-Range Criteria; National Renewable Energy Laboratory Report NREL/TP-5500-52414; US Department of Energy: Washington, DC, USA, 2011. [Google Scholar] [CrossRef]
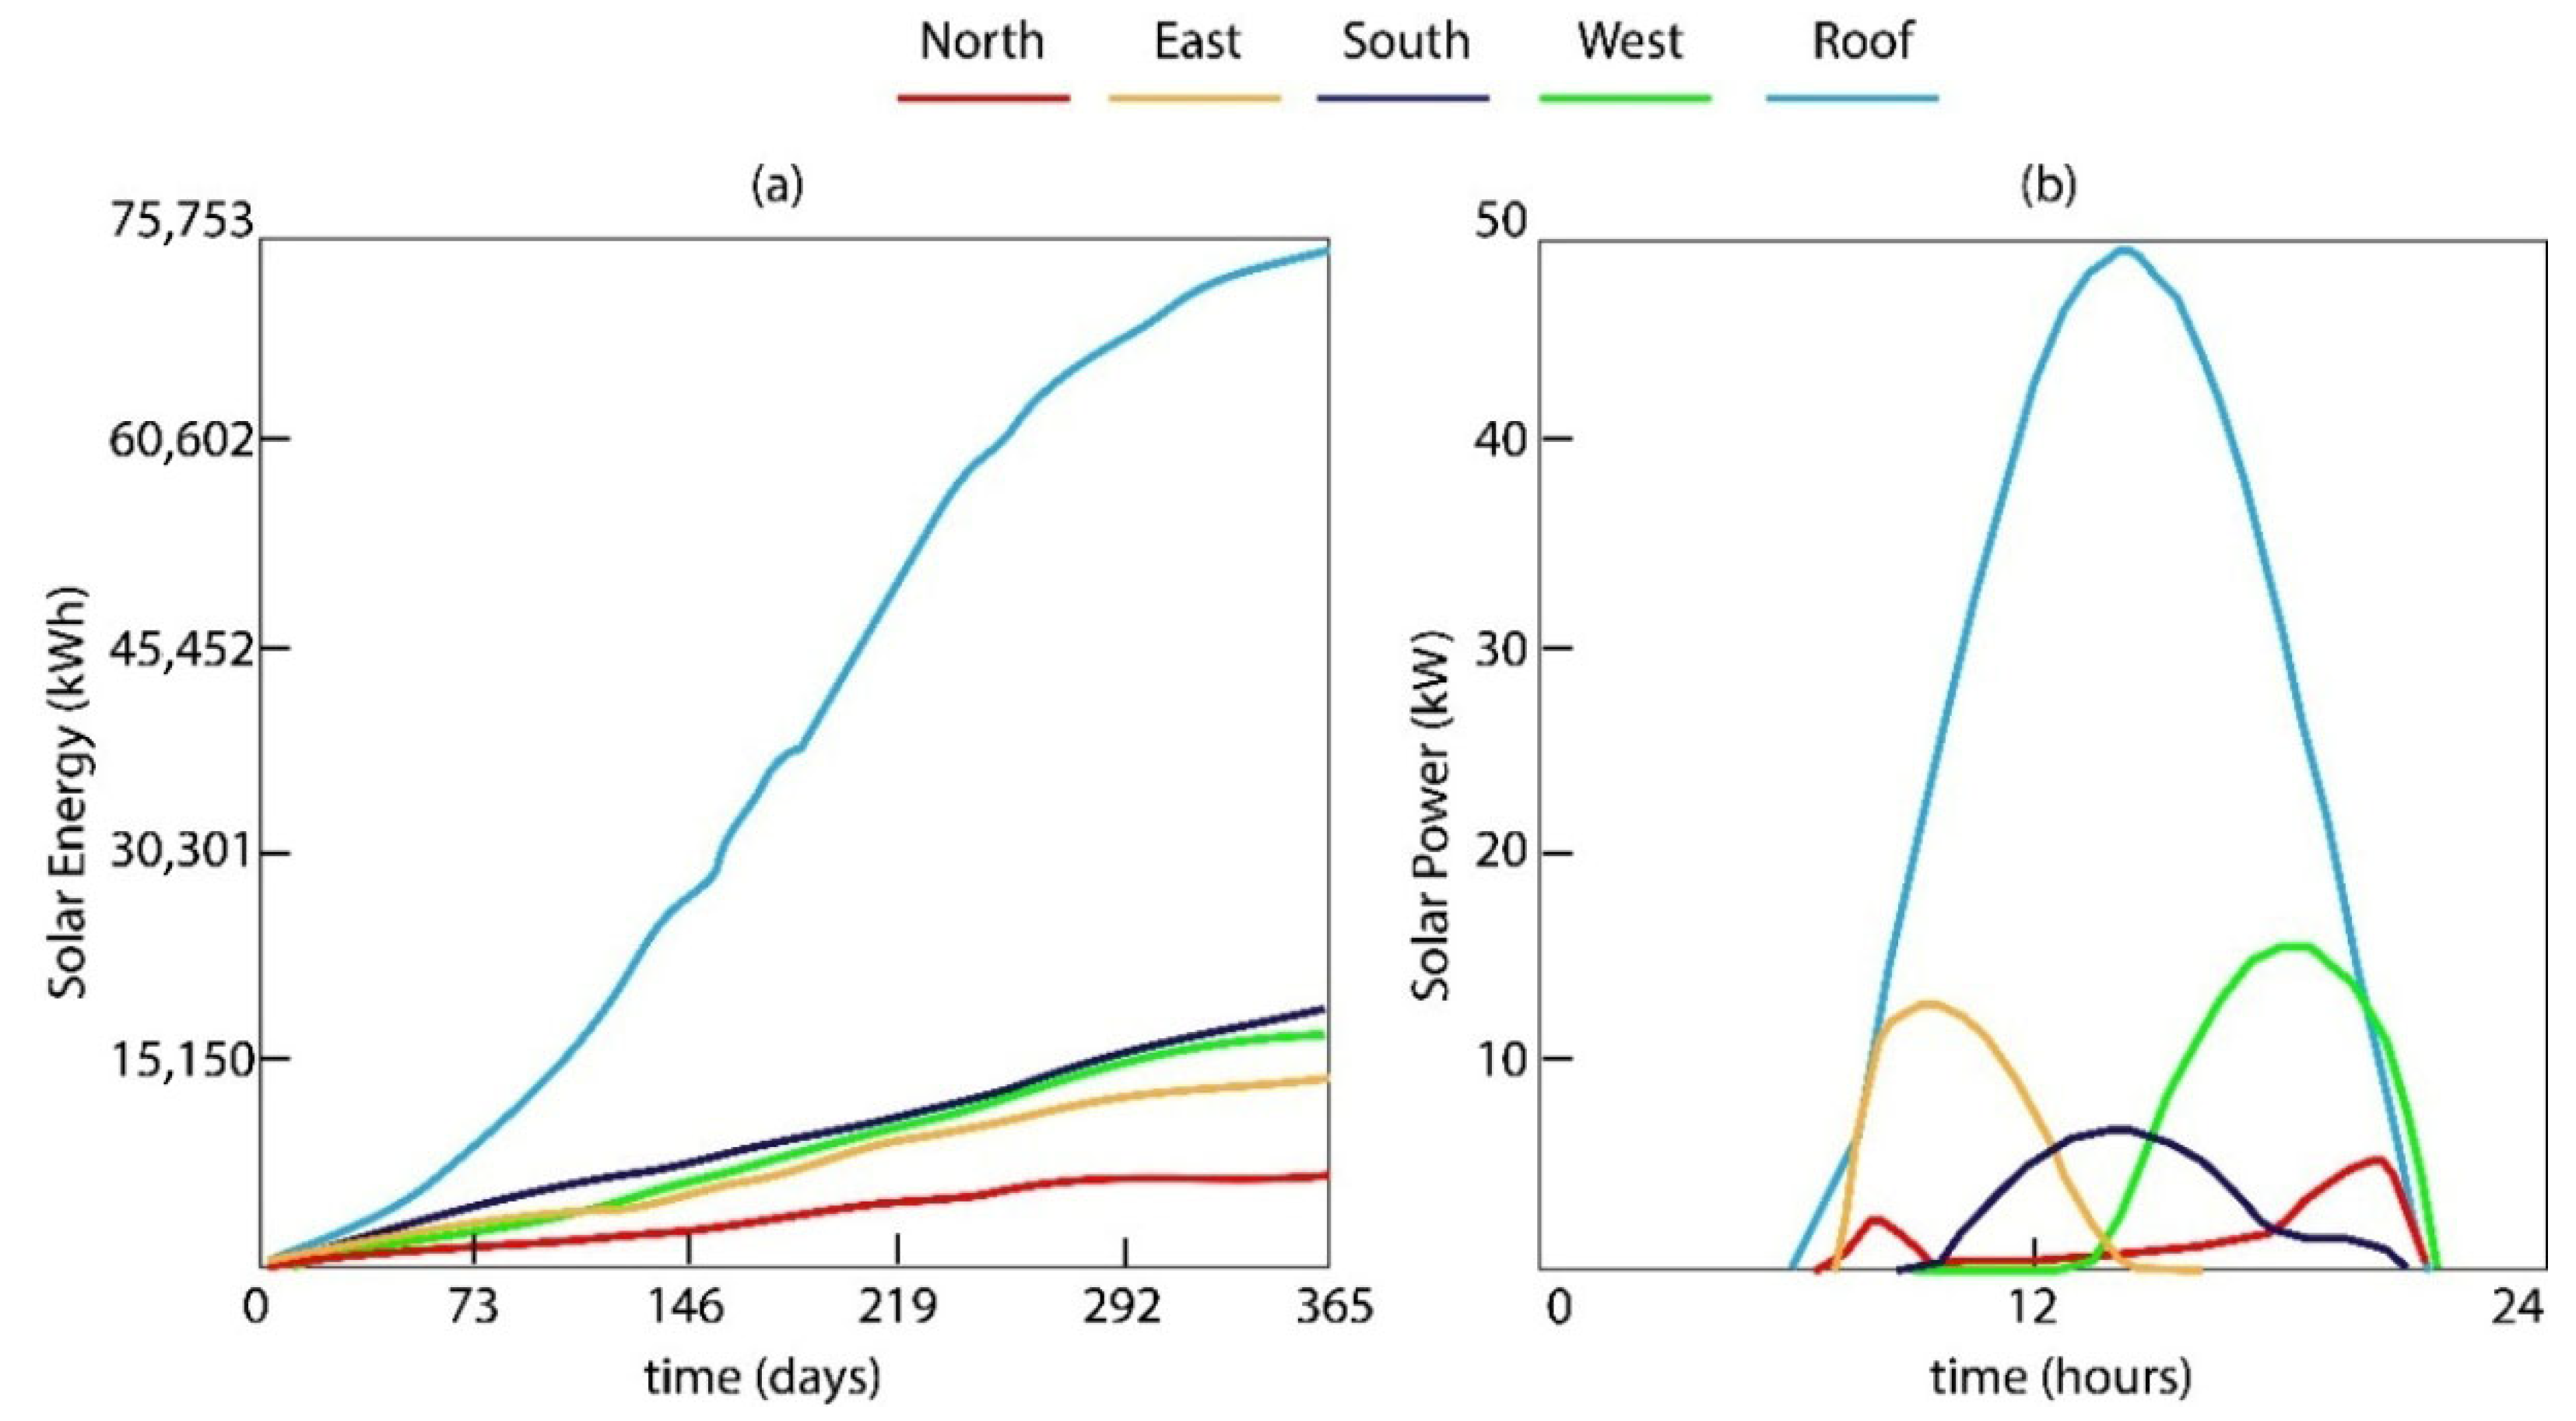
Figure 1. Parametric curves. Solar energy and power on different surfaces of a case study in Madrid, Spain. (a) yearly solar energy; (b) daily power on 5 July.
Sustainability 17 09669 g001
Figure 2. A description of the tool’s Application Programming Interface for spectral properties of Water Flow Glazing.
Sustainability 17 09669 g002
Figure 3. Spectral properties of case study of WFG. (a) Depending on angle of incidence; (b) depending on wavelength.
Sustainability 17 09669 g003
Figure 4. A description of the tool’s Application Programming Interface for thermal properties of Water Flow Glazing.
Sustainability 17 09669 g004
Figure 5. Layer description and spectral properties of the case studies from exterior to interior (a) Case 1: A1: planiclear 8 + 8 mm/24 mm water/A2: planiclear 8 + 8 mm, Low-E/16 mm argon/A3: planiclear 6 + 6 mm. (b) Case 2: A1: diamant glass 10 mm/16 mm argon/A2: Low-E, planiclear 8 + 8 mm/24 mm water/A3: planiclear 8 + 8 mm. (c) Case 3: diamant glass 10 mm, reflective coating/16 mm argon/A2: planiclear 8 + 8 mm/24 mm water/A3: planiclear 8 + 8 mm.
Sustainability 17 09669 g005
Figure 6. Description of experimental prototype with a WFG facade.
Sustainability 17 09669 g006
Figure 7. Temperature Conditions and Solar Irradiance Settings for WFG Panel scenarios: (a) WFG panel at steady state. The solar irradiance (I) is constant and oriented perpendicularly to the panel; (b) WFG panel at transient state. The solar irradiance (I) is given by a weather file; (c) WFG facade in an insulated room at transient state. The solar irradiance (I) is given by a weather file.
Sustainability 17 09669 g007
Figure 8. Case 2 and Case 3. Results from the tool of a panel of WFG under transient conditions in winter days and summer days.
Sustainability 17 09669 g008
Figure 9. Case 2 and Case 3. Results from the tool of a WFG facade in an insulated room under transient conditions in winter days and summer days.
Sustainability 17 09669 g009
Figure 10. Thermal output of an insulated room. Cases 2 and 3 tested under transient conditions with the studied Tool and IDA-ICE.
Sustainability 17 09669 g010
Figure 11. Results from experimental prototype over three days in summer.
Sustainability 17 09669 g011
Figure 12. Comparative results from the simulation tools and the experimental setup on a summer day (θINLET Tool = 17 °C; Volume of the Prototype is different from the Volume of the digital model in the simulation tool).
Sustainability 17 09669 g012
Figure 13. Comparative results from the simulation tool and the experimental setup on a summer day (θINLET Tool = 17 °C; Volume of the Prototype = Volume of the digital model in the simulation tool).
Sustainability 17 09669 g013
Figure 14. Comparative results from the simulation tools and the experimental setup on a summer day (θINLET Tool = θINLET Prototype; Volume of the Prototype = Volume of the digital model in the simulation tool).
Sustainability 17 09669 g014
Table 1. Variables involved in the WFG model.
ArgumentTypeRoleDescription
RADirInRadinExterior beam solar radiation perpendicular to the glazing [W/(m2)]
RADiffInRadinExterior diffuse solar radiation [W/(m2)]
RBDirInRadinInterior beam radiation perpendicular to the glazing [W/(m2)]
RBDiffInRadinInterior diffuse irradiance [W/(m2)]
RADirOutRadoutExterior beam solar radiation perpendicular to the Glazing [W/(m2)]
RADiffOutRadoutExterior diffuse solar radiation [W/(m2)]
RBDirOutRadoutInterior beam radiation perpendicular to the glazing [W/(m2)]
RBDiffOutRadoutInterior diffuse irradiance [W/(m2)]
TsoutTempinExterior Surface window temperature [°C]
QeHeatFluxoutExterior heat flux [W/(m2)]
TsinTempinInterior Surface window temperature [°C]
QiHeatFluxoutInterior heat flux [W/(m2)]
TeTempinExterior temperature [°C]
QABackCvHeatFluxoutBack convection from the window curtains, in this model is set to zero [W/(m2)]
TiTempinInterior temperature [°C]
QBBackCvHeatFluxoutBack convection from the window curtains, in this model is set to zero [W/(m2)]
TinTempinInlet water temperature [°C]
TwTempoutOutlet water temperature [°C]
PHeatFluxoutPower obtained [W/(m2)]
flow rateMassFlowinFlow rate in the water chamber [kg/(s m2)]
ElevSunAngleinAngle of sun elevation in radians
AzimutSunAngleinAngle of sun azimuth in radians
WindVelVelinLocal wind speed [m/s]
ID WFGFactorS_PWFG identifier (Case 1 = 1; Case 2 = 2; Case 3 = 3;
Case 4 = 4).
AWindowAreaS_PWindow area
cHeatcpS_PHeat capacity of the fluid
azimutWindAngleS_PAzimuth of window surface
slopeWindAngleS_PSlope of window surface
deg2radFactorC_PConversion factor from Deg to Rad
rad2degFactorC_PConversion factor from Rad to Deg
Table 2. Spectral and Thermal parameters of WFG ( = 0.028 kg/(s m2) 1.
GlazingA1A2A3AwAvTUi
W/(m2K)
Ue
(W/(m2K)
U
(W/(m2K)
Uw
(W/(m2K)
g
Case 10.6850.0330.0120.0040.510.200.9915.750.1280.9770.22
Case 20.0690.4320.0190.0020.440.216.891.080.0666.4590.24
Case 30.2910.0280.0190.0010.060.216.891.080.0636.4620.22
1 density of the fluid: 850 kg/(m3).
Table 3. Indoor and outdoor steady conditions.
Seasonθe
(°C)
θi
(°C)
θINLET
(°C)
he
W/(m2 °C)
hi
W/(m2 °C)
hg
W/(m2 °C)
hw
W/(m2 °C)
Ib
W/(m2)
Id
W/(m2)
Winter021212381.16506000.0
Summer3528172381.16508000.0
Table 4. Outputs of the Case Studies from the studied tool.
SeasonGlazingWHG
W/(m2)
TIb
W/(m2)
qi
W/(m2)
θINLET
(°C)
θOUTLET
(°C)
WinterCase 119.9123.77.42121.2
Case 2227.4128.413.72122.9
Case 312.9129.22.62121.1
SummerCase 1556.1164.93.51721.6
Case 2413.3171.2−44.41720.4
Case 3127.2172.3−59.21718.1
Table 5. Winter outputs in steady state of the case studies from the studied tool and IDA-ICE in an insulated square room.
SoftwareGlazingWHG
W/(m2)
TIb
W/(m2)
qi
W/(m2)
θINLET
(°C)
θOUTLET
(°C)
Tool 1Case 1130.4123.7105.12122.1
Case 2355.6128.3109.02124.1
Case 3133.4129.2109.82122.1
IDA-ICECase 1125.0123.7108.92121.8
Case 2354.2128.4111.12123.9
Case 3128.6129.4113.12122.1
1 ISO model and constant hi and he.
Table 6. Summer outputs in steady state of the case studies from the studied tool and IDA-ICE in an insulated square room.
SoftwareGlazingWHG
W/(m2)
TIb
W/(m2)
qi
W/(m2)
θINLET
(°C)
θOUTLET
(°C)
Tool 1Case 1697.1164.9140.11722.8
Case 2532.2171.1145.41721.5
Case 3232.0172.3146.41718.9
IDA-ICECase 1642.7164.9145.11722.4
Case 2520.9171.2148.21721.3
Case 3220.5172.3150.81718.8
1 ISO model and constant hi and he.
Table 7. Root Mean Square Error and Normalized Root Mean Square Error for hourly results comparing IDA-ICE and the studied tool.
RMSE(θi)nARi > 0 (θi)NRMSE(θi)RMSE(WHG)nARi > 0 (WHG)NRMSE(WHG)
Case 21.28876.6017.219526.97
Case 31.20876.1410.448532.69
Table 8. Root Mean Square Error, Normalized Root Mean Square Error, and R2 for hourly results comparing results from the prototype and the studied tool.
Volume (Tool)θINLET ToolRMSE(θi)nARi > 0 (θi)NRMSE(θi)R2(θi)
Iteration 17 m × 7 m × 3 m17 °C3.205025.060.43
Iteration 21 m × 1 m × 0.75 m17 °C2.345010.990.81
Iteration 31 m × 1 m × 0.75 mθINLET Prototype0.51502.410.97
Disclaimer/Publisher’s Note: The statements, opinions and data contained in all publications are solely those of the individual author(s) and contributor(s) and not of MDPI and/or the editor(s). MDPI and/or the editor(s) disclaim responsibility for any injury to people or property resulting from any ideas, methods, instructions or products referred to in the content.