1. Introduction
The merging of virtual space and physical space fundamentally reshaped the landscape of cultural, social, and economic activities, and it has significantly affected social networks and urban structures [
1]. Advances in technology have enabled individuals across different regions and economic contexts to engage in a wide array of services and activities online. The COVID-19 pandemic, declared a global pandemic by the World Health Organization (WHO) [
2], has accelerated this digital transformation. Initially detected in Wuhan, China in late 2019, COVID-19 rapidly spread worldwide, profoundly impacting socio-economic activities and urban structures [
3]. The pandemic-induced lockdowns compelled individuals to adjust to a new lifestyle, moving many daily activities and services from physical to virtual spaces. While past pandemics have influenced socioeconomic structures [
4], COVID-19 exemplifies a contemporary case in which a public health crisis rapidly accelerated the adoption of digital solutions.
Urban mobility patterns were significantly disrupted by the pandemic. As governments imposed travel restrictions and encouraged remote work, commuting and personal travel drastically declined [
5,
6,
7,
8,
9]. Public transportation saw the steepest decline in usage, driven by the challenges of maintaining physical distancing on crowded buses and trains [
10,
11,
12]. In contrast, while walking decreased [
13], cycling saw a notable surge, particularly in Europe, North America, and Australia, as it allowed individuals to maintain social distancing while promoting physical health [
14,
15].
These lifestyle changes had notable environmental consequences. Global CO
2 emissions dropped by 17% during the pandemic [
16], with highly affected regions in the world experiencing up to a 30% reduction in pollution [
17,
18,
19]. Urban noise levels also dropped substantially [
20,
21,
22]. However, increases in ozone levels were observed, particularly in southern European cities and India, highlighting the complex nature of environmental impacts [
23,
24]. The pandemic further emphasized the importance of access to information and essential services during crises. This prompted research into the effects of COVID-19 on disaster evacuation [
25] and highlighted the role of timely information in supporting effective evacuation strategies, with implications for enhancing future resilience [
26,
27]. Concurrently, the rapid shift from physical to digital service platforms—including online shopping, teleworking, virtual meetings, and remote learning—reduced the need for in-person travel, easing pressure on transportation networks and contributing to lower CO
2 emissions.
The trend toward online shopping, which had already been growing before the pandemic, accelerated in response to mobility restrictions [
5]. Similarly, e-learning, enabled by ICT (Information and Communication Technologies), allowed students to participate in classes remotely [
9]. Teleworking has become an integral aspect of modern work–life arrangements, decreasing commuting demands and providing considerable environmental benefits [
16]. As a result, access to services is increasingly mediated through digital networks rather than traditional transport infrastructure, presenting both challenges and opportunities for urban planning and policy development.
Considering the rapid integration of technology into modern life and the widespread impacts of pandemics like COVID-19, understanding the substitutability of services in physical spaces with those in virtual spaces is crucial. An existing study [
1] investigated how digital service substitution and social networks influence sustainable urban structures, demonstrating that digital transformation can reshape social relationships and land-use patterns to inform future urban planning and modeling. However, that study has not focused on the effects of substitutability on the overall QOL, Gross Regional Happiness (GRH), and Decarbonization (De-CO
2), and how to evaluate QOL through both real and virtual networks. Meanwhile the current study, utilizing data from an internet questionnaire survey in Japan, deeply studies the substitution of physical services with virtual services, explores the causes, preferences of individuals, and presents a methodological framework to evaluate overall QOL through both real and virtual networks. Additionally, an existing study [
1] has conducted a binomial logistic regression on substitution behavior and residential relocation choices to assess how socio-demographic factors influence digital substitution, whereas the current study, building on the existing study [
1], seeks to emphasize integration of real and virtual networks into a QOL evaluation framework.
While numerous studies have evaluated living environment, QOL in physical spaces by evaluating perceived accessibility through transportation networks [
28,
29,
30,
31], relatively few have examined the impact of ICT on QOL [
32,
33]. Additionally, studies have focused on the value of physical interactions within digital service environments [
34], literature review on effects of digital technology on the QOL of elderly people [
35], or the impacts of perceived accessibility of travel behavior [
36]. Another study [
37] proposes a framework integrating physical and virtual accessibility to analyze how ICT use, accessibility, and demographics jointly affect engagement of individuals in physical and digital activities. However, to date, no study has fully developed a comprehensive methodology to evaluate QOL based on accessibility to services through both real and virtual networks. Such an approach is critical for ensuring equity and promoting sustainable urban development in the digital age.
Therefore, building on our previous empirical study that quantified the determinants of digital service substitution and social network transformation using logistic regression analysis [
1], the present paper extends this line of research by developing an integrated evaluation framework that connects real and virtual accessibility to Quality of Life (QOL) and sustainability outcomes. Hence, the overall objective of this study is to investigate the substitutability of six physical services with digital services and connect them with the development of a conceptual framework to integrate real and virtual networks with the QOL evaluation framework.
This study seeks to fill this gap by developing an integrated evaluation framework that evaluates QOL through both real and virtual accessibility components. It incorporates the findings from service access substitutability analysis and addresses the impact of digital transformation on pollution and decarbonization [
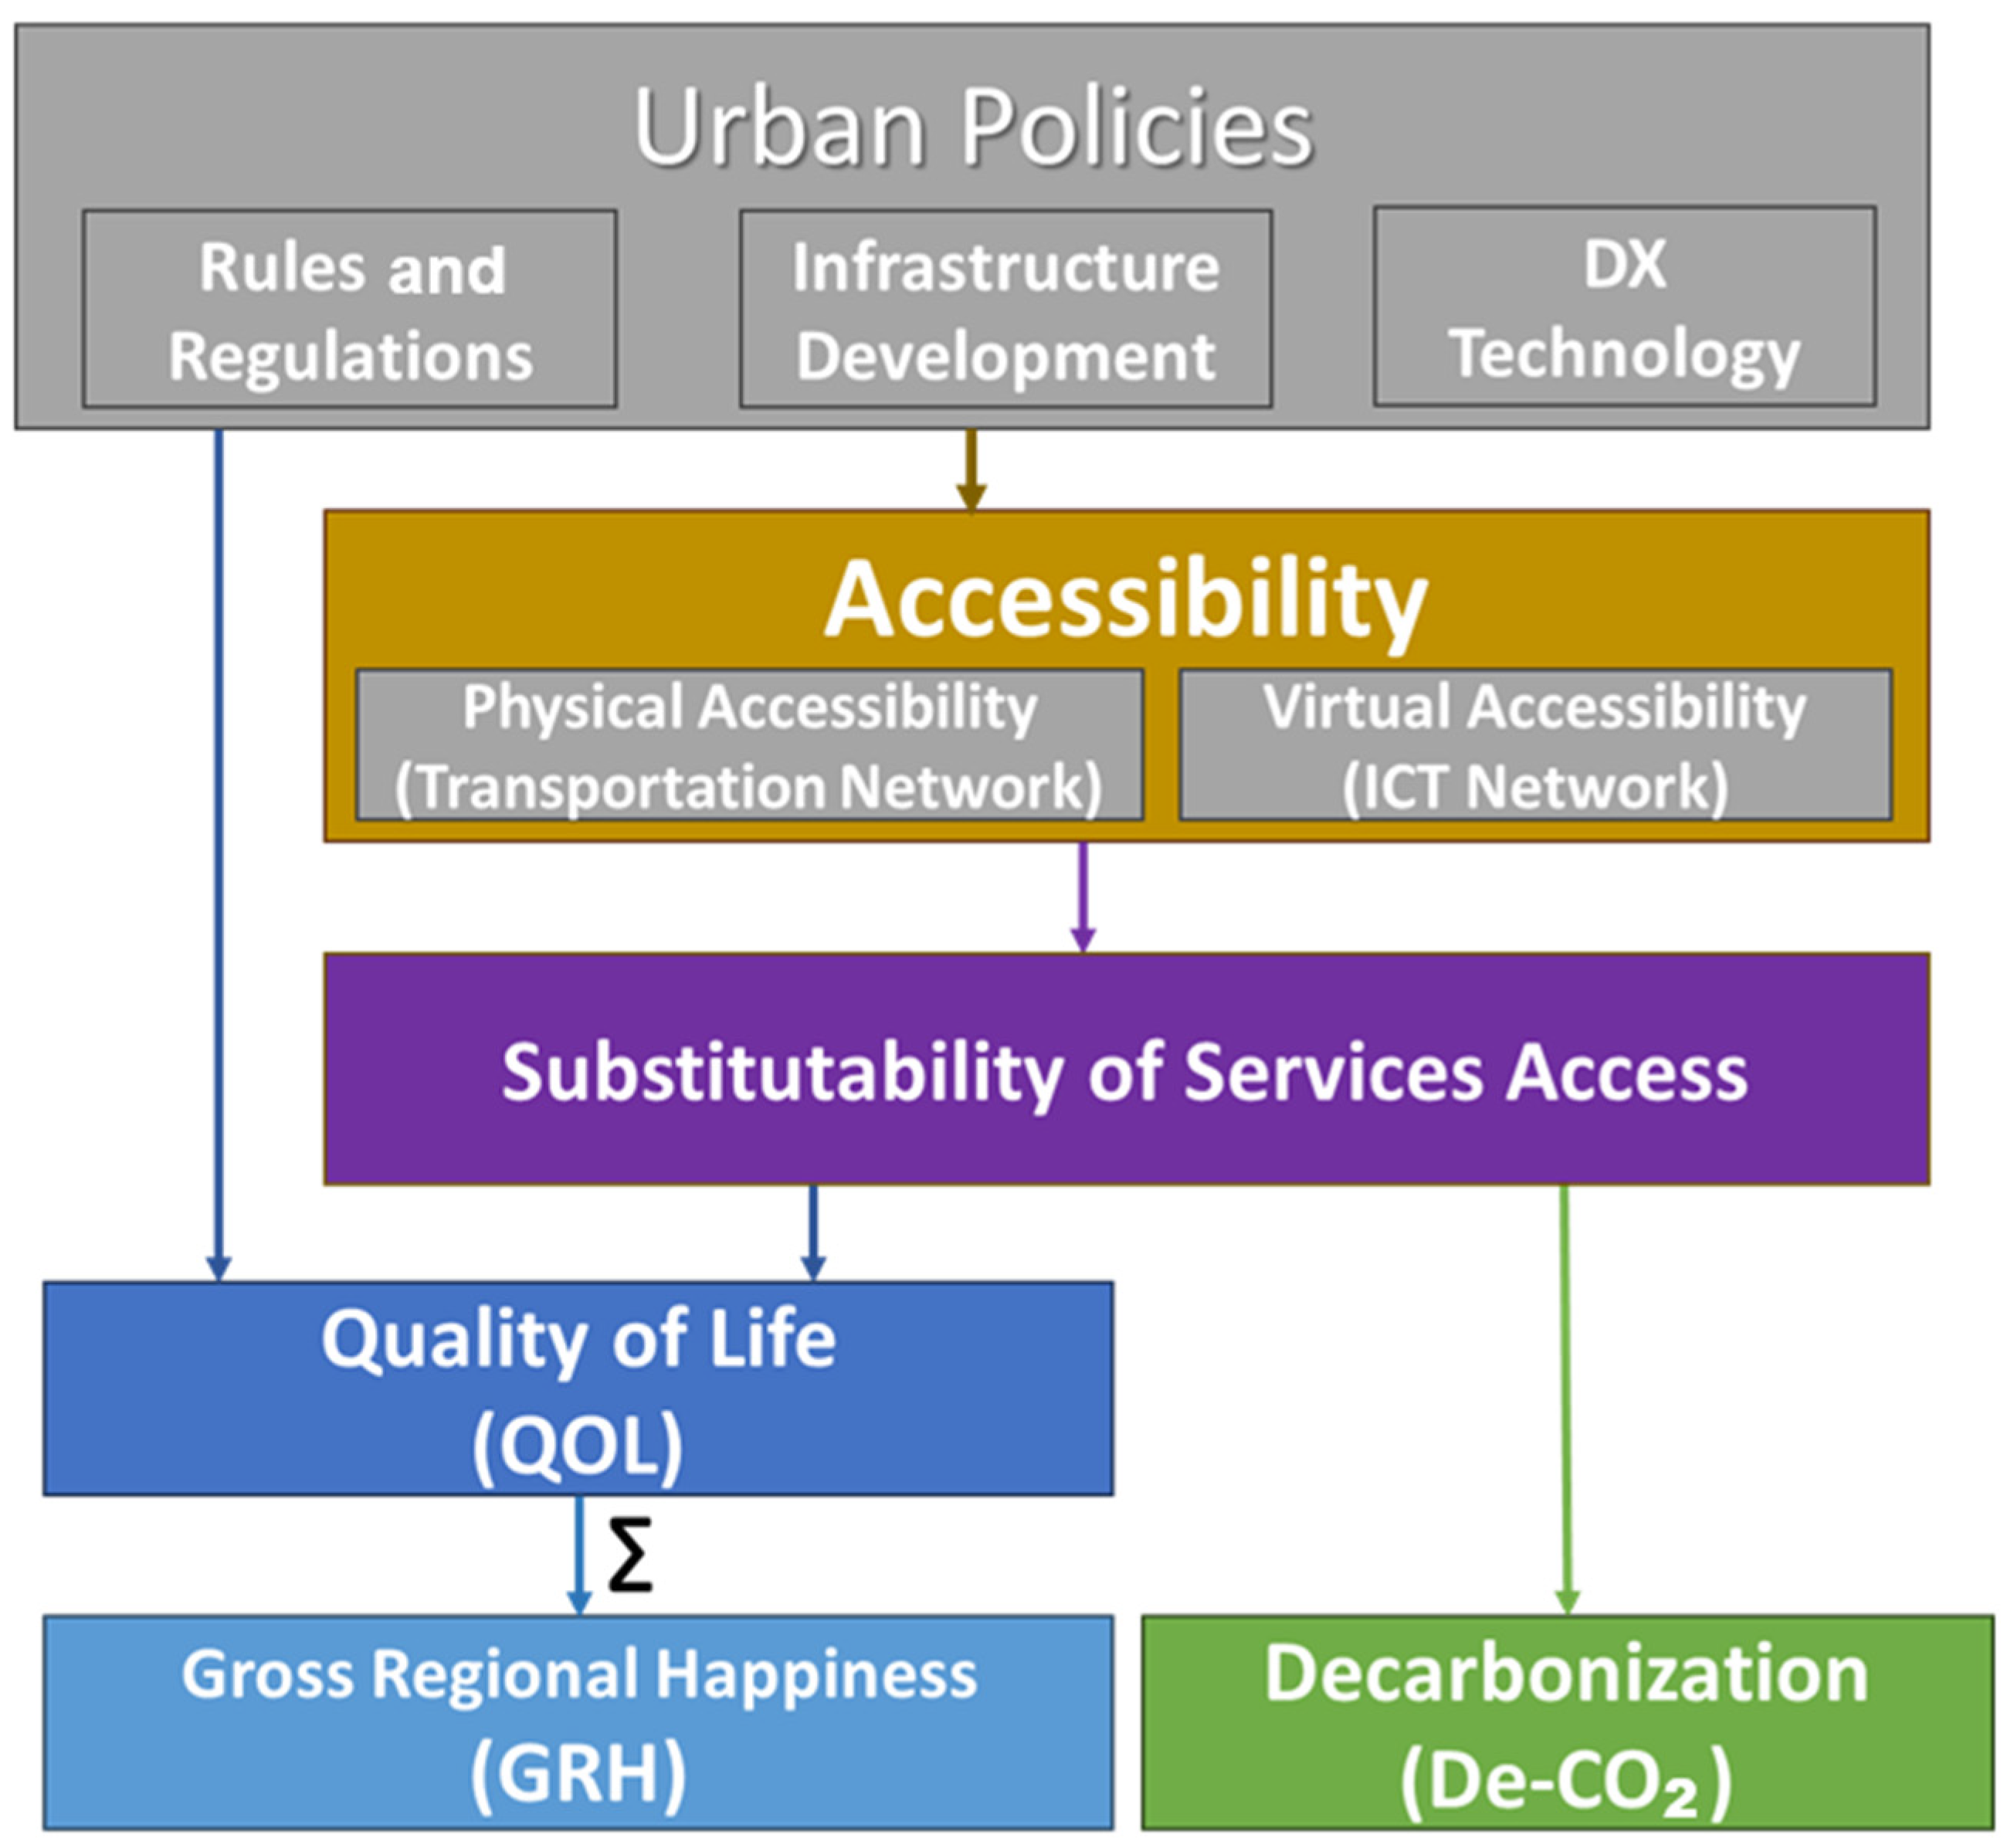
38]. The proposed conceptual framework evaluates urban structures, taking into account three core factors: accessibility, QOL, and De-CO
2. This comprehensive approach is vital for urban planners and decision-makers seeking to align urban policies with the United Nations Sustainable Development Goals (SDGs) 10 and 11.
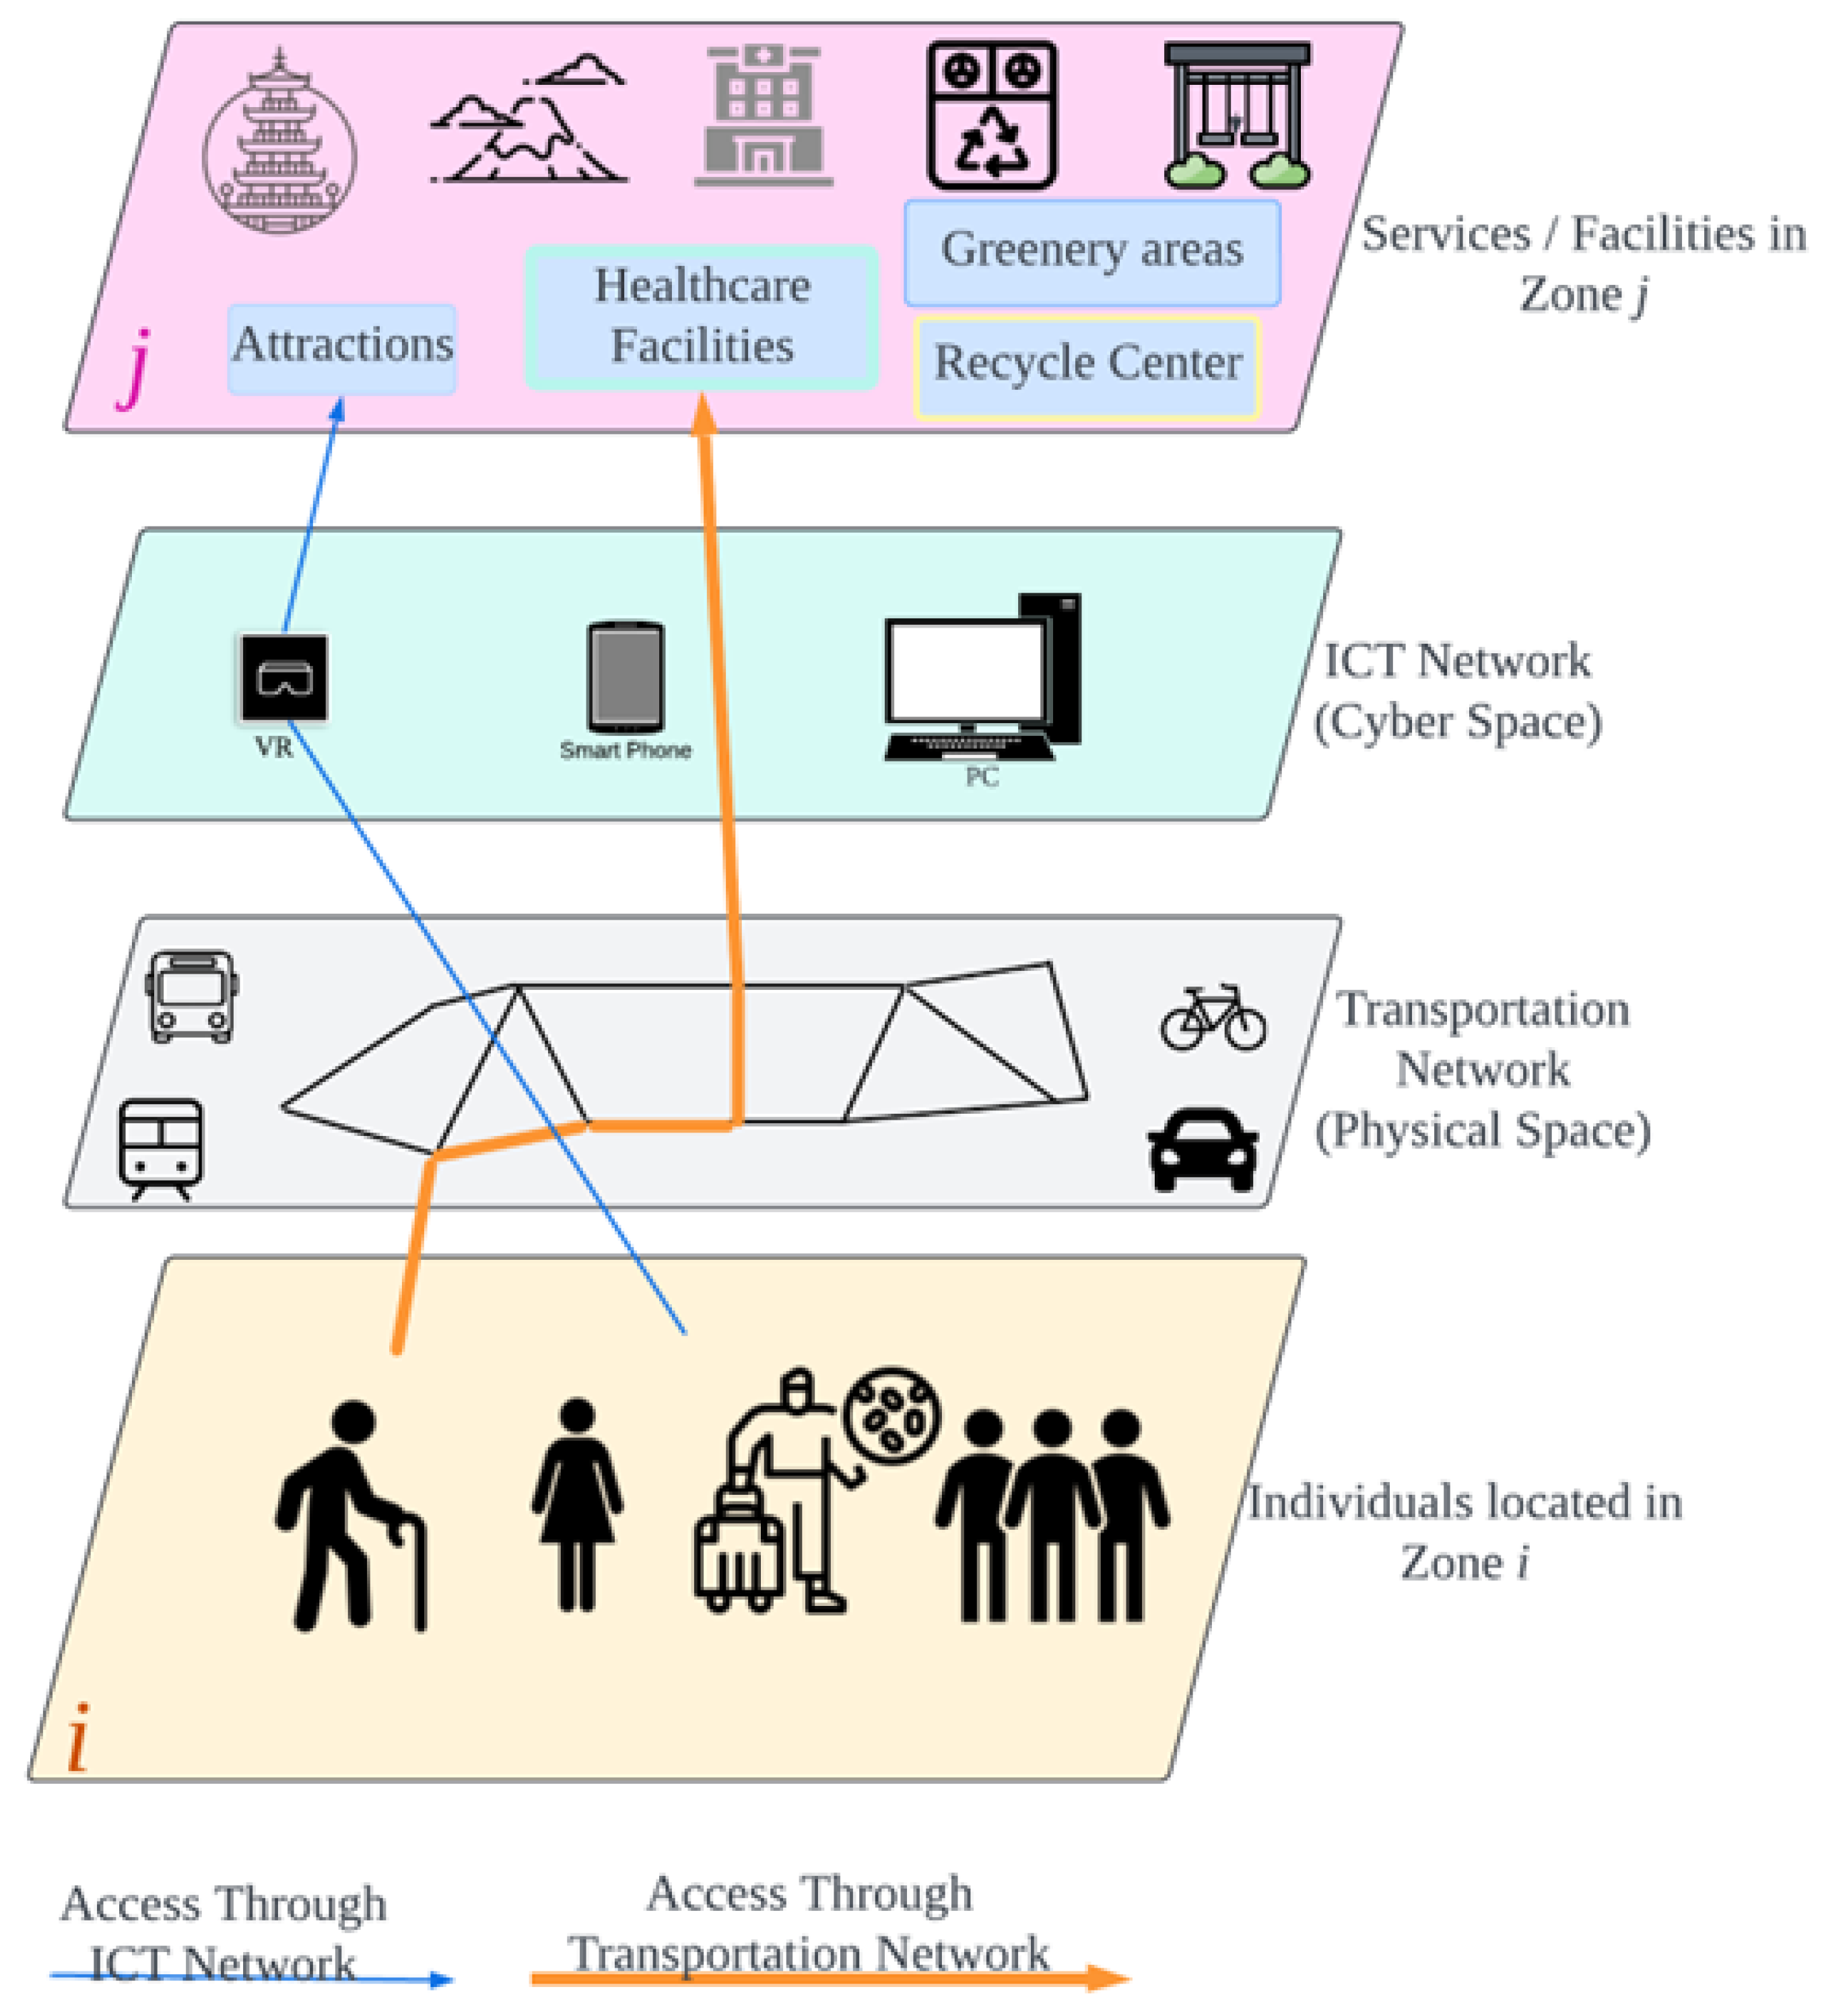
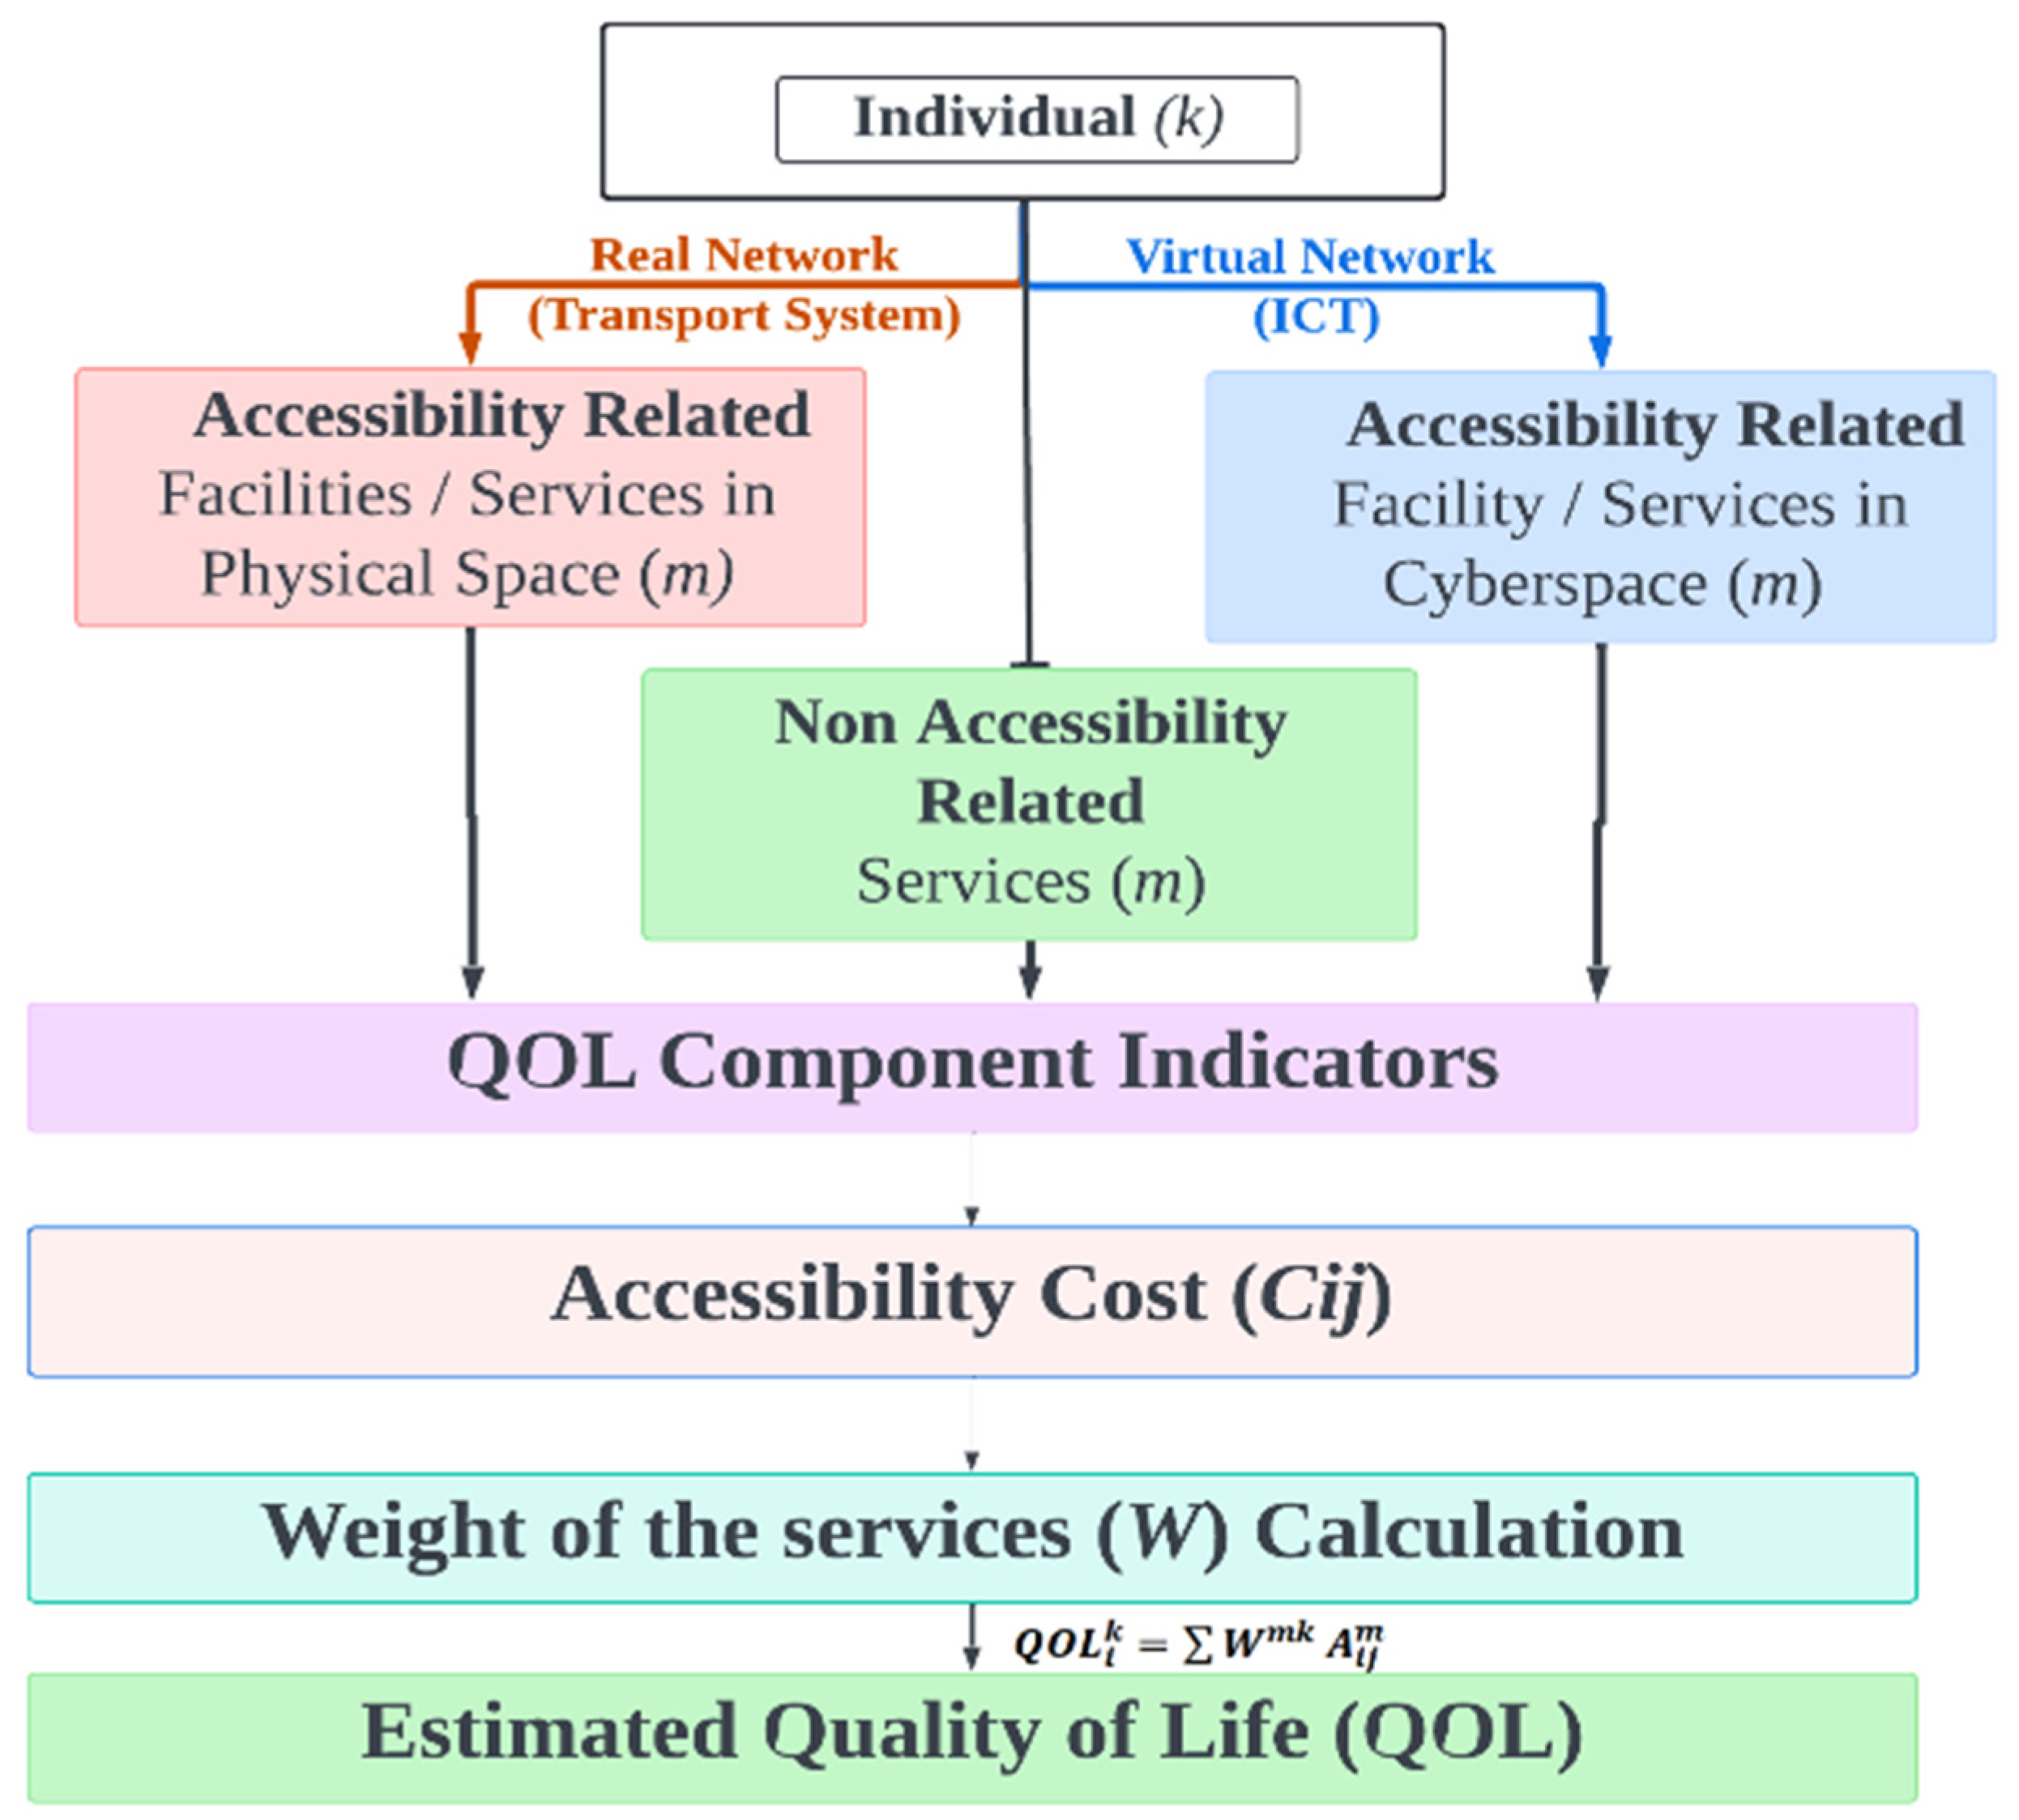
Traditionally, accessibility evaluations have focused on physical space, largely neglecting the role of virtual space. To bridge this gap, this study examines the substitutability of services reached via physical accessibility with those reached via virtual accessibility. The proposed QOL accessibility-based model adapts a model [
28] and modifies it to assess accessibility in two distinct environments: one governed by travel time and geography, and the other by digital connectivity, media availability, and cost.
By exploring the impact of substituting physical services with virtual ones, this study offers valuable insights into how access to services in physical and virtual networks influences both QOL and environmental sustainability. These findings provide critical tools for urban and transportation planners, offering a deeper understanding of the interplay between real and virtual networks and their effects on QOL and De-CO2. The insights gained are pivotal for informed decision-making in urban policy development and scenario evaluation.
The remainder of this paper is organized as follows:
Section 2 briefly presents the data collection method, analyzes the survey, and discloses the results of the survey.
Section 3 introduces the integrated evaluation methodology and concept, considering the substitutability of service accessibility, QOL, De-CO
2, and GRH (Gross Regional Happiness).
Section 4 presents the findings and provides a discussion. Lastly, the Conclusion summarizes this study and presents ideas for future research prospects.
3. Service Choice Behavior Evaluation
3.1. Physical Services and Digital Alternatives Value Analysis
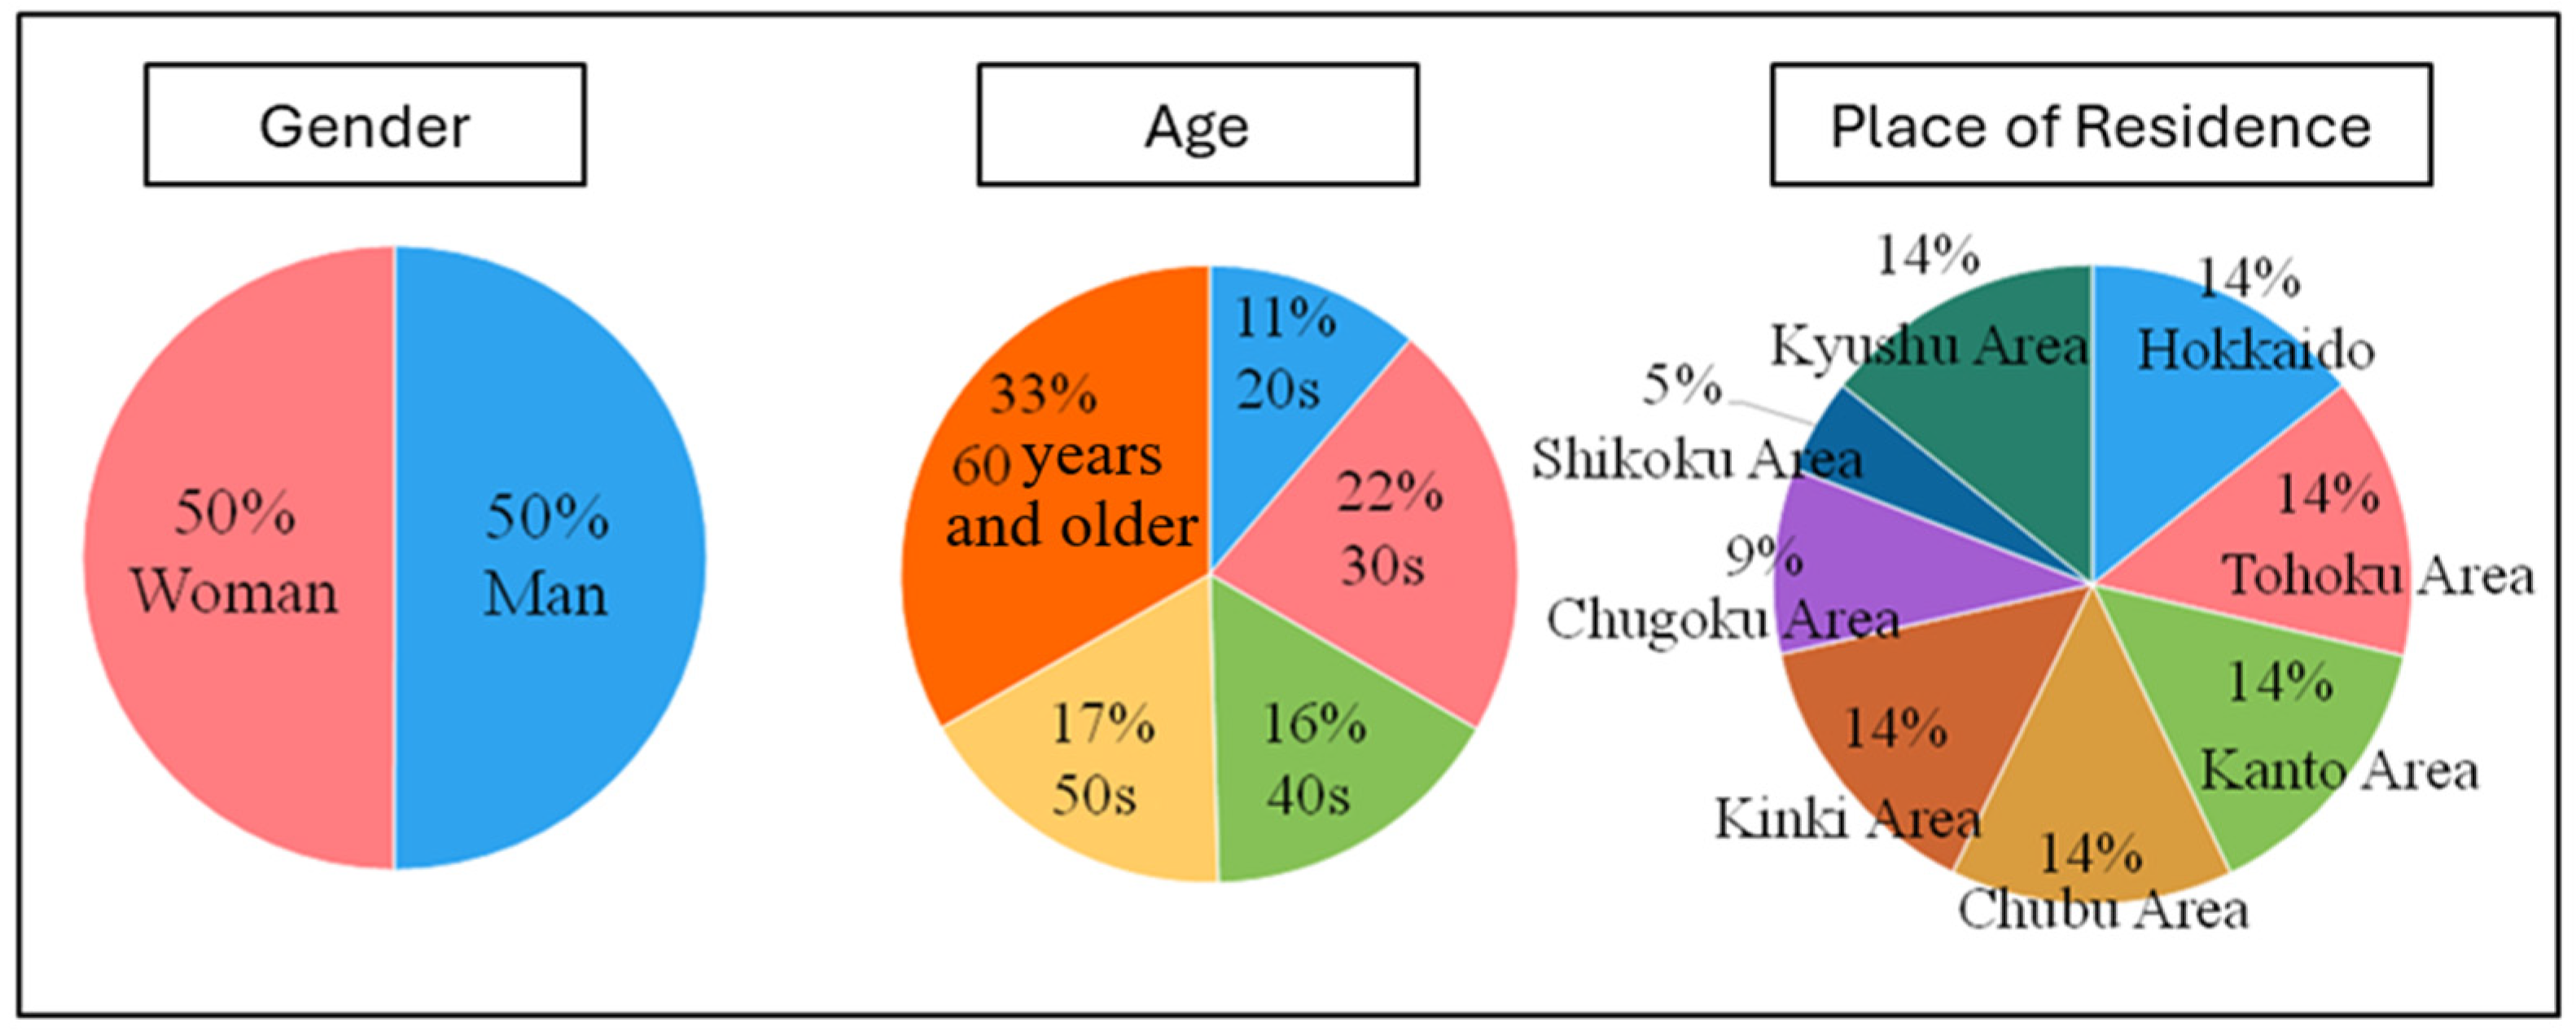
Using the data gathered from the web-based questionnaire survey, the study further explored the value of services provided in physical space and virtual space based on the preferences of individuals, considering several evaluation items. To evaluate the service values and analyze factors affecting the service value and preference of individuals, respondents were asked questions regarding their preference for physical and digital services, considering several items. Subsequently, the responses for each activity and service are aggregated and analyzed to understand the service choice behavior of individuals through real and virtual networks. This analysis is carried out to analyze the service choice behavior of individuals and investigate major factors influencing people to substitute their activities from real networks, which rely on transportation, to virtual networks, which rely on ICT. Six services, shopping, dining, working, schooling, hospital visits, and tourism are selected in this study.
3.1.1. Shopping
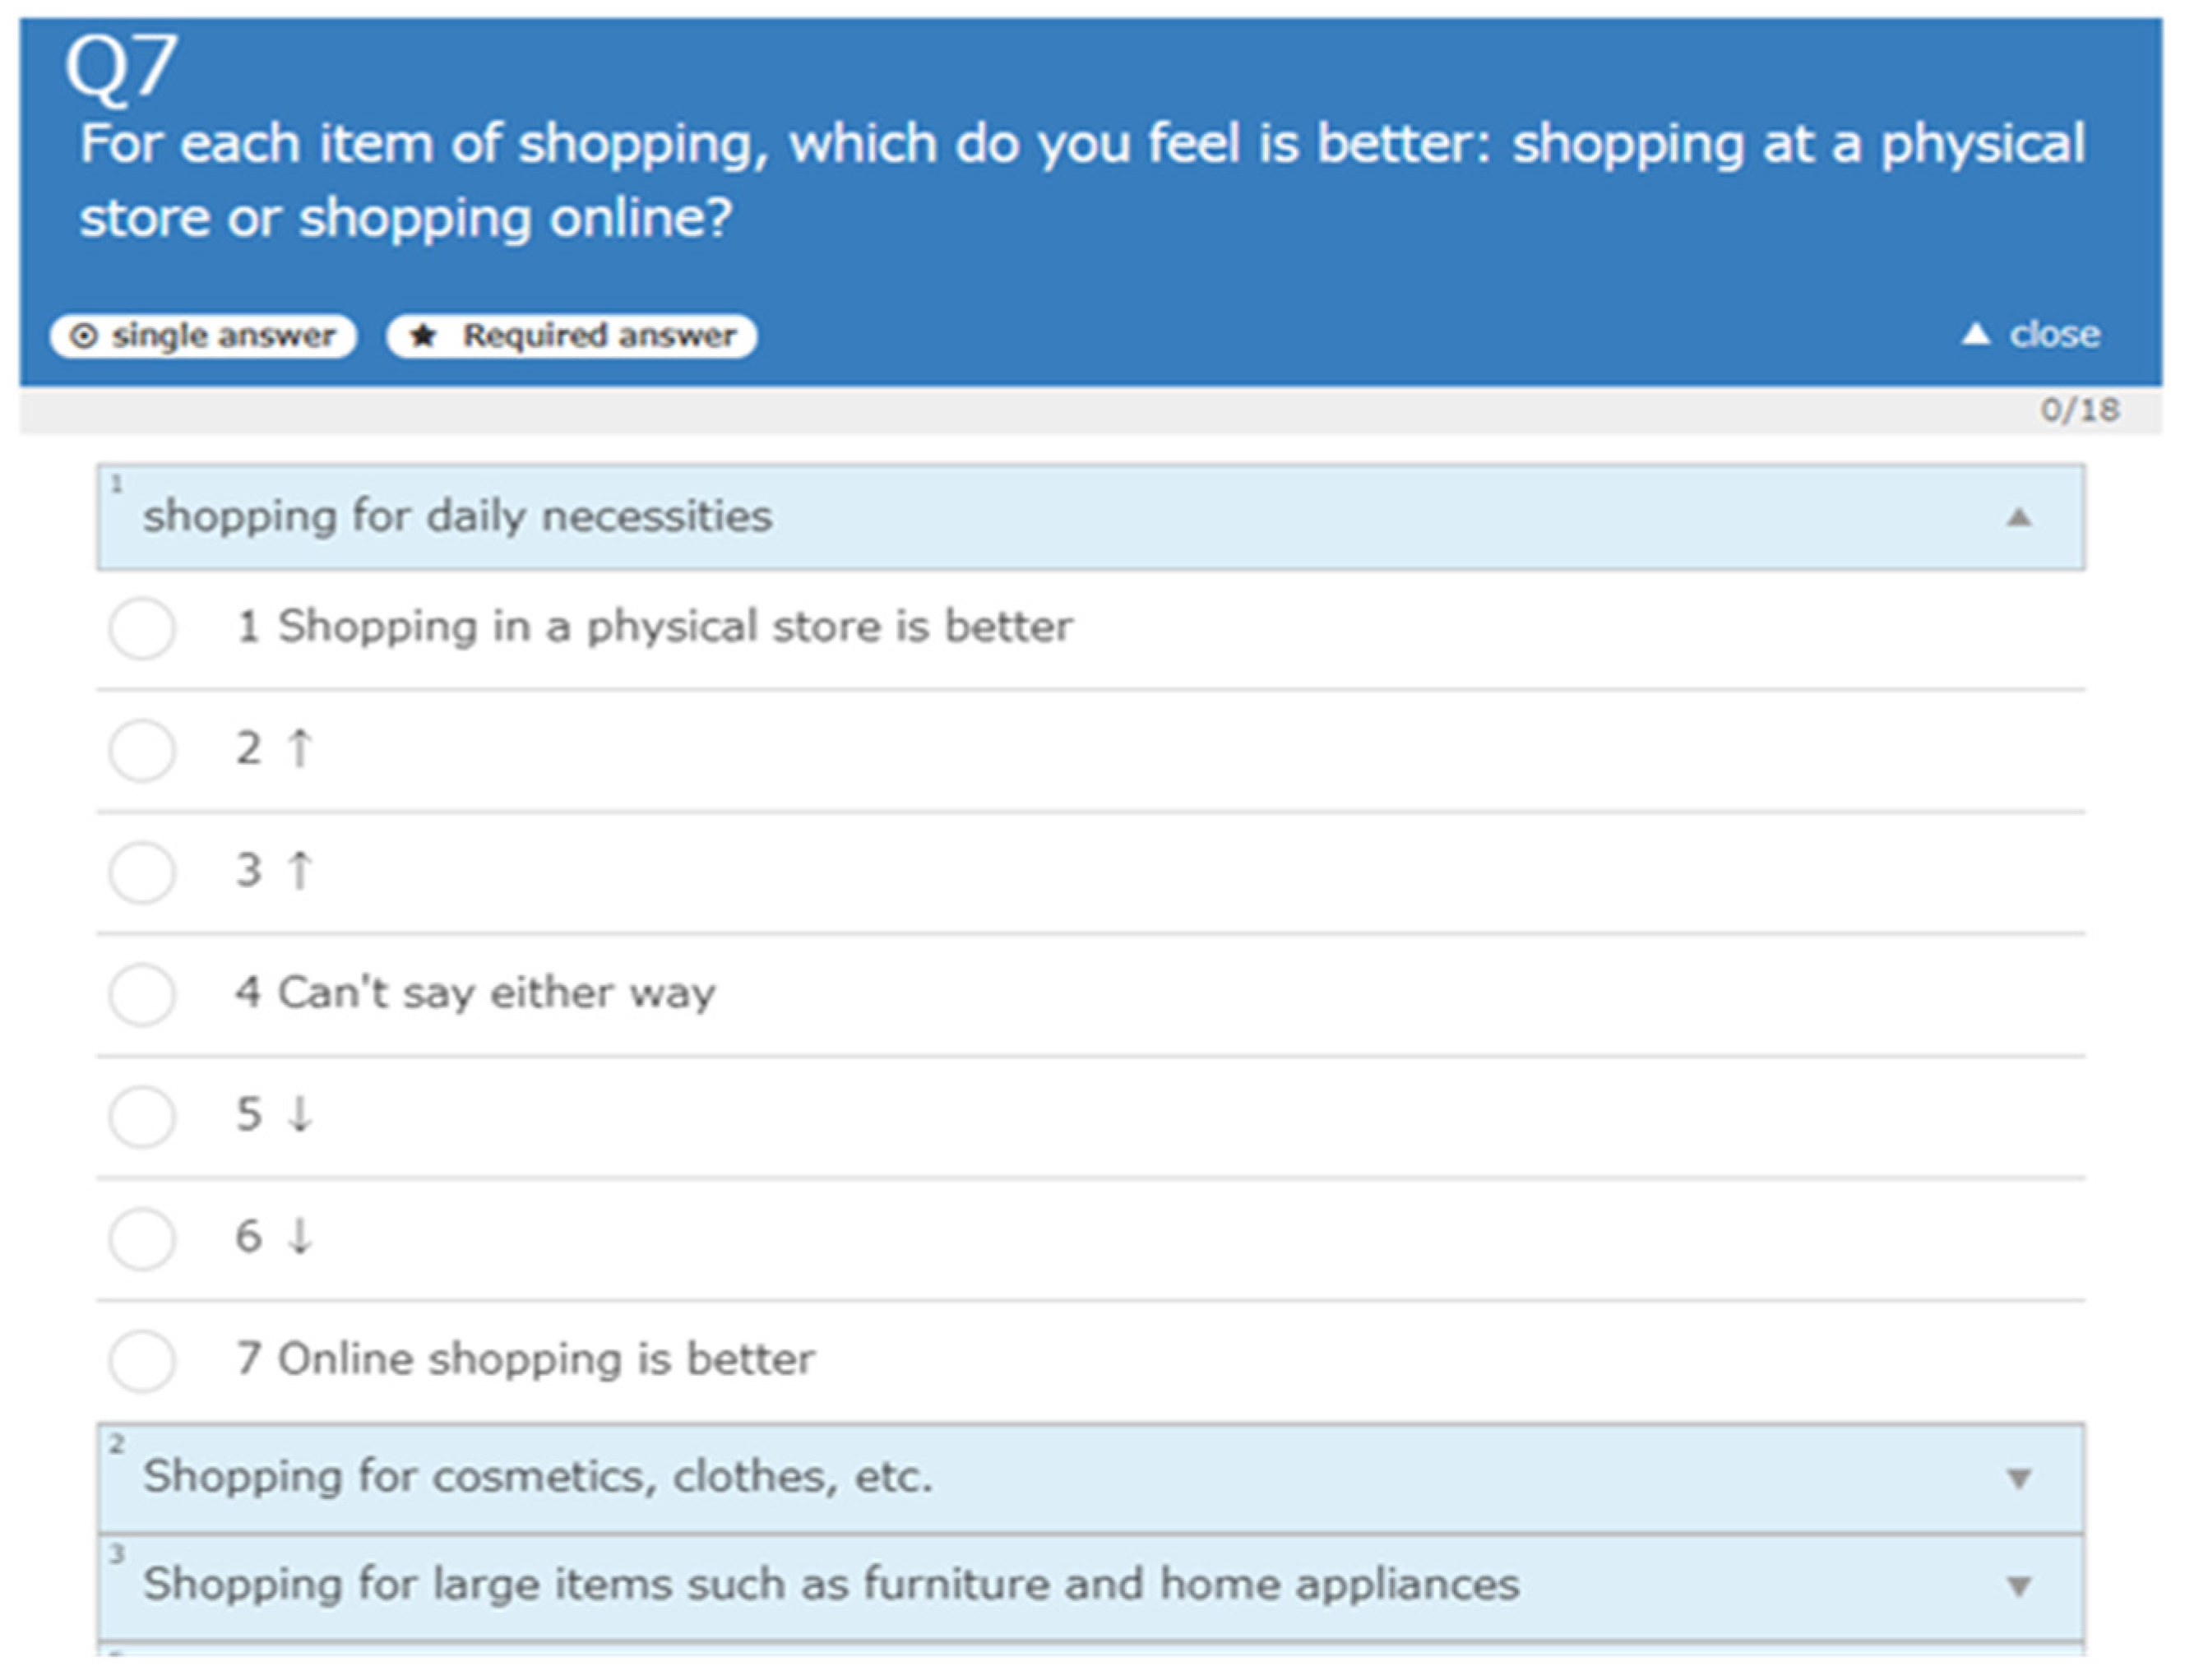
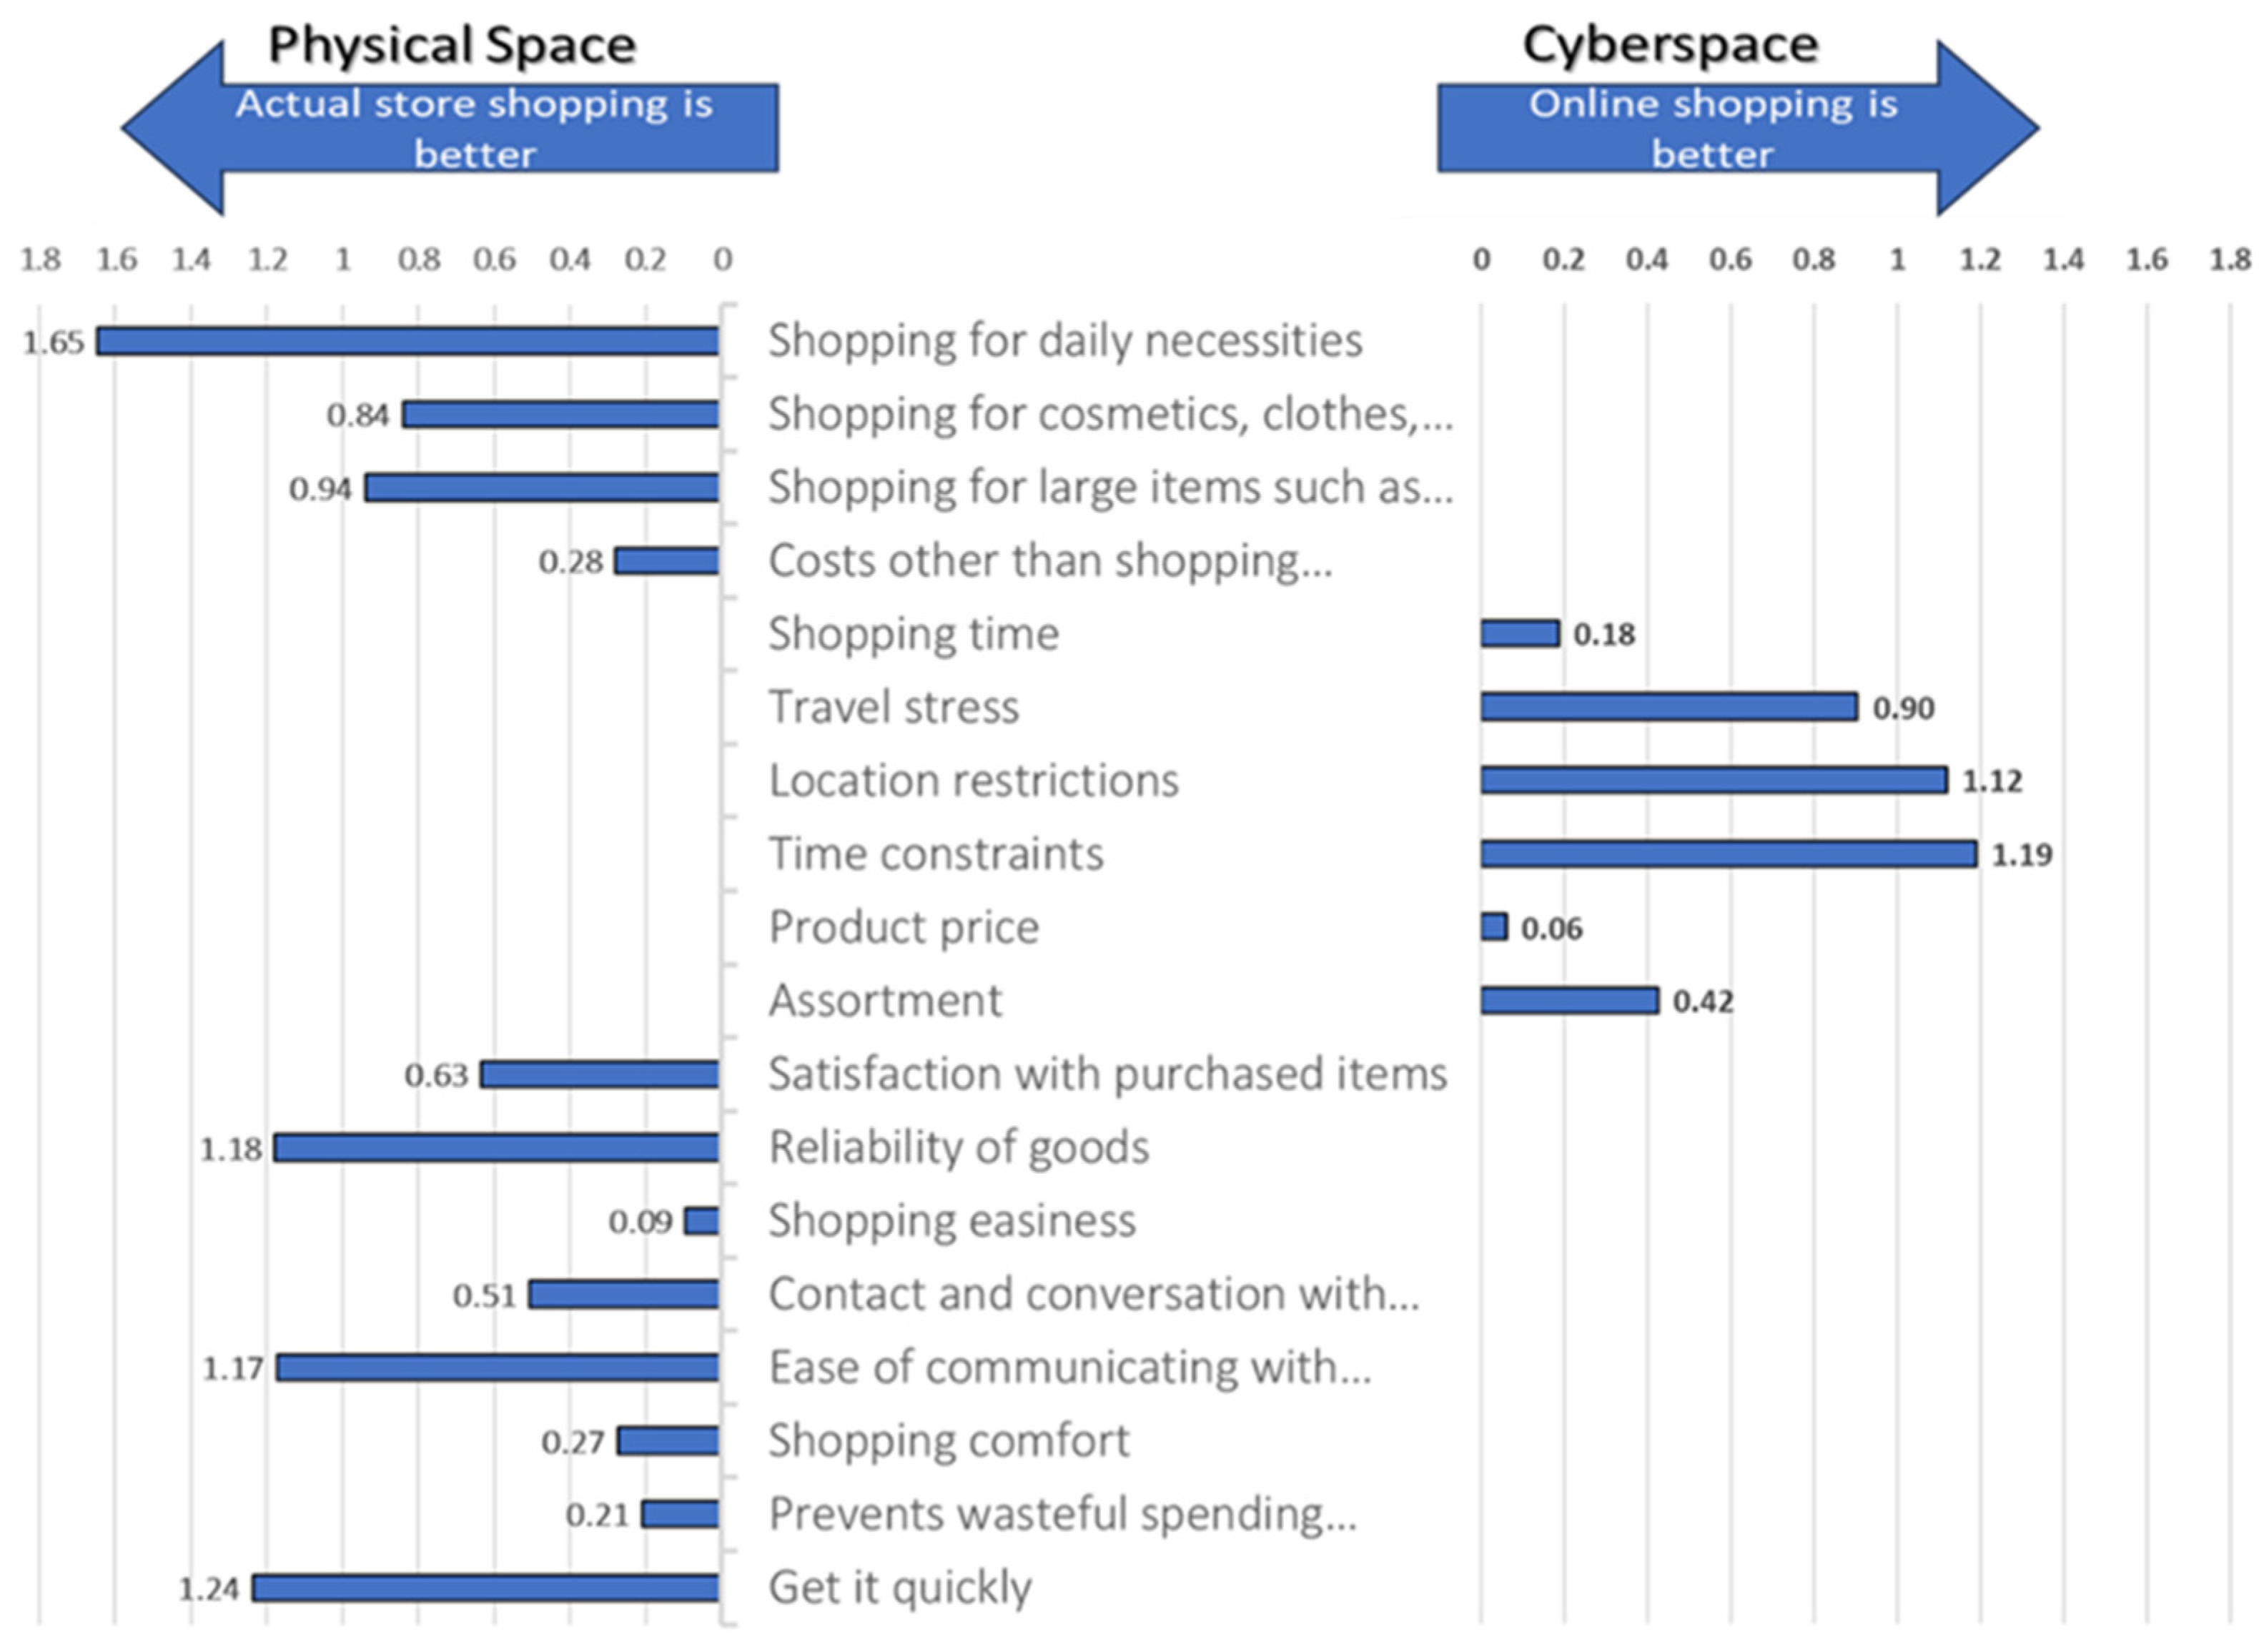
To evaluate the shopping service value either in physical space or virtual space, individuals were asked if they feel physical shopping is better or if online shopping is better, considering several evaluation items as shown in
Figure 4.
Figure 6 illustrates the result of the survey analysis for physical and online shopping services, and it is found that online shopping is preferred by individuals considering accessibility-related evaluation items such as shopping time, travel stress, location restrictions, and time constraints. In contrast, physical shopping is weighted higher in the case of non-accessibility-related evaluation items such as the type of shopping items, service satisfaction and convenience, and social interactions. The result confirms that accessibility-related factors can be the potential drivers of the substitution of physical services for digital alternatives in the case of shopping.
3.1.2. Dining
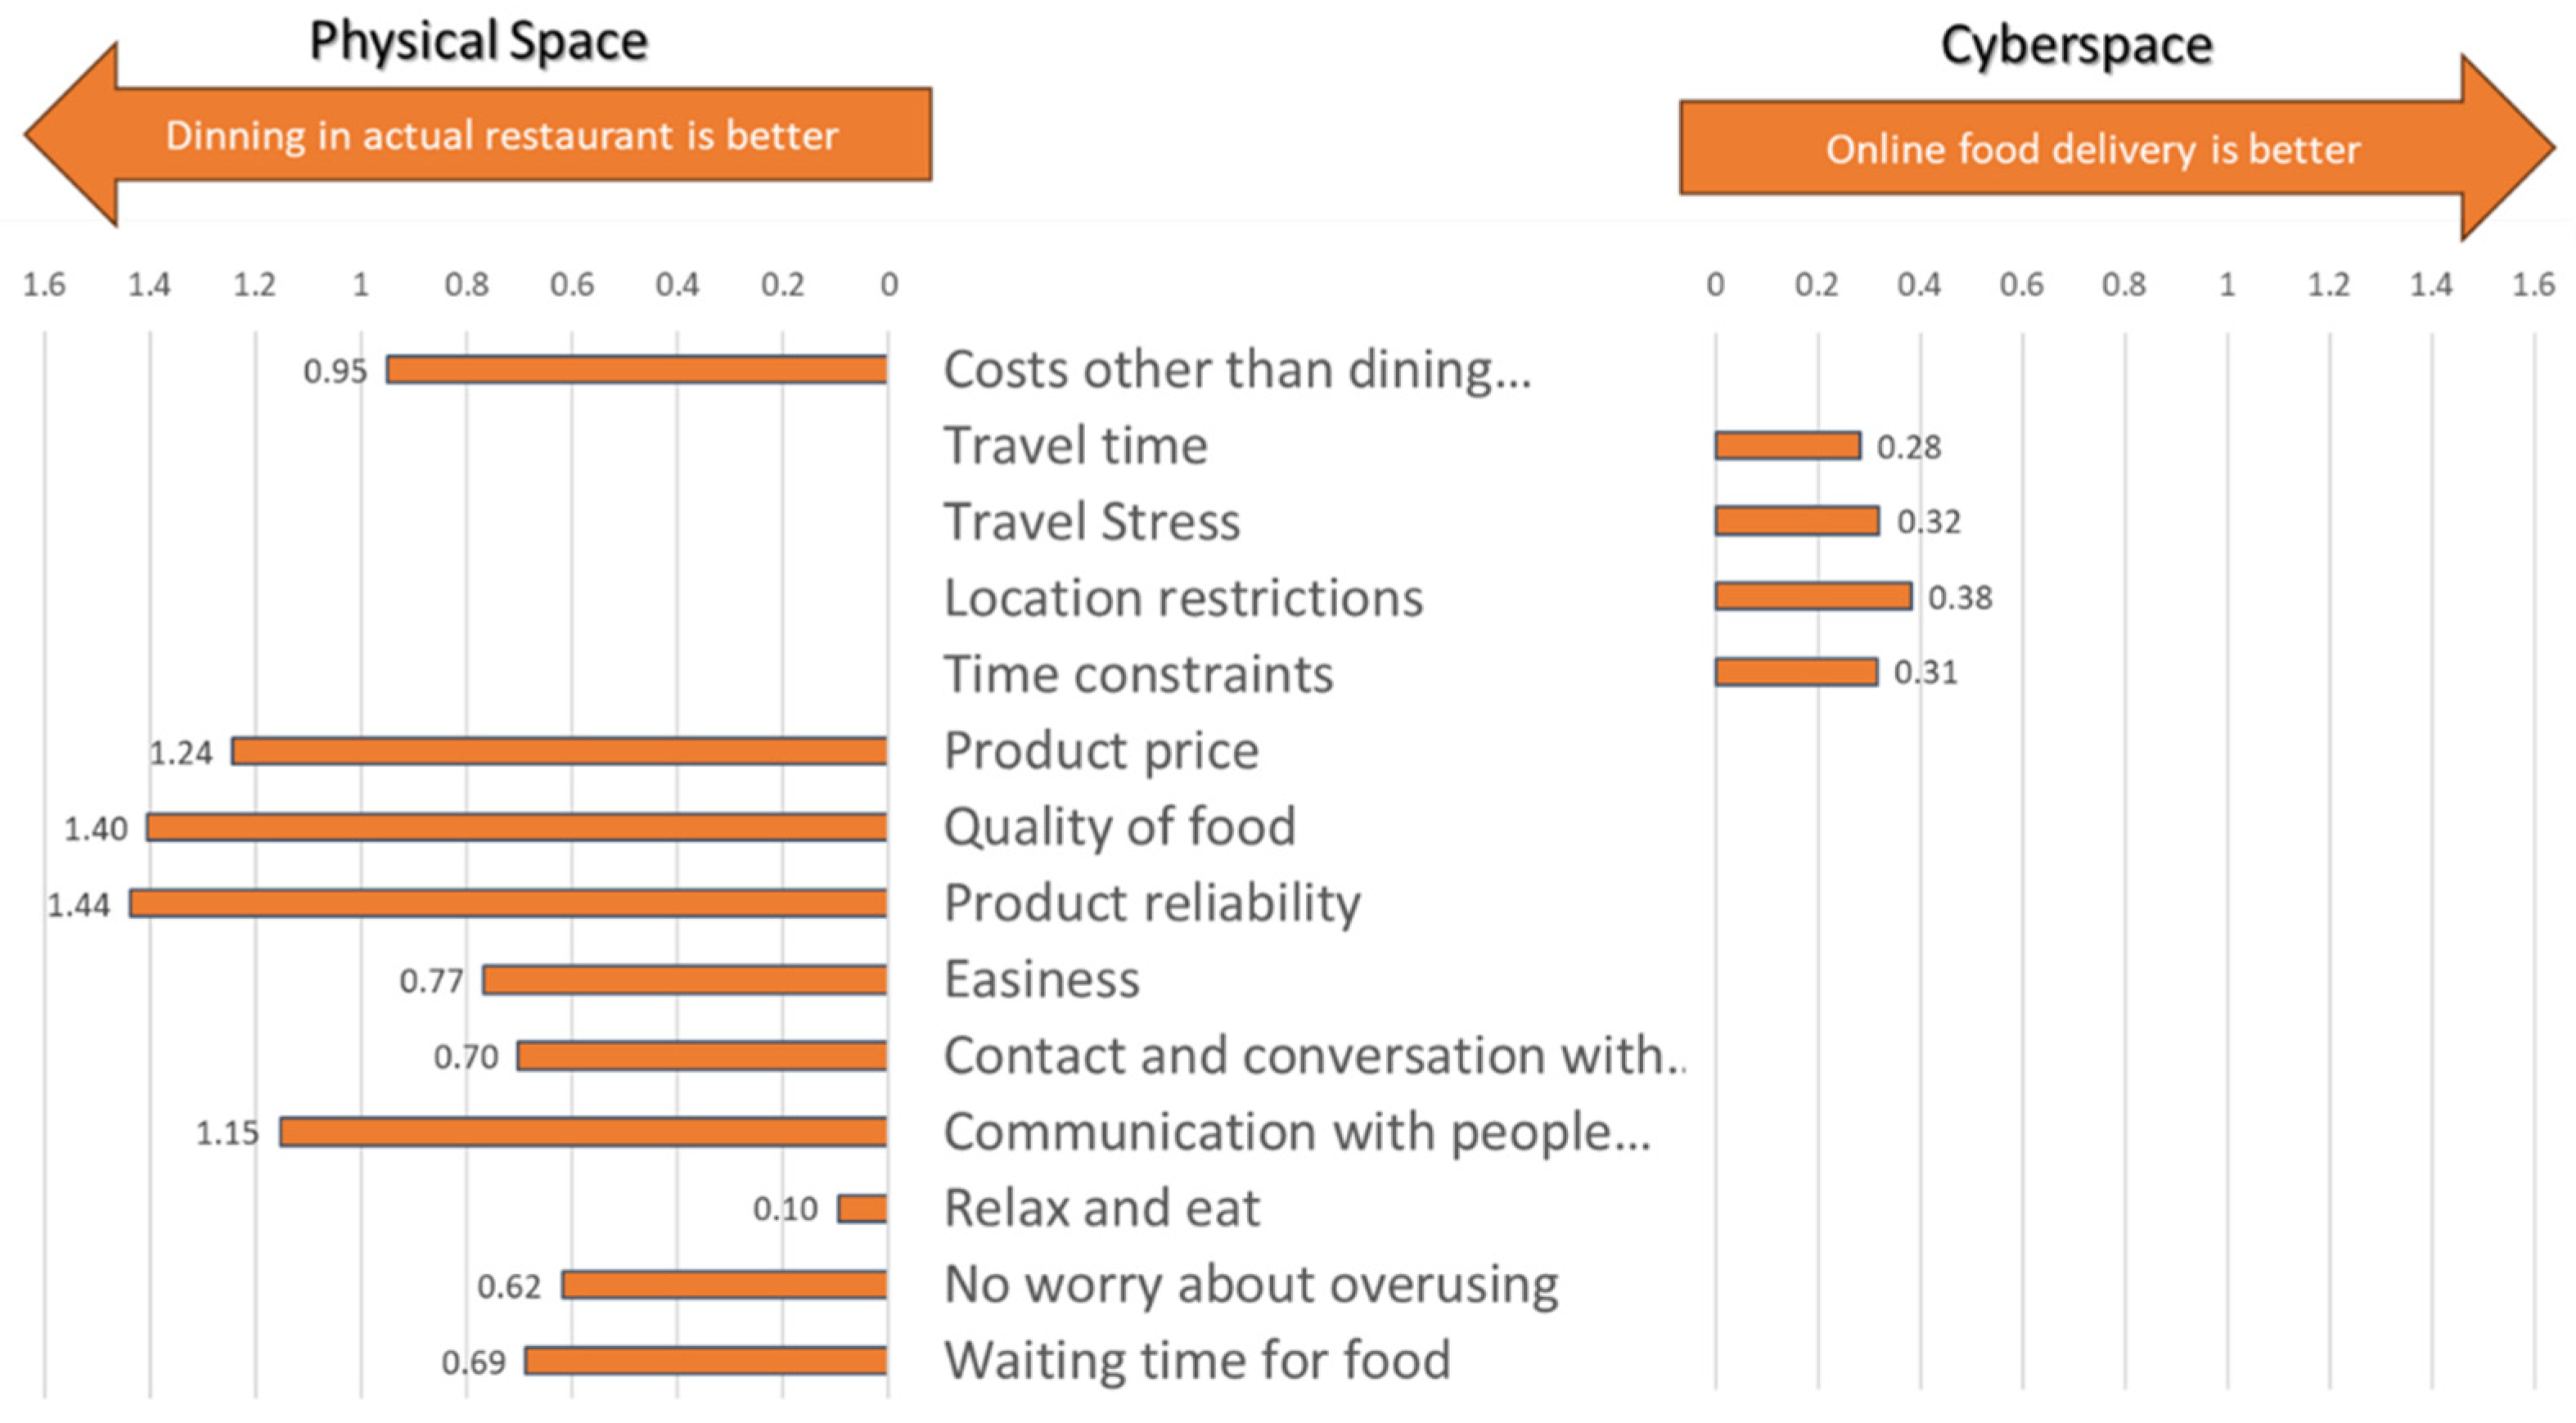
Individuals were asked if they feel physical (in-restaurant) dining is better or if online food delivery is better, considering several evaluation items. Physical (in-restaurant) dining refers to dining activities performed outside of the home. As shown in
Figure 7, the survey results disclose that, similar to shopping, online food delivery is preferred considering accessibility-related items such as travel time, travel stress, location, and time constraints. In contrast, dining in actual restaurants is preferred, considering the non-related accessibility items such as costs, quality, reliability, convenience, and social interactions. The result confirms that, similar to shopping, the digital alternative substitution is highly influenced by accessibility-related factors in the case of dining.
3.1.3. Working
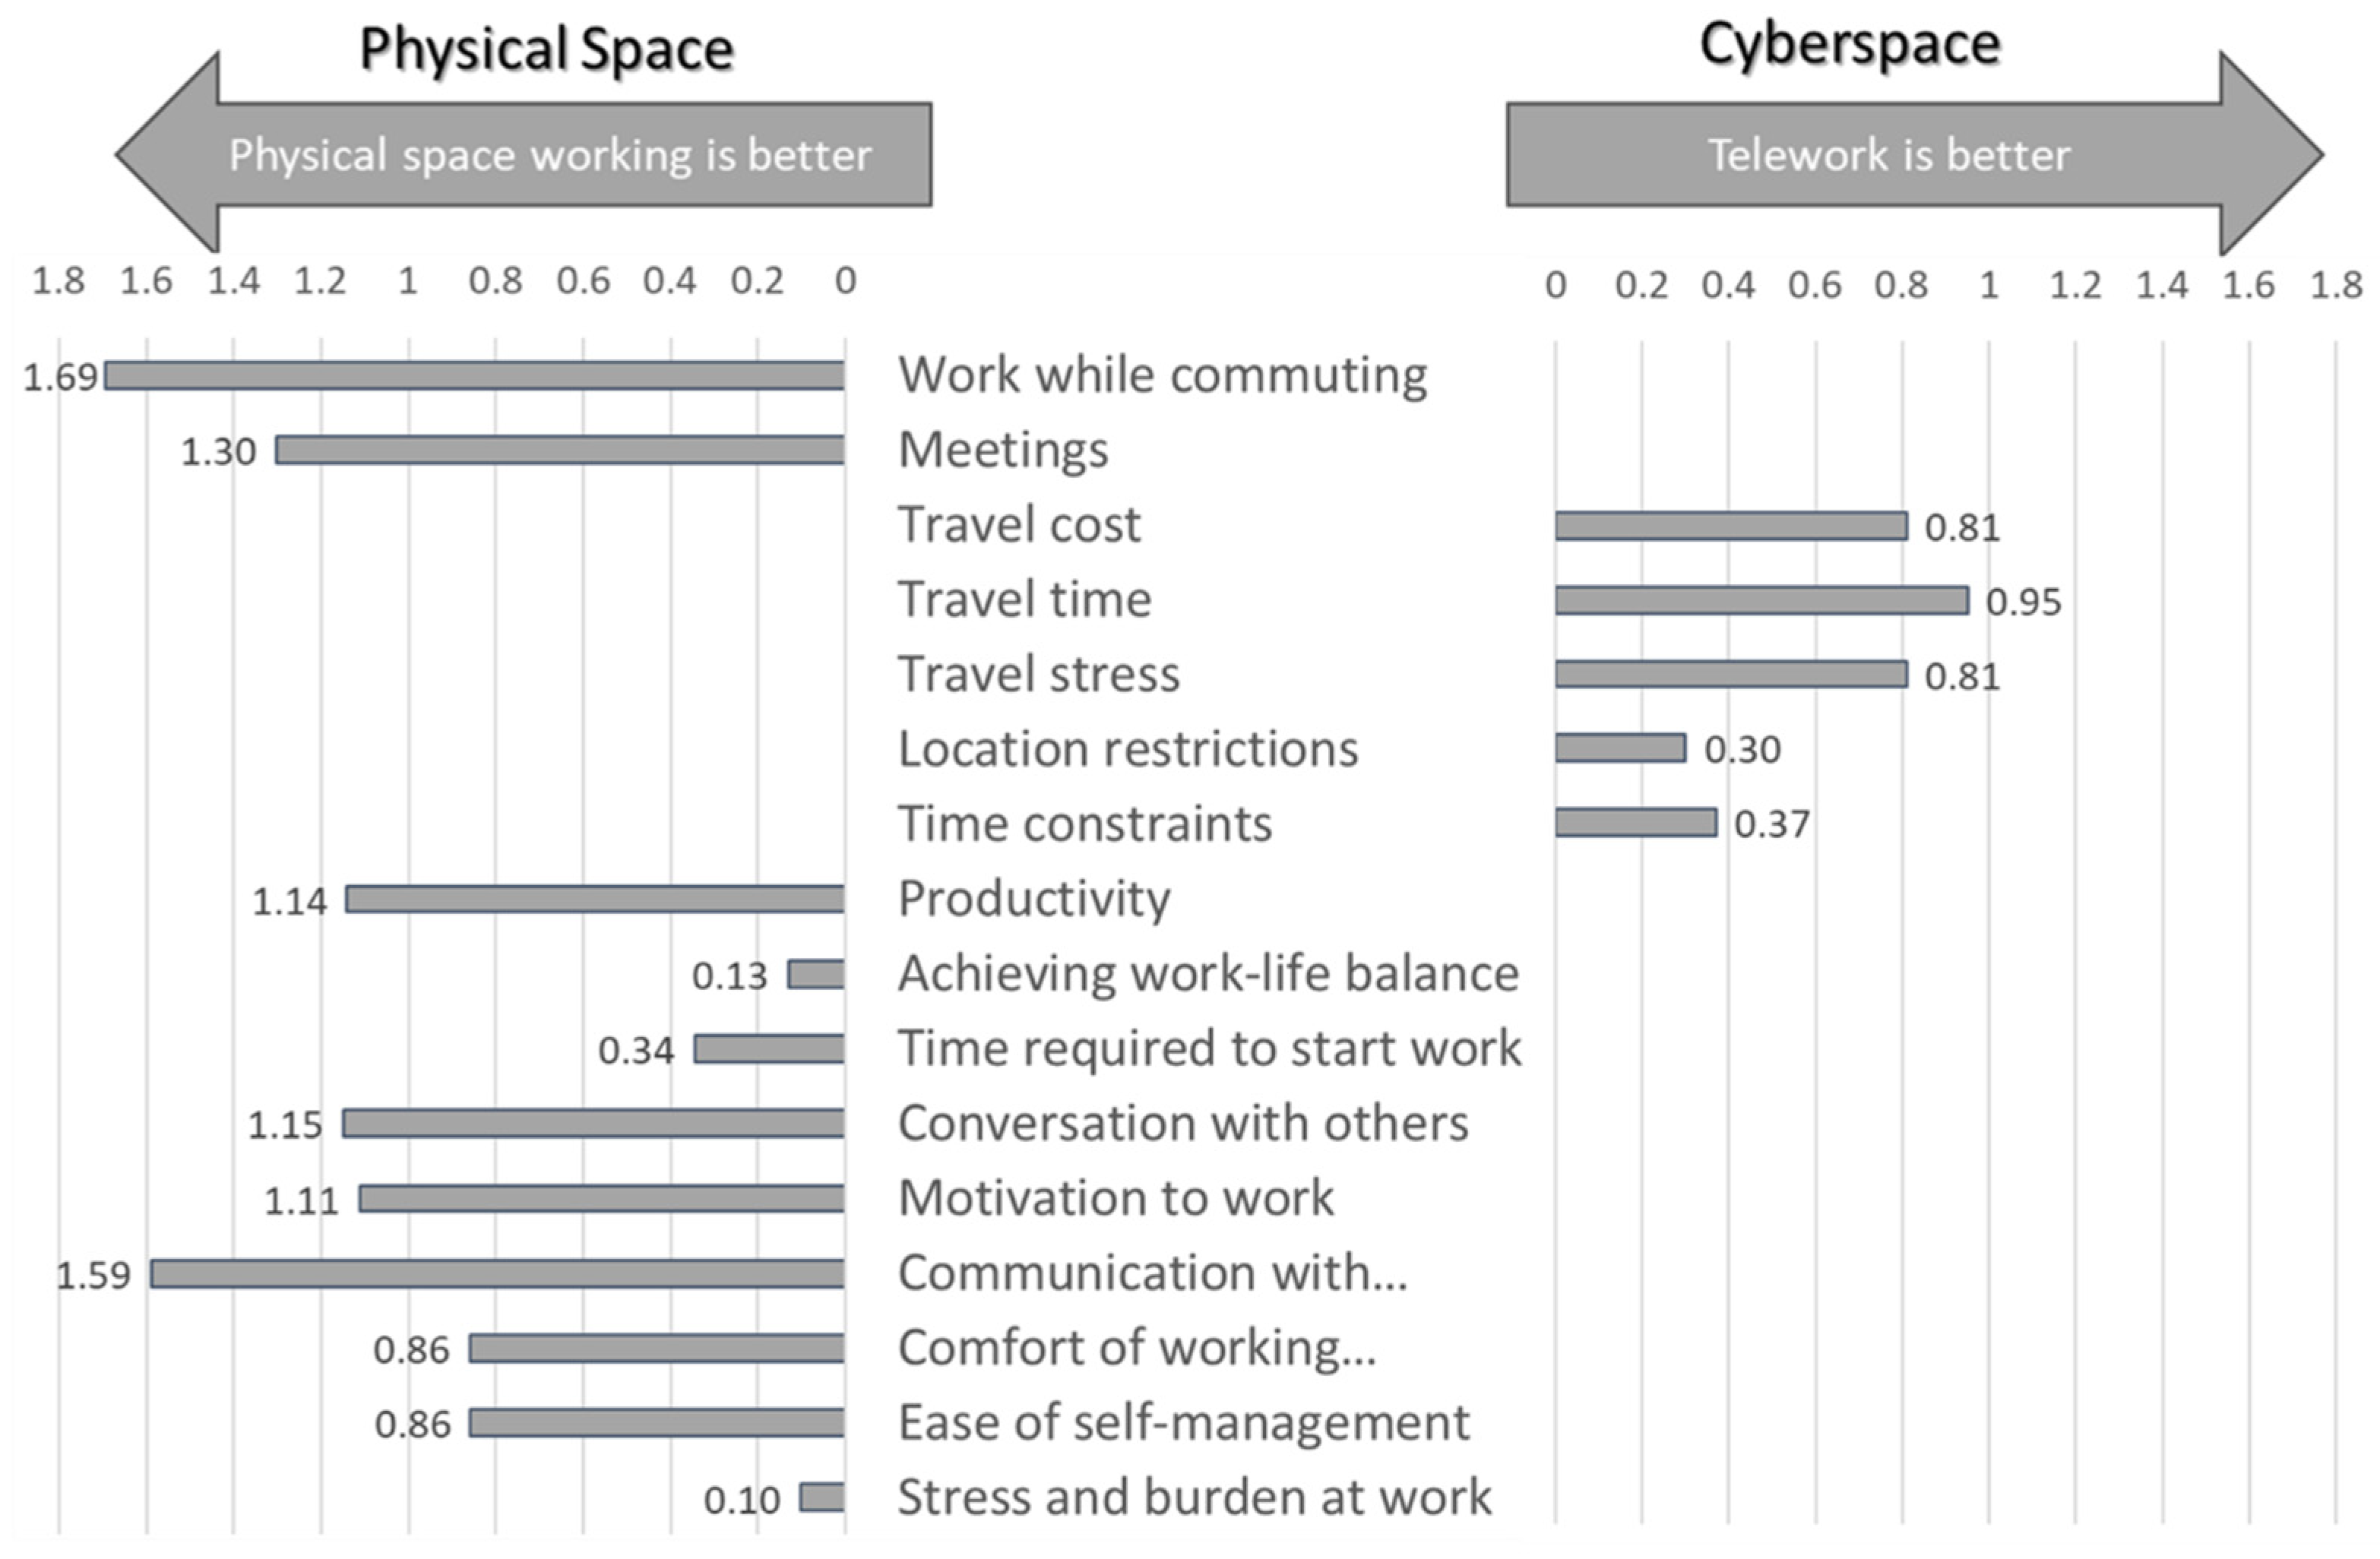
Through the web-based questionnaire survey, individuals were asked if they feel physical (in-office) working is better or if telework is better, considering several evaluation items. The results disclosed that teleworking is weighted higher by varying degrees, considering the accessibility-related items as shown in
Figure 8. Meanwhile, physical (in-office) working is weighted higher considering non-accessibility-related factors such as working while commuting, work productivity, self-management, and social interactions.
3.1.4. Schooling
Through the web-based questionnaire survey, individuals were asked if they feel physical (in-school) learning is better or if e-learning is better, considering several evaluation items. Similarly to shopping, dining, and working, the results disclosed that respondents prefer e-learning considering the accessibility-related items, but physical learning value is weighted higher considering social interaction in the school, learning effectiveness, satisfaction with tuition fees, motivation, self-management, and convenience, as shown in
Figure 9. The result discloses that accessibility-related factors can be a potential driver for digital alternative substitution in the case of schooling as well.
3.1.5. Hospital Visit
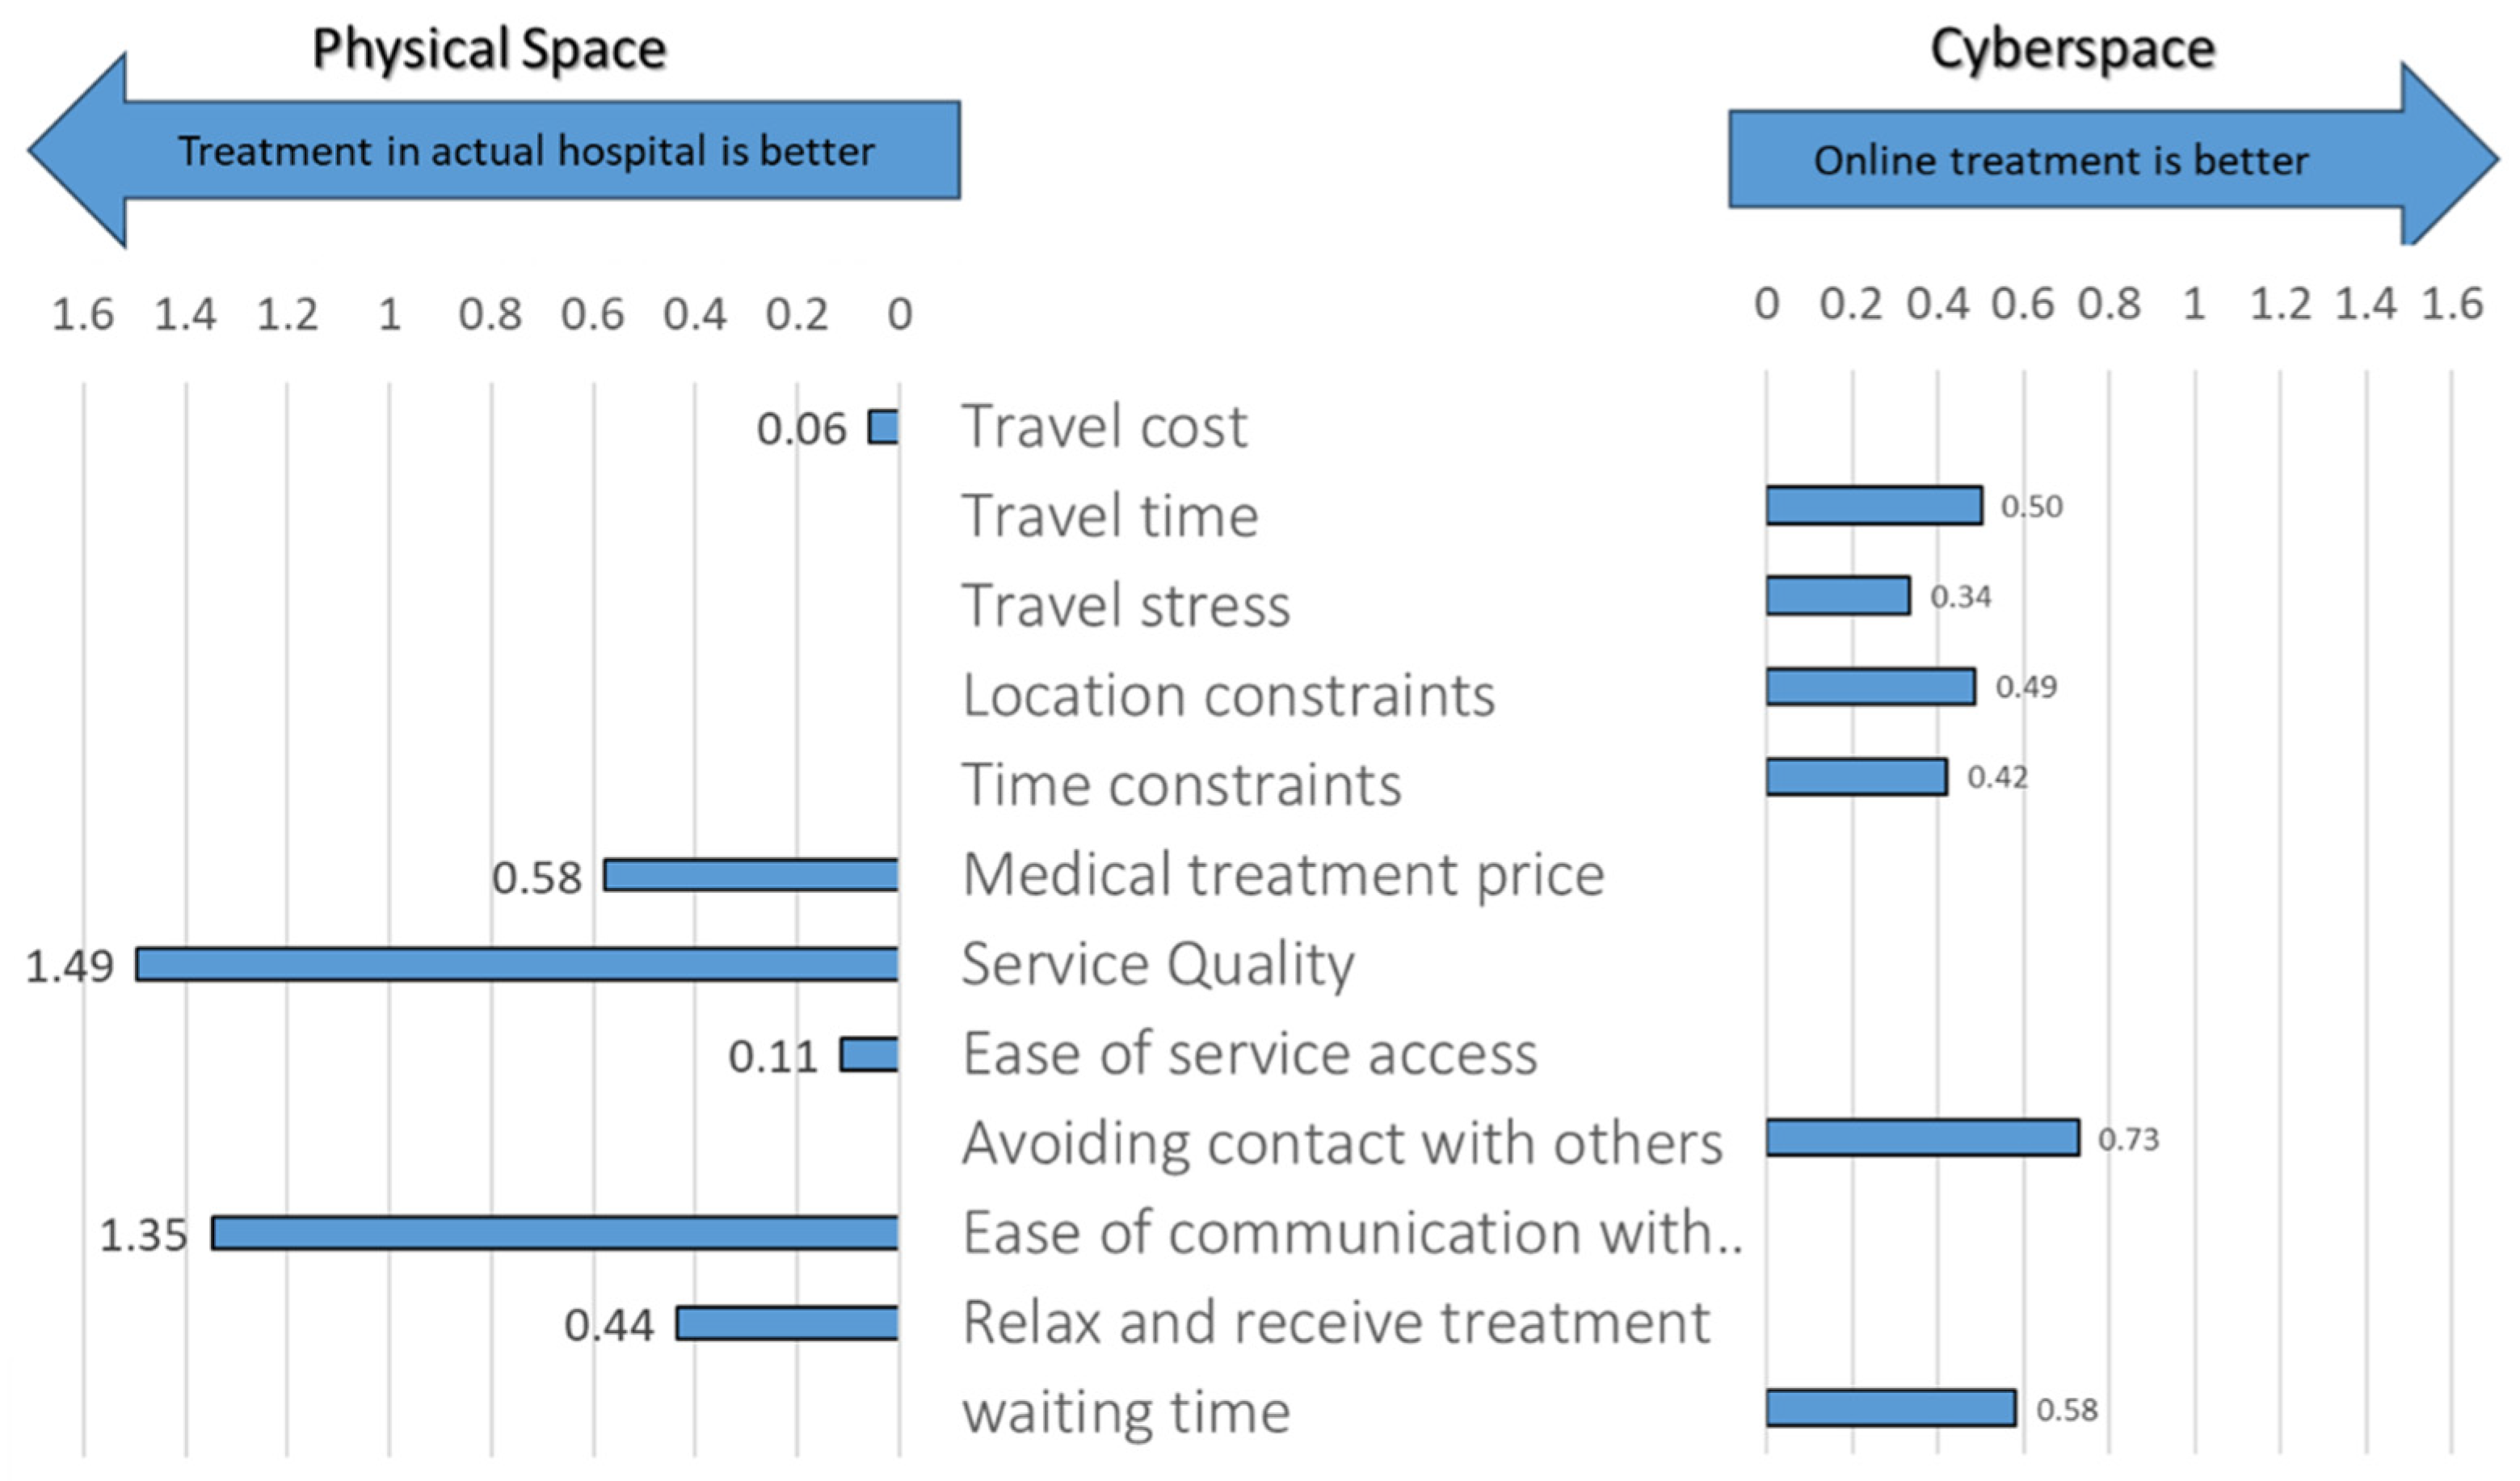
Through the web-based questionnaire survey, individuals were asked if they feel physical (in-hospital) treatment is better or if online treatment is better, considering several evaluation items to evaluate the value of the services and factors affecting it. The result discloses that, in addition to accessibility-related factors, avoiding contact with others and waiting time are the other factors that weigh more heavily on the online treatment, as shown in
Figure 10. In contrast, service quality, social communication, treatment price, and convenience are factors influencing individuals to prefer physical (in-hospital) treatment.
3.1.6. Tourism
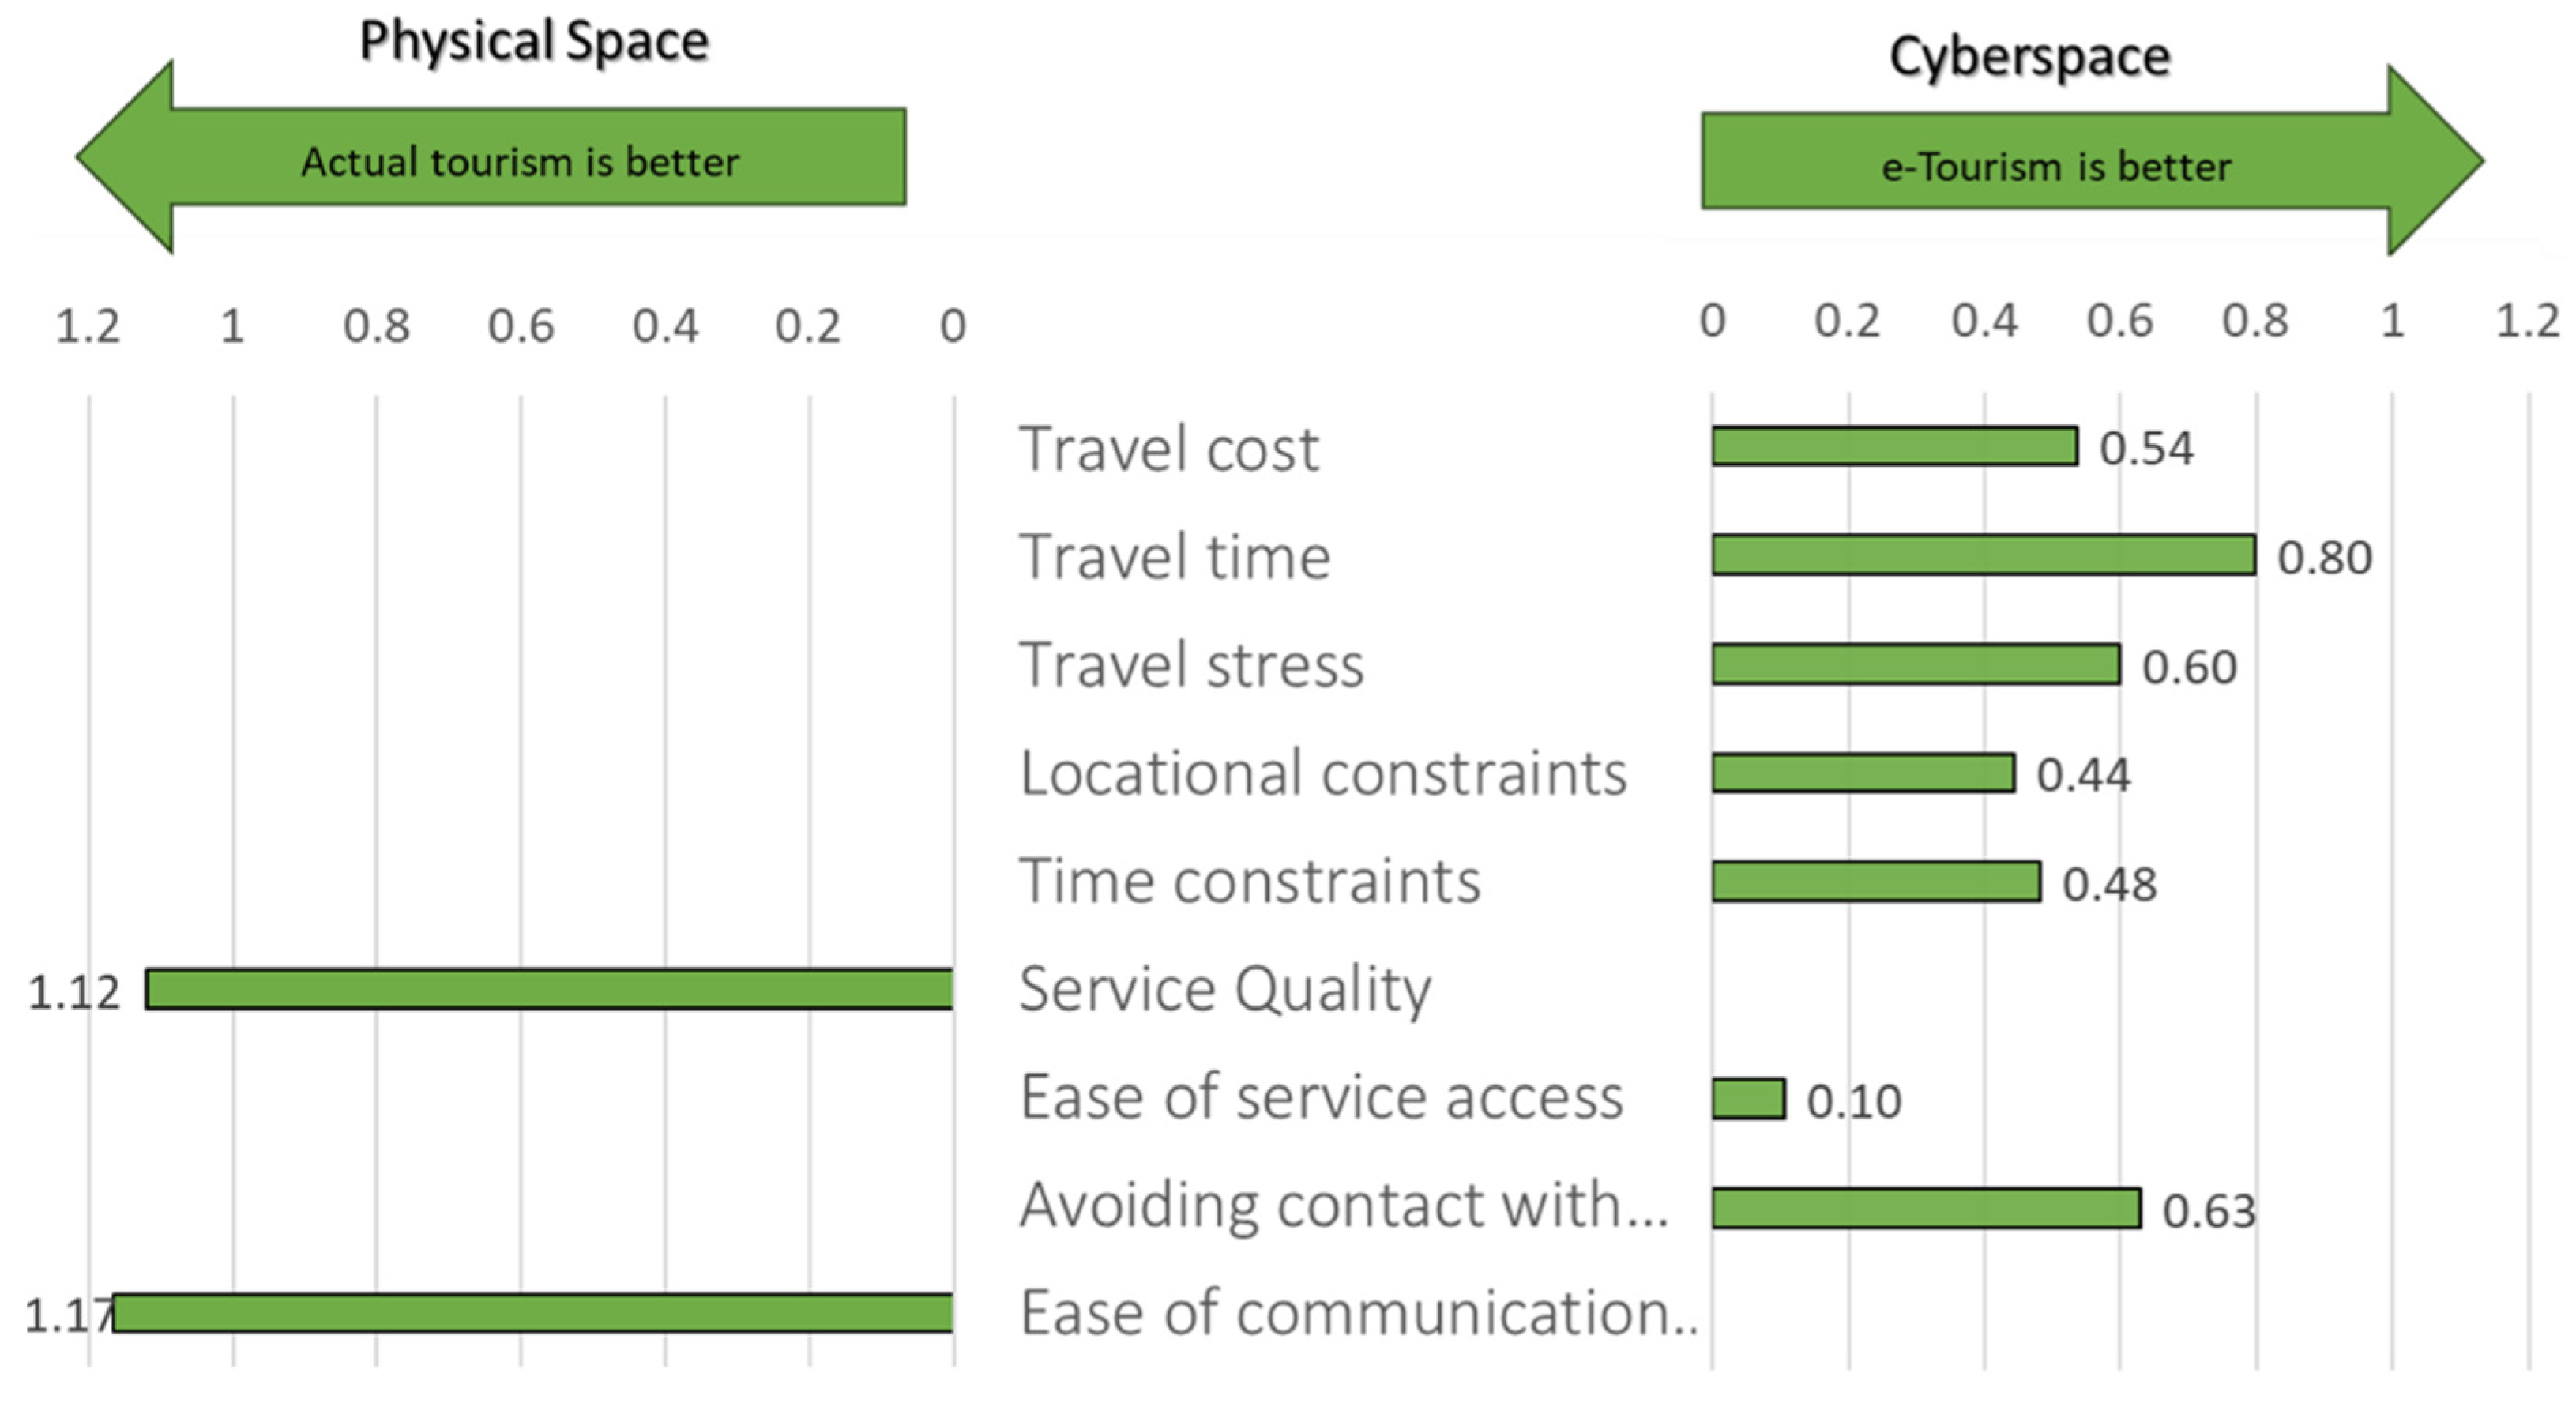
Through the web-based questionnaire survey, individuals were asked if they feel physical (in-spot) tourism is better or if e-tourism (virtual tours) is better, considering several evaluation items to evaluate the value of the services and factors affecting it. It was found that, similar to hospital visits, the individuals prefer e-tourism because of accessibility-related items, avoiding contact with others, and ease of service access, as shown in
Figure 11. In contrast, the preference of individuals towards physical hospital visits was strongly influenced by service quality and social interaction items. The result confirms that accessibility-related factors, in addition to avoiding contact with others, positively affect the substitutability of actual tourism for a digital alternative, whereas the strong reluctant factors are service quality and social communication.
3.2. Socio-Economic and Demographic Factors Affecting Substitutability
This section investigates the factors affecting substitutability (preference of individuals for physical services or their digital counterparts) of the six primary services (shopping, dining, working, schooling, treatment, and watching movies) with their digital counterparts, as shown in
Table 2. The study conducted Multiple Linear Regression (MLR) Analysis, where the substitution rate for services is kept as a dependent variable, while the age, sex, driving license, household income, and employment status are kept as independent variables. For the dummy variables, the coding was set as follows: Gender (0 = Male, 1 = Female), Driver’s License (0 = No, 1 = Yes), and Employment Status (0 = Unemployed, 1 = Employed). Accordingly, the regression coefficients represent the change in the substitution rate relative to the reference (0) category.
3.2.1. Factors Affecting the Substitutability of Shopping
Table 3 presents the results of the multiple linear regression (MLR) analysis examining the factors influencing the shopping substitution ratio, which indicates the extent to which individuals replace in-person shopping with online shopping (digital alternative). The results show that age, gender, and employment status have significant effects on substitution behavior.
The coefficient for age is negative and highly significant (β = −0.00167, p < 0.001), demonstrating that younger individuals are substantially more likely to substitute traditional shopping with digital alternatives, while older respondents tend to maintain physical shopping behavior. Similarly, gender is highly significant and negative (β = −0.0208, p < 0.001), suggesting that female respondents engage less frequently in online shopping substitution compared with males. This difference may reflect variations in product preferences, digital purchasing confidence, or risk perception between genders.
Employment status also exhibits a significant negative relationship (β = −0.0191, p = 0.007), indicating that those in stable employment positions are less likely to shift to online shopping, possibly due to habitual purchasing routines. Conversely, driving license ownership and household income do not significantly influence shopping substitution, implying that digital purchasing behavior is shaped more by socio-demographic and lifestyle factors than by mobility or income levels.
Overall, these findings highlight that the digital substitution of shopping activities is most prominent among younger, male, and more flexible workers, reflecting the influence of the elderly’s digital literacy and differing lifestyle patterns of men and women in the transition toward virtual shopping environments.
3.2.2. Factors Affecting the Substitutability of Dining
Table 4 presents the results of the MLR analysis examining factors affecting the dining substitution ratio, which measures the tendency to replace dining out with digital alternative options (food delivery). The analysis indicates that age, driving license, and employment status significantly and moderately influence dining substitution behavior, respectively. Specifically, age has a negative coefficient (β = −0.00147,
p < 0.001), suggesting that older individuals are less likely to substitute dining out with alternatives. This could be because of elderly put a higher importance on face-to-face communication (social interaction) or lack of digital literacy (inability to use digital devices to reach virtual services).
Similarly, having a driving license (β = −0.03503, p < 0.001) is associated with a lower substitution ratio, indicating that individuals with easier access to transportation are more likely to continue dining out. Employment status (β = −0.02246, p = 0.012) also shows a negative effect, meaning that employed individuals tend to have a lower dining substitution ratio than unemployed individuals. In contrast, gender (β = 0.00210, p = 0.722) and household income (β = 0.00116, p = 0.281) do not have statistically significant effects on dining substitution. Overall, the findings suggest that age, employment, and driving ability play a more substantial role in influencing dining substitution behavior than gender or income.
3.2.3. Factors Affecting the Substitutability of Working
Table 5 presents the results of the MLR analysis examining the factors influencing the working substitution ratio, which represents the degree to which individuals substitute physical work activities with virtual work (reaching the work using virtual accessibility). The results show that gender, household income, and employment status have statistically highly and marginally significant effects on the working digital substitution ratio, respectively. Specifically, the coefficient for gender is negative and highly significant (β = −0.027,
p < 0.001), indicating that female respondents tend to have a lower working substitution ratio compared to males. This is consistent with an existing study [
37], which suggests women are performing less telework than men due to a lower degree of virtual accessibility.
Household income exhibits a positive and significant relationship (β = 0.0026, p = 0.019), suggesting that higher-income groups are more likely to engage in telework. Employment status also shows a negative but marginally significant effect (β = −0.033, p = 0.046), implying that those in more stable or traditional employment arrangements are less likely to substitute physical work with digital alternatives. Age (p = 0.052) and possession of a driving license (p = 0.270) do not significantly influence substitution behavior.
Overall, these findings suggest that digital substitution in working activities is more prevalent among higher-income and male respondents, while employment status still limits the diffusion of teleworking. This highlights the socio-economic heterogeneity in the transition toward hybrid and digital work styles.
3.2.4. Factors Affecting the Substitutability of Hospital Visits
Table 6 presents the results of the MLR analysis examining the factors influencing the hospital visit substitution ratio, which reflects the extent to which individuals replace in-person medical consultations with online or telemedicine alternatives. The results indicate that age and gender are the primary determinants of substitution behavior for healthcare services, while other socio-economic variables such as income, employment status, and driving license ownership show no statistically significant effects.
The coefficient for age is negative and highly significant (β = −0.00069, p < 0.001), suggesting that younger individuals are more likely to use digital healthcare services, whereas older respondents remain strongly dependent on traditional, face-to-face consultations. This result is consistent with the known digital divide in health technology adoption, where older populations face greater barriers related to digital literacy, virtual accessibility, and trust in remote medical systems. Similarly, gender shows a significant negative association (β = −0.0110, p < 0.001), indicating that female respondents are less likely than males to substitute physical hospital visits with telemedicine options. This may reflect greater risk aversion or a stronger preference for direct, interpersonal care interactions among women.
The lack of significant effects for income, employment status, and driving license ownership suggests that the choice between physical and online medical consultations is driven more by personal and demographic factors, such as age and gender, than by economic or mobility constraints. Overall, these findings underscore that digital healthcare substitution remains limited among older and female populations, highlighting the need for inclusive e-health policies that promote accessibility, trust, and literacy in telemedicine platforms to reduce disparities in healthcare access.
3.2.5. Factors Affecting the Substitutability of Schooling
Table 7 presents the results of the MLR analysis examining the factors influencing the schooling substitution ratio, which represents the extent to which individuals or households replace physical, in-person education with online or remote learning alternatives. The analysis shows that none of the examined socio-economic or demographic variables, age, gender, driving license ownership, household income, or employment status, have statistically significant effects on the schooling substitution ratio (
p > 0.05 for all variables).
3.2.6. Factors Affecting the Substitutability of Watching Movies
Table 8 summarizes the results of the MLR analysis examining the factors influencing the watching-movie substitution ratio, which represents the degree to which individuals replace cinema visits with online viewing (Netflix, Disney+, etc.). The analysis reveals that age and household income are the most influential variables, both showing statistically significant negative relationships with the substitution ratio.
The coefficient for age is negative and highly significant (β = −0.00235, p < 0.001), indicating that younger respondents are considerably more likely to substitute physical cinema experiences with online streaming or digital platforms, while older individuals tend to maintain traditional in-person viewing habits. Similarly, household income displays a negative and moderately significant effect (β = −0.0093, p = 0.009), suggesting that individuals with higher incomes are less likely to prefer digital substitutes, possibly because they can more easily afford the cost and leisure associated with physical movie outings.
Other variables, including gender, driving license possession, and employment status, show no statistically significant relationships (p > 0.05), implying that these factors do not substantially influence the choice between online and in-person movie watching.
Overall, these results highlight that digital substitution for entertainment activities such as movie watching is driven primarily by age and income differences; younger and lower-income groups are leading the shift toward digital platforms, reflecting generational preferences, cost sensitivity, and differing lifestyle patterns within the ongoing digital transformation of leisure behavior.
3.3. Results and Discussion
The analysis of service choice behavior and service value evaluation was conducted to examine individuals’ preference towards substitutability of physical services to virtual ones and to identify the key determinants of service substitutability. This investigation has been carried out to develop a conceptual integrated evaluation methodology to integrate physical accessibility and virtual accessibility for QOL estimations.
Building on the regression results presented in
Section 3.2, the findings indicate that socio-economic and demographic factors, particularly age, gender, income, and employment status, play a critical role in shaping individuals’ adoption of digital alternatives across service types. Younger, higher-income, and more flexible workers tend to substitute physical services with virtual ones more readily, while elderly and traditionally employed individuals remain more reliant on physical services through physical accessibility (physical network). The service choice behavior analysis further revealed that digital alternatives are mainly preferred for activities where accessibility-related constraints, such as travel time, cost, or schedule inflexibility, are significant. In particular, shopping, working, and dining activities show higher substitution tendencies when convenience, reduced contact, and time savings are valued. Conversely, activities that rely on service quality, social interaction, and tangible experience, such as hospital visits or entertainment, demonstrate lower levels of substitutability.
For example, the advantages of online shopping, such as the ability to purchase goods at any time and from any location, while avoiding travel and queuing, illustrate how certain daily tasks can be efficiently conducted in virtual networks. However, the physical experience of evaluating product quality, engaging in social interactions, and the immediacy of obtaining goods remain critical factors sustaining physical shopping demand. Likewise, the regression results showed that younger males and unemployed individuals exhibit significantly higher online-shopping substitution ratios, whereas older and female respondents show lower adoption levels, emphasizing the heterogeneity of digital inclusion.
Similar trends were found in working and entertainment activities. Higher-income and male respondents were more likely to engage in remote working, whereas having a permanent employment status limited teleworking adoption. In contrast, younger and lower-income groups displayed higher substitution ratios for movie-watching through virtual networks, reflecting their greater familiarity with streaming platforms and cost sensitivity toward cinema visits. These findings confirm that while digital transformation enhances accessibility and efficiency, its benefits are not uniformly distributed among social groups.
Overall, the results suggest that service substitutability is activity- and group-specific, determined by the trade-off between convenience and physical experience. Services with strong spatial or social components remain less substitutable, reinforcing the importance of hybrid service models that integrate both real and virtual networks. Such integration not only enhances overall accessibility but also mitigates digital inequality, contributing to sustainable and inclusive urban development. Hence, the subsequent proposed conceptual QOL evaluation framework incorporates these differentiated substitution patterns to assess how physical-virtual accessibility jointly influences individuals’ well-being and the sustainability of urban service systems.
5. Results
5.1. Substitutability Between Real and Virtual Activities
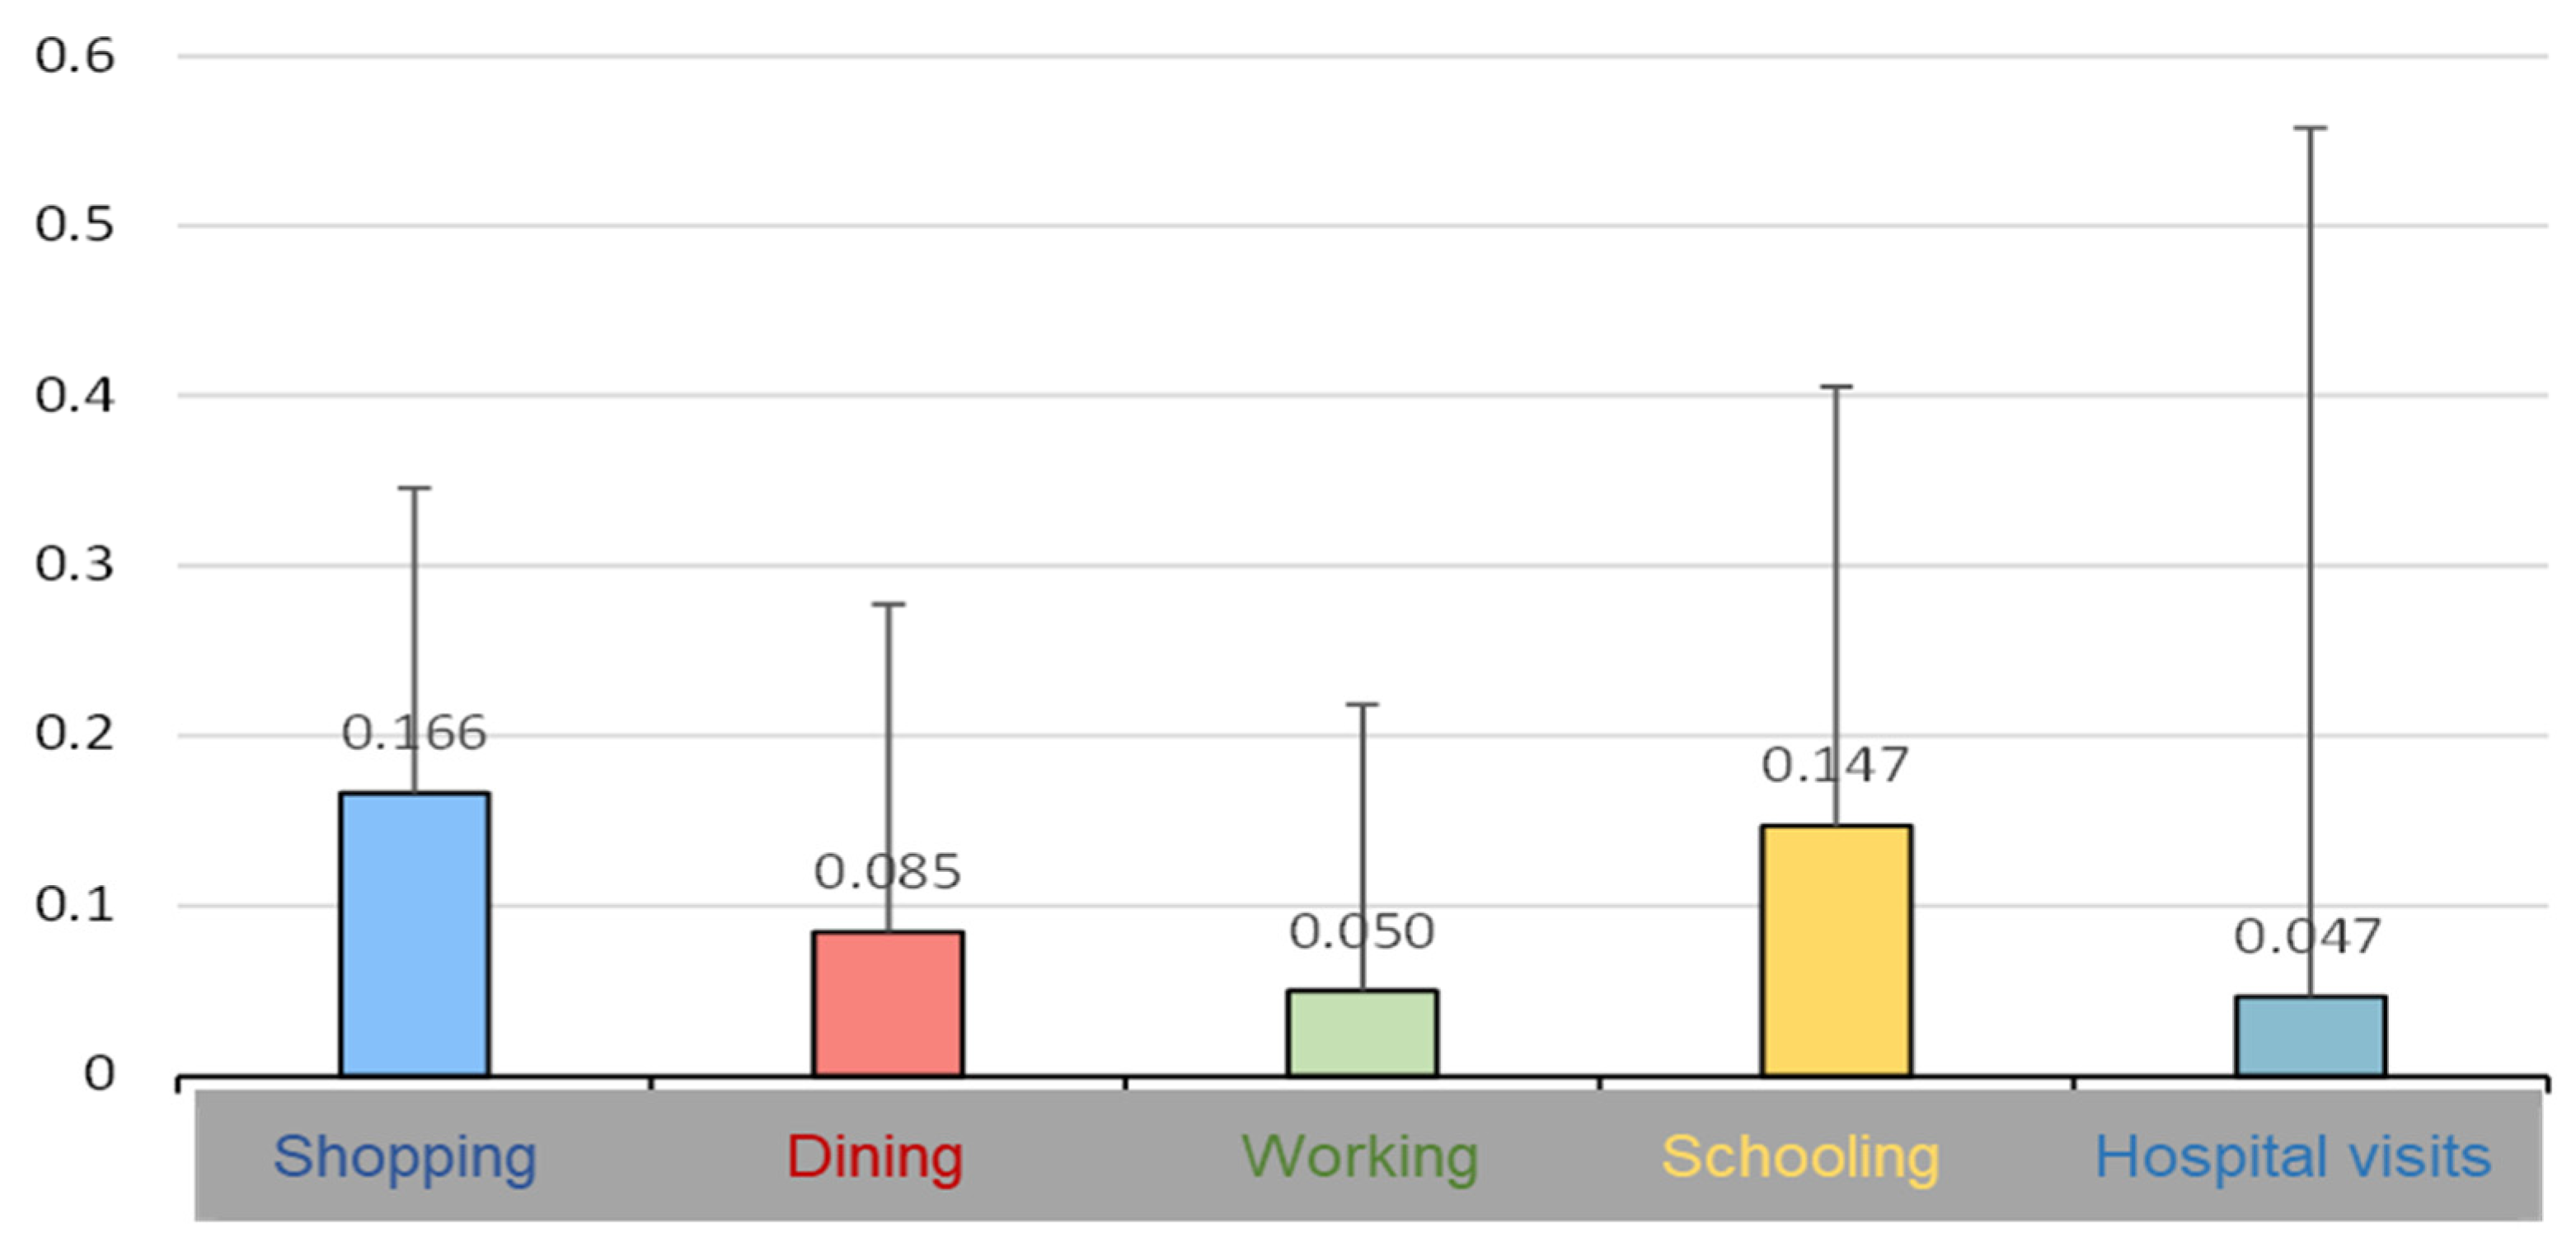
The survey results revealed significant insights into the substitutability of activities between physical and virtual spaces. In evaluating six primary activities, such as shopping, dining, working, schooling, hospital visits, and entertainment, we observed varying degrees of substitution based on the nature of the activity, socio-demographic factors, and accessibility to ICT networks. Shopping and schooling exhibited the highest rates of substitutability, with younger generations, particularly age groups in their 20s and 30s, more likely to engage in digital alternatives. This trend was attributed to the convenience offered by digital platforms, reduced travel time, and lower transportation costs. Shifting from physical (in-store) shopping to online shopping has been accelerated due to improvements in e-commerce, which enable seamless transactions.
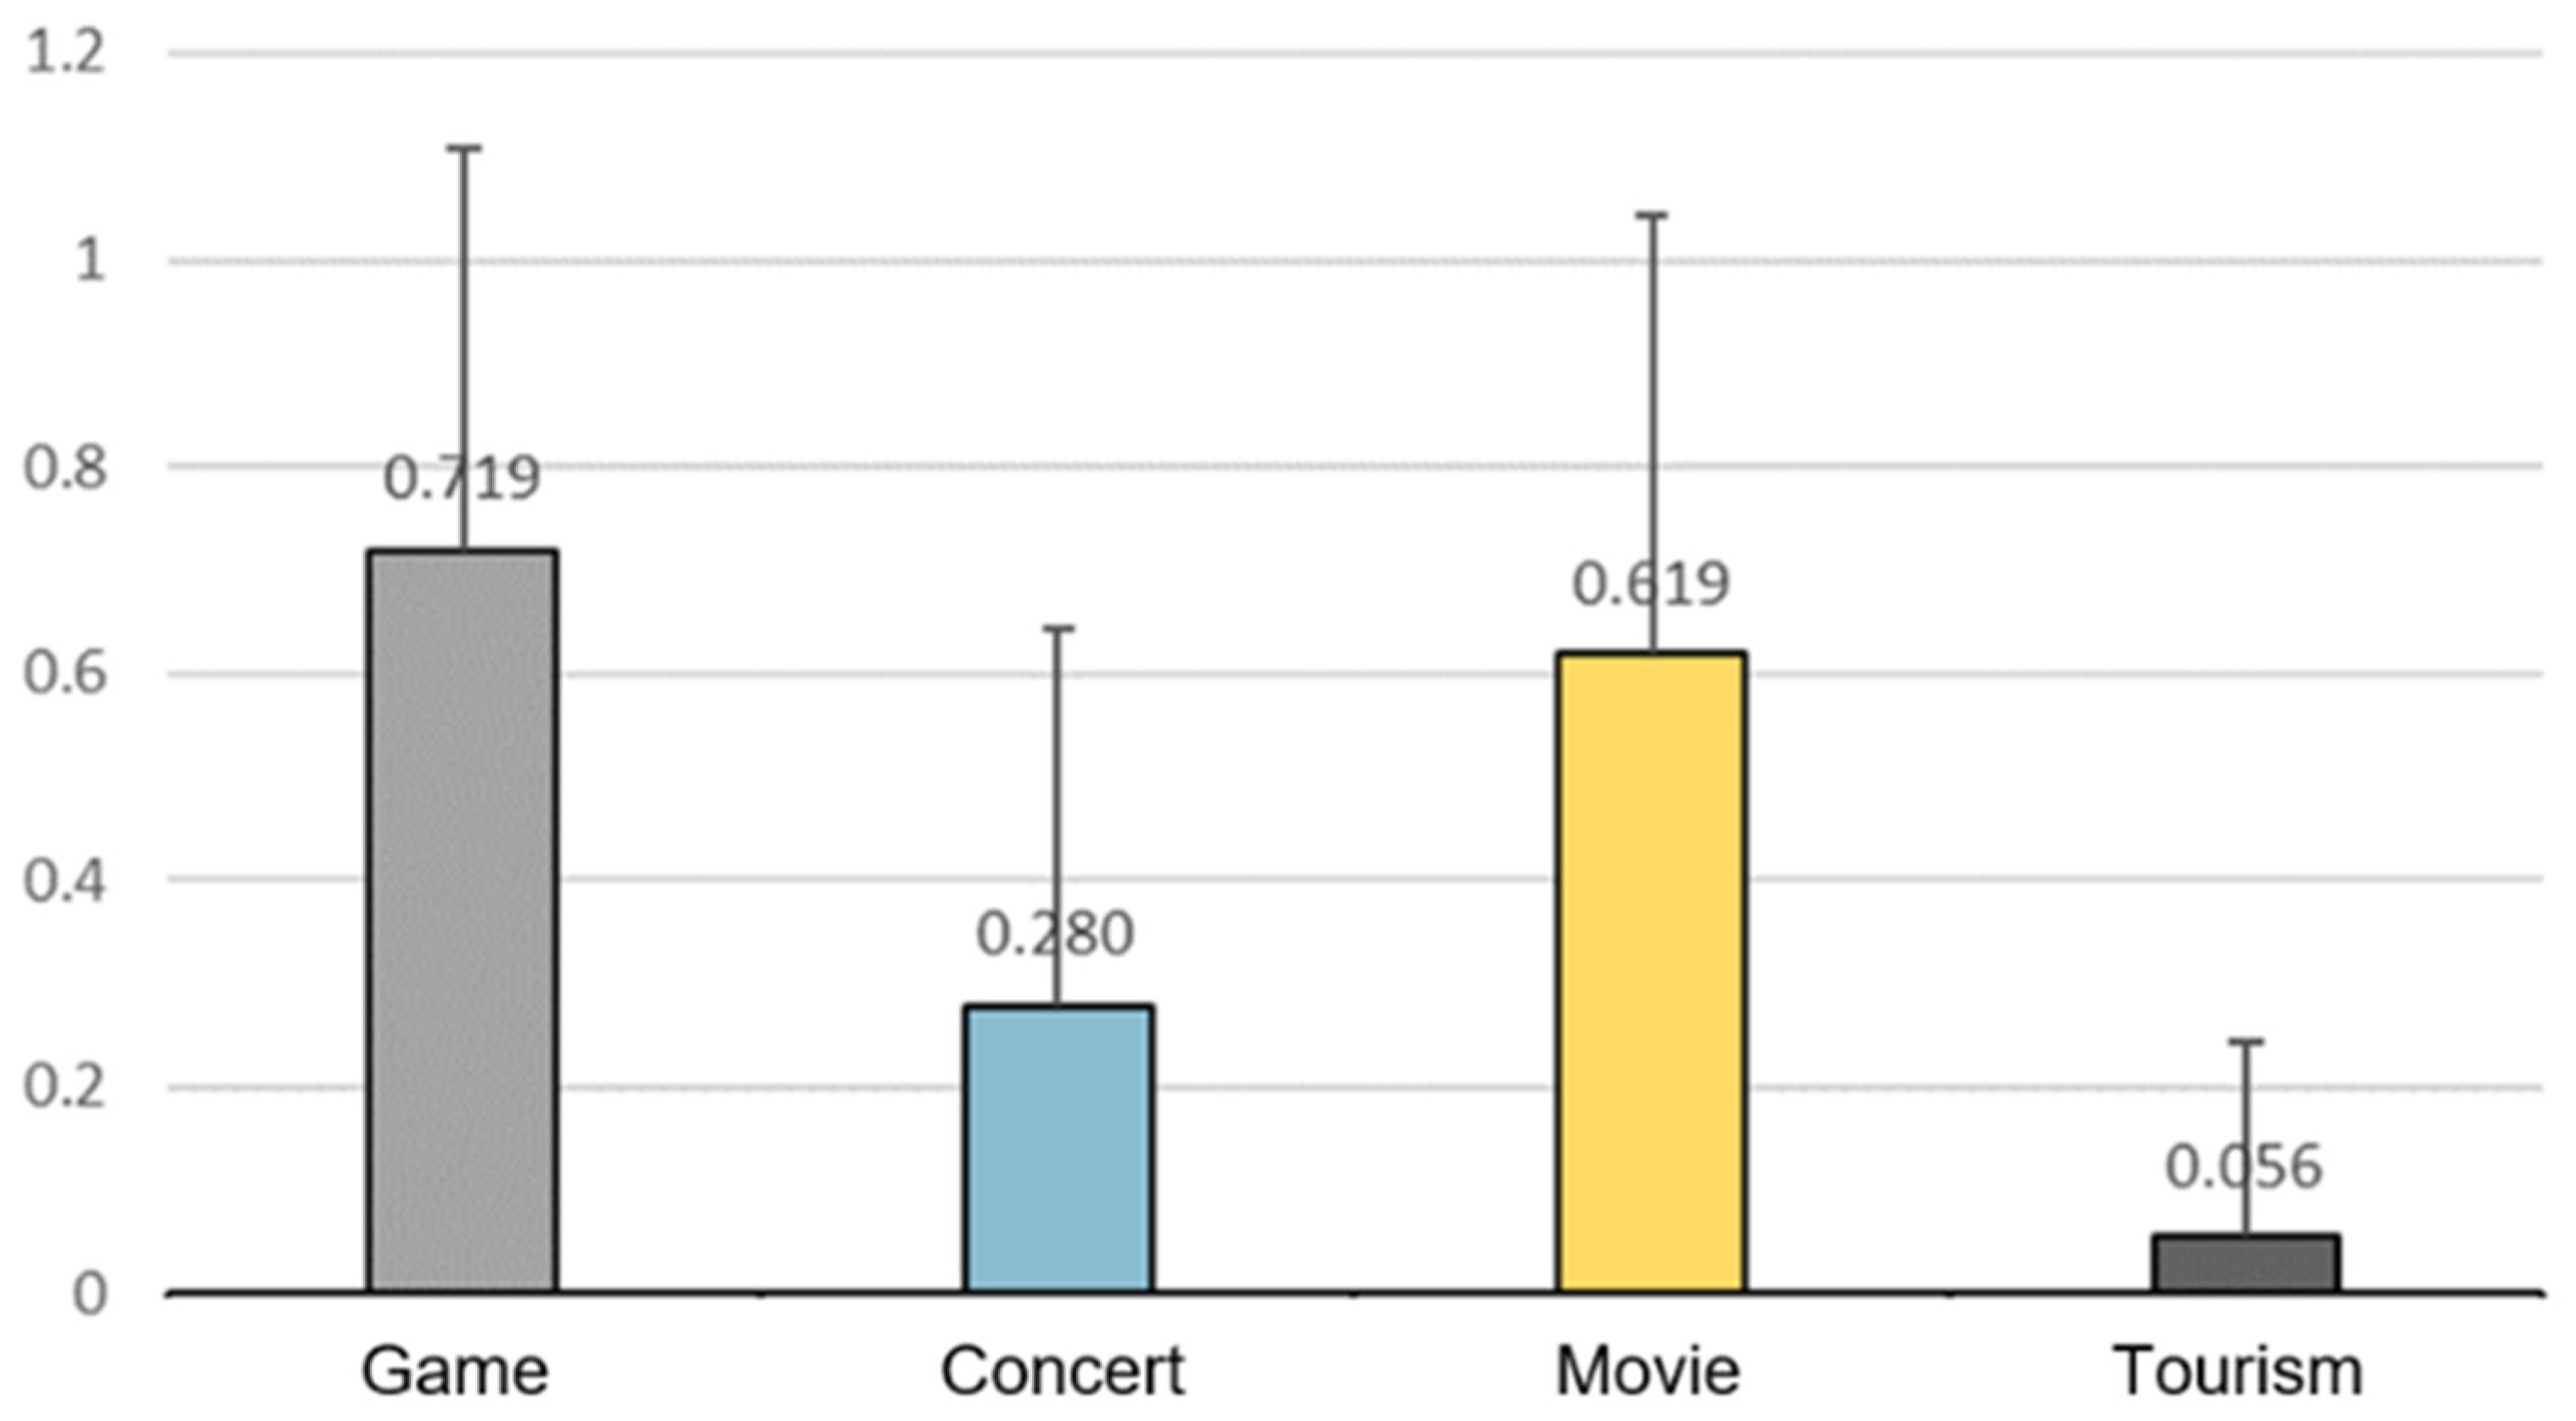
Similarly, e-learning platforms accessed by ICT networks have gained significant traction, especially during and post-pandemic, reducing the need for physical attendance in schools and universities. In contrast, activities like working and hospital visits displayed the lowest levels of substitution. Approximately 5% of respondents engaged in telework or virtual healthcare alternatives regularly. This low adoption rate is primarily due to the essential nature of physical presence in these activities, where hands-on work or in-person diagnosis remains critical. Entertainment activities also showed a notable shift towards virtual engagement, with online streaming, gaming, and social media interactions replacing physical venues such as cinemas or entertainment parks. Interestingly, while digital entertainment options have grown in popularity, tourism-related activities have seen limited digital substitution, emphasizing the unique value of physical travel experiences. Among the key factors, time savings, including reduced travel duration, minimized waiting time, and the flexibility to access services at any hour, emerged as one of the most significant perceived benefits of digital alternatives. These time-related advantages enhance individual convenience and productivity while simultaneously reducing unnecessary travel, contributing to improved urban efficiency and sustainability.
5.2. Impacts on QOL
The integration of digital services substantially enhances accessibility and convenience, improving individuals’ perceived Quality of Life (QOL). Respondents with greater digital access expressed that digital services are associated with reduced travel stress, shorter time expenditure, and higher satisfaction with daily activities. However, physical interactions remained irreplaceable in domains emphasizing social communication, such as education and healthcare. The substitutability of services between physical and virtual networks has effects on individuals’ QOL. The integrated evaluation methodology, developed in this study, suggests that QOL is influenced by accessibility to services through both transportation and ICT networks. Individuals with greater access to virtual networks reported higher accessibility satisfaction levels, especially in regions where physical travel is limited or restricted. Additionally, the study results disclose that the ability to shop, attend school, or work in virtual networks improves overall QOL by reducing the time, stress, and costs associated with physical travel.
Furthermore, the study results revealed that social interactions play a key role in determining QOL. Physical interactions remained important for personal relationships, with many respondents indicating that virtual engagement could not fully substitute the value of face-to-face cultural engagements. This insight underscores the need for balanced policies that promote both real and virtual connectivity to maintain higher QOL and social well-being, including mental health.
5.3. Impacts on De-CO2
The substitution of physical activities with digital alternatives has significant environmental impacts, particularly concerning CO
2 emissions. The study argues that the shift from transportation-based activities to ICT-based activities may contribute to a reduction in CO
2 emissions. For instance, online shopping and remote work reduced the demand for transportation, leading to lower fuel consumption and emissions. During the COVID-19 pandemic, a global reduction in CO
2 emissions was observed [
33], and this study’s findings align with the existing study’s findings. The adoption of teleworking and digital services provided an effective means to mitigate the environmental impact of urban mobility. By avoiding physical commutes, individuals directly contributed to reduced congestion, energy consumption, and pollution in cities.
However, the analysis also highlighted that the environmental benefits of substituting physical activities with digital alternatives are not uniform. While activities like online shopping and teleworking offer substantial CO2 reduction potential, others, such as virtual tourism, remain limited in their ability to offset the carbon footprint of physical travel. This finding suggests that decarbonization efforts must target specific activities where substitution is most feasible, while also promoting sustainable practices in areas that cannot be easily replaced by digital alternatives.
6. Discussion
6.1. Interpretation of Key Findings
The results demonstrate that digital substitution is not uniform but varies by service type, demographic profile, and accessibility type. The high substitutability of shopping and schooling reflects the maturity and user-friendliness of online platforms, while the persistently low rates for hospital visits and working emphasize the importance of physical engagement, trust, and service quality. The dominance of age and gender effects confirms existing literature showing that younger, tech-savvy populations are early adopters of virtual services, whereas elderly groups face digital literacy barriers. This heterogeneity underscores a key insight: digital transformation enhances accessibility and sustainability but risks reinforcing social and technological inequalities. Urban planners must therefore address disparities in digital readiness to ensure equitable benefits from hybrid service systems.
The study reinforces that integrated (physical and virtual) accessibility is a critical determinant of QOL. Digital alternatives reduce time and mobility burdens, directly improving convenience and perceived life satisfaction. However, the irreplaceable value of face-to-face interaction in education, healthcare, and social life highlights that digital services should complement rather than replace physical experiences. A balanced hybrid model, where physical and digital services coexist, is essential to sustain social cohesion and mental well-being while maximizing service efficiency. Urban planners should focus on hybrid systems that accommodate both physical and virtual networks, ensuring that critical services remain accessible, regardless of location or mobility constraints, to maintain a higher QOL. While such patterns are consistent with existing research on post-pandemic digital behavior, their interpretation within the present integrated QOL-accessibility framework offers new insights. Specifically, these behavioral shifts reveal how digital adoption contributes to spatial redistribution of service accessibility, influencing urban compactness, travel demand, and sustainability outcomes. Thus, rather than focusing on behavioral novelty, the discussion emphasizes the systemic implications of these tendencies for future urban and transport policies. Although our analysis results are based on a web-based survey from Japan, differences in transport infrastructure and digital literacy across different countries may affect accessibility, social, and technological exclusion. Limited transport access can restrict physical mobility, while older populations may face barriers to digital service adoption, so these contextual factors may need to be considered when generalizing our findings globally.
6.2. Policy Implications
This study’s findings offer key implications for future urban and transportation policy and planning. As cities continue to evolve with the integration of virtual space, urban and transportation planners must develop policies that account for both real and virtual networks. The result of this study suggests that prioritizing investments in cyberinfrastructure, particularly in underserved rural areas, could enhance accessibility and improve QOL while simultaneously contributing to decarbonization goals. Additionally, investments in cyberinfrastructures in rural areas with lower land prices can attract digital nomads and can result in economic growth and higher overall QOL.
The results indicate clear heterogeneity in digital service substitution behavior across socio-economic groups. Younger and higher-income individuals exhibit higher substitution ratios in activities such as shopping, working, and entertainment, while older and lower-income groups remain more dependent on physical services. These disparities highlight the need for differentiated policy approaches to promote equitable access to both real and virtual services. Policy measures should therefore focus on digital inclusion and infrastructure support for elderly and low-income populations through targeted ICT training programs, affordable broadband access, and public digital service centers. For younger teleworkers and students, urban strategies should encourage hybrid spatial planning, such as co-working spaces, smart mobility, and mixed-use neighborhood hubs that combine physical and digital functions. By tailoring interventions to distinct social groups, policymakers can reduce digital inequality while enhancing overall accessibility and sustainability. These differentiated strategies align with SDG 10 (Reduced Inequalities) and SDG 11 (Sustainable Cities and Communities), reinforcing the study’s contribution to evidence-based urban policy formulation.
Additionally, the results of this study have clear sustainability implications. Reduced reliance on physical transportation due to digital services contributes directly to lower CO2 emissions and energy consumption. Yet, these environmental benefits are contingent upon digital infrastructure efficiency and the energy footprint of ICT systems. To optimize De-CO2 outcomes, future urban strategies must integrate low-carbon digital infrastructure, renewable-powered data centers, and smart mobility solutions that bridge the gap between real and virtual accessibility.
7. Conclusions
This study investigated the substitutability of 6 basic daily life activities from real networks to virtual networks and disclosed that the substitution has substantial effects on QOL and the environment. The developed framework in the current study synthesizes and extends our earlier empirical findings on digital service substitution into a comprehensive QOL-based evaluation model for sustainable urban development. The results indicate that an integrated evaluation model combining both real and virtual networks can comprehensively evaluate urban policies and contribute to the enhancement of urban accessibility, improvement of QOL, and De-CO2 efforts. This comprehensive approach advances the understanding of the interplay between physical and virtual networks, offering a valuable tool for designing urban policies that enhance QOL while supporting global sustainability goals. It should be noted that the proposed framework represents an accessibility-based evaluation of QOL, quantifying the value of aggregate perceived accessibility rather than encompassing all social, psychological, or health dimensions of QOL.
As a limitation of this study, integrated models that evaluate accessibility to services through real and virtual networks should be developed to accommodate varying levels of substitutability across different activities. For example, promoting e-commerce and e-treatment services in regions with limited physical infrastructure could enhance service delivery while reducing transportation demand. Conversely, in urban areas, policies that support the coexistence of physical and digital services, such as smart transportation systems, flexible work arrangements, and the utilization of DX technologies in urban business environments, could maximize efficiency, enhance QOL, and contribute to sustainability.
Future research should investigate the long-term effects of digital transformation on urban structures and the role of emerging technologies in further optimizing service delivery across different sectors. Additionally, future research should focus on the effects of substitution on the physical and mental health of individuals, as shifting from physical space to virtual space will reduce face-to-face communications and active mobility and may contribute to social isolation. The authors of this study believe that not all services can be substituted, but digital services can be used as complementary services to enhance accessibility only, and the purpose of substitution shall only be to enhance the QOL of individuals, not more than that. These insights are crucial for urban planners and policymakers to design more sustainable, inclusive cities for the future.
While this study provides insights into the substitutability of physical and digital activities, several areas warrant further research. First, additional studies are needed to explore the long-term impacts of digital substitution on urban mobility and environmental sustainability. Second, future research should investigate the role of emerging technologies, such as DX technologies, in enhancing the substitutability of services across different sectors to evaluate the Quality of Business (QOB) within the urban business environment. As another limitation of the study, due to a lack of data, the study, which has only developed a conceptual framework that De-CO2 will be affected by substitutability, could not provide a quantitative estimation of the effects of substitutability on De-CO2. As future research prospects, it is recommended to either provide quantitative estimations or construct scenario analyses to study the effects of substitutability on De-CO2.
Moreover, the development of comprehensive models that consider the dynamic interplay between real and virtual networks is essential for accurately predicting future trends in urban mobility and estimating overall QOL and GRH. To do this, utilization of the social dynamics simulation method [
41] can project the individuals’ QOL considering temporal changes in different elements of society, including individuals and household attributes, land price, residential location choice, etc., through different time steps.
