An Inventory Management Model for City Multifloor Manufacturing Clusters Under Intermodal Supply Chain Uncertainty
Abstract
1. Introduction
- (1)
- Support decision-making on inventory allocation under variable transport conditions;
- (2)
- Optimise buffer stock (BS) levels to balance cost, reliability, and environmental performance; and
- (3)
- Enhance the adaptability and efficiency of intermodal supply operations in CMFMCs.
2. Literature Review
2.1. Sustainable Supply Chain Resilience in the Context of City Manufacturing
2.2. Inventory Management for City Manufacturing
2.3. The Multi-Layer Bayesian Network Method
3. Materials and Methods
- Conceptual foundation—A comprehensive literature review (Section 2.1 and Section 2.2) establishes the theoretical basis by linking SSCR, city manufacturing, and inventory management principles.
- Model development—The MLBNM (Section 2.3) is applied to formalise causal dependencies and quantify intermodal supply chain uncertainty affecting CMFMCs.
- Model formulation—A stochastic inventory management model is constructed to optimise BSs allocation under uncertainty, integrating sustainability and resilience criteria.
- Simulation and validation—The proposed model is tested through a case-based simulation, using representative data for a typical CMFMC to verify model reliability, sensitivity, and robustness.
- Analysis and implications—Results are interpreted to identify managerial and theoretical implications, highlighting contributions to sustainable city manufacturing and outlining directions for future research.
4. Problem Definition, Notation, and Assumptions
4.1. Problem Definition
4.2. Notation
4.3. Assumptions
- (1)
- Orders from CMFM enterprises for production materials are processed according to two rules: ‘next-day delivery’, i.e., orders are collected on a given day and delivered the next day, and ‘never less than ordered’, i.e., the volume of transported materials can be increased due to the best use of the vehicle’s cargo capacity. Shortages in supply may occur due to disruptions in intermodal transport prior to the delivery to ILN and may be affected by any of the production materials.
- (2)
- The demand for production materials ordered by CMFMC enterprises is highly variable because it is related to the volume of next-day planned production generated independently for each CMFMB and to the JIT ordering regime.
- (3)
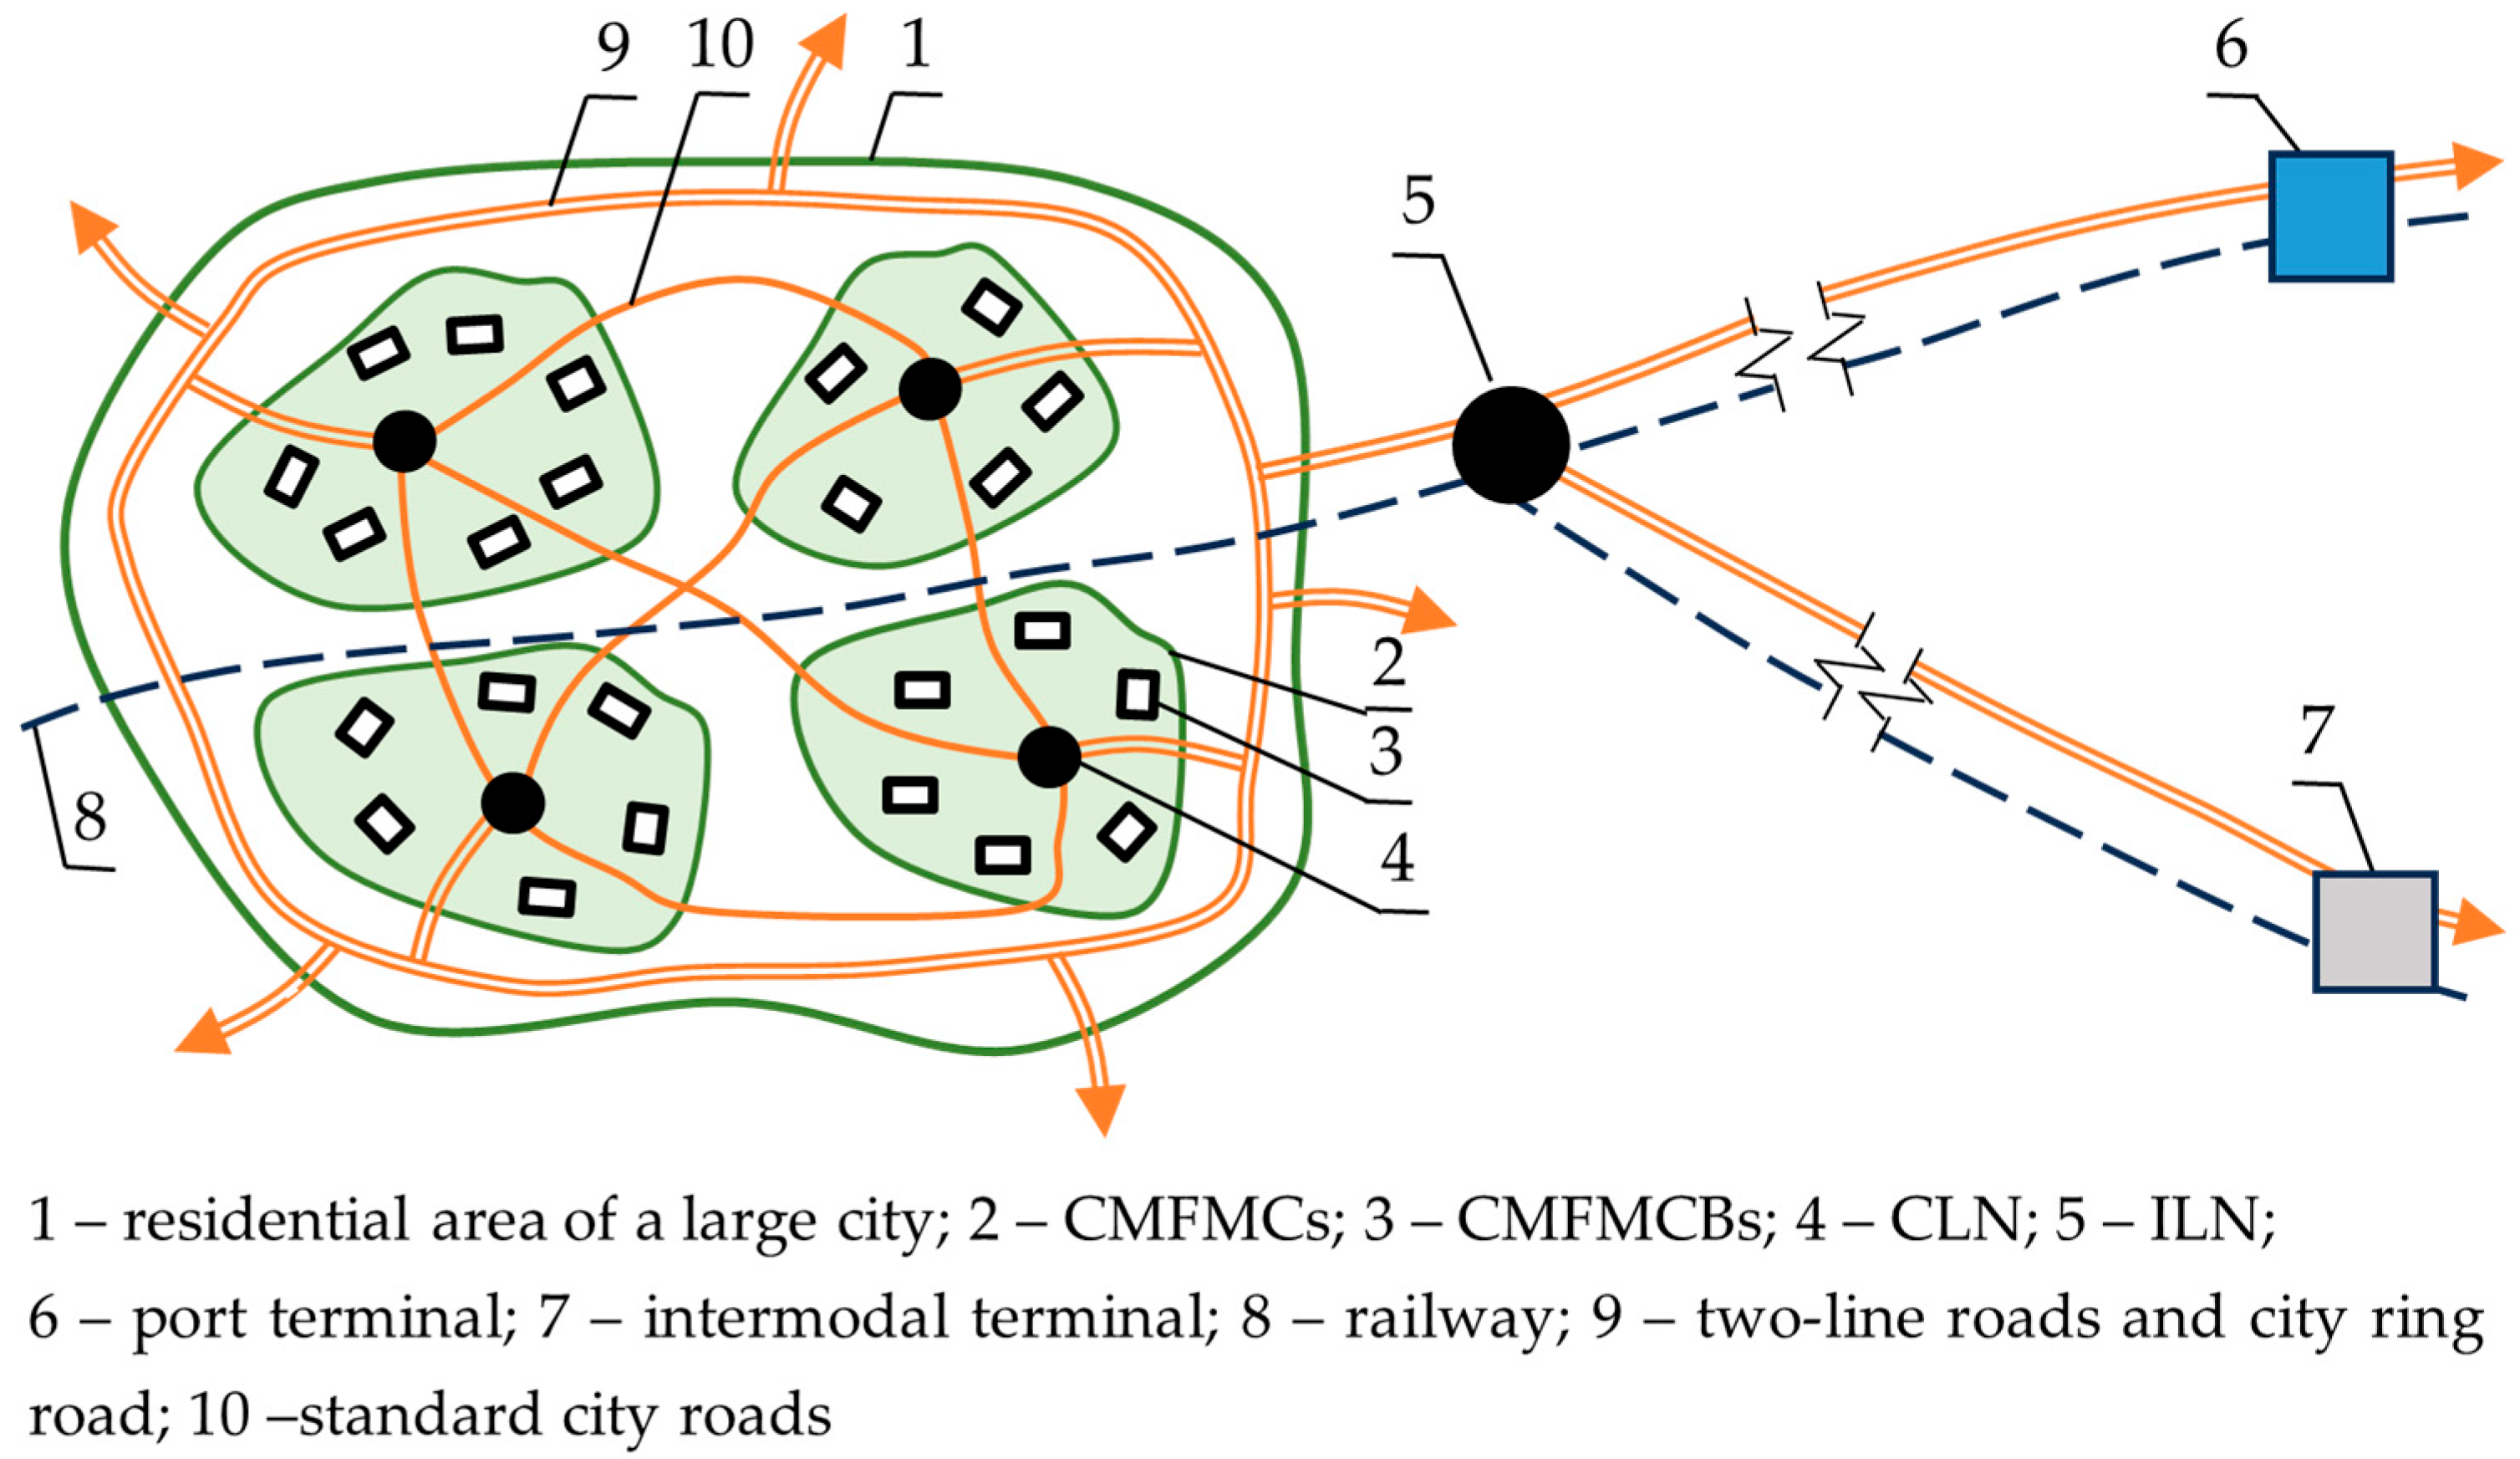
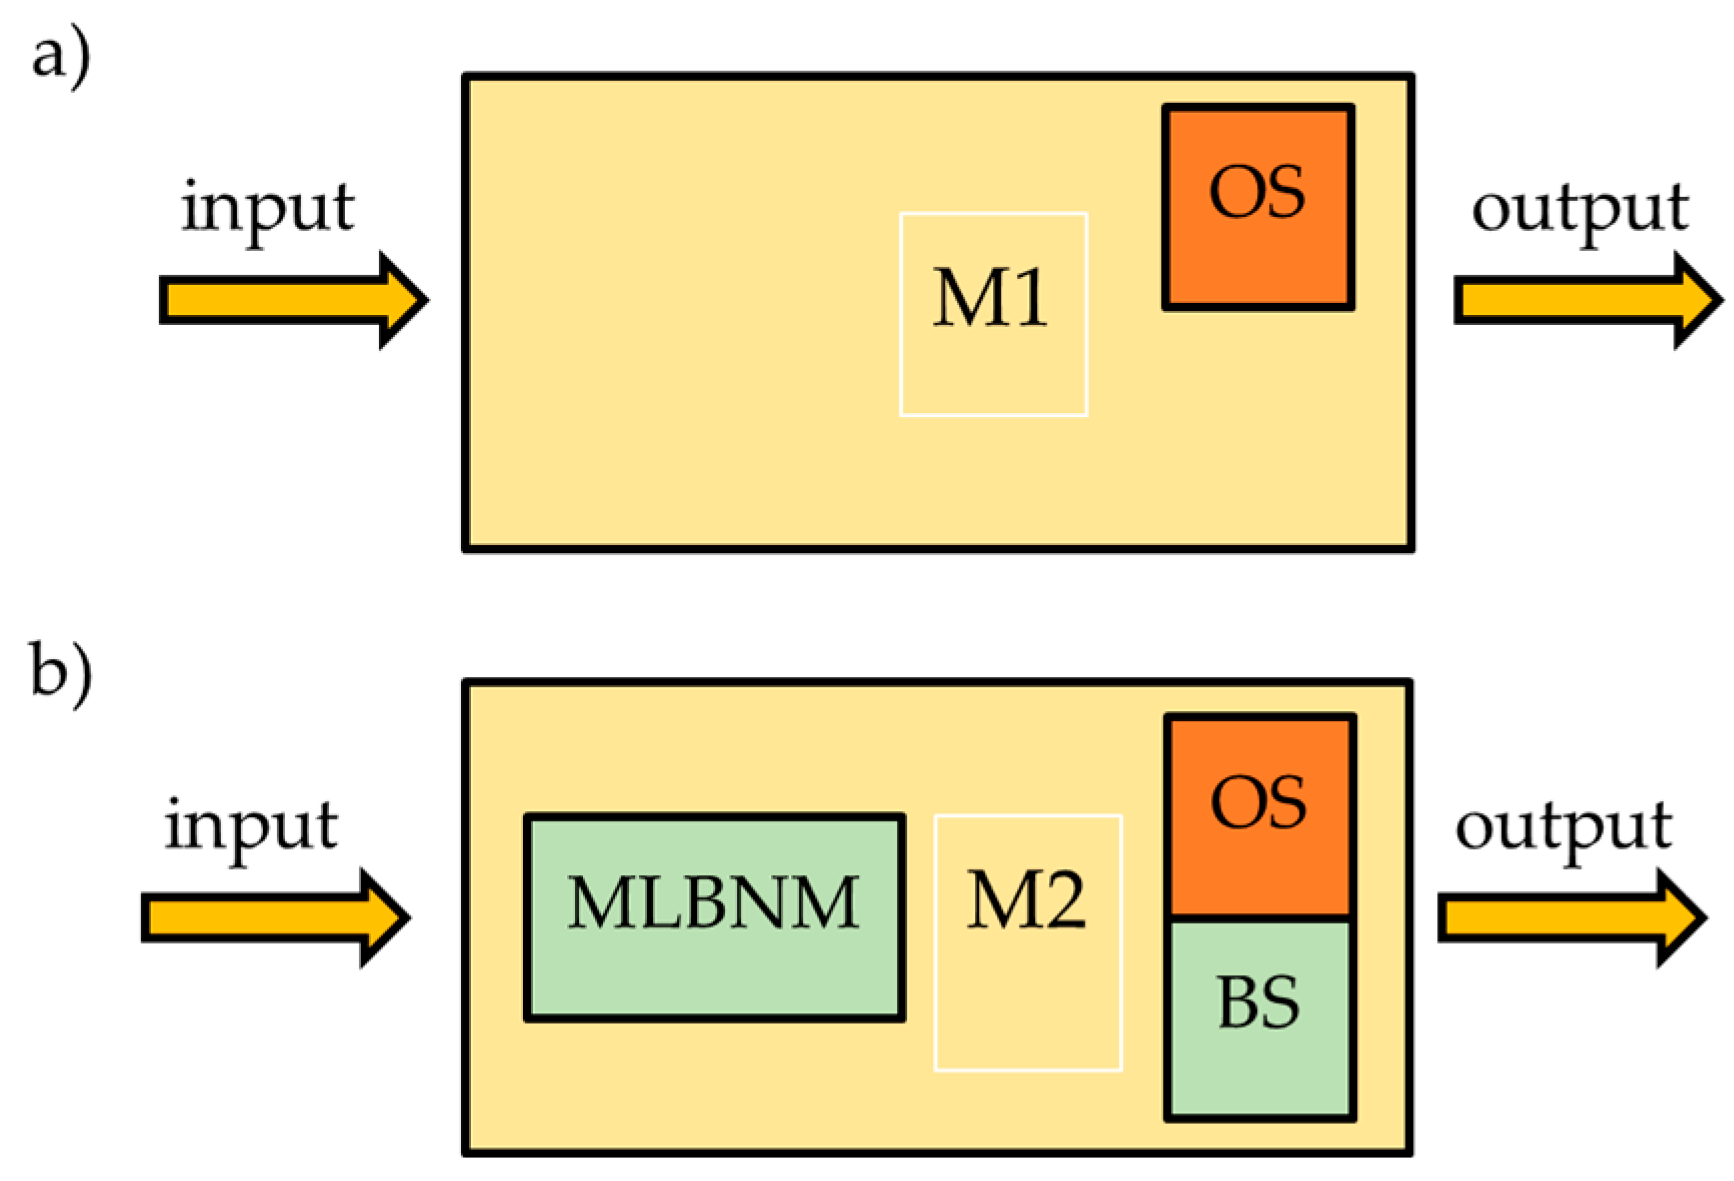
- There are two types of IRT storage areas in each CLN, enabling daily shipments to CMFMBs, i.e., the BS area aimed at maintaining a safety stock supplementing the shortages in CLN deliveries, and the overnight stock area aimed at storage of redundant IRTs that were delivered to CLN as a result of optimisation of vehicle capacity utilisation. The total storage area in CLN is always limited by the parameters of the building in which it is located.
- (4)
- Each CMFMB has a very limited storage area. As a rule, SMEs are located in multi-storey buildings that correspond to urban development. The available space is intended for production, and the pre- and post-storage processes should be limited to the necessary minimum. Additional storage restrictions result from the permissible load of the floor and the freight elevator.
5. Results
5.1. The Inventory Management Model for CMFMCs Under Supply Chain Uncertainty
- (1)
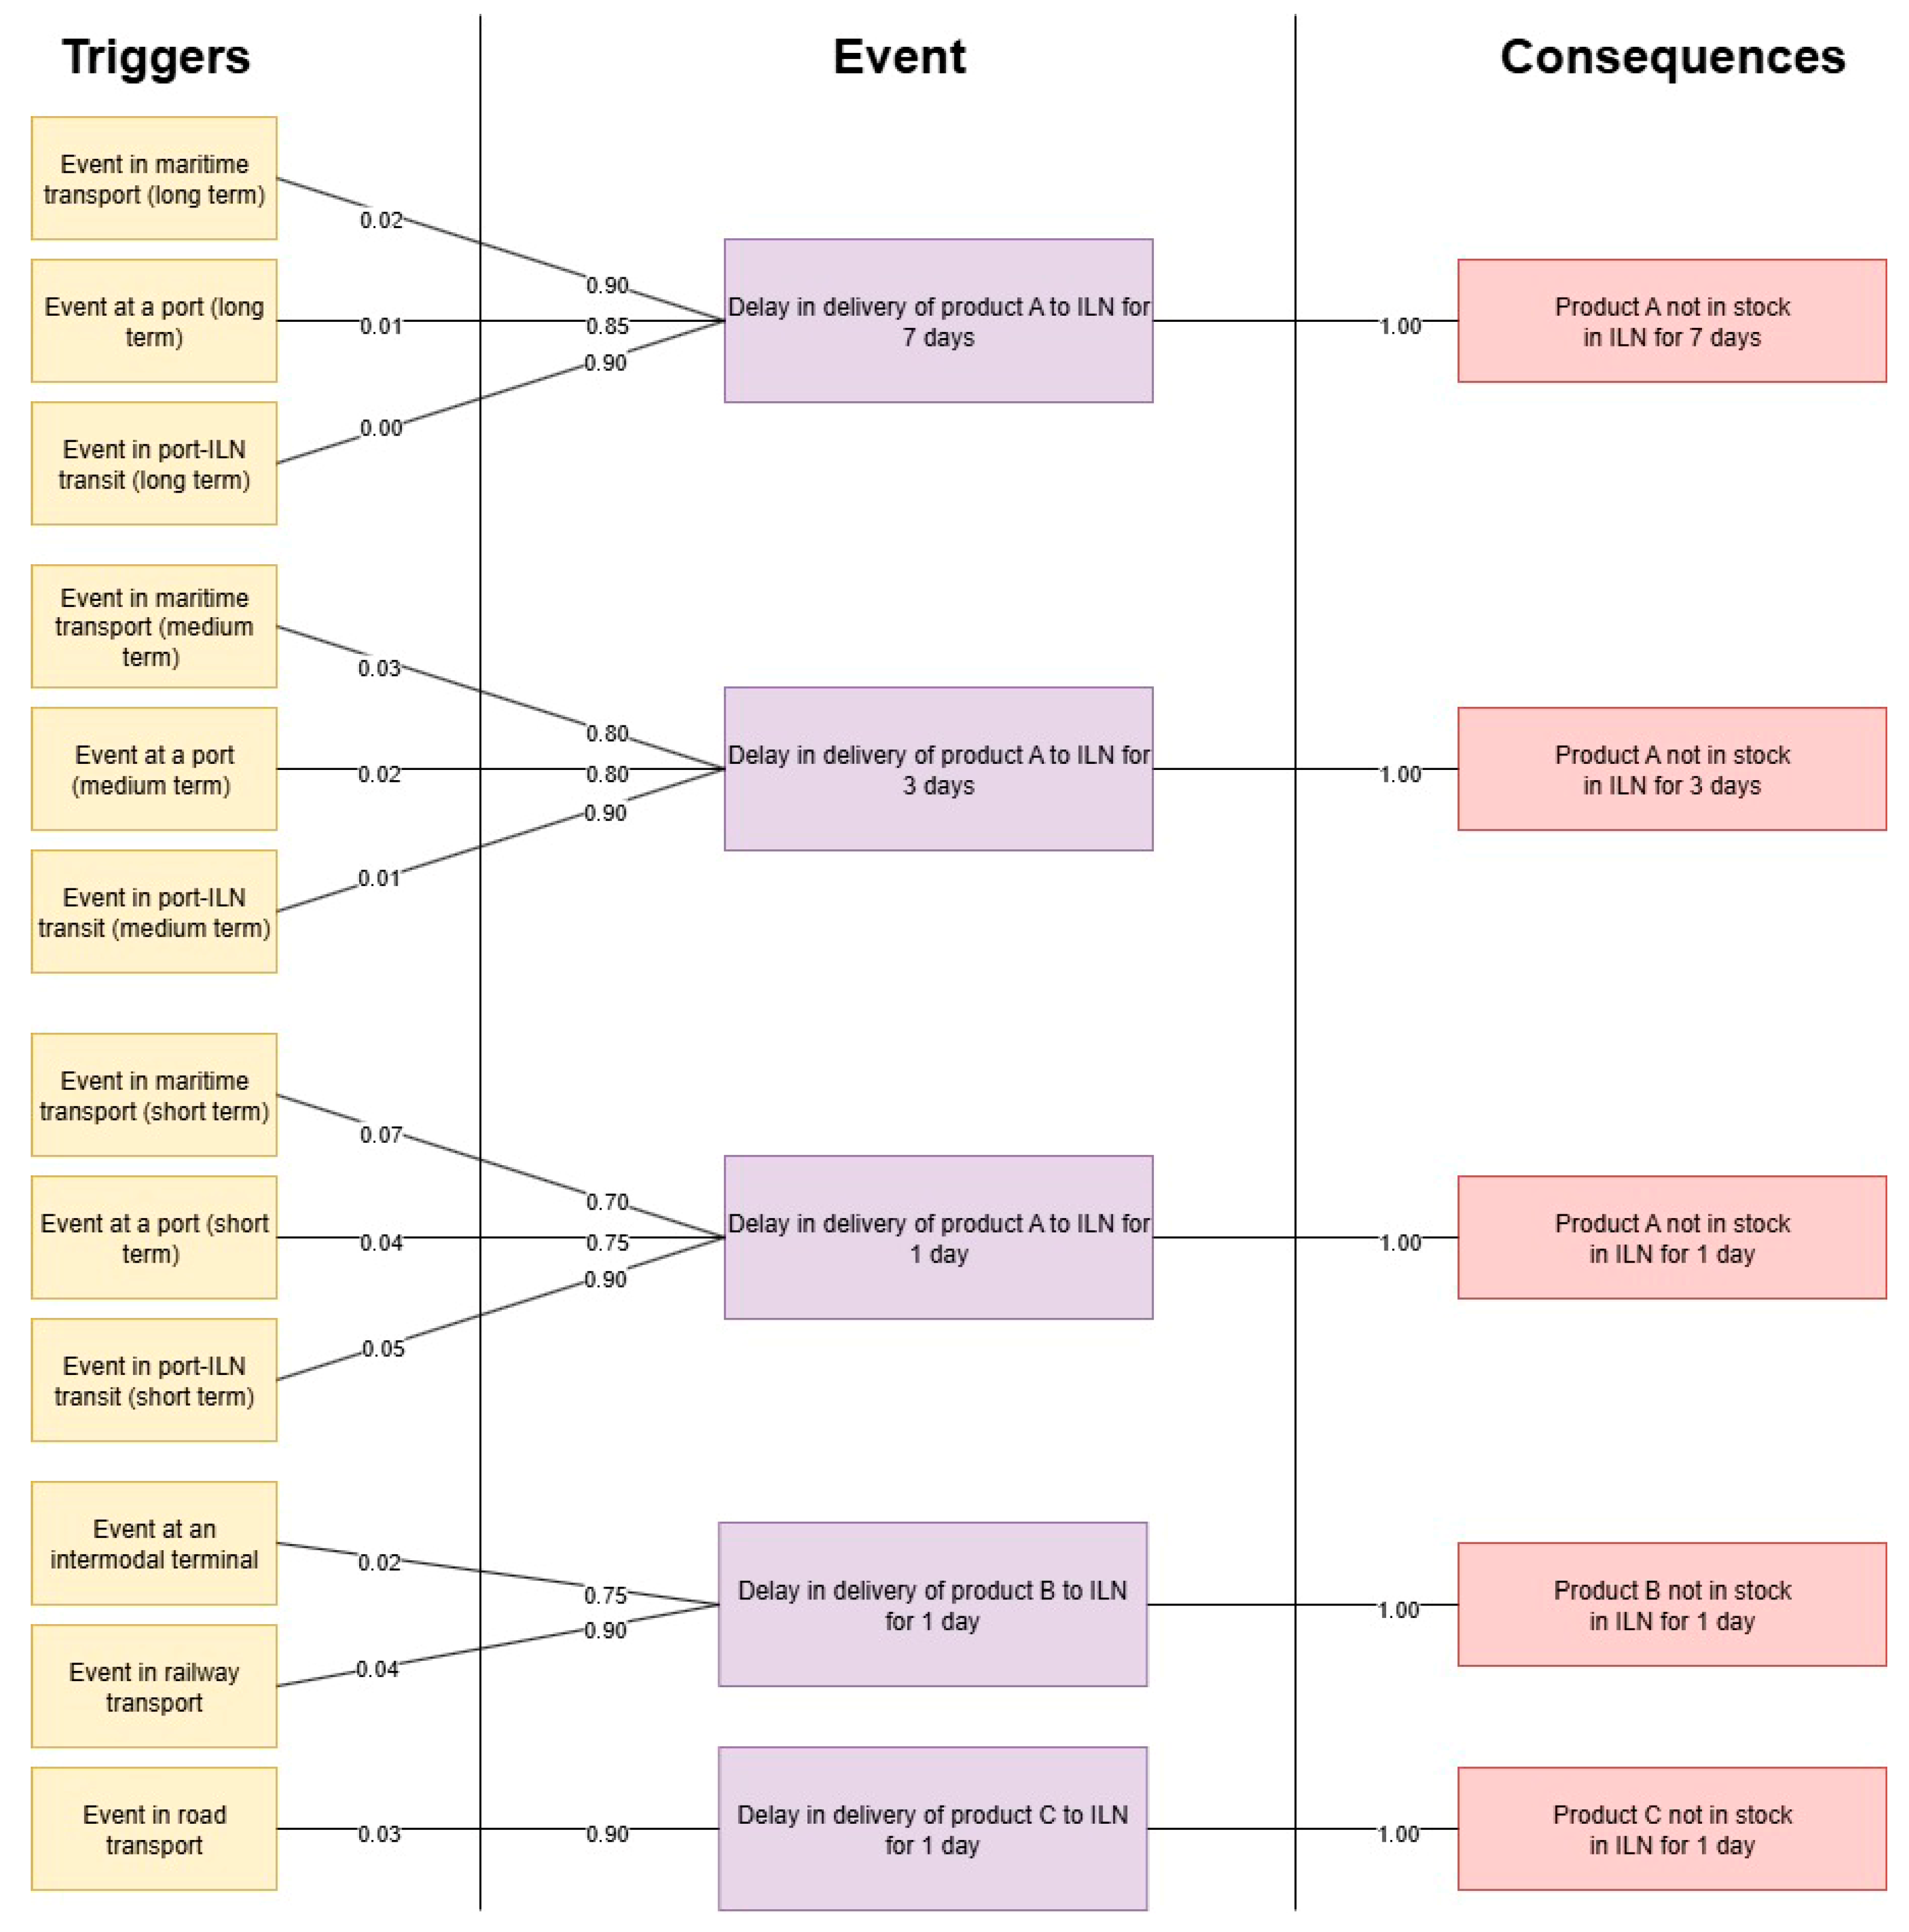
- the consequence “Product A not in stock in ILN for 7 days” has a probability factor of 1.00, provided the event Y “Delay in delivery of product A to INL for 7 days” occurs;
- (2)
- the event Y “Delay in delivery of product A to INL for 7 days” has a probability factor of 0.90, provided the trigger X “Event in maritime transport (long term)” occurs;
- (3)
- the trigger X “Event in maritime transport (long term)” has a probability factor 0.02.
- (i)
- Overnight stock in CLN and CMFMB is calculated as follows:
- (ii)
- Upgraded suppliers’ lead time of agglomeration transfers, i.e., on the ILN-CLN-CMFMB section, is calculated as follows:
- (iii)
- volume of BS in CLN is calculated as follows:
- (i)
- in CLN
- (ii)
- in CMFMB
5.2. A Case Study
5.2.1. Model Inputs
- (1)
- The standard level of cargo capacity utilisation is 83% for e-trucks (minimum 20 of 24 IRTs) and 50% for e-vans (minimum 3 of 6 IRTs).
- (2)
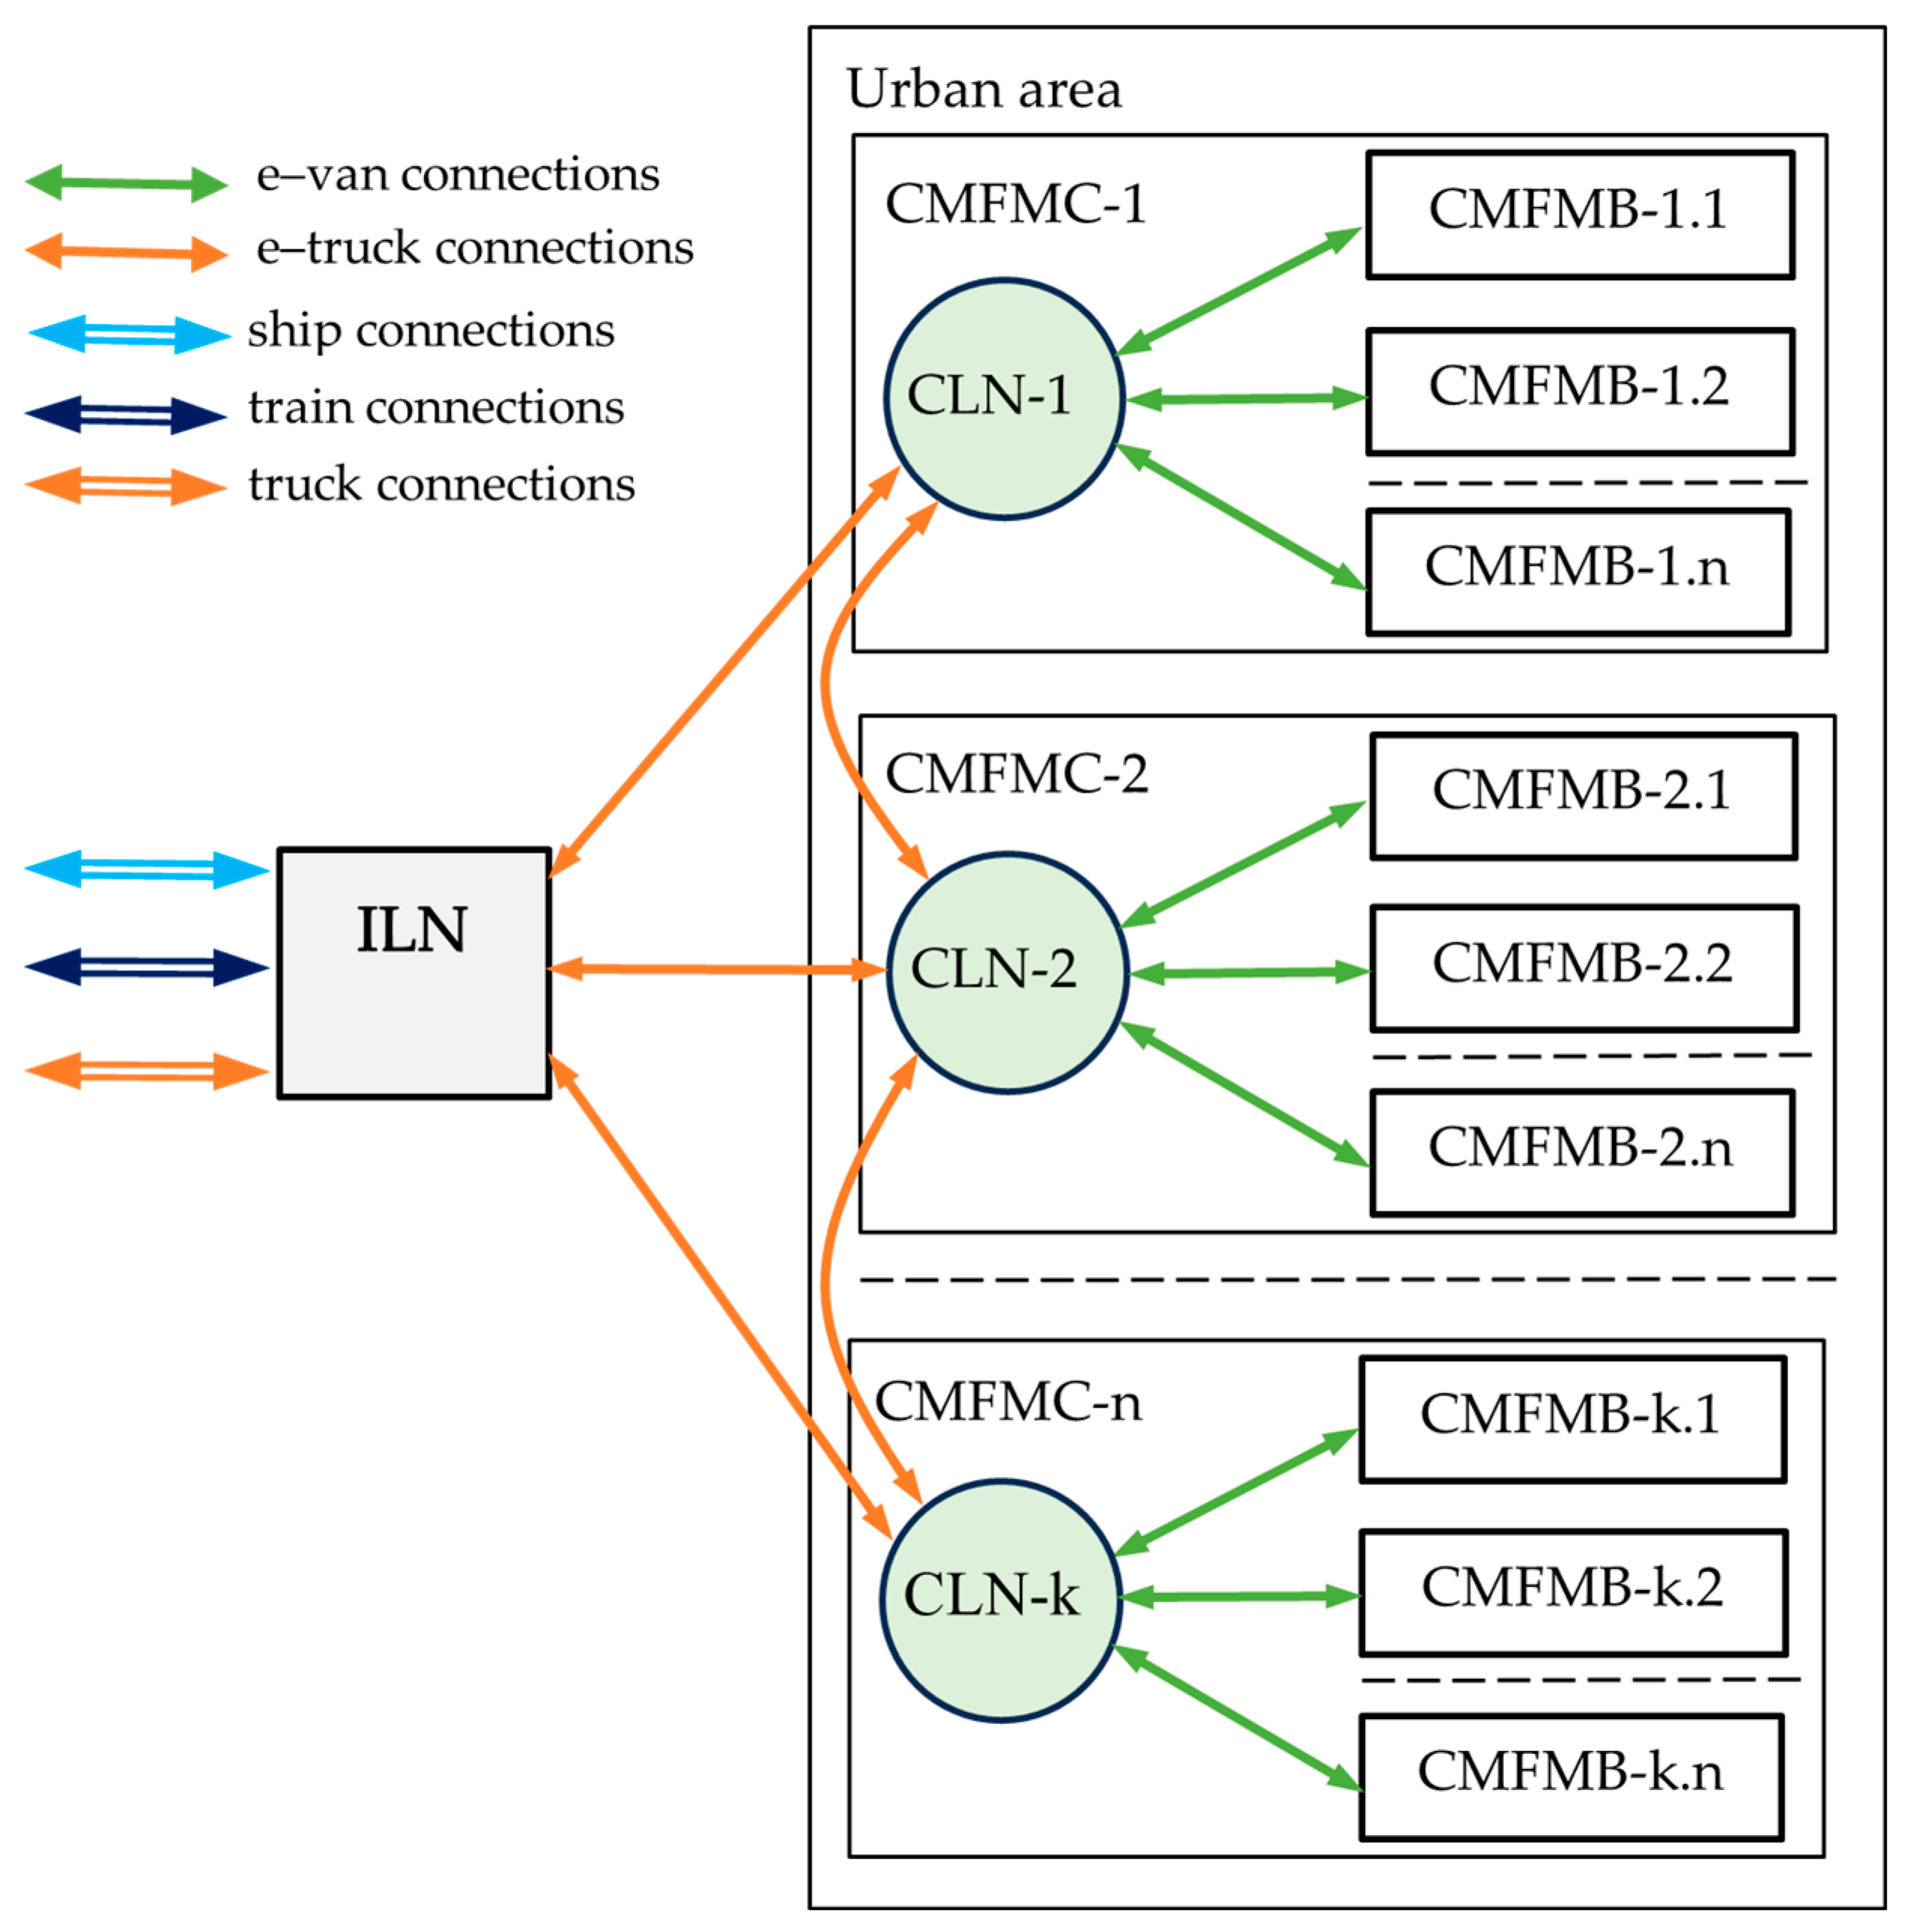
- Every CLN within the area of its CMFMC supplies four CMFMBs.
- (3)
- Demand ordered by each of four CMFMBs is generated randomly for each day and each production material, and its maximum value for one material is 3 tons/day, i.e., the daily demand may be 0% to 100% of the maximum value (Table 2).
- (4)
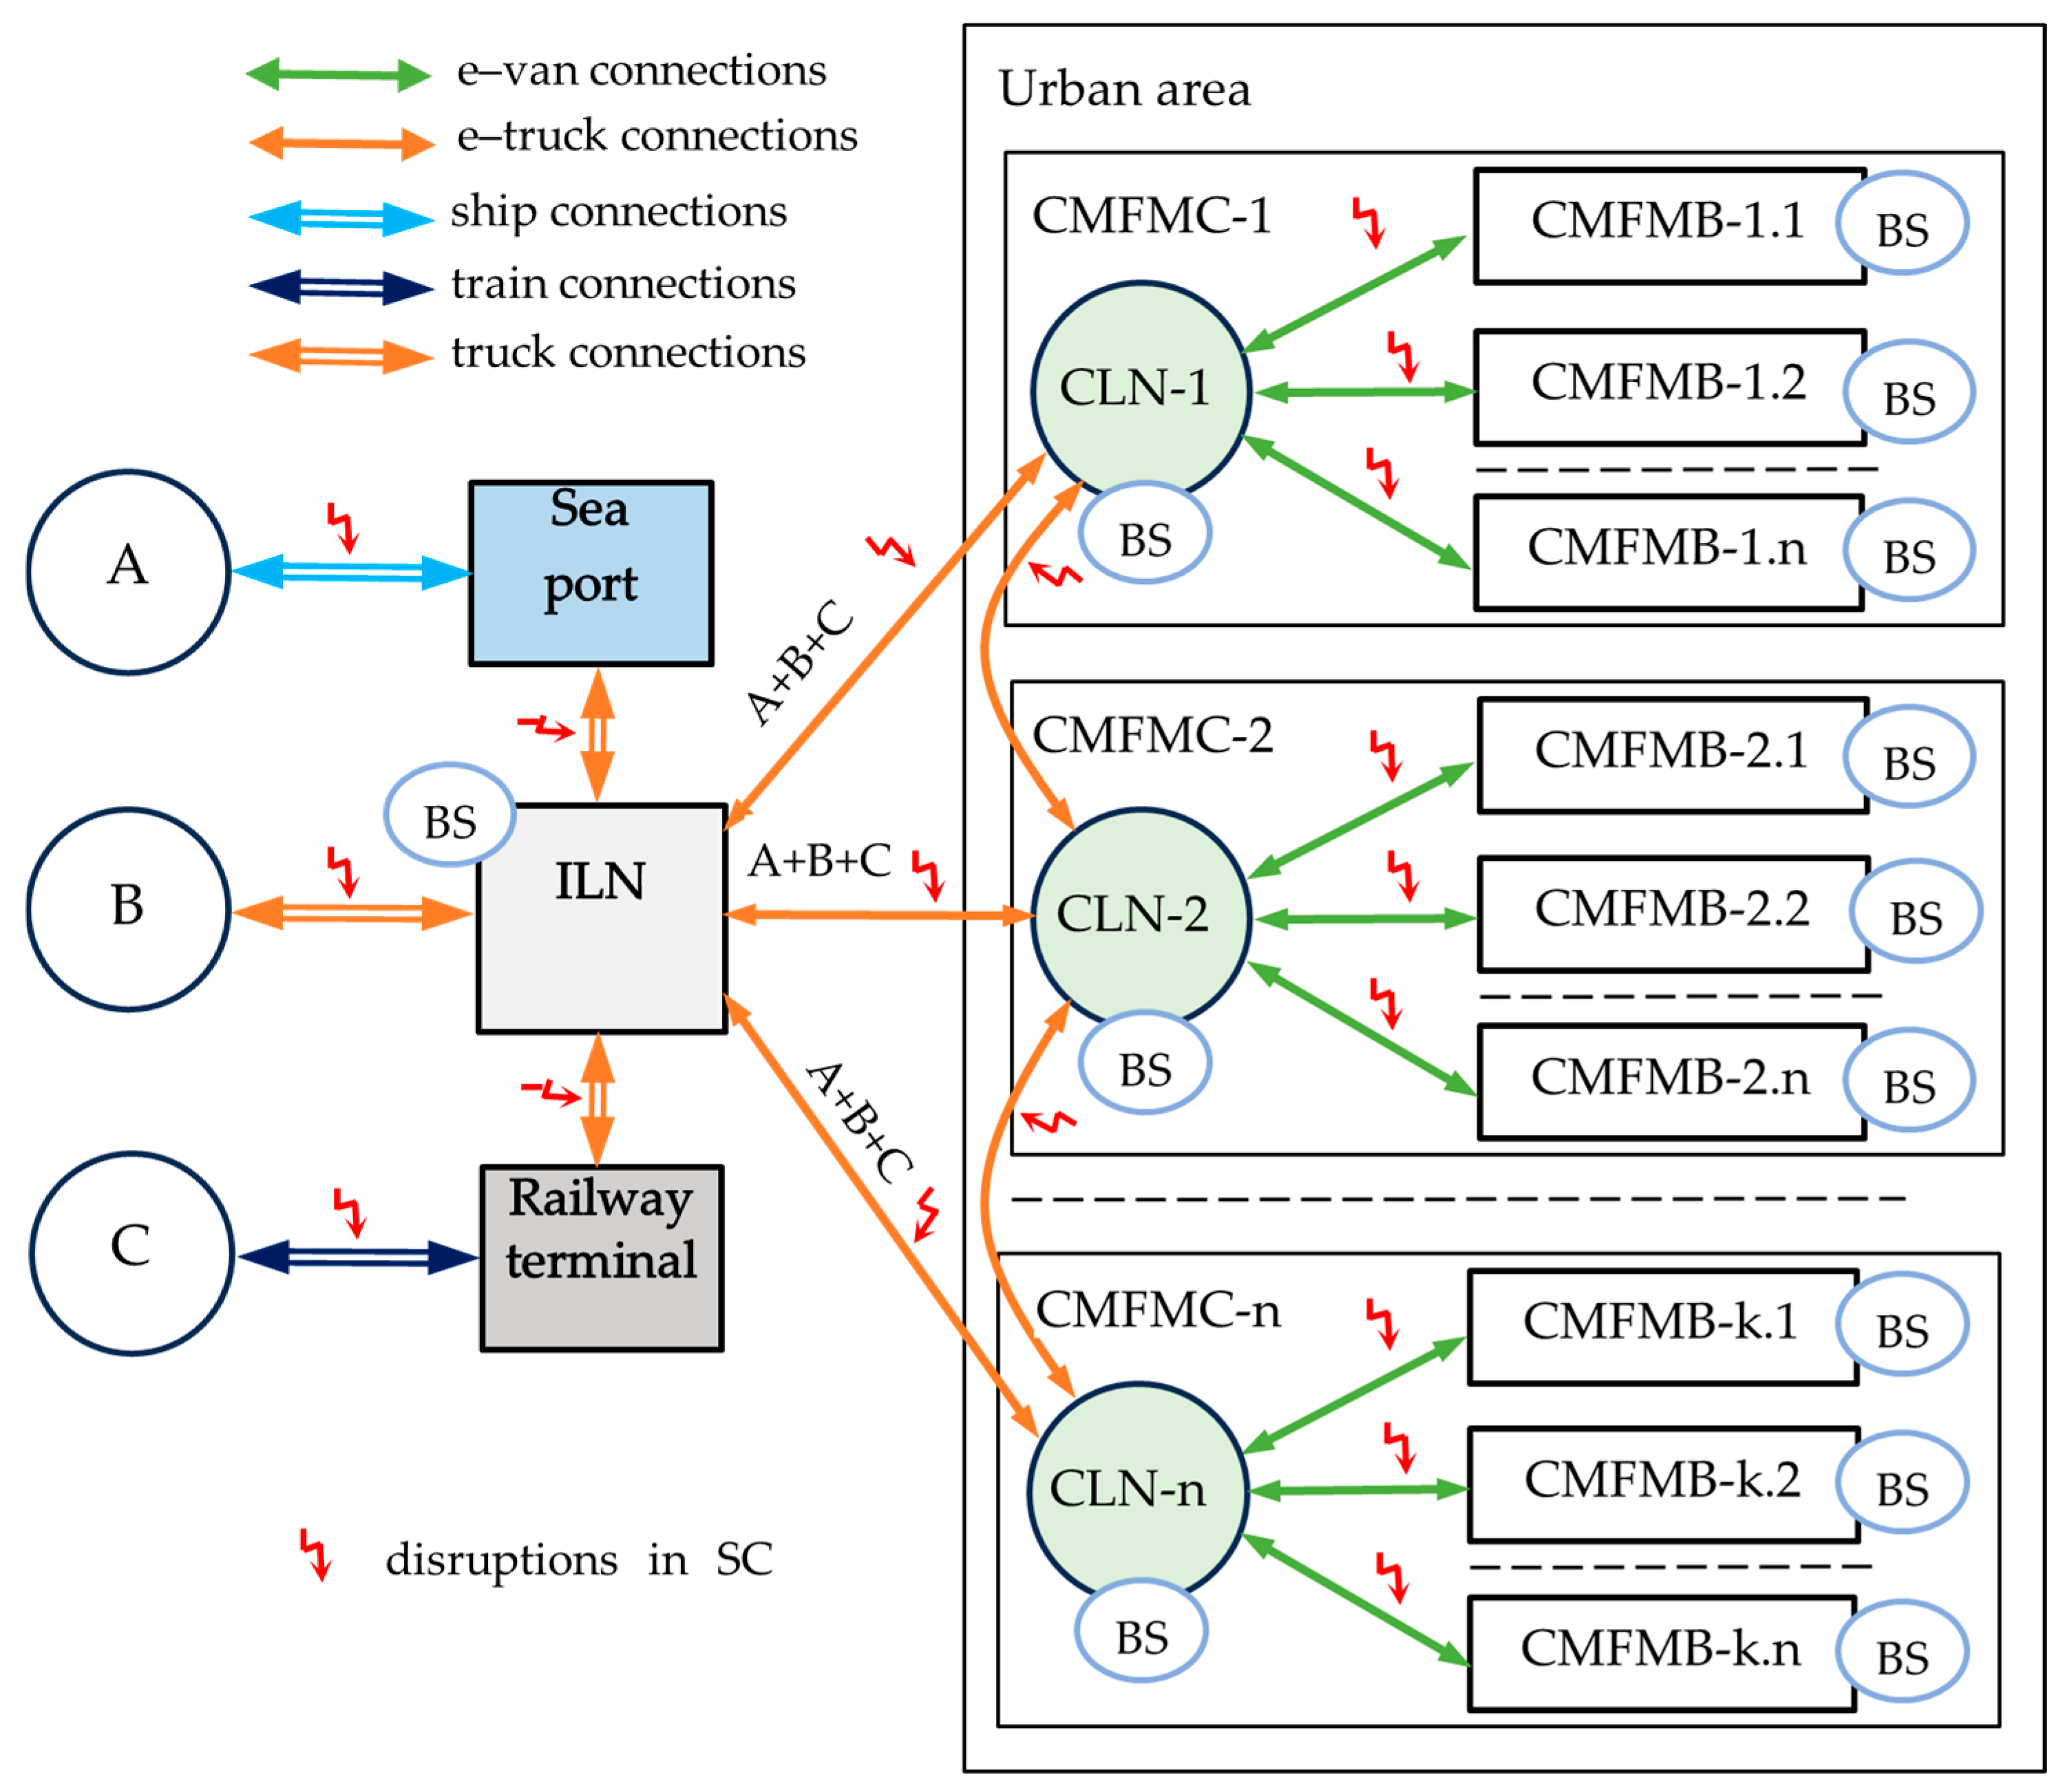
- Production materials are transported to ILN by different transport modes, in compliance with the principle that the largest share in the supply of production material A is provided by maritime transport, production material B by rail transport and production material C by heavy road transport (Figure 3).
- (5)
- The partial probabilities of transport disruptions identified for each engaged transport mode and supply chain stages are shown in Figure 4.
- (6)
- Parameters that determine supplier lead time:
5.2.2. Model Verification and Validation
- (1)
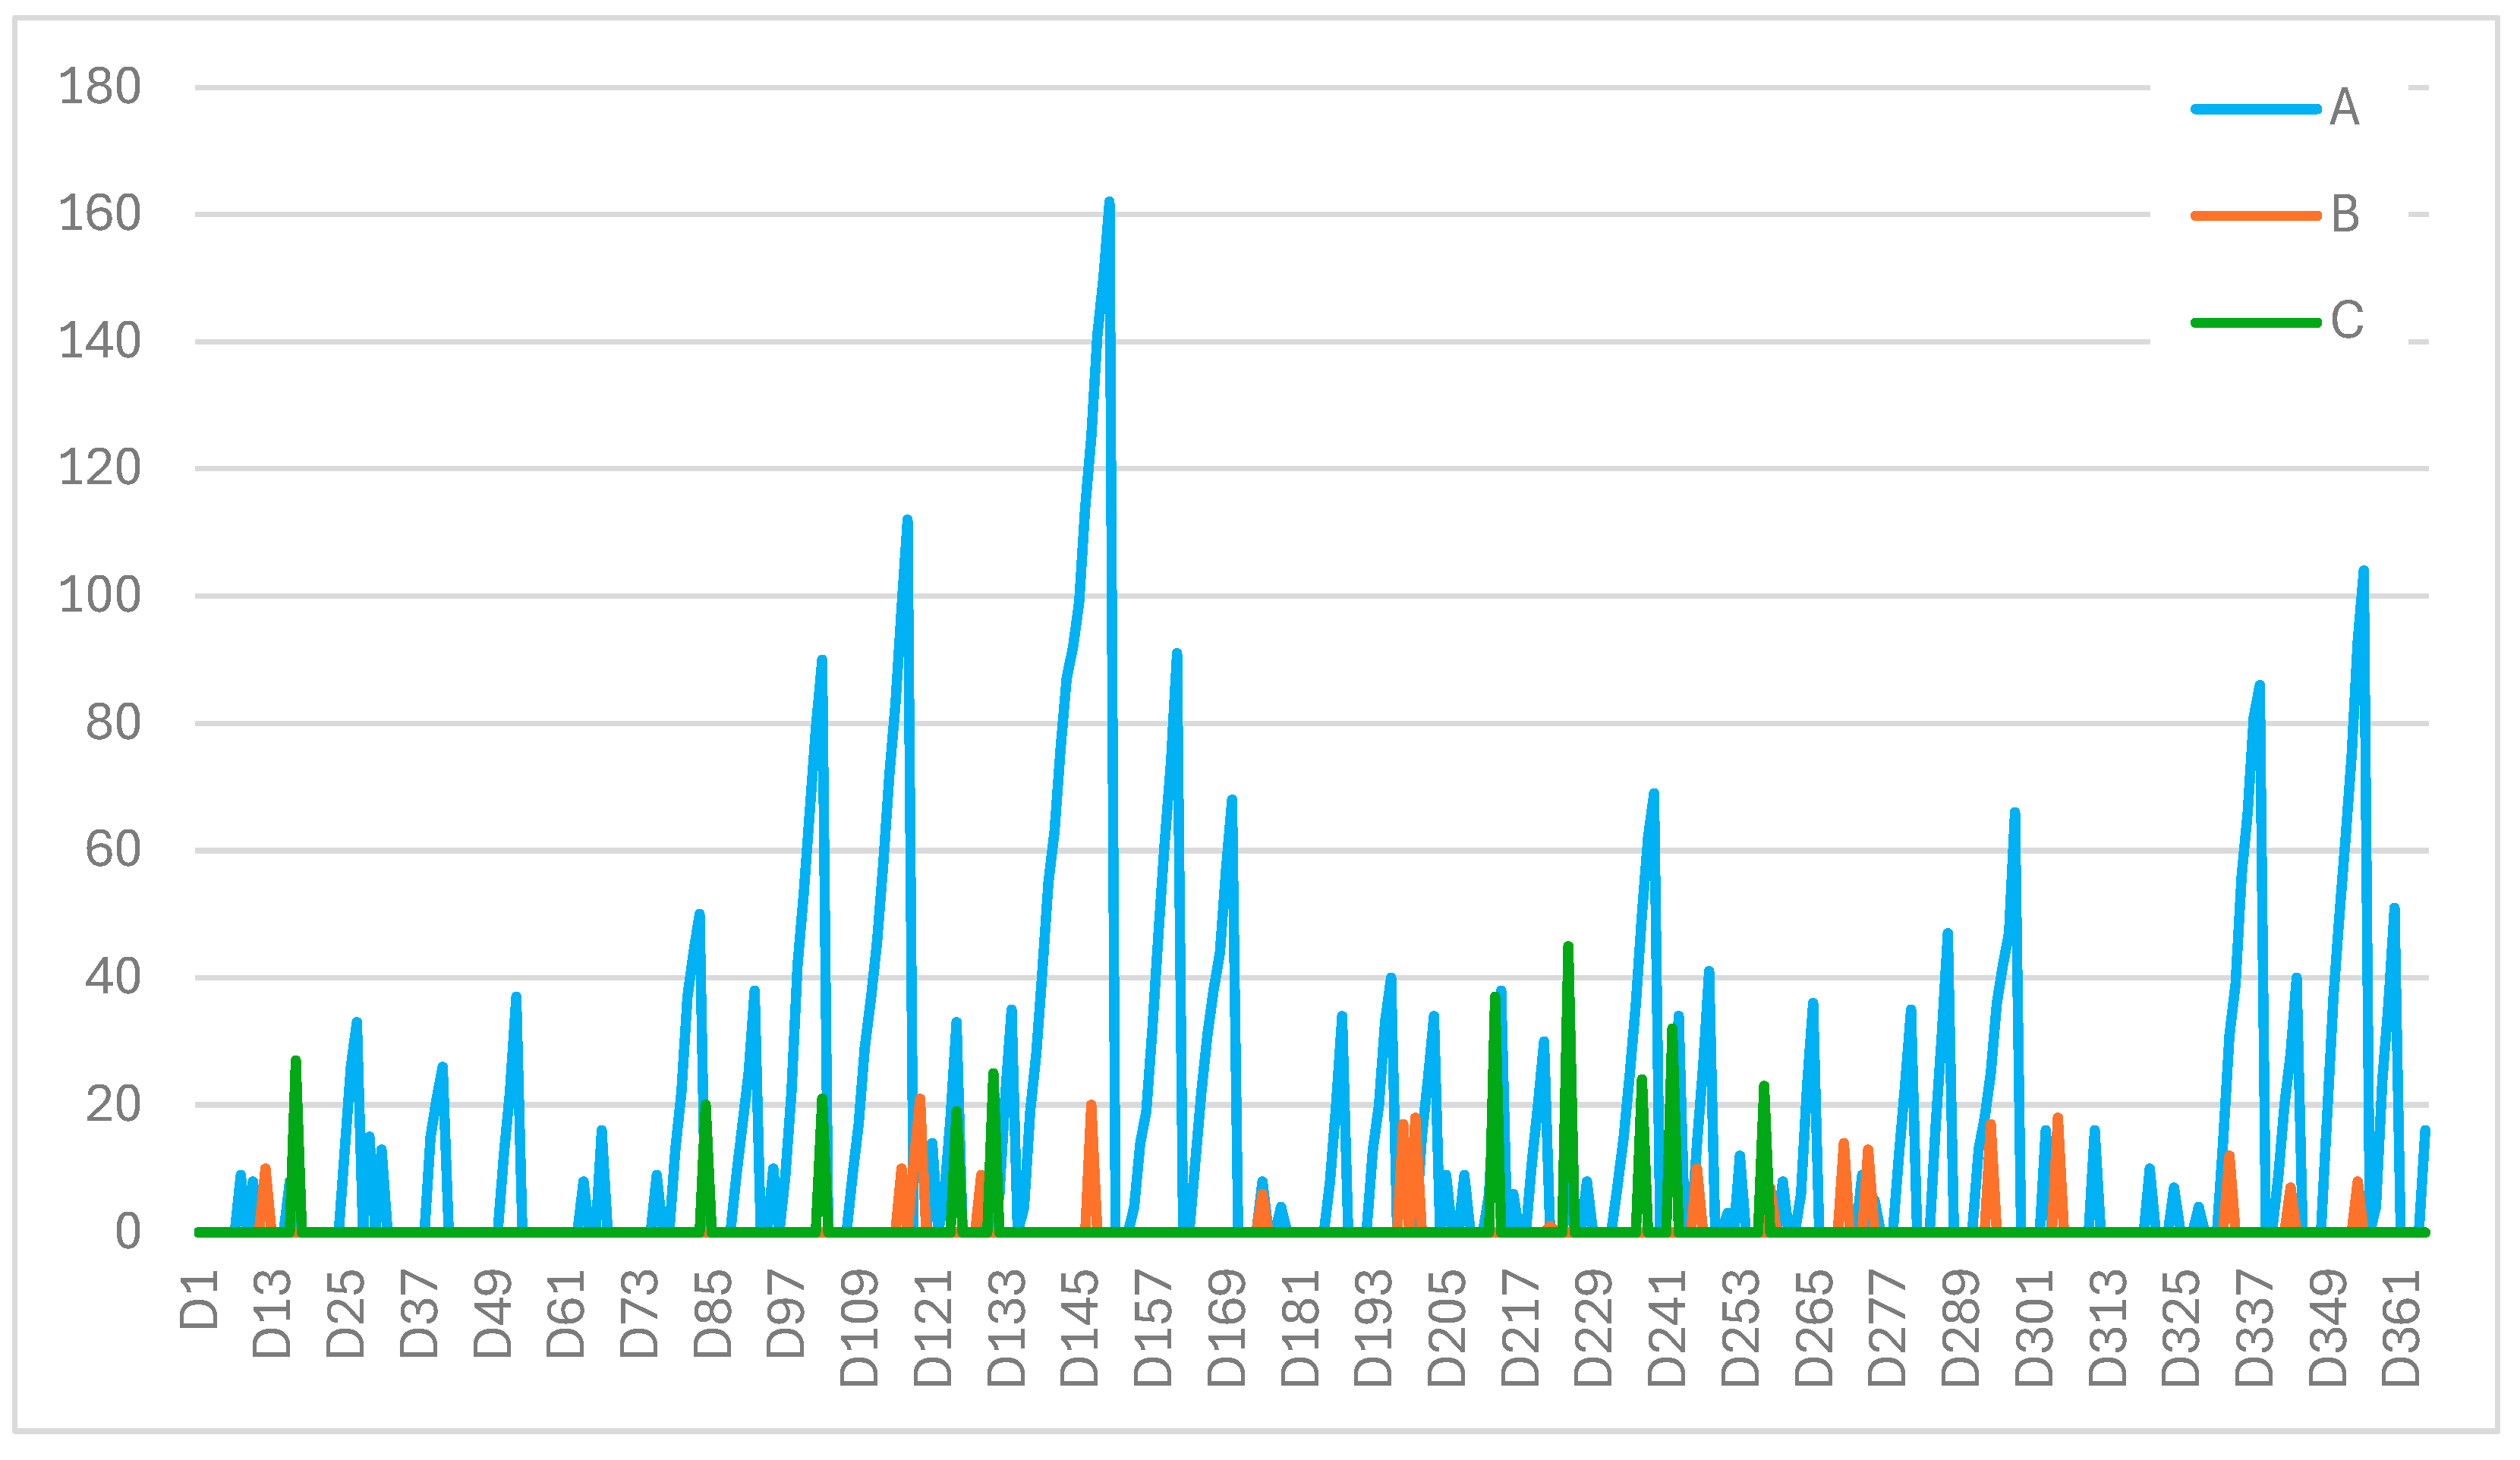
- Transport disruptions cause the cumulative time of the shortage of deliveries to CLN from 166 days per year for material A, 19 days per year for material B and 10 days per year for material B. Differences result from different probabilities of disruptions and their negative effects assigned to other transport modes involved in intermodal transport. Thus, in maritime transport, which carries out the main part of the carriage of production material A, events that trigger delivery delays to ILN for up to 7 days are assigned. In the case of long-distance rail and heavy road transport, which are responsible for transporting production materials B and C, the maximum delivery delay to ILN can be 1 day.
- (2)
- Disruptions in intermodal transportation result in the inability to deliver materials ordered for production according to the ‘next-day delivery’ rule. The shortage of production materials in CLN accumulates with increasing delay time. The largest deficit maxis observed in the case of production material A, where the most significant volume of missing material was 165 IRT, corresponding to a mass of 82.5 tons. For production materials B and C, the maximum volumes of shortage are much lower, i.e., 23 IRT (9.2 tons) and 48 IRT (9.6 tons), respectively.
- (3)
- Shortages in deliveries to CLN translate into shortages in deliveries to individual production enterprises in CMFMBs. Considering the dynamically changing orders, different for each CMFMB, the maximum shortages max and the cumulative time of production materials shortage in each CMFMB, there are differences. For the four CMFMBs operated by one CLN, the longest waiting time and shortage volume were for production material A, namely CMFMB(1) had to wait 160 days for this material, and CMFMB(4) had a material A shortage as much as 47.4 IRT (23.7 tons). The distribution of production material shortages between individual buildings is uneven and, on average, annually ranges from 19% to 30% for one CMFMB concerning the entire volume of production material needed in a given cluster.
- (4)
- There is no clear correlation between volumes of overnight stock maintained in CLN or CMFMBs and BSL variants. A significant correlation has been identified between maximum and average overnight stock values in CMFMBs and CLN concerning different types of production materials. This results from the adopted priority rule in loading production materials into e-vans while maintaining their minimum 83% capacity utilisation level. Surplus IRTs are selected so that IRTs with material A are sent from CLN to CMFMBs first, followed by B and then C. Hence, in CLN, the maximum and average O overnight stocks are smallest for production material A and largest for production material C, as shown by the median i . The opposite relationship occurs in CMFMBs, where surplus materials are stored upon arrival from CLN. The overnight stocks are largest for production material A and smallest for material C, as shown by the medians i .
- (5)
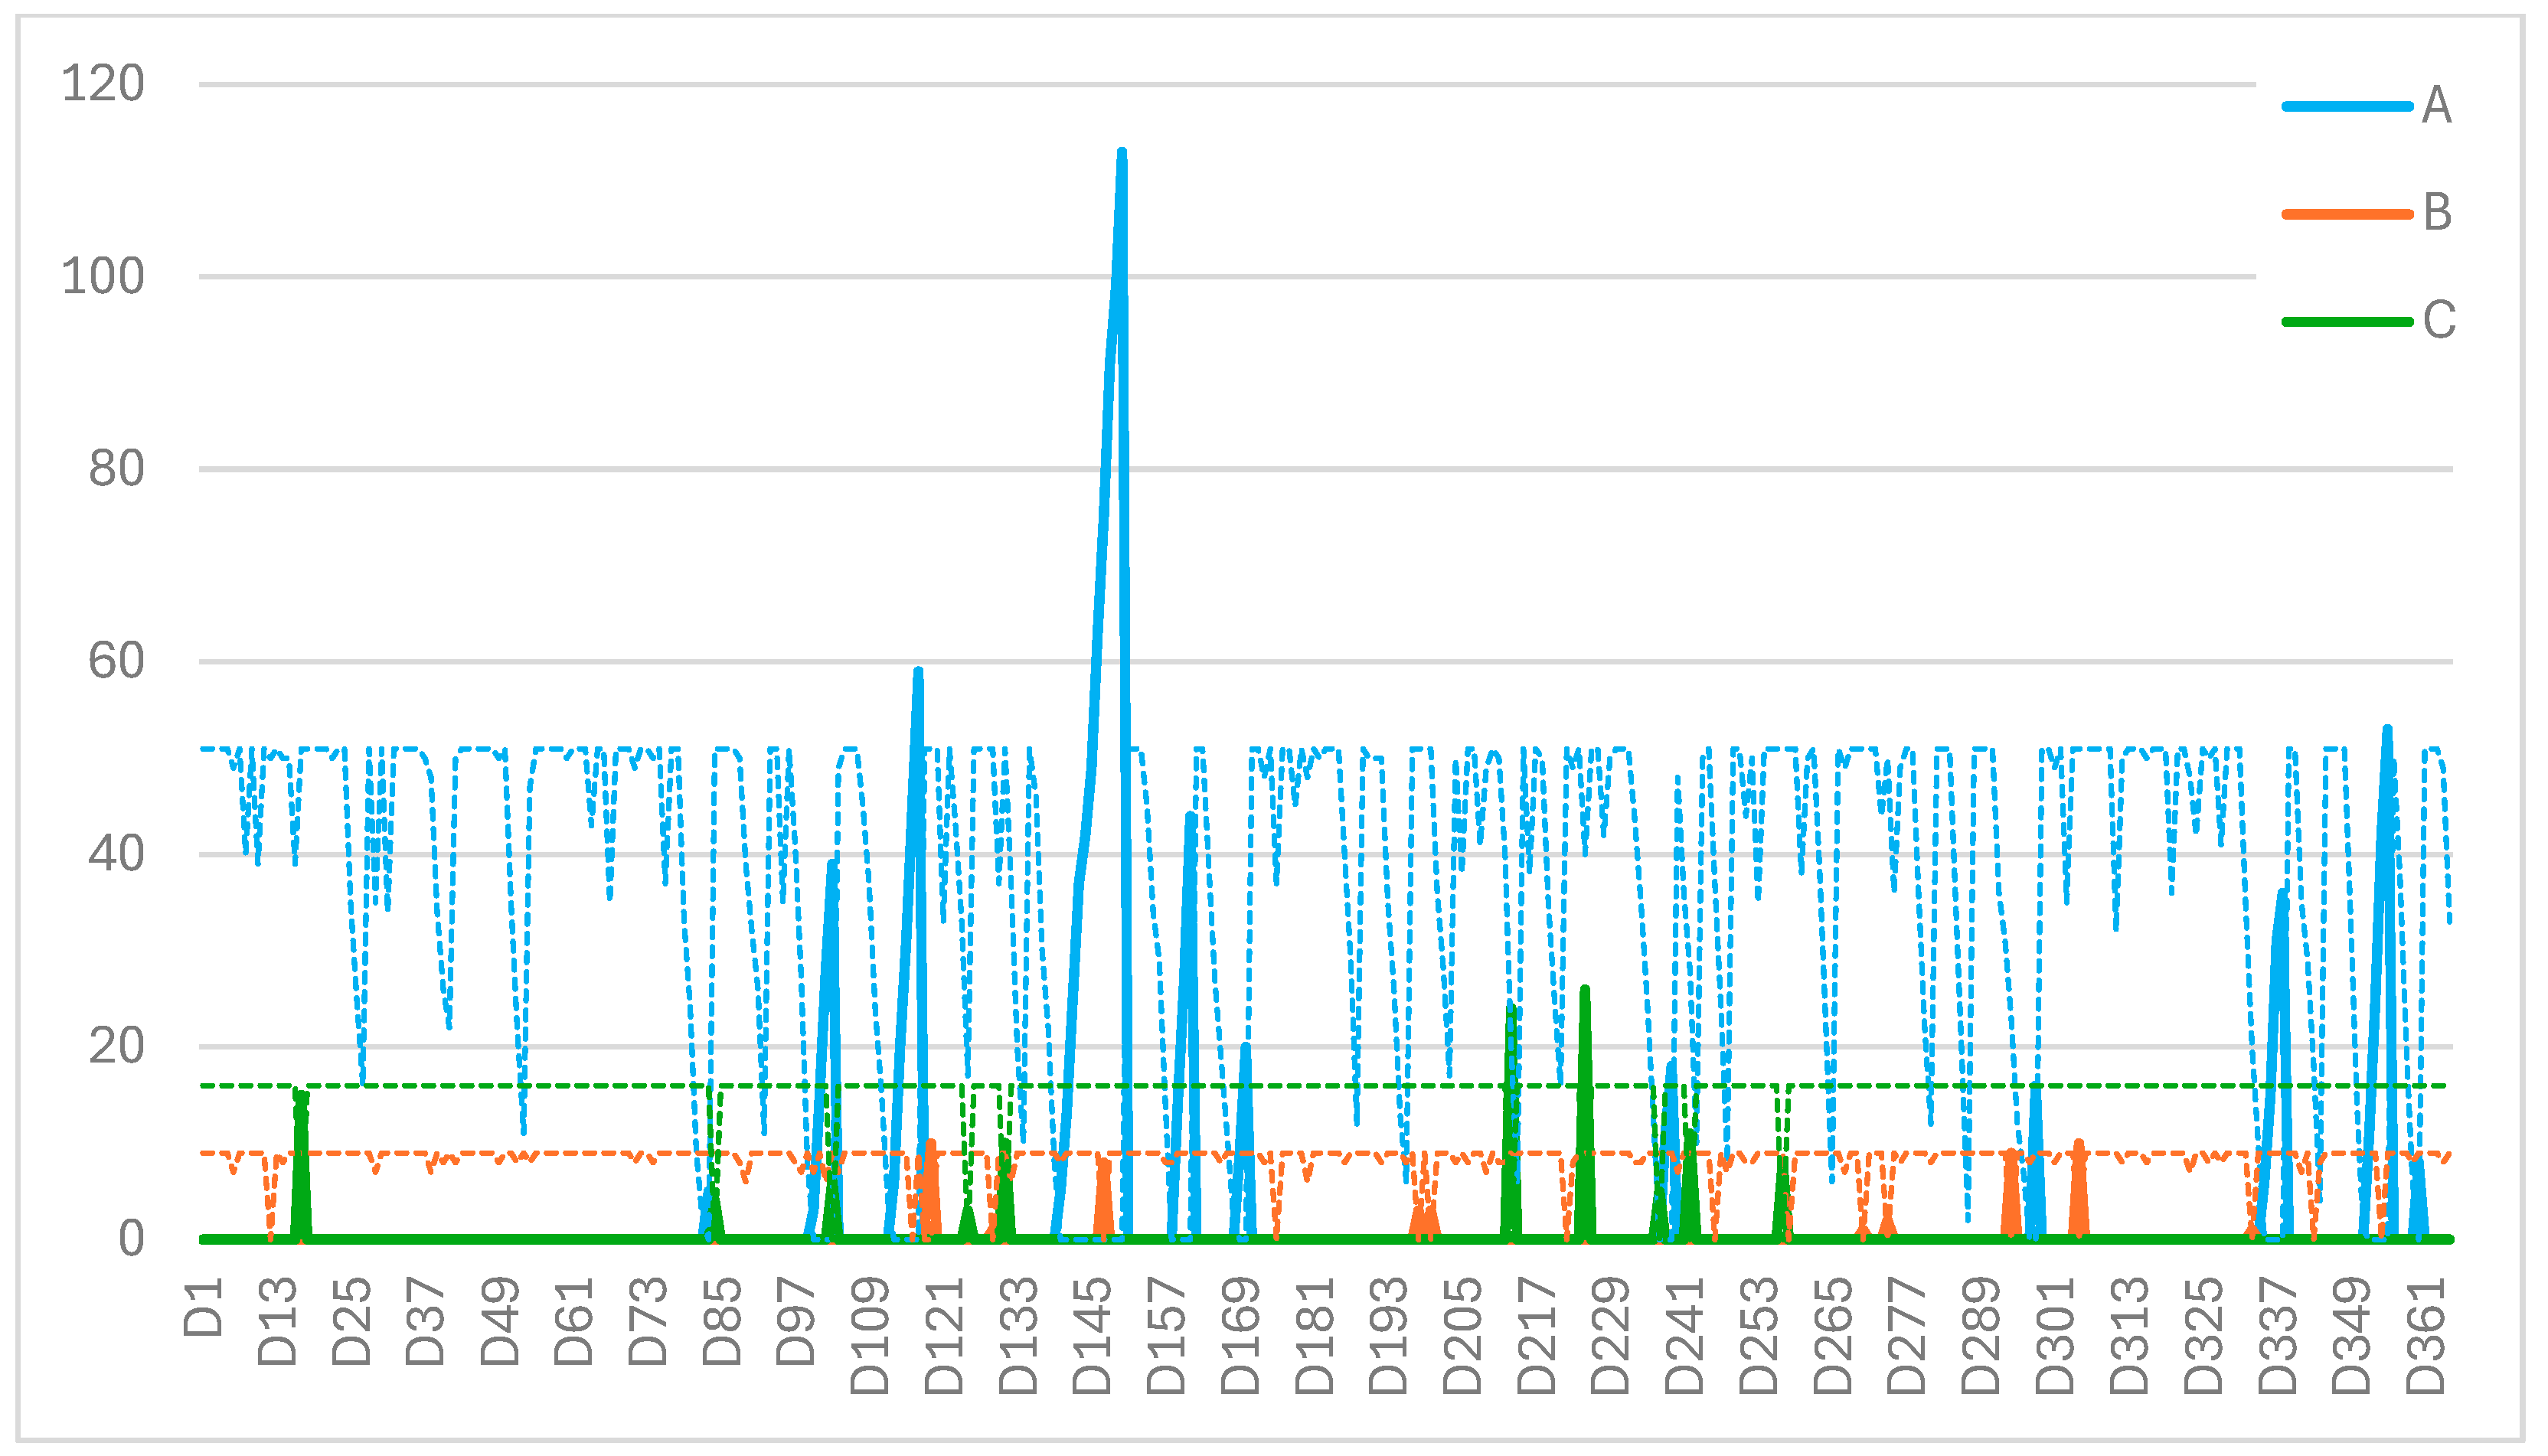
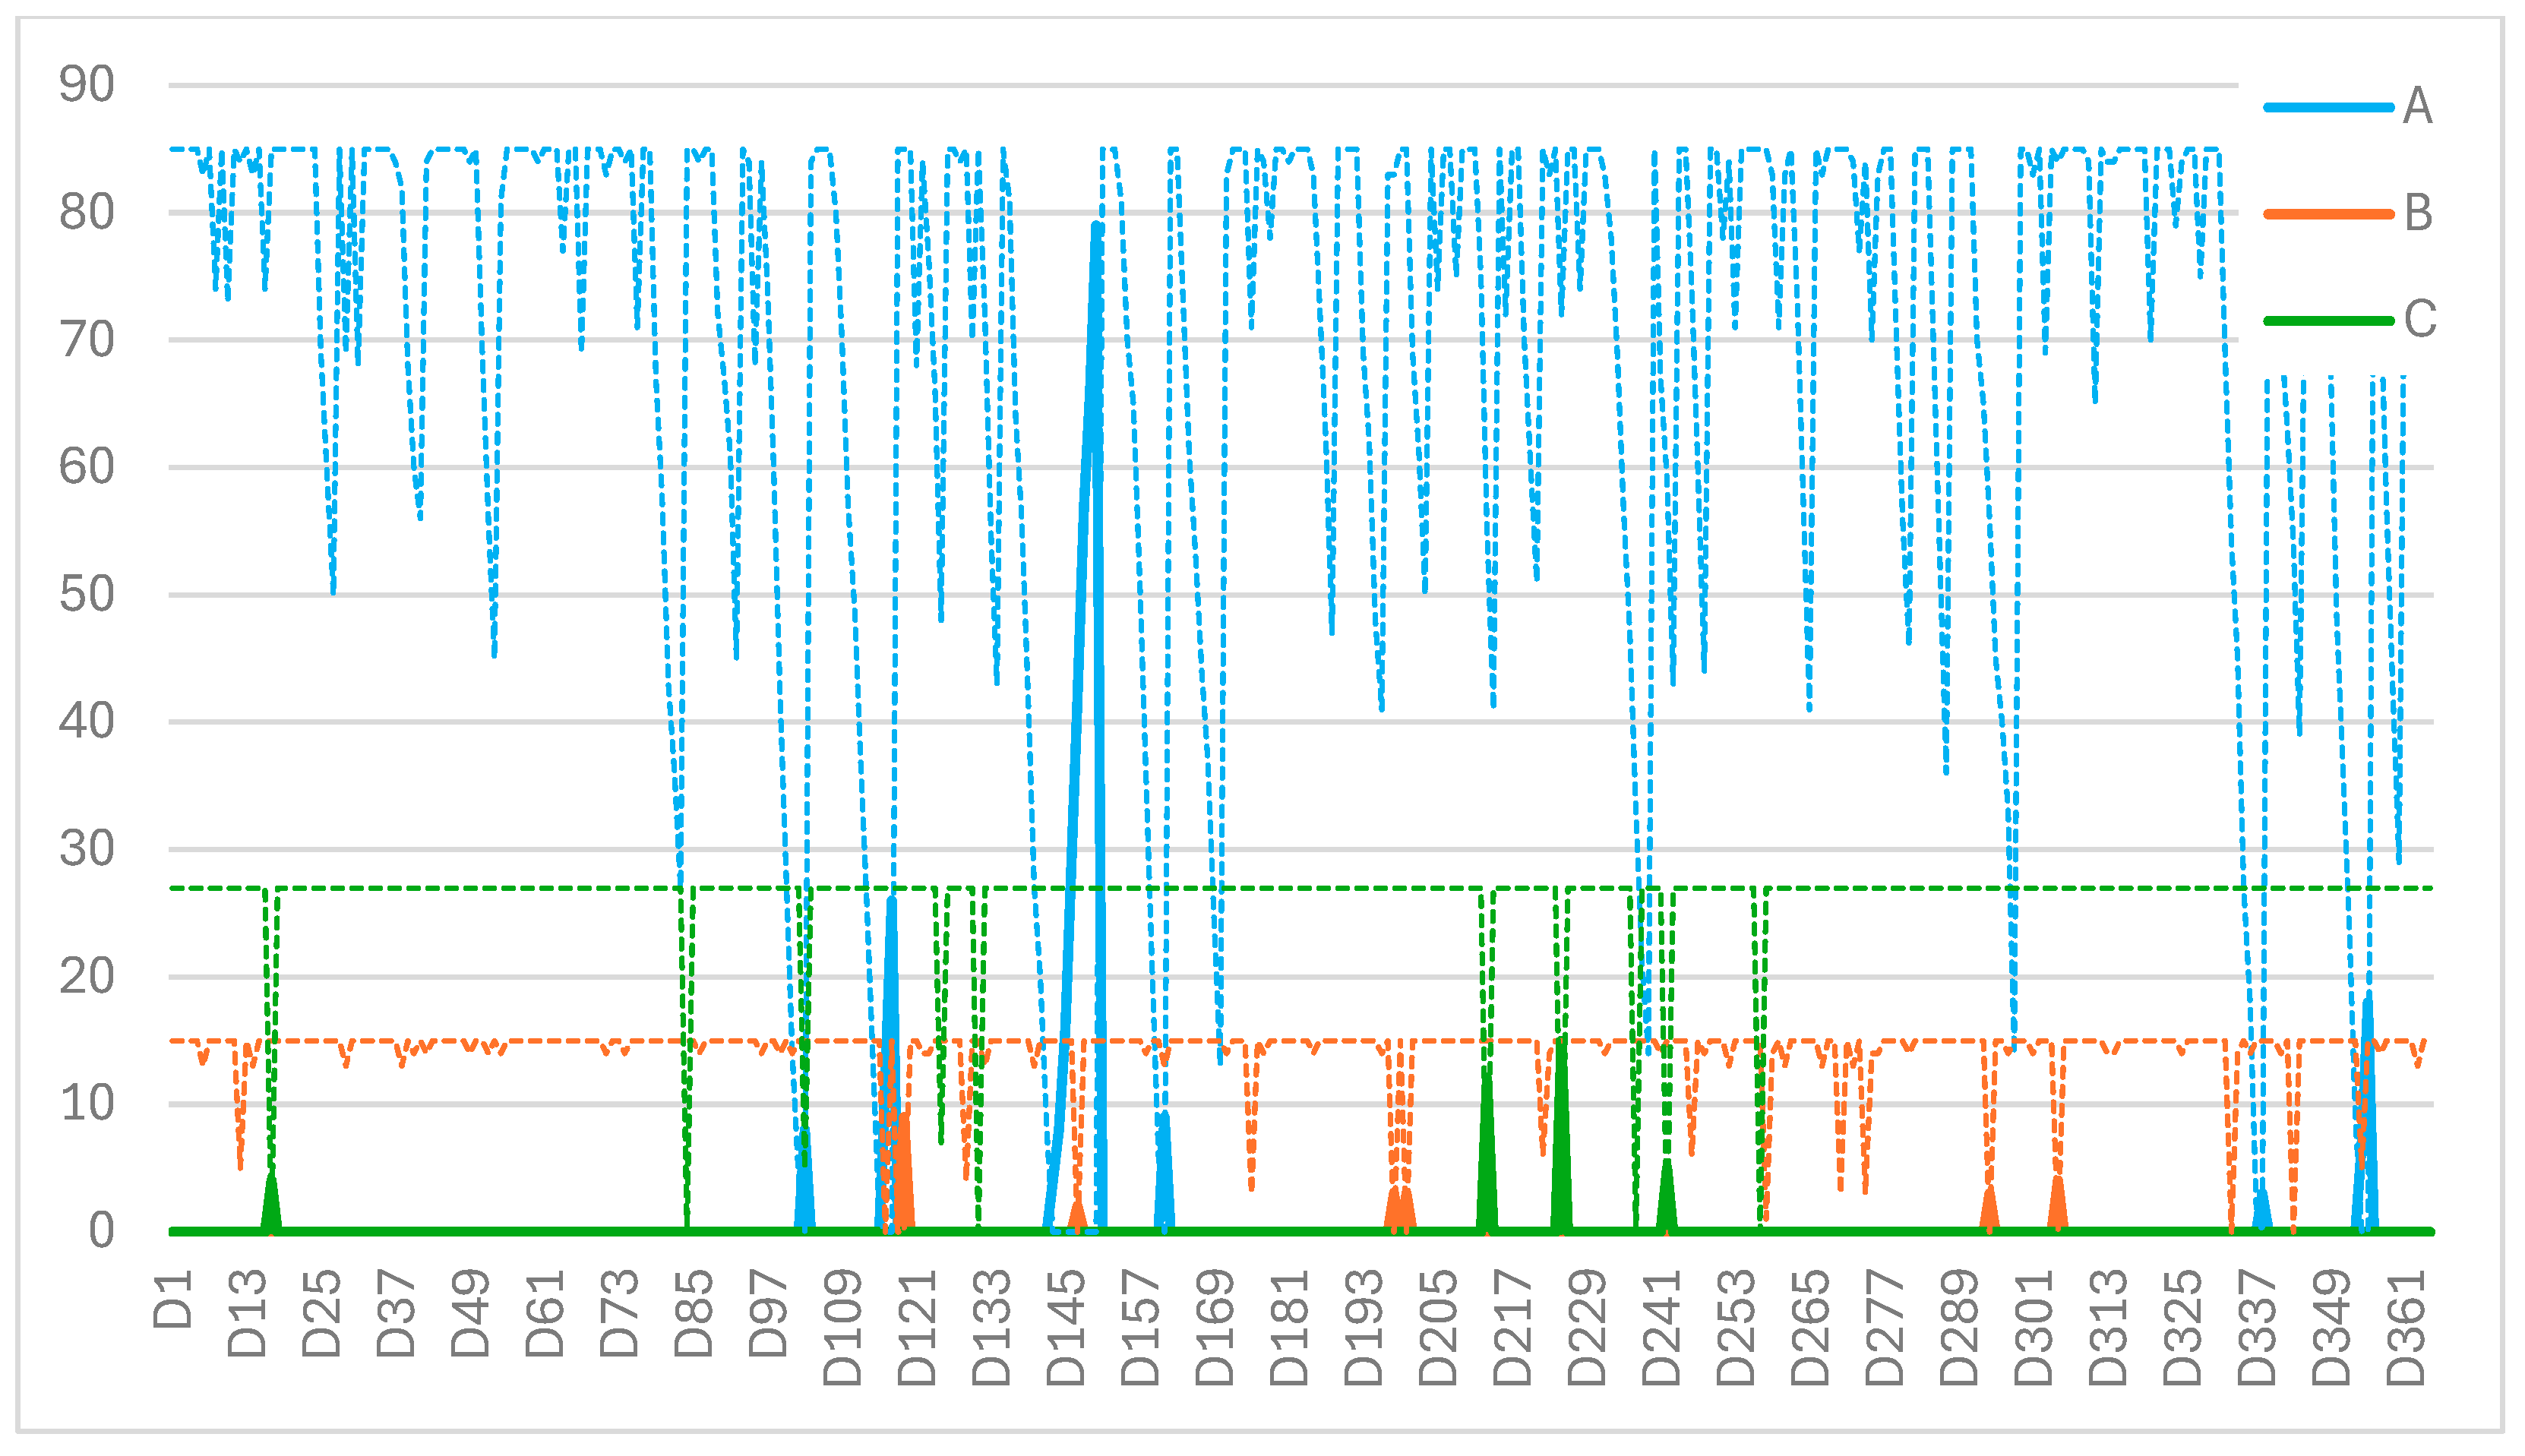
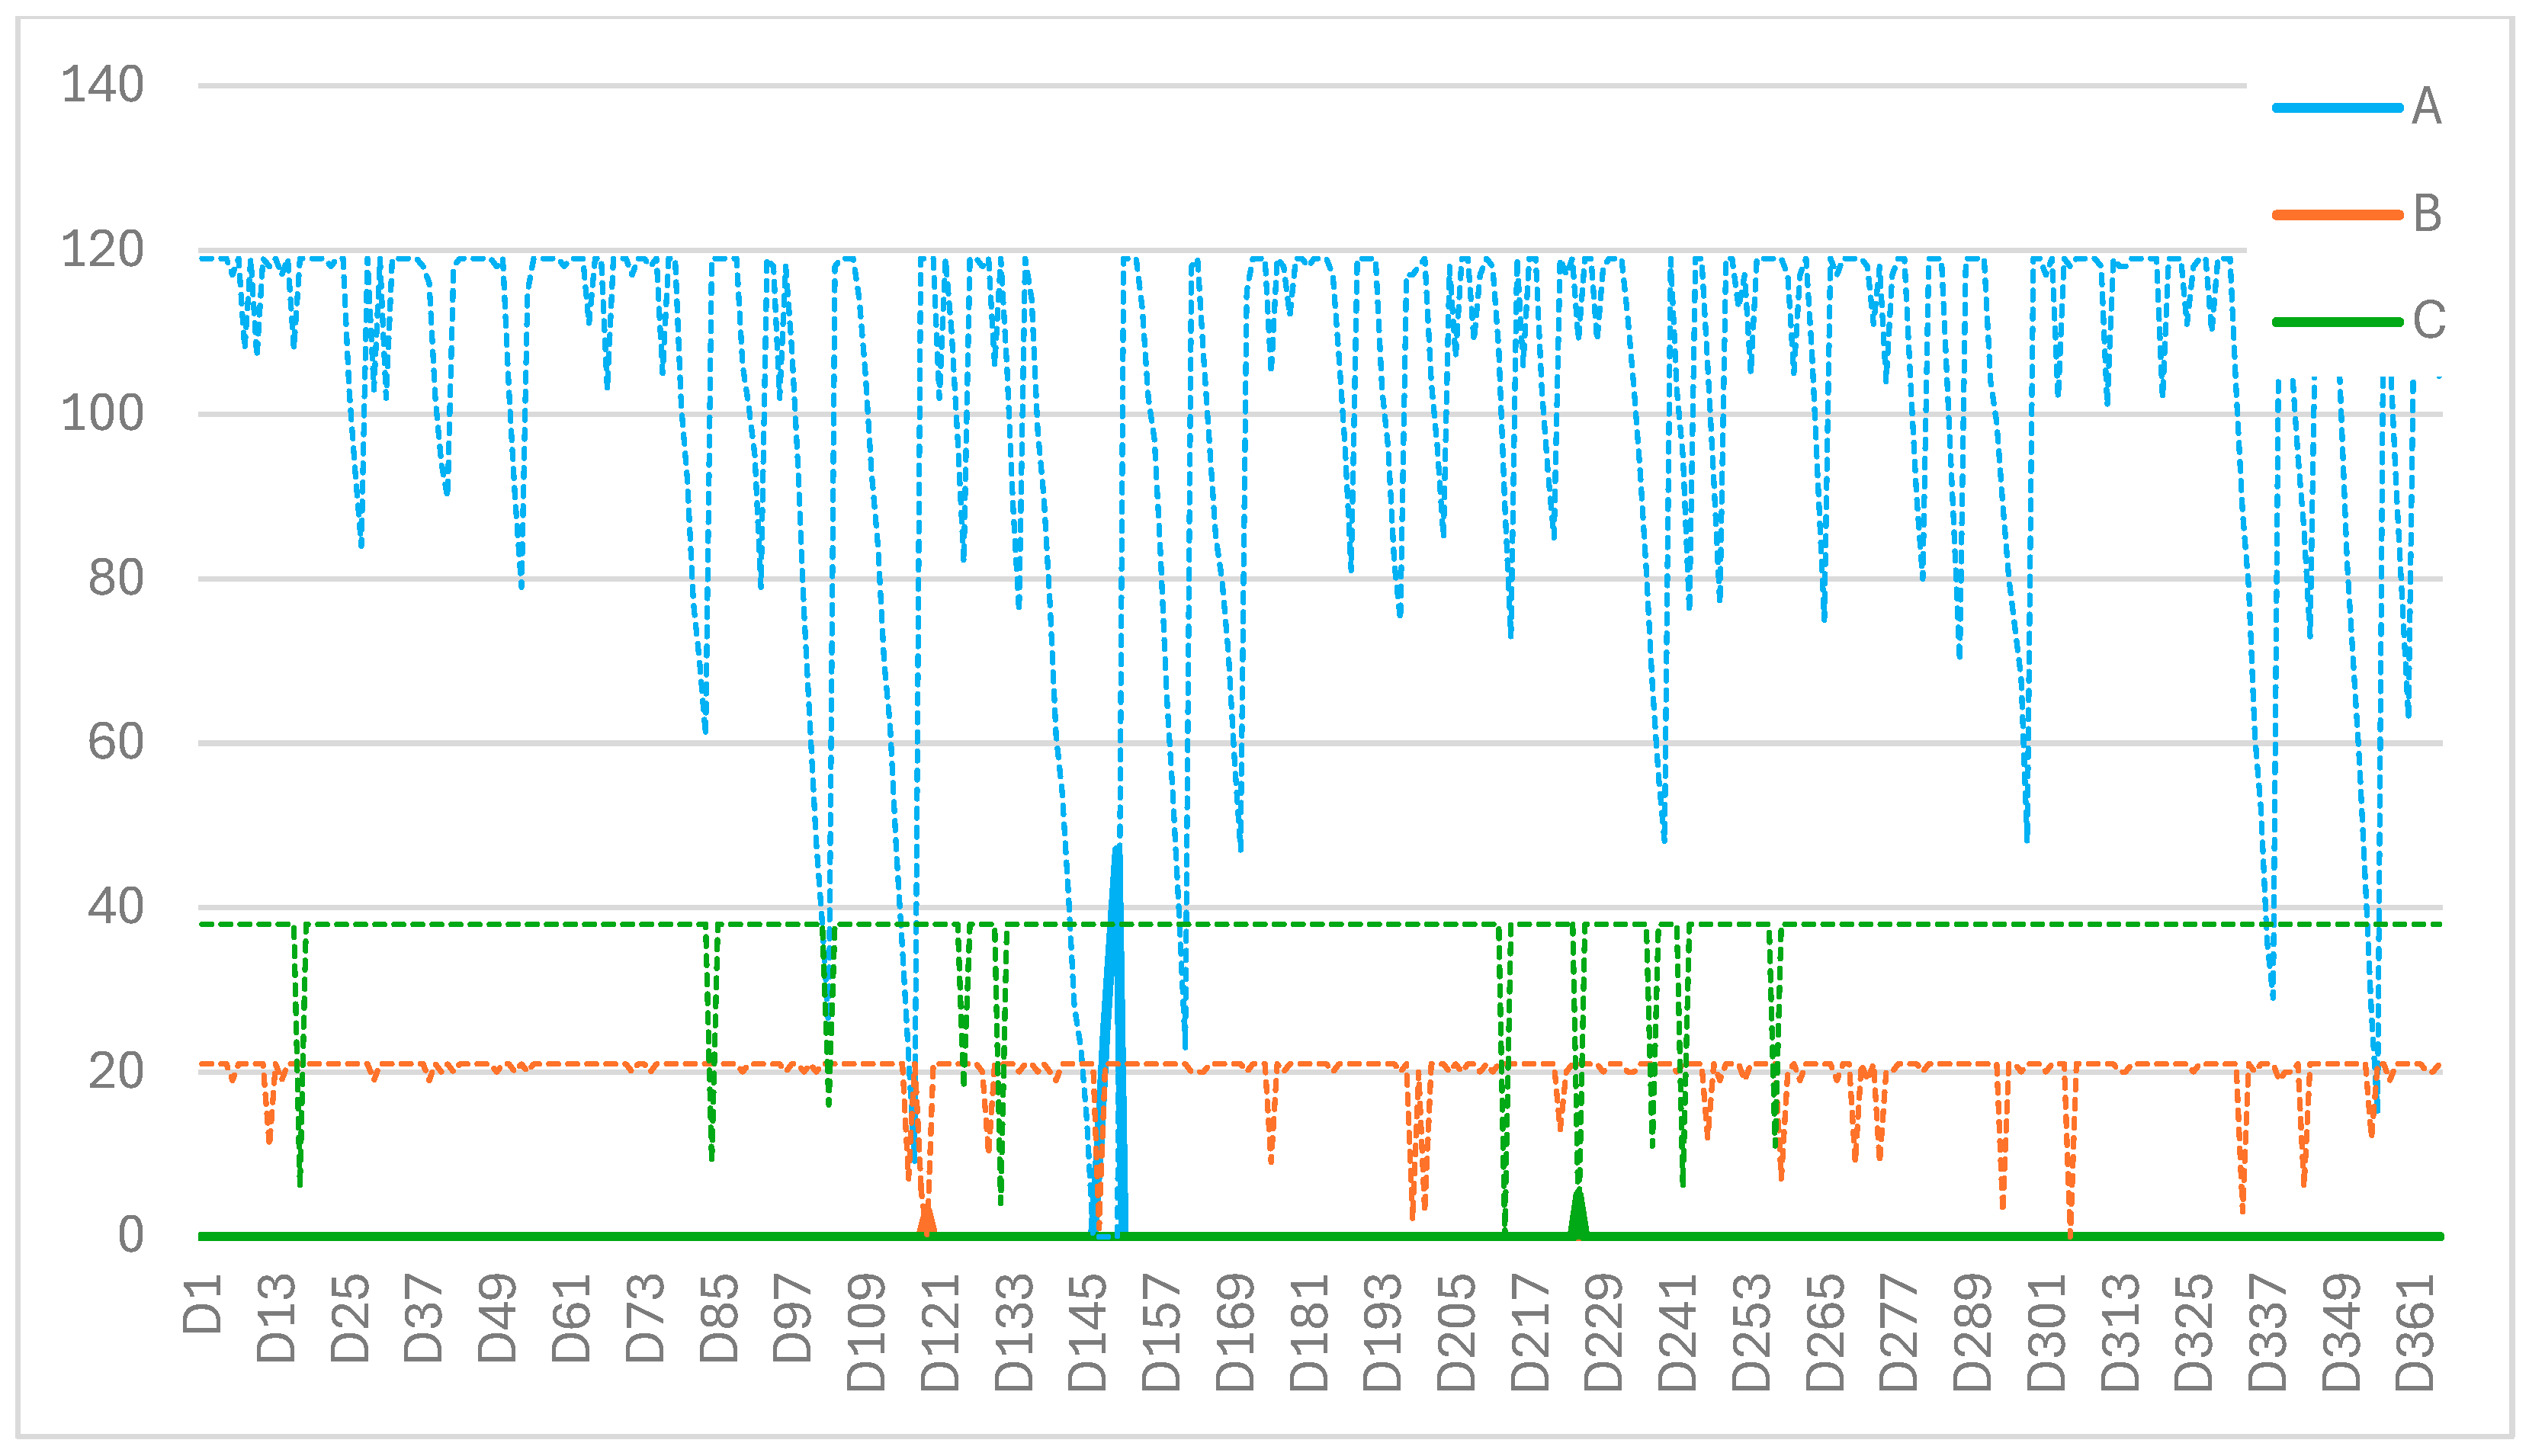
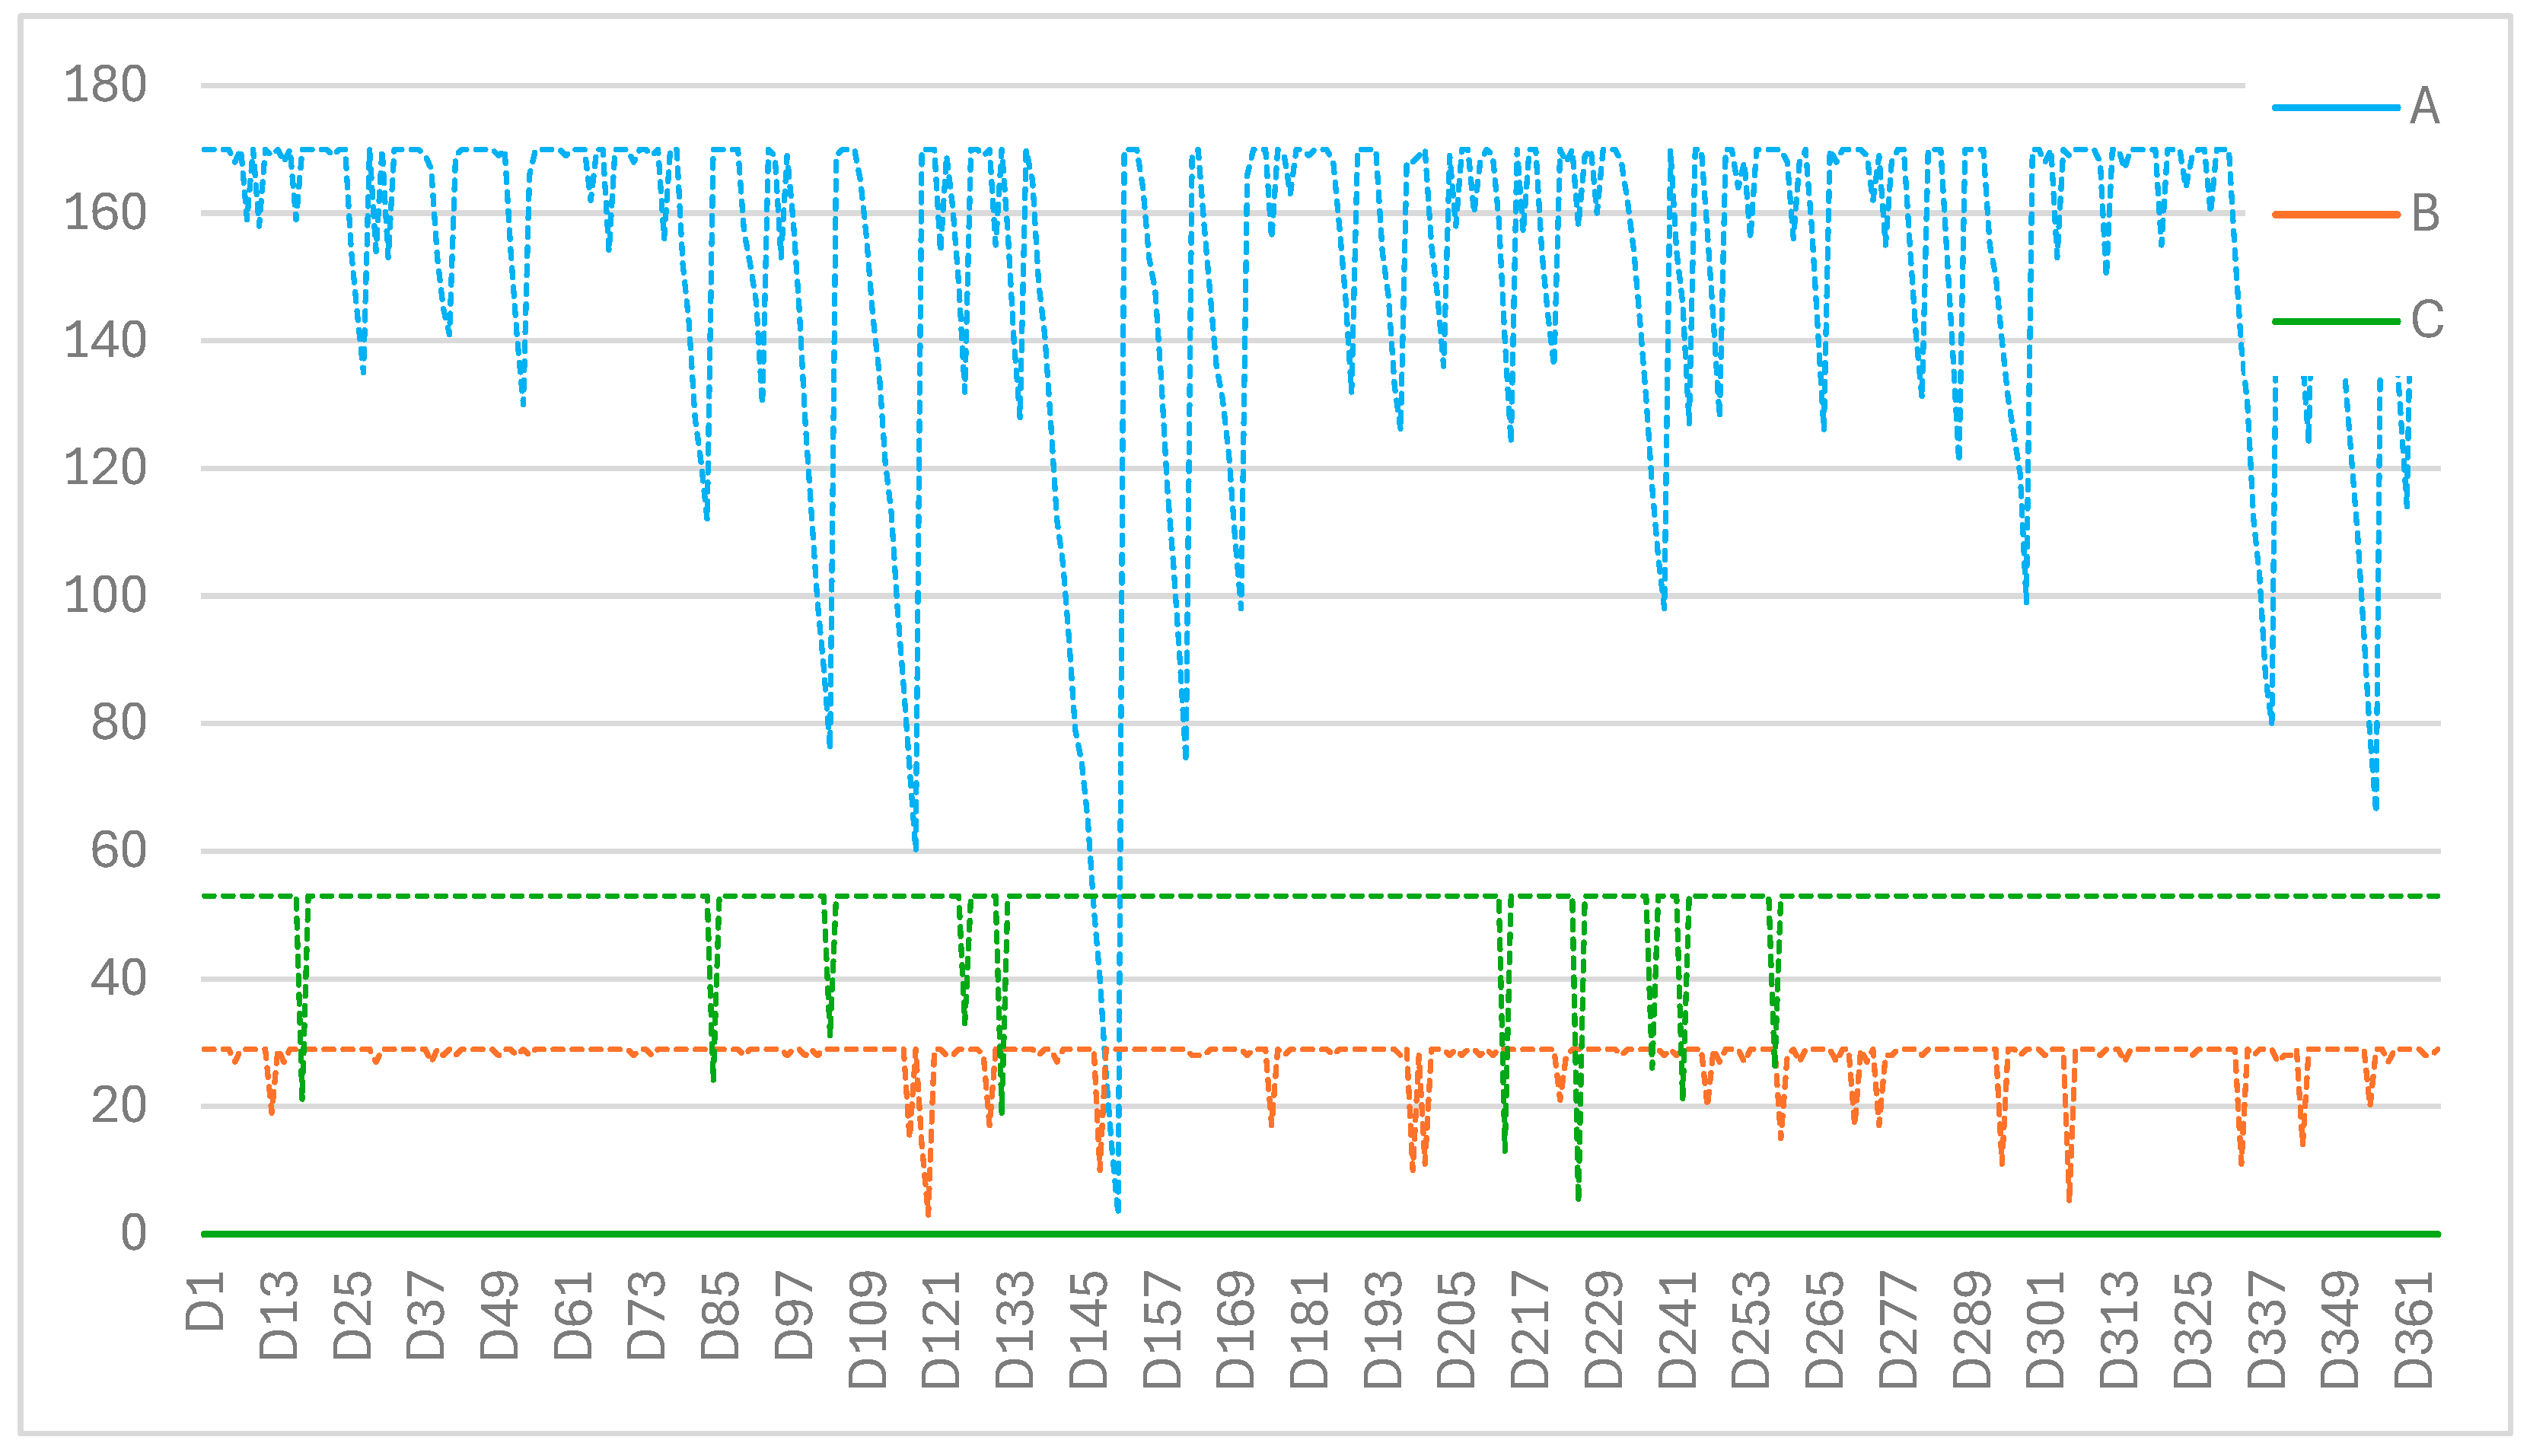
- Maintaining BS in the CLN allows for the complete or partial elimination of delays resulting from disruptions in intermodal transport. To eliminate delays, it is necessary to maintain BS at a constant volume level equal to 100% of the most significant deficiency recorded (BSL = 100%, Figure 9), i.e., 165 IRT of product ion material A, 23 IRT of production material B and 48 IRT of production material C. In the case of lower BSL levels, a smaller volume and shorter duration material shortage is formed. Each time, the highest and longest shortage applies to production material A. For example, for this material and BSL increasing from 30% up to 70%, the maximum shortage decreases from 113 IRT to 49 IRT, with the cumulative shortage duration per year decreasing from 40 days to 4 days, respectively. Different BSL and related levels of material shortages in CLN translate into adequate shortages in deliveries to individual production enterprises in CMFMBs.
- (6)
- Figure 7, Figure 8, Figure 9 and Figure 10 show characteristic variable BS values for different BSL variants. Significant decreases in the number of IRTs maintained in BS are related directly to disruptions in the supply chain, and relatively small fluctuations of 1–2 IRTs are caused by the need to preserve e-vans’ minimum capacity utilisation level. The latter quantitative changes occur when there is a shortage of the appropriate production materials stored as OS. Due to the adopted rule of surplus IRTs priorities in the e-vans loading process, the greatest BS fluctuations concern material A, followed by B, and to the least extent material C.
- (7)
- It should be remembered that the costs related to BS, i.e., the operating costs of storage space, are appropriate for the number of IRTs stored. For different BSL scenarios, the necessary space must correspond to the sum of +, and amount to 76 IRT (BSL = 70%) or 127 IRT (BSL = 50%) or 178 IRT (BSL = 70%) or 252 IRT (BSL = 100%).
6. Discussion
- (1)
- Ad RQ1. Disruptions that occur during intermodal transport preceding intra-urban transfers, i.e., maritime/rail/heavy road transport supplies to ILN, heavily affect the delivery delays to CMFMBs. Considering that the production materials orders differ for each CMFMB, the maximum shortage per building is almost 50 IRT per type of production material. The longest waiting time for missing production material can be as long as 15 days, and the cumulative time of production material shortages in one year can reach 160 days.
- (2)
- Ad RQ2. The model proved the effectiveness of localisation of BS in each CLN of CMFMCs. In addition, it is about halfway between the ILN and the final consignees in CMFMBs. An alternative to CLN is the ILN and CMFMBs locations. The following arguments speak for the location of BS in CLN instead of these two alternative places. Firstly, the CMFMB infrastructure is very limited, and storage in this location is a last resort due to the principle of holding only overnight stock. Secondly, ILN is the largest of the logistics centres under consideration and serves almost all intermodal supply chains focused on customers within the agglomeration. Any disruptive event in ILN will delay delivery to all clients in all CMFMBs. A rational solution is accumulating production material stocks in ILN, but in a form not yet unitised in IRT. Storing larger cargo units (containers, replacement bodies, big bags) will allow for a reduction in demand for storage area and a more efficient operational link between the intermodal supply chain and intra-agglomerate transport.
- (3)
- Ad RQ3. To determine the volume of BS, you need to calculate expected supply chain shortages based on past data. The key input data required for calculations are partial probabilities of disturbances characteristic of the engaged mode of transport, including transhipment hubs. These model inputs should be based on statistical data on the reliability of widely understood global supply chains. The presented inventory management model allows calculating the BS volume in option BSL = 100%, eliminating interruptions in deliveries and in any options (0% < BSL < 100%), reducing the BS volume and the delivery delay time.
7. Conclusions
Author Contributions
Funding
Institutional Review Board Statement
Informed Consent Statement
Data Availability Statement
Conflicts of Interest
Abbreviations
| ABV | adaptation-based view |
| BS | buffer stock |
| CLC | City Logistics Centre |
| CLN | City Logistics Node |
| CMFM | City Multifloor Manufacturing |
| CMFMB | City Multifloor Manufacturing Building |
| CMFMC | City Multifloor Manufacturing Cluster |
| EOQ | economic order quantity |
| HGV | heavy goods vehicles |
| ILN | Intermodal Logistics Node |
| IoT | Internet of Things |
| IRT | intelligent reconfigurable trolley |
| JIT | just-in-time |
| MLBNM | Multi-Layer Bayesian Network Method |
| OS | overnight stock |
| PSSC | platform service supply chain |
| SBV | stability-based view |
| SCR | supply chain resilience |
| SSC | sustainable supply chain |
| SSCR | sustainable supply chain resilience |
| SME | small and medium-sized enterprises |
References
- Dzhuguryan, T.; Deja, A.; Wiśnićki, B.; Jóźwiak, Z. The Design of Sustainable City Multi-Floor Manufacturing Processes Under Uncertainty in Supply Chains. Sustainability 2020, 12, 9439. [Google Scholar] [CrossRef]
- Busch, H.C.; Mühl, C.; Fuchs, M.; Fromhold-Eisebith, M. Digital urban production: How does Industry 4.0 reconfigure productive value creation in urban contexts? Reg. Stud. 2021, 55, 1801–1815. [Google Scholar] [CrossRef]
- Sajadieh, S.M.M.; Noh, S.D. Towards Sustainable Manufacturing: A Maturity Assessment for Urban Smart Factory. Int. J. Precis. Eng. Manuf.-Green Tech. 2024, 11, 909–937. [Google Scholar] [CrossRef]
- Koumboulis, F.N.; Fragkoulis, D.G.; Michos, A.A. Modular supervisory control for multi-floor manufacturing processes. Control Theory Technol. 2023, 21, 148–160. [Google Scholar] [CrossRef]
- Dudek, T.; Dzhuguryan, T.; Wiśnicki, B.; Pędziwiatr, K. Smart Sustainable Production and Distribution Network Model for City Multi-Floor Manufacturing Clusters. Energies 2022, 15, 488. [Google Scholar] [CrossRef]
- Dudek, T.; Dzhuguryan, T.; Lemke, J. Sustainable production network design for city multi-floor manufacturing cluster. Procedia Comput. Sci. 2019, 159, 2081–2090. [Google Scholar] [CrossRef]
- Deja, A.; Ślączka, W.; Dzhuguryan, L.; Dzhuguryan, T.; Ulewicz, R. Green technologies in smart city multifloor manufacturing clusters: A framework for additive manufacturing management. Prod. Eng. Arch. 2023, 29, 428–443. [Google Scholar] [CrossRef]
- Dzhuguryan, T.; Deja, A. Sustainable Waste Management for a City Multifloor Manufacturing Cluster: A Framework for Designing a Smart Supply Chain. Sustainability 2021, 13, 1540. [Google Scholar] [CrossRef]
- Ghobakhloo, M. Industry 4.0, digitisation, and opportunities for sustainability. J. Clean. Prod. 2020, 252, 1–21. [Google Scholar] [CrossRef]
- Kusiak, A. Smart Manufacturing. In Springer Handbook of Automation; Nof, S.Y., Ed.; Springer Handbooks; Springer: Cham, Switzerland, 2023. [Google Scholar] [CrossRef]
- Davydenko, L.; Davydenko, N.; Deja, A.; Wiśnicki, B.; Dzhuguryan, T. Efficient Energy Management for the Smart Sustainable City Multifloor Manufacturing Clusters: A Formalisation of the Water Supply System Operation Conditions Based on Monitoring Water Consumption Profiles. Energies 2023, 16, 4519. [Google Scholar] [CrossRef]
- Lin, Y.; Chen, A.; Yin, Y.; Li, Q.; Zhu, Q.; Luo, J. A framework for sustainable management of the platform service supply chain: An empirical study of the logistics sector in China. Int. J Prod. Econ. 2021, 235, 108112. [Google Scholar] [CrossRef]
- Deja, A.; Ślączka, W.; Kaup, M.; Szołtysek, J.; Dzhuguryan, L.; Dzhuguryan, T. Supply Chain Management in Smart City Manufacturing Clusters: An Alternative Approach to Urban Freight Mobility with Electric Vehicles. Energies 2024, 17, 5284. [Google Scholar] [CrossRef]
- Deja, A.; Dzhuguryan, T.; Dzhuguryan, L.; Konradi, O.; Ulewicz, R. Smart sustainable city manufacturing and logistics: A framework for city logistics node 4.0 operations. Energies 2021, 14, 8380. [Google Scholar] [CrossRef]
- Wiśnicki, B.; Dzhuguryan, T.; Mielniczuk, S.; Petrov, I.; Davydenko, L. A Decision Support Model for Lean Supply Chain Management in City Multifloor Manufacturing Clusters. Sustainability 2024, 16, 8801. [Google Scholar] [CrossRef]
- Pan, S.; Zhou, W.; Piramuthu, S.; Giannikas, V.; Chen, C. Smart city for sustainable urban freight logistics. Int. J. Prod. Res. 2021, 59, 2079–2089. [Google Scholar] [CrossRef]
- Hrušovský, M.; Demir, E.; Jammernegg, W.; Van Woensel, T. Real-time disruption management approach for intermodal freight transportation. J. Clean. Prod. 2021, 280, 124826. [Google Scholar] [CrossRef]
- Alnahhal, M.; Aylak, B.L.; Al Hazza, M.; Sakhrieh, A. Economic Order Quantity: A State-of-the-Art in the Era of Uncertain Supply Chains. Sustainability 2024, 16, 5965. [Google Scholar] [CrossRef]
- Alquraish, M. Digital Transformation, Supply Chain Resilience, and Sustainability: A Comprehensive Review with Implications for Saudi Arabian Manufacturing. Sustainability 2025, 17, 4495. [Google Scholar] [CrossRef]
- Yao, J.; Gong, R.; Long, H.; Liu, X. Analysis of the Factors Influencing Grain Supply Chain Resilience in China Using Bayesian Structural Equation Modeling. Sustainability 2025, 17, 3250. [Google Scholar] [CrossRef]
- Ferdous, O.; Yousefi, S.; Tosarkani, B.M. A multi-disruption risk analysis system for sustainable supply chain resilience. Int. J. Disaster Risk Reduct. 2025, 116, 105136. [Google Scholar] [CrossRef]
- Hilmola, O.-P.; Panova, Y. Eurasian Intermodal Supply Chains: A Dynamic Systems Approach; Cambridge Scholars Publishing: Newcastle upon Tyne, UK, 2020. [Google Scholar]
- Goodarzi, A.H.; Jabbarzadeh, A.; Fahimnia, B.; Paquet, M. Evaluating the sustainability and resilience of an intermodal transport network leveraging consolidation strategies. Transp. Res. Part E-Logist. Transp. Rev. 2024, 188, 103616. [Google Scholar] [CrossRef]
- Rajabzaeh, H.; Rabiee, M.; Sarkis, J. Sourcing from Risky Reverse Channels: Insights on Pricing and Resilience Strategies in Sustainable Supply Chains. Int. J. Prod. Econ. 2024, 276, 109373. [Google Scholar] [CrossRef]
- Saffari, H.; Abbasi, M.; Gheidar-Kheljani, J. The design of a sustainable-resilient forward-reverse logistics network considering resource sharing and using an accelerated Benders decomposition algorithm. Int. J. Shipp. Transp. Logist. 2025, 19, 444–481. [Google Scholar] [CrossRef]
- Herold, D.M.; Marzantowicz, Ł. Neo-institutionalism in supply chain management: From supply chain susceptibility to supply chain resilience. Manag. Res. Rev. 2024, 47, 1199–1220. Available online: https://eprints.qut.edu.au/247097 (accessed on 18 September 2025). [CrossRef]
- Negri, M.; Cagno, E.; Colicchia, C.; Sarkis, J. Integrating sustainability and resilience in the supply chain: A systematic literature review and a research agenda. Bus. Strategy Environ. 2021, 30, 2858–2886. [Google Scholar] [CrossRef]
- Allaoui, H.; Guo, Y.; Sarkis, J. Decision Support for Collaboration Planning in Sustainable Supply Chains. J. Clean. Prod. 2019, 229, 761–774. [Google Scholar] [CrossRef]
- Sánchez-Flores, R.B.; Cruz-Sotelo, S.E.; Ojeda-Benitez, S.; Ramírez-Barreto, M.E. Sustainable Supply Chain Management—A Literature Review on Emerging Economies. Sustainability 2020, 12, 6972. [Google Scholar] [CrossRef]
- Li, X.; Krivtsov, V.; Pan, C.; Nassehi, A.; Gao, R.X.; Ivanov, D. End-to-end supply chain resilience management using deep learning, survival analysis, and explainable artificial intelligence. Int. J. Prod. Res. 2024, 63, 1174–1202. [Google Scholar] [CrossRef]
- Kouhizadeh, M.; Saberi, S.; Sarkis, J. Blockchain technology and the sustainable supply chain: Theoretically exploring adoption barriers. Int. J. Prod. Econ. 2021, 231, 107831. [Google Scholar] [CrossRef]
- Mehrjerdi, Y.Z.; Shafiee, M. A resilient and sustainable closed-loop supply chain using multiple sourcing and information sharing strategies. J. Clean. Prod. 2021, 289, 125686. [Google Scholar] [CrossRef]
- Sonar, H.; Mukherjee, A.; Gunasekaran, A.; Singh, R.K. Sustainable supply chain management of automotive sector in context of the circular economy: A strategic framework. Bus. Strategy Environ. 2022, 31, 3635–3648. [Google Scholar] [CrossRef]
- Jimenez-Castillo, L.; Sarkis, J.; Saberi, S.; Yao, T. Blockchain-based governance implications for ecologically sustainable supply chain management. J. Enterp. Inf. Manag. 2024, 37, 76–99. [Google Scholar] [CrossRef]
- Chowdhury, M.M.H.; Islam, M.T.; Ali, I.; Quaddus, M. The role of social capital, resilience, and network complexity in attaining supply chain sustainability. Bus. Strategy Environ. 2024, 33, 2621–2639. [Google Scholar] [CrossRef]
- Dzhuguryan, T.; Kijewska, K.; Iwan, S.; Dzhuguryan, K. Supply Chain Ecosystem for Smart Sustainable City Multifloor Manufacturing Cluster: Knowledge Management Based on Open Innovation and Energy Conservation Policies. Sustainability 2025, 17, 8882. [Google Scholar] [CrossRef]
- Melkonyan, A.; Krumme, K.; Gruchmann, T.; Spinler, S.; Schumacher, T.; Bleischwitz, R. Scenario and strategy planning for transformative supply chains within a sustainable economy. J. Clean. Prod. 2019, 231, 144–160. [Google Scholar] [CrossRef]
- Ivanov, D.; Dolgui, A.; Sokolov, B. Cloud supply chain: Integrating Industry 4.0 and digital platforms in the “Supply Chain-as-a-Service”. Transp. Res. Part E-Logist. Transp. Rev. 2022, 160, 102676. [Google Scholar] [CrossRef]
- Ivanov, D. Two Views of Supply Chain Resilience. Int. J. Prod. Res. 2023, 62, 4031–4045. [Google Scholar] [CrossRef]
- Ivanov, D. Lean resilience: AURA (Active Usage of Resilience Assets) framework for post-COVID-19 supply chain management. Int. J. Logist. Manag. 2022, 33, 1196–1217. [Google Scholar] [CrossRef]
- Göçer, A.; Brockhaus, S.; Fawcett, S.E.; Vural, C.A.; Knemeyer, A.M. Supply chain sustainability, risk and transformational tension: A systems perspective. Int. J. Logist. Manag. 2025, 36, 21–45. [Google Scholar] [CrossRef]
- Rajesh, R. Social and environmental risk management in resilient supply chains: A periodical study by the Grey-Verhulst model. Int. J. Prod. Res. 2019, 57, 3748–3765. [Google Scholar] [CrossRef]
- Roy, H.N.; Almehdawe, E.; Kabir, G. Supply Chain Resilience Strategies for Times of Unprecedented Uncertainty. In Supply Chain Risk and Disruption Management. Flexible Systems Management; Paul, S.K., Agarwal, R., Sarker, R.A., Rahman, T., Eds.; Springer: Singapore, 2023. [Google Scholar] [CrossRef]
- Daryanto, A.W.; Prabowo, H.; Hamsal, M.; Elidjen, E. Supply Chain Resilience Strategy in Dynamic Environmental Change: A Systematic Literature Review. J. Lifestyle and SDGs Rev. 2025, 5, e03846. [Google Scholar] [CrossRef]
- Ivanov, D. When is the supply chain resilient? Customer and operational perspectives. Int. J. Prod. Res. 2025, 63, 5512–5527. [Google Scholar] [CrossRef]
- Hosseini, S.; Ivanov, D.; Dolgui, A. Ripple effect modelling of supplier disruption: Integrated Markov chain and dynamic Bayesian network approach. Int. J. Prod. Res. 2020, 58, 3284–3303. [Google Scholar] [CrossRef]
- Hosseini, S.; Ivanov, D. Bayesian networks for supply chain risk, resilience and ripple effect analysis: A literature review. Expert Syst. Appl. 2020, 161, 113649. [Google Scholar] [CrossRef]
- Reshad, A.I.; Biswas, T.; Agarwal, R.; Paul, S.K.; Azeem, A. Evaluating barriers and strategies to sustainable supply chain risk management in the context of an emerging economy. Bus. Strategy Environ. 2023, 32, 4315–4334. [Google Scholar] [CrossRef]
- Becerra, P.; Mula, J.; Sanchis, R. Sustainable Inventory Management in Supply Chains: Trends and Further Research. Sustainability 2022, 14, 2613. [Google Scholar] [CrossRef]
- Naz, F.; Agrawal, R.; Kumar, A.; Gunasekaran, A.; Majumdar, A.; Luthra, S. Reviewing the applications of artificial intelligence in sustainable supply chains: Exploring research propositions for future directions. Bus. Strategy Environ. 2022, 31, 2400–2423. [Google Scholar] [CrossRef]
- Saberi, S.; Kouhizadeh, M.; Sarkis, J.; Shen, L. Blockchain technology and its relationships to sustainable supply chain management. Int. J. Prod. Res. 2019, 57, 2117–2135. [Google Scholar] [CrossRef]
- Aqlan, F.; Lam, S.S. Supply Chain Risk Modelling and Mitigation. Int. J. Prod. Res. 2015, 53, 5640–5656. [Google Scholar] [CrossRef]
- Karmaker, C.L.; Ahmed, T.; Ahmed, S.; Ali, S.M.; Moktadir, M.A.; Kabir, G. Improving supply chain sustainability in the context of COVID-19 pandemic in an emerging economy: Exploring drivers using an integrated model. Sustain. Prod. Consum. 2021, 26, 411–427. [Google Scholar] [CrossRef]
- Hosseini, S.; Ivanov, D. A Multi-Layer Bayesian Network Method for Supply Chain Disruption Modelling in the Wake of the COVID-19 Pandemic. Int. J. Prod. Res. 2022, 60, 5258–5276. [Google Scholar] [CrossRef]
- Lu, J.; Wu, D.; Dolgui, A. Construction of resilient and sustainable supply chain based on multilayer Bayesian network. Int. J. Prod. Res. 2025, 1–25. [Google Scholar] [CrossRef]
- Ivanov, D.; Dolgui, A. Viability of Intertwined Supply Networks: Extending the Supply Chain Resilience Angles Towards Survivability. A Position Paper Motivated by COVID-19 Outbreak. Int. J. Prod. Res. 2020, 58, 2904–2915. [Google Scholar] [CrossRef]
- Ivanov, D.; Dolgui, A.; Blackhurst, J.; Choi, T.M. Toward Supply Chain Viability Theory: From Lessons Learned Through COVID-19 Pandemic to Viable Ecosystems. Int. J. Prod. Res. 2023, 61, 2402–2415. [Google Scholar] [CrossRef]
- Ivanov, D. Viable Supply Chain Model: Integrating Agility, Resilience and Sustainability Perspectives—Lessons from and Thinking Beyond the COVID-19 Pandemic. Ann. Oper. Res. 2022, 319, 1411–1431. [Google Scholar] [CrossRef]
- Hosseini, S.; Ivanov, D.; Blackhurst, J. Conceptualization and Measurement of Supply Chain Resilience in An Open-System Context. IEEE Trans. Eng. Manag. 2020, 69, 3111–3126. [Google Scholar] [CrossRef]
- Jabbarzadeh, A.; Fahimnia, B.; Sabouhi, F. Resilient and sustainable supply chain design: Sustainability analysis under disruption risks. Int. J. Prod. Res. 2018, 56, 5945–5968. [Google Scholar] [CrossRef]
- Behzadi, G.; O’Sullivan, M.J.; Olsen, T.L. On metrics for supply chain resilience. Eur. J. Oper. Res. 2020, 287, 145–158. [Google Scholar] [CrossRef]
- Kareem, S.; Fehrer, J.A.; Shalpegin, T.; Stringer, C. Navigating tensions of sustainable supply chains in times of multiple crises: A systematic literature review. Bus. Strategy Environ. 2024, 34, 316–337. [Google Scholar] [CrossRef]
- Chen, L.; Zhao, X.; Tang, O.; Price, L.; Zhang, S.; Zhu, W. Supply chain collaboration for sustainability: A literature review and future research agenda. Int. J. Prod. Econ. 2017, 194, 73–87. [Google Scholar] [CrossRef]
- Erhun, F.; Kraft, T.; Wijnsma, S. Sustainable triple-A supply chains. Prod. Oper. Manag. 2021, 30, 644–655. [Google Scholar] [CrossRef]
- Brintrup, A.; Kosasih, E.; Schaeffer, P.; Zheng, G.; Demirel, G.; MacCarthy, B.L. Digital Supply Chain Surveillance Using Artificial Intelligence: Definitions, Opportunities and Risks. Int. J. Prod. Res. 2024, 62, 4674–4695. [Google Scholar] [CrossRef]
- Abdelaziz, F.B.; Chen, Y.T.; Dey, P.K. Supply chain resilience, organisational well-being, and sustainable performance: A comparison between the UK and France. J. Clean. Prod. 2024, 444, 141215. [Google Scholar] [CrossRef]
- Ngo, V.M.; Quang, H.T.; Hoang, T.G.; Binh, A.D.T. Sustainability-related supply chain risks and supply chain performances: The moderating effects of dynamic supply chain management practices. Bus. Strategy Environ. 2024, 33, 839–857. [Google Scholar] [CrossRef]
- Carter, C.R.; Kaufmann, L.; Ketchen, D.J. Expect the unexpected: Toward a theory of the unintended consequences of sustainable supply chain management. Int. J. Oper. Prod. Manag. 2020, 40, 1857–1871. [Google Scholar] [CrossRef]
- Govindan, K.; Rajeev, A.; Padhi, S.S.; Pati, R.K. Supply chain sustainability and performance of firms: A meta-analysis of the literature. Transp. Res. Part E-Logist. Transp. Rev. 2020, 137, 101923. [Google Scholar] [CrossRef]
- Chowdhury, M.M.H.; Quaddus, M.A. Supply chain sustainability practices and governance for mitigating sustainability risk and improving market performance: A dynamic capability perspective. J. Clean. Prod. 2021, 278, 123521. [Google Scholar] [CrossRef]
- Zavala-Alcívar, A.; Verdecho, M.J.; Alfaro-Saiz, J.J. A conceptual framework to manage resilience and increase sustainability in the supply chain. Sustainability 2020, 12, 6300. [Google Scholar] [CrossRef]
- Bechtsis, D.; Tsolakis, N.; Iakovou, E.; Vlachos, D. Data-driven secure, resilient and sustainable supply chains: Gaps, opportunities, and a new generalised data sharing and data monetisation framework. Int. J. Prod. Res. 2022, 60, 4397–4417. [Google Scholar] [CrossRef]
- Lücker, F.; Seifert, R.W.; Biçer, I. Roles of Inventory and Reserve Capacity in Mitigating Supply Chain Disruption Risk. Int. J. Prod. Res. 2019, 57, 1238–1249. [Google Scholar] [CrossRef]
- Holloway, S. Inventory Management as a Key Driver of Sustainability in Supply Chains. SSRN 2025. Available online: http://dx.doi.org/10.2139/ssrn.5135338 (accessed on 18 September 2025).
- Carpitella, S.; Izquierdo, J. Trends in Sustainable Inventory Management Practices in Industry 4.0. Processes 2025, 13, 1131. [Google Scholar] [CrossRef]
- Tadayonrad, Y.; Ndiaye, A.B. A new key performance indicator model for demand forecasting in inventory management considering supply chain reliability and seasonality. Supply Chain Anal. 2023, 3, 100026. [Google Scholar] [CrossRef]
- San-José, L.A.; Sicilia, J.; Cárdenas-Barrón, L.E.; González-de-la-Rosa, M. A sustainable inventory model for deteriorating items with power demand and full backlogging under a carbon emission tax. Int. J. Prod. Econ. 2024, 268, 109098. [Google Scholar] [CrossRef]
- Villacis, M.Y.; Merlo, O.T.; Rivero, D.P.; Towfek, S. Optimizing Sustainable Inventory Management using An Improved Big Data Analytics Approach. J. Intell. Syst. Internet Things 2024, 11, 15. [Google Scholar] [CrossRef]
- Nweje, U.; Taiwo, M. Leveraging Artificial Intelligence for predictive supply chain management, focus on how AI-driven tools are revolutionising demand forecasting and inventory optimisation. Int. J. Sci. Res. Arch. 2025, 14, 230–250. [Google Scholar] [CrossRef]
- Qi, M.; Shi, Y.; Qi, Y.; Ma, C.; Yuan, R.; Wu, D.; Shen, Z.-J. A practical end-to-end inventory management model with deep learning. Manag. Sci. 2022, 69, 759–773. [Google Scholar] [CrossRef]
- Brunaud, B.; Laínez-Aguirre, J.M.; Pinto, I.E. Grossmann, Inventory policies and safety stock optimisation for supply chain planning. AIChE J. 2019, 65, 99–112. [Google Scholar] [CrossRef]
- Barros, J.; Cortez, P.; Carvalho, M.S. A systematic literature review about dimensioning safety stock under uncertainties and risks in the procurement process. Oper. Res. Perspect. 2021, 8, 100192. [Google Scholar] [CrossRef]
- Qu, T.; Huang, T.; Nie, D.; Fu, Y.; Ma, L.; Huang, G.Q. Joint Decisions of Inventory Optimization and Order Allocation for Omni-Channel Multi-Echelon Distribution Network. Sustainability 2022, 14, 5903. [Google Scholar] [CrossRef]
- Anand, G.; Vashisht, P.; Singh, S.P.; Mittal, M. Sustainable Inventory Control and Management. In Sustainable Inventory Management: Perspectives from India; Springer: Berlin, Germany, 2025; pp. 1–24. [Google Scholar] [CrossRef]
- Hosseini, S.; Ivanov, D. A new resilience measure for supply networks with the ripple effect considerations: A Bayesian network approach. Ann. Oper. Res. 2022, 319, 581–607. [Google Scholar] [CrossRef]
- Aldrighetti, R.; Calzavara, M.; Martignago, M.; Zennaro, I.; Battini, D.; Ivanov, D. A methodological framework for the design of efficient resilience in supply networks. Int. J. Prod. Res. 2024, 62, 271–290. [Google Scholar] [CrossRef]
| Indexes | Unit | |
|---|---|---|
| availability of m-type production material in d day = 0—unavailable) | ||
| day d = 1, 2, 3, … 365 | ||
| l | l = 1, 2… L | |
| j | j = 1, 2 … J | |
| , N | ||
| k | , K | |
| Parameters | ||
| Independent parameters | ||
| level of utilisation of e-van loading capacity (last e-van in transfer group) | %, IRT | |
| transit time between ILN and CLN | days | |
| transit time between CLN and CMFMB | days | |
| e-truck loading/unloading time | days | |
| e-van loading/unloading time | days | |
| cargo handling time in CLN | days | |
| Dependent parameters | ||
| demand for d day and m-type production material in non-unitised form ordered by CMFMB | %, tonnes | |
| reduced demand for d day and m-type of production material ordered by CLN | IRT | |
| reduced demand for d day and m-type of production material ordered by CMFMB | IRT | |
| reduced demand for d day and m-type of production material ordered by CMFMB and calculated in full IRT units | IRT | |
| supply of m-type of production material based on the order of CMFMB on d day | IRT | |
| supply of m-type of production material based on the order of CLN on d day | IRT | |
| relative probability defined for successive stages of the supply chain | ||
| total volume of BS | IRT | |
| volume of BS of m-type of production material | IRT | |
| BSL | BS level | % |
| cumulative period of shortage of m-type of production material in CLN during one year (365 days) | days | |
| cumulative period of shortage of m-type of production material in CMFMB during one year (365 days) | days | |
| shortage of m-type of production material in CLN on d day | IRT | |
| shortage of m-type of production material in CMFMB on d day | IRT | |
| overnight stock of m-type of production material in CLN after d day | IRT | |
| overnight stock of m-type of production material in CMFMB after d day | tonnes, IRT | |
| supplier lead time | days | |
| delay time related to production materials ordered by CMFMB on d day | days | |
| period m-type of production material unavailability in ILN (product not in stock in ILN) | days | |
| first day on which m-type of production material is not in stock in ILN | ||
| last day on which m-type of production material is not in stock in ILN | ||
| delay of shipment from CLN to CMFMB resulting from limitations in the use of e-vans. | days | |
| number of days in which the materials are not delivered from CLN to CMFMB | days | |
| Day | 1 | 2 | 3 | 4 | 5 | 6 | 7 | … | 365 |
|---|---|---|---|---|---|---|---|---|---|
| [%] | 87% | 20% | 12% | 83% | 9% | 12% | 63% | … | 69% |
| [%] | 94% | 41% | 33% | 64% | 72% | 86% | 86% | … | 58% |
| [%] | 19% | 46% | 49% | 79% | 95% | 32% | 1% | … | 56% |
| [t] | 2.61 | 0.60 | 0.36 | 2.48 | 0.28 | 0.36 | 1.88 | … | 2.07 |
| [t] | 2.83 | 1.24 | 0.98 | 1.93 | 2.15 | 2.58 | 2.58 | … | 1.73 |
| [t] | 0.56 | 1.38 | 1.47 | 2.37 | 2.85 | 0.95 | 0.03 | … | 1.67 |
| [%] | 21% | 31% | 84% | 80% | 1% | 24% | 95% | … | 75% |
| [%] | 22% | 22% | 58% | 92% | 96% | 99% | 66% | … | 35% |
| [%] | 37% | 66% | 24% | 71% | 98% | 45% | 35% | … | 92% |
| [t] | 0.62 | 0.92 | 2.52 | 2.40 | 0.03 | 0.72 | 2.85 | … | 2.24 |
| [t] | 0.65 | 0.65 | 1.73 | 2.75 | 2.88 | 2.97 | 1.97 | … | 1.04 |
| [t] | 1.10 | 1.97 | 0.73 | 2.13 | 2.95 | 1.35 | 1.06 | … | 2.77 |
| [%] | 5% | 76% | 30% | 30% | 20% | 0% | 84% | … | 90% |
| [%] | 92% | 98% | 24% | 31% | 51% | 40% | 41% | … | 91% |
| [%] | 3% | 29% | 91% | 40% | 52% | 34% | 50% | … | 34% |
| [t] | 0.15 | 2.27 | 0.90 | 0.89 | 0.60 | 0.01 | 2.51 | … | 2.71 |
| [t] | 2.76 | 2.95 | 0.73 | 0.92 | 1.54 | 1.19 | 1.23 | … | 2.74 |
| [t] | 0.10 | 0.88 | 2.74 | 1.21 | 1.57 | 1.02 | 1.51 | … | 1.02 |
| [%] | 33% | 23% | 91% | 63% | 96% | 87% | 35% | … | 43% |
| [%] | 11% | 38% | 76% | 88% | 11% | 37% | 84% | … | 45% |
| [%] | 63% | 73% | 66% | 44% | 53% | 70% | 73% | … | 36% |
| [t] | 1.00 | 0.68 | 2.72 | 1.88 | 2.89 | 2.60 | 1.04 | … | 1.29 |
| [t] | 0.32 | 1.14 | 2.28 | 2.65 | 0.33 | 1.10 | 2.51 | … | 1.34 |
| [t] | 1.89 | 2.18 | 1.98 | 1.33 | 1.60 | 2.11 | 2.19 | … | 1.09 |
| BSL | MEDIAN (0% ÷ 100%) | |||||
|---|---|---|---|---|---|---|
| 0% | 30% | 50% | 70% | 100% | ||
| 9 | 9 | 8 | 9 | 9 | 9 | |
| [IRT] | 13 | 12 | 10 | 15 | 15 | 13 |
| [IRT] | 19 | 17 | 17 | 17 | 17 | 17 |
| 1.68 | 1.26 | 1.19 | 1.19 | 1.11 | 1.19 | |
| [IRT] | 3.58 | 2.90 | 2.83 | 2.92 | 2.84 | 2.90 |
| [IRT] | 3.33 | 3.14 | 3.12 | 3.21 | 3.15 | 3.15 |
| 2.00 | 2.00 | 1.98 | 2.00 | 2.00 | 2.00 | |
| [IRT] | 1.98 | 1.98 | 1.98 | 1.98 | 1.98 | 1.98 |
| [IRT] | 0.95 | 0.95 | 0.95 | 0.95 | 0.95 | 0.95 |
| 1.92 | 2.00 | 2.00 | 2.00 | 2.00 | 2.00 | |
| [IRT] | 1.98 | 1.98 | 1.98 | 1.98 | 1.98 | 1.98 |
| [IRT] | 0.95 | 0.95 | 0.95 | 0.95 | 0.95 | 0.95 |
| 1.96 | 1.98 | 1.98 | 1.98 | 1.98 | 1.98 | |
| [IRT] | 1.98 | 1.98 | 1.98 | 1.98 | 1.98 | 1.98 |
| [IRT] | 0.95 | 0.95 | 0.95 | 0.95 | 0.95 | 0.95 |
| 1.96 | 1.98 | 1.94 | 1.98 | 1.98 | 1.98 | |
| [IRT] | 1.98 | 1.95 | 1.98 | 1.98 | 1.98 | 1.98 |
| [IRT] | 1.00 | 1.00 | 1.00 | 1.00 | 1.00 | 1.00 |
| 0.39 | 0.74 | 0.76 | 0.83 | 0.84 | 0.76 | |
| [IRT] | 0.48 | 0.65 | 0.62 | 0.66 | 0.67 | 0.65 |
| [IRT] | 0.45 | 0.48 | 0.48 | 0.49 | 0.49 | 0.48 |
| 0.36 | 0.71 | 0.78 | 0.79 | 0.80 | 0.78 | |
| [IRT] | 0.49 | 0.65 | 0.66 | 0.65 | 0.67 | 0.65 |
| [IRT] | 0.46 | 0.47 | 0.47 | 0.47 | 0.48 | 0.47 |
| 0.33 | 0.69 | 0.73 | 0.75 | 0.76 | 0.73 | |
| [IRT] | 0.50 | 0.61 | 0.63 | 0.64 | 0.65 | 0.63 |
| [IRT] | 0.41 | 0.42 | 0.43 | 0.43 | 0.43 | 0.43 |
| 0.35 | 0.67 | 0.74 | 0.77 | 0.79 | 0.74 | |
| [IRT] | 0.44 | 0.58 | 0.60 | 0.62 | 0.62 | 0.60 |
| [IRT] | 0.44 | 0.45 | 0.47 | 0.48 | 0.48 | 0.47 |
| BSL | |||||
|---|---|---|---|---|---|
| 0% | 30% | 50% | 70% | 100% | |
| max [IRT] | 162 | 113 | 79 | 47 | 0 |
| [IRT] | 21 | 10 | 9 | 3 | 0 |
| [IRT] | 45 | 26 | 15 | 5 | 0 |
| [days] | 167 | 38 | 15 | 4 | 0 |
| [days] | 19 | 11 | 6 | 1 | 0 |
| [days] | 10 | 10 | 4 | 1 | 0 |
| 46.28 | 29.28 | 20.28 | 10.46 | 0.00 | |
| [IRT] | 5.78 | 3.60 | 2.00 | 0.00 | 0.00 |
| [IRT] | 12.00 | 8.05 | 4.05 | 0.60 | 0.00 |
| [IRT] | 29.22 | 22.22 | 18.82 | 8.82 | 0.00 |
| [IRT] | 8.75 | 4.75 | 3.75 | 0.75 | 0.00 |
| [IRT] | 12.10 | 6.25 | 3.30 | 0.30 | 0.00 |
| [IRT] | 36.98 | 23.10 | 15.2 | 9.44 | 0.00 |
| [IRT] | 6.57 | 4.13 | 3.90 | 1.90 | 0.00 |
| [IRT] | 11.40 | 7.40 | 4.40 | 1.40 | 0.00 |
| [IRT] | 47.98 | 35.58 | 22.58 | 16.58 | 0.00 |
| [IRT] | 6.43 | 3.45 | 0.45 | 0.00 | 0.00 |
| [IRT] | 12.70 | 8.70 | 4.70 | 0.85 | 0.00 |
| [days] | 175 | 38 | 15 | 3 | 0 |
| [days] | 40 | 9 | 7 | 0 | 0 |
| [days] | 17 | 9 | 4 | 1 | 0 |
| [days] | 164 | 36 | 13 | 4 | 0 |
| [days] | 46 | 12 | 8 | 1 | 0 |
| [days] | 14 | 6 | 2 | 1 | 0 |
| [days] | 181 | 37 | 11 | 4 | 0 |
| [days] | 46 | 12 | 6 | 1 | 0 |
| [days] | 15 | 7 | 2 | 1 | 0 |
| [days] | 177 | 36 | 14 | 4 | 0 |
| [days] | 48 | 15 | 2 | 0 | 0 |
| [days] | 19 | 7 | 3 | 1 | 0 |
| BSL | |||||
|---|---|---|---|---|---|
| 0% | 30% | 50% | 70% | 100% | |
| [IRT] | 0 | 51 | 85 | 119 | 170 |
| [IRT] | 0 | 9 | 15 | 21 | 29 |
| [IRT] | 0 | 16 | 27 | 38 | 53 |
Disclaimer/Publisher’s Note: The statements, opinions and data contained in all publications are solely those of the individual author(s) and contributor(s) and not of MDPI and/or the editor(s). MDPI and/or the editor(s) disclaim responsibility for any injury to people or property resulting from any ideas, methods, instructions or products referred to in the content. |
© 2025 by the authors. Licensee MDPI, Basel, Switzerland. This article is an open access article distributed under the terms and conditions of the Creative Commons Attribution (CC BY) license (https://creativecommons.org/licenses/by/4.0/).
Share and Cite
Wiśnicki, B.; Dzhuguryan, T.; Mielniczuk, S.; Dzhuguryan, L. An Inventory Management Model for City Multifloor Manufacturing Clusters Under Intermodal Supply Chain Uncertainty. Sustainability 2025, 17, 9565. https://doi.org/10.3390/su17219565
Wiśnicki B, Dzhuguryan T, Mielniczuk S, Dzhuguryan L. An Inventory Management Model for City Multifloor Manufacturing Clusters Under Intermodal Supply Chain Uncertainty. Sustainability. 2025; 17(21):9565. https://doi.org/10.3390/su17219565
Chicago/Turabian StyleWiśnicki, Bogusz, Tygran Dzhuguryan, Sylwia Mielniczuk, and Lyudmyla Dzhuguryan. 2025. "An Inventory Management Model for City Multifloor Manufacturing Clusters Under Intermodal Supply Chain Uncertainty" Sustainability 17, no. 21: 9565. https://doi.org/10.3390/su17219565
APA StyleWiśnicki, B., Dzhuguryan, T., Mielniczuk, S., & Dzhuguryan, L. (2025). An Inventory Management Model for City Multifloor Manufacturing Clusters Under Intermodal Supply Chain Uncertainty. Sustainability, 17(21), 9565. https://doi.org/10.3390/su17219565


