1. Introduction
The Renewable Fuel Standard (RFS) stands as a landmark policy intervention in the United States, designed to reduce transportation-related greenhouse gas (GHG) emissions and enhance national energy security through mandated increases in renewable fuel use [
1]. Established with the Energy Policy Act of 2005 and substantially expanded in 2007, the RFS marked a new era for the U.S. biofuel sector, particularly by driving large-scale production of corn ethanol and soybean-based biodiesel [
1]. As a result, the policy has fundamentally reshaped agricultural land use across the Midwest and especially within the U.S. Corn Belt, placing the RFS at the centre of ongoing debates about the environmental and economic sustainability of biofuel mandates [
2,
3,
4].
While the RFS was conceived to promote climate mitigation and rural economic development, its implementation has raised significant controversy, particularly concerning unintended land-use change [
5]. Critics have argued that increased demand for biofuel feedstocks, especially corn, has accelerated the conversion of grasslands, wetlands, and other natural ecosystems into cropland [
6]. Such land conversion can release substantial amounts of previously sequestered carbon, thereby offsetting the intended GHG reductions and raising questions about the net environmental benefits of the RFS [
2]. The debate is further complicated by the difficulty of assigning direct causality: land-use decisions are influenced by an array of overlapping policies, fluctuating commodity prices, local agronomic conditions, and broader socio-economic trends [
7,
8]. Thus, isolating the precise contribution of the RFS to observed cropland expansion—particularly on land that is suboptimal for corn production—remains a persistent challenge [
9].
Over the past decade, scholars have employed a variety of economic models and empirical analyses to evaluate the impacts of the RFS [
10,
11,
12]. Simulation-based approaches, such as computable general equilibrium (CGE) and partial equilibrium models, have yielded valuable insights into potential policy-driven land-use change [
13]. However, these models often rely on aggregate parameters and scenario assumptions that limit their spatial and causal specificity [
1]. Empirical studies using remote sensing data and econometric methods have provided spatially explicit observations of cropland expansion in the RFS era, revealing patterns of increased corn and soybean acreage [
14]. One study quantified the consequences of grassland conversion to cropland between 2008 and 2016, revealing that the net change led to a 7.9% increase in annual soil erosion and a 3.7% increase in nitrogen loss, despite cropland area expanding by only 2.5%. This confirms the substantial impact of land conversion on soil and water degradation [
15]. Other reviews indicate that for every billion gallons of biofuel produced, cropland area has expanded by approximately 0.01 to 2.45 million acres. Such expansions frequently involve the conversion of grasslands, wetlands, and other marginal lands, raising growing concerns over biodiversity loss, increased carbon emissions, and soil degradation [
16]. Empirical evidence further suggests that between 2008 and 2016, corn prices rose by about 31%, the corn-planted area expanded by 8.7%, and the total cropland area increased by 2.4%, accompanied by deterioration in water quality and related environmental impacts. Elevated corn prices made the cultivation of low-productivity lands economically viable, thereby accelerating the conversion and utilisation of marginal lands [
17].
However, these analyses often grapple with disentangling the unique effect of the RFS from other confounding factors, such as tax credits, state-level policies, market dynamics, and climatic variability [
7,
16,
18,
19]. Moreover, most studies generate deterministic or average estimates, overlooking the spatial heterogeneity and uncertainty that are intrinsic to land-use decision-making under policy intervention [
20,
21,
22,
23,
24,
25,
26].
A key methodological bottleneck in this field arises from the inherent uncertainty in attributing cropland expansion—especially the cultivation of corn on lands with low agronomic suitability—directly to the RFS policy [
16]. Because land-use change is the product of multiple interacting drivers, and because not all new corn fields on marginal or previously uncultivated land can be unequivocally linked to RFS incentives, a purely deterministic attribution may misrepresent both the scale and the character of policy impacts [
7,
12,
14,
27,
28]. Consequently, there is a growing need for probabilistic approaches that can estimate the likelihood of policy-driven land-use transitions rather than assigning binary or absolute causal relationships. In this study, the analysis is restricted to lands with a National Commodity Crop Productivity Index (NCCPI) of 0.42 or less, consistent with prior literature defining marginal land suitability [
29].
To address these challenges, this study develops an integrated framework that utilises probabilistic machine learning and multi-source remote sensing for spatial counterfactual attribution of land-use change. Using pre-policy land-use and biophysical, economic, and climatic variables, we construct probabilistic “no-policy” scenarios. Comparing them with observed outcomes reveals RFS-driven land conversion, including on marginal land unlikely to host corn cultivation otherwise. This probabilistic framework not only improves the granularity and credibility of policy impact assessment but also explicitly quantifies uncertainty, providing policymakers and stakeholders with a more detailed understanding of both the extent and the confidence of RFS-related land-use change.
This study introduces a probabilistic and spatially explicit counterfactual framework that jointly evaluates policy-driven cropland expansion and subsequent abandonment. Unlike conventional econometric or equilibrium models that produce deterministic outcomes, our approach estimates the probability and uncertainty of land-use transitions using high-resolution spatial data. The two-stage design enables assessment of both the initiation and sustainability of RFS-induced land-use change. By integrating Bayesian modelling, multi-source geospatial data, and uncertainty quantification, this research offers a replicable and flexible method for causal attribution in large-scale sustainability policy evaluation.
2. Methodology and Materials
2.1. Study Design
This study adopts a two-stage sequential design to investigate the causal impacts and long-term consequences of the Renewable Fuel Standard (RFS) policy on marginal croplands within the U.S. Corn Belt. The first phase seeks to identify marginal lands that were cultivated with corn in 2016 but would likely not have been planted under pre-policy market conditions. To achieve this, counterfactual planting probabilities for 2016 were estimated using a Bayesian logistic regression model trained on land-use data from 2000 to 2006, with 2005 excluded due to missing or unreliable data. The year 2006 thus serves as the final pre-policy benchmark.
The year 2016 is selected as the post-policy reference point, as it marks the culmination of corn expansion within the region, with several studies identifying it as the year of peak growth before subsequent stagnation or decline. This choice allows for a robust assessment of policy-driven land conversion at its height [
30].
The second phase evaluates the long-term sustainability of these newly cultivated lands by determining which were subsequently abandoned. Complete abandonment is operationally defined as the absence of corn cultivation during any year from 2022 to 2024, the most recent period for which data are available. This definition accounts for crop rotation and identifies lands that ultimately proved unsustainable or economically unviable for continued production.
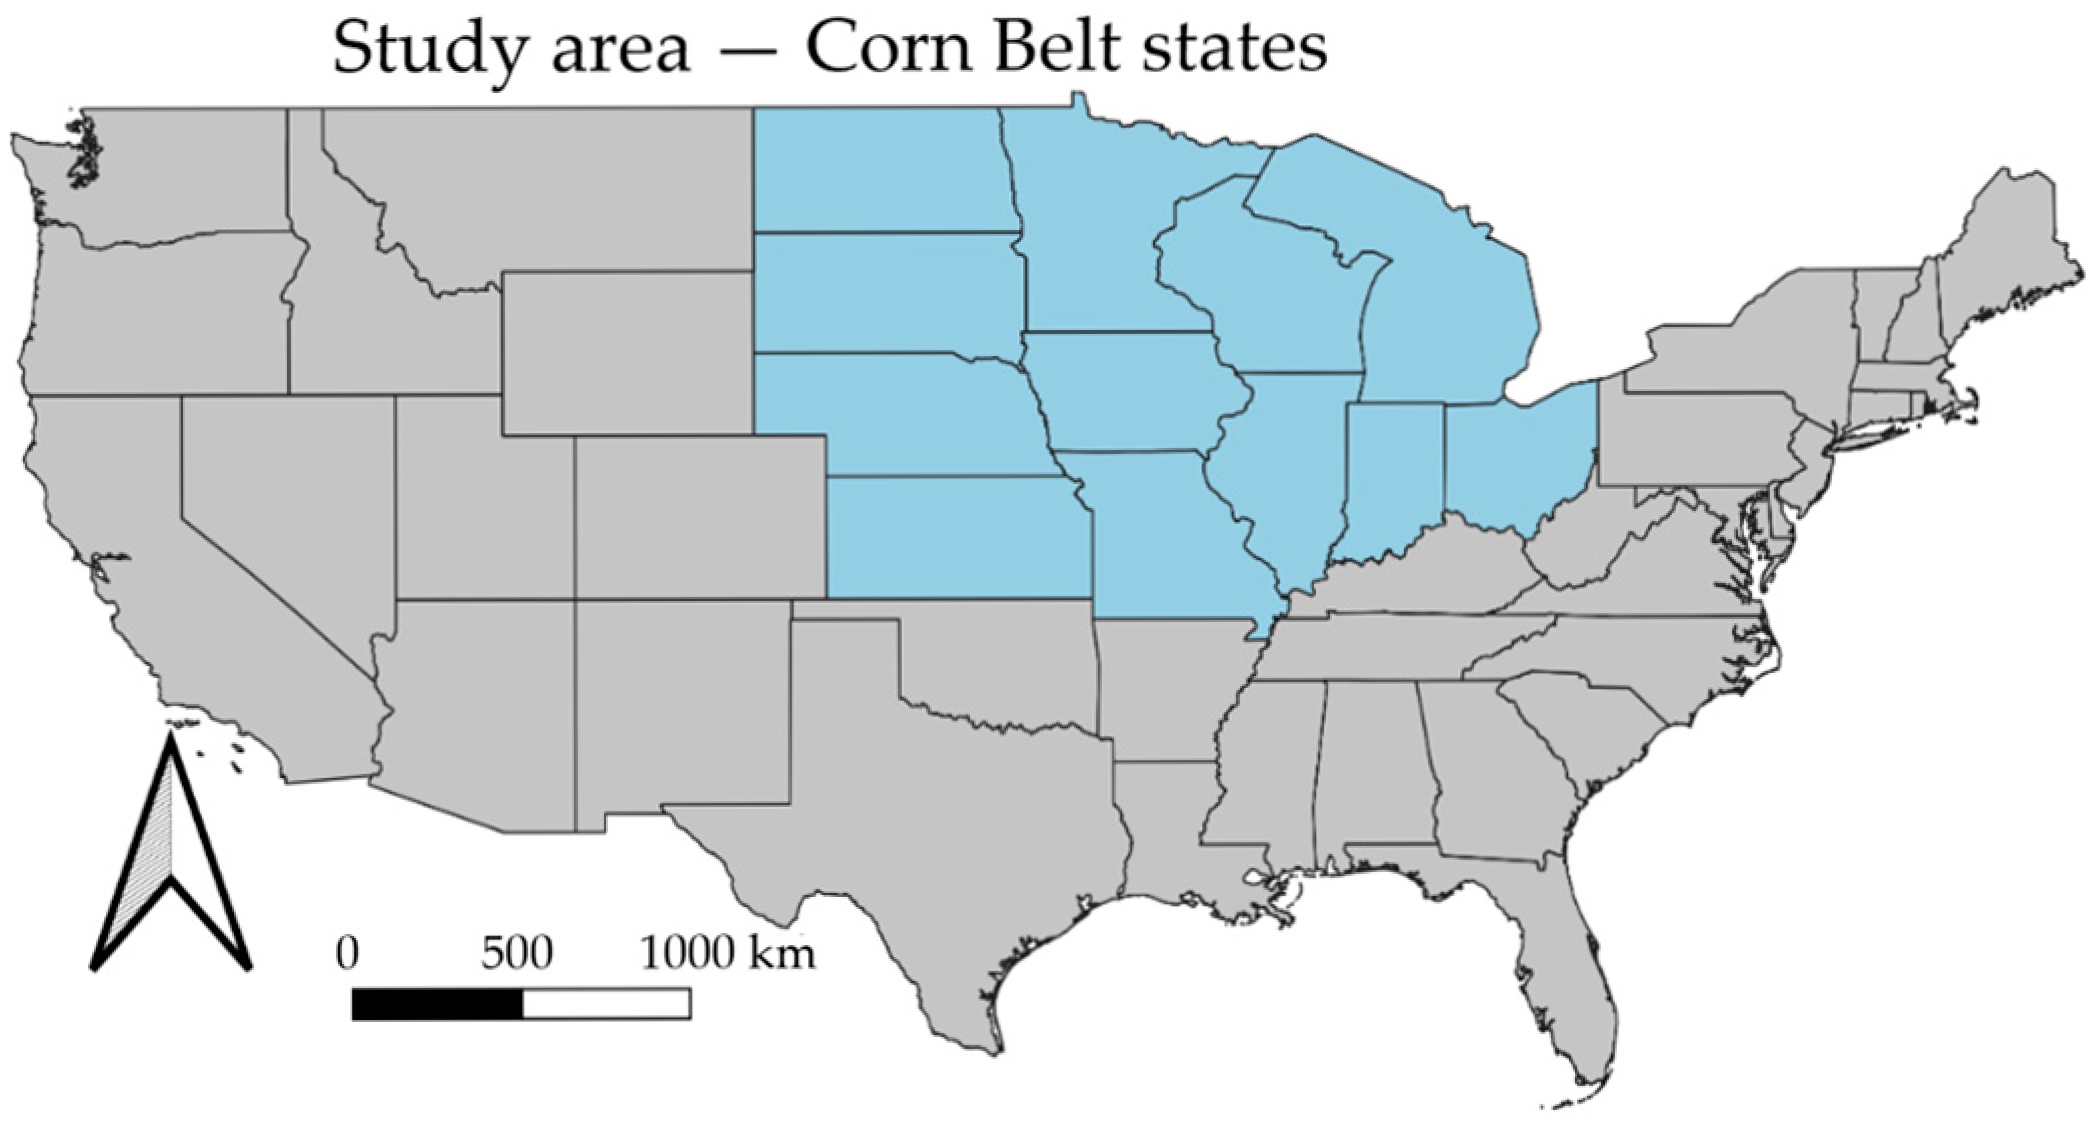
Figure 1 presents the flowchart of the study. A total of 12 states were included in the investigation (
Figure 2).
2.2. Model Selection
In this study, several alternative models were initially considered, including traditional logistic regression, random forest, and neural networks. Traditional logistic regression offers simplicity and interpretability but is limited in its ability to fully quantify parameter uncertainty [
31]. Random forest and neural networks deliver strong predictive performance; however, they are more complex, less interpretable, and do not naturally provide posterior distributions for uncertainty analysis [
32]. Although Bayesian neural networks can provide uncertainty estimation, they are less suitable for this study due to their high computational cost and limited interpretability in linking posterior parameters to specific predictors [
33].
Bayesian logistic regression was selected as the core framework for both phases due to its methodological advantages. The aim is not to maximise predictive accuracy but to generate probabilistic estimates of corn planting that reflect biophysical and economic conditions. By modelling the posterior probability distribution, this approach provides an uncertainty-aware understanding of planting tendencies [
34,
35].
In the context of counterfactual inference, Bayesian methods quantify uncertainty in both parameters and outcomes, addressing partial observability and label noise in land-use data through credible intervals [
36,
37,
38]. Compared to complex machine learning models, they also offer greater interpretability, with transparent posterior distributions linking covariates such as NCCPI, slope, and precipitation to land-use decisions [
39,
40]. Finally, the Bayesian framework aligns naturally with the two-stage design, where the focus is on estimating policy-free baselines and long-term land-use sustainability under uncertainty.
2.3. Phase 1: Counterfactual Modelling of Cropland Expansion
In the first phase, a Bayesian logistic regression model is implemented using a standardised input set comprising biophysical and climatic inputs, following standard practices [
34]. The binary response variable indicates whether a given pixel of land was planted with corn. Land parcels are mapped to pixels using the corn mask layer available on Google Earth Engine (GEE), which provides annual coverage of corn cultivation. Model fitting is conducted using the No-U-Turn sampler, a Hamiltonian Monte Carlo algorithm, with 2000 posterior draws following 1000 tuning steps to ensure robust convergence. The expression can be specified as Equations (1)–(3):
where
is a binary indicator of corn planting for pixel
i,
denotes the
jth standardised predictor (e.g., NCCPI, precipitation, slope, temperature metrics) for pixel
i,
is the intercept,
are regression coefficients,
is the probability of corn planting,
is the prior variance. In this study, non-informative (weakly informative) priors are adopted for all regression coefficients,
σ is specified as 5.
To ensure the reliability of posterior inference, Markov chain convergence was assessed using the potential scale reduction factor
[
41,
42]. Values of
close to 1 indicate satisfactory convergence of the sampling chains; all estimated parameters in this study exhibited
< 1.01, confirming robust posterior estimation.
After model training, the fitted model is applied to the 2016 data to generate counterfactual predictions. For each pixel of land, the mean predicted probability across all posterior samples is used to represent the expected likelihood of planting under pre-policy conditions. Pixels with actual planting but predicted counterfactual probability below 0.5 are identified as likely cases of policy-induced expansion. The posterior distributions of model parameters are visualised and summarised to enable uncertainty-aware interpretation of input effects.
2.4. Phase 2: Modelling Long-Term Abandonment
In the second phase, we develop a separate Bayesian logistic regression model focused on those lands that were newly brought into production during the expansion period (any year from 2014 to 2016, with NCCPI ≤ 0.42). The target variable is defined as complete abandonment, operationalised as a lack of corn cultivation in all years from 2022 to 2024. Negative cases are land pixels that were planted at least once during the same period. This definition excludes short-term crop rotations by requiring continuous non-cultivation of corn for three consecutive years, thereby distinguishing true abandonment from rotational fallowing.
Posterior inference again uses the No-U-Turn sampler, with 2000 draws following 1000 tuning steps. Model performance is evaluated using the Area Under the Receiver Operating Characteristic Curve (AUC-ROC) on a held-out test set (30% of samples), and the distribution of predicted outcomes is assessed through posterior predictive sampling. The posterior coefficient distributions are interrogated to determine which inputs are most strongly associated with abandonment, enabling an uncertainty-aware analysis of the conditions under which policy-driven expansion failed to sustain long-term cultivation.
2.5. Model Evaluation
Model performance in both phases is first assessed using the Area Under the Receiver Operating Characteristic Curve (AUC-ROC) (Equation (4)), quantifying the ability to distinguish between positive and negative cases [
43,
44].
where
are the numbers of positive and negative cases, respectively,
denotes the predicted probability for sample
i. An AUC value closer to 1 indicates better model performance in distinguishing between positive and negative cases. An AUC of 1.0 represents perfect discrimination, while an AUC of 0.5 suggests no discriminative ability (equivalent to random guessing). However, in this context, AUC should be interpreted with caution, as observed land-use labels are only a partial manifestation of true suitability—many “false negatives” may represent land that could have been cultivated under different circumstances, introducing label noise and partial observability.
To complement AUC, the calibration of predicted probabilities using reliability curves is evaluated. These curves compare the predicted probabilities to the empirical frequency of positive cases across uniformly spaced bins. A well-calibrated model should yield probability estimates that closely match observed outcome frequencies. In addition, the Brier Score is computed to quantitatively assess the accuracy of probabilistic predictions [
45]. The Brier Score is defined as Equation (5):
where
is the number of samples,
is the predicted probability for sample
i, and
is the observed outcome for sample
i. The Brier Score takes values between 0 and 1, with lower values indicating better calibrated and more accurate probabilistic predictions.
Beyond point predictions, the Bayesian framework provides posterior distributions over model parameters and predicted outcomes, formally quantifying epistemic uncertainty. This is particularly valuable in the context of counterfactual modelling, where many cases are ambiguous or unobserved. For each pixel of land, both a predicted probability and a credible interval are reported, allowing for detailed, uncertainty-aware interpretation. Posterior distributions of model coefficients provide insight into the relative certainty with which each input influences planting or abandonment likelihood. Notably, predictions with high uncertainty can be flagged for further investigation, especially in policy contexts where land-use sustainability is in question.
2.6. Input Data and Variable Preparation
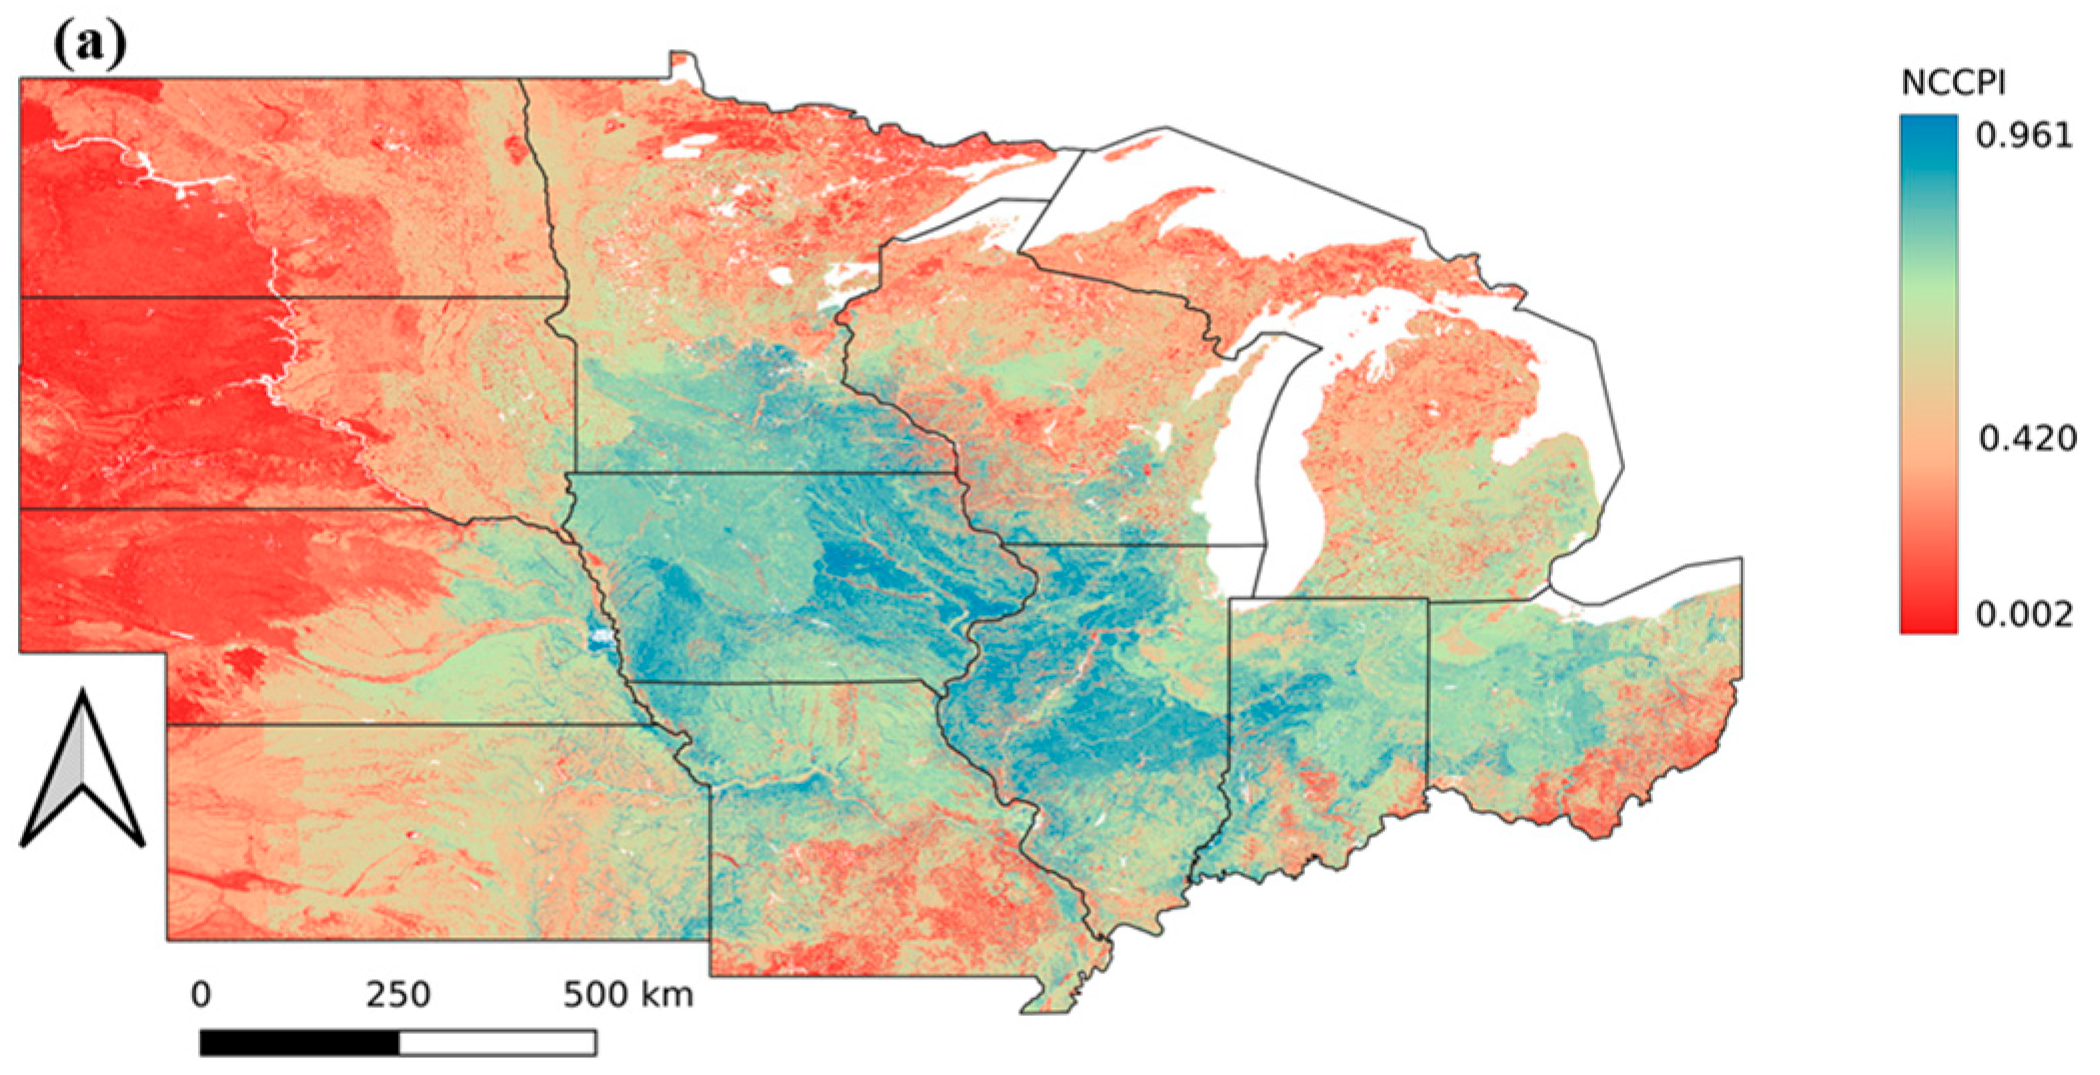
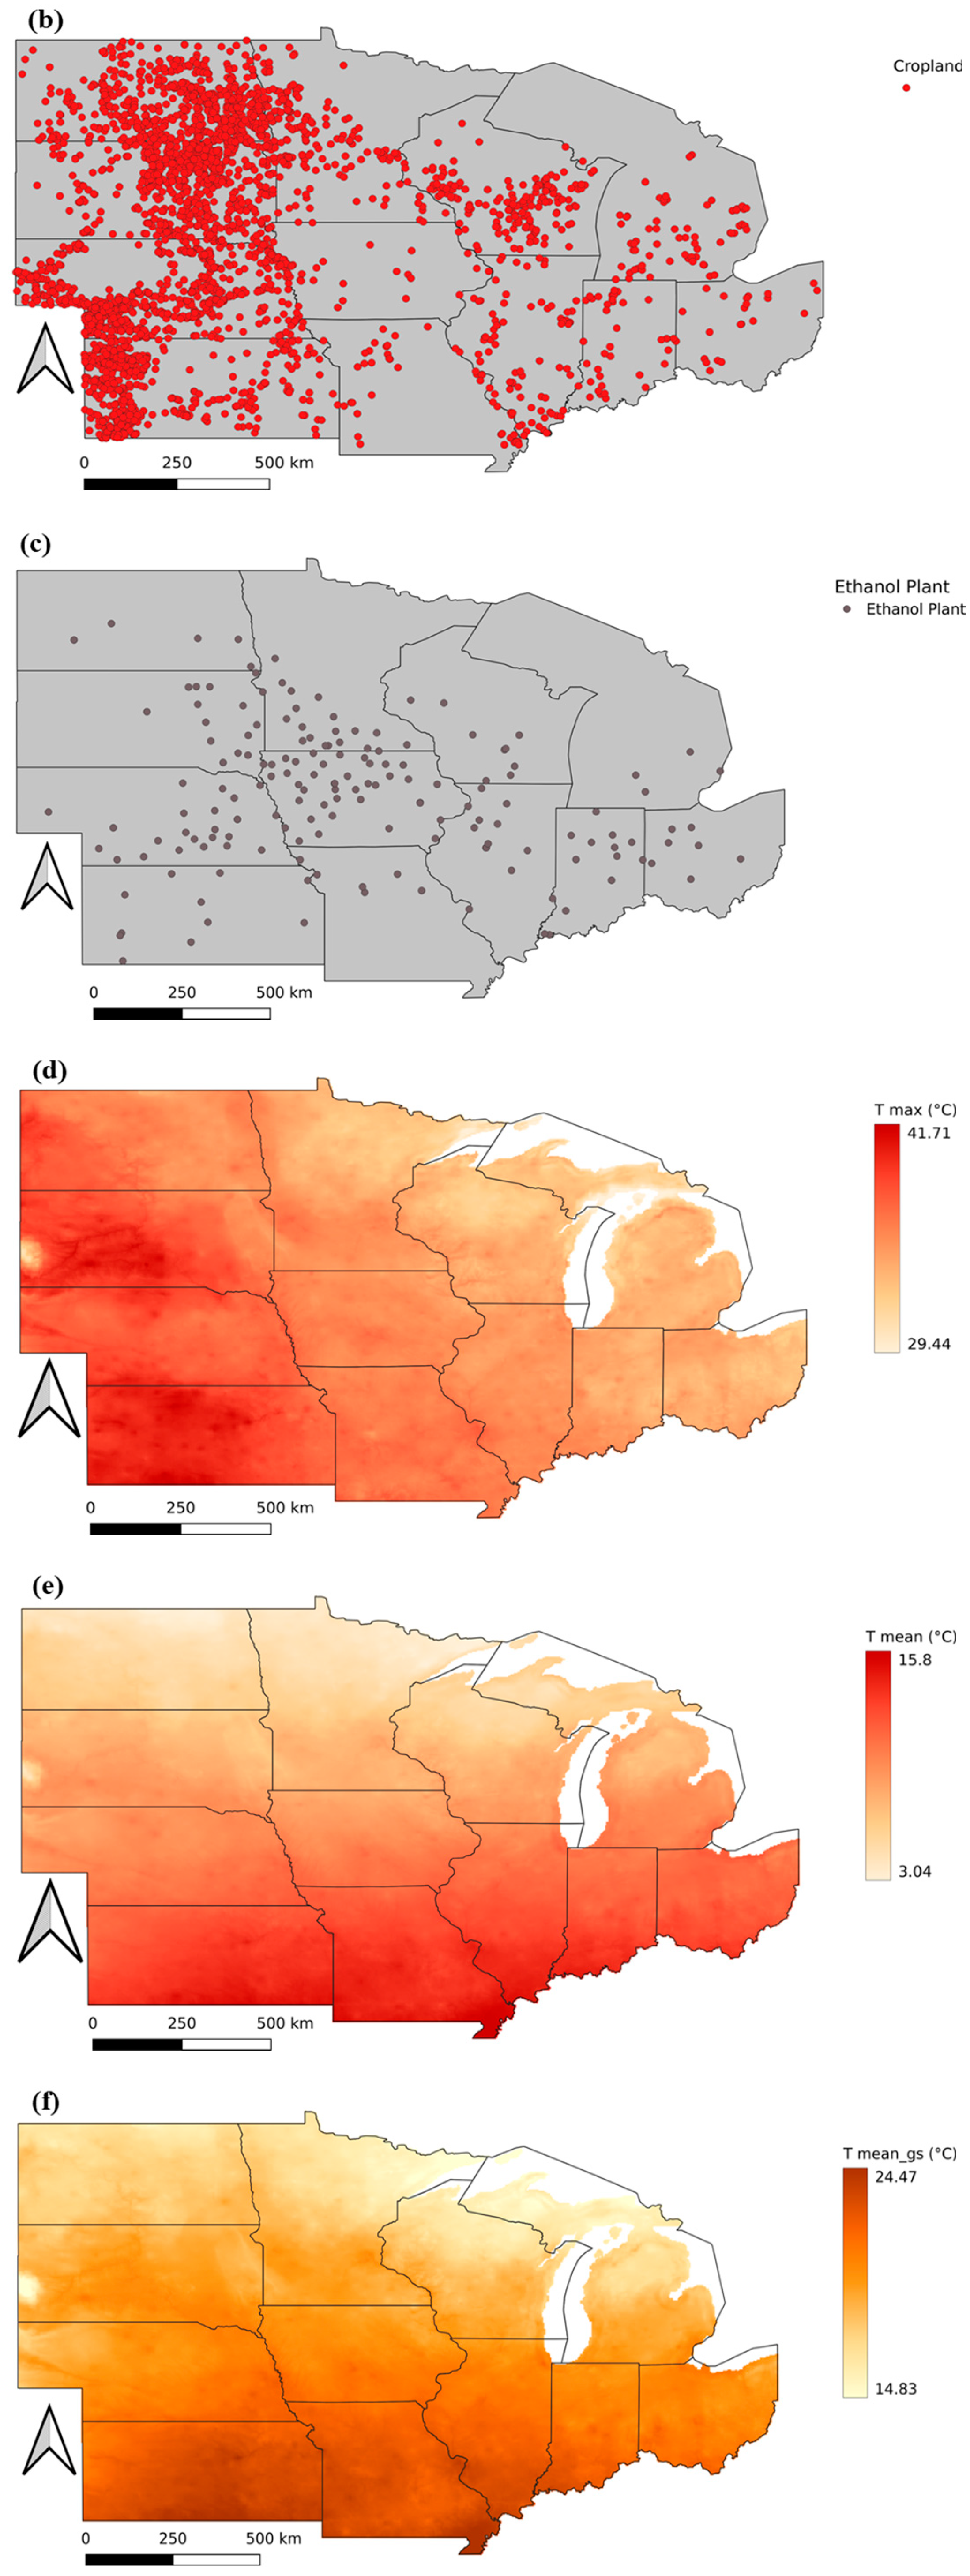
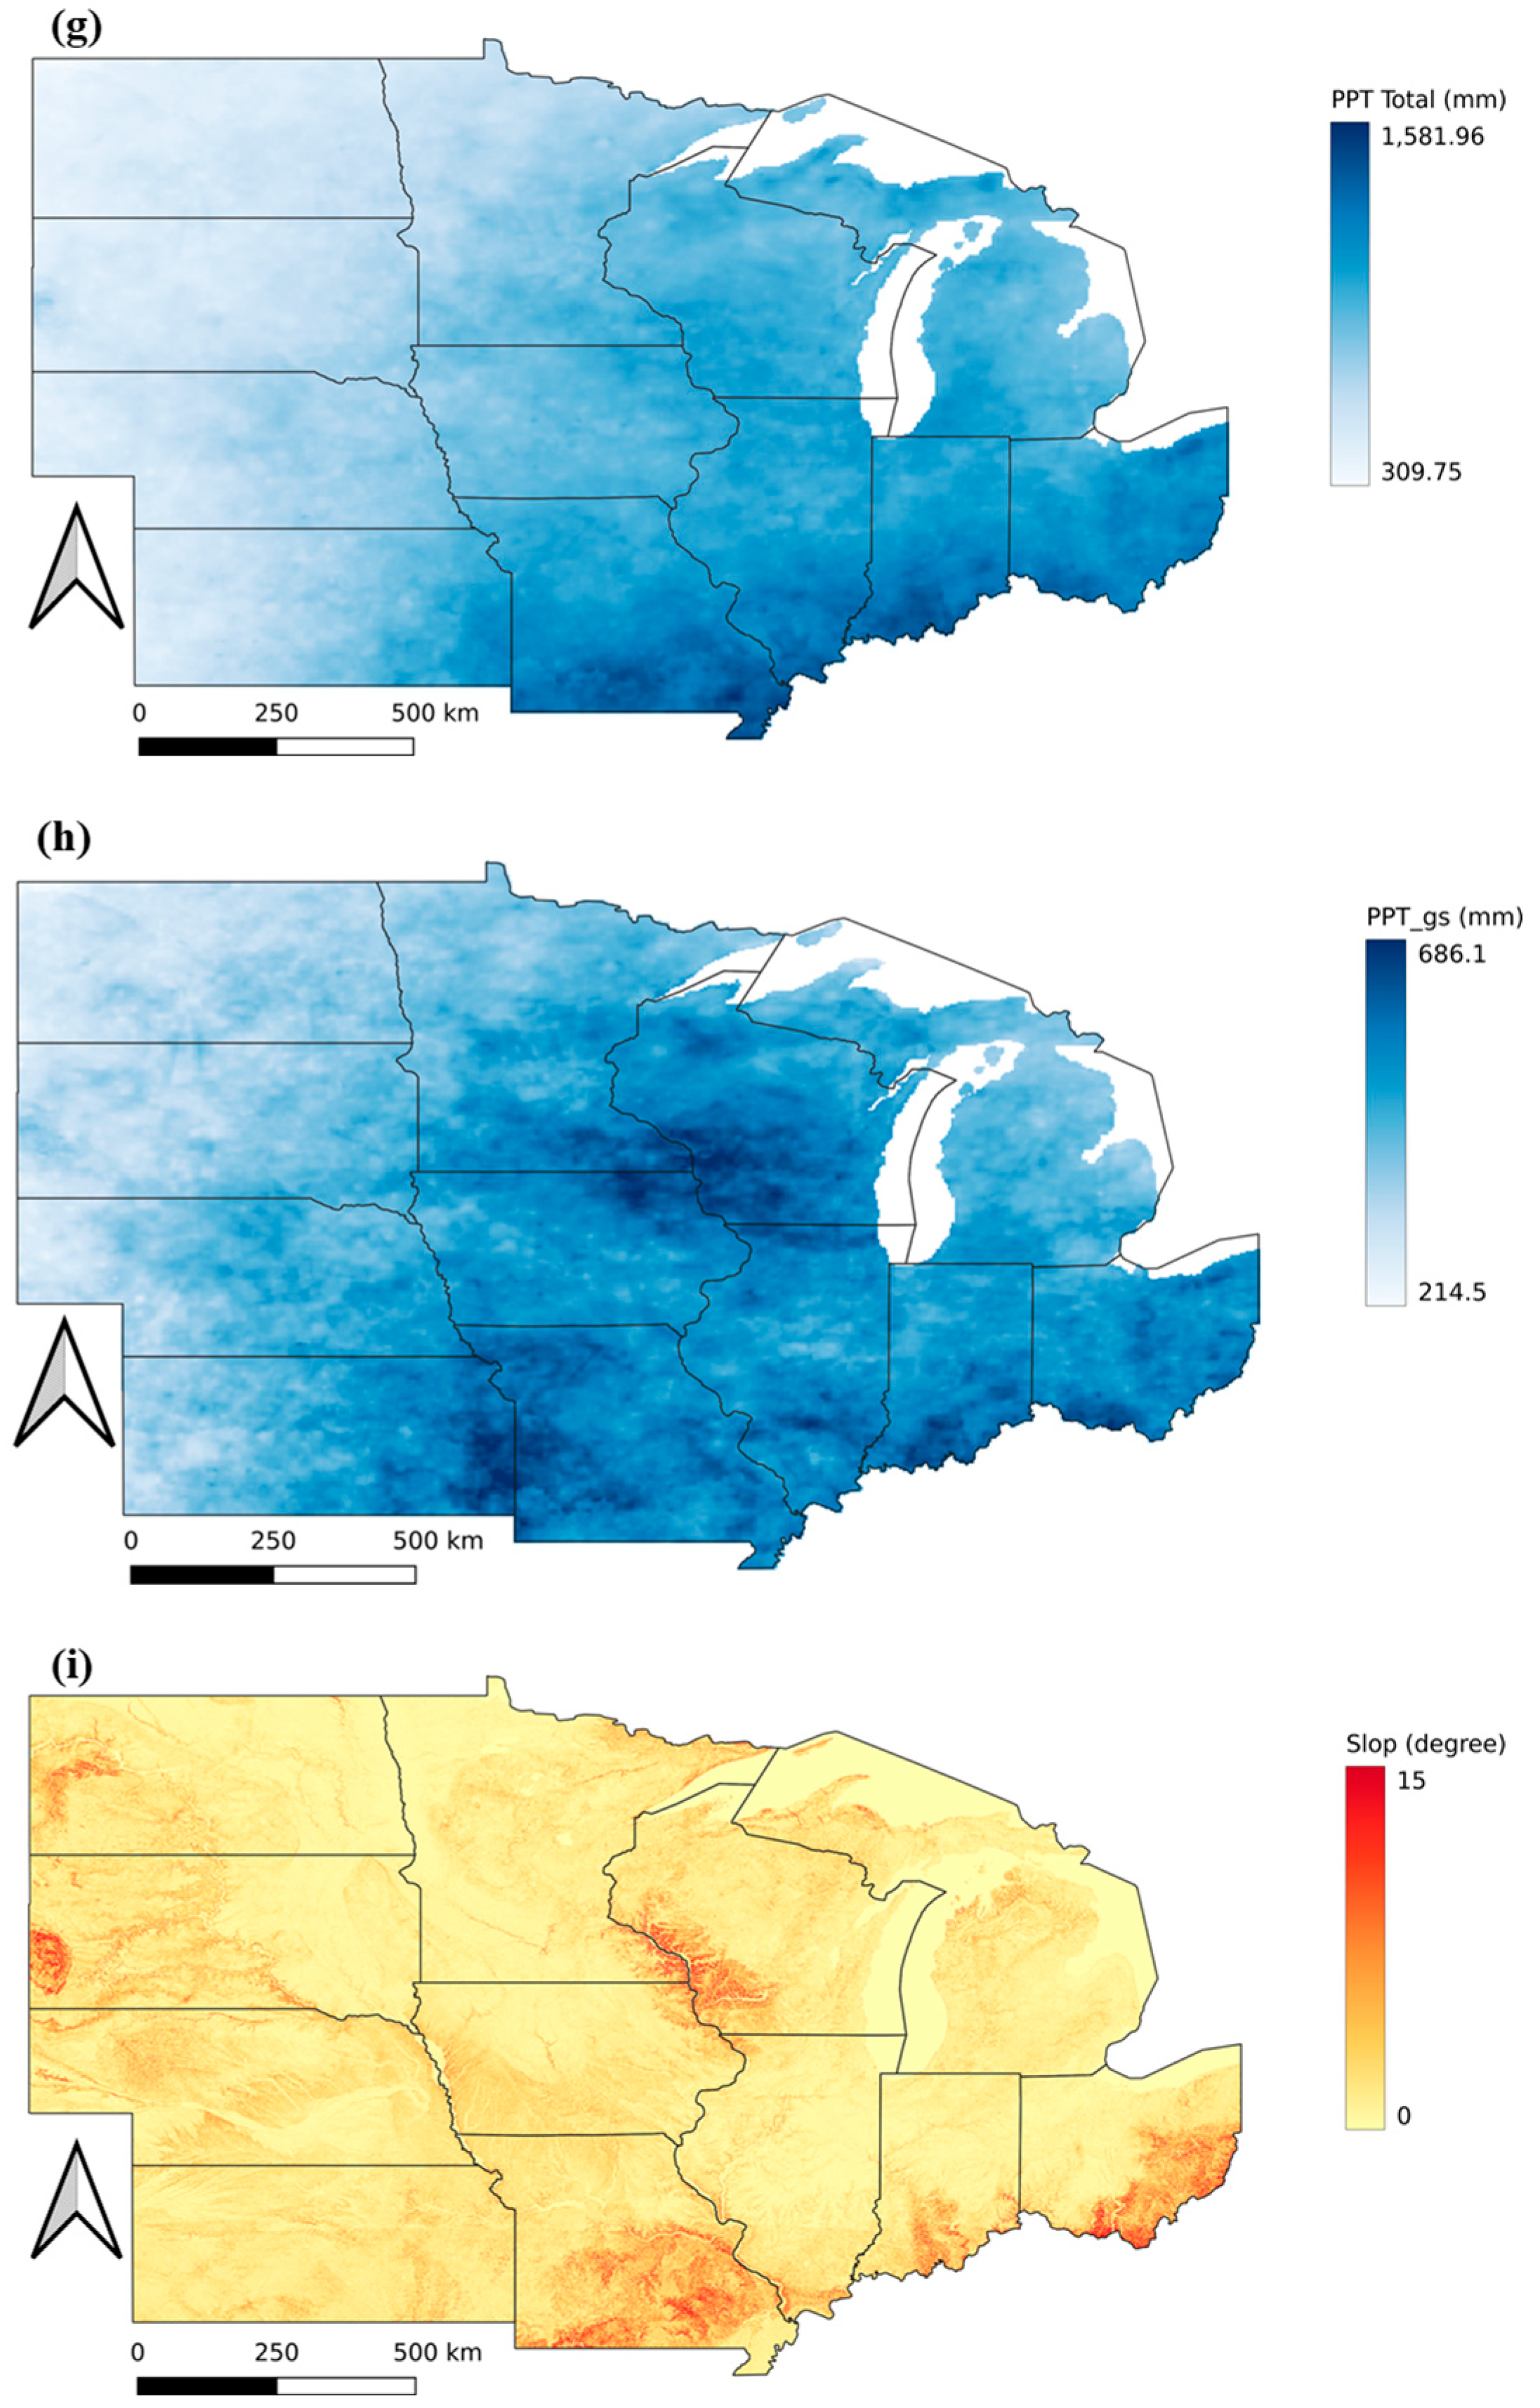
To prepare the modelling dataset, a balanced sample of 3000 positive cases (pixels classified as corn) and 3000 negative cases (uncultivated pixels) was randomly drawn from marginal lands (NCCPI ≤ 0.42). All continuous predictors were standardised to zero mean and unit variance prior to model fitting to ensure comparability of regression coefficients. Soil productivity was captured by the National Commodity Crop Productivity Index (NCCPI), a composite indicator derived from the SSURGO database, which integrates key soil properties including texture, organic matter, pH, and water-holding capacity [
46]. Due to the comprehensive nature of NCCPI, additional soil chemical variables (e.g., nitrogen, carbon, EC, CEC) were excluded as either redundant or unavailable at adequate spatial resolution. The spatial distribution of key inputs is illustrated in
Figure 3.
The point-biserial correlation coefficient (
) measures the strength and direction of the association between a binary variable and a continuous variable [
47] (Equation (6)). In this study, this method is used to conduct a preliminary assessment of the correlation between each input variable and the binary response prior to model fitting (
Table 1). This simple correlation analysis helps to identify potentially informative predictors for subsequent modelling.
where
and
are the means of the continuous variable for the binary groups (1 and 0),
is the standard deviation of the continuous variable,
are the sample sizes for each group, and n =
.
indicates the strength and direction of association between the binary and continuous variables. A positive value suggests that the continuous variable is, on average, higher when the binary variable equals one, while a negative value indicates the opposite. The closer the absolute value of
is to 1, the stronger the association; values near zero indicate weak or no association.
3. Results
3.1. Model Validation
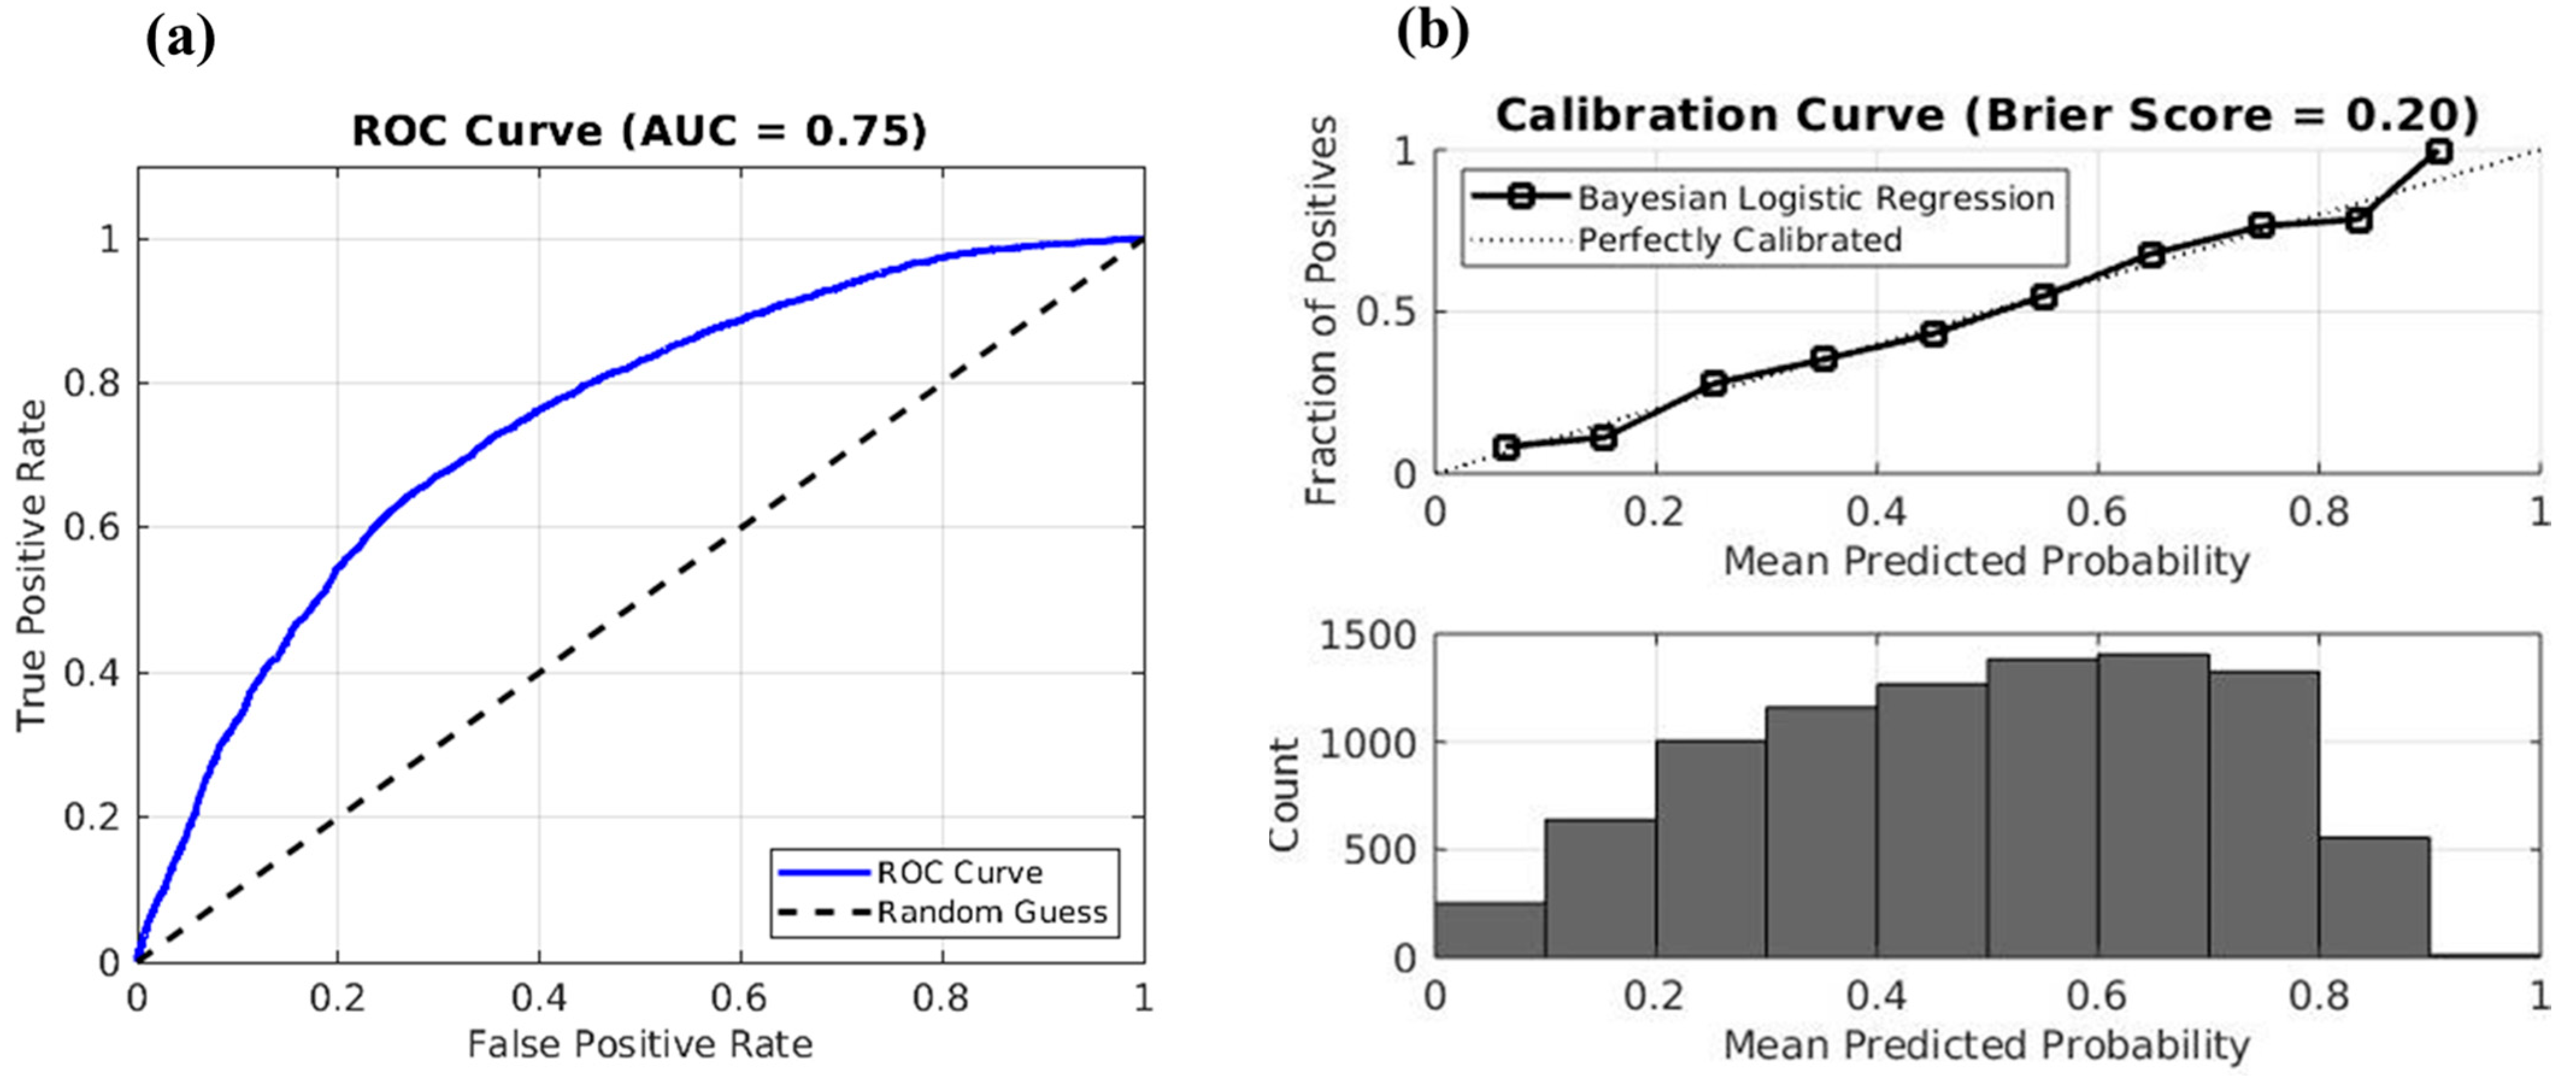
The performance of the Bayesian logistic regression model was evaluated using data from the pre-RFS period (2000–2006, excluding 2005). The model exhibited a moderate level of discriminatory ability, with an AUC of 0.75 (
Figure 4a). This suggests that the model was able to distinguish between cultivated and uncultivated marginal lands with reasonable accuracy, though not without limitations.
Model calibration was further assessed through a reliability curve and Brier Score. The calibration plot (
Figure 4b, upper panel) indicated a close alignment between predicted probabilities and observed frequencies, particularly in the mid-to-high probability range, while some underestimation was observed at lower predicted values. The Brier Score of 0.20 reflects moderate overall probabilistic accuracy. The histogram of predicted probabilities (
Figure 4b, lower panel) showed a uniform distribution, suggesting the model did not over-concentrate predictions in extreme probability bins.
3.2. Counterfactual Prediction of Cultivation Probability in 2016
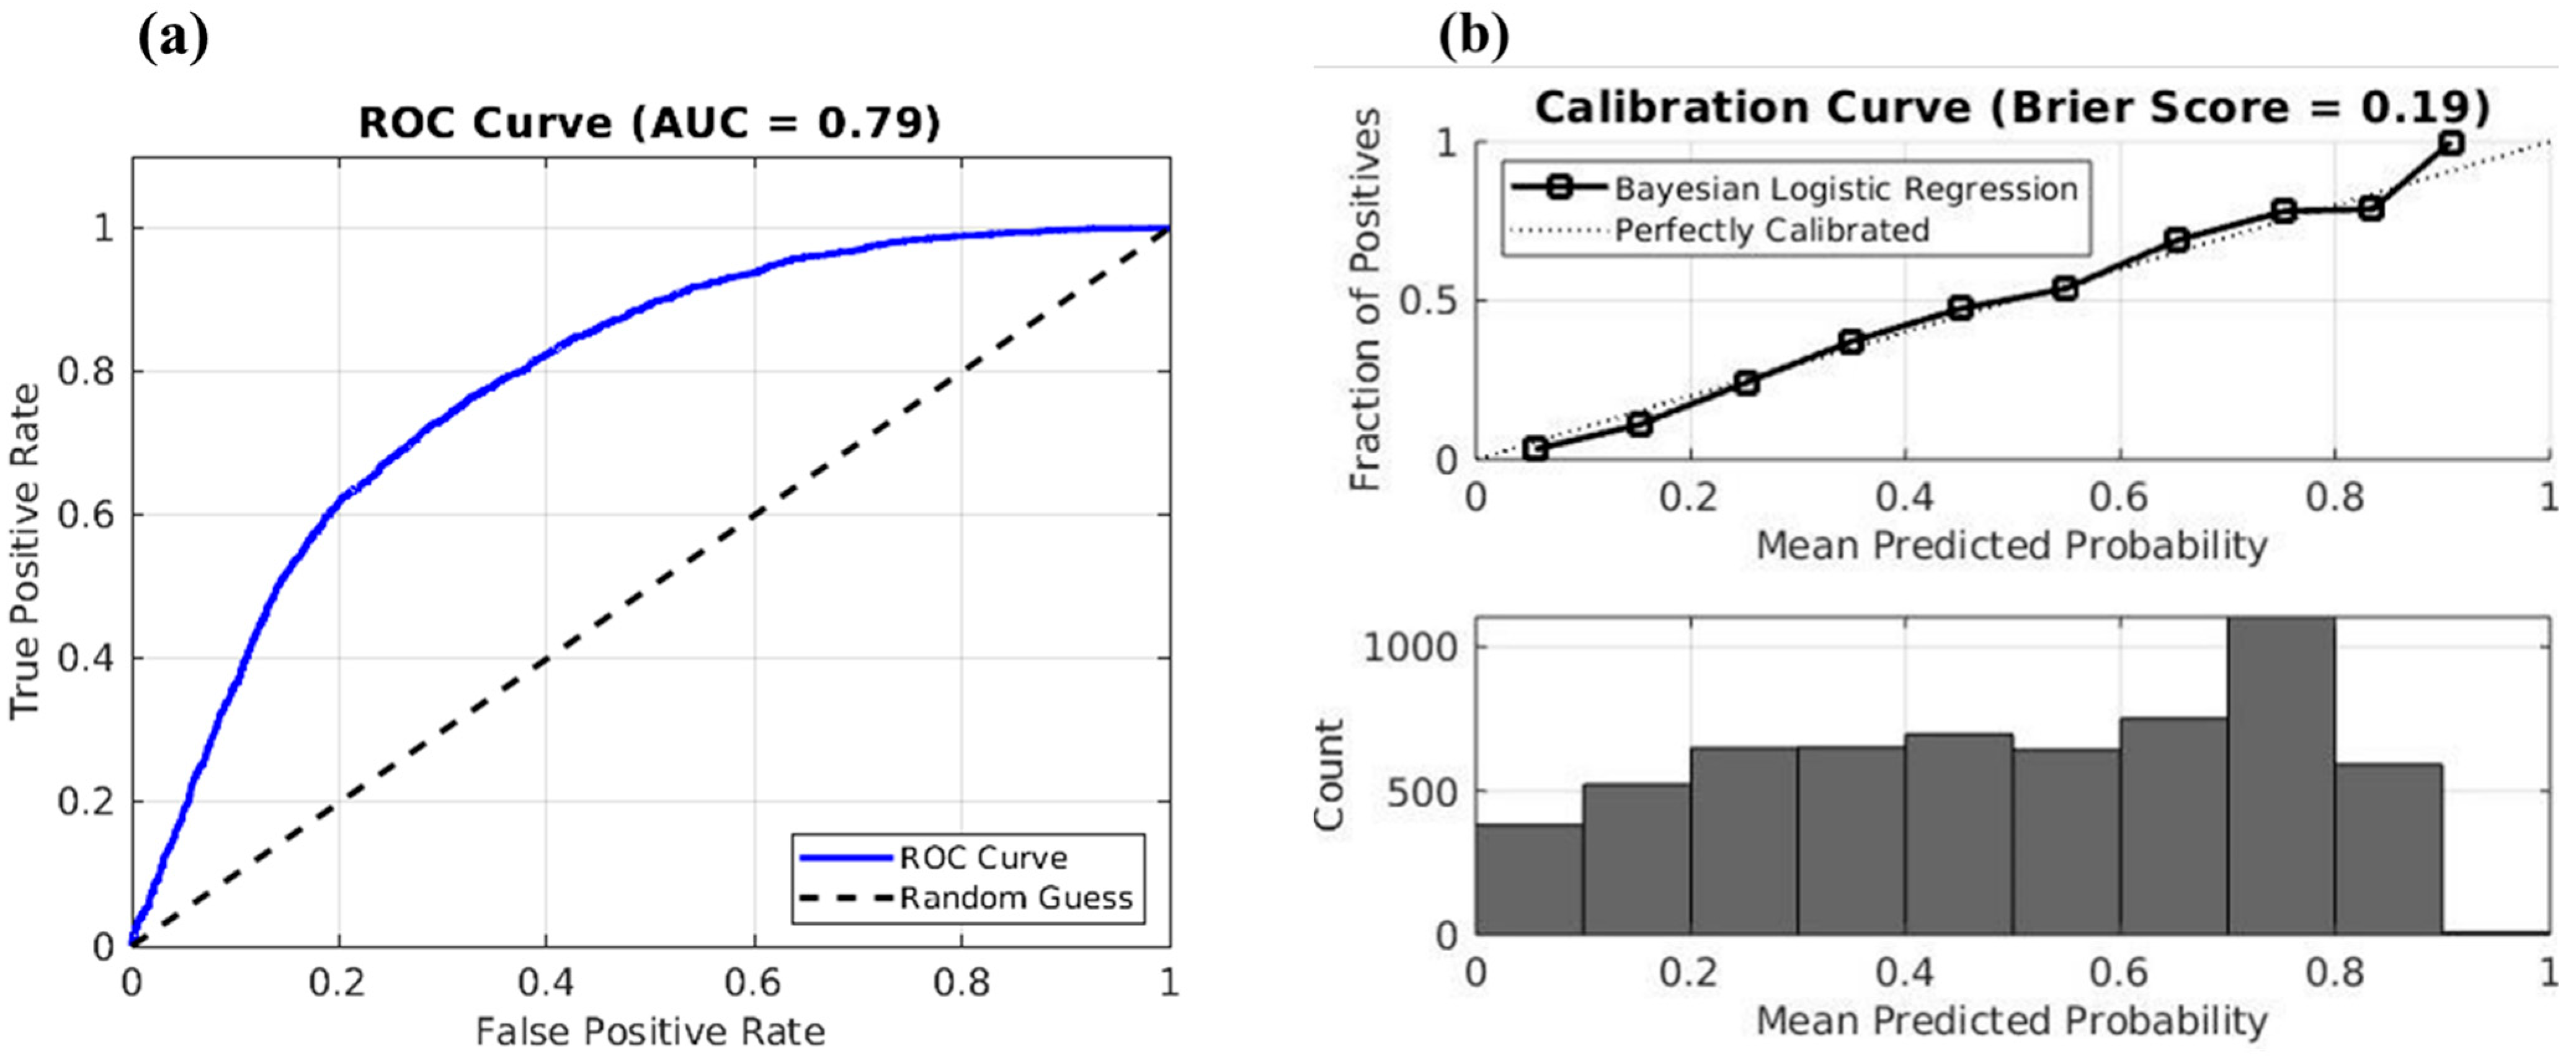
The application of the Bayesian logistic regression model to the 2016 data yielded an AUC of 0.79, reflecting strong discriminatory ability in distinguishing between cultivated and uncultivated pixels on marginal land (
Figure 5). The calibration curve (Brier Score = 0.19) indicates that predicted probabilities are generally well aligned with observed frequencies, and the distribution of predicted values is broadly uniform across probability bins.
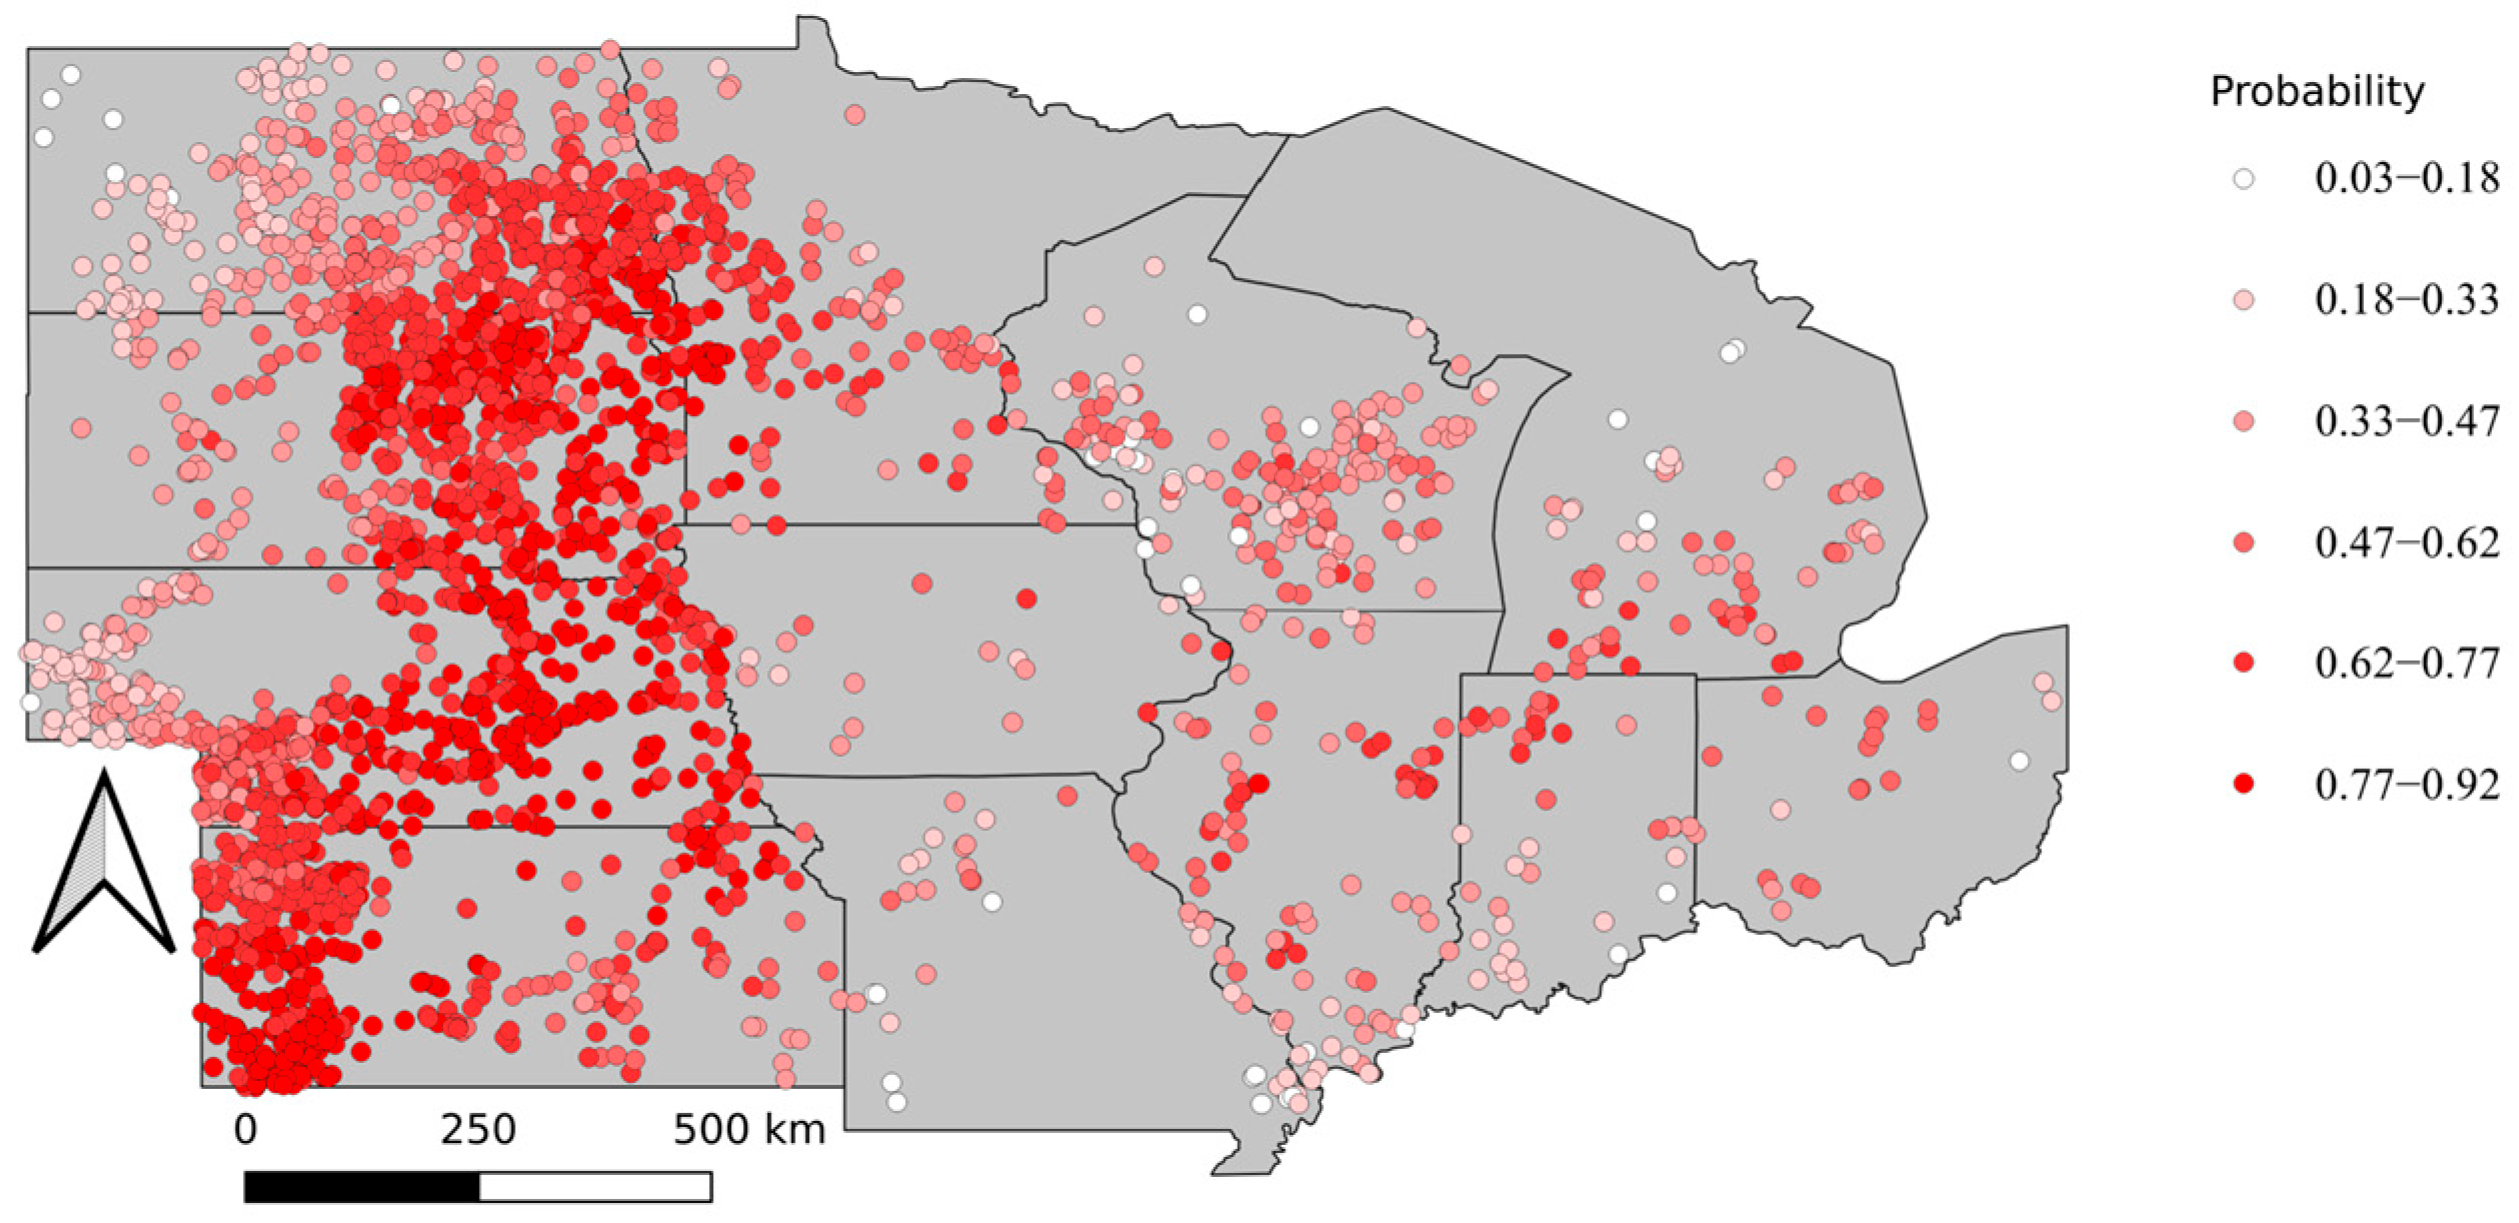
The counterfactual predictions of corn cultivation in 2016 without the influence of the RFS policy are illustrated in
Figure 6. These predictions represent the likelihood that marginal and sub-marginal land areas would have been cultivated purely due to their biophysical suitability and climatic conditions, independent of RFS-induced market incentives.
As shown in
Figure 6, the spatial distribution of the predicted probabilities exhibits considerable variability across the U.S. Corn Belt. Regions with the highest predicted probabilities (0.77–0.92) primarily cluster in the central and southern portions of the Corn Belt, particularly concentrated around Nebraska, Iowa, and southern Minnesota. In contrast, lower predicted probabilities (below 0.5) are predominantly found at the peripheries, including northern and western fringe regions characterised by relatively poor soil productivity (low NCCPI), higher slopes, or less favourable climatic conditions.
Quantitative analysis indicates that 26.67% of pixels cultivated in 2016 were assigned predicted probabilities below the 0.5 threshold.
Table 2 presents the posterior distributions of the regression coefficients, providing further insights into the drivers of cultivation decisions under baseline conditions. Ethanol plant proximity exhibited a strong negative association with predicted cultivation likelihood (mean = −0.643; 95% CrI: −0.688 to −0.597), consistent with expectations that greater distance from ethanol plants would reduce cultivation incentives. Climatic variables demonstrated complex relationships with baseline cultivation probabilities. Total annual precipitation (ppt_total) showed a strong negative association (mean = −1.291; 95% CrI: −1.408 to −1.174), suggesting excessive precipitation may limit corn cultivation due to drainage and operational constraints. Conversely, growing season precipitation (ppt_gs) exhibited a positive relationship (mean = 0.708; 95% CrI: 0.613 to 0.801), underlining the critical role of adequate rainfall during crop development periods.
Temperature variables presented similarly complex patterns. Annual mean temperature (tmean) had a clearly positive effect on the likelihood of corn cultivation (mean = 0.667; 95% CrI: 0.539 to 0.802), reflecting the climatic suitability within optimal corn-growing temperature ranges. However, mean growing season temperature (tmean_gs) had a negative impact (mean = −0.244; 95% CrI: −0.370 to −0.117), indicating that overly high temperatures during key developmental stages may adversely affect corn productivity, thus reducing cultivation probabilities on marginal lands.
Furthermore, soil productivity as measured by the NCCPI was positively related to cultivation probability (mean = 0.376; 95% CrI: 0.341 to 0.408), reaffirming that, even within marginal areas, relative improvements in soil quality significantly influence cultivation likelihood. Slope showed a negative relationship (mean = −0.442; 95% CrI: −0.479 to −0.404), confirming that steeper terrain remains a critical deterrent to corn expansion under baseline conditions.
3.3. Phase 2: Analysis of Complete Cropland Abandonment
In the second phase of the analysis, attention was directed toward the fate of marginal lands that had been newly cultivated during the RFS-induced expansion but subsequently experienced complete abandonment of corn cultivation. Land pixels were classified as abandoned if they were cultivated in any year between 2014 and 2016 but remained uncultivated in each year from 2022 to 2024. These abandoned pixels were designated as the positive class, while those with continuous cultivation throughout the entire period formed the negative class.
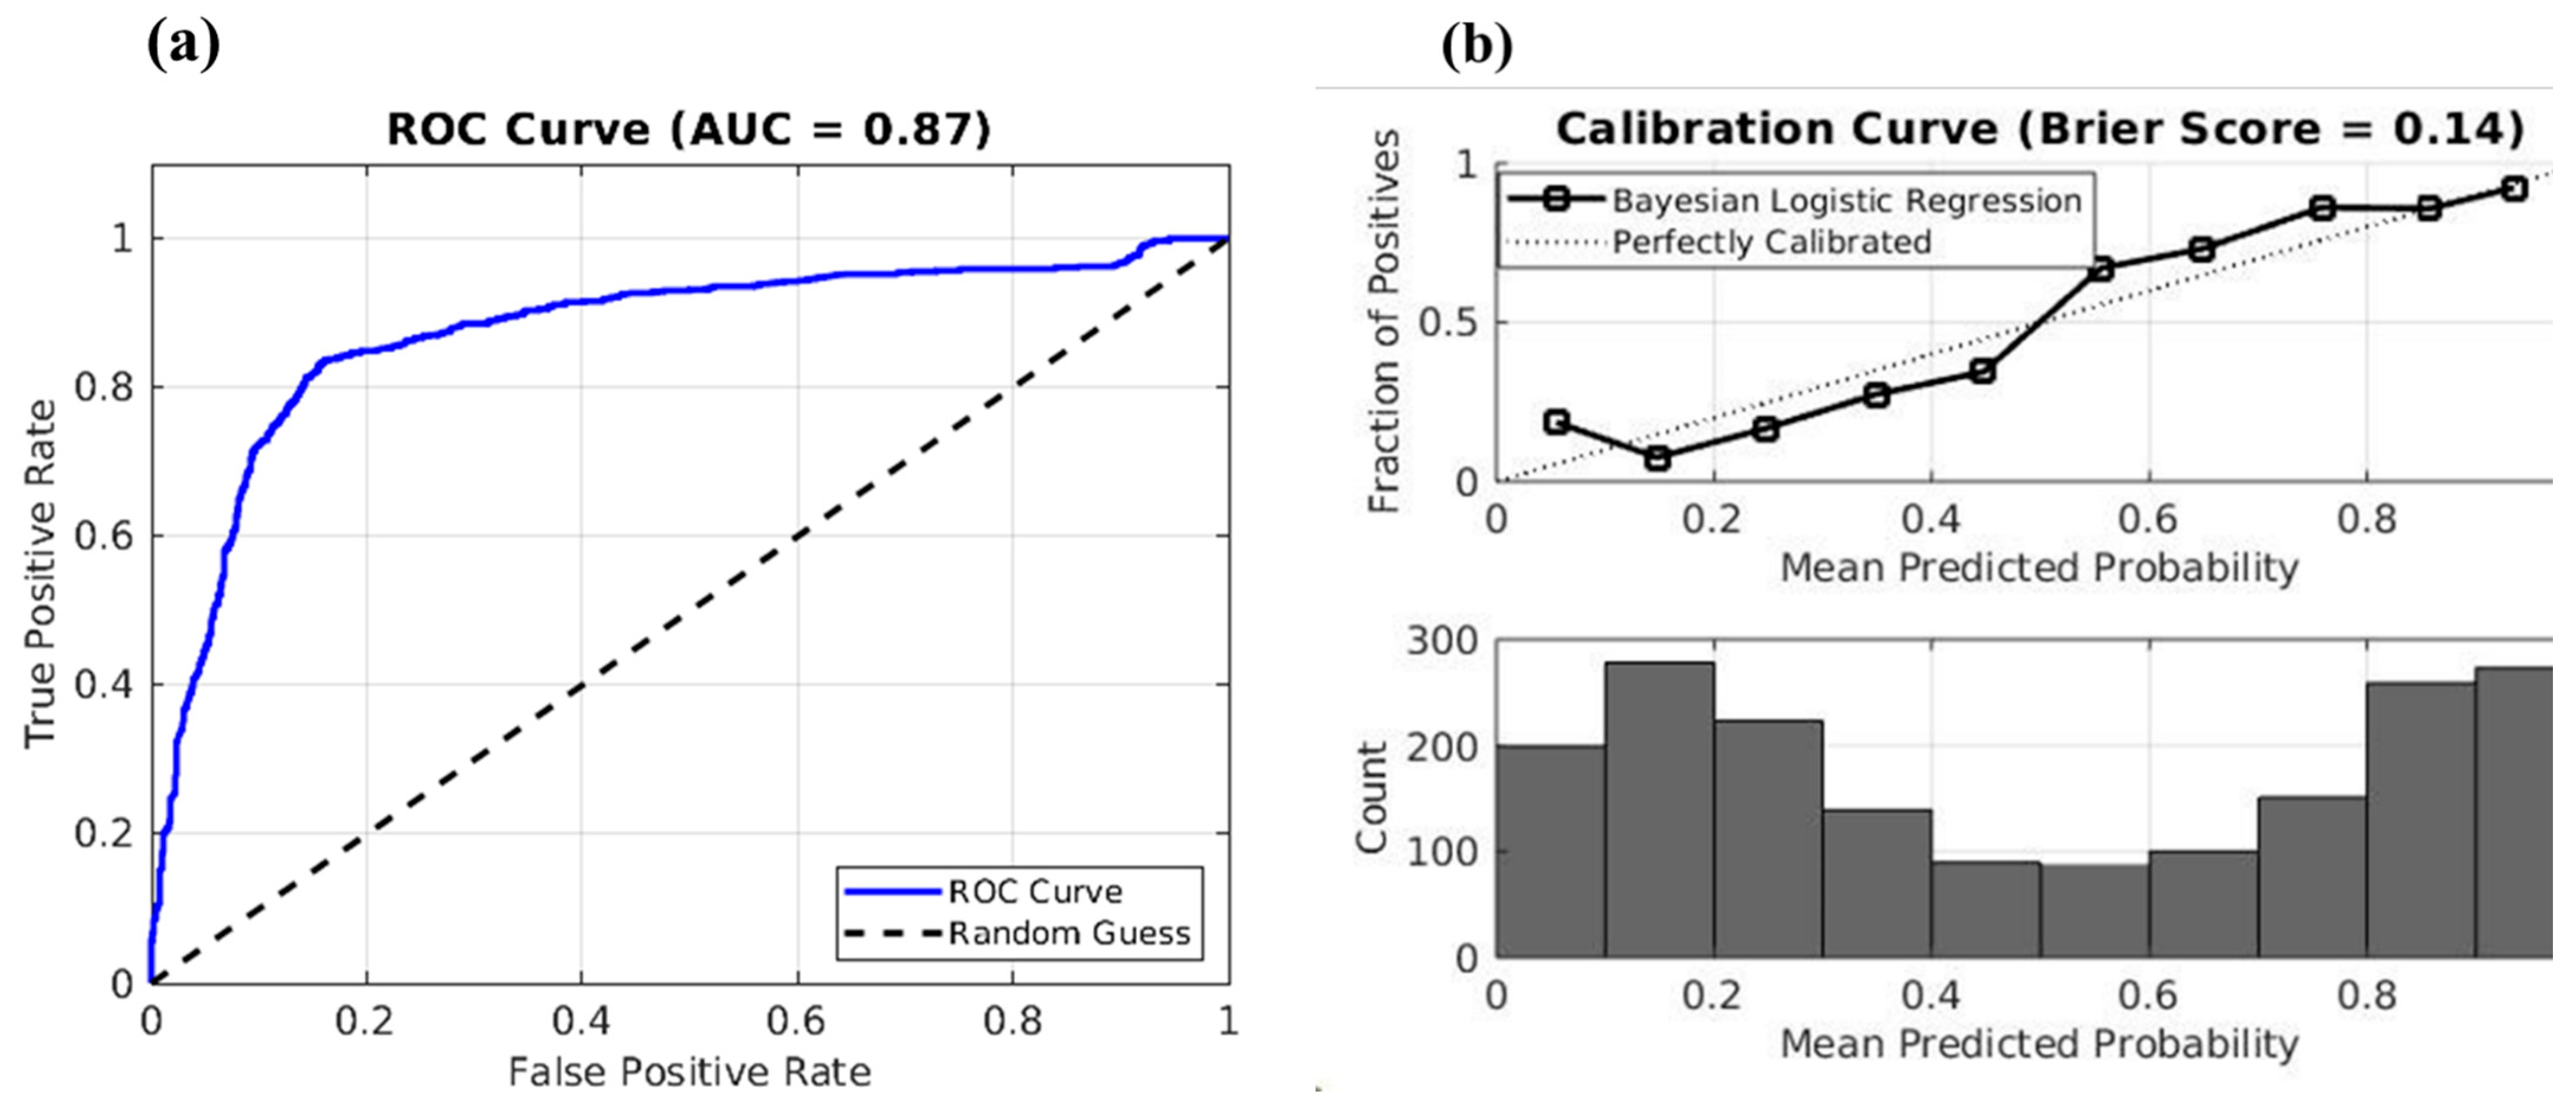
The performance of the Bayesian logistic regression model in predicting abandonment risk is illustrated in
Figure 7. The ROC curve for the test set yields an AUC of 0.87. This is mainly due to the strong contrast in key variables—particularly ethanol plant distance, temperature, and precipitation—between abandoned and retained cropland. These relationships allow the Bayesian logistic regression model to correctly classify most cases, demonstrating genuine predictive skill rather than random separation. The calibration curve (Brier Score = 0.14) further demonstrates that predicted probabilities closely match observed frequencies, supporting the reliability of the model for probabilistic risk assessment.
Spatial analysis revealed that the distribution of abandoned cropland was highly uneven across the study area. As depicted in
Figure 8a, most abandonment events occurred in the northwestern and peripheral regions of the Corn Belt, where marginal soils, steeper slopes, and less favourable climate conditions predominate. In contrast, retained cultivation sites were more prevalent in central zones with higher baseline suitability. The mapped distribution of predicted abandonment probabilities (
Figure 8b) corroborates these findings, highlighting a concentration of high-risk areas in locations with persistent biophysical and economic constraints.
The posterior parameter estimates (
Table 3) provide further insight into the drivers of abandonment risk. Higher mean annual temperatures (tmean) and greater distances from ethanol plants (ethanol_distance) were strongly associated with increased probability of abandonment, reflecting both climatic vulnerability and reduced market access. Conversely, greater annual precipitation (ppt_total) and higher soil productivity (NCCPI) reduced the risk of abandonment, consistent with the fundamental role of these factors in supporting sustainable corn production. The effects of growing season climate variables were more complex, with evidence that excessive temperatures or inadequate precipitation during the crop development window increased vulnerability to abandonment.
Overall, these results demonstrate that while the RFS policy initially drove corn expansion onto marginal lands, the long-term retention of such cultivation is highly contingent on local environmental and market conditions.
4. Discussion and Limitation
The results highlight both the promise and inherent limitations of probabilistic modelling for quantifying policy-driven land-use change. While the Bayesian logistic regression framework effectively distinguishes between cultivated and uncultivated land pixels and provides interpretable probability estimates, several factors constrain the precision of policy attribution. The choice of Bayesian logistic regression reflects a deliberate balance between model interpretability, computational feasibility, and the need for formal uncertainty quantification. While non-Bayesian approaches such as random forest or conventional neural networks could achieve higher predictive accuracy, they lack explicit posterior inference, which is crucial for probabilistic counterfactual evaluation. Future work could explore Bayesian neural networks or ensemble probabilistic models to further improve predictive performance while maintaining transparency and uncertainty awareness.
While previous studies have estimated cropland expansion due to biofuel production, ranging from 0.01 to 2.45 million acres per billion gallons [
16], our probabilistic counterfactual analysis provides a spatially explicit estimate of marginal land conversion under RFS incentives. Unlike deterministic models, our approach quantifies uncertainty and reveals that over 26% of marginal land cultivated in 2016 would likely not have been planted without policy intervention. These findings align with life-cycle assessments showing elevated carbon intensity and environmental degradation [
15,
17], but offer a more granular understanding of where and why such impacts occur. These environmental outcomes align with the well-documented impacts of agricultural expansion on marginal or ecologically sensitive lands, thereby offering indirect empirical support for the finding that the RFS policy contributed to the conversion of substantial areas of marginal land into corn cultivation.
A key limitation arises from the composition of the training dataset. The inclusion of agronomically suitable but historically uncultivated marginal lands in both positive and negative samples introduces ambiguity in the conceptualisation of baseline suitability. Therefore, the predicted probabilities for the 2016 test set may be systematically deflated, particularly for pixels at the suitability threshold. This ambiguity is reflected in the finding that only 26% of the 2016 cultivated marginal land pixels were classified as unlikely to be planted under no-policy conditions when a threshold of 0.5 was used. While this offers a conservative estimate of RFS-induced expansion, it likely underestimates the true policy impact. Adopting a higher probability threshold (e.g., 0.7 or 0.8) may provide a more realistic benchmark for identifying lands that would otherwise have remained uncultivated. However, there is currently no universally accepted criterion for selecting an optimal threshold, and such decisions inherently involve normative assumptions rather than purely statistical evidence. For this reason, the present study reports results based on the conventional 0.5 threshold while acknowledging that future work should incorporate sensitivity analysis or decision-theoretic approaches to formalise threshold selection.
Another important limitation concerns the challenge of endogeneity and omitted variable bias, particularly regarding factors such as ethanol plant location and evolving local market conditions. While spatial and biophysical controls were included, unobserved variables may still influence cultivation decisions, complicating strict causal interpretation.
Furthermore, the transferability of the model to other regions or time periods may be limited by changing agronomic practices, technological advances, and evolving climate conditions, all of which could shift the underlying suitability frontier. Finally, the use of land pixel-level probability thresholds for policy attribution, while methodologically transparent, inevitably involves value judgements about what constitutes a “likely” versus “unlikely” planting event, which may vary depending on context and policy objectives.
Overall, while the modelling approach provides a robust, data-driven framework for estimating policy-driven land-use change, results should be interpreted as lower-bound estimates and with appropriate caution regarding threshold sensitivity and data limitations.
5. Conclusions
This study makes both theoretical and methodological contributions. Theoretically, it advances understanding of how biofuel policies influence land-use dynamics by quantifying the probability—rather than the certainty—of policy-induced cropland expansion and abandonment. This probabilistic perspective challenges deterministic assumptions and enriches the conceptual framework for analysing policy–environment interactions. Methodologically, the integration of Bayesian logistic regression with spatial counterfactual analysis offers a robust and transparent framework for causal attribution under uncertainty. This approach can be extended to other sustainability policies where spatial heterogeneity and uncertainty are critical. Empirical findings show strong model discrimination and calibration, confirming the robustness of the analytical framework. Counterfactual results indicate that a substantial share of marginal lands cultivated after RFS implementation would likely not have been planted without policy incentives, underscoring the pivotal role of the RFS in driving cropland expansion onto less suitable areas. Sensitivity analysis further reveals that higher probability thresholds lead to greater estimated policy impacts. In the second phase, systematic patterns of post-expansion abandonment were identified, mainly associated with climatic disadvantage, poor soil productivity, and distance from ethanol markets. These results highlight that the sustainability of policy-driven land-use changes is highly contingent on local environmental and economic conditions.
From a policy perspective, the findings underscore the need for more spatially targeted and environmentally differentiated implementation of the RFS program. Policymakers could incorporate explicit land suitability thresholds into renewable fuel mandates to discourage cultivation on low-productivity or ecologically sensitive soils. Incentive mechanisms—such as RIN credits or biofuel subsidies—should be linked to environmental performance indicators, including soil carbon retention, erosion control, and nutrient management. In addition, promoting crop diversification and rotational practices on marginal lands can reduce long-term abandonment and maintain soil resilience. Finally, the development of spatially explicit monitoring systems based on remote sensing can help evaluate compliance and detect unintended land-use changes in real time.
Despite its strengths, the framework remains subject to limitations such as potential endogeneity, threshold sensitivity, and the evolving nature of agronomic and market dynamics. Nevertheless, the study contributes new empirical evidence to the debate on biofuel policy impacts and demonstrates the value of combining probabilistic counterfactual modelling with high-resolution spatial data for land-use policy assessment.

