Abstract
Promoting cycling in mixed-traffic environments remains a global challenge, hinging on the development of well-connected, low-stress networks. However, existing evaluation frameworks often lack comprehensiveness, overlooking the multifaceted nature of cyclists’ experiences. This study addresses this gap by proposing a novel multidimensional evaluation framework for assessing the effective connectivity of urban cycling networks. The framework integrates four critical dimensions: (1) structural connectivity of the basic road network, (2) dynamic interference from mixed traffic, (3) comfort of the cycling environment, and (4) cross-barrier connectivity. Using Nanjing, China, as a case study, we applied a hybrid Analytic Hierarchy Process (AHP)–Grey Clustering method to derive objective indicator weights and conduct a comprehensive evaluation. The results yield a composite score of 3.2568 (on a 0–4 scale), classifying Nanjing’s cycling network connectivity at the “Four-Star” level, indicating a generally positive developmental trajectory. Nevertheless, spatial disparities persist: the urban core faces intense traffic interference, while peripheral areas are hindered by network fragmentation and poor permeability. Key challenges include frequent vehicle–cyclist conflicts at intersections, inadequate nighttime illumination, suboptimal pavement conditions, and excessive detours caused by natural barriers such as the Yangtze River. This study provides urban planners and policymakers with a robust and systematic diagnostic tool to identify deficiencies and prioritize targeted interventions, ultimately contributing to sustainable urban mobility by enhancing the resilience, equity, and attractiveness of cycling networks in complex mixed-traffic settings.
1. Introduction
The global transition toward sustainable urban mobility has positioned cycling as a cornerstone strategy for mitigating traffic congestion, reducing carbon emissions, and improving public health [1]. However, the effectiveness of cycling promotion is fundamentally constrained by the quality and connectivity of bicycle networks—particularly in mixed-traffic environments where cyclists must share road space with motor vehicles [2]. In such settings, perceived safety, comfort, and route directness are key determinants of cyclists’ route choices and overall willingness to cycle [3]. Poor network connectivity remains a widespread challenge in cities worldwide, leading to circuitous routes, increased interaction conflicts, and a diminished cycling experience that ultimately suppresses latent cycling demand. For instance, Furth et al. [4] demonstrated that network fragmentation can deter over 50% of potential cycling trips, underscoring the urgent need for accurate evaluation and systematic enhancement of network connectivity.
Despite a growing body of research on cycling networks, critical gaps remain. Early studies relied heavily on graph-theory-based indicators (e.g., connectivity, density) but often neglected cyclists’ perceived safety and stress levels [5]. The introduction of the Level of Traffic Stress (LTS) concept was a major advancement, enabling roads to be classified according to their comfort and safety for the average cyclist [4]. More recently, the availability of big data, such as GPS trajectories, has enabled researchers to analyze revealed route preferences and actual cycling behavior, offering insights into “perceived” connectivity that often diverges from “potential” connectivity inferred from physical infrastructure alone [6]. Other research streams have examined specific aspects in isolation: safety analyses using Traffic Conflict Techniques (TCT) and surrogate safety measures such as Post-Encroachment Time [7]; comfort evaluations incorporating pavement quality, greenery, and nighttime illumination [8]; and barrier-crossing studies using detour ratios and network algorithms to identify critical missing links [9]. However, these studies rarely integrate these dimensions, leaving three major research gaps: (1) the absence of a unified, systematic evaluation framework that integrates structural, interference, comfort, and barrier-crossing dimensions; (2) an over-reliance on static data that fail to capture the dynamic nature of mixed-traffic interactions; and (3) an oversimplified understanding of barriers and their associated crossing costs [10].
Addressing these gaps is critical for advancing sustainable transport research. Without a comprehensive and multidimensional framework, existing studies remain fragmented and cannot adequately explain how mixed-traffic conditions shape cyclists’ mobility outcomes. From a practical standpoint, the lack of such an approach constrains planners’ ability to identify priority interventions, allocate resources effectively, and design cycling networks that promote safety, equity, and long-term sustainability. These shortcomings form the major motivation of this study.
Moreover, improving cycling connectivity has direct implications for social equity. Well-connected networks not only facilitate faster and safer commutes for daily riders but also provide affordable mobility options for low-income groups and enhance accessibility for recreational cyclists. By linking technical evaluation with the broader goals of sustainable mobility and equitable access, this study situates its contributions within both academic and policy debates.
This study seeks to address these gaps by developing and applying a multidimensional evaluation framework to assess the effective connectivity of cycling networks in mixed-traffic environments. The contributions of this study are threefold. First, it develops a systematic and integrated framework for evaluating cycling network connectivity, incorporating both physical and perceived dimensions often overlooked in previous studies. Second, it introduces a hybrid Analytic Hierarchy Process (AHP)–Grey Clustering method to enhance the robustness and transferability of connectivity assessments. Third, by applying this framework to Nanjing, the study provides actionable insights for improving cycling infrastructure planning and policy in rapidly motorizing urban contexts.
The remainder of this study is structured as follows. Section 2 provides a review of the relevant literature. Section 3 describes the methodology and data sources. The results of the empirical analysis are presented in Section 4. To better illustrate the contributions and limitations of this study, a discussion is presented in Section 5, and Section 6 concludes the paper.
2. Literature Review
2.1. Connectivity Analysis of the Basic Road Network Structure
The connectivity of a road network forms the foundation for evaluating cycling network performance, as it directly influences the feasibility, efficiency, and convenience of cycling trips [11]. Recent advancements in data-driven methodologies, particularly Graph Neural Networks (GNNs), have introduced powerful new tools for analyzing network connectivity and reliability. For instance, Liu and Meidani developed a GNN surrogate model for efficient seismic reliability analysis of highway bridge systems, demonstrating the capability of GNNs to handle complex, interdependent network components and dynamic loads [12]. Furthermore, Liu and Meidani proposed an end-to-end heterogeneous GNN framework for traffic assignment problems, showcasing the potential of these methods to capture intricate network flow patterns and interactions more accurately than traditional models [13]. These approaches offer promising avenues for more dynamic and high-fidelity assessments of network connectivity, potentially overcoming limitations of static topological metrics. The Federal Highway Administration (FHWA) guidelines refine connectivity analysis by proposing network segmentation based on node and link attributes and quantifying network fragmentation using indicators such as density and directness. For example, the commonly used link-to-node ratio effectively reflects the integrity and redundancy of network topology [14].
In traditional transport geography, graph-theoretic metrics—such as node degree, betweenness, and network diameter—have long been employed to quantify road network topology. However, these conventional metrics are often insufficient to capture the actual service levels and user experiences relevant to cyclists [15]. Consequently, research has increasingly shifted towards cyclist-centric evaluations of network accessibility and connectivity.
A major advancement in this field is the introduction of the Low-Stress Network (LSN) framework, which classifies roads based on their Level of Traffic Stress (LTS) to assess cycling network continuity. For example, researchers have developed a four-level LTS categorization of road segments and intersections, identifying connectivity gaps within low-stress cycling networks to attract mainstream populations [4]. Comparative studies of Copenhagen and Oslo demonstrate that highly connected low-stress networks are a prerequisite for increasing cycling mode share [16]. Building on this, the “capture area” metric was introduced from a spatial coverage perspective, quantifying the area of low-stress segments accessible from a given intersection. When combined with the proportion of low-stress segments and the average stress level of adjacent streets, this provides a comprehensive measure of network cohesion and accessibility [17].
Beyond traffic-related factors, growing attention has been paid to the influence of the built environment—including land-use mix, building density, and urban form—on cycling accessibility [18]. Some scholars argue that accessibility should be understood as a hybrid concept, combining both objective dimensions—such as the interplay between land-use and transport infrastructure—and subjective dimensions, such as perceived accessibility shaped by individual preferences and behavioral characteristics [19].
With the rapid advancement of big data analytics, evaluating both “perceived” and “actual” cycling network connectivity using travel trajectory data has emerged as a promising research direction. Unlike measures of “potential” accessibility derived from static network models, trajectory-based approaches capture cyclists’ actual route choices, behavioral preferences, and path dependencies [10]. For instance, a Seattle-based study examined how built environment characteristics—including land-use diversity and road network structure—influence cyclists’ route preferences [6]. Similarly, another study applied machine learning models to predict cycling traffic volumes under varying built environment conditions using trajectory data, thereby indirectly evaluating the connectivity value of network segments [20].
2.2. Analysis of Cycling Disturbances in Mixed Traffic Environments
In many urban contexts, particularly where dedicated bicycle lane networks remain underdeveloped, cyclists are often forced to share limited road space with motor vehicles within mixed-traffic environments. In such settings, traffic disturbances emerge as a critical negative factor affecting cyclists’ safety, comfort, and route choice, and in severe cases, can even lead to traffic accidents [21].
Early research on cycling safety primarily relied on statistical analyses of bicycle accidents, identifying macro-level determinants such as traffic volume, speed limits, and road classifications [22]. However, due to persistent issues of underreporting—particularly of minor incidents—and the inherently low probability of crash events, accident-based studies fail to comprehensively capture the pervasive disturbances and safety risks encountered by cyclists during everyday travel [23].
To address these limitations, the Traffic Conflict Technique (TCT) has become widely adopted in cycling disturbance analysis. Using field observations or video surveillance, researchers apply Surrogate Safety Measures (SSMs)—such as Post-Encroachment Time (PET) and Time-to-Collision (TTC)—to quantitatively assess hazardous interactions between cyclists and motor vehicles. For example, one study employed computer vision techniques to automatically extract cyclist and vehicle trajectories from intersection video data, enabling an evaluation of the safety effectiveness of bicycle lanes at intersections [7]. Similarly, microsimulation models of cyclist–vehicle interactions at unsignalized intersections have been developed to predict conflict scenarios and support the design of active safety systems and autonomous vehicle algorithms that better respond to cyclists in mixed-traffic environments [24].
Beyond objective safety metrics, cyclists’ subjective perceptions and behavioral responses to disturbances have also become a central focus of recent research. Scholars have adopted instrumented bicycles equipped with GPS, video cameras, and physiological sensors (e.g., heart rate monitors, galvanic skin response) to collect real-time data on cyclists’ stress levels, behavioral adaptations, and risk avoidance strategies during naturalistic cycling [25]. In addition, cycling simulator experiments have been increasingly employed to systematically investigate cyclists’ risk perception and behavioral responses under controlled traffic scenarios and roadway designs. For instance, one experimental study found that cyclists using dedicated bike lanes exhibited 1.77 fewer galvanic skin response peaks per minute compared to when riding in mixed-traffic conditions without bike lanes, indicating a significantly lower physiological stress level in separated infrastructure [26].
2.3. Analysis of Comfort in Cycling Network Environments
Cycling experience is influenced not only by safety and efficiency, but also by the level of environmental comfort—a multidimensional concept that encompasses both physical and psychological well-being [11]. Enhancing comfort is widely recognized as a strategic approach to attract more individuals to cycling, especially for recreational and fitness-related purposes. According to the FHWA guidelines, the Route Comfort Index incorporates subjective dimensions such as lighting, visual esthetics, and perceived social safety into a composite scoring system for evaluating comfort along cycling routes [14].
Within mixed-traffic environments, researchers have identified passing distance and traffic density as key determinants of cyclists’ comfort levels [27]. Additionally, studies focusing on night-time cycling accessibility highlight the importance of factors such as employment patterns of low-income shift workers, commute durations, and the distribution of street lighting, which collectively influence both comfort and safety during night cycling [28].
The urban landscape—particularly green infrastructure—plays a critical role in shaping cyclists’ psychological comfort. Greening initiatives, such as tree-lined streets and parks, offer promising avenues for enhancing the appeal of urban cycling [8]. For instance, the Perceived Bicycling Intersection Safety (PBIS) model demonstrates that the presence of vegetation and dedicated cycling infrastructure significantly improves riders’ perceptions of safety and comfort [29]. Other studies evaluate rideability using a composite of five dimensions: (1) quality of cycling infrastructure, (2) coverage of dedicated bike lanes, (3) number of major roads lacking bike lanes, (4) presence of green spaces and water bodies, and (5) topographic features [30].
From the perspective of physical comfort, road surface quality is a direct and critical factor. Recent research has introduced a road defect density index—an improvement over traditional average texture depth—to facilitate rapid evaluation of surface conditions and predict ride quality [31]. Moreover, factors such as roadway width, longitudinal gradient, proximity to bus stops, physical separation from pedestrian areas, surrounding land-uses, and cyclist flow intensity have been identified as key variables influencing the comfort of physically separated bike lanes [32]. Indeed, road texture and roughness significantly affect the vibrational impact on cyclists [33]. Studies show that newly constructed bike lanes substantially reduce severe vibrations, enhancing riding comfort; however, surface defects—even minor ones—continue to impair the overall riding experience [34].
2.4. Cross-Barrier Connectivity of Cycling Networks
In urban environments, physical barriers such as highways, railways, rivers, large industrial zones, and gated communities are among the primary causes of fragmented and disconnected cycling networks. Empirical studies suggest that such barriers limit more than 50% of potential cycling demand by constraining direct route options and increasing trip distances [17]. These obstructions often force cyclists to undertake significant detours, which increase travel time and reduce the overall attractiveness of cycling. Consequently, analyzing and enhancing cross-barrier connectivity has become essential for improving the efficiency and accessibility of cycling networks [35].
The detour ratio is one of the most widely adopted metrics for evaluating the impacts of barriers. Higher detour ratios generally indicate greater disruption to cycling continuity. Studies reveal that areas equipped with denser road networks, dedicated cycling infrastructure, and high-capacity cycle superhighways demonstrate substantially lower average route detour ratios (RDRs) [9]. Conversely, sparse bicycle facilities and high speed limits significantly increase the likelihood of detour-taking among cyclists. Interestingly, empirical results show that street greenery is positively correlated with longer detours, suggesting that environmental attractiveness can partially offset cyclists’ resistance to extended routes. Furthermore, multilevel mixed-effects linear regression models confirm substantial heterogeneity in cyclists’ responses to different environmental attributes, underscoring the importance of context-sensitive planning strategies [36].
Identifying “dead-end roads” and “missing links” is central to cross-barrier connectivity optimization. These missing links often represent critical nodes that reconnect two otherwise disconnected sub-networks separated by physical barriers. Recent studies employ network analysis algorithms—such as identifying cutpoints and bridges in graph theory—to automatically detect these high-impact connection points [37]. By integrating optimization algorithms, researchers can determine minimal-investment strategies to maximize network connectivity, constructing only the fewest necessary links [38].
Beyond single-layer approaches, recent advances propose multilayer network models to better analyze and address complex barrier-crossing challenges [39]. In these models, cycling, pedestrian, and public transit networks are conceptualized as distinct but interdependent layers. Cross-barrier facilities—such as shared pedestrian-cyclist bridges or subway stations with bicycle access—function as cross-layer nodes, enabling seamless integration between modes [40]. Applying multilayer network frameworks facilitates the coordinated planning of integrated slow-travel systems, allowing cross-barrier infrastructure to simultaneously support cycling, walking, and public transit. Furthermore, researchers have developed multilayer optimal path models incorporating a deviation coefficient to quantify the efficiency of routes circumventing barriers (e.g., rivers or railways). Simulation results demonstrate that optimized multilayer networks can significantly reduce average detour distances while enhancing overall cycling continuity [39].
2.5. Summary
A systematic review of the relevant literature reveals that although existing studies have laid an important foundation for evaluating cycling network performance, significant gaps remain in both theoretical frameworks and evaluation methodologies. First, the current evaluation metrics lack sufficient systematicity and dynamism. While earlier studies primarily relied on topological analyses of network structures, more recent research has introduced concepts such as Level of Traffic Stress (LTS) to assess connectivity from the perspective of cyclists’ perceived safety. However, this evolution remains incomplete, as the existing metric systems are neither uniform nor comprehensive, and many indicators—such as “bikeability”—are difficult to operationalize and quantify, leading to potential subjective judgment errors in the evaluation process. Moreover, weighting methods commonly depend on expert-driven subjective assignments rather than systematic, data-driven approaches, reducing their applicability in real-world contexts. In addition, existing frameworks often fail to reflect the dynamic characteristics of mixed-traffic environments, as most studies rely on static or quasi-static data and overlook real-time interactions between motorized and non-motorized traffic flows, which critically affect cycling continuity, safety, and comfort.
Second, the comprehensiveness and integration of current evaluation models remain limited. Existing research tends to investigate cycling networks from relatively isolated perspectives, focusing separately on structural connectivity, environmental comfort, or safety. For example, structural connectivity emphasizes network topological integrity and path accessibility, environmental comfort considers factors such as greenery, pavement quality, and noise, while safety focuses on traffic conflicts, motorized–non-motorized separation, and barrier-crossing conditions. However, most models adopt a simple linear weighting of these dimensions, which fails to capture the complex, nonlinear interactions among them or to construct a multidimensional coupled framework capable of representing cyclists’ comprehensive experiences.
Third, research on cross-barrier connectivity remains insufficient, despite its critical role in determining whether large-city cycling networks are truly “connected.” Existing studies often define “barriers” too narrowly, focusing on physical obstacles such as highways and rivers while neglecting functional “soft barriers,” including land-use discontinuities and restricted-access zones. Similarly, current measurements of barrier-crossing costs are overly simplified, typically relying on the presence of crossing facilities or detour distances without adequately capturing the full range of impedance factors—such as safety risks, delays, and environmental discomfort—that cyclists encounter during barrier crossings.
To address these gaps, this study develops a multidimensional and coupled evaluation framework for cycling network connectivity under mixed-traffic conditions, using Nanjing, China, as a case study. The proposed framework integrates four critical dimensions: structural connectivity of the basic road network, cycling disturbances in mixed-traffic environments, environmental comfort of cycling networks, and cross-barrier connectivity within the urban fabric. By combining these dimensions into a unified analytical model, this study aims to provide a more comprehensive understanding of cycling network performance and offer methodological support for enhancing cycling infrastructure and promoting sustainable urban mobility.
3. Methodologies
3.1. Evaluation Process Framework
To ensure a systematic and transparent assessment, this study follows a comprehensive four-stage evaluation process, as illustrated in Figure 1. The framework integrates construction of the evaluation index system and data collection, AHP weight calculation, grey clustering evaluation, comprehensive evaluation. This structured approach enhances the robustness, objectivity, and practical applicability of the connectivity assessment for Nanjing’s cycling network.
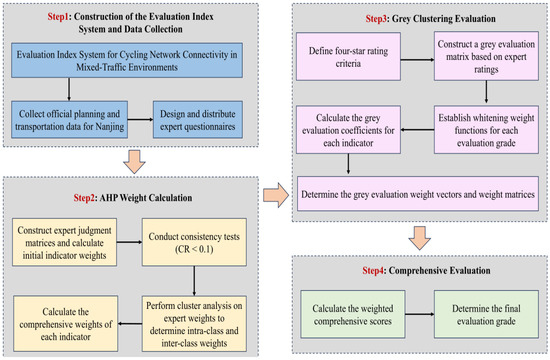
Figure 1.
The overall workflow of AHP-Grey Clustering evaluation frame-work.
Stage 1: Construction of the Evaluation Index System and Data Collection. First, a multidimensional evaluation index system was established based on a review of national planning standards (Ministry of Housing and Urban-Rural Development, 2021) and international literature. The system comprises 4 primary dimensions and 11 secondary indicators (detailed in Section 3.2). Concurrently, multi-source data were gathered, including official urban planning documents, geospatial data, and field survey data on traffic conditions and facility characteristics, to inform the subsequent expert scoring and validation.
Stage 2: AHP Weight Calculation. Determination of Indicator Weights via AHP and Hierarchical Clustering. The relative importance of each indicator was determined using a hybrid weighting approach to mitigate subjectivity. Five domain experts performed pairwise comparisons of the indicators using a structured questionnaire (AHP). Their individual judgment matrices were then aggregated and refined through hierarchical cluster analysis, which grouped experts with similar perspectives and calculated intra- and inter-cluster weights.
Stage 3: Grey Clustering Evaluation. The core evaluation was conducted using the grey clustering method, well-suited for handling systems with limited and uncertain information. Experts scored each indicator for Nanjing’s network based on the collected data. These discrete scores were then transformed into continuous membership degrees using whitening weight functions, corresponding to four predefined connectivity grades (Four-Star to One-Star).
Stage 4: Comprehensive Evaluation. The final composite score and dimensional scores were calculated and interpreted.
This integrated process framework ensures that the evaluation is not only methodologically sound but also transparent and actionable for urban planning practitioners.
3.2. Evaluation Index System for Cycling Network Connectivity in Mixed-Traffic Environments
To comprehensively assess cycling network connectivity under mixed-traffic conditions, this study establishes an evaluation index system with reference to the Planning Standards for Urban Pedestrian and Bicycle Transportation Systems issued by the Ministry of Housing and Urban-Rural Development (2021) [41]. These standards identify connectivity, safety, comfort, and barrier-crossing as key considerations in the planning of urban cycling systems, and therefore provided the baseline dimensions for our indicator system [42].
The selection of indicators was further guided by three principles: (i) alignment with national planning standards to ensure policy consistency; (ii) support from the international literature on cycling network evaluation, connectivity, and sustainable transport, which highlights the importance of network structure, mixed-traffic interactions, environmental quality, and cross-barrier continuity; and (iii) practical feasibility, reflecting both the availability of data and the need to ensure that each indicator can be meaningfully applied in the Nanjing context.
Based on these criteria, four primary dimensions were defined:
- (C1) Connectivity of the Basic Road Network Structure, capturing the completeness, accessibility, and permeability of the cycling network;
- (C2) Mixed-Traffic Interference, measuring the degree of disruption and safety risks posed by interactions between cyclists and motorized traffic;
- (C3) Comfort of the Cycling Environment, assessing environmental and facility-related factors influencing cyclists’ perceived comfort and riding experience;
- (C4) Cross-Barrier Connectivity, evaluating the continuity of cycling routes across natural and man-made barriers.
These dimensions are operationalized through eleven secondary indicators. While other potential indicators—such as detailed crash records or land-use intensity measures—were considered, they were excluded because of data limitations or to avoid redundancy with existing dimensions. We acknowledge that the framework is not exhaustive, and future research could expand the indicator set by incorporating additional safety- and land-use–oriented variables. The final evaluation index system is summarized in Table 1.

Table 1.
Evaluation Index System for Cycling Network Connectivity in Mixed-Traffic Environments.
3.3. Determination of Indicator Weights—Hierarchical Clustering and AHP
The Analytic Hierarchy Process (AHP) is a powerful multi-criteria decision-making tool renowned for its ability to handle complex, multi-attribute problems. However, its reliance on expert pairwise comparisons renders it susceptible to subjective bias, and the consistency of judgment matrices can deteriorate as the number of compared elements increases, potentially compromising the reliability of the derived weights [43]. To ensure the scientific validity and objectivity of the evaluation framework, this study integrates the Analytic Hierarchy Process (AHP) with hierarchical clustering analysis to determine the weights of all evaluation indicators. The combination of AHP and clustering allows us to balance expert consensus with diversity in expert opinions, thereby improving the robustness of the weighting scheme.
Specifically, a panel of five domain experts, each with more than five years of professional experience in areas such as mixed-traffic systems, cycling network connectivity, and urban greenway development, was invited to conduct pairwise comparisons of all indicators. The comparisons were made using a five-point scale with reciprocals (see Table 2), and the resulting judgment matrices were subsequently aggregated and tested for consistency before clustering analysis.
Table 2.
Methods and Meanings of the Five-Level Scale.
Following the standard AHP procedure, these comparisons were used to construct an expert judgment matrix, from which the initial weights of the indicators were derived by normalizing the matrix elements (Equation (1)):
To ensure the reliability of expert judgments, a consistency test was conducted for each judgment matrix. The consistency index (CI) and consistency ratio (CR) were calculated using Equations (2) and (3). If CR < 0.10, the judgment matrix is considered logically consistent, and the eigenvector corresponding to the maximum eigenvalue can be used as the weight vector for ranking purposes. The random index (RI) values used for consistency testing are provided in Table 3.
Table 3.
RI Values (n denotes the order of the matrix).
However, given the potential heterogeneity among expert judgments, relying solely on AHP may introduce bias into the weighting process. To address this issue, hierarchical clustering analysis was applied to the expert weight matrix to group experts with similar scoring patterns. Within each cluster, intra-cluster weights were calculated, while inter-cluster weights were determined based on the relative contribution of each expert group (Equations (4)–(6)).
Finally, the comprehensive indicator weights were computed by integrating the AHP-derived initial weights with the clustering-based intra- and inter-group weights (Equation (7)). This combined approach ensures that the final weighting scheme captures both the collective consensus of experts and the diversity of their professional perspectives, thus enhancing the overall credibility and robustness of the evaluation framework.
3.4. Gray Clustering Method for Building the Evaluation Model
To comprehensively evaluate the connectivity of Nanjing’s cycling network under mixed-traffic conditions, this study adopts the grey clustering method, which has strong applicability for multi-indicator evaluation problems with limited or uncertain data. Unlike traditional evaluation techniques, grey clustering combines quantitative scores with membership functions, allowing us to integrate expert judgment with objective indicator data. The final goal is to classify the cycling network into four development levels based on comprehensive scores.
3.4.1. Classification of Evaluation Grade
Following the Planning Standards for Urban Pedestrian and Bicycle Transportation Systems [41] issued by the Ministry of Housing and Urban-Rural Development (2021), combined with the latest research on Nanjing’s greenway development [44], the connectivity of the cycling network is categorized into four levels:
- Four-star (3 ≤ Score ≤ 4): Excellent connectivity, strongly supporting the full realization of Nanjing’s cycling network objectives.
- Three-star (2 ≤ Score < 3): Good connectivity, generally meeting Nanjing’s network development goals.
- Two-star (1 ≤ Score < 2): Average connectivity, partially achieving the planned objectives.
- One-star (0 ≤ Score < 1): Poor connectivity, largely preventing the realization of intended network outcomes.
For individual indicators, experts evaluate connectivity using six qualitative tiers: Excellent, Very Good, Good, Average, Poor, and Very Poor, corresponding to scores of 5, 4, 3, 2, 1, and 0, respectively. These scores serve as the basis for constructing the grey clustering evaluation model.
3.4.2. Constructing of the Grey Evaluation Matrix
For the Nanjing cycling network , first select experts to evaluate the connectivity of the Nanjing cycling network under mixed traffic conditions based on the quantitative standards of each connectivity indicator . Construct the indicator scoring gray matrix based on the expert evaluation results:
Based on expert scoring of each indicator , the grey evaluation matrix is constructed as follows:
where denotes the number of primary indicators, is the number of secondary indicators, and represents the number of experts.
3.4.3. Whitening Weight Function
Since the evaluation standards are divided into four rating levels (Four-Star, Three-Star, Two-Star, and One-Star), the corresponding evaluation grey classes were accordingly established as four categories. To transform discrete expert scores into continuous membership degrees, whitening weight functions are constructed for each grey category, corresponding to the four evaluation levels. The whitening weight function for each grey class is denoted as vector . The functional forms of the whitening weight functions are summarized in Table 4.
Table 4.
White-out Power Functions for Each Ash Grade.
3.4.4. Calculate of Grey Evaluation Coefficients
For each indicator , its grey evaluation coefficient with respect to grade is computed based on the whitening weight functions and expert-assigned scores:
The grey evaluation coefficients for all secondary indicators are then aggregated to compute the coefficients for each primary indicator:
3.4.5. Grey Weight Matrices and Comprehensive Evaluation
Using the grey evaluation coefficients, the grey weight of each secondary indicator for grade is obtained as:
The gray weight of the first-level indicator is then canulated as:
The gray weight matrix for each primary indicator can then be determined:
The weighted grey power matrix for the first-level indicators is:
Similarly, for and so on, the overall gray matrix is derived as:
Finally, the comprehensive evaluation matrix can be obtained as:
3.4.6. Determination of Final Composite Scores and Grades
The final composite score for the cycling network is computed as:
3.5. Data Source
The construction of the evaluation indicator system and the subsequent scoring process were grounded in a comprehensive and multi-source dataset that reflects the spatial structure, traffic environment, and physical conditions of Nanjing’s urban cycling network. The data were collected and processed with two key objectives: (1) to ensure accurate representation of the 12 secondary indicators defined in the evaluation framework (see Table 4), and (2) to support a structured and evidence-based expert evaluation process.
- (1)
- Core Spatial and Planning Data
The foundational data were obtained from official government sources, including the Nanjing Urban Master Plan (2020–2035) (https://ghj.nanjing.gov.cn/ghbz/ztgh/202410/t20241024_4992742.html (accessed on 27 September 2025)), greenway (https://ghj.nanjing.gov.cn/pqgs/ghbzpqgs/202109/t20210908_3125145.html (accessed on 27 September 2025)) and non-motorized transport planning documents, road infrastructure inventories, and functional zoning maps (https://www.mohurd.gov.cn/gongkai/zc/wjk/art/2021/art_17339_250179.html (accessed on 27 September 2025)). These were sourced from the Nanjing Municipal Bureau of Planning and Natural Resources, the Urban and Rural Development Commission, the Transport Bureau, and the Bureau of Statistics.
The collected data directly support the measurement or contextual interpretation of key indicators: e.g., road segment connectivity and global accessibility; traffic interference; greenery coverage; and cross-barrier connectivity.
- (2)
- Field Surveys and Expert Scoring Materials
To complement the above datasets and address limitations in secondary data, targeted field surveys were conducted in 2025 across representative cycling corridors. These surveys captured fine-grained environmental features not fully documented in official records—such as the degree of visual separation between cyclists and vehicles, intersection conflict points, nighttime lighting functionality, and slope conditions of key cycling segments.
These materials were provided to a panel of 5 domain experts—including transport planners, traffic engineers, and urban designers with local experience—who rated each indicator based on structured visual and spatial evidence. This ensured that scoring was both knowledge-driven and data-informed, rather than subjective or arbitrary.
4. Empirical Results
4.1. Analysis of Nanjing’s Cycling Network
According to the Detailed Plan for Nanjing Greenways (2020–2035) [43] issued by the Nanjing Municipal Bureau of Planning and Natural Resources, the city —covering an administrative area of 6587 square kilometers—has prioritized the enhancement of waterfront greenways along the Yangtze River, Chuhe River, and Qinhuai River, as well as mountain-ringed greenways around Laoshan, Pingshan, Qinglongshan, and Niushou-Zutangshan. In parallel, the plan promotes the construction of community-level greenways, as illustrated in Figure 2.
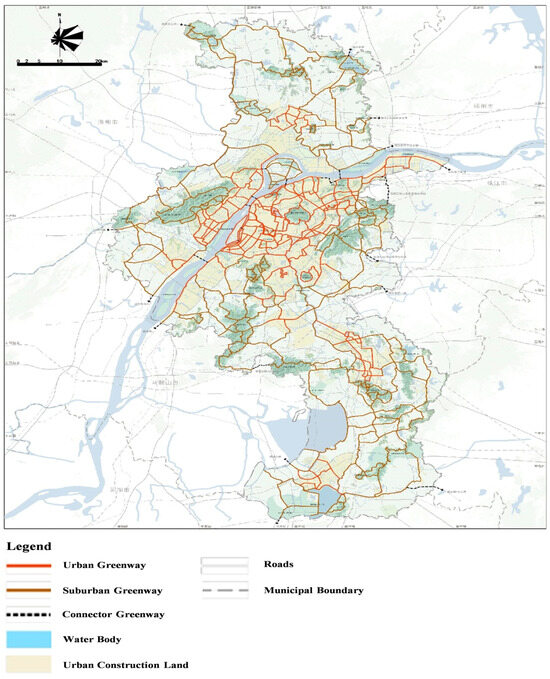
Figure 2.
Planning Layout of Nanjing’s Cycling and Greenway Network.
By 2025, the total length of the city’s greenway network is projected to reach 1779 km; by 2035, 2800 km; and by 2050, 8394 km. Specifically: (i) Municipal greenways will form 16 major corridors with a total length of approximately 1891 km, connecting key natural and cultural landscapes throughout the city. (ii) District-level greenways will serve as branch lines within each district, linking to the municipal corridors, with a planned total length of approximately 2767 km. (iii) Community greenways will create micro-circulation systems within neighborhoods and green spaces, with a planned total length of approximately 3736 km.
Building on this urban greenway framework, the Nanjing Municipal Bureau of Planning and Natural Resources aims to further advance the development of a safe, continuous, smooth, and comfortable pedestrian and cycling system. According to Article 98 on Green Transportation in the Nanjing Territorial Spatial Master Plan (2021–2035) [45], daily pedestrian and cycling networks should be integrated with the city’s road network system, while recreational pedestrian and cycling networks should align with the greenway system. In the central urban area, efforts will focus on integrating urban rail transit, surface bus services, and slow-mobility networks, improving pedestrian and cycling access around transit stations, planning bicycle park-and-ride facilities, and providing flexible, convenient “last-mile” services.
4.2. Determine the Weighting Coefficients
Following the establishment of an indicator system for evaluating effective connectivity in mixed-traffic cycling environments, a survey on indicator importance was distributed to five experts specializing in mixed-traffic systems, cycling network connectivity, and urban greenway development. This survey (see Appendix A: Nanjing Cycling Network Connectivity Evaluation Indicator Importance Survey) was designed with full consideration of Nanjing’s geographical characteristics, traffic conditions, and the specific features of cycling network connectivity assessments.
The experts used a 5-point scale to rate the relative importance of each indicator within the evaluation framework. The subjective weights of the indicators were then calculated through hierarchical analysis using MATLAB (R2024a). To incorporate objective perspectives, cluster analysis of the expert weight matrix was conducted using SPSS (IBM SPSS Statistics 25), generating the objective weights of expert clusters. Finally, the subjective and objective weights were integrated to derive the final comprehensive weights for the evaluation indicators (see Table 5, Table 6, Table 7, Table 8 and Table 9).
Table 5.
Expert #1 Judgment Matrix for First-Level Evaluation Index.
Table 6.
Expert #2 Judgment Matrix for First-Level Evaluation Index.
Table 7.
Expert #3 Judgment Matrix for First-Level Evaluation Index.
Table 8.
Expert #4 Judgment Matrix for First-Level Evaluation Index.
Table 9.
Expert #5 Judgment Matrix for First-Level Evaluation Index.
Construct the weight matrix for the five experts:
Using SPSS software (IBM SPSS Statistics 25), a cluster analysis was performed on the expert weight matrix , as shown in Figure 3.

Figure 3.
Matrix G Cluster Analysis Diagram.
The cluster analysis diagram generated by SPSS software (IBM SPSS Statistics 25) can group the five experts into:
The inter-class weights for the expert cluster analysis are calculated as follows:
Through the consistency ratio test of the expert weight matrix, the intra-class weights for each expert can be calculated as follows:
Class A:
Class B:
Class C:
By integrating the hierarchical analysis weights with both the inter-class and intra-class weights, the comprehensive weights for the primary indicators were obtained.
The same process was applied to the secondary indicators, with the corresponding dendrogram shown in Figure 4, and the final weights summarized in Table 10.
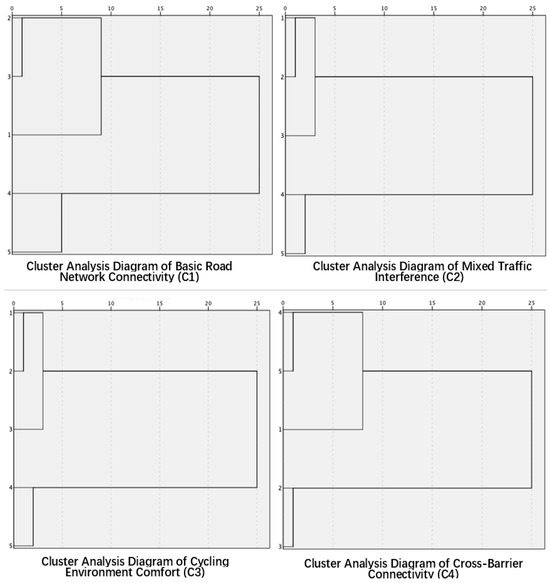
Figure 4.
Dendrogram using Average Linkage (Between-Groups) for First-Level Indicators.
Table 10.
Evaluation Indicator Weighting Table.
4.3. Evaluation of Cycling Network Connectivity in Nanjing’s Mixed-Traffic Environment
Based on the characteristics of cycling network connectivity and the relevant evaluation indicators for Nanjing’s mixed-traffic environment, expert scoring forms (see Appendix B: Expert Scoring Survey Form) were distributed to five entities, including urban transportation planning, design, and construction agencies involved in cycling network projects, research institutes focusing on cycling network development, and urban greenway organizations. Each indicator was rated on a 0–5 scale (see Table 11), and the average score across the five experts was computed for subsequent analysis.
Table 11.
Expert Scoring Sheet.
Using the experts’ scores, a gray matrix was constructed for each indicator, and the corresponding gray weight matrices for the primary indicators were derived, as summarized in Table 12.
Table 12.
Evaluation Matrix for Each Indicator.
A comprehensive evaluation of the connectivity indicators for Nanjing’s basic road network structure (C1) reveals:
A comprehensive evaluation of Nanjing’s mixed traffic interference (C2) indicators yields the following:
A comprehensive evaluation of the comfort indicators for cycling environments (C3) in Nanjing reveals:
A comprehensive evaluation of Nanjing’s cross-barrier connectivity (C4) indicators reveals:
The comprehensive evaluation results for cycling network connectivity in Nanjing’s mixed traffic environment are as follows:
Calculate the final score and determine the evaluation grade:
Integrating the weighted scores for all indicators, the comprehensive connectivity score of Nanjing’s cycling network in a mixed-traffic environment was calculated as 3.2568, corresponding to a “Four-Star Level” connectivity rating.
To further validate the stability of the evaluation results, we conducted a sensitivity analysis by simulating the impact of a ±20% variation in the weights of each dimension on the final scores. The results (details provided in Appendix C: Sensitivity Analysis) show that the final star rating fluctuates between 3.0 and 3.4, yet remains within the “four-star” level, demonstrating a certain degree of robustness in the evaluation outcome.
5. Discussion
5.1. Connectivity in Nanjing’s Basic Road Network Structure
The connectivity of Nanjing’s cycling network infrastructure demonstrates notable spatial variation. Evaluation results indicate that core urban areas achieve higher scores in fundamental connectivity metrics—such as segment connectivity (C11), global accessibility (C12), and local permeability (C13)—reflecting a well-developed network topology that offers cyclists multiple routing options. However, this strong connectivity is often challenged by dynamic disruptions in mixed-traffic environments, particularly during peak hours, when heavy motor vehicle flows significantly reduce cycling efficiency.
Weighted analysis highlights the dominant influence of segment connectivity (C11, weight = 0.4049) and global accessibility (C12, weight = 0.446) on overall network performance. Spatially, Nanjing’s road network displays a centralized pattern, with dense short-path connections in the core urban area and radial extensions toward peripheral zones. This configuration results in high accessibility in the urban core, while peripheral areas face greater cycling impedance due to more dispersed facilities [46].
In contrast, the moderate rating of local permeability (C13, expert score = 3) suggests that built environment constraints in some areas negatively impact cycling continuity. In particular, community-level micro-circulation networks remain underdeveloped, limiting seamless intra-neighborhood mobility [17].
To enhance overall connectivity, future planning efforts should prioritize filling network gaps in peripheral areas by improving the density and continuity of minor roads. At the community scale, local permeability should be strengthened through targeted upgrades to micro-circulation routes, ensuring that intra-neighborhood cycling becomes more convenient and efficient. Furthermore, the integration of dynamic traffic data is essential to support adaptive optimization of cycling path continuity in the urban core, thereby maintaining consistent cycling efficiency even during peak traffic conditions.
5.2. The Impact of Mixed Traffic Environments on the Connectivity of Nanjing’s Cycling Network
The disruption of cycling connectivity within Nanjing’s mixed-traffic environment exhibits nonlinear characteristics, reflecting complex interactions between motorized and non-motorized flows. Evaluation results highlight motor vehicle flow (C21, weight = 0.4054) and intersection conflict intensity (C22, weight = 0.4564) as the two most influential factors affecting cycling utility. The average score for motor vehicle flow in Nanjing is 3.2 (out of 5), indicating that as conflicts between motorized and non-motorized traffic intensify, the effective width of the cycling network is reduced, constraining route capacity and overall efficiency. Similarly, the average score for intersection conflict intensity is 2.8 (out of 5), underscoring the high risk of conflict at major road intersections. Such conditions not only increase the probability of cycling interruptions but may also force cyclists to detour, further reducing network efficiency.
Spatial analysis reveals that commercial districts such as Xinjiekou exhibit a higher density of intersection conflict points compared to other urban areas. This concentration of conflicts directly undermines the temporal reliability of the cycling network in these zones, creating additional delays and discouraging cycling as a viable mode of transport.
Although the lane separation level (C23) carries a relatively low weight (0.1382), it offers substantial marginal benefits for improving connectivity. At present, physical separation measures are limited to a few major roads, while most cycling lanes rely solely on painted lane markings, which provide little protection against motor vehicle encroachment. To address this issue, priority should be given to the installation of physical barriers along high-conflict sections of the network. Complementary measures such as intelligent signal control to optimize intersection timing could further enhance safety and continuity, thereby improving the functional utility of the cycling network in mixed-traffic environments.
While the current framework does not explicitly adopt a “safety” dimension, elements of safety are partially embedded in our “Mixed-Traffic Interference” indicators (e.g., intersection conflict intensity, lane separation). Nonetheless, we acknowledge that our approach does not fully capture the contextual fit between road function and surrounding land-use, which has been emphasized in the Movement–Place frameworks recently implemented in New Zealand, Australia, the Netherlands, and other countries [47]. Future research could enrich our framework by incorporating measurable contextual indicators such as land-use intensity, population and employment density, and accessibility to key destinations. This would enable a more systematic assessment of how mixed-traffic conditions translate into heightened vulnerability, thereby strengthening the diagnostic and policy value of cycling network evaluations.
5.3. Cycling Environment Comfort in Nanjing
The Cycling Environment Comfort (C3) dimension, with a weight of 0.251, represents a core factor in enhancing the overall cycling experience. Within this dimension, green visual coverage (C31) carries the highest weight (0.5602) and received a relatively high expert rating of 3.8 out of 5. Areas along greenways such as Xuanwu Lake and the Sun Yat-sen Mausoleum exhibit superior green visibility compared to other urban districts, making them particularly attractive to recreational cyclists.
In contrast, the nighttime illumination level (C32) scored only 3.0 out of 5, reflecting inadequate lighting along certain branch routes of the urban greenway network. This lack of sufficient illumination not only reduces nighttime usability but also presents safety hazards. Additionally, road surface smoothness (C33), with a weight of 0.1824 and an expert rating of 2.8 out of 5, highlights another area of concern. Steep gradients and uneven surfaces, particularly in older urban areas, increase riding resistance and diminish the overall comfort of cycling. These conditions point to the need for assistive facilities or path optimization to enhance accessibility and safety.
Comfort is closely tied to cycling behavior. Commuter cyclists typically prioritize efficiency and direct connectivity, while recreational cyclists are more sensitive to environmental factors such as green visibility and esthetic appeal. Data analysis further suggests that higher comfort scores correlate with increased cycling volume elasticity [48], indicating that improvements in environmental comfort could significantly encourage cycling uptake.
To address these challenges, targeted strategies should include enhancing lighting and surface smoothness along key commuter corridors, introducing scenic nodes and rest areas along recreational greenways, and leveraging street-view image recognition technologies to systematically identify and remediate “low-comfort” segments of the network. These measures would not only improve safety and convenience but also enhance the attractiveness and usability of Nanjing’s cycling infrastructure.
5.4. Cross-Barrier Connectivity in Nanjing’s Cycling Network
Although the density of cross-barrier facilities (C42) achieved a score of 3.5 out of 5, these facilities are unevenly distributed. For example, key crossings such as the Yangtze River Bridge serve a relatively limited radius of less than 3 km, while certain areas in the Jiangbei New District remain underserved, lacking dedicated river-crossing options. In other contexts, elevated cycling corridors can effectively mitigate connectivity losses by providing direct, uninterrupted routes. For instance, implementing elevated corridors at key transportation hubs, such as Nanjing South Railway Station, could significantly reduce rail-crossing times. However, the feasibility of such interventions is constrained in historic urban districts, where spatial and heritage limitations restrict large-scale infrastructure modifications.
Model evaluation results suggest that enhancing cross-barrier connectivity can unlock latent cycling demand. The addition of a dedicated river-crossing bridge would not only reduce detour rates but also substantially increase the proportion of cycling trips for commuting in adjacent communities. In the short term, priorities should include eliminating dead-end roads across administrative boundaries in the main urban area, constructing multi-level facilities along key “fracture zones”, and optimizing the design of non-motorized lanes on existing bridges to improve accessibility [49].
Furthermore, leveraging GPS trajectory data for dynamic monitoring of detour hotspots would provide actionable, data-driven insights for infrastructure planning. This approach would enable planners to identify critical connectivity gaps in real time and prioritize targeted interventions, thereby improving the overall efficiency and equity of Nanjing’s cycling network.
5.5. Limitations and Future Research
A number of limitations should be acknowledged in this study. Firstly, A further limitation of this study lies in the reliance on expert judgments for both the weighting of indicators (via AHP and clustering) and the scoring of network performance. While this approach is consistent with established practice in AHP-based transport evaluations and is particularly useful in contexts where detailed behavioral or crash data are scarce, it inevitably introduces a degree of subjectivity. To mitigate this, we applied hierarchical clustering to aggregate expert opinions and reduce individual bias, and we con-ducted sensitivity analysis to examine the robustness of the results under varying weight assumptions. Nevertheless, we acknowledge that the framework does not empirically calibrate indicator weights or membership thresholds against observed cycling behavior, revealed route choices, or safety outcomes. Future research should seek to integrate such empirical data—e.g., GPS trajectory datasets, crash records, or travel surveys—into the calibration of the evaluation framework. Doing so would not only enhance the behavioral validity of the weights but also strengthen the practical relevance of the connectivity grading outcomes.
Secondly, the current indicator system was primarily constructed based on expert knowledge to ensure methodological consistency with the AHP–Grey Clustering approach, which limited the inclusion of spatially explicit and objectively quantified variables (e.g., land-use intensity or intersection density). Although safety-related aspects were partially reflected in the mixed-traffic interference dimension, the framework did not fully integrate comprehensive safety indicators or contextual factors emphasized in approaches such as the Movement–Place framework. Future studies could strengthen the evaluation system by incorporating such dimensions.
Thirdly, data limitations pertain to the use of planning datasets that reflect future scenarios rather than current conditions, seasonal variations in environmental features such as greenery and lighting, and restricted site access during fieldwork that necessitated reliance on satellite imagery or secondary records.
Lastly, while the AHP method provides a structured approach to weighting, its inherent hierarchical and qualitative nature may not fully capture the nuanced trade-offs perceived by cyclists. Moreover, the framework did not explicitly incorporate riders’ subjective perceptions—such as sense of safety, comfort, and overall experience—which are critical to cycling behavior and adoption. Future work should consider integrating attitudinal data with objective measures to capture a more comprehensive understanding of cycling network performance.
6. Conclusions
This study conducted a comprehensive evaluation of the effective connectivity of Nanjing’s cycling network within a mixed-traffic environment. The final composite connectivity score of 3.2568 corresponds to a “four-star” rating, indicating that, overall, the development of Nanjing’s cycling network is highly favorable and generally aligned with the city’s strategic objectives. However, the analysis of individual evaluation indicators highlights several critical shortcomings that warrant attention in future planning and management efforts.
First, the cycling network exhibits marked spatial disparities in connectivity. While the core urban area benefits from a relatively complete network structure and high node connectivity, it is significantly affected by motor vehicle interference, which leads to notable efficiency losses during peak periods. In contrast, peripheral areas experience pronounced network fragmentation, weaker connectivity, and limited local permeability, all of which negatively impact the “last-mile” cycling experience.
Second, mixed-traffic interference remains a dominant factor undermining network performance. Motor vehicle volume (weight = 0.405) and intersection conflict intensity (weight = 0.456) are the primary disruptive elements. These impacts are particularly pronounced on sections lacking physical separation, where both cycling comfort and safety are substantially reduced. High-conflict intersections further heighten the likelihood of cycling interruptions, underscoring the urgent need for optimized traffic management and physical segregation measures.
Third, cycling environment comfort plays a pivotal role in shaping travel behavior. Areas with high green visibility, such as the Xuanwu Lake Greenway, tend to attract more recreational cyclists, while commuters prioritize direct and efficient routes. However, inadequate nighttime lighting and steep gradients in certain sections limit the all-weather feasibility of the network and reduce its appeal for utilitarian trips.
Finally, barrier-induced connectivity gaps contribute to significant detour problems. Natural barriers such as the Yangtze River impose substantial additional distance on cross-river cycling trips, diminishing network efficiency and increasing travel-related emissions. Existing cross-river facilities are unevenly distributed, and the limited service radii of available crossings constrain cross-regional cycling demand and hinder the integration of cycling into daily commuting patterns.
In practical terms, several targeted interventions are recommended for improving Nanjing’s cycling network. In peripheral areas, filling network gaps and upgrading micro-circulation routes would strengthen local connectivity. In the urban core, physical separation and optimized signal control at intersections should be prioritized to mitigate conflicts with motor vehicles. Enhancing nighttime lighting, pavement quality, and greenery visibility would improve environmental comfort and encourage higher cycling uptake. To address cross-barrier challenges, expanding dedicated river-crossing facilities and improving non-motorized lanes on existing bridges are essential. Collectively, these measures would contribute to a safer, more efficient, and more attractive cycling environment for Nanjing.
Overall, the findings of this study underscore the vital role that well-connected cycling networks play in promoting sustainable urban mobility. By reducing reliance on motorized transport, enhanced cycling infrastructure can significantly lower carbon emissions, reduce energy consumption, and improve public health. Moreover, equitable access to high-quality cycling networks supports social sustainability by providing affordable and healthy transportation options for all demographic groups, including low-income communities. These results further highlight the need for targeted interventions to address spatial disparities, mitigate traffic conflicts, enhance environmental comfort, and improve cross-barrier connectivity—measures that are essential to achieving Nanjing’s goal of building a safer, more efficient, and attractive cycling network capable of meeting the diverse mobility needs of its residents.
Author Contributions
Conceptualization, Z.T.; Data curation, Z.T. and J.W.; Formal analysis, Z.T. and J.W.; Methodology, Z.T. and J.W.; Visualization, Z.T. and J.W.; Writing—original draft, Z.T. and J.W.; Writing—review and editing, Z.T. and J.W. All authors have read and agreed to the published version of the manuscript.
Funding
This research was funded by Army Engineering University of the People’s Liberation Army (grant number KYJXJKQTZQ24002).
Institutional Review Board Statement
This study is waived for ethical review as the research design and protocol of this study are scientifically sound, fair and impartial, and will not pose any harm or risk to participants. The recruitment of participants is conducted on the principles of voluntariness and informed consent, and their rights and privacy are fully protected. This project involves no conflict of interest and does not contravene any ethical standards or legal regulations by Institution Committee.
Informed Consent Statement
Informed consent for participation was obtained from all subjects involved in the study.
Data Availability Statement
Data will be made available on request.
Conflicts of Interest
The authors declare no conflicts of interest.
Appendix A. Survey on the Importance of Evaluation Indicators for Nanjing’s Cycling Network Connectivity
Appendix A.1. Survey Background and Methodology
This expert survey was conducted in April 2025 at the Army Engineering University of the People’s Liberation Army in Nanjing, China, with the aim of scientifically determining the weighting of evaluation indicators for bicycle network connectivity in mixed-traffic environments.
A total of five experts were invited to participate, selected based on their professional expertise and experience relevant to the research theme. The panel included scholars specializing in transportation planning, engineers from urban construction departments involved in non-motorized traffic projects, and planners from institutions focused on greenway development. All experts possess over five years of professional experience in their respective fields, with specific knowledge of Nanjing’s urban traffic context and cycling infrastructure planning. This composition ensures that the expert sample covers the core disciplines involved in cycling network evaluation, providing a balanced and authoritative perspective that enhances the representativeness and reliability of the weighting results. The selection criteria align with established practices for obtaining expert consensus in policy-sensitive urban transport studies [50,51].
The survey was administered via one-on-one meetings or structured online forms, ensuring that all experts fully understood the indicator definitions and the pairwise comparison process before providing their judgments.
Appendix A.2. Survey Questionnaire
Dear Respondent,
Greetings! The primary purpose of this questionnaire is to assess the relative importance of evaluation indicators for Nanjing’s cycling network connectivity. We sincerely appreciate your assistance in completing this survey based on your experience with mixed-traffic environments, cycling network connectivity, and urban greenway development. We guarantee strict confidentiality of your responses. Collected questionnaires will be processed systematically using specialized software and used solely for academic research purposes.
We kindly request your prompt response and thank you for your support and assistance!
Wishing you good health, success in your work, and all the best in your endeavors!
This questionnaire primarily compares the importance of evaluating connectivity within Nanjing’s cycling network. A 5-point scale is used to rank indicator importance, where i represents a vertical indicator and j represents a horizontal indicator:
- 1 = Indicators i and j have equal influence
- 2 = Indicator i is slightly more influential than indicator j
- 3 = Indicator i is more influential than indicator j
- 4 = Indicator i is significantly more influential than indicator j
- 5 = Indicator i is absolutely more influential than indicator j
- 1/2, 1/3, 1/4, 1/5 = The reciprocal values indicate that indicator j is more influential than indicator i in the same ratio.
The evaluation framework consists of 4 primary indicators and 11 secondary indicators:
- (1)
- Basic Road Network Connectivity: segment connectivity, global accessibility, and local permeability;
- (2)
- Mixed-Traffic Interference: motor vehicle traffic volume, intersection conflict intensity, and lane separation level;
- (3)
- Cycling Environment Comfort: greenery visual coverage, nighttime lighting level, and slope adaptability;
- (4)
- Cross-Barrier Connectivity: barrier detour efficiency and barrier-crossing facility density.
Table A1.
Primary Indicator Scoring Table.
Table A1.
Primary Indicator Scoring Table.
| Indicator Item | Connectivity of the Basic Road Network Structure | Mixed-Traffic Interference | Comfort of the Cycling Environment | Cross-Barrier Connectivity |
|---|---|---|---|---|
| Connectivity of the Basic Road Network Structure | 1 | |||
| Mixed-Traffic Interference | 1 | |||
| Comfort of the cycling Environment | 1 | |||
| Cross-Barrier Connectivity | 1 |
Please fill in the blanks above with your score (1, 2, 3, 4, 5 or their reciprocals 1/2, 1/3, 1/4, 1/5) comparing the row indicator to the column indicator.
Table A2.
Scoring Table for Basic Road Network Structure Connectivity in Secondary Indicators.
Table A2.
Scoring Table for Basic Road Network Structure Connectivity in Secondary Indicators.
| Indicator Item | Road Segment Connectivity | Global Accessibility | Local Permeability |
|---|---|---|---|
| Road Segment Connectivity | 1 | ||
| Global Accessibility | 1 | ||
| Local permeability | 1 |
Table A3.
Scoring Table for Mixed Traffic Interference in Secondary Indicators.
Table A3.
Scoring Table for Mixed Traffic Interference in Secondary Indicators.
| Indicator Item | Motor Vehicle Traffic | Intensity of Intersection Conflicts | Lane Separation Level |
|---|---|---|---|
| Motor vehicle traffic | 1 | ||
| Intensity of Intersection Conflicts | 1 | ||
| Lane Separation Level | 1 |
Table A4.
Scoring Table for Comfort of the cycling Environment in Secondary Indicators.
Table A4.
Scoring Table for Comfort of the cycling Environment in Secondary Indicators.
| Indicator Item | Greenery Visual Coverage | Nighttime Illumination Level | Slope Adaptability |
|---|---|---|---|
| Greenery Visual Coverage | 1 | ||
| Nighttime illumination level | 1 | ||
| Slope Adaptability | 1 |
Table A5.
Scoring Table for Cross-Barrier Connectivity in Secondary Indicators.
Table A5.
Scoring Table for Cross-Barrier Connectivity in Secondary Indicators.
| Indicator Item | Barrier Bypass Degree | Cross-Barrier Facility Density |
|---|---|---|
| Barrier bypass degree | 1 | |
| Cross-barrier facility density | 1 |
Appendix A.3. Open-Ended Feedback
If you have any comments on the indicators above or would like to suggest additional metrics, please provide your feedback in the space below.
Thank you for your participation!
Signature: __________________________
Appendix B. Expert Scoring Survey Form
Dear Expert,
Please evaluate the connectivity indicators of Nanjing’s cycling network based on its construction characteristics and relevant assessment metrics within a mixed-traffic environment. Use the 5-point scale below for scoring:
- 5—Excellent
- 4—Very Good
- 3—Good
- 2—Average
- 1—Poor
- 0—Very Poor
Kindly record your scores in the table provided below.
Table A6.
Expert Scoring Sheet (Example).
Table A6.
Expert Scoring Sheet (Example).
| Nanjing City Cycling Network Connectivity Evaluation Index System | Primary indicator | Secondary Indicators | Grading |
| C1. Connectivity of the Basic Road Network Structure | C11. Road Segment Connectivity | ||
| C12. Global Accessibility | |||
| C13. Local permeability | |||
| C2. Mixed-Traffic Interference | C21. Motor vehicle traffic | ||
| C22. Intensity of Intersection Conflicts | |||
| C23. Lane Separation Level | |||
| C3. Comfort of the cycling Environment | C31. Greenery Visual Coverage | ||
| C32. Nighttime illumination level | |||
| C33. Slope Adaptability | |||
| C4. Cross-Barrier Connectivity | C41. Barrier bypass degree | ||
| C42. Cross-barrier facility density |
Appendix C. Sensitivity Analysis
| Scheme | C1 | C2 | C3 | C4 | S | Grade |
|---|---|---|---|---|---|---|
| Baseline | 0.4087 | 0.1850 | 0.2510 | 0.1553 | 3.2568 | Four-Star Level |
| C1 + 20% | 0.4904 | 0.1595 | 0.2163 | 0.1338 | 3.2759 | Four-Star Level |
| C1 − 20% | 0.3270 | 0.2105 | 0.2857 | 0.1768 | 3.2379 | Four-Star Level |
| C2 + 20% | 0.3901 | 0.2220 | 0.2396 | 0.1483 | 3.2447 | Four-Star Level |
| C2 − 20% | 0.4273 | 0.1480 | 0.2623 | 0.1624 | 3.2690 | Four-Star Level |
| C3 + 20% | 0.3813 | 0.1726 | 0.3012 | 0.1449 | 3.2602 | Four-Star Level |
| C3 − 20% | 0.4361 | 0.1974 | 0.2008 | 0.1657 | 3.2535 | Four-Star Level |
| C4 + 20% | 0.3937 | 0.1782 | 0.2417 | 0.1864 | 3.2523 | Four-Star Level |
| C4 − 20% | 0.4237 | 0.1918 | 0.2603 | 0.1242 | 3.2614 | Four-Star Level |
References
- Pucher, J.; Buehler, R. Making Cycling Irresistible: Lessons from The Netherlands, Denmark and Germany. Transp. Rev. 2008, 28, 495–528. [Google Scholar] [CrossRef]
- Parkin, J.; Rotheram, J. Design speeds and acceleration characteristics of bicycle traffic for use in planning, design and appraisal. Transp. Policy 2010, 17, 335–341. [Google Scholar] [CrossRef]
- Winters, M.; Buehler, R.; Götschi, T. Policies to Promote Active Travel: Evidence from Reviews of the Literature. Curr. Environ. Health Rep. 2017, 4, 278–285. [Google Scholar] [CrossRef] [PubMed]
- Furth, P.G.; Mekuria, M.C.; Nixon, H. Network Connectivity for Low-Stress Bicycling. Transp. Res. Rec. J. Transp. Res. Board 2016, 2587, 41–49. [Google Scholar] [CrossRef]
- Lowry, M.B.; Callister, D.; Gresham, M. Assessment of communitywide bikeability with bicycle level of service. Transp. Res. Rec. 2013, 2387, 24–32. [Google Scholar] [CrossRef]
- Chen, P.; Shen, Q.; He, Z. A GPS data-based analysis of built environment influences on bicyclist route preferences. Int. J. Sustain. Transp. 2018, 12, 218–231. [Google Scholar] [CrossRef]
- Zangenehpour, S.; Miranda-Moreno, L.F.; Saunier, N. Are signalized intersections with cycle tracks safer? A case–control study based on automated surrogate safety analysis using video data. Accid. Anal. Prev. 2016, 86, 161–172. [Google Scholar] [CrossRef]
- Nawrath, M.; Elsey, H.; Kowarik, I. The influence of green streets on cycling behavior in European cities. Landsc. Urban Plan. 2019, 190, 103598. [Google Scholar] [CrossRef]
- Chou, K.Y.; Paulsen, M.; Nielsen, O.A.; Jensen, A.F. Analysis of cycling accessibility using detour ratios—A large-scale study based on crowdsourced GPS data. Sustain. Cities Soc. 2023, 93, 104500. [Google Scholar] [CrossRef]
- Tian, K.; Zheng, Y.; Sun, Z.; Yin, Z.; Zhu, K.; Liu, C. A comprehensive framework for evaluating cycling infrastructure: Fusing subjective perceptions with objective data. Sensors 2025, 25, 1168. [Google Scholar] [CrossRef]
- Green, D. Guide to Traffic Management Part 4: Network Management [R/OL]. Available online: https://docslib.org/doc/2616233/guide-to-traffic-management-part-4-network-management (accessed on 24 September 2025).
- Liu, T.; Meidani, H. Graph Neural Network Surrogate for seismic reliability analysis of highway bridge system. arXiv 2022, arXiv:2210.06404. [Google Scholar] [CrossRef]
- Liu, T.; Meidani, H. End-to-end heterogeneous graph neural networks for traffic assignment. Transp. Research Part C-Emerg. Technol. 2024, 165, 104695. [Google Scholar] [CrossRef]
- Broach, J. FHWA Guidebook for Measuring Multimodal Network Connectivity; PSU Transportation Seminars: Portland, OR, USA, 2018; p. 147. Available online: http://archives.pdx.edu/ds/psu/25035 (accessed on 24 September 2025).
- Chen, S.; Claramunt, C.; Ray, C. A spatio-temporal modelling approach for the study of the connectivity and accessibility of the Guangzhou metropolitan network. J. Transp. Geogr. 2014, 36, 12–23. [Google Scholar] [CrossRef]
- Imani, A.F.; Miller, E.J.; Saxe, S. Cycle accessibility and level of traffic stress: A case study of Toronto. J. Transp. Geogr. 2019, 80, 102496. [Google Scholar] [CrossRef]
- Shi, W. The Impacts of the Bicycle Network on Bicycling Activity: A Longitudinal Multi-City Approach. Ph.D. Thesis, Portland State University, Portland, OR, USA, 2020. [Google Scholar] [CrossRef]
- Zhang, Y.; Wang, R.; Wu, Y.; Chu, G.; Wu, X. The Influence of Built-Environment Factors on Connectivity of Road Networks in Residential Areas: A Study Based on 204 Samples in Nanjing, China. Buildings 2023, 13, 301. [Google Scholar] [CrossRef]
- Ryan, J.; Pereira, R.H. Pereira. What are we missing when we measure accessibility? Comparing calculated and self-reported accounts among older people. J. Transp. Geogr. 2021, 93, 103086. [Google Scholar] [CrossRef]
- Miah, M. Estimation of daily bicycle traffic using machine and deep learning techniques. Transportation 2022, 50, 1631–1684. [Google Scholar] [CrossRef]
- Olsson, S.R.; Elldér, E. Are bicycle streets cyclist-friendly? Micro-environmental factors for improving perceived safety when cycling in mixed traffic. Accid. Anal. Prev. 2023, 184, 107007. [Google Scholar] [CrossRef]
- Cai, Q.; Abdel-Aty, M.; Castro, S. Explore effects of bicycle facilities and exposure on bicycle safety at intersections. Int. J. Sustain. Transp. 2021, 15, 592–603. [Google Scholar] [CrossRef]
- Li, C. Evaluating the safety effects of bicycle lanes in New York City. Am. J. Public Health 2012, 102, 1120–1127. [Google Scholar]
- Mohammadi, A.; Piccinini, G.B.; Dozza, M. Understanding the interaction between cyclists and motorized vehicles at unsignalized intersections: Results from a cycling simulator study. J. Saf. Res. 2024, 90, 306–318. [Google Scholar] [CrossRef] [PubMed]
- Caviedes, A.; Figliozzi, M. Modeling the impact of traffic conditions and bicycle facilities on cyclists’ on-road stress levels. Transp. Res. Part F-Traffic Psychol. Behav. 2018, 58, 488–499. [Google Scholar] [CrossRef]
- Cobb, D.P.; Jashami, H.; Hurwitz, D.S. Bicyclists’ behavioral and physiological responses to varying roadway conditions and bicycle infrastructure. Transp. Res. Part F-Traffic Psychol. Behav. 2021, 80, 172–188. [Google Scholar] [CrossRef]
- Apasnore, P.; Ismail, K.; Kassim, A. Bicycle-vehicle interactions at mid-sections of mixed traffic streets: Examining passing distance and bicycle comfort perception. Accid. Anal. Prev. 2017, 106, 141–148. [Google Scholar] [CrossRef]
- Chandra, S.; Jimenez, J.; Radhakrishnan, R. Accessibility evaluations for nighttime walking and bicycling for low-income shift workers. J. Transp. Geogr. 2017, 64, 97–108. [Google Scholar] [CrossRef]
- Wang, K.; Akar, G. Street Intersection Characteristics and Their Impacts on Perceived Bicycling Safety; Ohio Department of Transportation: Columbus, OH, USA, 2018. [Google Scholar]
- Krenn, P.J.; Oja, P.; Titze, S. Development of abikeability index to assess the bicycle-friendliness of urban environments. Open J. Civ. Eng. 2015, 5, 451–459. [Google Scholar] [CrossRef]
- Qian, X.; Moore, J.K.; Niemeier, D. Predicting bicycle pavement ride quality: Sensor-based statistical model. J. Infrastruct. Syst. 2020, 26, 04020033. [Google Scholar] [CrossRef]
- Li, Z.; Wang, W.; Zhang, Y.; Lu, J.; Ragland, D.R. Exploring factors influencing bicyclists perception of comfort on bicycle facilities. In Proceedings of the TRB 2012 Annual Meeting, Washington, DC, USA, 22–26 January 2012; pp. 718–727. [Google Scholar]
- Thigpen, C.G.; Li, H.; Handy, S.L.; Harvey, J. Modeling the impact of pavement roughness on bicycle ride quality. Transp. Res. Rec. 2015, 2520, 67–77. [Google Scholar] [CrossRef]
- Miah, S.; Kaparias, I.; Ayub, N.; Milonidis, E.; Holmes, W. Measuring cycle riding comfort in Southampton using an instrumented bicycle. In Proceedings of the 6th International Conference on Models and Technologies for Intelligent Transportation Systemsm, Cracow, Poland, 5–7 June 2019; p. 8883328. [Google Scholar]
- Boisjoly, G.; Lachapelle, U.; El-Geneidy, A. Bicycle network performance: Assessing the directness of bicycle facilities through connectivity measures, a Montreal, Canada case study. Int. J. Sustain. Transp. 2020, 14, 620–634. [Google Scholar] [CrossRef]
- Park, Y.; Akar, G. Why do bicyclists take detours? A multilevel regression model using smartphone GPS data. J. Transp. Geogr. 2019, 74, 191–200. [Google Scholar] [CrossRef]
- Vybornova, A.; Cunha, T.; Gühnemann, A.; Szell, M. Automated Detection of Missing Links in Bicycle Networks. Geogr. Anal. 2022, 55, 239–267. [Google Scholar] [CrossRef]
- Orozco, L.G.N.; Battiston, F.; Iñiguez, G.; Szell, M. Data-driven strategies for optimal bicycle network growth. R. Soc. Open Sci. 2020, 7, 201130. [Google Scholar] [CrossRef]
- Lonardi, A.; Szell, M.; De Bacco, C. Cohesive urban bicycle infrastructure design through optimal transport routing in multilayer networks. J. R. Soc. Interface 2025, 22, 20240532. [Google Scholar] [CrossRef] [PubMed]
- Ospina, J.P.; Duque, J.C.; Botero-Fernández, V.; Montoya, A. The maximal covering bicycle network design problem. Transp. Res. Part A-Policy Pract. 2022, 159, 222–236. [Google Scholar] [CrossRef]
- Ministry of Housing and Urban-Rural Development. Standard for Planning of Urban Pedestrian and Bicycle Transportation System (GB/T 51439-2021) [R/OL]. Available online: https://www.mohurd.gov.cn/gongkai/zc/wjk/art/2021/art_17339_250179.html (accessed on 20 May 2021).
- Li, C.; Zhang, H.; Li, K.; Zhang, D.; Jia, J.; Zhao, S.; He, Y. Review on travel quality evaluation methods for urban bicycle traffic system. J. Traffic Transp. Eng. 2024, 24, 43–65. [Google Scholar]
- Fagundes, M.V.C.; Hellingrath, B.; Freires, F.G.M. Supplier Selection Risk: A New Computer-Based Decision-Making System with Fuzzy Extended AHP. Logistics 2021, 5, 13. [Google Scholar] [CrossRef]
- Nanjing Planning and Natural Resources Bureau. Detailed Planning of Nanjing Greenway (2020–2035) (for Public Comment) [R/OL]. Available online: http://ghj.nanjing.gov.cn/pqgs/ghbzpqgs/202109/t20210908_3125145.html (accessed on 1 June 2022).
- Nanjing Planning and Natural Resources Bureau. Nanjing Territorial Spatial Master Plan (2021–2035) [R/OL]. Available online: https://ghj.nanjing.gov.cn/ghbz/ztgh/202410/t20241024_4992742.html (accessed on 24 October 2024).
- Shi, G.; Shan, J.; Ding, L.; Ye, P.; Li, Y.; Jiang, N. Urban road network expansion and its driving variables: A case study of Nanjing city. Int. J. Environ. Res. Public Health 2019, 16, 2318. [Google Scholar] [CrossRef]
- Hsu, C.K.; Tsao, M.; Moran, M.E.; Griswold, J.B.; Schneider, R.J.; Bigham, J.M. A con-text-sensitive roadway classification frame-work for speed limit setting in the US. Transp. Res. Interdiscip. Perspect. 2025, 33, 101621. [Google Scholar]
- Li, Z.; Wang, W.; Liu, P.; Schneider, R.; Ragland, D.R. Investigating bicyclists’ perception of comfort on physically separated bicycle paths in Nanjing, China. Transp. Res. Part F Traffic Psychol. Behav. 2019, 65, 368–379. [Google Scholar] [CrossRef]
- Nanjing Urban and Rural Construction Committee. Notice of the General Office of the Municipal Government on Issuing the Three-Year Action Plan for the Construction of Cross-Administrative District Dead-End Roads in Nanjing’s Main City (2018–2020) [R/OL]. Available online: https://sjw.nanjing.gov.cn/zthg/2018njcsjxhjs/gzdt/201809/t20180907_492026.html (accessed on 7 December 2018).
- Wang, M.; Du, M.; Li, X.; Yang, J.; Shen, Y. Driving Sustainable Mobility: Adoption and the Willingness to Participate in Electric Ride-Hailing Service Among Driver Groups in Less-Developed Cities. Sustainability 2025, 17, 8077. [Google Scholar] [CrossRef]
- Wang, C.; Li, X.; Du, M.; Yang, J.; Shen, Y. Factors Influencing the Acceptance of Electric Ride-Hailing Vehicles and Market-Exit Decisions Among Drivers in Underdeveloped Cities. Sustainability 2025, 17, 7869. [Google Scholar] [CrossRef]


Disclaimer/Publisher’s Note: The statements, opinions and data contained in all publications are solely those of the individual author(s) and contributor(s) and not of MDPI and/or the editor(s). MDPI and/or the editor(s) disclaim responsibility for any injury to people or property resulting from any ideas, methods, instructions or products referred to in the content. |
© 2025 by the authors. Licensee MDPI, Basel, Switzerland. This article is an open access article distributed under the terms and conditions of the Creative Commons Attribution (CC BY) license (https://creativecommons.org/licenses/by/4.0/).