Spatiotemporal Evolution, Regional Disparities, and Transition Dynamics of Carbon Effects in China’s Agricultural Land Use
Abstract
1. Introduction
2. Materials and Methods
2.1. Methodology for Estimating the Carbon Effects of Agricultural Land Use
2.1.1. Methodology for Estimating Carbon Emissions from Agricultural Land Use
2.1.2. Methodology for Estimating Carbon Sink from Agricultural Land Use
2.2. Dagum Gini Coefficient
2.3. Kernel Density Estimation
2.4. Markov Chain Analysis
2.5. Data Sources
3. Results
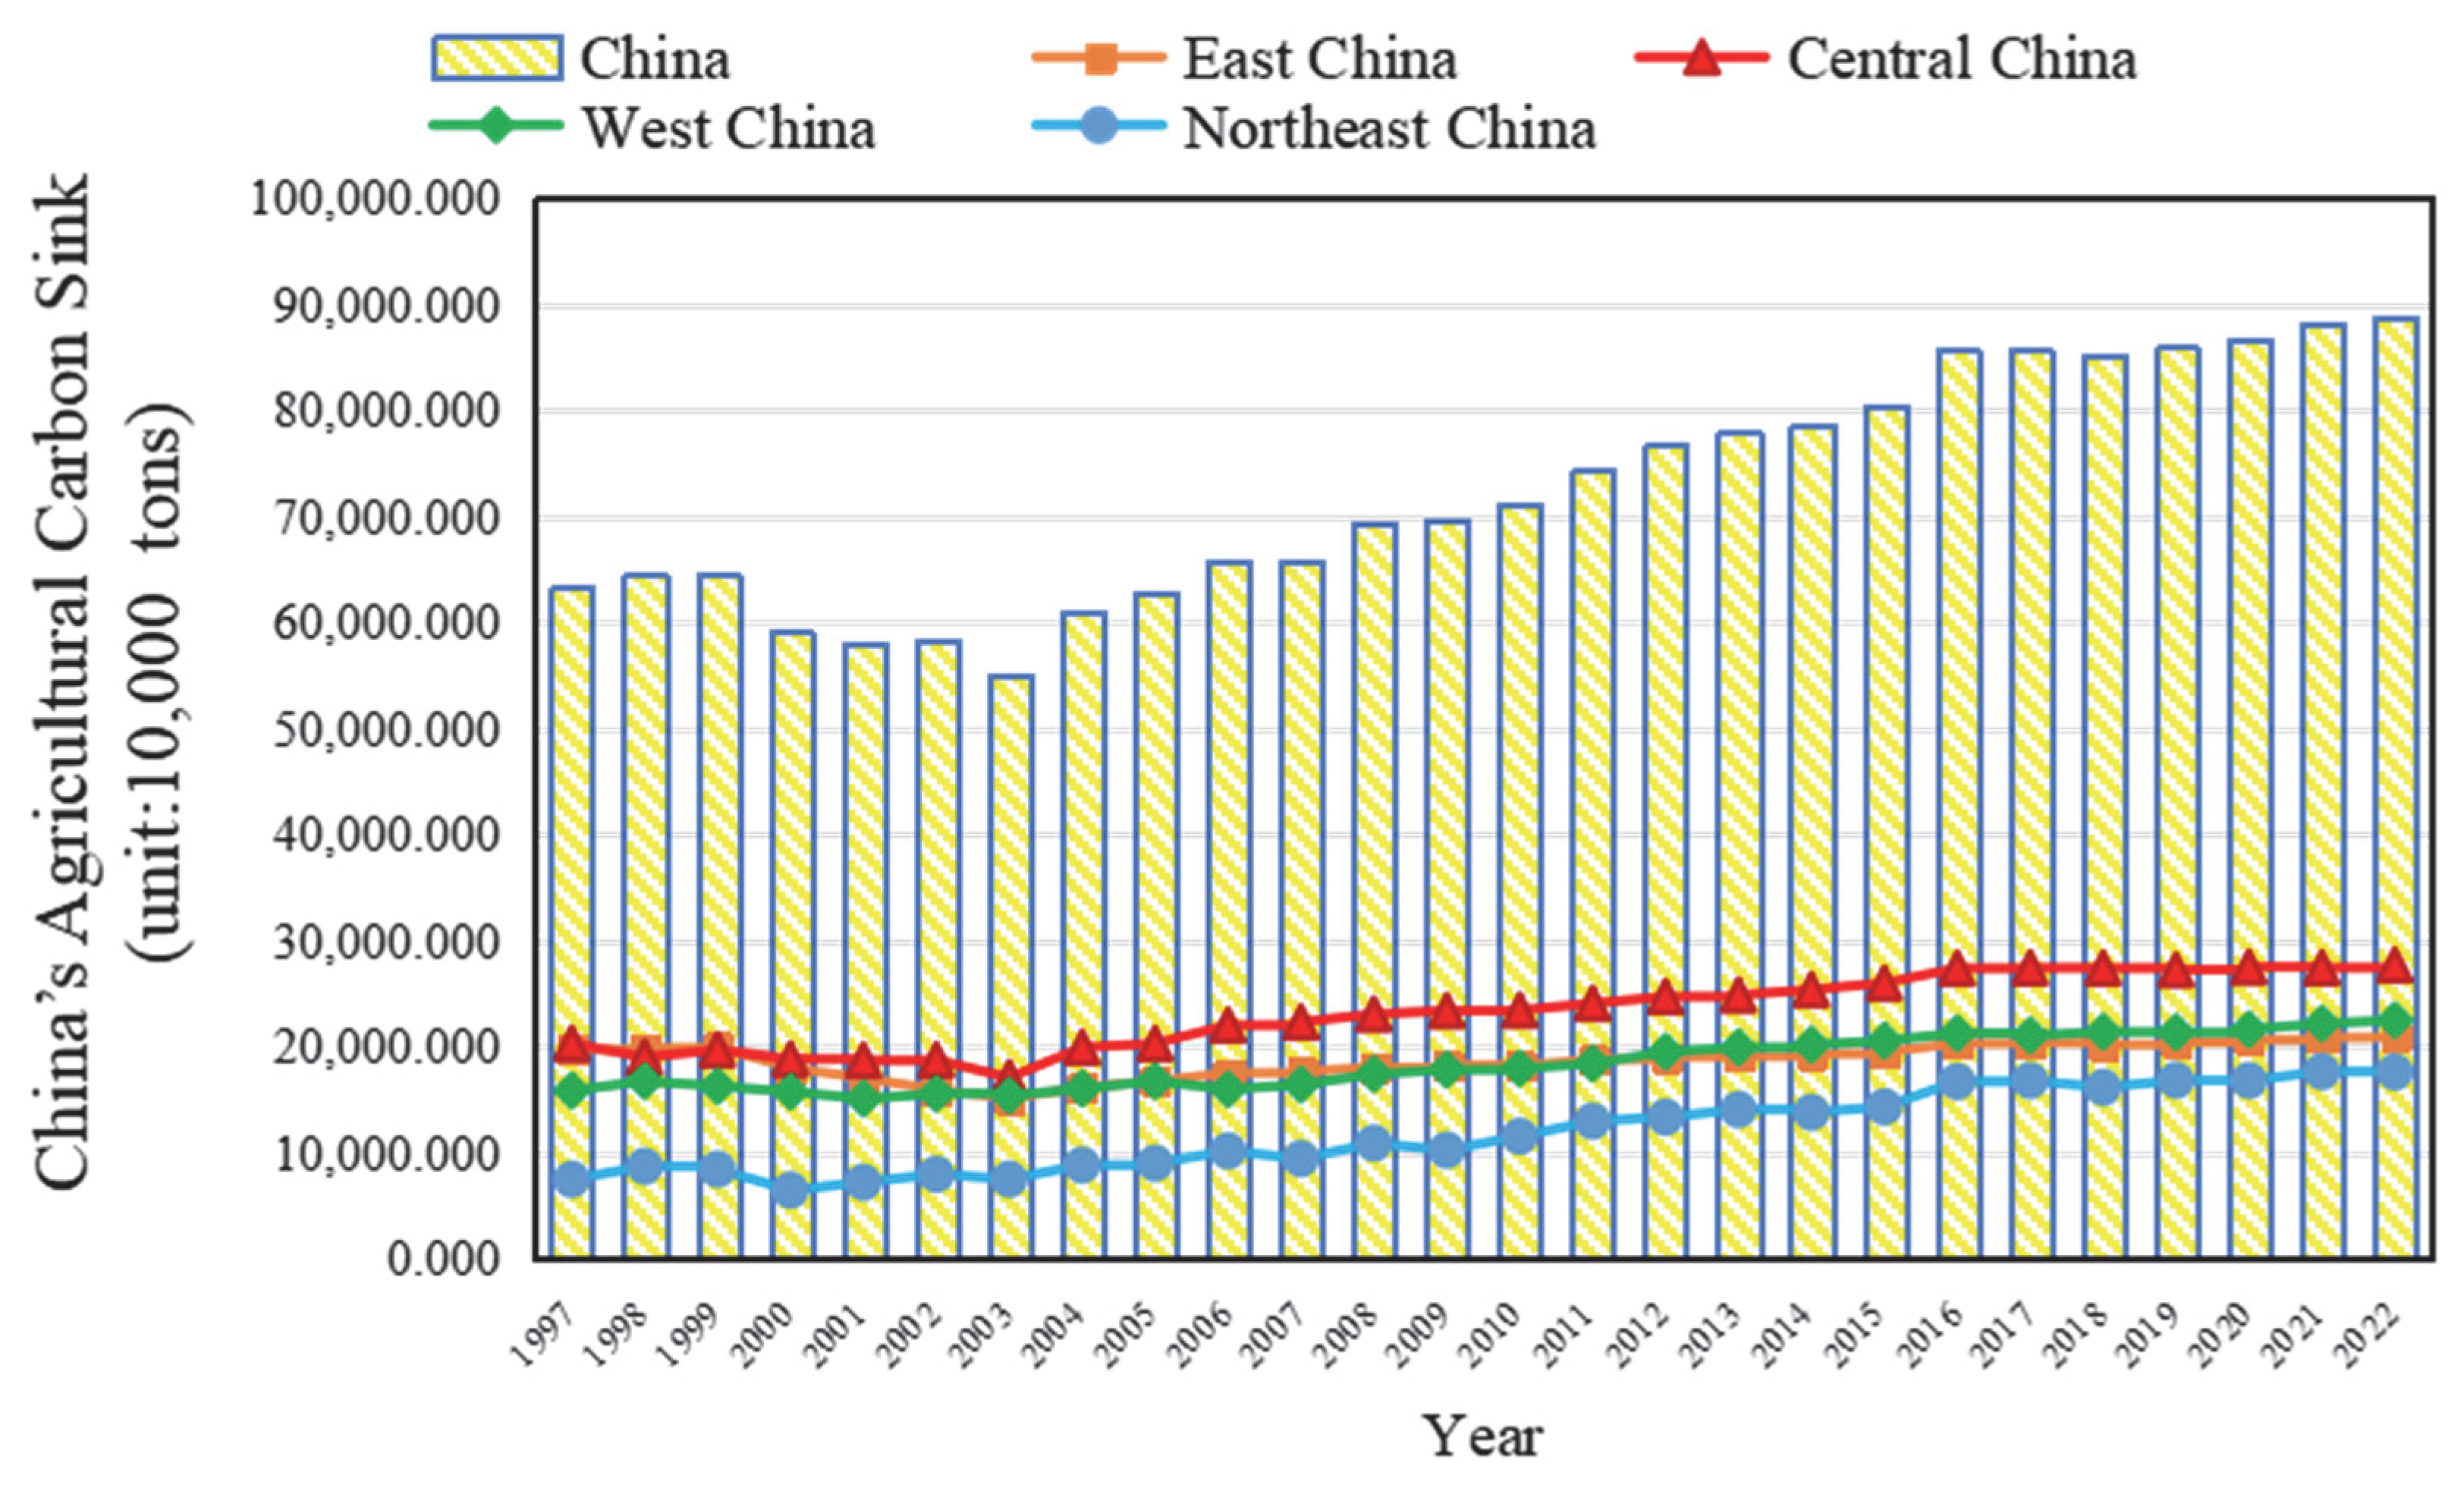
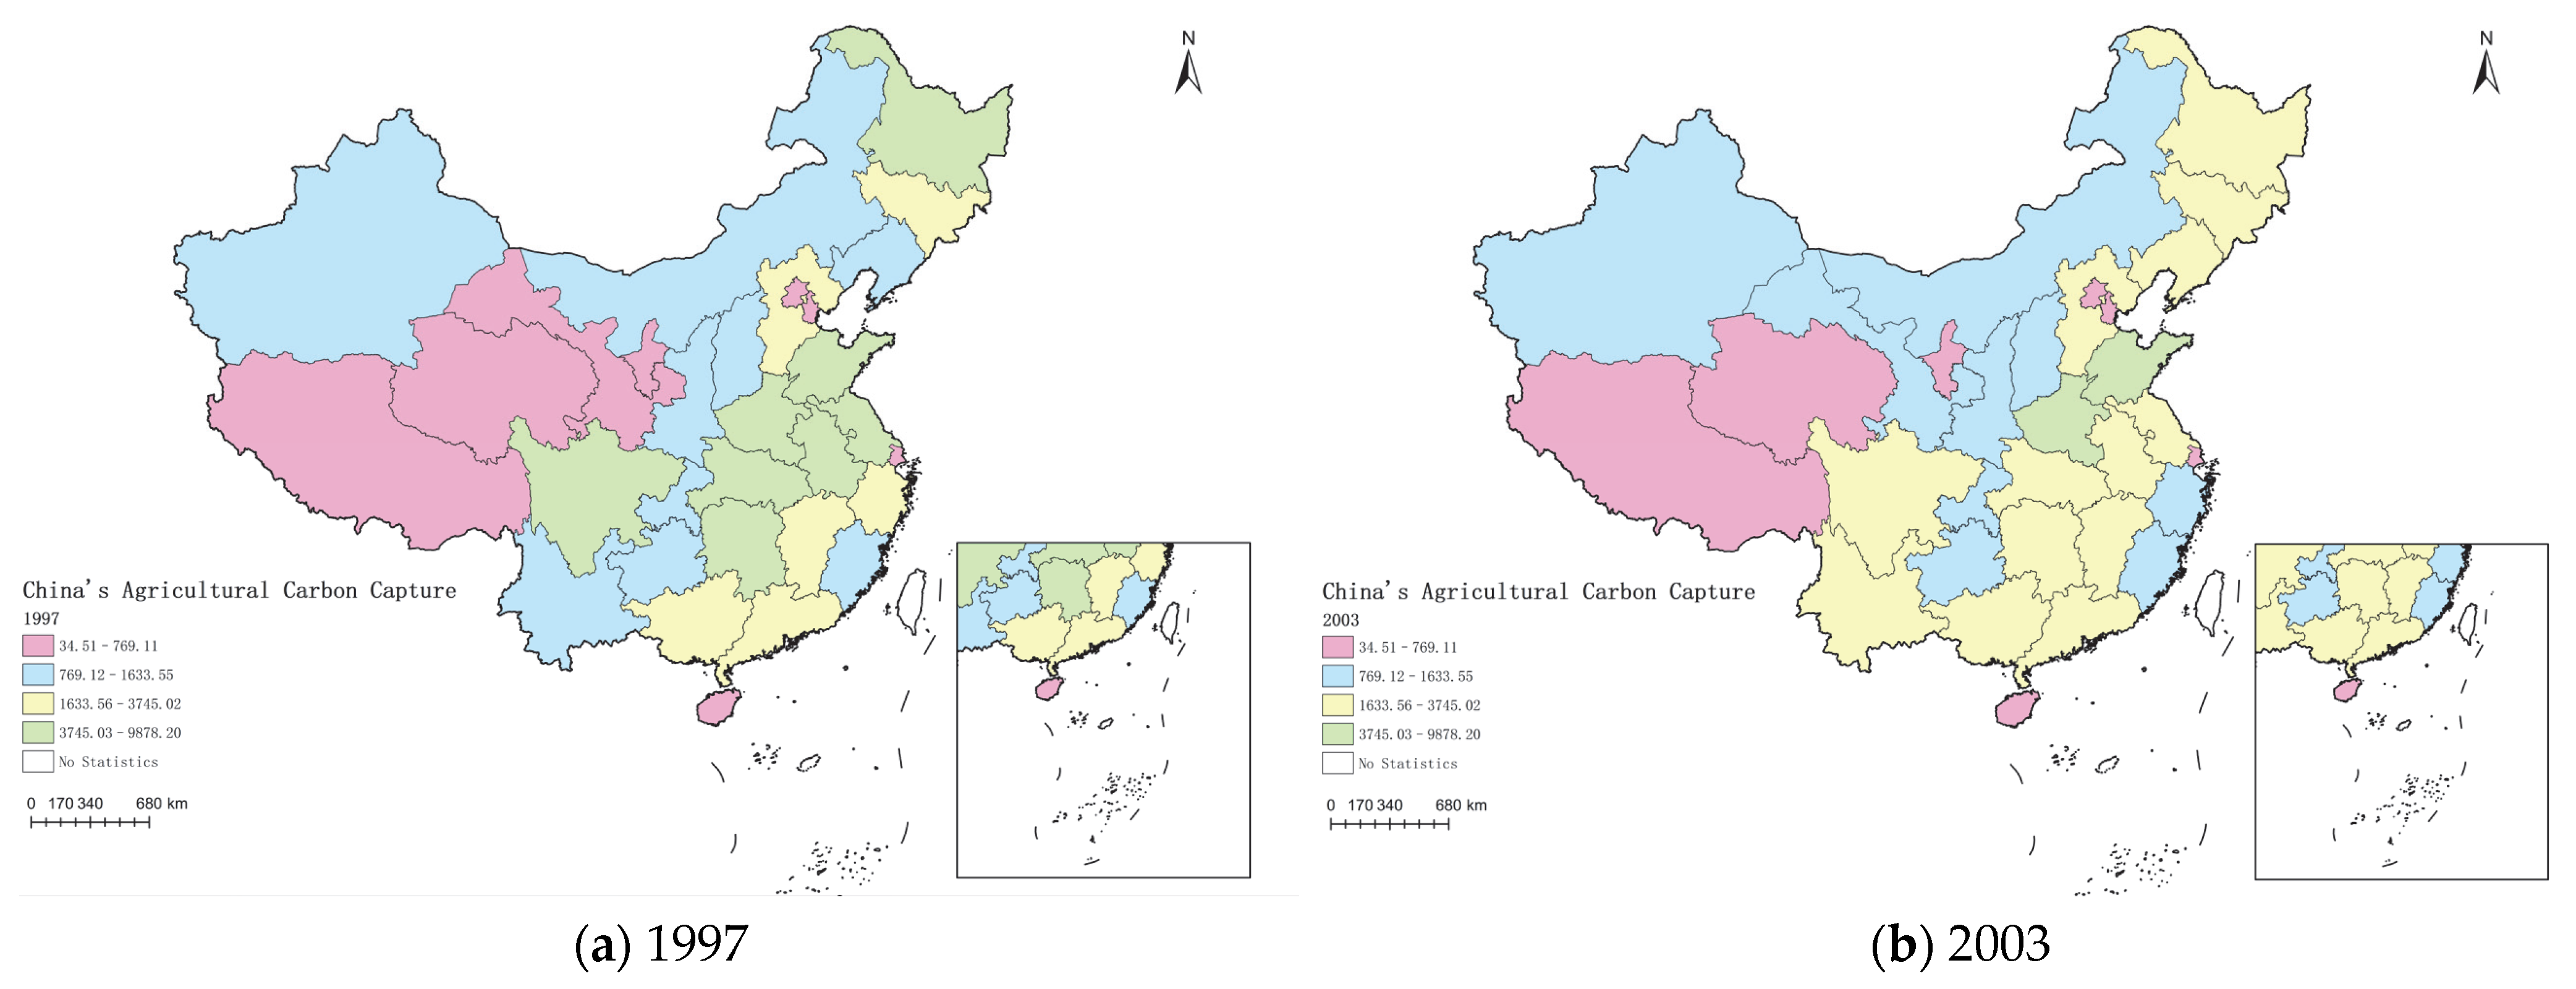
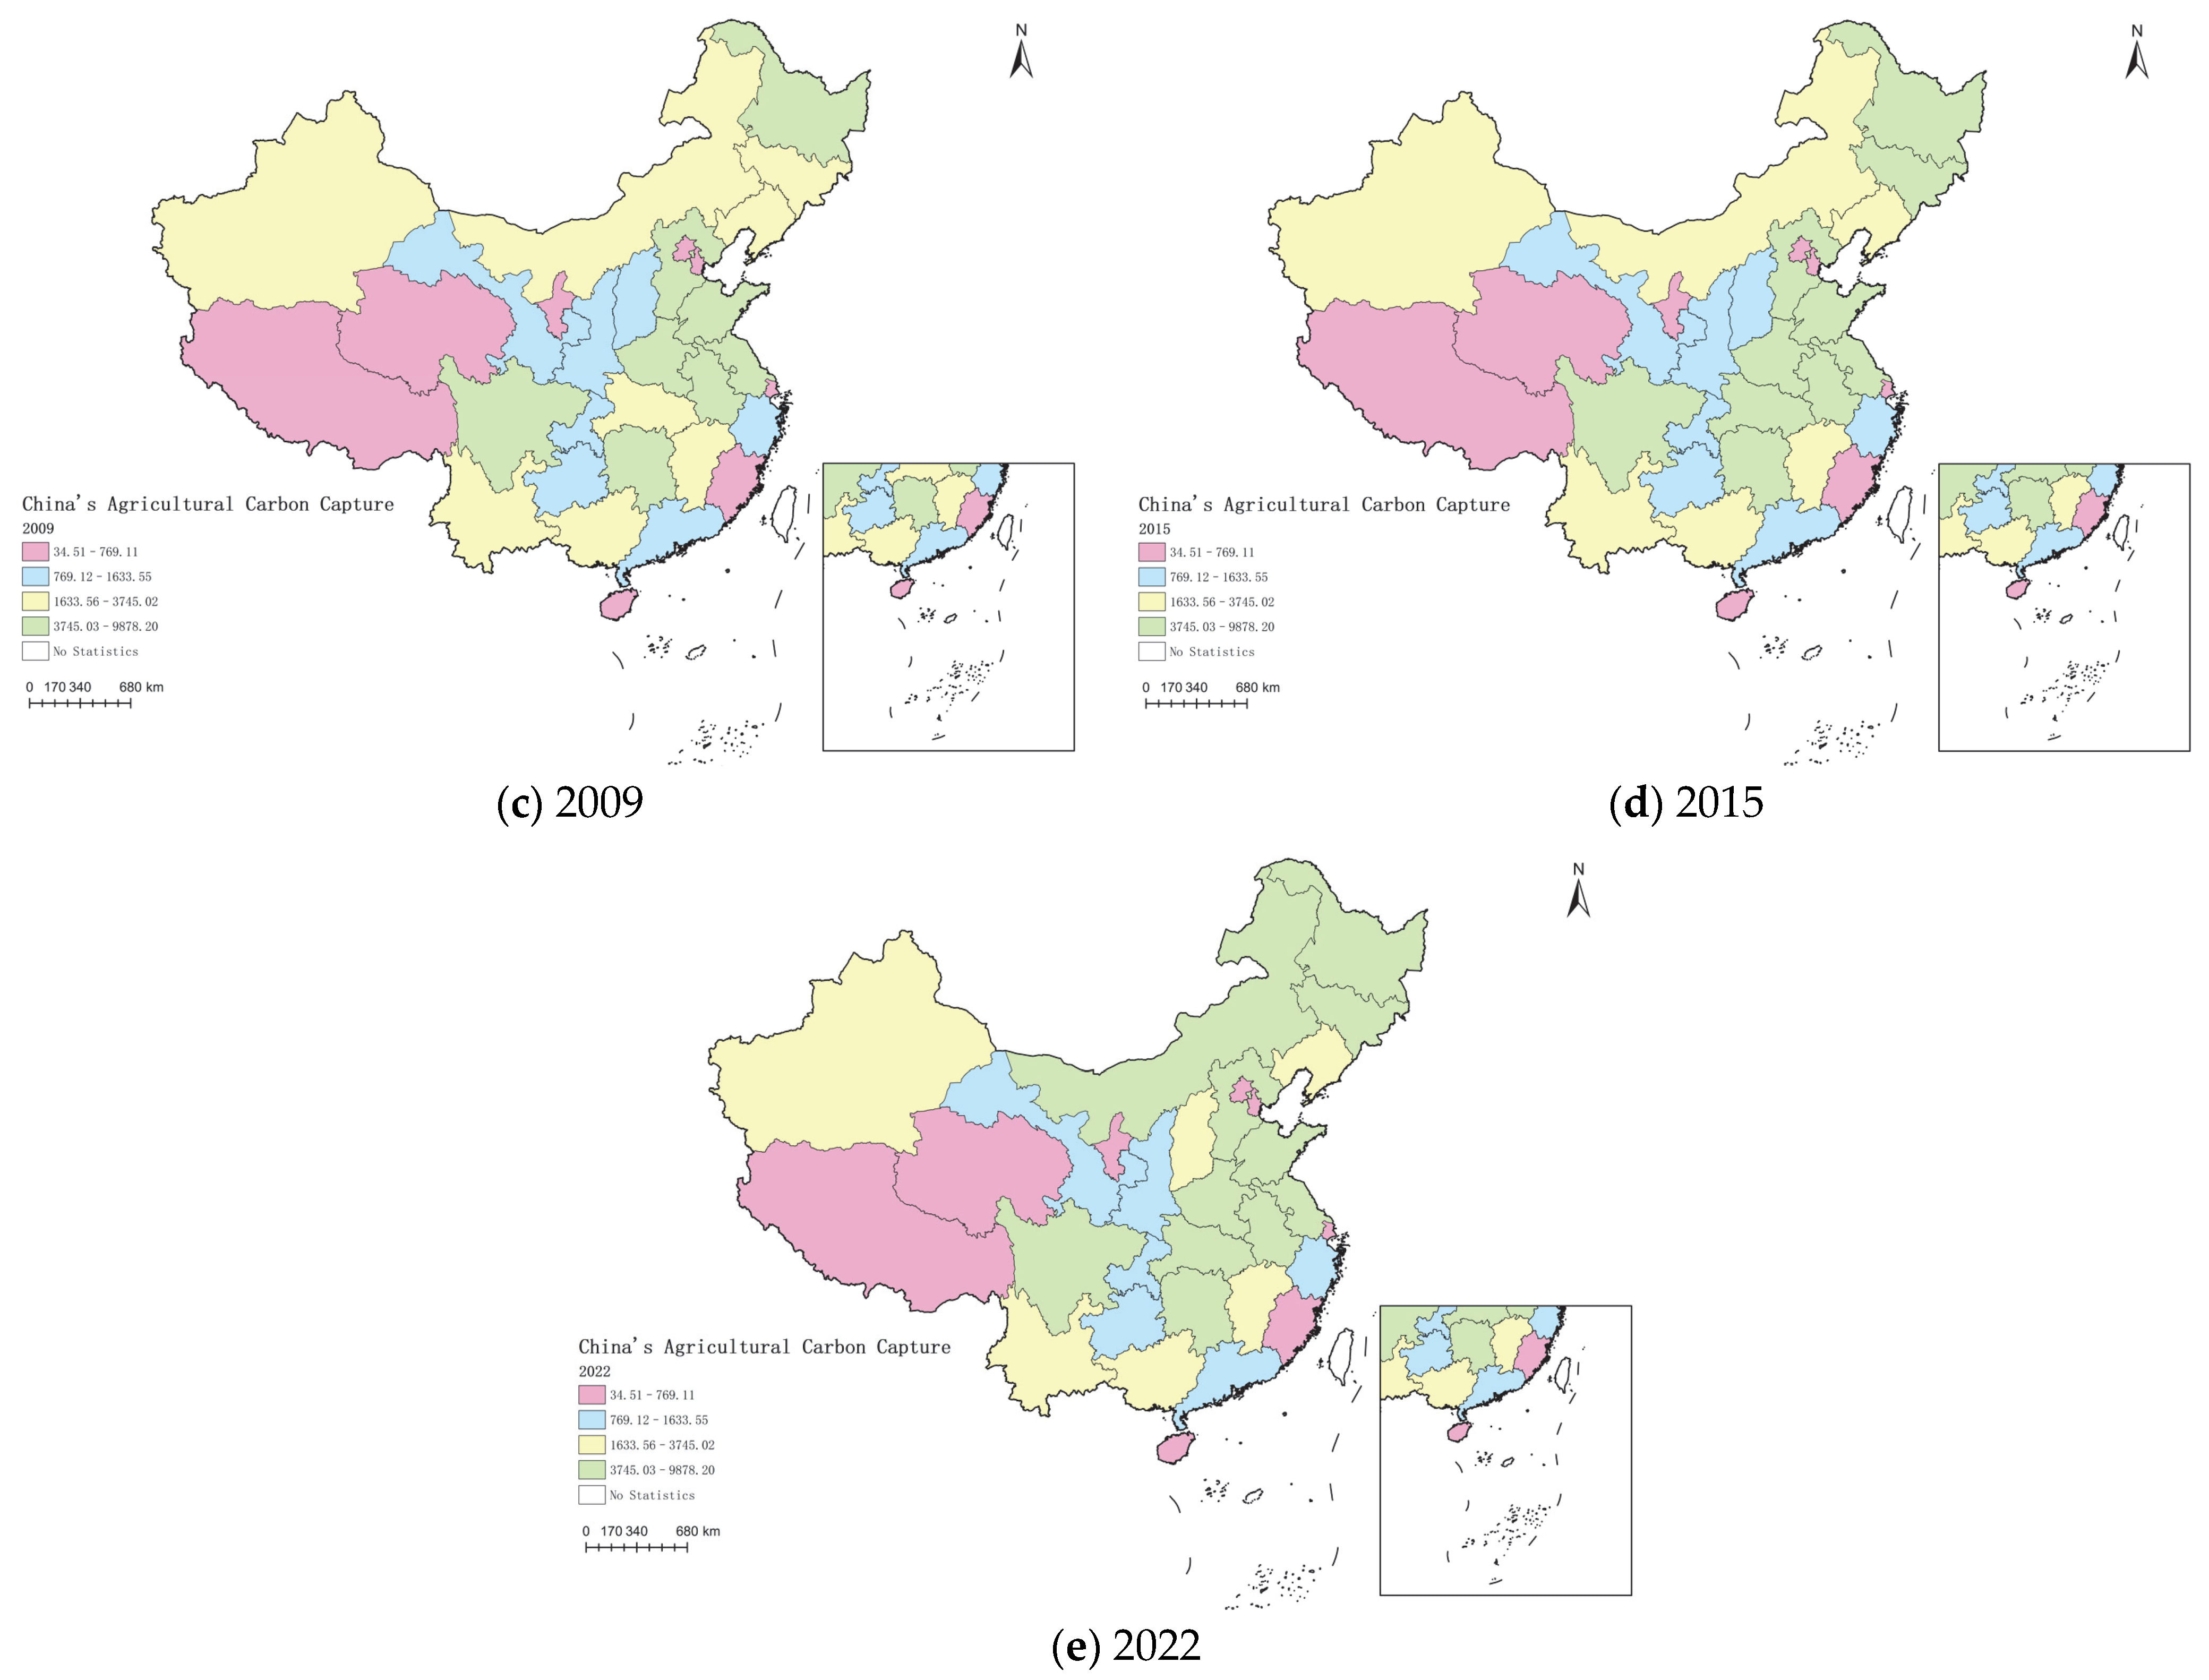
3.1. Spatial–Temporal Patterns and Evolutionary Dynamics of Carbon Capture in China’s Agricultural Land Use
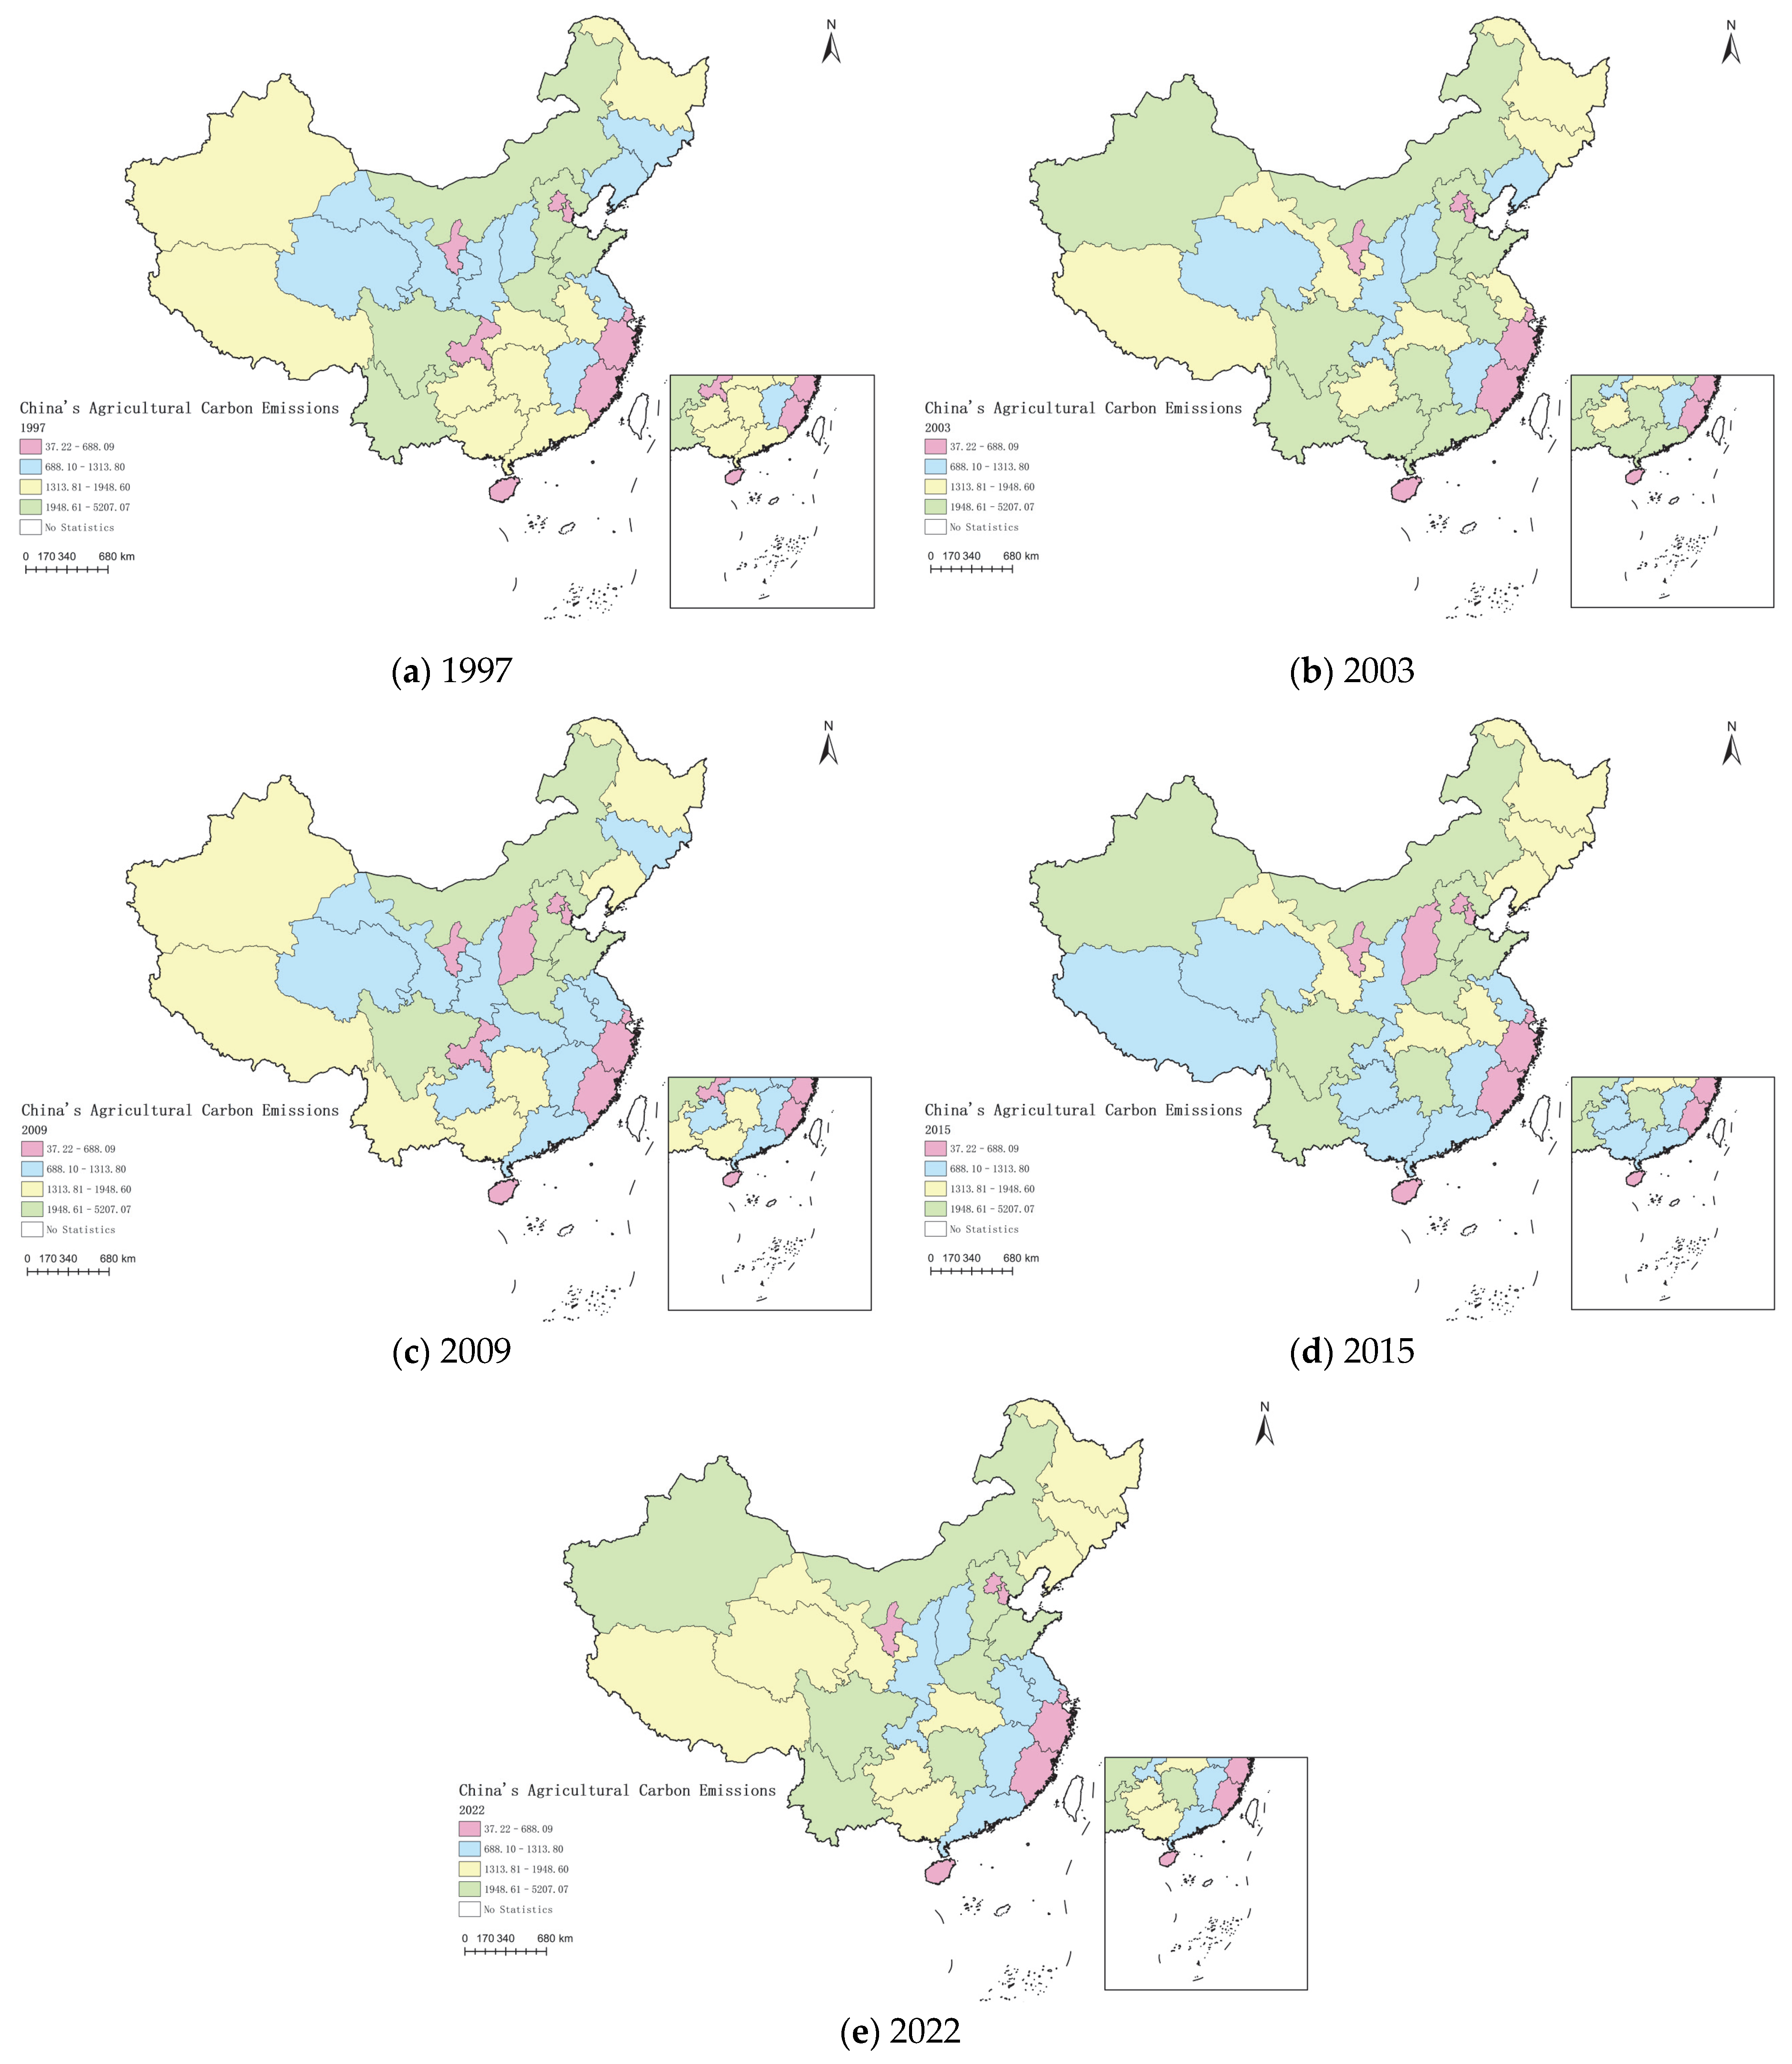
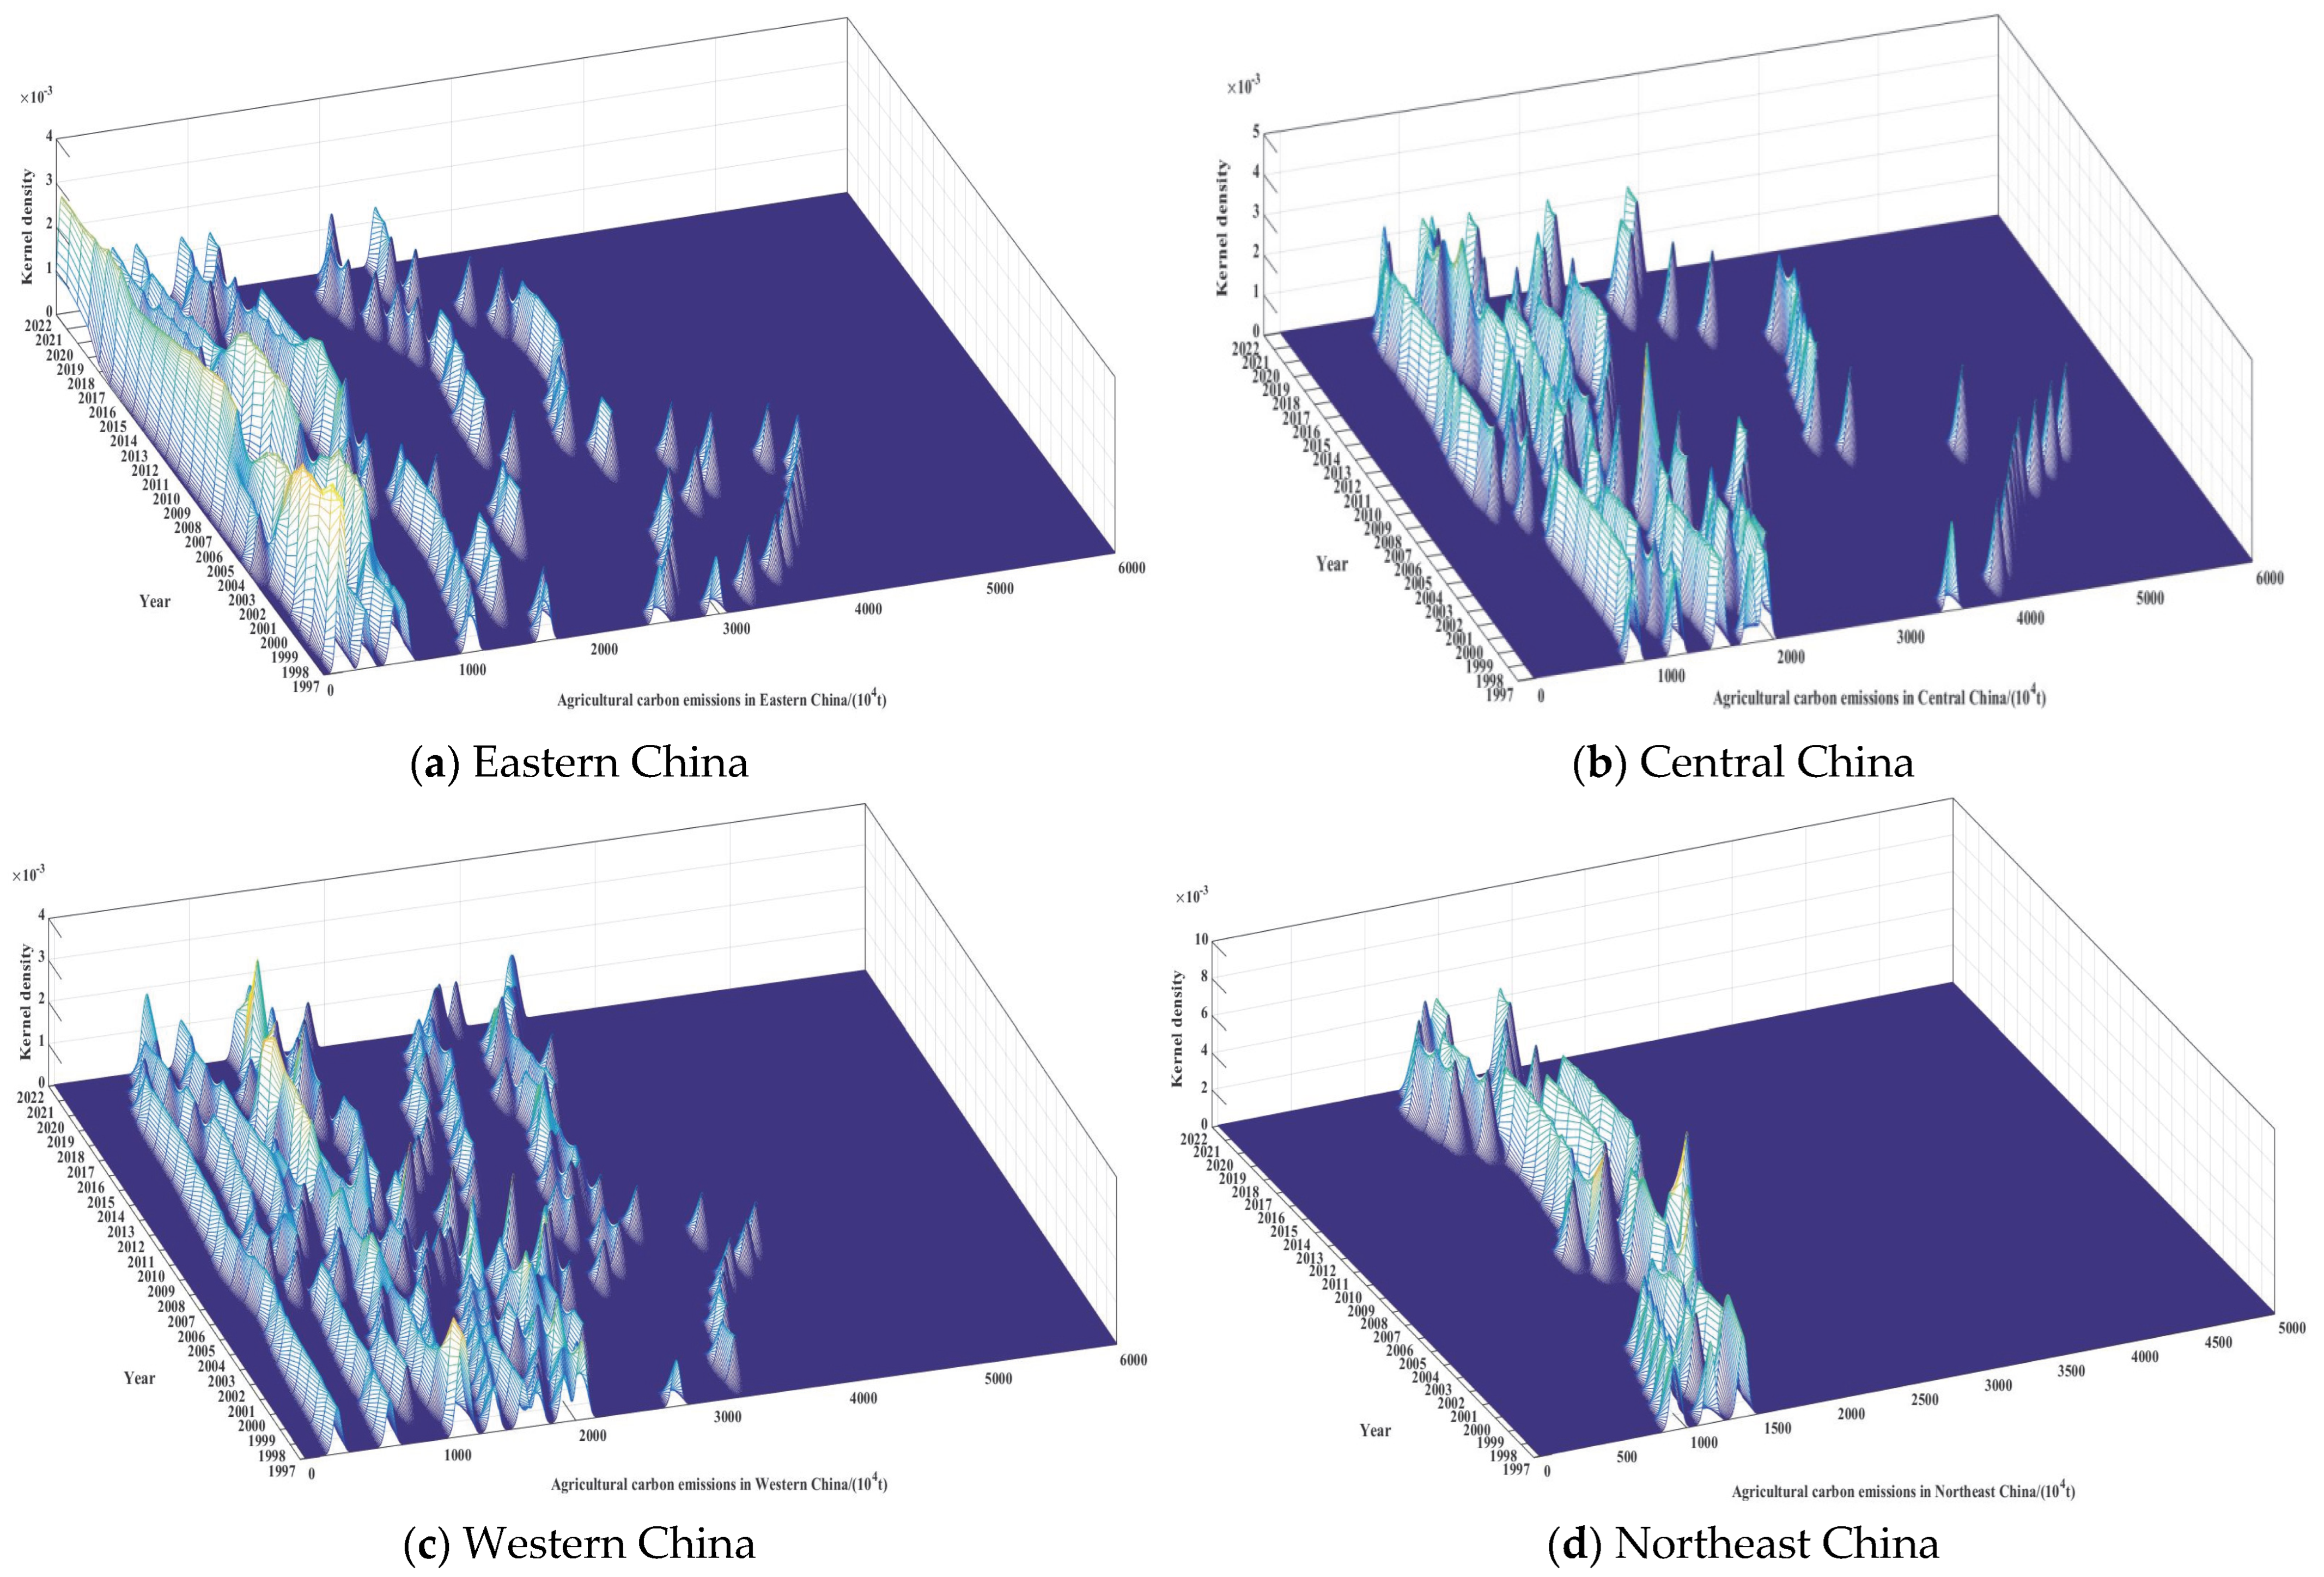
3.2. Spatial–Temporal Patterns and Evolutionary Dynamics of Carbon Emissions in China’s Agricultural Land Use
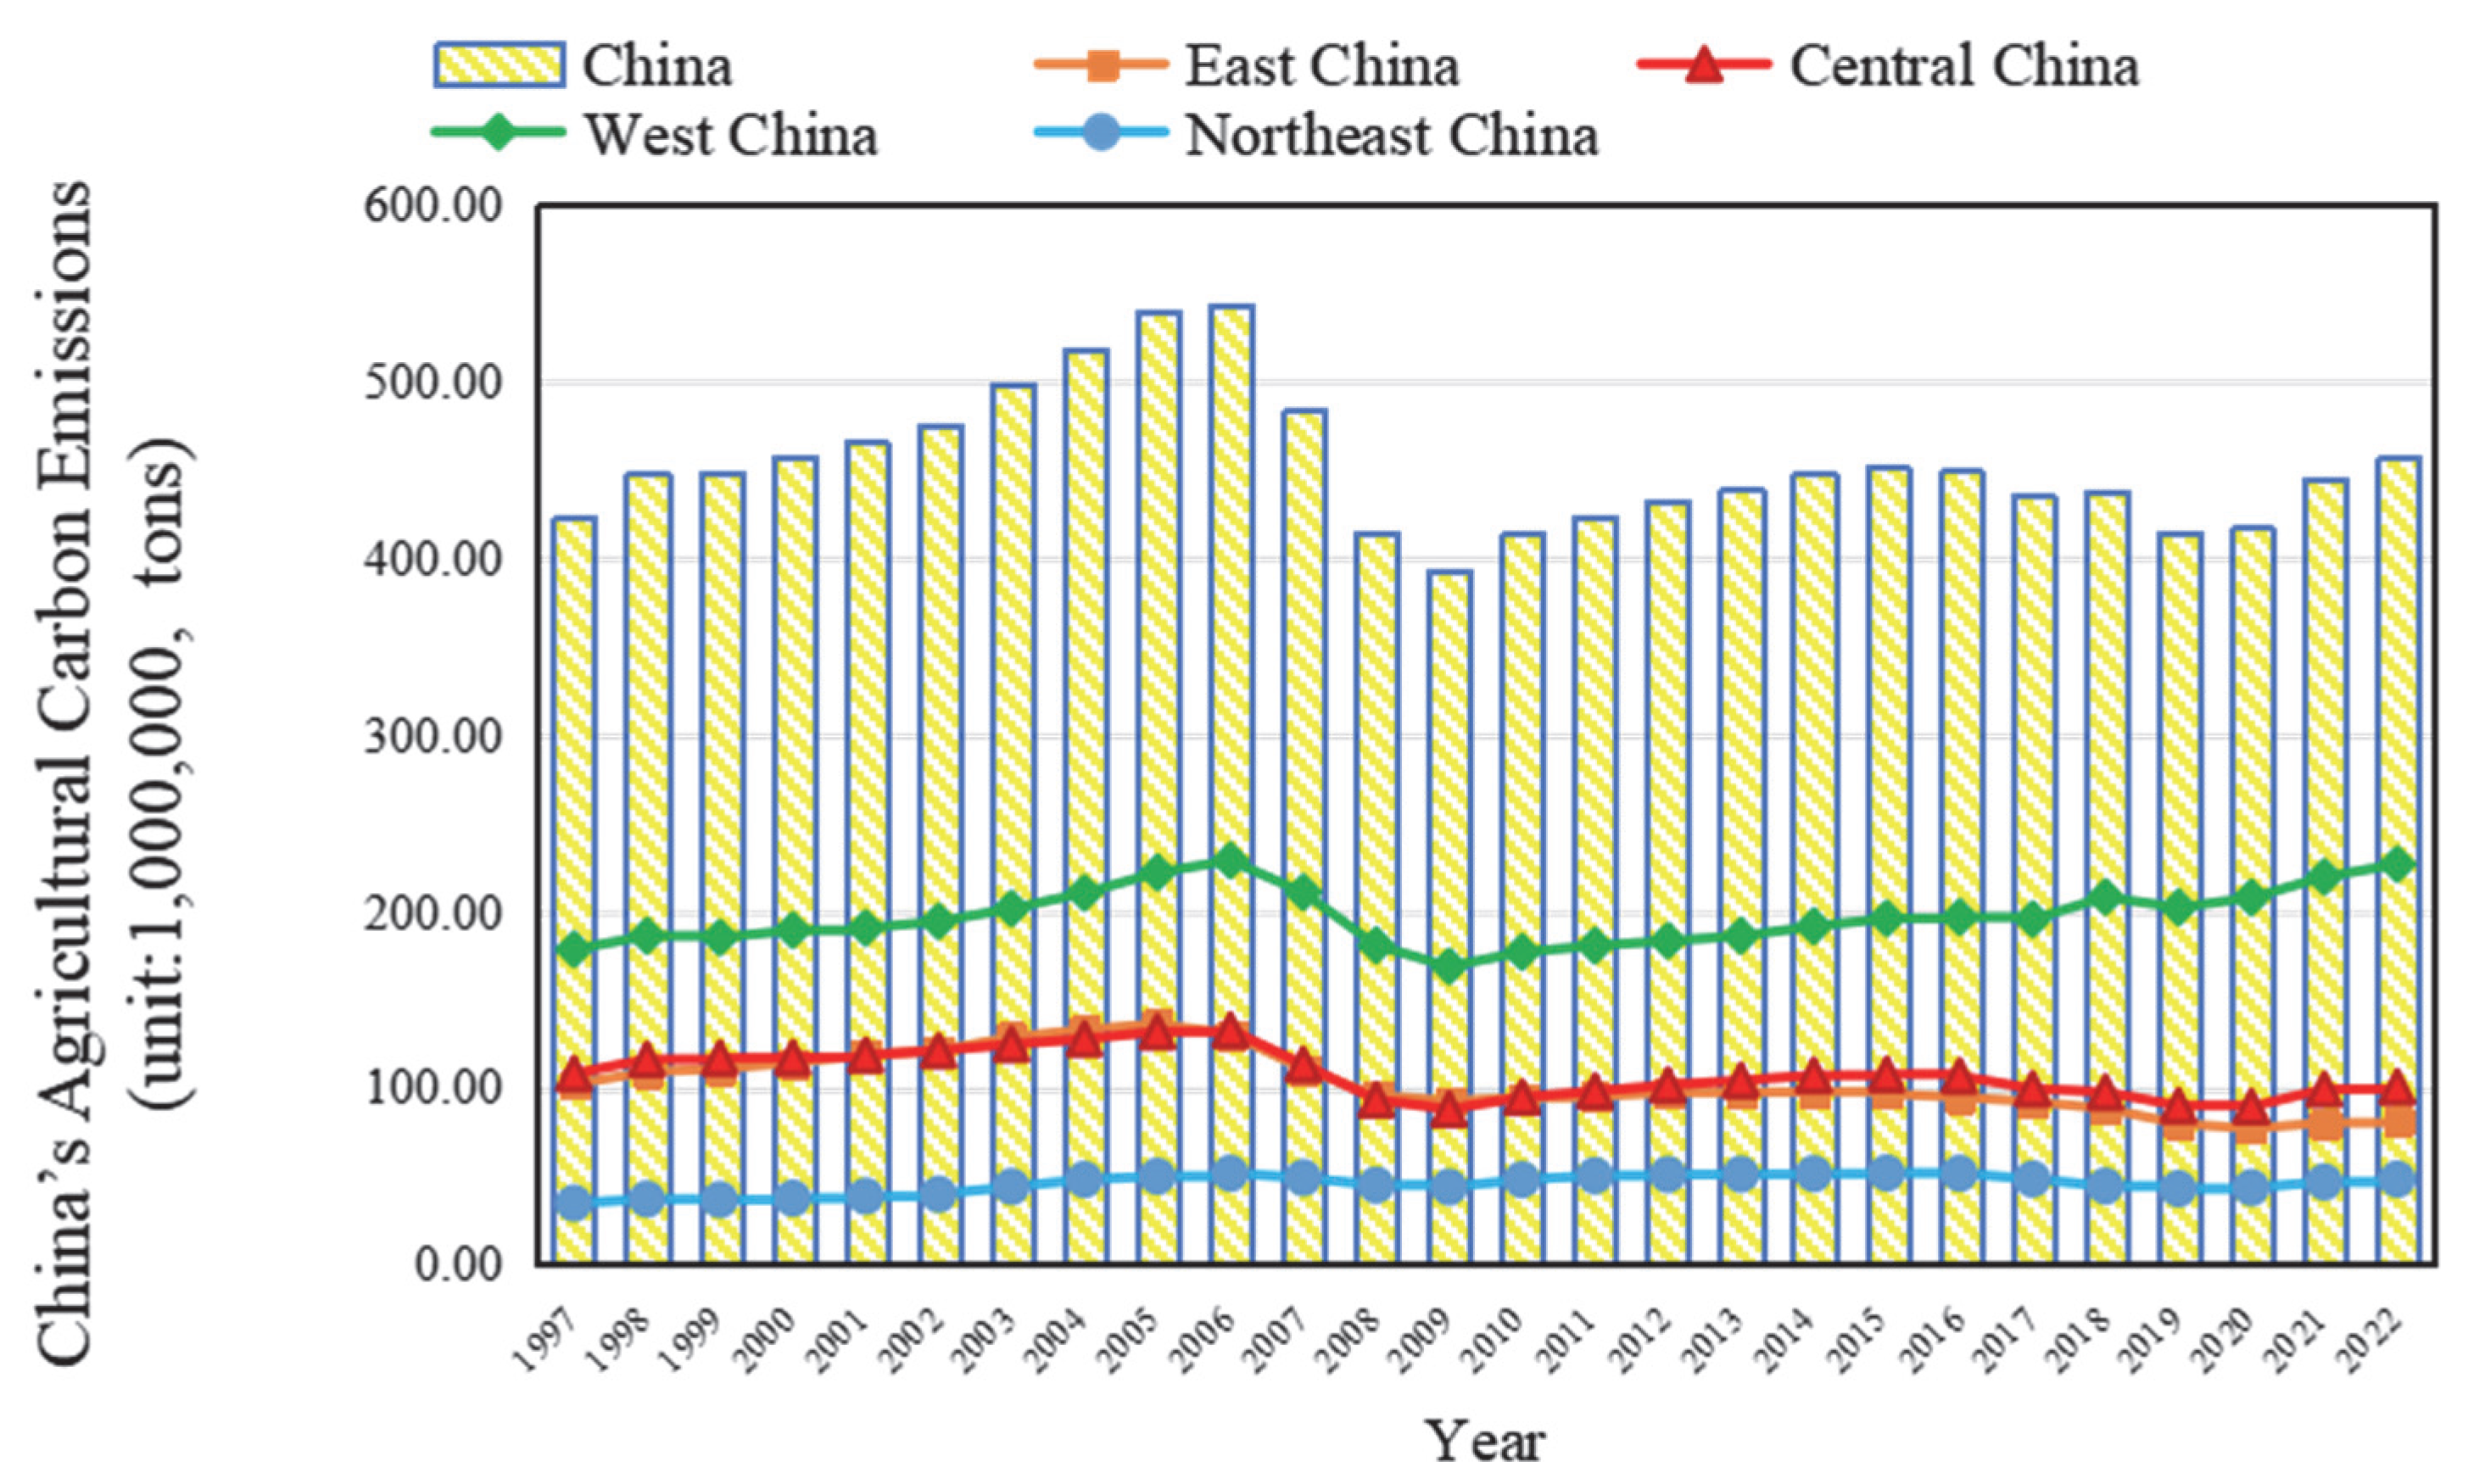
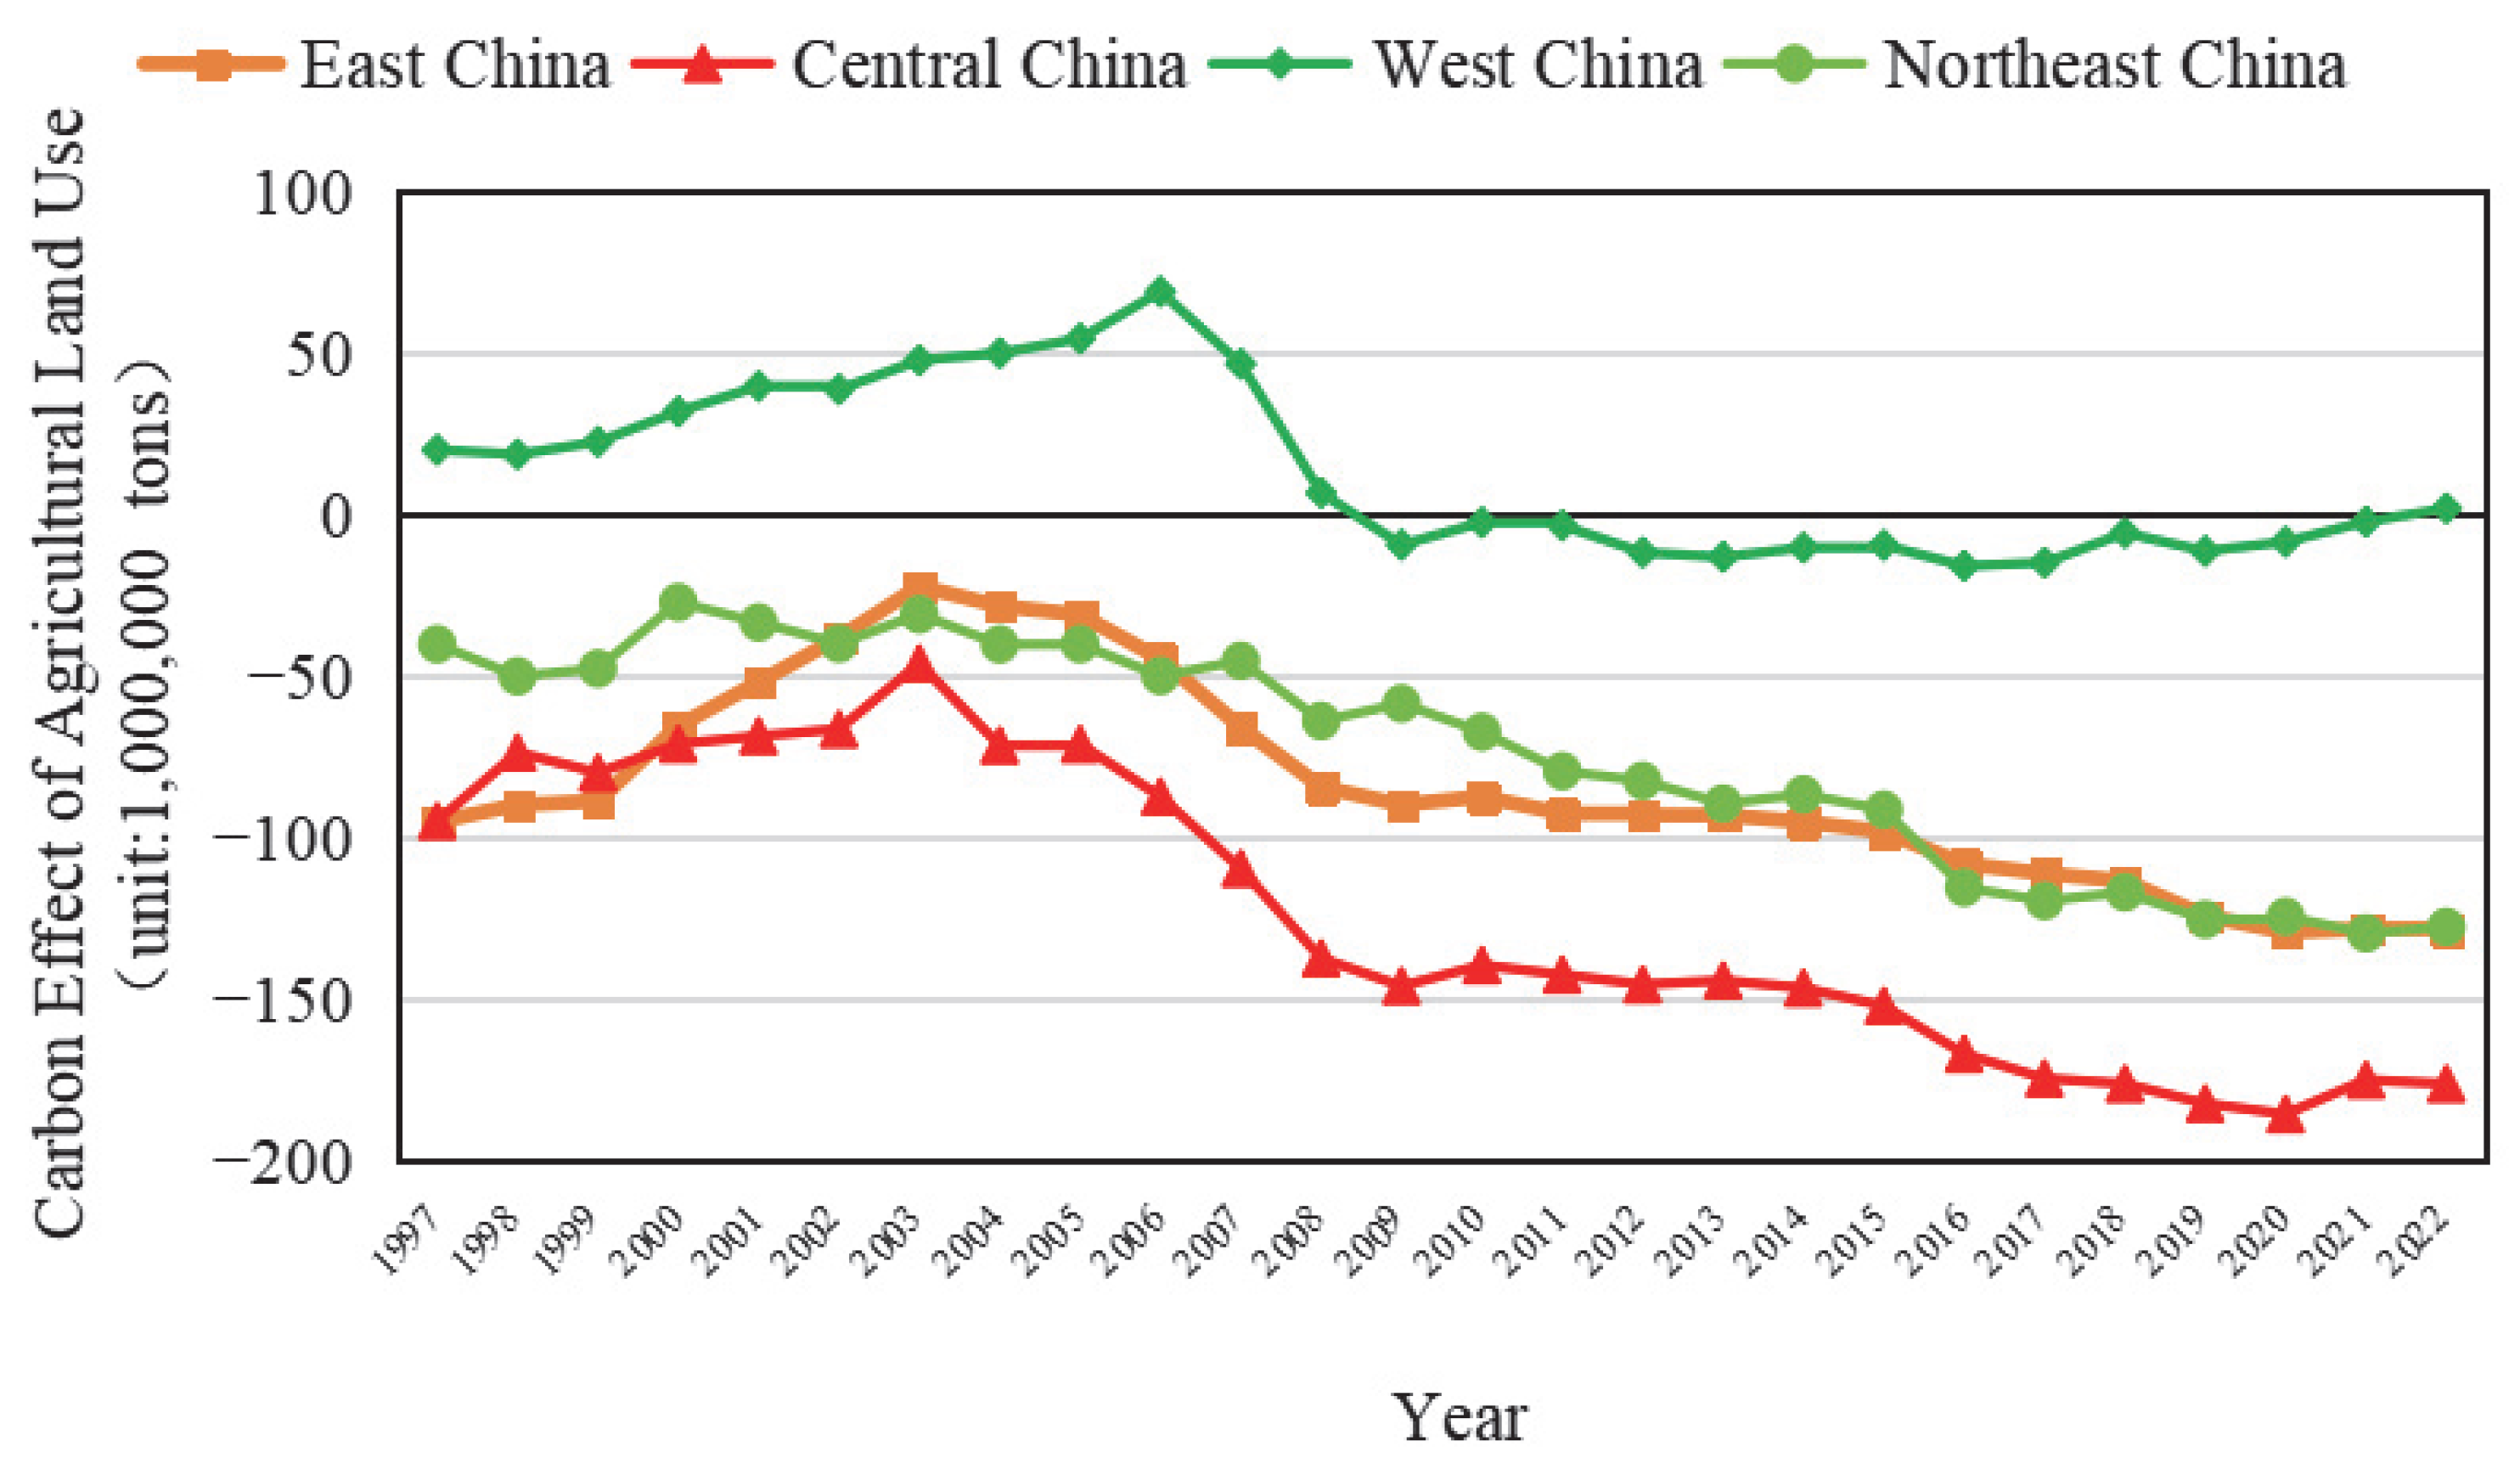
3.3. Carbon Effects from Agricultural Land Use in China
4. Discussion
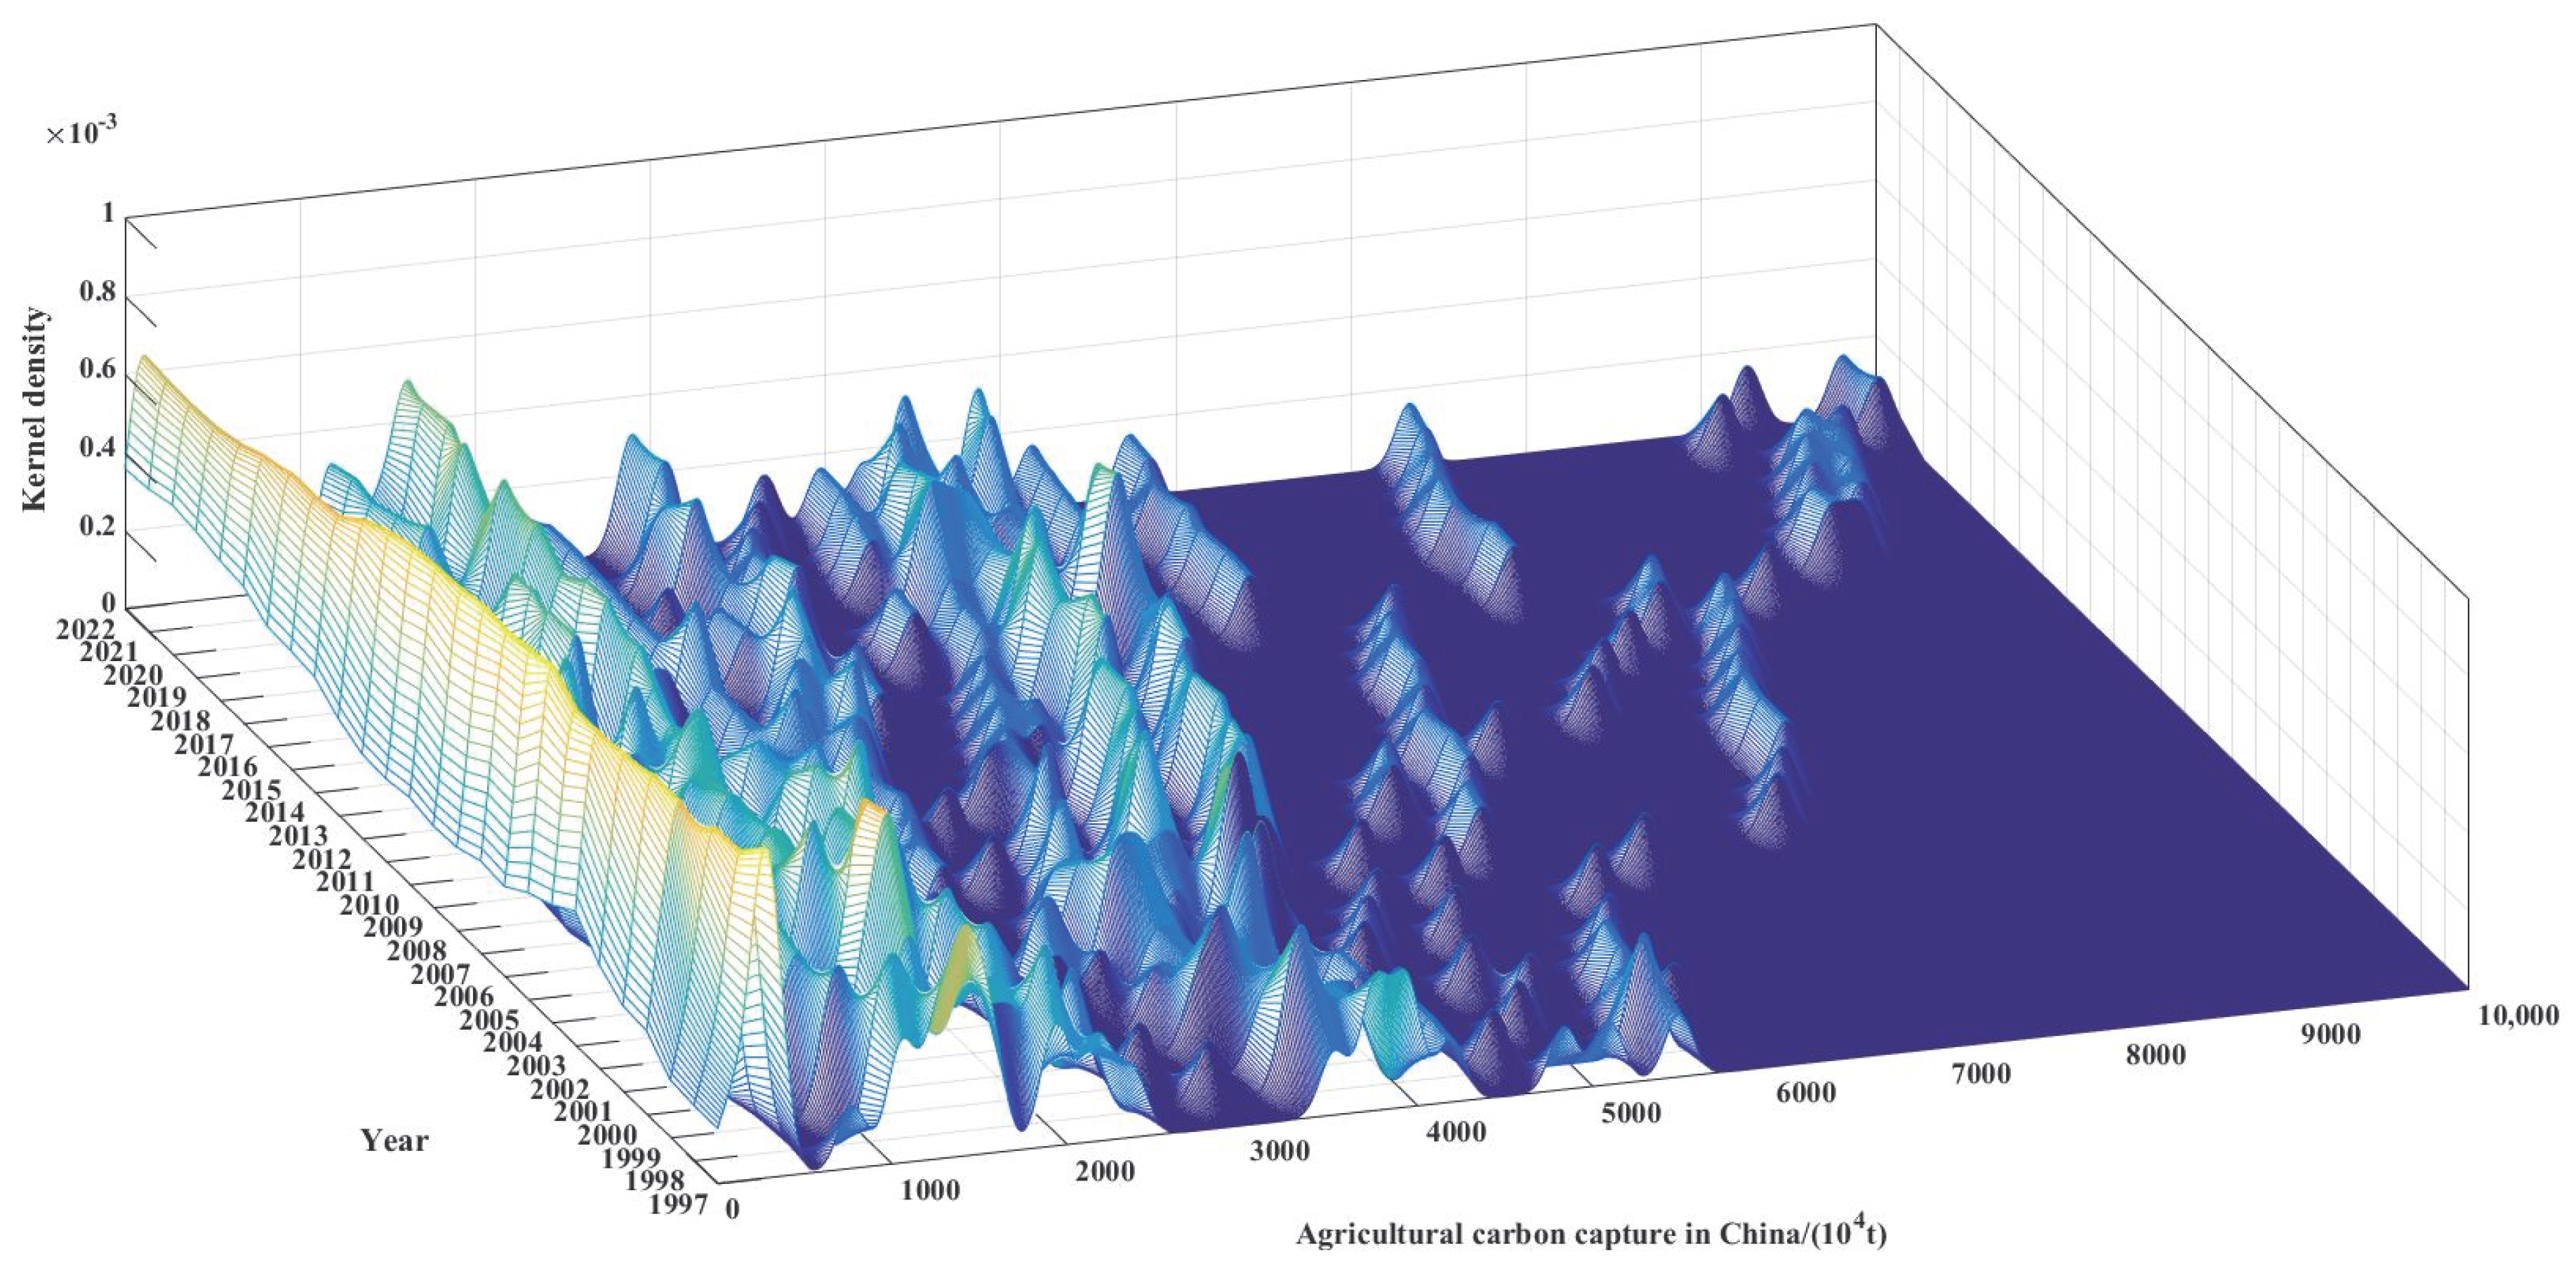
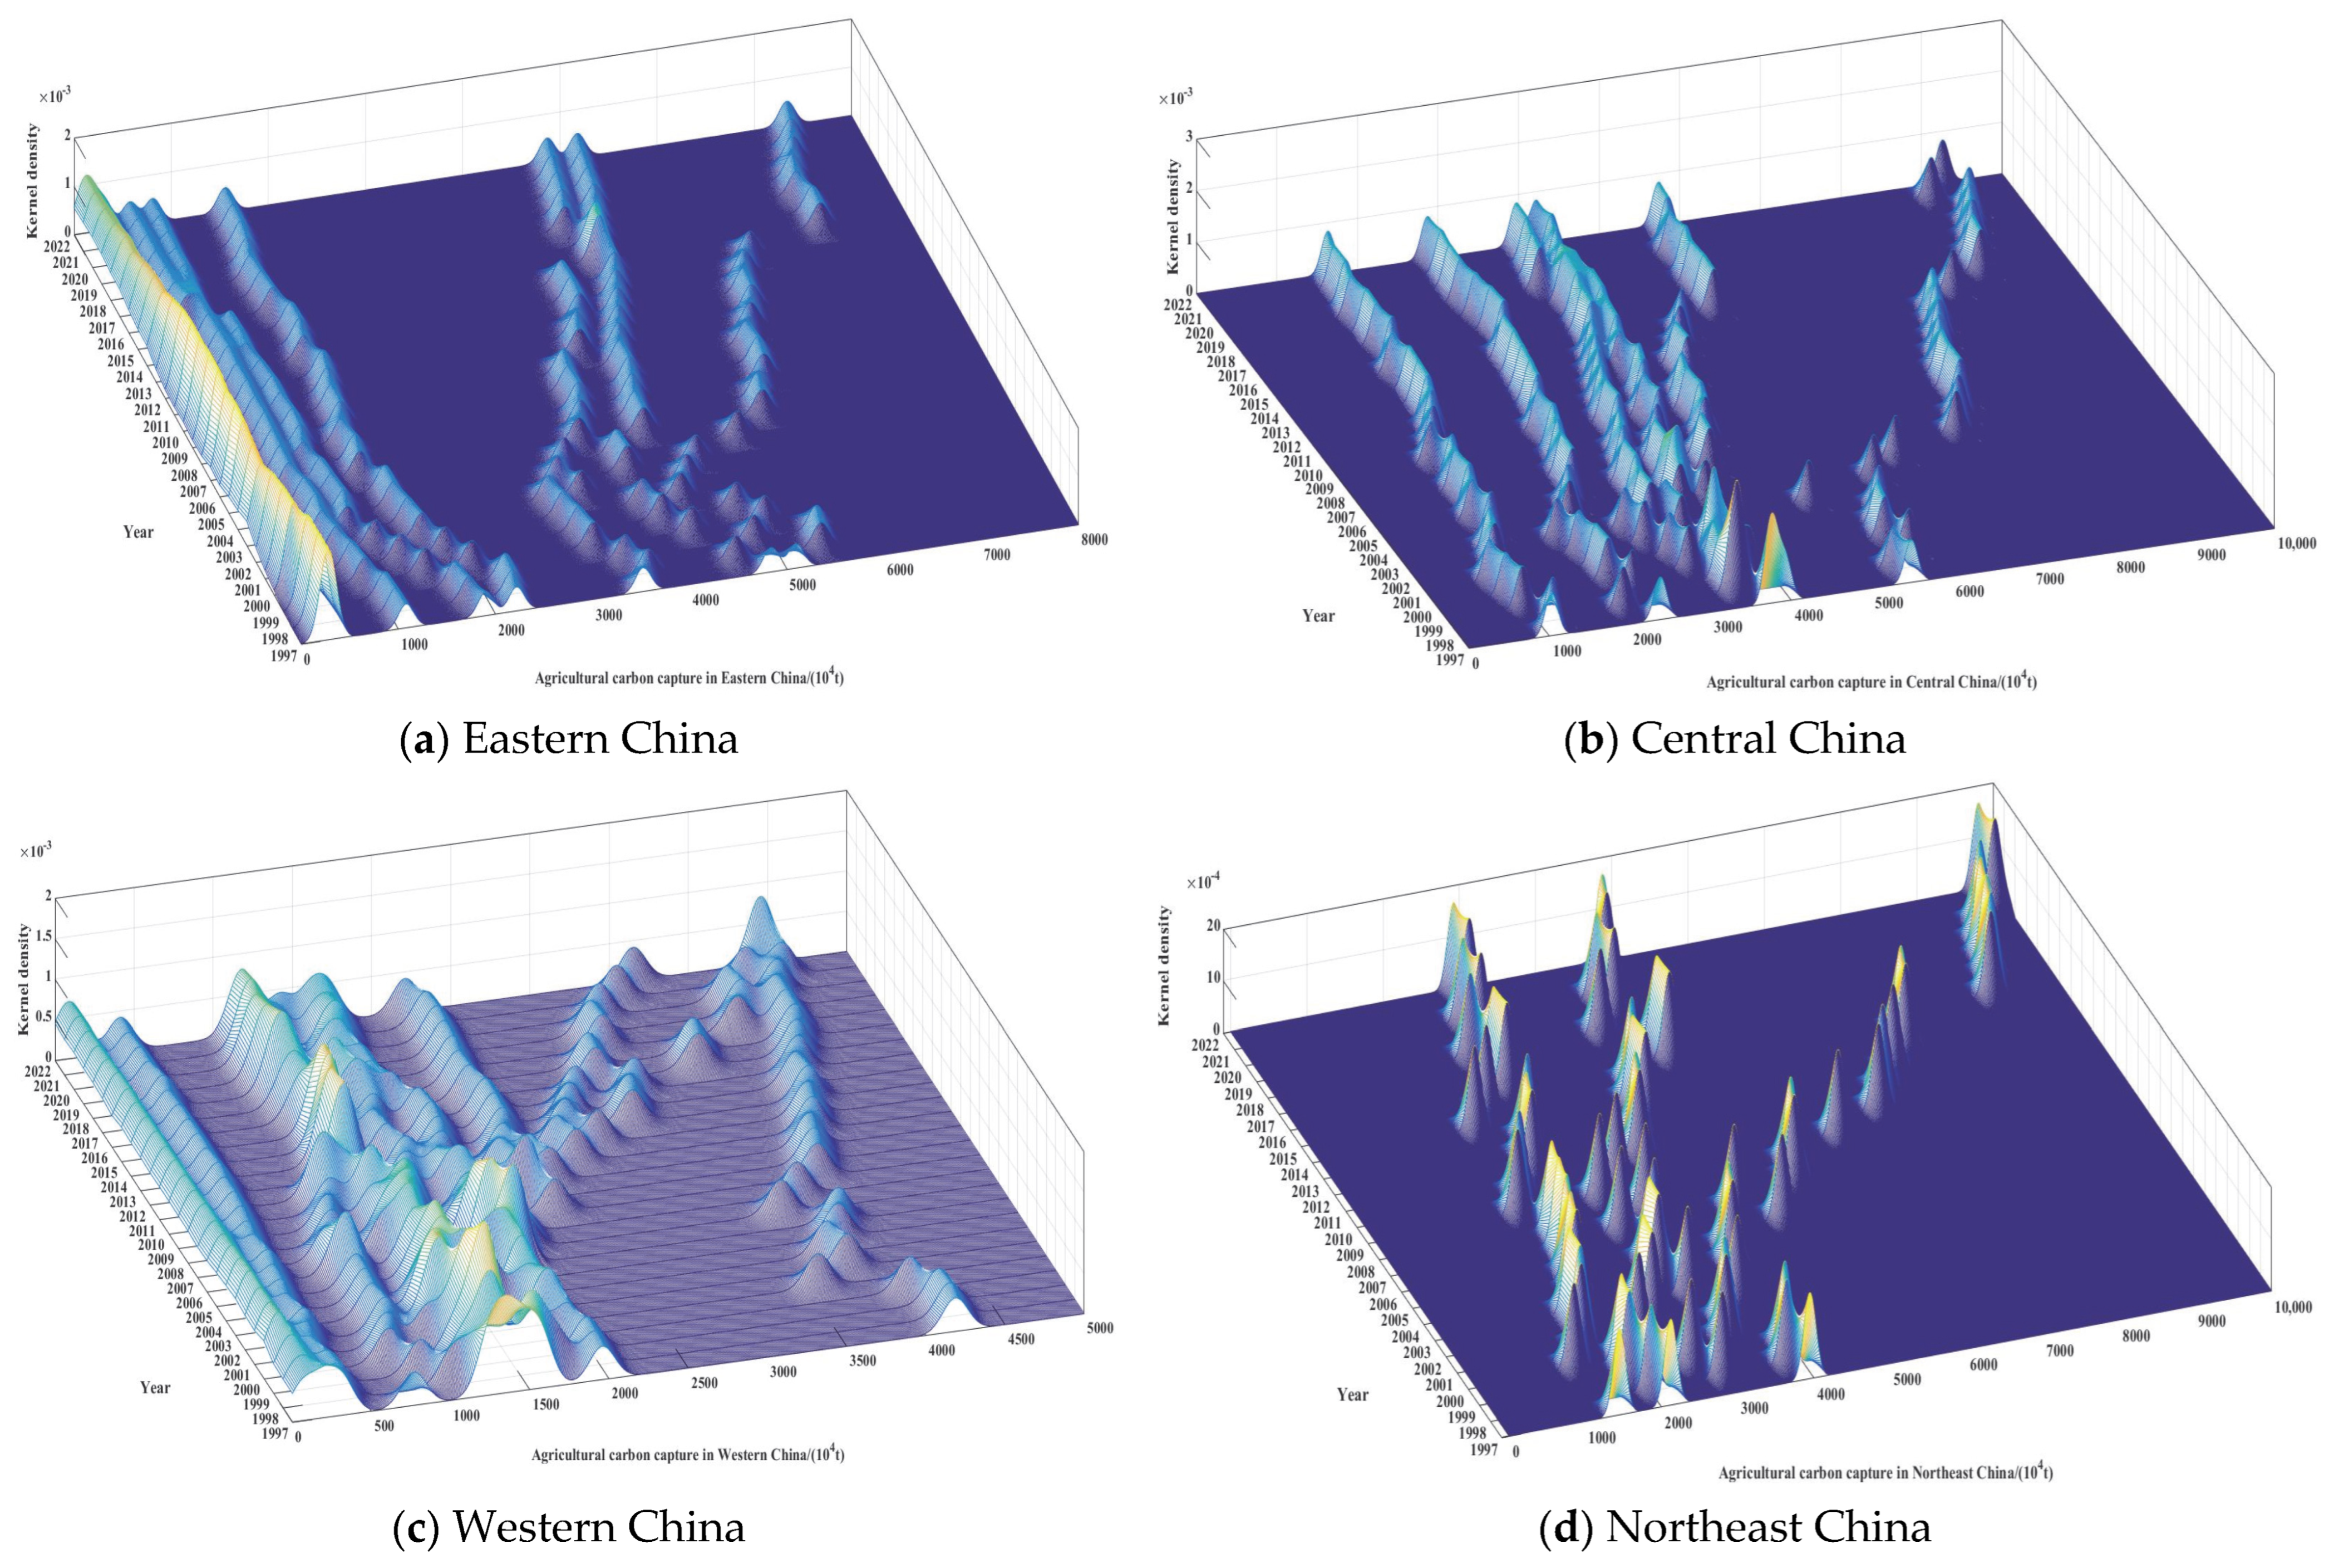
4.1. Regional Differences and Dynamic Evolution Path of Agricultural Carbon Capture
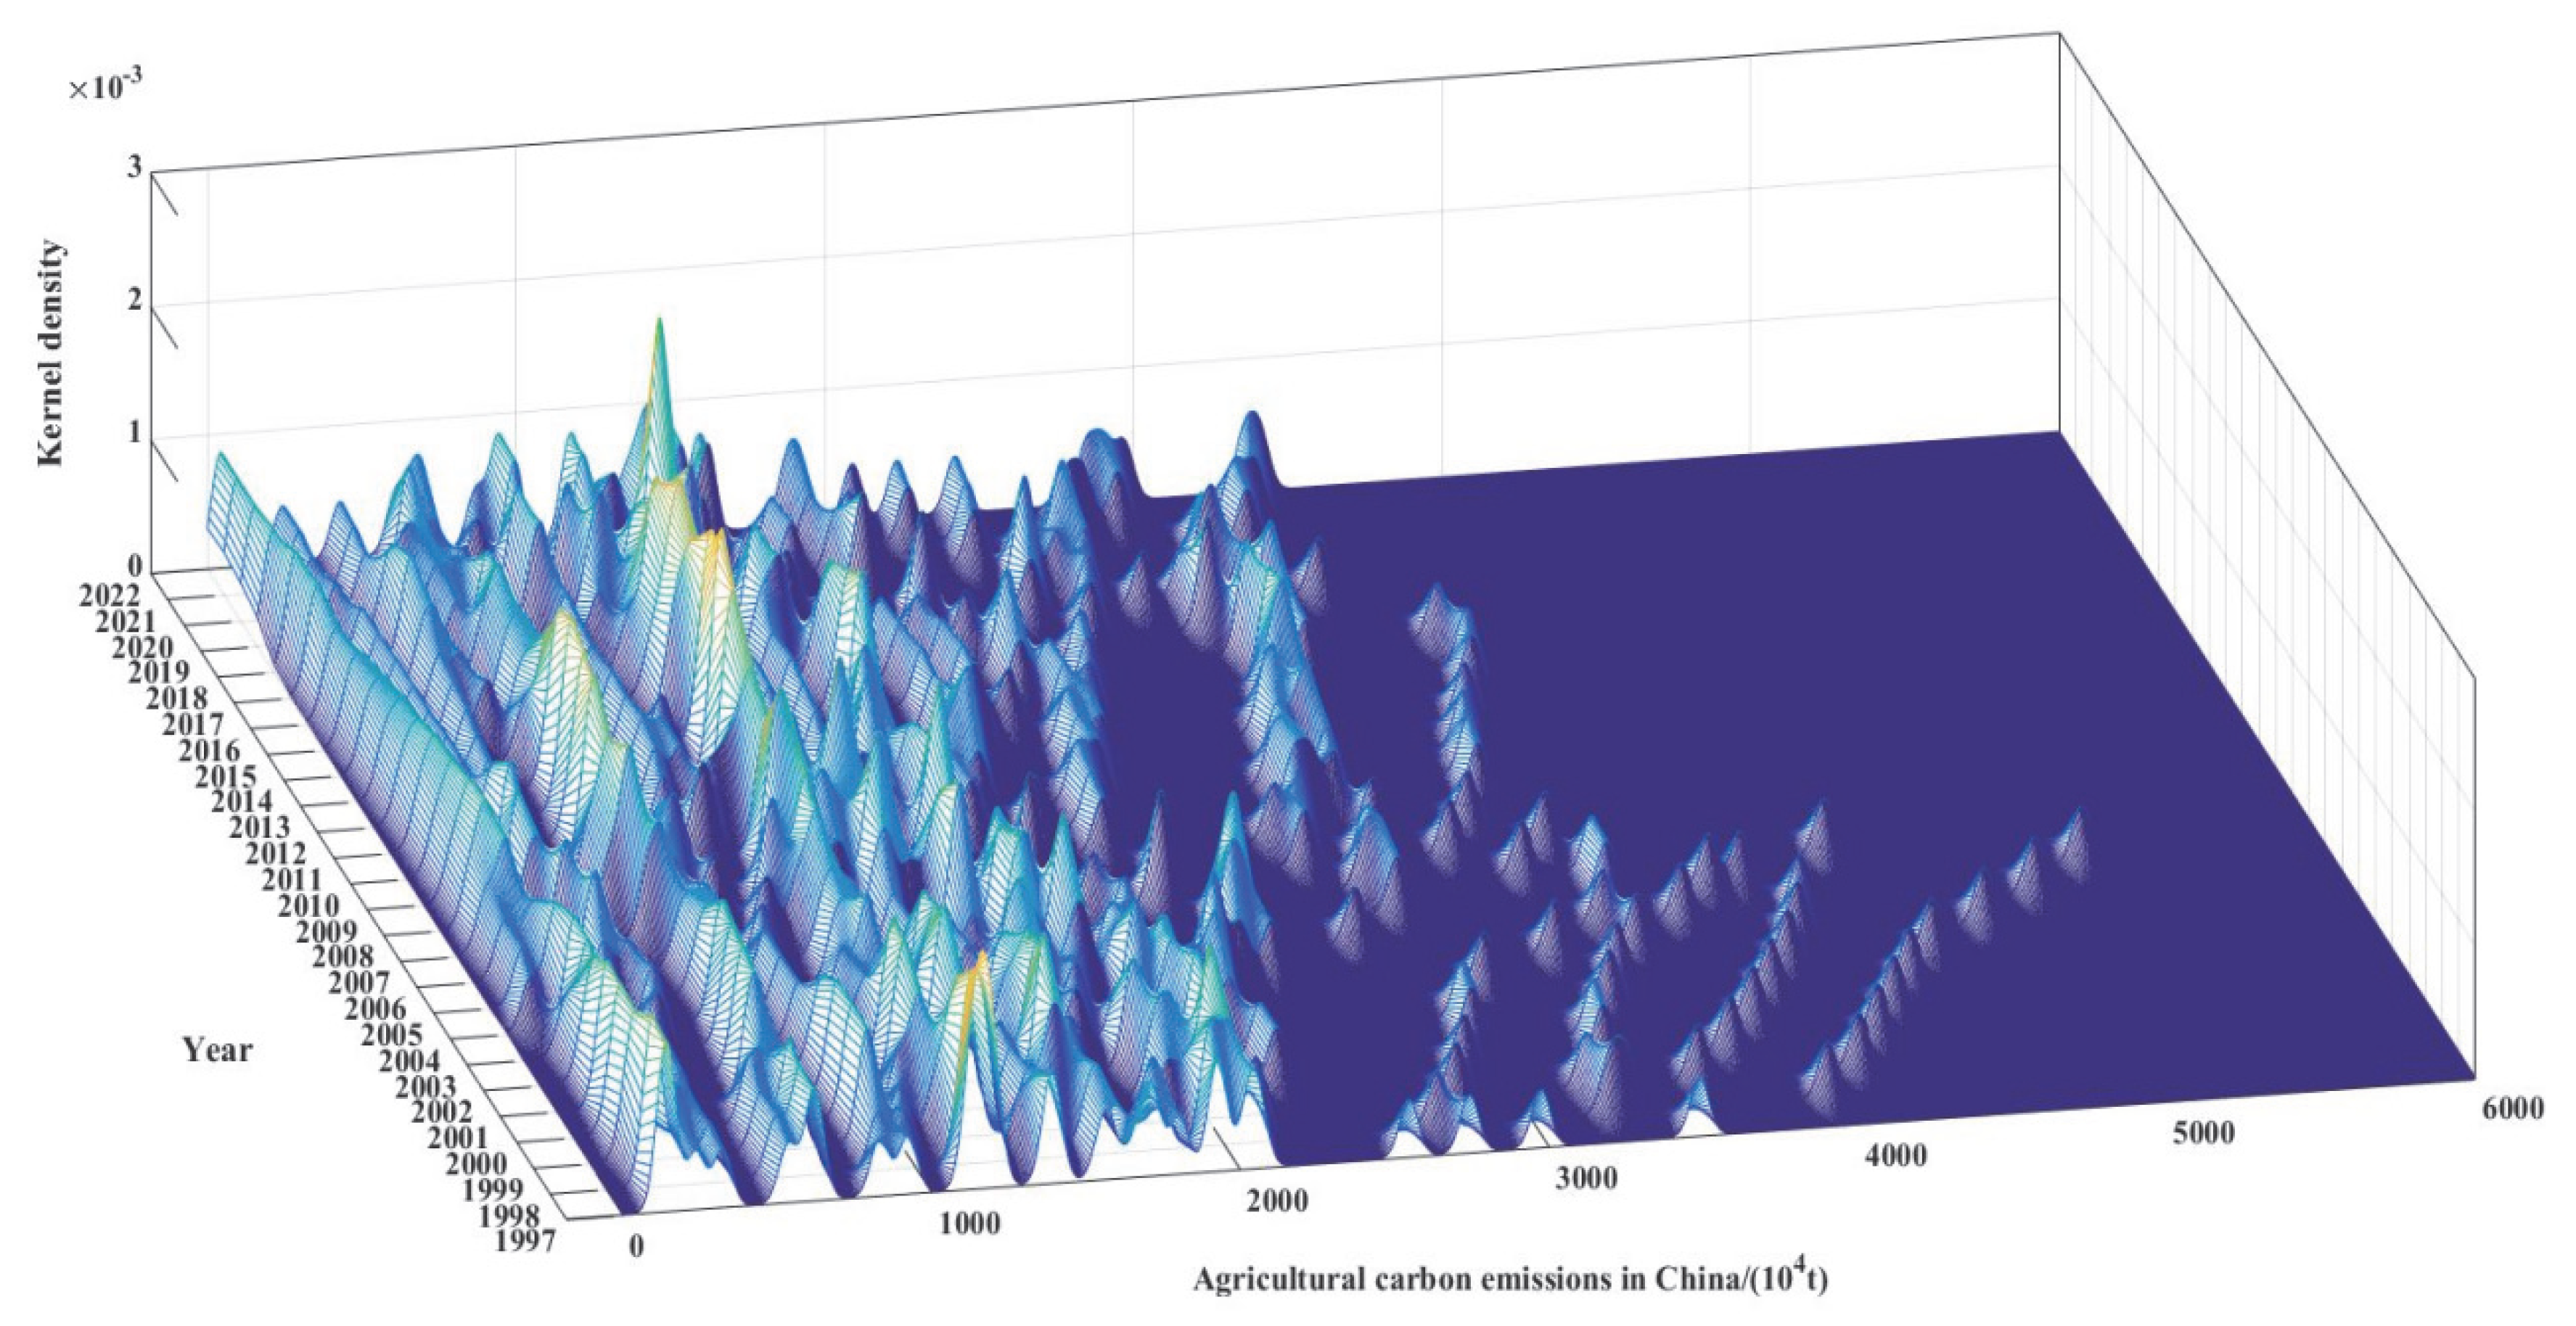
4.2. Spatial Distribution and Stability of Agricultural Carbon Emissions
4.3. Surplus–Deficit Dual Pattern of Agricultural Carbon Effects
5. Conclusions and Implications
6. Limitations and Reflection
Author Contributions
Funding
Institutional Review Board Statement
Informed Consent Statement
Data Availability Statement
Conflicts of Interest
References
- Liu, Z.; Deng, Z.; Davis, S.; Ciais, P. Monitoring global carbon emissions in 2022. Nat. Rev. Earth Environ. 2023, 4, 205–206. [Google Scholar] [CrossRef]
- Hua, H.; Chen, X.; Zhang, X. Carbon effects of land use transitions: A process-mechanism-future perspective. Earth Sci. Inform. 2025, 18, 354. [Google Scholar] [CrossRef]
- Mendelsohn, R.; Sohngen, B. The Net Carbon Emissions from Historic Land Use and Land Use Change. J. For. Econ. 2019, 34, 263–283. [Google Scholar] [CrossRef]
- Wang, N.; Chen, X.; Zhang, Y.; Pang, J.; Long, Z.; Chen, Y.; Zhang, Z. Integrated effects of land use and land cover change on carbon metabolism: Based on ecological network analysis. Environ. Impact Assess. Rev. 2024, 104, 107320. [Google Scholar] [CrossRef]
- Yue, X.; Zhou, H.; Cao, Y.; Liao, H.; Lu, X.; Yu, Z.; Yuan, W.; Liu, Z.; Lei, Y.; Sitch, S.; et al. Large potential of strengthening the land carbon sink in China through anthropogenic interventions. Sci. Bull. 2024, 69, 2622–2631. [Google Scholar] [CrossRef] [PubMed]
- Chang, X.; Xing, Y.-Q.; Wang, J.; Yang, H.; Gong, W. Effects of land use and cover change (LUCC) on terrestrial carbon stocks in China between 2000 and 2018. Resour. Conserv. Recycl. 2022, 182, 106333. [Google Scholar] [CrossRef]
- Wu, H.; Ding, B.; Liu, L.; Zhou, L.; Meng, Y.; Zheng, X. Have Agricultural Land-Use Carbon Emissions in China Peaked? An Analysis Based on Decoupling Theory and Spatial EKC Model. Land 2024, 13, 585. [Google Scholar] [CrossRef]
- Soimakallio, S.; Norros, V.; Aroviita, J.; Heikkinen, R.K.; Lehtoranta, S.; Myllyviita, T.; Pihlainen, S.; Sironen, S.; Toivonen, M. Choosing reference land use for carbon and biodiversity footprints. Int. J. Life Cycle Assess. 2025, 30, 54–65. [Google Scholar] [CrossRef]
- Qin, Z.; Zhu, Y.; Canadell, J.G.; Chen, M.; Li, T.; Mishra, U.; Yuan, W. Global spatially explicit carbon emissions from land-use change over the past six decades (1961–2020). One Earth. 2024, 7, 835–847. [Google Scholar] [CrossRef]
- Fu, S.; Xu, B.; Peng, Y.; Huangxiong, C.; Li, X. Carbon emission effects of land use change in Nanchang, West of Central China Region. Sci. Rep. 2025, 15, 4797. [Google Scholar] [CrossRef]
- Huang, Y.; Wang, Z.; Zhao, H.; You, D.; Wang, W.; Peng, Y. Spatial Association Network of Land-Use Carbon Emissions in Hubei Province: Network Characteristics, Carbon Balance Zoning, and Influencing Factors. Land 2025, 14, 1329. [Google Scholar] [CrossRef]
- Yu, Z.; Chen, L.; Tong, H.; Chen, L.; Zhang, T.; Li, L.; Yuan, L.; Xiao, J.; Wu, R.; Bai, L.; et al. Spatial correlations of land-use carbon emissions in the Yangtze River Delta region: A perspective from social network analysis. Ecol. Indic. 2022, 142, 109147. [Google Scholar] [CrossRef]
- Li, W.; Chen, Z.; Li, M.; Zhang, H.; Li, M.; Qiu, X.; Zhou, C. Carbon emission and economic development trade-offs for optimizing land-use allocation in the Yangtze River Delta, China. Ecol. Indic. 2023, 147, 109950. [Google Scholar] [CrossRef]
- Li, Y.; Peng, Y.-L.; Cheng, W.-Y.; Peng, H.-N. Spatial-temporal evolution and multi-scenario prediction of carbon emissions from land use in the adjacent areas of nature reserves. Ecol. Indic. 2025, 170, 113047. [Google Scholar] [CrossRef]
- Pan, Y.; Zhang, H.; Wang, C.; Zhou, Y. Impact of land use change on regional carbon sink capacity: Evidence from Sanmenxia, China. Ecol. Indic. 2023, 156, 111189. [Google Scholar] [CrossRef]
- Winkler, K.; Yang, H.; Ganzenmüller, R.; Fuchs, R.; Ceccherini, G.; Duveiller, G.; Grassi, G.; Pongratz, J.; Bastos, A.; Shvidenko, A.; et al. Changes in land use and management led to a decline in Eastern Europe’s terrestrial carbon sink. Commun. Earth Environ. 2023, 4, 237. [Google Scholar] [CrossRef]
- Jiao, F.; Xu, X.; Xue, P.; Gong, H.; Liu, X.; Liu, J.; Zhang, K.; Yang, Y.; Qiu, J.; Zou, C. Land carbon sink function variation across bedrock types in Southwest China. J. Environ. Manag. 2025, 374, 124030. [Google Scholar] [CrossRef]
- Hu, Y.; Jiang, P.; Li, M. The impact of agricultural land use change on agricultural GHG emissions in China. Environ. Earth Sci. 2024, 83, 61. [Google Scholar] [CrossRef]
- Rehman, A.; Ma, H.; Khan, M.K.; Khan, S.U.; Murshed, M.; Ahmad, F.; Mahmood, H. The asymmetric effects of crops productivity, agricultural land utilization, and fertilizer consumption on carbon emissions: Revisiting the carbonization-agricultural activity nexus in Nepal. Environ. Sci. Pollut. Res. 2022, 29, 39827–39837. [Google Scholar] [CrossRef]
- Li, S.; Liu, Y.; Wei, G.; Bi, M.; He, B.-J. Carbon surplus or carbon deficit under land use transformation in China? Land Use Policy 2024, 143, 107218. [Google Scholar] [CrossRef]
- Quan, T.; Zhang, H.; Quan, T.; Yu, Y. China’s agricultural land transfer: Carbon emissions driver or opportunity? The pivotal role of rural human capital revealed. Front. Sustain. Food Syst. 2024, 8, 1480636. [Google Scholar] [CrossRef]
- Wang, Y.; Zhang, T.; Wang, X.; Jiang, B.; Wu, X.; Huang, X. Urbanization and Agricultural Carbon Emissions:the Mediation Effect of Agricultural Land Use Change. Pol. J. Environ. Stud. 2024, 33, 3927–3939. [Google Scholar] [CrossRef]
- Chen, Z.; Tang, C.; Liu, B.; Liu, P.; Zhang, X. Can socialized services reduce agricultural carbon emissions in the context of appropriate scale land management? Front. Environ. Sci. 2022, 10, 1039760. [Google Scholar] [CrossRef]
- IPCC. 2006 IPCC Guidelines for National Greenhouse Gas Inventories; IPCC: Geneva, Switzerland, 2006; IGES.2006. [Google Scholar]
- Zhang, X.; Liu, C.; Zhang, J.; Liu, J.; Hu, W. Evolution Trends in Carbon Emissions and Sustainable Development Paths in China’s Planting Industry from the Perspective of Carbon Sources. Sustainability 2025, 17, 2772. [Google Scholar] [CrossRef]
- Liu, C.; Hsu, C.-Y.; Agrawal, M.K.; Zhang, J.; Ahmad, S.F.; Seikh, A.H.; Mohanavel, V.; Chauhdary, S.T.; Chi, F. Design and thermo-enviro-economic analyses of an innovative environmentally friendly trigeneration process fueled by biomass feedstock integrated with a post-combustion CO2 capture unit. J. Clean. Prod. 2024, 443, 141137. [Google Scholar] [CrossRef]
- Zhang, X.; Zhang, J.; Wang, H. Resilient recovery strategies: Enhancing resiliency in natural resource markets for sustainable development. Resour. Policy. 2024, 90, 104612. [Google Scholar] [CrossRef]
- Zhao, H.; Jia, X.; Yang, J.; Wu, Y.; Wu, X.; Du, L. Spatiotemporal variations and influencing factors of methane emissions from livestock in China: A spatial econometric analysis. Sci. Total Environ. 2024, 931, 173010. [Google Scholar] [CrossRef] [PubMed]
- Zhang, J.; Peng, X.; Zhang, J.; Liu, J.; Hu, W. Stage characteristics, spatial differences and dynamic evolution of crop carbon sink in Hubei Province based on the crop data from 1997 to 2022. J. Environ. Eng. Technol. 2024, 14, 1513–1522. [Google Scholar]
- Kong, J.; Li, Y. Spatio-temporal variations in carbon sources, sinks and footprints of cropland ecosystems in the Middle and Lower Yangtze River Plain of China, 2013–2022. Sci. Rep. 2025, 15, 16225. [Google Scholar] [CrossRef] [PubMed]
- Hao, X. Spatiotemporal Variation of Carbon Source/ in Agricultural Ecosystem Based on Carbon Footprint in Heilongjiang Land Reclamation Areas. Chinese J. Agric. Resour. Reg. Plan. 2022, 43, 64–73. [Google Scholar]
- Liu, J.; Peng, X.; Huang, M.; Ma, Y.; Jiang, C.; Hu, W.; Zhang, J. Identification and Forecasting of Key Influencing Factors in China’s Agricultural Carbon Emissions: Based on Machine Learning. Method. Syst. 2025, 13, 554. [Google Scholar] [CrossRef]
- Zha, Q.; Liu, Z.; Song, Z.; Wang, J. A study on dynamic evolution, regional differences and convergence of high-quality economic development in urban agglomerations: A case study of three major urban agglomerations in the Yangtze river economic belt. Front. Environ. Sci. 2022, 10, 1012304. [Google Scholar] [CrossRef]
- Lv, C.; Bian, B.; Lee, C.-C.; He, Z. Regional gap and the trend of green finance development in China. Energy Econ. 2021, 102, 105476. [Google Scholar] [CrossRef]
- Li, J.; Liu, J. Comprehensive Measures, Regional Differences, and Dynamic Evolution of e-Commerce Level in China Based on the e-Commerce Data of 31 Provinces From 2013 to 2021. Discret. Dyn. Nat. Soc. 2025, 2791558. [Google Scholar] [CrossRef]
- Chen, P.; Rao, M.; Vasa, L.; Xu, Y.; Zhao, X. Spatial effects and heterogeneity analysis of the impact of environmental taxes on carbon emissions in China. Heliyon 2023, 9, e21393. [Google Scholar] [CrossRef]
- Wen, T.; Sun, P.X.; Zhang, L. Dynamic evolution and regional pattern of agricultural carbon emissions in China. Econ. Geogr. 2024, 44, 165–175. [Google Scholar]
- Liu, K.; Song, Y.; Du, S.; Xiao, H.; Chen, C.; Xu, J.; Dai, H.; Fang, N. Spatiotemporal patterns and drivers of soil organic carbon in key black soil region of northeast China. PLoS ONE 2025, 20, e0320784. [Google Scholar]
- Liang, G.; Stefanski, A.; Eddy, W.C.; Bermudez, R.; Montgomery, R.A.; Hobbie, S.E.; Rich, R.L.; Reich, P.B. Soil respiration response to decade-long warming modulated by soil moisture in a boreal forest. Nat. Geosci. 2024, 9, 905–911. [Google Scholar] [CrossRef]
- Yang, Y.; Yang, M.; Zhao, B.; Lu, Z.; Sun, X.; Zhang, Z. Spatially explicit carbon emissions from land use change: Dynamics and scenario simulation in the Beijing-Tianjin-Hebei urban agglomeration. Land Use Policy 2025, 150, 107473. [Google Scholar] [CrossRef]
- Zhu, X.; Shao, X. Spatiotemporal evolution of agricultural carbon emissions intensity in China and analysis of influencing factors. Sci. Rep. 2025, 15, 19202. [Google Scholar] [CrossRef]
- Feng, Y.; Wu, Q.; Wang, J.; Shao, Z.; Zhang, C. Impact of the agglomeration of urban construction land on its utilization efficiency in China: Mechanism, spatial effect, and group difference. Chin. Popul. Resour. Environ. 2022, 32, 97–106. [Google Scholar]
- Zhang, F.; Xuan, X.; Jin, G.; Wu, F. Agricultural sources of non-carbon dioxide greenhouse gas emissions and scenario simulation. Acta Geogr. Sin. 2023, 78, 35–53. [Google Scholar]
- Shangguan, Z. Investigating the spatiotemporal dynamics and interplay mechanisms between population urbanization and carbon dioxide emissions in China. J. Geochem. Explor. 2024, 266, 107571. [Google Scholar] [CrossRef]
- Batista, A.M.; Gomes, L.E.d.S.; Pazianotto, R.A.A.; Alves, B.J.R.; Hernandes, T.A.D.; de Mendonça, G.C.; do Amaral, D.R.; Savioli, J.P.P.d.D.P.; Bayma, G.; Garofalo, D.F.T.; et al. Carbon stocks and CO2 emissions uncertainties associated with agricultural land use change in Brazil. J. Clean. Prod. 2025, 524, 146494. [Google Scholar] [CrossRef]
| Carbon Sources | Emission Factors of CH4 | Emission Factors of N2O | |
|---|---|---|---|
| Gastrointestinal Fermentation | Fecal Fermentation | ||
| Pigs | 1.000 kg per animal per year | 3.500 kg per animal per year | 0.530 kg per animal per year |
| Rabbits | 0.254 kg per animal per year | 0.080 kg per animal per year | 0.020 kg per animal per year |
| Poultry | 0 kg per animal per year | 0.020 kg per animal per year | 0.020 kg per animal per year |
| Cows | 68.000 kg per animal per year | 16.000 kg per animal per year | 1.000 kg per animal per year |
| Other cattle | 51.400 kg per animal per year | 1.500 kg per animal per year | 1.370 kg per animal per year |
| Horses | 18.000 kg per animal per year | 1.640 kg per animal per year | 1.390 kg per animal per year |
| Donkeys | 10.000 kg per animal per year | 0.900 kg per animal per year | 1.390 kg per animal per year |
| Mules | 10.000 kg per animal per year | 0.900 kg per animal per year | 1.390 kg per animal per year |
| Goats | 5.000 kg per animal per year | 0.170 kg per animal per year | 0.330 kg per animal per year |
| Sheep | 5.000 kg per animal per year | 0.150 kg per animal per year | 0.330 kg per animal per year |
| Camels | 46.000 kg per animal per year | 1.920 kg per animal per year | 1.390 kg per animal per year |
| Crops | Carbon Absorption Rate | Moisture Content | Economic Coefficient | Root-to-Shoot Ratio |
|---|---|---|---|---|
| Corn | 0.471 | 0.13 | 0.4 | 0.16 |
| Rice plant | 0.414 | 0.12 | 0.45 | 0.6 |
| Wheat | 0.485 | 0.12 | 0.4 | 0.4 |
| Legume | 0.45 | 0.13 | 0.35 | 0.13 |
| Tubers | 0.423 | 0.7 | 0.7 | 0.18 |
| Oilseeds | 0.45 | 0.09 | 0.25 | 0.04 |
| Cotton | 0.45 | 0.08 | 0.19 | 0.1 |
| Tobacco | 0.45 | 0.17 | 0.55 | 0.32 |
| Fiber crops | 0.45 | 0.13 | 0.1 | 0.4 |
| Year | Overall | Inner-Regional | Inter-Regional | Intensity of Transvariation | Contributions | ||
|---|---|---|---|---|---|---|---|
| Inner- Regional | Inter- Regional | Intensity of Transvariation | |||||
| 1997 | 0.432 | 0.104 | 0.196 | 0.131 | 24.130 | 45.478 | 30.391 |
| 1998 | 0.416 | 0.103 | 0.178 | 0.135 | 24.702 | 42.921 | 32.376 |
| 1999 | 0.432 | 0.105 | 0.190 | 0.137 | 24.407 | 43.935 | 31.658 |
| 2000 | 0.438 | 0.110 | 0.180 | 0.149 | 24.994 | 41.047 | 33.959 |
| 2001 | 0.436 | 0.106 | 0.193 | 0.137 | 24.364 | 44.294 | 31.341 |
| 2002 | 0.434 | 0.105 | 0.193 | 0.136 | 24.141 | 44.556 | 31.304 |
| 2003 | 0.425 | 0.105 | 0.176 | 0.144 | 24.761 | 41.379 | 33.860 |
| 2004 | 0.436 | 0.103 | 0.203 | 0.131 | 23.526 | 46.489 | 29.985 |
| 2005 | 0.441 | 0.105 | 0.197 | 0.139 | 23.766 | 44.671 | 31.563 |
| 2006 | 0.464 | 0.106 | 0.227 | 0.132 | 22.737 | 48.913 | 28.350 |
| 2007 | 0.462 | 0.107 | 0.221 | 0.135 | 23.067 | 47.760 | 29.173 |
| 2008 | 0.462 | 0.106 | 0.221 | 0.136 | 22.830 | 47.716 | 29.454 |
| 2009 | 0.463 | 0.107 | 0.215 | 0.141 | 23.083 | 46.455 | 30.462 |
| 2010 | 0.465 | 0.106 | 0.220 | 0.140 | 22.694 | 47.243 | 30.063 |
| 2011 | 0.468 | 0.105 | 0.229 | 0.133 | 22.507 | 49.046 | 28.447 |
| 2012 | 0.463 | 0.104 | 0.223 | 0.135 | 22.545 | 48.189 | 29.266 |
| 2013 | 0.466 | 0.105 | 0.226 | 0.136 | 22.543 | 48.374 | 29.084 |
| 2014 | 0.471 | 0.106 | 0.223 | 0.142 | 22.564 | 47.352 | 30.084 |
| 2015 | 0.473 | 0.107 | 0.226 | 0.140 | 22.519 | 47.786 | 29.695 |
| 2016 | 0.490 | 0.107 | 0.243 | 0.139 | 21.923 | 49.643 | 28.434 |
| 2017 | 0.494 | 0.108 | 0.246 | 0.140 | 21.926 | 49.750 | 28.324 |
| 2018 | 0.496 | 0.111 | 0.238 | 0.147 | 22.366 | 47.953 | 29.682 |
| 2019 | 0.498 | 0.111 | 0.242 | 0.144 | 22.325 | 48.674 | 29.001 |
| 2020 | 0.498 | 0.112 | 0.240 | 0.146 | 22.413 | 48.247 | 29.341 |
| 2021 | 0.495 | 0.111 | 0.240 | 0.144 | 22.366 | 48.548 | 29.086 |
| 2022 | 0.495 | 0.111 | 0.238 | 0.146 | 22.452 | 48.062 | 29.486 |
| Average | 0.462 | 0.107 | 0.216 | 0.139 | 23.140 | 46.711 | 30.149 |
| t | t + 1 | |||
|---|---|---|---|---|
| Ⅰ | II | III | IV | |
| Ⅰ | 0.990 | 0.010 | 0 | 0 |
| II | 0.010 | 0.954 | 0.036 | 0 |
| III | 0 | 0.025 | 0.904 | 0.071 |
| IV | 0 | 0 | 0.053 | 0.947 |
| Year | Overall | Inner-Regional | Inter-Regional | Intensity of Transvariation | Contributions | ||
|---|---|---|---|---|---|---|---|
| Inner- Regional | Inter- Regional | Intensity of Transvariation | |||||
| 1997 | 0.345 | 0.093 | 0.117 | 0.135 | 26.889 | 33.838 | 39.273 |
| 1998 | 0.356 | 0.097 | 0.117 | 0.143 | 27.100 | 32.778 | 40.122 |
| 1999 | 0.368 | 0.100 | 0.115 | 0.153 | 27.279 | 31.216 | 41.505 |
| 2000 | 0.371 | 0.102 | 0.110 | 0.159 | 27.434 | 29.586 | 42.980 |
| 2001 | 0.368 | 0.101 | 0.104 | 0.163 | 27.510 | 28.153 | 44.337 |
| 2002 | 0.367 | 0.101 | 0.103 | 0.163 | 27.419 | 28.139 | 44.442 |
| 2003 | 0.363 | 0.100 | 0.095 | 0.168 | 27.480 | 26.139 | 46.381 |
| 2004 | 0.366 | 0.101 | 0.092 | 0.173 | 27.596 | 25.220 | 47.183 |
| 2005 | 0.370 | 0.102 | 0.095 | 0.173 | 27.628 | 25.590 | 46.782 |
| 2006 | 0.375 | 0.102 | 0.105 | 0.167 | 27.333 | 27.982 | 44.684 |
| 2007 | 0.371 | 0.102 | 0.106 | 0.163 | 27.491 | 28.666 | 43.843 |
| 2008 | 0.368 | 0.104 | 0.095 | 0.169 | 28.168 | 25.832 | 46.000 |
| 2009 | 0.366 | 0.104 | 0.092 | 0.170 | 28.356 | 25.171 | 46.473 |
| 2010 | 0.358 | 0.100 | 0.104 | 0.154 | 27.905 | 29.093 | 43.001 |
| 2011 | 0.357 | 0.099 | 0.111 | 0.147 | 27.668 | 31.019 | 41.314 |
| 2012 | 0.358 | 0.099 | 0.111 | 0.148 | 27.640 | 31.125 | 41.235 |
| 2013 | 0.357 | 0.098 | 0.115 | 0.145 | 27.502 | 32.060 | 40.437 |
| 2014 | 0.359 | 0.098 | 0.118 | 0.143 | 27.399 | 32.804 | 39.797 |
| 2015 | 0.363 | 0.099 | 0.120 | 0.144 | 27.294 | 33.150 | 39.555 |
| 2016 | 0.363 | 0.099 | 0.122 | 0.142 | 27.228 | 33.659 | 39.113 |
| 2017 | 0.360 | 0.100 | 0.114 | 0.147 | 27.680 | 31.571 | 40.749 |
| 2018 | 0.362 | 0.100 | 0.136 | 0.126 | 27.594 | 37.512 | 34.894 |
| 2019 | 0.362 | 0.098 | 0.149 | 0.114 | 27.226 | 41.141 | 31.633 |
| 2020 | 0.365 | 0.098 | 0.160 | 0.107 | 26.862 | 43.865 | 29.272 |
| 2021 | 0.361 | 0.096 | 0.160 | 0.105 | 26.560 | 44.394 | 29.046 |
| 2022 | 0.360 | 0.096 | 0.163 | 0.102 | 26.500 | 45.257 | 28.243 |
| Average | 0.363 | 0.100 | 0.117 | 0.147 | 27.413 | 32.114 | 40.473 |
| t | t + 1 | |||
|---|---|---|---|---|
| Ⅰ | II | III | IV | |
| Ⅰ | 0.9692 | 0.0308 | 0 | 0 |
| II | 0.0258 | 0.9021 | 0.0722 | 0 |
| III | 0 | 0.0622 | 0.8860 | 0.0518 |
| IV | 0 | 0 | 0.0415 | 0.9585 |
| Types | Provinces |
|---|---|
| Carbon surplus zone (carbon capture > carbon emission) | Tianjin, Hebei, Shanxi, Liaoning, Jilin, Heilongjiang, Shanghai, Jiangsu, Zhejiang, Anhui, Fujian, Jiangxi, Shandong, Henan, Hubei, Hunan, Guangdong, Guangxi, Chongqing, Sichuan, Shannxi, Ningxia, Xinjiang |
| Carbon deficit zone (carbon emission > carbon capture) | Beijing, Neimenggu, Hainan, Guizhou, Yunnan, Xizang, Gansu, Qinghai |
Disclaimer/Publisher’s Note: The statements, opinions and data contained in all publications are solely those of the individual author(s) and contributor(s) and not of MDPI and/or the editor(s). MDPI and/or the editor(s) disclaim responsibility for any injury to people or property resulting from any ideas, methods, instructions or products referred to in the content. |
© 2025 by the authors. Licensee MDPI, Basel, Switzerland. This article is an open access article distributed under the terms and conditions of the Creative Commons Attribution (CC BY) license (https://creativecommons.org/licenses/by/4.0/).
Share and Cite
Liu, C.; Zhang, X.; Sun, Y.; Hu, W.; Li, X.; Cheng, H. Spatiotemporal Evolution, Regional Disparities, and Transition Dynamics of Carbon Effects in China’s Agricultural Land Use. Sustainability 2025, 17, 9344. https://doi.org/10.3390/su17209344
Liu C, Zhang X, Sun Y, Hu W, Li X, Cheng H. Spatiotemporal Evolution, Regional Disparities, and Transition Dynamics of Carbon Effects in China’s Agricultural Land Use. Sustainability. 2025; 17(20):9344. https://doi.org/10.3390/su17209344
Chicago/Turabian StyleLiu, Caibo, Xuenan Zhang, Yiyang Sun, Wanling Hu, Xia Li, and Huiru Cheng. 2025. "Spatiotemporal Evolution, Regional Disparities, and Transition Dynamics of Carbon Effects in China’s Agricultural Land Use" Sustainability 17, no. 20: 9344. https://doi.org/10.3390/su17209344
APA StyleLiu, C., Zhang, X., Sun, Y., Hu, W., Li, X., & Cheng, H. (2025). Spatiotemporal Evolution, Regional Disparities, and Transition Dynamics of Carbon Effects in China’s Agricultural Land Use. Sustainability, 17(20), 9344. https://doi.org/10.3390/su17209344


