Abstract
The increase in municipal solid waste (MSW) generation and its inefficient management have caused significant environmental impacts, particularly in developing countries such as Mexico. In the central region, final disposal in uncontrolled sites (UCSs) remains a common practice despite its negative effects on the environment and public health. These impacts have been underestimated due to the scarcity of studies and the lack of technological alternatives aimed at mitigating them. In response to this problem, Life Cycle Assessment (LCA) emerges as a strategic tool to quantify these effects and to guide decision-making toward more sustainable management. The objective of this study was to evaluate the environmental impacts of a UCS using LCA, considering four scenarios: a baseline (E0) representing the current system conditions and three alternative scenarios (E1, E2, and E3) designed to explore potential improvements in environmental performance and to identify a feasible option under the socioeconomic conditions of a municipality in central Mexico. The functional unit was defined as the treatment of one tonne of MSW. The system boundaries included the separation of recyclable inorganic waste (RIW), the treatment of organic waste (OW) through composting and anaerobic digestion (AD), and the final disposal of mixed waste (MW) in UCSs and sanitary landfills. The assessment was performed using SimaPro Analyst v9.6 software and the ReCiPe methodology. The E0 scenario exhibited the highest environmental burdens, whereas E2 and E3 reduced the disposal of MW from 85.92% to 52.57% and emissions by 78.9%. E3 showed the lowest overall impact by integrating mechanical separation, AD, and controlled landfill disposal. E2, which employed composting instead of AD, proved to be a viable alternative for resource-constrained contexts. The results support the closure of uncontrolled sites and encourage the transition toward integrated systems that incorporate valorization technologies, which are urgently needed to achieve the Sustainable Development Goals.
1. Introduction
Globally, over recent decades, population growth, industrialization, consumerism, and changing lifestyles have been the main drivers behind the continuous increase in municipal solid waste (MSW) generation [1,2]. According to the latest World Bank report, approximately 2.01 billion tons of waste were generated worldwide in 2018, and this figure is projected to rise to 3.40 billion tons by 2050. Regionally, the largest share of waste generation was reported in East Asia and the Pacific (23%), followed by Europe and Central Asia (20%), South Asia (17%), North America (14%), Latin America and the Caribbean (LA&C) (11%), Sub-Saharan Africa (9%), and the Middle East and North Africa (6%) [3,4,5]. Of this total, 36.7% of MSW is disposed of in sanitary landfills, 33% is disposed of in uncontrolled sites (UCSs), 19.3% is treated through recycling and composting, and 11% is treated through incineration [5].
In LA&C, MSW management continues to represent a major challenge for developing countries [6]. In 2021, the region generated approximately 230 million tons of MSW, of which only 84.75% was collected. From the collected fraction, 4.39% was utilized (3.85% by recycling, 0.39% by composting, and 0.15% by co-processing); meanwhile, 46.06% was disposed of in sanitary landfills, 25.57% in UCSs or open dumps, and 8.73% of the total waste had unknown final disposal [7]. In Mexico, MSW generation in 2021 reached 126,350.81 tons per year, with a collection rate of 83.83%. From the collected amount, 8.73% was recovered (7.45% recycling, 0.63% composting, and 0.65% co-processing), while 28.9% was disposed of in sanitary landfills and 42.3% in UCSs. The final disposal of 3.9% of the collected waste and the 16.17% uncollected fraction remain unknown, posing a significant environmental and public health risk [5,7].
Moreover, according to global greenhouse gas (GHG) inventories, the solid waste sector contributes approximately 5% (1.6 billion tons of CO2 eq) of total GHG emissions [8]. In Mexico, in 2021, this sector accounted for 8.93% (63 million tons of CO2 eq) of total national GHG emissions. Within this share, final disposal sites (FDSs) contributed 4.14%, incineration and open burning 0.37%, biological treatment 0.028%, and wastewater treatment 4.39% [9].
Nationally, there are 93 sanitary landfills, 119 controlled sites (CS), and 2004 UCSs. In the central region of Mexico—comprising the State of Mexico, Mexico City, Hidalgo, Morelos, Puebla, Querétaro, and Tlaxcala—there are 252 FDSs, of which 35 are sanitary landfills, 28 are CSs, and 189 are UCSs [10]. The high prevalence of UCSs at both national and regional scales demonstrates that their environmental impacts remain largely underestimated.
In Mexico, most studies on MSW management are limited in scope, focusing on specific processes rather than providing a comprehensive life-cycle perspective that considers all inputs, outputs, and environmental impacts. Examples include Castillo-González & De Medina-Salas [11], who studied MSW generation and characterization in Veracruz; Taboada-González et al. [12] and Hernández-Berriel et al. [13], who analyzed MSW composition in southern and central Mexico; Bernache-Pérez [14], who examined the risk of contamination from FDSs to air, water, and nearby settlements; and Zuloaga-Cano [15], who proposed a sustainable management plan for Mazatepec, Jalisco, based on waste collection, sorting, and recovery.
To overcome these limitations, comprehensive tools are required to assess the environmental impacts of MSW treatment and disposal systems. Among these, Life Cycle Assessment (LCA) stands out as a strategic methodology for quantifying environmental effects from the extraction of raw materials to final disposal (i.e., from cradle to grave). LCA consists of four main stages: (a) goal and scope definition, (b) life cycle inventory, (c) life cycle impact assessment, and (d) interpretation [16,17].
Although originally developed for the industrial sector, LCA has been widely applied since the 1990s to evaluate the environmental feasibility of Integrated Solid Waste Management (ISWM) systems in Asia and Europe.
For instance, Sharma and Chandel [18] evaluated MSW management options in Mumbai, India, under scenarios involving landfilling with and without biogas recovery, incineration, anaerobic digestion (AD), composting, and recycling combinations. Similarly, Zhou et al. [19] assessed the environmental performance of MSW systems in Hangzhou, China, while Mancini et al. [20] compared two organic waste treatment options in Italy. In the United Kingdom, Slorach et al. [21] analyzed the environmental and economic implications of energy and resource recovery from food waste, and Weligama-Thuppahige and Babel [22] evaluated the environmental benefits of AD in Sri Lanka. In Hong Kong, Woon and Lo [23] integrated life-cycle cost and human health analyses to assess municipal waste management alternatives. Finally, Mondragón-Zarza et al. [24] reviewed 132 LCA studies published between 2013 and 2024 on MSW treatment and disposal systems worldwide, identifying incineration as the most frequent energy recovery technology, followed by AD, sanitary landfilling with energy recovery, gasification, pyrolysis, and cogeneration.
In light of current challenges related to energy sustainability, the circular economy, and greenhouse gas (GHG) reduction, several Life Cycle Assessment (LCA) studies have been conducted on hybrid systems, such as the following: Ayodele et al. [25] performed an LCA of WtE plants in twelve Nigerian cities, concluding that landfill biogas-to-energy (LFGTE) systems achieved the lowest carcinogenic potential, whereas incineration/AD hybrids (INC/AD) were most effective in reducing global warming potential (GWP) and acidification potential (AP). In northern Nigeria, Jumare et al. [26] applied environmental LCA to hybrid renewable energy systems and reported a 96.5% reduction in GWP for wind/biogas–biomass hybrids. In Ghana, Armoo et al. [27] compared the environmental performance of MSW treatment in landfills and hybrid WtE facilities incorporating mechanical/manual sorting, solar photovoltaic systems, refuse-derived fuel (RDF) production, and AD/plastic pyrolysis. Furthermore, Anvari et al. [28] presented an extensive review of recent advances in photovoltaic (PV), biomass gasification (BG), and energy storage (ES) technologies, highlighting their integration into hybrid PV/BG&ES multigeneration systems as a promising route for sustainable power generation.
In Latin America, the application of LCA remains limited due to the lack of reliable inventory data in commercial databases. Noteworthy examples include Goicochea-Cardos [29], who evaluated household solid waste management in Havana, Cuba; Ziegler-Rodríguez et al. [30], who assessed the environmental impacts of final disposal sites in Peru; and Lima et al. [31], who examined MSW incineration in Brazil and found no significant advantages over landfilling because of the country’s predominantly hydroelectric energy mix. In Chile, Espinoza-Pérez et al. [32] analyzed GHG emissions and energy performance in six MSW treatment scenarios in Valdivia, concluding that WtE conversion could achieve substantial reductions in GHG and particulate matter emissions. Similarly, Galván and Bielsa [33] evaluated MSW incineration in Argentina, determining that its large-scale implementation remains technically unfeasible due to variations in waste composition, limited financial support, and insufficient technical expertise. Overall, these studies confirm that waste-to-energy (WtE) technologies are effective in reducing GHG emissions, though their deployment in the region remains delayed and dependent on source separation, technical capacity, funding mechanisms, public acceptance, and supportive policy frameworks [32,34,35,36,37].
In Mexico, few studies have applied LCA to waste management. Notable examples include Botello-Álvarez et al. [38], who quantified the environmental impacts of informal recycling systems, and Aldana-Espitia et al. [39], who performed an LCA of MSW management in Celaya, Mexico. Although several landfills already generate electricity from biogas [40,41,42], other sites such as Prados de la Montaña and Bordo Poniente only flare biogas in compliance with NOM-083-SEMARNAT-2003 [43]. Additional energy recovery initiatives include the pilot AD plant in Iztalaca (State of Mexico) and the Hydrothermal Carbonization Plant in Mexico City [44]. Likewise, the co-processing of MSW and special handling waste for energy generation is conducted by private companies under NOM-098-SEMARNAT-2002 [45,46,47,48].
Based on the foregoing, and given the lack of studies addressing the environmental and health effects of UCSs in Mexico, the objective of this study was to evaluate the environmental impacts of an uncontrolled disposal site (UCS) through Life Cycle Assessment, considering four scenarios: a baseline (E0) representing current system conditions and three alternatives (E1, E2, and E3) designed to explore improvements in environmental performance and identify a viable solution under the socioeconomic conditions of a municipality in central Mexico.
2. Study Area and Waste Composition
The study was conducted in the municipality of Xalatlaco, one of the 125 administrative divisions comprising the State of Mexico. The municipality is located in the southeastern region of the state, approximately 50 km southwest of Mexico City and 32 km east of Toluca. Xalatlaco forms part of the Santiago Tianguistenco Metropolitan Area and encompasses a total area of 11.41 km2 (Figure 1).
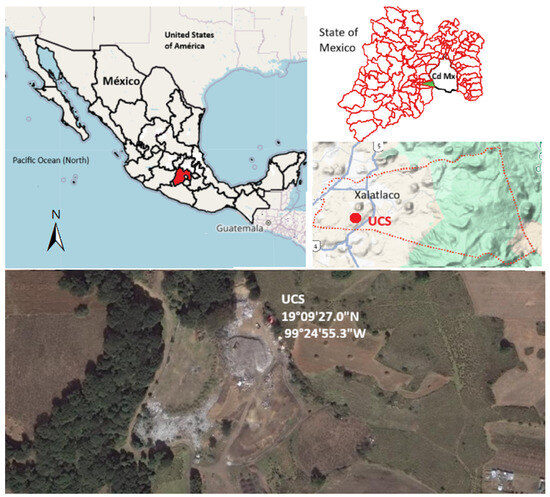
Figure 1.
Study area, Xalatlaco, State of Mexico, Mexico. The State of Mexico is highlighted in red within the country of Mexico. Within the State of Mexico, the municipality of Xalatlaco is highlighted in green. The red dashed lines delimit the municipality of Xalatlaco, and within it, the red dot indicates the location of the UCS. Finally, the UCS is shown in the photograph, with its coordinates displayed in white.
According to the most recent population census conducted in 2020, the municipality of Xalatlaco had a total of 30,687 inhabitants, distributed across 22 communities. Of this population, 52.1% lived in moderate poverty, 12.1% lived in extreme poverty, 21.2% were socially vulnerable, 5.3% were vulnerable due to income, and the remainder were classified as non-vulnerable. Projections from the National Population Council (Consejo Nacional de Población, CONAPO) estimate that the population of Xalatlaco will reach 33,927 inhabitants by 2030, peaking in 2027 [49,50].
The average composition of MSW in Xalatlaco for the dry and rainy seasons of 2017 is presented in Table 1, determined in accordance with the Mexican standards NMX-AA-15-1985 and NMX-AA-22-1985 [51,52]. Easily biodegradable organic waste, such as food residues and yard trimmings, accounted for 24.30%, while slowly degradable organic waste represented 16.03%. The combined fraction of total organic waste therefore amounted to 40.33%, which is lower than the national average of 52.40% reported by the Ministry of Environment and Natural Resources (Secretaría de Medio Ambiente y Recursos Naturales, SEMARNAT) [53]. The MSW management system of Xalatlaco for 2017 consisted of four stages: selective collection, home composting of organic waste (OW), manual separation of recyclable inorganic waste (RIW) carried out by informal recyclers, and the final disposal of mixed waste (MW) at the uncontrolled disposal site (UCS) of the municipality (Figure 2) [54].

Table 1.
Composition of the MSW in Xalatlaco.
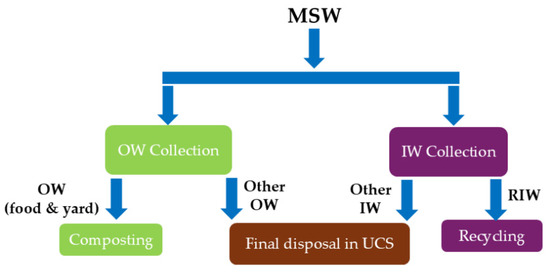
Figure 2.
MSW Management System in Xalatlaco. IW—Inorganic Waste; OW—Organic Waste; MW—Mixed Waste; UCS—Uncontrolled site; RIW—Recyclable Inorganic Waste; MSW—Municipal Solid Waste.
3. Materials and Methods
To conduct this research, the LCA methodology was applied in accordance with the ISO 14040 and ISO 14044 standards, following the four standardized stages: (a) Definition of the study goal, scope, and system boundaries; (b) Life cycle inventory; (c) Life cycle impact assessment for the proposed scenarios; and (d) Interpretation of results [16,17].
3.1. Goal and Scope Definition
The goal of this study was to identify, through LCA, the scenario with the lowest environmental impact among four MSW treatment and disposal alternatives, taking as a case study the municipality of Xalatlaco, located in the State of Mexico, central Mexico.
The treatment and final disposal of one metric ton of MSW in Xalatlaco was defined as the functional unit (FU). Within the scope of this research, the separation of food waste and yard trimmings was considered as OW, while RIW included materials such as plastics, metals, paper, and glass. However, it was not possible to segregate all waste fractions for recovery; therefore, other OW and other IW (including diapers, toilet paper, wood, and fines) were incorporated into the system model.
In all four scenarios, the system boundaries were defined to focus exclusively on the treatment and final disposal stages of MSW, deliberately excluding the collection phase. This delimitation aimed to concentrate the analysis on the waste streams entering the UCS of the municipality of Xalatlaco, allowing the characterization of their direct environmental impacts and the evaluation of management alternatives using technically viable and economically accessible recovery technologies for the local context.
The separated OW was treated through composting and AD. Generic datasets were used to model the recycling processes of the various materials, while infrastructure-related processes were excluded. For the final disposal stage, both UCSs and landfills were considered, excluding infrastructure construction and maintenance (Figure 3).

Figure 3.
System boundaries. IW—Inorganic Waste; OW—Organic Waste; MW—Mixed Waste; RIW—Recyclable Inorganic Waste; MSW—Municipal Solid Waste.
3.2. Definition of the Scenarios
For the proposed scenarios, technologies widely documented in the scientific literature—namely, recycling [18], composting [20], AD [55], and landfill [30]—were selected. Figure 4 shows the four scenarios considered:
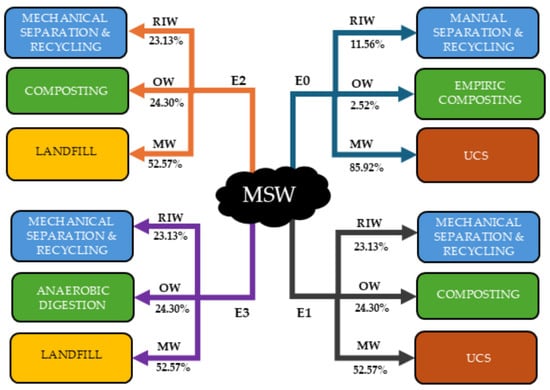
Figure 4.
Proposed scenarios. OW—Organic Waste; MW—Mixed Waste; UCS—Uncontrolled site; RIW—Recyclable Inorganic Waste; MSW—Municipal Solid Waste.
(a) E0: This scenario represents the baseline MSW management conditions in the municipality of Xalatlaco at the time of the study. All MSW generated is collected in a differentiated manner using the “point-to-point” collection system. Collectors pick up bags and containers of OW and IW—not always properly separated—from outside each household and load them into collection vehicles for transport to the municipality’s UCS.
Of the total MSW delivered to the UCS, only 2.52% of the OW is treated through home composting. The process begins when the collected OW is received by a worker who manually removes plastic films and other unseparated IW, then mixes the OW with soil using a shovel to form composting piles.
The collected IW, on the other hand, is dumped at the active front of the UCS, where it is manually sorted by informal recyclers, also known as “scavengers”. Since this activity is performed without standardized procedures and under rudimentary conditions, only an average of 11.56% of the total MSW is recovered as RIW and subsequently recycled.
The remaining 85.92% of MSW, classified as MW, is disposed of directly at the UCS using a backhoe. The site lacks biogas and leachate collection systems, and therefore, in SimaPro Analyst v9.6, it was modeled as a “non-sanitary landfill”.
(b) Scenario 1 (E1). This scenario focuses on increasing the separation of RIW to 23.10% for recycling, which corresponds to a technical projection based on the incorporation of a conveyor belt in the separation process. The inclusion of basic infrastructure would, at a minimum, double the recovery rate of scavengers, observed under current conditions (11.56%), which is considered feasible within the operational and economic context of the municipality. This estimate was used as a reference to model a transition scenario toward a more technical and integrated management system.
This scenario assumes that, out of the 40.33% corresponding to the total OW, only 24.30%—classified as easily degradable—is treated through mechanical composting, while the remaining 16.03% is disposed of at the UCS as MW (52.57%).
(c) Scenario 2 (E2). This scenario is similar to E1 in terms of the proportions of RIW (23.1%) and OW (24.30%); however, the final disposal of MW (52.57%) is conducted in a sanitary landfill. To model this scenario, the following infrastructure and operational characteristics were considered: a geological barrier with geomembrane lining in the disposal cells, MSW compaction and soil cover, biogas collection and control systems, and leachate collection and recirculation from a geomembrane-lined lagoon, among others. All features were defined in accordance with the NOM-083-SEMARNAT-2003 technical specifications [43].
(d) Scenario 3 (E3). In this scenario, the OW—representing 24.30% of the total MSW—is treated through AD. The RIW and MW fractions are managed in the same manner as described in E2.
3.3. Life Cycle Inventory
The Life Cycle Inventory (LCI) data were obtained directly from local authorities responsible for MSW management in the municipality of Xalatlaco. The dataset comprised documentary information, model-based estimations, and Ecoinvent database processes integrated in SimaPro Analyst v9.6.
3.3.1. Generation of Municipal Solid Waste at the Source
For estimating the OW and MW flows, a total generation rate of 792 t/month was used as a reference, equivalent to 26.5 t/day. Based on this quantity and the waste composition shown in Table 1, percentage estimates were made according to the FU (Supplementary SA. Additional Information).
As previously mentioned, MSW is separated at the household level; however, this segregation is not properly performed. Therefore, the daily flow of 1.0 t MSW in Scenario E0 consisted of 0.0252 t/day OW, 0.1156 t/day RIW, and 0.8552 t/day MW. For Scenarios E1, E2, and E3, the respective flows of OW, RIW, and MW were 0.2430 t/day, 0.2313 t/day, and 0.5257 t/day, respectively.
3.3.2. Waste Separation
In Scenarios E1, E2, and E3, the energy consumption of the mechanical conveyor belt used for waste separation was modeled considering Mexico’s national electricity mix (Supplementary SB. Additional Information).
The composition of RIW for each scenario was derived from the MSW characterization data (Supplementary SA. Additional Information). Using the values presented in Table 2, the recycling process—“Recycled Inorganic Waste {MX}”—was simulated. This simulation included the following Ecoinvent 3.10 datasets (Supplementary SB. Additional Information): Paper (waste treatment) {GLO}| recycling of paper | APOS, U, PET (waste treatment) {GLO}| recycling of PET | APOS, U, Mixed plastics (waste treatment) {GLO}| recycling of mixed plastics | APOS, U, Aluminum (waste treatment) {GLO}| recycling of aluminum | APOS, U, Packaging glass, white (waste treatment) {GLO}| recycling of packaging glass, white | APOS, U.

Table 2.
Recyclable Inorganic Waste.
3.3.3. Composting
Home composting was considered in the modeling of E0, as the process is performed manually and in a rudimentary manner (see Supplementary SC. Additional Information). For Scenarios E1 and E2, which also included composting, the produced compost was assumed to be used as a substitute for commercial synthetic fertilizers—specifically Urea, P2O5, and KCl (Supplementary SC. Additional Information). In this case, the amount of OW processed was 0.2430 t/d, achieving 60% compost (0.1458 t/d). Table 3 shows the substituted products, based on the nutrient content (N, P, and K) in 1.0 t of inorganic fertilizer and in the produced compost. Table 3 shows the substituted products, taking as a base for calculation the content of N, P, and K present in a 1.0 t of inorganic fertilizer and compost. For the simulation of this process, the Ecoinvent 3.0 dataset “Biowaste {RoW} | treatment of biowaste, industrial composting | APOS, U” was used [56,57,58].

Table 3.
Products Avoided through the Substitution of Synthetic Fertilizers.
3.3.4. Anaerobic Digestion
In Scenario E3, AD and electricity generation from biogas were considered. The biogas produced, with a CH4 content of 68.54%, enables the generation of 2.04 kWh per m3 of biogas [59]. The electricity generation process was modeled under a combined heat and power (CHP) configuration, assuming complete utilization of biogas in a gas engine and connection to the Mexican electricity grid. For the modeling, the following Mexico-specific Ecoinvent dataset was used: Electricity, high voltage {MX} | Heat and Power Co-generation, Biogas, Gas engine | Cut-off, U; here, the energy output corresponds to the potential generation and substitution of 78.46 kWh of electricity, which would otherwise be produced from coal combustion in Mexico (Supplementary SD. Additional Information).
3.3.5. Final Disposal
For the modeling of the UCS, the following Ecoinvent 3.0 dataset was used: Municipal solid waste {GLO} | treatment of municipal solid waste, unsanitary landfill, dry infiltration class (100 mm) | APOS, U. For the sanitary landfill, the selected dataset was Municipal solid waste {RoW}| treatment of, sanitary landfill | APOS, U.
To estimate the biogas generation, the Modelo Mexicano de Biogás (MBM, Mexican Biogas Model) version 2.0 was employed. This model applies Equation (1) through an automated Excel template [60]. Table 4 presents the values of the CH4 generation index (k) and the CH4 generation potential () assigned by the MBM according to its classification of geographic regions. For this study, the corresponding category is “Region 3: Central/Interior of Mexico” [60,61].
where:

Table 4.
Values of the MBM for Region 3: Central/Interior of Mexico.
- i: 1 year increment
- j: methane generation increment (1/year)
- k: CH4 generation index (m3/Mg)
- : potential CH4 generation (m3/Mg)
- : mass of the disposed waste in year i (Mg)
- : methane correction factor
- n: calculation year
- F: Fire adjustment factor
- : maximum expected landfill gas flow (m3/year).
Biogas emissions were estimated for both the uncontrolled disposal site (UCS)—corresponding to Scenarios E0 and E1—and the sanitary landfill. The resulting data were subsequently integrated into the corresponding datasets for each scenario. The estimated biogas generation, assuming a CH4 concentration of 50% and a time horizon of 100 years, is presented in Table 5 for Scenarios E0, E1, E2, and E3. Supplementary SE–SJ (Additional Information) provide detailed calculations of the estimates, considering CH4 and CO2 densities of 0.717 kg/m3 and 1.977 kg/m3, respectively. Biogas emissions were estimated at both the UCS (E0 and E1) and the sanitary landfill, and subsequently, this data was loaded into the datasets for each of the different scenarios [62].

Table 5.
Biogas Generation in FDSs.
Emissions of compounds present in the leachate were modeled using Ecoinvent datasets.
3.4. Categories for Environmental Impact Assessment
The ReCiPe Midpoint (H) method was applied to evaluate the environmental impacts associated with MSW management in each scenario. The impact categories considered in this study included Global Warming, Stratospheric Ozone Depletion, Fine Particulate Matter Formation, Terrestrial Acidification, Freshwater Eutrophication, Terrestrial Ecotoxicity, Freshwater Ecotoxicity, Human Carcinogenic Toxicity, Human Non-carcinogenic Toxicity, Soil Use, and Fossil Resource Depletion. All simulations were performed using SimaPro Analyst v9.6.
3.5. Sensitivity Analysis
A sensitivity analysis was conducted for scenario E2, using as variables the amount of OW segregated and treated through mechanical composting and sanitary landfill disposal, in order to determine whether variations in this parameter would induce increases in the environmental impact categories.
4. Results and Discussion
This section presents the Environmental Impact Assessment stage with the selected categories, as well as the analysis and interpretation of the results.
4.1. Global Warming
In the Global Warming category, expressed in kg CO2 equivalent (Figure 5), the E0 scenario exhibited the highest negative climate impact (1174.037 kg CO2 eq), primarily due to the uncontrolled release of biogenic CH4 generated by the degradation of the organic fraction of waste in the UCS [1]. The absence of biogas capture, flaring, or energy recovery systems exacerbates these emissions, making the site a significant source of GHGs. This pattern has been widely reported in developing countries, where disposal sites often present structural and operational deficiencies [31,63].
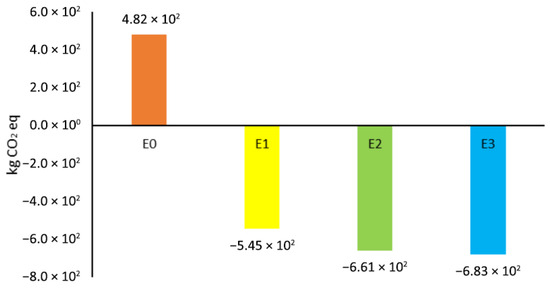
Figure 5.
Contribution of the Global Warming Impact Category.
Conversely, manual segregation of IW for recovery and recycling generated a compensatory environmental effect, through avoided fossil CO2 emissions resulting from the substitution of virgin material production [64] (Supplementary SK, Additional Information). This outcome highlights the mitigation potential of material recovery practices, even under technological limitations, and underscores the importance of strengthening separation and valorization strategies as key components for reducing net emissions in the waste sector. Similarly, Yavad & Samadder [65] in Dhanbad, India, reported that UCS systems generated the highest global warming impacts, while Khandelwal et al. [63], in Nagpur, India, demonstrated that waste utilization and recovery significantly reduced such impacts.
The E1 scenario, which integrates mechanical separation/recycling and industrial composting while maintaining a UCS, showed a substantial reduction in this impact category. The increased recovery of RIW yielded greater environmental benefits than those derived from composting, confirming that material valorization can serve as a more effective strategy for mitigating GHG emissions associated with waste management. This finding aligns with the results of Behrooznia et al. [55] in Rasht, Iran, where the reduction in impacts was attributed to composting emissions and fuel consumption during treatment. Moreover, increasing the RIW separation rate to 23.13% produced larger avoided emissions (–771,709 kg CO2 eq) compared to those from OW composting (–14,793 kg CO2 eq) (Supplementary SL, Additional Information).
The E2 scenario, which combines mechanical separation/recycling, industrial composting, and landfilling, also achieved a notable reduction compared with uncontrolled systems. Although fugitive CH4 emissions remained the dominant source of warming, their magnitude was significantly reduced through controlled operations and partial biogas capture. This behavior is consistent with Cheela et al. [66], who reported marked climate benefits in systems integrating industrial composting with sanitary landfilling. Notably, as in E1, RIW separation contributed more to the overall reduction in emissions than composting activities (Supplementary SL, Additional Information).
The E3 scenario, integrating AD, sanitary landfill, and mechanical recycling, achieved the best performance (–6.83 × 10² kg CO2 eq). The valorization of inorganic waste and the generation of electricity from biogas allowed for the substitution of fossil-based electricity, reducing both CO2 and CH4 emissions associated with the extraction and processing of virgin materials (Supplementary SK and SL, Additional Information). This dual benefit—direct mitigation of biogenic emissions and displacement of fossil sources—demonstrates that AD represents the most effective technology for reducing climate impacts within integrated MSW management systems. These findings are consistent with Behrooznia et al. [55] in Rasht, Iran, who reported favorable environmental outcomes from AD systems due to value-added energy and material recovery. In this scenario, the sanitary landfill produced an impact similar to that of E2 (125.85 kg CO2 eq) (Supplementary SL, Additional Information).
Overall, the results reveal a clear hierarchy in climate performance (E3 > E2 > E1 > E0). The integration of clean technologies and material and energy valorization strategies results in substantial GHG reductions, even in medium-scale municipalities. These findings support the need for public policies that promote the integration of AD and mechanical separation/recycling into regional waste management planning to enhance climate mitigation and resource efficiency.
In Mexico, the National Institute of Ecology and Climate Change (INECC) reported in the National Greenhouse Gas and Compound Emissions Inventory (INEGYCEI) a total of 2.959 × 10¹⁰ kg of CO2 eq generated from MSW disposed of in FDSs—including UCSs, controlled sites, and landfills—for the year 2021 [9]. According to the National Institute of Statistics and Geography (INEGI) [50], the total amount of MSW disposed of in FDSs at the national level during that year was 38,880,946 tonnes, which corresponds to an average of 760.92 kg CO2 eq per tonne of MSW.
As presented in Table 6, this national estimate is approximately twice the value obtained for the E0 scenario and 9.6 times higher than the results for E2 and E3. These differences arise mainly from methodological assumptions and variations in waste composition. Regarding methodology, the national inventory is based on the Intergovernmental Panel on Climate Change (IPCC) guidelines, which rely on generalized and conservative assumptions for emission factors across different FDS types. However, the INECC inventory does not specify the proportion of MSW disposed of in each site type (UCSs, controlled sites, or sanitary landfills) [9,60,67,68].

Table 6.
Comparison of Emissions from this Research with Values Reported in 2021.
In terms of waste composition, as discussed in Section 2 the OW at the Xalatlaco site (40.33%) is notably lower than the national average (52.40%) [53]. Additionally, the fact that scenario E0 yields approximately half the CO2 eq per tonne of MSW can be attributed by the low compaction and limited coverage of waste at the UCS, which reduces the degradation rate and, consequently, methane generation [29,30].
In comparison, the implementation of the E2 and E3 configurations—which integrate mechanical separation, composting, AD, and landfill—would achieve a 78.9% reduction in the GHG emissions relative to the E0 scenario, based on 2021 emission levels.
4.2. Stratospheric Ozone Depletion
The depletion of stratospheric ozone, expressed in kg CFC-11 equivalent (Figure 6), was significantly influenced by the degree of recyclable waste recovery and energy utilization achieved in each scenario. Scenarios with higher material recovery and energy generation rates contributed to the reduction of emissions of N2O, CFC-114, Halon 1211, Halon 1301, HCFC-22, CFC-12, and CFC-10. Similar results were reported by Hadzic et al. [69] in Zagreb, Croatia, where increasing the recycling rate led to avoided emissions through the reduction of virgin raw material extraction and processing.
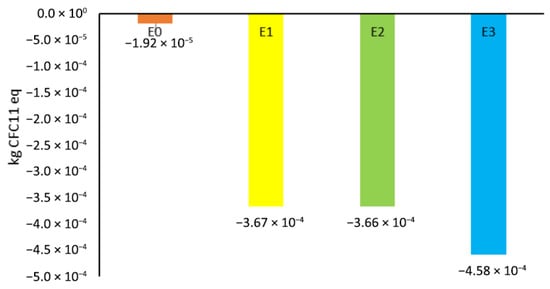
Figure 6.
Impact contribution for the category of Stratospheric Ozone Depletion.
Among the four scenarios, E0 exhibited the lowest avoided impacts, mainly due to fossil fuel consumption required for machinery operation (Supplementary SK and SL, Additional Information). In contrast, E1 and E2 showed more favorable environmental outcomes compared with E0 (Supplementary SK, Additional Information). This improvement resulted from recycling activities, which reduced N2O and halogenated compound emissions associated with waste degradation, as well as those linked to raw material extraction, composting operations, and final disposal sites. These results are consistent with the findings of Yavad & Samadder [65] in Dhanbad, India, and Slorach et al. [21] in the United Kingdom, who also reported significant reductions in global warming potential as a consequence of material recovery and improved management of OW.
The E3 scenario achieved the most favorable performance, as the integration of AD enabled energy generation from biogas, which replaced conventional electricity production, thereby reducing fossil fuel-derived emissions. This outcome reinforces the notion that energy recovery from the OW, combined with the recycling of IW, constitutes a key strategy for ozone layer protection and for minimizing the use of ozone-depleting substances (Supplementary SK and SL, Additional Information). Comparable results were observed by Hadzic et al. [69] in Zagreb, where the combination of recycling, sanitary landfill, and biological processing yielded lower environmental burdens through carbon sequestration and energy recovery from AD biogas. Similarly, Weligama Thuppahige & Babel [22] in Sri Lanka reported that AD achieved notable environmental benefits by avoiding emissions associated with conventional electricity generation.
4.3. Eutrophication
The eutrophication potential, expressed in kg P eq, encompasses NH3 compounds, N2O, PO43−, and P present in leachate. As shown in Figure 7, the E0 scenario exhibited the highest negative impact. Being a UCS, it allows the direct infiltration of leachate into surrounding water bodies due to the absence of a geomembrane or containment system [30,70] (Supplementary SK, Additional Information). However, the separation of RIW for subsequent recycling contributed to avoided emissions and a modest reduction in eutrophication impacts (Supplementary SL, Additional Information).
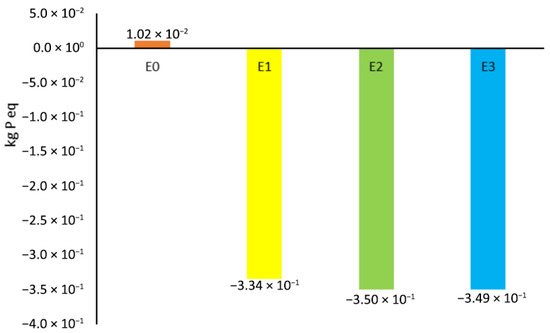
Figure 7.
Impact contribution to the Eutrophication category.
In the E1 scenario, the reduction of organic waste directed to the UCS significantly decreased leachate generation, while industrial composting partially substituted synthetic fertilizers, thereby preventing discharges rich in PO43− compounds [70]. This demonstrates that the valorization of the OW not only reduces nutrient loading but also alleviates pressure on aquatic ecosystems.
The E2 scenario, incorporating a sanitary landfill, achieved notably better performance, as the control of percolation and leachate effectively limited eutrophying discharges (Supplementary SK, Additional Information).
The E3 scenario delivered the greatest overall benefits, combining recycling, AD, and electricity generation from biogas. This configuration prevents diffuse contamination while promoting the efficient use and recovery of nutrients (Supplementary SL, Additional Information). These results are consistent with the findings of Slorach et al. [21] in the United Kingdom, where AD systems exhibited the lowest eutrophication impacts. Similarly, Richard et al. [71] in Arusha, Tanzania, and Khandelwal et al. [63] in Nagpur, India, reported that UCS and sanitary landfill scenarios generated the highest impacts in this category, underscoring the advantages of biological treatment technologies.
4.4. Acidification
This category is associated with the emissions of NOx, SOx, NH3, and H2S, expressed in kg SO2 equivalent (Figure 8). The separation of RIW for subsequent recycling contributed to a reduction in acidifying emissions across all four scenarios, as the avoided impacts increased with higher recovery rates.
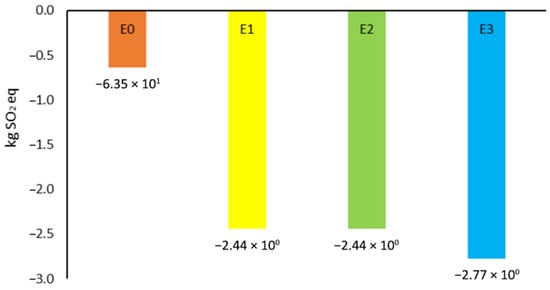
Figure 8.
Impact contribution for the Acidification category.
The E0 scenario was the least favorable in this category (–0.634 kg SO2 eq), since the decomposition of a large proportion of OW disposed of in the UCS generated substantial acid gas emissions, exacerbated by the release of H2S through leachates (Supplementary SK, Additional Information) [72].
The E1 scenario showed marked improvements, attributed to the reduction in the volume of disposed waste and the substitution of virgin materials through recycling. However, industrial composting partially offset these benefits, as it contributes to NH3 and NOx emissions during aerobic degradation (Supplementary SL, Additional Information). Despite this, the smaller amount of OW reaching the UCS in E1 led to a 38.81% decrease in impact compared to E0.
The E2 scenario presented similar results to E1, although machinery operation and biogas combustion in the sanitary landfill introduced additional NOx and SOx emissions (Supplementary SK, Additional Information). Nevertheless, the net reduction remained positive, owing to improved process control and material recovery. Composting contributed similarly to E1. According to Maalouf & El-Fadel [73] in Beirut, Lebanon, the greatest emission reductions in this category were achieved through biogas combustion and subsequent energy recovery. Likewise, Cheela et al. [66] in Visakhapatnam, India, attributed environmental impacts mainly to waste handling operations, including compaction, leveling, and internal transport within the landfill.
Finally, the E3 scenario was the most favorable, as AD enabled the capture and utilization of biogas for clean energy generation, eliminating the need for fossil fuel combustion and drastically reducing acidifying emissions [69,73] (Supplementary SK and SL, Additional Information).
4.5. Ecotoxicity
The impacts associated with Terrestrial (Figure 9) and Freshwater Ecotoxicity (Figure 10) were quantified in kg 1,4-dichlorobenzene equivalent (1,4-DCB eq).
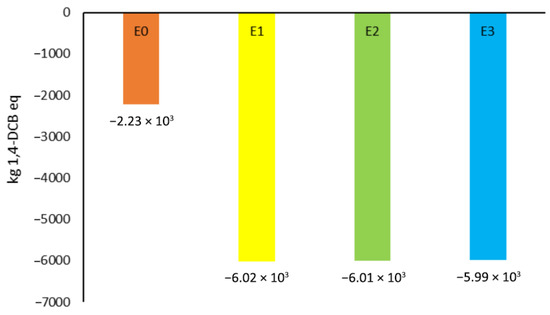
Figure 9.
Impact contribution to the Terrestrial Ecotoxicity category.
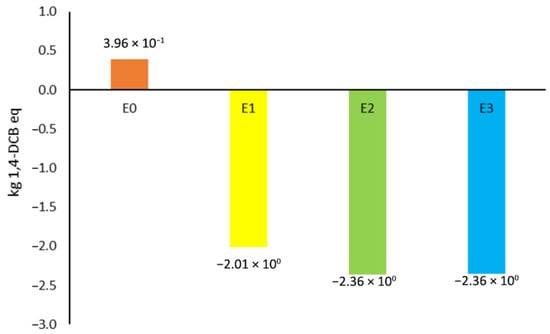
Figure 10.
Impact contribution to the freshwater ecotoxicity category.
In the case of Terrestrial Ecotoxicity, positive impacts were observed, as increasing the separation rate of RIW led to higher avoided emissions across the evaluated scenarios [65]. The E0 scenario, characterized by a UCS, represented the greatest threat to terrestrial ecosystems. The absence of impermeable barriers and leachate treatment systems allowed the direct infiltration of pollutants such as Pb, Cd, and Cr(VI), which accumulate in soil and vegetation, thereby affecting biota and agricultural productivity.
The E1 and E2 scenarios, incorporating mechanical separation, recycling, and industrial composting, showed a substantial decrease in impacts. The reduction in OW and the valorization of IW limited the generation and transport of heavy metals to soil. Moreover, the emission control and stabilization of organic matter during composting reduced contaminant mobility. It is important to note that the positive impact of E1 was slightly higher than that of E2, due to emissions from machinery operation and biogas combustion in vent pits [74]. Nevertheless, the technical control of the sanitary landfill in E2 mitigated leachate infiltration and dispersion, minimizing effects on Terrestrial Ecotoxicity. Similarly, Cheela et al. [66] identified leachate generation, landfill construction, and operational activities as the main contributors to this category, while the application of compost and renewable electricity substitution significantly reduced emissions.
The E3 scenario showed a slight additional reduction compared to E2. Although the marginal benefit was limited, the technological improvement was noteworthy. AD reduced the amount of fermentable organic waste, lowered leachate generation, and produced a stable digestate with a low contaminant load. Furthermore, biogas energy recovery avoided the extraction and combustion of fossil fuels, indirectly decreasing the release of metals and particulates to soil. These findings are consistent with those of Zarea et al. [75], who demonstrated that composting, recycling, and AD reduce metal mobility in contaminated soils, decreasing ecotoxic risk by more than 60% compared with open dumping systems.
Regarding Freshwater Ecotoxicity, the E0 scenario was the least favorable, due to the direct discharge of untreated leachate into surface and groundwater bodies. The lack of impermeabilization, drainage, and cover in the UCS facilitated the diffuse and persistent contamination of water by heavy metals and persistent organic compounds (e.g., phenols and aromatic hydrocarbons), severely impacting aquatic biota [65]. In the study by Behrooznia et al. [76], heavy metals in leachate were identified as key contributors to this category. Likewise, Zarea et al. [75] in Ahvaz, Iran, found that recycling and selective collection of OW reduced the ecotoxic impact associated with heavy metal leachate.
The E1 and E2 scenarios demonstrated significant improvements. Industrial composting and recycling decreased the proportion of moist and toxic waste capable of producing hazardous leachate, while the hydraulic control system of the sanitary landfill in E2 limited contaminant transport. The combined effect of these strategies resulted in a substantial reduction of toxic loads discharged into aquatic systems (Supplementary SK and SL, Additional Information). However, it should be noted that the sanitary landfill in E2 generated slightly higher fossil fuel consumption, producing a minor negative offset. In Jaafarzadeh et al. [77] conducted in Dezful, Iran, composting and recycling strategies significantly decreased ecotoxicity risks compared to landfill-only systems.
In this category, both E2 and E3 achieved higher avoided emissions. However, E3 stood out for its biogas energy recovery, which reduced atmospheric emissions that could be redeposited into aquatic ecosystems through wet deposition. The performance of E2 and E3 confirms that the critical inflection point in this category occurs with the implementation of hydraulic control measures, including geomembranes, drainage, and leachate treatment (Supplementary SK, Additional Information). Consistently, Jaglan et al. [74] in Kharagpur, India, found that AD combined with sanitary landfill management balanced environmental emissions, achieving notable ecological benefits and a reduced ecological footprint. Similarly, waste separation proved essential for lowering environmental costs and improving system sustainability.
4.6. Fine Particle Formation
Figure 11 presents the results for the Formation of Fine Particles category (kg PM2.5 eq), where the separation of RIW directly contributed to the increase in avoided loads through recycling across all four scenarios.
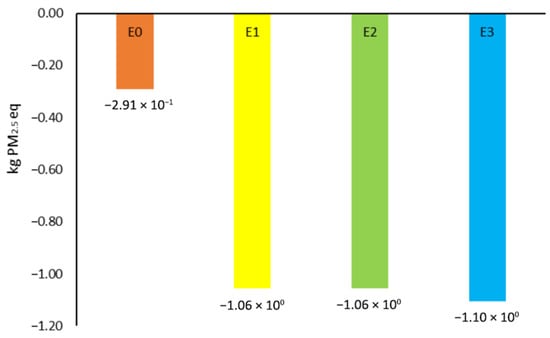
Figure 11.
Impact contribution for the Fine Particle Formation category.
The E0 scenario was the least favorable, as particulate emissions originated from uncontrolled anaerobic and aerobic degradation, accompanied by the diffuse release of gases such as SO2, NOx, NH3, CO, CH4, and volatile organic compounds (VOCs). These compounds act as precursors of secondary aerosols in the atmosphere, thereby contributing to fine particulate formation. In addition, the absence of daily cover and the limited use of operational machinery exacerbated gas dispersion (Supplementary SK, Additional Information). These findings are consistent with those of Aldhafeeri & Alhazmi [78] in Riyadh, Saudi Arabia, where UCSs exhibited greater emissions of waste decomposition gases and particulate matter into the atmosphere.
In the E1 scenario, the UCS showed a lower impact compared to E0. This reduction is mainly attributed to the mechanical separation of recyclable materials and controlled industrial composting, which decrease both the volume of disposed waste and direct particle emissions. Nevertheless, the composting process also produces secondary emissions of NH3 and NOx from aerobic degradation, which limits the overall benefit [79]. Additionally, the use of diesel for composting operations contributed to the emission of CO, CH4, and VOCs [21,65]. According to Joseph & Stichnothe [80], open composting systems can release up to 45% of the total potential for fine particulate formation in the form of NH3 emissions if gas treatment systems or biofilters are not implemented.
The E2 scenario presented values nearly identical to E1, suggesting that the introduction of a sanitary landfill did not yield significant additional benefits in this category. Although landfill implementation effectively reduces diffuse emissions, the combustion of biogas and the operation of site machinery generate additional emissions of PM, CO, NOx, SOx, VOCs, polycyclic aromatic hydrocarbons, and heavy metals, which partially offset the improvements achieved through composting and recycling. Similarly, Ziegler-Rodriguez et al. [30] in Peru reported that biogas combustion can contribute to PM2.5 and PM10 emissions, emphasizing the need for flue gas treatment systems or filters in exhaust chimneys to minimize particulate release.
The E3 scenario recorded the lowest contribution to PM emissions, primarily due to the energy recovery from biogas through AD. This process replaces the passive venting or flaring of biogas typical of less advanced systems, thereby avoiding emissions of CO, NOx, and PM that are commonly produced during the combustion of fossil fuels in conventional power plants. In addition, the use of digestate as a biofertilizer further contributes to mitigation by reducing indirect emissions of NH3 and secondary particulate matter associated with the use of synthetic nitrogen-based fertilizers. Together, these improvements strengthen the circular and low-impact nature of the system, positioning E3 as the most efficient alternative for atmospheric emissions mitigation and the integrated utilization of OW (Supplementary SK, Additional Information) [81].
4.7. Human Toxicity
Carcinogenic and Non-carcinogenic Human Toxicities are presented in Figure 12 and Figure 13, respectively, and are primarily associated with the presence of Pb, Cr(VI), Hg, Ni, Ba, Cd, Cu, Ag, Zn, and V. In both categories, the separation of RIW contributed to impact reduction; however, the environmental benefits were more pronounced in Non-carcinogenic Toxicity.
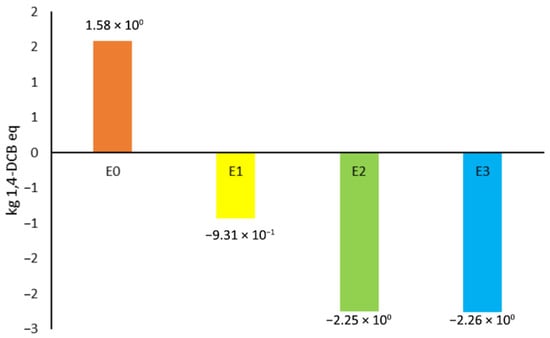
Figure 12.
Impact contribution to the category of Carcinogenic Human Toxicity.
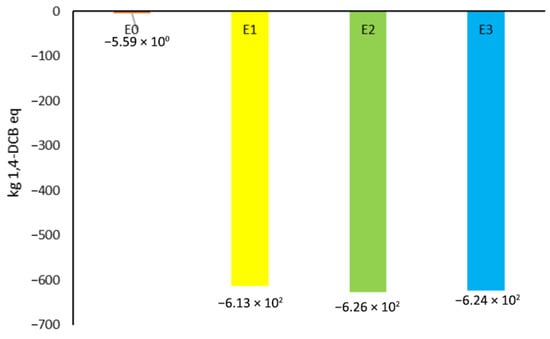
Figure 13.
Impact contribution for the category of Non-Carcinogenic Human Toxicity.
The E0 scenario exhibited the least favorable performance, mainly due to the release and dispersion of carcinogenic compounds such as Cr(VI), Cd, Ni, Pb, and As, resulting from the degradation and leaching of waste in an uncontrolled disposal site [65]. Direct infiltration into soils and aquifers, coupled with the emission of airborne particles containing heavy metals, represents a critical pathway of human exposure, both through inhalation and indirect ingestion of contaminated water and food. This pattern aligns with the findings of Hadzic et al. [69] and Caicedo-Concha et al. [82], who reported that uncontrolled landfills pose the highest carcinogenic risks, primarily due to heavy metal bioaccumulation and the absence of leachate collection systems.
The E1 scenario achieved higher avoided emissions compared to E0, driven by the mechanization of RIW separation and the introduction of industrial composting, which together reduce the amount of OW and the potential for metal leaching. Moreover, material recovery decreases the dependence on resource-intensive extractive activities, one of the main sources of atmospheric metal emissions.
Across the E1–E3 scenarios, mechanical separation and recycling of RIW played a decisive role in mitigating Human Toxicity, both Carcinogenic and Non-carcinogenic. This effect is primarily linked to the prevention of heavy metal and persistent organic pollutant (POP) emissions, as well as to the replacement of energy-intensive industrial processes and the elimination of informal burning or improper disposal practices.
The E2 scenario yielded greater avoided emissions than E1. The implementation of a sanitary landfill represented the critical improvement, providing physical containment of waste through the use of geomembranes and drainage systems that prevent leachate migration, and enabling the controlled combustion of biogas, thereby reducing the dispersion of volatile compounds and metals into the environment. According to Dastjerdi et al. [83], the transition from open dumps to engineered landfills can reduce atmospheric emissions of heavy metals and polycyclic aromatic compounds by more than 90%, which translates into a significant reduction in carcinogenic risk over the waste life cycle.
Finally, the E3 scenario demonstrated the best environmental performance, showing net beneficial impacts. Although the quantitative difference compared with E2 was small, the qualitative improvement was substantial. AD promotes the controlled degradation of the OW and the capture of biogas, thereby eliminating the risk of toxic gaseous emissions (Supplementary SK and SL, Additional Information). As noted by Cheela et al. [66] and Behrooznia et al. [76], this biological treatment provides environmental credits by avoiding emissions of VOCs and carcinogenic aromatic compounds that would otherwise occur during fossil-based electricity generation.
In the Non-carcinogenic Human Toxicity category, the E0 scenario recorded a value of –5.59 kg 1,4-DCB eq, indicating a marginal benefit derived from the manual recovery of recyclable materials. However, this effect is insufficient when compared with the diffuse emissions of heavy metals and inorganic compounds—such as Hg, Cu, Zn, and Mn—released through leachates from UCSs, which represent a persistent source of environmental contamination and human health risk [70].
The E1 scenario showed a significant reduction in impacts compared with E0, highlighting the critical role of industrial composting in mitigating heavy metal emissions and reducing leachate generation from landfill operations. At the same time, mechanical separation and formal recycling lower the demand for virgin mineral extraction, one of the main global contributors to Non-carcinogenic Toxicity, due to the release of cyanides, arsenates, and metallic sulfates during ore beneficiation processes [65].
Across scenarios E1 to E3, the combination of recycling and biological treatment produced a synergistic mitigation effect. Recycling functions as a preventive strategy at the source, avoiding the generation of toxic flows from their origin, while biological stabilization complements this action by reducing contaminant mobility within the system.
The E2 scenario exhibited an additional improvement over E1. Although the percentage change was moderate, the implementation of a sanitary landfill represented a substantial qualitative advancement, as it ensured the physical containment of leachates through the use of geomembranes and drainage systems. This design effectively limits infiltration into groundwater and thereby reduces chronic exposure risks for nearby communities.
In the E3 scenario, although the quantitative difference compared with E2 was small, its environmental advantage stems from the integration of energy recovery via AD [66]. The mechanical pre-separation of recyclable materials allows for their efficient extraction, preventing batteries, electronic components, metallic containers, and halogenated plastics from entering the landfill. This, in turn, reduces the risk of releasing heavy metals and POPs, consolidating an integrated model of material valorization and environmental control that combines energy efficiency with public health protection [83].
Overall, the results demonstrate that the technological transition toward controlled and energy-recovering systems not only reduces pollutant loads but also disrupts the main human exposure pathways. While Carcinogenic Toxicity is predominantly linked to inhalation and trophic bioaccumulation, Non-carcinogenic Toxicity is more closely associated with dermal contact and indirect ingestion of contaminated water. Thus, the implementation of sanitary landfills and AD constitutes an effective strategy for environmental containment and public health protection, reaffirming the potential of technologically advanced scenarios to minimize toxicity throughout the life cycle of MSW.
4.8. Soil Use
Figure 14 illustrates the results for the Soil Use category (m2a crop eq), where increasing the separation rate of RIW progressively reduced land occupation across all scenarios. This improvement stems from the avoidance of land-intensive activities, such as deforestation for paper production, metal extraction through mining, and the installation of refineries and raw-material processing plants for plastics and other industrial products [20]. Similar conclusions were reported by Morero et al. [84], who emphasized that recycling directly mitigates land-use pressures, and by De Feo et al. [85], who found that recycled paper reduced deforestation impacts by offsetting virgin paper production.
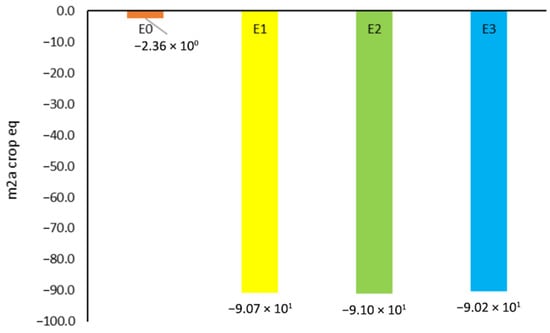
Figure 14.
Contribution of impact for the Soil Use category.
The E0 scenario exhibited the lowest performance, as the UCS requires a larger surface area for waste deposition and lacks potential for post-closure recovery. In contrast, E1 yielded higher benefits, driven by the increase in RIW separation and the operation of an industrial composting facility, which occupies less land than uncontrolled disposal. Furthermore, closed sanitary landfills can eventually be rehabilitated and converted into natural land, contributing to long-term positive outcomes [21].
The E2 scenario produced the greatest improvement, as the land requirement for the sanitary landfill was minimized under the assumption that, after closure, the area would be vegetated and reforested [85]. This conversion from artificial to natural land enhances ecological function, consistent with Mancini et al. [20], who described the transition from a landfill surface to a forest ecosystem after approximately 150 years of recovery.
The E3 scenario was the second most favorable, since biogas production through AD eliminates the need for land exploitation for fossil-fuel extraction, thereby reducing indirect land-use impacts [20,85]. However, as Bisinella et al. [86] noted, the construction of sanitary landfills and the separate treatment of organic waste may still require substantial land occupation compared with integrated treatment systems.
Overall, the findings demonstrate that combining material recovery with landfill management achieves optimal land-use efficiency. In municipalities with limited spatial capacity, E2 and E3 configurations represent strategic options, balancing land conservation, ecological restoration potential, and environmental performance through the recovery of soil function and ecosystem services.
4.9. Depletion of Fossil Resources
In this category, the recycling of recoverable waste generated positive environmental outcomes across all scenarios, primarily due to the avoidance of fossil fuel consumption associated with the extraction and processing of virgin materials (Figure 15). This trend is consistent with the findings of Parkes et al. [87], who demonstrated in London that higher recycling rates effectively reduced the impact of fossil resource depletion.
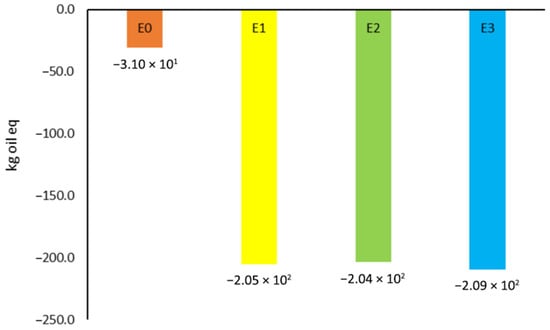
Figure 15.
Impact contribution to the Fossil Resource Depletion category.
The E0 scenario exhibited only marginal benefits, as manual recycling achieved a low recovery rate. Moreover, the operation of the UCS led to energy losses caused by fugitive emissions of CH4 and CO2, which were neither captured nor utilized as potential energy sources.
In contrast, the E1 scenario showed a substantial improvement, mainly driven by mechanized separation and formal recycling, which replace highly energy-intensive processes linked to virgin material extraction [88]. Additionally, industrial composting contributed to fossil fuel savings by partially substituting nitrogen- and phosphate-based fertilizers, whose manufacture is energy-intensive and dependent on natural gas. Although these credits are smaller than those from metal recycling, they provide a notable complementary contribution to the overall energy performance of the system [89].
The E2 scenario presented a slightly lower benefit than E1, mainly due to diesel consumption by the machinery used for compaction and daily operations in the sanitary landfill. Similar results were reported by Behrooznia et al. [76] in Iran, where fuel use in transportation and heavy machinery represented one of the dominant contributors to impacts in landfill and landfill–composting systems, emphasizing the trade-offs between operational control and energy demand.
Finally, the E3 scenario achieved the highest environmental benefits, primarily through the implementation of AD, which enables the capture and utilization of biogas as a renewable source of electricity and heat. Beyond energy recovery, AD also complements mechanical recycling by closing the carbon–energy loop, converting biodegradable waste—traditionally an environmental burden—into a valuable energy resource. This process embodies the principle of energetic circularity, wherein the embedded energy of organic matter is recovered and reintegrated into the system, thereby reducing dependence on external fossil fuels [63]. Consistently, Behrooznia et al. [55] reported that electricity generation from biogas through AD effectively substitutes natural gas consumption, preventing impacts related to fossil resource depletion and reinforcing the role of biogas utilization as a key strategy in sustainable waste management.
4.10. Normalization of Categories
The normalization results (Figure 16a,b) indicate that Global Warming, Freshwater Ecotoxicity, Eutrophication, and Carcinogenic Human Toxicity were the categories with the most significant negative impacts, with E0 exhibiting the highest overall burden across the system. These results reflect the cumulative effect of uncontrolled emissions and the absence of recovery processes in the baseline scenario.
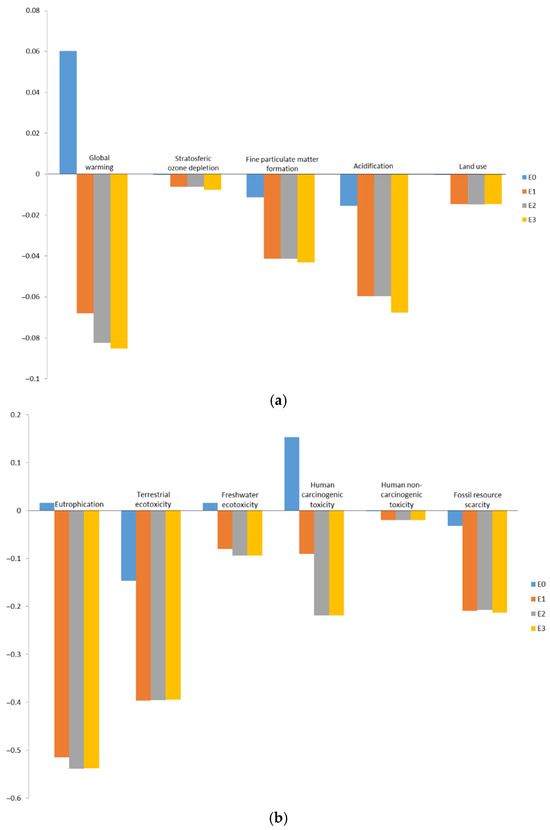
Figure 16.
(a) Standardization of categories. (b) Standardization of categories.
Conversely, the scenarios incorporating material and energy recovery achieved substantial positive environmental outcomes through the utilization of OW and the recycling of valuable materials. Among them, E3 demonstrated the highest avoided emissions, particularly in the categories of Global Warming, Stratospheric Ozone Depletion, Fine Particulate Matter Formation, Acidification, Carcinogenic Human Toxicity, and Fossil Resource Depletion.
The E2 scenario also exhibited notable environmental benefits, primarily in Eutrophication, Freshwater Ecotoxicity, and Non-Carcinogenic Human Toxicity, owing to its controlled leachate management and integrated composting and landfill operations. In contrast, E1 achieved moderate improvements, mainly in Terrestrial Ecotoxicity and Soil Use, due to the combined effects of mechanical separation, recycling, and industrial composting.
Overall, the normalization analysis reinforces the superior environmental performance of E3, highlighting the synergistic benefits of biogas recovery, renewable energy generation, and material valorization in mitigating multiple impact categories simultaneously.
4.11. Sensitivity Analysis
The sensitivity analysis conducted for E2 on the variation in the proportion of organic matter allocated to composting and landfill disposal reveals that the model outcomes are, overall, robust. Only three impact categories—Eutrophication, Freshwater Ecotoxicity, and Non-carcinogenic Human Toxicity—showed variations exceeding 10% when the composting fraction was reduced from 24.3% to 10%. In all other categories, the changes remained marginal, indicating a low sensitivity of the system to this parameter (Figure 17).
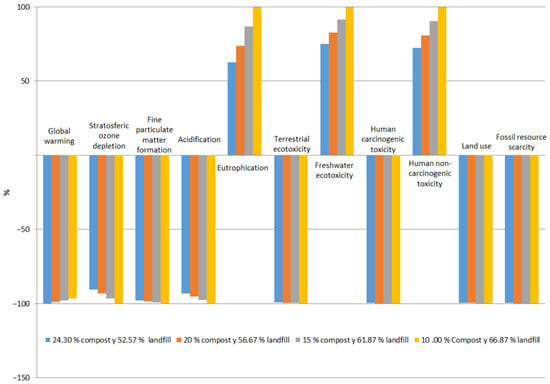
Figure 17.
Sensitivity analysis E2.
The higher sensitivity in freshwater-related categories likely arises from increased nutrient leaching (e.g., nitrogen, phosphorus) and release of toxicants when OW is diverted to landfill instead of undergoing controlled composting, where stabilization processes can mitigate emissions. This mechanism is consistent with recent LCA findings: for example, Wang et al. [90] reported that their composting–landfill systems are particularly sensitive to freshwater ecotoxicity and toxicity equivalence metrics.
Also, Behrooznia et al. [76] in their comparative LCA of landfilling vs. composting identified hotspots associated with leachate generation and untreated emissions in landfill scenarios. Similar patterns have been documented in other contexts. A systematic meta-analysis on composting LCA studies found that performance is very sensitive to operational and process management parameters (e.g., aeration, moisture control, treatment duration), especially in categories linked to aquatic and toxicity endpoints [91].
Nonetheless, a reduction in the composting rate accompanied by increased waste directed to landfill resulted in higher impacts within those sensitive categories, reinforcing the role of composting as an effective mitigation strategy for the environmental burdens associated with organic fraction management. From a management standpoint, sustaining or expanding composting capacity could serve as a practical measure to minimize waterborne and human health impacts, particularly in regions where landfill control is imperfect. These findings confirm the stability of the model across most impact categories and highlight the importance of optimizing composting processes to reduce potential effects on aquatic ecosystems and human health.
The sensitivity analysis applied to E3 to assess variations in the proportion of organic matter allocated to biogas and electricity production versus landfill disposal shows that the model results remain highly consistent across most impact categories. In this case, all variations were below 10%, confirming the robustness of the system against changes in this parameter (Figure 18). A gradual increase in environmental impacts was observed as the share of organic matter used for energy recovery decreased and landfill disposal increased, particularly in categories related to Global Warming and Acidification. However, the magnitude of these variations was minor, suggesting that energy recovery from the OW through biogas production represents an environmentally advantageous and stable strategy.
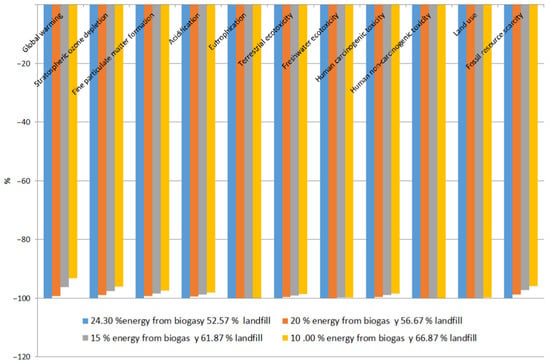
Figure 18.
Sensitivity analysis E3.
These results are consistent with previous studies that emphasize the robustness of AD models to parameter variations and their clear environmental advantages over landfill-based management. Barahmand & Samarakoon [92] reported that AD systems tend to show limited sensitivity in CH4 yield and overall performance when input parameters are moderately varied, reflecting the resilience of these processes under realistic operational conditions. Similarly, Kumawat et al. [93] demonstrated that biogas-based power generation substantially outperforms coal-based systems in terms of greenhouse gas mitigation, confirming the environmental benefit of energy recovery pathways.
In developing contexts, Ijeoma [94] performed a comparative LCA of fruit waste management and found that AD consistently reduced Global Warming and Acidification compared to landfilling, even under uncertainty and local constraints. Moreover, Ouedraogo et al. [95] highlighted through a comprehensive LCA comparison that integrating AD with other treatment options (e.g., composting) improves overall environmental performance and resource recovery efficiency. Collectively, these findings reinforce the role of biogas production as a robust and sustainable strategy for emission mitigation and energy valorization, particularly in regions where landfill control remains limited.
5. Conclusions
This study applied the LCA methodology to evaluate the environmental performance of four MSW management scenarios in the locality of Xalatlaco, located in central Mexico. The baseline scenario (E0) represents the currently operating system, from which three improvement alternatives (E1, E2, and E3) were modeled, incorporating different degrees of waste recovery and control in final disposal.
Scenario E0 is characterized by the implementation of composting processes under non-standardized conditions, manual waste separation, and final disposal of 85.92% of the MSW generated in a UCS. The environmental assessment indicated that E0 contributes the highest impacts in several categories, including Global Warming, Freshwater Ecotoxicity, Eutrophication, and Human Toxicity. These results are explained by technical deficiencies in the unit processes that make up the system:
- Empirical composting without control of critical parameters. Composting is carried out under non-standardized conditions without control of temperature, moisture, aeration, or residence time, favoring undesirable anaerobic processes that result in CH4 emissions—a gas with a significantly higher global warming potential than CO2 and NOx—contributing considerably to the Global Warming. Moreover, incomplete degradation of the organic fraction produces leachate with high loads of nutrients and toxic compounds, which, when not properly treated, negatively affect nearby water bodies, intensifying eutrophication and aquatic ecotoxicity effects.
- Manual separation with low recovery efficiency. The limited infrastructure and training for the separation of RIW reduce the effective recycling rate, increasing the flow of waste to final disposal. This operational inefficiency prevents the substitution of virgin materials, thereby increasing the system’s environmental burdens. In addition, the direct exposure of workers to waste without biosecurity measures represents a risk to human health, reflected in the human toxicity category.
- Disposal in uncontrolled sites. The absence of engineering measures such as cell lining, biogas capture, and environmental monitoring allows the direct release of GHGs, VOCs, and leachate, affecting both the atmosphere and aquatic and terrestrial ecosystems. Leachate infiltration into the subsoil further intensifies impacts on freshwater ecotoxicity and human toxicity, particularly affecting vulnerable communities located near the UCS.
- Absence of energy and material recovery. The lack of recovery technologies in the current system—such as AD, structured recycling, or technical composting—prevents the generation of net environmental benefits through the substitution of conventional inputs (energy, fertilizers, virgin materials). This limitation reduces the potential for impact mitigation and perpetuates a linear waste management model.
Regarding the proposed scenarios aimed at reducing negative impacts, the following conclusions were drawn:
- Through the application of the ReCiPe Midpoint methodology in SimaPro Analyst v9.6, it was identified that scenario E3—which incorporates AD of OW, recycling of RIW, and disposal in a sanitary landfill—presented the lowest environmental impacts in key categories such as Global Warming, ozone layer depletion, and eutrophication, demonstrating the potential of integrated management systems to mitigate negative externalities.
- Scenario E2 was identified as the second-best environmental alternative. It combines RIW separation with OW composting to replace synthetic fertilizers and final disposal in a sanitary landfill, reducing impacts in the categories of GW, ozone depletion, fine particulate matter formation, and human toxicity.
- In terms of avoided burdens (positive impacts), RIW separation yielded the most favorable results, followed by AD with energy recovery and, lastly, mechanical composting. This outcome is attributed to the differential potential of each technology to generate net environmental benefits through the substitution of conventional inputs. In the case of RIW separation, the recovered materials (plastics, metals, paper, glass) avoid highly energy- and emission-intensive extraction and primary manufacturing processes, resulting in significant reductions in categories such as global warming, particulate matter formation, and resource depletion. This treatment exhibits high efficiency in material recovery.
- Although less efficient in mass recovery, AD enables the generation of biogas as a renewable energy source, contributing to the substitution of fossil energy and the reduction of impacts in categories such as photochemical ozone formation and global warming. However, its performance depends on the efficiency of the capture and energy recovery system.
- Mechanical composting represents a substantial improvement compared to the baseline scenario, allowing for more efficient stabilization of organic waste, emission reduction, and the generation of a product with agronomic value. Collectively, these processes contribute to reducing environmental burdens in categories such as eutrophication, particulate matter formation, global warming, and resource depletion.
- Scenarios E2 and E3, which involve the final disposal of 52.57% of MSW in sanitary landfills with biogas capture and flaring, could reduce the impacts of E0 by up to 78.9%.
- Scenario E2 highlights the importance of integrating mechanical composting and controlled final disposal as strategic components in MSW management systems, particularly in contexts with operational and budgetary constraints, such as the municipality analyzed in this study. This configuration achieves significant reductions in environmental burdens through organic fraction recovery and mitigation of impacts associated with uncontrolled disposal. Although it does not surpass the environmental performance of E3—which includes AD with energy recovery—E2 represents a technically feasible and environmentally efficient alternative for municipalities transitioning toward circular management models.
- Sensitivity analyses for E2 and E3 confirmed the robustness of the model, with variations below 10% in most categories. The results revealed that decreasing composting rates increased eutrophication and human toxicity, while reducing the organic fraction directed to AD elevated global warming and acidification potentials. Therefore, maintaining or expanding composting and AD capacities is essential to ensure environmental stability.
The findings of this study may serve as a reference for municipal and regional authorities in Asia, Africa, Latin America, and the Caribbean with socioeconomic conditions similar to those of small municipalities in central Mexico, supporting decision-making on strategies to reduce environmental and human health impacts from a sustainability perspective.
As a future line of research, it is proposed to expand the system boundaries to include the collection stage, since the improved scenarios (E1–E3) involve changes in operational logistics and energy consumption associated with transportation. Incorporating this phase would allow a more holistic evaluation of the waste management system under the LCA approach, leading to a more accurate estimation of total environmental burdens and strengthening the technical basis for the formulation of sustainability-oriented public policies. It is also important for future research to include experimental validations and the integration of economic models.
Supplementary Materials
The following supporting information can be downloaded at: https://www.mdpi.com/article/10.3390/su17209324/s1, as Excel file containing Supplementary SA to Supplementary SL. SA—Supplementary A. Composition. SB—Supplementary B. MSW Separation. SC—Supplementary C. Composting. SD—Supplementary D. Anaerobic Digestion. SE—Supplementary E. MBM E0. SF—Supplementary F. Biogas generation E0. SG—Supplementary G. MBM E1. SH—Supplementary H. Biogas generation E1. SI—Supplementary G. MBM E2 & E3. SJ—Supplementary H. Biogas generation E2 & E3. SK—Supplementary K. Total Impact Categories Assessed. SL—Supplementary L. Impact categories evaluated at E0–E3.
Author Contributions
Conceptualization, E.M.-Z., I.N.M.-M., S.O.-B. and M.d.C.H.-B.; methodology, E.M.-Z., I.N.M.-M., E.R.R.D., S.E.C.-S. and S.O.-B.; validation, E.R.R.D. and S.E.C.-S.; formal analysis, E.M.-Z., E.R.R.D. and M.d.C.H.-B.; investigation, E.M.-Z., I.N.M.-M. and M.d.C.H.-B.; resources, M.d.C.H.-B. and E.R.R.D.; data curation, S.E.C.-S., I.N.M.-M. and M.d.C.H.-B.; writing—original draft preparation, E.M.-Z., M.d.C.H.-B. and I.N.M.-M.; writing—E.M.-Z., M.d.C.H.-B., E.R.R.D. and S.O.-B.; supervision, M.d.C.H.-B. and S.O.-B.; project administration, M.d.C.H.-B. and S.E.C.-S.; funding acquisition, M.d.C.H.-B. and E.R.R.D. All authors have read and agreed to the published version of the manuscript.
Funding
This research was funded by the SEMARNAT-CONACYT Environmental Research Sector Fund, through the research project “Location of future intermunicipal sanitary landfills in the State of Mexico and surrounding states.” with code SEMARNAT-2015-1-263315.
Institutional Review Board Statement
Not applicable.
Informed Consent Statement
Not applicable.
Data Availability Statement
The original contributions presented in this study are included in the article/Supplementary Materials. Further inquiries can be directed to the corresponding author.
Acknowledgments
The authors thank the Secretariat of Science, Humanities, Technology and Innovation (SECIHTI) for the maintenance scholarships awarded to two PhD students in Environmental Sciences at the Tecnológico Nacional de México/Instituto Tecnológico de Toluca, División de Estudios de Posgrado e Investigación.
Conflicts of Interest
The authors declare no conflicts of interest.
References
- Almansour, M.; Akrami, M. Towards Zero Waste: An In-Depth Analysis of National Policies, Strategies, and Case Studies in Waste Minimisation. Sustainability 2024, 16, 10105. [Google Scholar] [CrossRef]
- Cheniti, H.; Kerboua, K.; Sekiou, O.; Aouissi, H.A.; Benselhoub, A.; Mansouri, R.; Zeriri, I.; Barbari, K.; Gilev, J.B.; Bouslama, Z. Life Cycle Assessment of Municipal Solid Waste Management within Open Dumping and Landfilling Contexts: A Strategic Analysis and Planning Responses Applicable to Algeria. Sustainability 2024, 16, 6930. [Google Scholar] [CrossRef]
- Correal, M.; Rihm, A. Towards the Valorization of Solid Waste in Latin America and the Caribbean: Basic Concepts, Feasibility Analysis and Public Policy Recommendations, 1st ed.; Inter—American Development Bank: Washington DC, USA, 2022; pp. 8–17. [Google Scholar] [CrossRef]
- United Nations Environment Programme and International Solid Waste Association: Global Waste Management Outlook 2024—Beyond an Age of Waste: Turning Rubbish into a Resource. Available online: https://wedocs.unep.org/20.500.11822/44939 (accessed on 30 September 2025).
- Kaza, S.; Bhada-Tata, P.; Van Woerden, F. What a Waste 2.0. A Global Snapshot of Solid Waste Management to 2050, 1st ed.; The World Bank Group: Washington, DC, USA, 2018; pp. 1–37. [Google Scholar] [CrossRef]
- Coalición Para el Cierre Progresivo de los Basurales. Available online: https://www.unep.org/es/regiones/america-latina-y-el-caribe/iniciativas-regionales/impulsando-la-gestion-segura-de-0 (accessed on 5 February 2025).
- Alarcón Montero, P.A.; Acosta Acevedo, S.; Correal, M.; Piamonte, C.; Rihm, A.; Breukers, L.; Durón, L.; González, G.; Hernández López, C.; Sagasti, C.; et al. Regional Material Flow Assessment: Municipal Solid Waste EVAL for Latin America and the Caribbean 2023, 1st ed.; Inter—American Development Bank: Washington, DC, USA, 2023; pp. 10–23. [Google Scholar] [CrossRef]
- Food Waste is Responsible for 6% of Global Greenhouse Gas Emissions. Available online: https://ourworldindata.org/food-waste-emissions (accessed on 1 September 2025).
- Inventario Nacional de Emisiones de Gases y Compuestos de Efecto Invernadero (INEGyCEI). 2021. Available online: https://datos.gob.mx/busca/dataset/inventario-nacional-de-emisiones-de-gases-y-compuestos-de-efecto-invernadero-inegycei (accessed on 15 September 2025).
- Atlas Nacional de Residuos Sólidos Urbanos. Available online: https://www.gob.mx/cms/uploads/attachment/file/693803/125_2022_Atlas_Nacional_Residuos_Solidos.pdf (accessed on 10 September 2025).
- Castillo-González, E.; De Medina-Salas, L. Generación y Composición de Residuos Sólidos Domésticos en Localidades Urbanas Pequeñas en el Estado de Veracruz, México. Rev. Int. Contam. Ambie. 2014, 30, 81–90. Available online: http://www.scielo.org.mx/scielo.php?script=sci_arttext&pid=S0188-49992014000100007&lng=es&tlng=es (accessed on 10 October 2025).
- Taboada-González, P.; Aguilar-Virgen, Q.; Ojeda-Benítez, S. Análisis Estadístico de Residuos Sólidos Domésticos en un Municipio Fronterizo de México. Av. Cienc. Ing. 2011, 2, 9–20. Available online: https://dialnet.unirioja.es/servlet/articulo?codigo=3624167 (accessed on 10 October 2025).
- Hernández-Berriel, M.; Aguilar-Virgen, Q.; Taboada-González, P.; Lima-Morra, R.; Eljaiek-Urzola, M.; Márquez-Benavides, L.; Buenrostro-Delgado, O. Generación y composición de los residuos sólidos urbanos en América latina y el caribe. Rev. Int. Contam. Ambie. 2016, 32, 11–22. [Google Scholar] [CrossRef]
- Bernache-Pérez, G. Riesgo de contaminación por disposición final de residuos: Un estudio de la región centro occidente de México. Rev. Int. Contam. Ambie. 2012, 28, 97–105. Available online: https://www.revistascca.unam.mx/rica/index.php/rica/article/view/34917 (accessed on 10 October 2025).
- Zuloaga-Cano, A. Estrategia Sustentable de Prevención y Gestión Integral de Residuos Sólidos Urbanos en San Isidro Mazatepec, Jalisco, México. Tesis de Maestría, Instituto Tecnológico y de Estudios Superiores de Occidente, Tlaquepaque, Mexico, 1 January 2021. Available online: http://rei.iteso.mx/handle/11117/6480 (accessed on 10 October 2025).
- ISO 14040:2006; Environmental Management—Life Cycle Assessment—Principles and Framework. International Organisation for Standardisation (ISO): Geneva, Switzerland, 2006. Available online: https://www.iso.org/obp/ui#iso:std:iso:14040:ed-2:v1:en (accessed on 10 October 2025).
- ISO 14044:2006; Environmental Management—Life Cycle Assessment—Requirements and Guidelines. International Organisation for Standardisation (ISO): Geneva, Switzerland, 2006. Available online: https://www.iso.org/obp/ui#iso:std:iso:14044:ed-1:v1:en (accessed on 10 October 2025).
- Sharma, B.; Chandel, M. Life cycle assessment of potential municipal solid waste management strategies for Mumbai, India. Waste Manag. Res. 2017, 35, 79–91. [Google Scholar] [CrossRef]
- Zhou, Z.; Tang, Y.; Dong, J.; Chi, Y.; Ni, M.; Li, N.; Zhang, Y. Environmental performance evolution of municipal solid waste management by life cycle assessment in Hangzhou, China. J. Environ. Manag. 2018, 227, 23–33. [Google Scholar] [CrossRef]
- Mancini, E.; Arzoumanidis, I.; Raggi, A. Evaluation of potential environmental impacts related to two organic waste treatment options in Italy. J. Clean. Prod. 2019, 214, 927–938. [Google Scholar] [CrossRef]
- Slorach, P.; Jeswani, H.; Cuéllar-Franca, R.; Azapagic, A. Environmental and economic implications of recovering resources from food waste in a circular economy. Sci. Total Environ. 2019, 693, 133516. [Google Scholar] [CrossRef] [PubMed]
- Weligama Thuppahige, R.T.; Babel, S. Environmental impact assessment of organic fraction of municipal solid waste treatment by anaerobic digestion in Sri Lanka. Waste Manag. Res. 2022, 40, 236–243. [Google Scholar] [CrossRef]
- Woon, K.; Lo, I. An integrated life cycle costing and human health impact analysis of municipal solid waste management options in Hong Kong using modified eco-efficiency indicator. Resour. Conserv. Recycl. 2016, 107, 104–114. [Google Scholar] [CrossRef]
- Mondragón-Zarza, E.; Hernández-Berriel, M.; Turpin-Marion, S.J.; Rosa-Domínguez, E.; Mañón-Salas, M.; Carreño-de-León, M.C. Review of appropriate and best-evaluated options with life cycle assessment for municipal solid waste management. Rev. Mex. Ing. Quím. 2024, 23, IA24215. [Google Scholar] [CrossRef]
- Ayodele, T.R.; Ogunjuyigbe, A.S.O.; Alao, M.A. Life cycle assessment of waste-to-energy (WtE) technologies for electricity generation using municipal solid waste in Nigeria. Appl. Energy 2017, 201, 200–218. [Google Scholar] [CrossRef]
- Jumare, I.A.; Bhandari, R.; Zerga, A. Environmental Life Cycle Assessment of Grid-Integrated Hybrid Renewable Energy Systems in Northern Nigeria. Sustainability 2019, 11, 5889. [Google Scholar] [CrossRef]
- Armoo, E.A.; Baidoo, T.; Mohammed, M.; Agyenim, F.B.; Kemausuor, F.; Narra, S. Environmental Assessment of Hybrid Waste-to-Energy System in Ghana. Energies 2025, 18, 595. [Google Scholar] [CrossRef]
- Anvari, S.; Medina, A.; Merchán, R.P.; Hernández, A.C. Sustainable solar/biomass/energy storage hybridization for enhanced renewable energy integration in multi-generation systems: A comprehensive review. Renew. Sustain. Energy Rev. 2025, 223, 115997. [Google Scholar] [CrossRef]
- Goicochea-Cardos, O. Evaluación ambiental del manejo de residuos sólidos domésticos en La Habana, Cuba. Ing. Ind. 2015, 36, 263–274. Available online: http://scielo.sld.cu/scielo.php?script=sci_arttext&pid=S1815-59362015000300004&lng=es&tlng=es (accessed on 10 October 2025).
- Ziegler-Rodriguez, K.; Margallo, M.; Aldaco, R.; Vázquez-Rowe, I.; Kahhat, R. Transitioning from open dumpsters to landfilling in Peru: Environmental benefits and challenges from a life-cycle perspective. J. Clean. Prod. 2019, 229, 989–1003. [Google Scholar] [CrossRef]
- Lima, P.D.M.; Colvero, D.A.; Gomes, A.P.; Wenzel, H.; Schalch, V.; Cimpan, C. Environmental assessment of existing and alternative options for management of municipal solid waste in Brazil. Waste Manag. 2018, 78, 857–870. [Google Scholar] [CrossRef]
- Espinoza Pérez, L.; Ziegler-Rodríguez, K.; Espinoza Pérez, A.T.; Vásquez, Ó.C.; Vázquez-Rowe, I. Closing the gap in the municipal solid waste management between metropolitan and regional cities from developing countries: A life cycle assessment approach. Waste Manag. 2021, 124, 314–324. [Google Scholar] [CrossRef]
- Galván, S.L.; Bielsa, R.O. Use of life cycle assessment for estimating impacts of waste-to-energy technologies in solid waste management systems: The case of Buenos Aires, Argentina. Environ. Sci. Pollut. Res. 2024, 31, 9992–10012. [Google Scholar] [CrossRef]
- Carrasco-Gallegos, B.V.; Tadeo-Vargas, J. Incineración de residuos en Cementeras como una falsa solución inserta en los mercados de carbono. Entretextos 2014, 18, 1–13. [Google Scholar] [CrossRef]
- de Titto, E.; Savino, A. Environmental and health risks related to waste incineration. Waste Manag. Res. 2019, 37, 976–986. [Google Scholar] [CrossRef]
- Khan, I.; Chowdhury, S.; Techato, K. Waste to Energy in Developing Countries—A Rapid Review: Opportunities, Challenges, and Policies in Selected Countries of Sub-Saharan Africa and South Asia towards Sustainability. Sustainability 2022, 14, 3740. [Google Scholar] [CrossRef]
- COP29 UN Climate Conference Agrees to Triple Finance to Developing Countries, Protecting Lives and Livelihoods. United Nations Climate Change (UNFCC). Available online: https://unfccc.int/news/cop29-un-climate-conference-agrees-to-triple-finance-to-developing-countries-protecting-lives-and (accessed on 27 September 2025).
- Botello-Álvarez, J.; Rivas-García, P.; Fausto-Castro, L.; Estrada-Baltazar, A.; Gomez-Gonzalez, R. Informal collection, recycling and export of valuable waste as transcendent factor in the municipal solid waste management: A Latin-American reality. J. Clean. Prod. 2018, 182, 485–495. [Google Scholar] [CrossRef]
- Aldana-Espitia, N.B.-Á.-G.; Cerino-Córdova, F.; Bravo-Sánchez, M.; Abel-Seabra, J.; Estrada-Baltazar, A. Environmental impact mitigation during the solid waste management in an industrialized city in Mexico: An approach of life cycle assessment. Rev. Mex. Ing. Quím. 2017, 16, 563–580. [Google Scholar]
- En Monterrey Transforman la Basura en Electricidad. Available online: https://www.bancomundial.org/es/news/video/2013/02/06/in-monterrey-mexico-garbage-is-turned-into-electricity#:~:text=Un%20relleno%20sanitario%20en%20Monterrey%2C%20en%20el,de%201%20mill%C3%B3n%20de%20toneladas%20de%20CO2 (accessed on 27 September 2025).
- Comunicado de Prensa “Pasa Anuncia Inauguración de Planta Generadora de Energía Eléctrica” en el Relleno Sanitario de la Ciudad de León, Guanajuato. Available online: https://www.pasa.mx/storage/42d75bb9a853fd0c0cbdafcefef141d3_image.pdf (accessed on 27 September 2025).
- Tagle-Zamora, D. Mirada y Reflexión de la Gestión de Residuos Sólidos Urbanos en León, Guanajuato, 1st ed.; Universidad de Guanajuato: Guanajuato, México, 2024; pp. 89–115. Available online: http://repositorio.ugto.mx/handle/20.500.12059/11225 (accessed on 10 October 2025).
- NOM-083-SEMARNAT-2003. Available online: https://www.dof.gob.mx/nota_detalle.php?codigo=658648&fecha=20/10/2004#gsc.tab=0 (accessed on 1 June 2025).
- Boletín UNAM-DGCS-464. Científicos de la UNAM Transforman Basura Orgánica en Energía. Available online: https://www.dgcs.unam.mx/boletin/bdboletin/2016_464.html (accessed on 28 September 2025).
- NOM-098-SEMARNAT-2002. Available online: https://www.profepa.gob.mx/innovaportal/file/1309/1/nom-098-semarnat-2002.pdf (accessed on 28 September 2025).
- “ECORI”: Planta de Separación de Residuos Sólidos Orizaba. Revista Iberoamericana de Gobierno Local (RIGL). No. 19, Junio. 2021. Available online: https://revista.cigob.net/20-diciembre-2021/cronicas/ecori-planta-de-separacion-de-residuos-solidos-orizaba-GKCG/ver-online/ (accessed on 27 September 2025).
- ¡Con Basura! EXATEC Desarrolla Planta de Energía a Través de Residuos. Available online: https://conecta.tec.mx/es/noticias/santa-fe/sostenibilidad/con-basura-exatec-desarrolla-planta-de-energia-traves-de-residuos (accessed on 2 October 2025).
- El Aliado Ideal en Soluciones Sostenibles en la Gestión de Residuos. Available online: https://www.holcim.com.mx/geocycle (accessed on 1 October 2025).
- Censo Poblacional y Vivienda 2020. Available online: https://www.inegi.org.mx/programas/ccpv/2020/ (accessed on 6 September 2024).
- Proyecciones de la Población de México y de las Entidades Federativas, 2016–2050. Available online: https://datos.gob.mx/busca/dataset/proyecciones-de-la-poblacion-de-mexico-y-de-las-entidades-federativas-2016-2050 (accessed on 3 August 2025).
- NMX-AA-015-1985; Environmental Protection—Soil Pollution—Municipal Solid Residues—Sampling—Quarter Method. Secretaria de Comercio y Fomento Industrial: México, México, 1985. Available online: https://biblioteca.semarnat.gob.mx/janium/Documentos/Ciga/agenda/DOFsr/NMX-AA-015-1985.pdf (accessed on 10 September 2025).
- NMX-AA-022-1985; Environmental Protection-Soil Pollution-Municipal Solid Residues-by-Products Selection and Quantification. Secretaria de Comercio y Fomento Industrial: México, México, 1985. Available online: https://biblioteca.semarnat.gob.mx/janium/Documentos/Ciga/agenda/DOFsr/NMX-AA-022-1985.pdf (accessed on 10 September 2025).
- Diagnóstico Básico para la Gestión Integral de los Residuos. Available online: https://www.gob.mx/cms/uploads/attachment/file/554385/DBGIR-15-mayo-2020.pdf (accessed on 9 September 2025).
- Bando Municipal Xalatlaco. Available online: https://legislacion.edomex.gob.mx/sites/legislacion.edomex.gob.mx/files/files/pdf/bdo/bdo119.pdf (accessed on 1 August 2025).
- Behrooznia, L.; Shari, M.; Hosseinzadeh-Bandbafha, H. Comparative life cycle environmental impacts of two scenarios for managing an organic fraction of municipal solid waste in Rasht-Iran. J. Clean. Prod. 2020, 268, 122217. [Google Scholar] [CrossRef]
- Organic Farming. Available online: https://www.britannica.com/topic/organic-farming (accessed on 1 May 2025).
- Rosa, M.; Fernandes, T.; Aparecida-Pereira, A. Bayesian approach for evaluating ammonia volatilization nitrogen losses in fertilizers applied to coffee plants. Sci. Agrotech. 2025, 49, e019324. [Google Scholar] [CrossRef]
- Super Fostato Triple. Available online: https://www.deluser.es/nikafol-20-20-20-phytohermes-abono-triple-20-para-nutricion-foliar-y-fertirrigacion-Articulo-245#:~:text=Promueve%20el%20crecimiento%20uniforme%3A%20La,saludables%20y%20con%20mayores%20rendimientos (accessed on 7 April 2025).
- Dalpaz, R.; Konrad, O.; Cândido-da-Silva, C.; Panis-Barzotto, H.; Hasan, C.; Guerini-Filho, M. Using biogas for energy cogeneration: An analysis of electric and thermal energy generation from agro-industrial waste. Sustain. Energy Technol. Assess. 2020, 40, 100774. [Google Scholar] [CrossRef]
- Manual del Usuario Modelo Mexicano de Biogás Versión 2.0. SCS Engineers, Contrato de EPA No. EP-W-06-023. Available online: https://globalmethane.org/documents/events_land_20090326_landfill-26mar09_intro_mexico_lfg_model_alex_stege.pdf (accessed on 7 August 2025).
- Aguilar-Virgen, Q.; Taboada-González, P.; Ojeda-Benítez, S. Modelo mexicano para la estimación de la generación de biogás. Ingeniería 2011, 15, 37–45. Available online: https://www.revista.ingenieria.uady.mx/volumen15/modelo.pdf (accessed on 10 October 2025).
- Mitiku-Teferra, D.; Wubu, W. Biogas for Clean Energy, 1st ed.; IntechOpen: New Delhi, India, 2019; pp. 1–20. [Google Scholar] [CrossRef]
- Khandelwal, H.; Thalla, A.; Kumar, S.; Kumar, R. Life cycle assessment of municipal solid waste management options for India. Bioresour. Technol. 2019, 288, 121515. [Google Scholar] [CrossRef]
- Shrestha, P.; Ghimire, A.; Dangi, M.; Urynowicz, M. Development of a Municipal Solid Waste Management Life Cycle Assessment Tool for Banepa Municipality, Nepal. Sustainability 2023, 15, 9954. [Google Scholar] [CrossRef]
- Yadav, P.; Samadder, S. Environmental impact assessment of municipal solid waste management options using life cycle assessment: A case study. Environ. Sci. Pollut. Res. 2018, 25, 838–854. [Google Scholar] [CrossRef]
- Cheela, V.; John, M.; Biswas, W.; Dubey, B. Environmental impact evaluation of current municipal solid waste treatments in India using life cycle assessment. Energies 2021, 14, 3133. [Google Scholar] [CrossRef]
- IPCC Guidelines for National Greenhouse Gas Inventories. 2006. Available online: https://www.ipcc-nggip.iges.or.jp/public/2006gl/pdf/5_Volume5/V5_3_Ch3_SWDS.pdf (accessed on 7 August 2025).
- Cárdenas-Moreno, P.R.; Piña-Guzmán, A.B.; Robles-Martínez, F. Estimación del biogás generado en sitios de disposición final del Estado de México. Rev. Int. Contam. Ambient. 2021, 37, 27–38. [Google Scholar] [CrossRef]
- Hadzic, A.; Voca, N.; Golubic, S. Lifecycle assessment of solid-waste management in city of Zagreb, Croatia. J. Mater. Cycles Waste Manag. 2018, 20, 1286–1298. [Google Scholar] [CrossRef]
- Rana, R.; Ganguly, R.; Gupta, A. Life-cycle assessment of municipal solid-waste management strategies in Tricity region of India. J. Mater. Cycles Waste Manag. 2019, 21, 606–623. [Google Scholar] [CrossRef]
- Richard, E.; Hilonga, A.; Machunda, R.; Njau, K. Life cycle analysis of potential municipal solid wastes management scenarios in Tanzania: The case of Arusha City. Sustain. Environ. Res. 2021, 31, 1. [Google Scholar] [CrossRef]
- Bajracharya, S.; Adhikari, A.; Shrestha, P.; Ghimire, A. Life-cycle assessment of solid waste management in Dhulikhel Municipality, Nepal. J. Environ. Eng. Sci. 2022, 17, 147–154. [Google Scholar] [CrossRef]
- Maalouf, A.; El-Fadel, M. Life cycle assessment for solid waste management in Lebanon: Economic implications of carbon credit. Waste Manag. Res. 2019, 37, 14–26. [Google Scholar] [CrossRef] [PubMed]
- Jaglan, A.; Cheela, V.; Vinaik, M.; Dubey, B. Environmental Impact Evaluation of University Integrated Waste Management System in India Using Life Cycle Analysis. Sustainability 2022, 14, 8361. [Google Scholar] [CrossRef]
- Zarea, M.; Moazed, H.; Ahmadmoazzam, M.; Malekghasemi, S.; Jaafarzadeh, N. Life cycle assessment for municipal solid waste management: A case study from Ahvaz, Iran. Environ. Monit. Assess. 2019, 191, 131. [Google Scholar] [CrossRef]
- Behrooznia, L.; Sharifi, M.; Alimardani, R.; Mousavi-Avval, S. Sustainability analysis of landfilling and composting-landfilling for municipal solid waste management in the north of Iran. J. Clean. Prod. 2018, 203, 1028–1038. [Google Scholar] [CrossRef]
- Jaafarzadeh, N.; Ahmadmoazzam, M.; Kojloo, R.; Jorfi, S.; Baasim, Y. The environmental performance of four municipal solid waste management scenarios: A life cycle assessment study. Environ. Qual. Manag. 2021, 31, 77–84. [Google Scholar] [CrossRef]
- Aldhafeeri, Z.; Alhazmi, H. Sustainability Assessment of Municipal Solid Waste in Riyadh, Saudi Arabia, in the Framework of Circular Economy Transition. Sustainability 2022, 14, 5093. [Google Scholar] [CrossRef]
- Chiu, S.; Lo, I. Reviewing the anaerobic digestion and co-digestion process of food waste from the perspectives on biogas production performance and environmental impacts. Environ. Sci. Pollut. Res. 2016, 23, 24435–24450. [Google Scholar] [CrossRef]
- Joseph, B.; Stichnothe, H. Considering Grouped or Individual Non-Methane Volatile Organic Compound Emissions in Life Cycle Assessment of Composting Using Three Life Cycle Impact Assessment Methods. Recycling 2024, 9, 35. [Google Scholar] [CrossRef]
- Bernstad-Saraiva, A.; Souza, R.; Valle, R. Comparative lifecycle assessment of alternatives for waste management in Rio de Janeiro—Investigating the influence of an attributional or consequential approach. Waste Manag. 2017, 68, 701–710. [Google Scholar] [CrossRef] [PubMed]
- Caicedo-Concha, D.; Sandoval-Cobo, J.; Stringfellow, A.; Colmenares-Quintero, R. An evaluation of final disposal alternatives for municipal solid waste through life cycle assessment: A case of study in Colombia. Cogent Eng. 2021, 8, 1956860. [Google Scholar] [CrossRef]
- Dastjerdi, B.; Strezov, V.; Kumar, R.; He, J.; Behnia, M. Comparative life cycle assessment of system solution scenarios for residual municipal solid waste management in NSW, Australia. Sci. Total Environ. 2021, 767, 144355. [Google Scholar] [CrossRef] [PubMed]
- Morero, B.; Montagna, A.; Campanella, E.; Cafaro, D. Optimal process design for integrated municipal waste management with energy recovery in Argentina. Renew. Energy 2020, 146, 2626–2636. [Google Scholar] [CrossRef]
- De Feo, G.; Ferrara, C.; Iuliano, C.; Grosso, A. LCA of the collection, transportation, treatment, and disposal of source separated municipal waste: A Southern Italy case study. Sustainability 2016, 8, 1084. [Google Scholar] [CrossRef]
- Bisinella, V.; Götze, R.; Conradsen, K.; Damgaard, A.; Christensen, T.; Astrup, T. Importance of waste composition for Life Cycle Assessment of waste management solutions. Int. J. Life Cycle Assess. 2016, 21, 378–394. [Google Scholar] [CrossRef]
- Parkes, O.L. Life cycle assessment of integrated waste management systems for alternative legacy scenarios of the London Olympic Park. Waste Manag. 2015, 40, 157–166. [Google Scholar] [CrossRef]
- Rajcoomar, A.; Ramjeawon, T. Life cycle assessment of municipal solid waste management scenarios on the small island of Mauritius. Waste Manag. Res. 2017, 35, 313–324. [Google Scholar] [CrossRef]
- Rajaeifar, M.; Tabatabaei, M.; Ghanavati, H.; Khoshnevisan, B.; Rafiee, S. Comparative life cycle assessment of different municipal solid waste management scenarios in Iran. Renew. Sustain. Energy Rev. 2015, 51, 886–898. [Google Scholar] [CrossRef]
- Wang, J.; Tian, B.; Li, R.; Li, J. Life cycle assessment of heat, CO2 from composting for greenhouse applications. J. CO2 Util. 2025, 92, 103031. [Google Scholar] [CrossRef]
- Serafini, L.F.; Feliciano, M.; Rodrigues, M.A.; Gonçalves, A. Systematic Review and Meta-Analysis on the Use of LCA to Assess the Environmental Impacts of the Composting Process. Sustainability 2023, 15, 1394. [Google Scholar] [CrossRef]
- Barahmand, Z.; Samarakoon, G. Sensitivity analysis and anaerobic digestion modeling: A scoping review. Fermentation 2022, 8, 624. [Google Scholar] [CrossRef]
- Kumawat, R.; Gidwani, L.; Rana, K.B. Comparative analysis of life cycle assessment of biogas-powered and coal-powered power plant for optimized environmental operation. Heliyon 2024, 10, e39155. [Google Scholar] [CrossRef] [PubMed]
- Ijeoma, M.W.; Chukwu, B.N.; Yakubu, R.O.; Chen, H.; Carbajales-Dale, M. A comparative and prospective life cycle assessment of agricultural fruit wastes disposal: A case study. Int. J. Life Cycle Assess. 2025, 20, 1–20. [Google Scholar] [CrossRef]
- Ouedraogo, A.S.; Kumar, A.; Frazier, R.; Sallam, K.A. Comparative Life Cycle Assessment of Landfilling with Sustainable Waste Management Methods for Municipal Solid Wastes. Environments 2024, 11, 248. [Google Scholar] [CrossRef]
Disclaimer/Publisher’s Note: The statements, opinions and data contained in all publications are solely those of the individual author(s) and contributor(s) and not of MDPI and/or the editor(s). MDPI and/or the editor(s) disclaim responsibility for any injury to people or property resulting from any ideas, methods, instructions or products referred to in the content. |
© 2025 by the authors. Licensee MDPI, Basel, Switzerland. This article is an open access article distributed under the terms and conditions of the Creative Commons Attribution (CC BY) license (https://creativecommons.org/licenses/by/4.0/).