Article

Effect of Rock Structure on Seismic Wave Propagation

1
State Key Laboratory of Metal Mine Mining Safety and Disaster Prevention and Control, University of Science and Technology Beijing, Beijing 100083, China
2
Key Laboratory of Xinjiang Coal Resources Green Mining, Ministry of Education, Xinjiang Institute of Engineering, Urumqi 830023, China
3
Xinjiang Key Laboratory of Coal Mine Disaster Intelligent Prevention and Emergency Response, Xinjiang Institute of Engineering, Urumqi 830023, China
*
Author to whom correspondence should be addressed.
Sustainability 2025, 17(20), 9325; https://doi.org/10.3390/su17209325
Submission received: 7 September 2025 / Revised: 23 September 2025 / Accepted: 17 October 2025 / Published: 21 October 2025

Abstract

The extraction of geothermal energy is of great significance for sustainable energy development. The destruction of hard rock masses during geothermal well exploitation generates seismic waves that can compromise wellbore stability and operational sustainability. Seismic waves are known to be affected by rock structures like cracks and interfaces. However, a quantitative understanding of these effects on wave parameters is still lacking. This study addresses this gap by experimentally investigating the effect of crack geometry (angle and width) and rock interfaces on seismic wave propagation. Using a synchronous system for rock loading and seismic wave acquisition, we analyzed wave propagation through carbonate rock samples with pre-defined cracks and interfaces under unconfined, dry laboratory conditions. Key wave parameters (amplitude, frequency, and energy) were extracted using the fast Fourier transform (FFT) and the Hilbert–Huang transform (HHT). Our primary findings show the following: (1) Increasing the crack angle from 35° to 75° and the width from 1 mm to 3 mm leads to significant attenuation, reducing peak amplitude by up to 94.0% and energy by over 99.8%. (2) A tightly pressed rock interface also causes severe attenuation (94.2% in amplitude and 99.9% in energy) but can increase the main frequency by up to 8.5%, a phenomenon attributed to a “boundary effect”. (3) Seismic wave parameters exhibit significant spatial variations depending on the propagation path relative to the source and rock structures. This study provides a fundamental, quantitative baseline for how rock structures govern seismic wave attenuation and parameter shifts, which is crucial to improving microseismic monitoring and wellbore integrity assessment in geothermal engineering.

1. Introduction

With the rapid development of modern economy, most of the construction has begun to move to the deep, and deep engineering such as ultra deep drilling, deep earth laboratory, nuclear waste disposal, and geothermal resource exploitation is booming in the world. Among them, the development and utilization of geothermal energy has attracted more and more attention (Wang et al. 2023 [1]). The efficient development of geothermal energy depends on the integrity of wellbores and the reliability of surface facilities. However, in this complex underground engineering activity, human intervention will inevitably disturb the in situ stress field and induce a series of microseismic events (Um et al. 2023 [2]). The seismic waves generated by these microseismic events potentially affect wellbore integrity, the safety of surface facilities, and the sustainability of long-term operation (Tunc et al. 2023 [3]). Therefore, it is of great significance to accurately reveal the influence of rock structures such as crack and rock interfaces on the propagation of seismic waves for accurately evaluating the stability of geothermal wellbores.
Li et al. [4] studied the seismic wave propagation law for different filling joint thickness by a linear elastic thin-layer model. Lu et al. [5] studied the influence and attenuation law of medium material and porosity on seismic wave propagation. It is concluded that the material type has the most significant control effect on seismic wave attenuation propagation, followed by porosity and saturation. In addition, Fan et al. [6] studied the influence of the medium difference on both sides of the joint with saturated fluid on the propagation of oblique incident longitudinal waves. It was found that when the joint viscosity was not considered, the reflection coefficient of longitudinal waves and transverse waves increased with the increase in incident wave frequency, the transmission coefficient of longitudinal waves decreased, and the transmission coefficient of transverse waves increased first and then decreased. Considering joint viscosity, the difference between the reflection coefficient and the transmission coefficient under different viscosity coefficients decreases with the increase in the incident frequency. Yu et al. [7] established the theoretical equations of longitudinal waves, shear waves, and Rayleigh waves, which reflect the attenuation characteristics of seismic waves, based on blasting experiments. Nourhan et al. [8] found that with the increase in rock mass stiffness, the existence of discontinuity has a greater impact on the attenuation of longitudinal and shear wave amplitude. Chai et al. [9] derived the formula for calculating the transmission and reflection coefficients of longitudinal waves in viscoelastic filled cracks and found that the viscoelasticity of rock mass produces amplitude attenuation and delay effects on the propagation of longitudinal waves. The greater the thickness of the filled joint, the more obvious the attenuation. Wu et al. [10] found that when a longitudinal wave propagates in a sand-filled fracture, the loading rate and the main frequency decrease. Zhao et al. [11] studied the propagation law of stress waves through a set of parallel cracks by using the characteristic line method and displacement discontinuity theory. Syu et al. [12] found that S-waves have significant attenuation and travel time delays as they pass through geothermal reservoirs and magma chambers. Through exploration in the laboratory, Toksoz et al. [13] concluded that various mechanisms affecting the propagation of seismic waves in rock strata mainly include wave diffusion, mutual friction among rock particles, fluid flow in pores, and relaxation effects of rock. Lu [14] put forward the concept of cavity effect and found that the local amplification effect of surface vibration velocity is caused by the existence of a cavity. Based on the theory of wave mechanics, Li et al. [15] studied the propagation of seismic waves in a single fault rock mass and the induced ground motion and analyzed the influence of fault stiffness, fault strike, incident angle, and incident wave frequency on the peak particle velocity of ground motion. Samuel Chapman et al. [16] observed the decompression experiment of Berea sandstone with saturated carbon dioxide water by X-ray CT scans and designed a seismic wave propagation experiment to measure the attenuation and dispersion of the sample. The results of the CT scans were numerically simulated, and the results were consistent with the laboratory measurement results. Jan V.M. et al. [17] measured the attenuation and dispersion of seismic waves in fully saturated carbonate rocks. Michael L.B. et al. [18] analyzed the influence of permeability and viscosity of fluid in rock on the attenuation of seismic waves and the dispersion of wave velocity by means of stress–strain, a resonance bar, and ultrasonic measurement. Sun et al. [19] measured the attenuation and dispersion of seismic waves in sandstone media under dry, saturated salt water, and saturated oil conditions by forced oscillation experiments. Yin et al. [20] independently developed an experimental system to measure the elastic properties of rock samples in a wide frequency band and measured the attenuation and dispersion of seismic waves of saturated nitrogen, saturated salt water, and saturated glycerol tight sandstone samples under different pressures. Cheng et al. [21] used cracks with different aspect ratios to conduct a comprehensive study of the velocity changes caused by seismic waves. The results show that the crack size significantly affects the velocity of seismic waves. Guo and Song et al. [22,23,24] studied the influence of fracture thickness on the dispersion and attenuation of seismic waves and pointed out that the dispersion and attenuation are more significant in the low-frequency region where the fracture size is smaller than the wavelength. Fu et al. [25] pointed out that when the diameter of the circular crack is equal to the length of the slit crack, the characteristic frequency of the peak attenuation of the seismic wave is the same by comparing the dispersion of the seismic wave in the slit crack and the circular crack. Tan et al. [26] analyzed the problem of seismic wave scattering in porous media with rectangular cracks based on the Biot model. Song et al. [27,28,29] further studied the seismic wave scattering problem of circular cracks and rectangular cracks subjected to vertically incident seismic waves and pointed out that the low-frequency seismic wave velocity of the rectangular model may be different from the low-frequency seismic wave velocity of the circular model and the slit crack model, and when the distance between adjacent cracks decreases, the dispersion and attenuation amplitude of the seismic wave increase significantly.
The existing results mainly focus on the influence of rock structure on seismic wave attenuation through experiments and do not consider the influence of other parameters, such as seismic wave frequency. The influence of rock structure on the propagation of P-waves and S-waves is currently in the preliminary exploration stage. The effect of rock structure on P-waves and S-waves and its physical mechanism are still unclear, particularly regarding how geometric parameters (crack angle/width) and interfaces quantitatively modulate P-/S-wave differentiation in spatial propagation paths. Prior studies could not resolve this due to limitations in synchronized acquisition of source–receiver waveforms under controlled stress and decoupled quantification of P- and S-wave parameters affected by localized structures. This gap impedes the real-time monitoring of engineering safety and the early warning of potential risks in geothermal well exploitation. To address this gap by establishing a foundational understanding, this study employs a synchronized loading acquisition system under simplified, unconfined, and dry laboratory conditions. The aim is to isolate and quantify how fundamental rock structures (cracks and interfaces) spatially resolve P-/S-wave parameter changes, providing an essential experimental quantification of how crack geometry governs wave-mode conversion efficiency.

2. Methodology: Integrated Experimental and Analytical Framework

2.1. Experimental Equipment

In this study, a rock-loading, seismic wave excitation, and seismic wave signal synchronous acquisition system, including a loading control system, an acoustic emission (AE) monitoring system, and a seismic wave signal synchronous acquisition system was built, as shown in Figure 1. The loading control instrument used in this experiment is a YAW-600 pressure test machine, located in Beijing, China. The receiving frequency of the acoustic emission monitoring system is 50~400 kHz. The amplification factor of the preamplifier can be adjusted in three gears of 20, 40, and 60 dB. The frequency band of the built-in filter is 20~1.5 MHz. The data acquisition and processing device adopts a DS5-16 B full-information acoustic emission signal analysis system.

2.2. Experimental Scheme

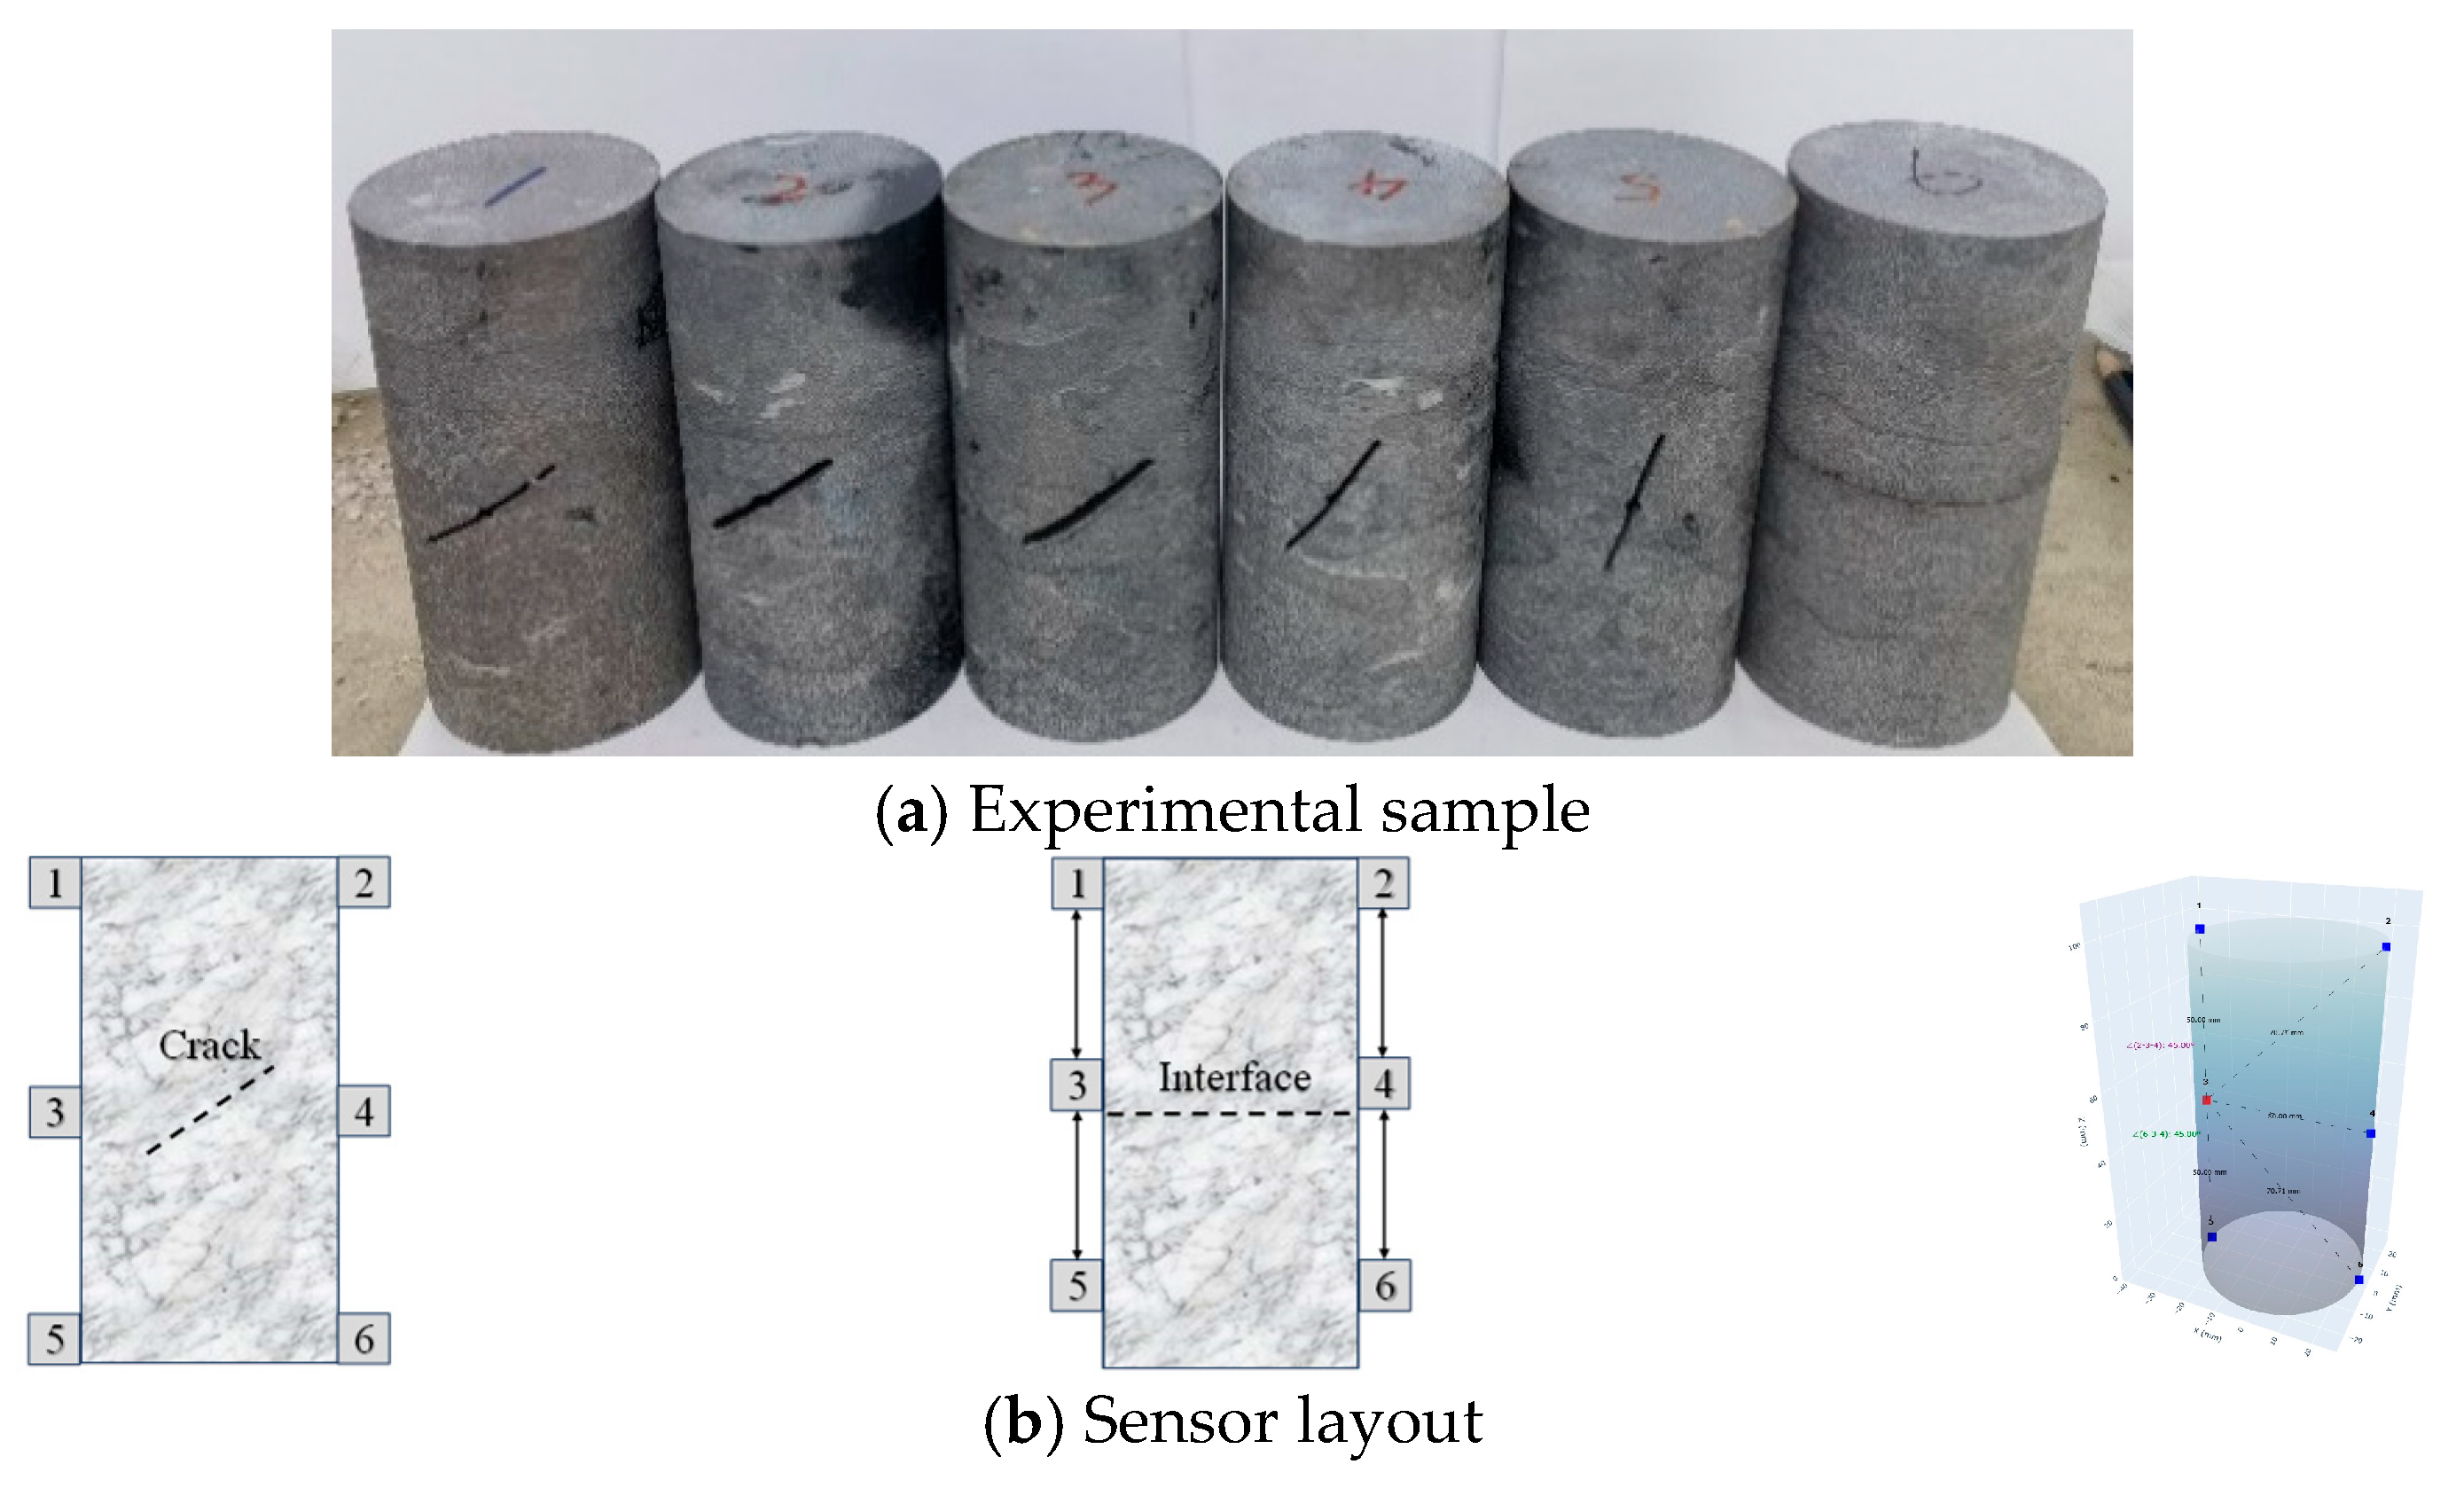
According to national standards GB/T 23561.7-2009 [30], common carbonate rock from China was processed into six standard samples with a sample size of Φ 50 × 100 mm. Cracks were introduced in specimens 1–5 according to different angles and widths. The specific parameters of the cracks are shown in Table 1. Specimen 6 was cut along the cross-section of the specimen center to simulate the rock interface. The completed specimens are shown in Figure 2a. In the seismic wave excitation-receiving experiment, six acoustic emission sensors were arranged on the surface of each sample to truly record the seismic wave signals received by the acoustic emission sensors at different spatial positions after the excitation of the seismic wave. The arrangement of the sensors is shown in Figure 2b. To provide a clear geometric framework for our analysis, we established a 3D Cartesian coordinate system with its origin at the center of the sample’s base. The cylindrical sample had a radius of 25 mm and a height of 100 mm. The six acoustic emission sensors were placed on the cylinder’s surface. The crack or interface was located in the center of the sample, aligned with the y-z plane (at x = 0). This setup allows for a clear distinction between wave paths that cross the central discontinuity and those that do not. For instance, when sensor #3 is the source, paths to sensors #2, #4, and #6 directly interrogate the discontinuity, whereas paths to sensors #1 and #5 travel along the same side of the sample.
During the loading process, the rock sample was loaded by 2 μm/s displacement control. When the pressure reached 10 MPa, the loading was stopped to maintain the pressure, so as to simulate the vertical stress state of the rock at a certain buried depth. The equivalent vertical stress σ v was derived from σ v = ρgH k t , where ρ = 2700 kg/m3, g = 9.8  m/s2, and k t = 1.2–2.0. This was solved for H ≈ 380–630 m. This range aligns with typical geothermal well depths in carbonate reservoirs. It is important to note that these unconfined, dry, and room-temperature conditions were intentionally chosen to isolate the influence of their on seismic wave parameters. After 3 min of holding pressure, seismic wave excitation began. The excitation wave period was 50 ms, and the excitation interval was 1000 ms. The seismic wave was excited, and each acquisition sensor started signal acquisition synchronously. The sampling frequency was set to 3 MHz.

2.3. Signal Processing Methodology

To ensure robustness and transparency, a detailed signal processing workflow was established, as illustrated in Figure 3. The raw seismic signals, sampled at 3 MHz, underwent a multi-step procedure for parameter extraction.
  • Pre-processing:
(1) Filtering: A zero-phase bandpass filter (Butterworth, 4th order) was applied between 20 kHz and 400 kHz to isolate the frequency band of interest, consistent with the acoustic emission sensor’s response range.
(2) Time gating: The signal was windowed to the first arrival ±50 µs to focus the analysis on the primary wave packet and minimize reflections from sample boundaries.
(3) De-noising: A wavelet thresholding technique (using a Symlet 8 wavelet with a soft, universal threshold) was employed to suppress background noise.
2.
Analysis and Parameter Extraction:
(1) Following pre-processing, two parallel analyses were conducted: the FFT for frequency-domain analysis and the HHT for time–frequency–energy analysis.
Amplitude: Defined as the peak absolute voltage of the time-gated, de-noised waveform.
Frequency: To provide a robust measure, the main frequency was calculated from the FFT results. It is defined as
f c = 0 f S f d f 0 S f d f
where S(f) is the power spectral density at frequency f. This metric represents the weighted average frequency and is less sensitive to spurious peaks than a simple maximum peak measurement. The term “main frequency” in this paper refers to this main frequency.
(2) Energy: The instantaneous energy was analyzed using the HHT. The process involved the operations reported below.
Empirical Mode Decomposition (EMD): The signal was decomposed into a finite set of Intrinsic Mode Functions (IMFs). The standard EMD algorithm as implemented in MATLAB’s emd function(Version R2021a, 9.10.0) was used. The sifting process was terminated based on a Cauchy-type convergence criterion, where the standard deviation between two consecutive sifting iterations fell below a threshold of 0.2. To mitigate end effects, a characteristic wave-based extension method was applied at the signal boundaries.
Hilbert Transform: The Hilbert transform was applied to each IMF to obtain the analytic signal, from which the instantaneous frequency and amplitude (envelope) were derived.
Relative Energy Calculation: The signal’s relative energy was calculated by integrating the square of the Hilbert envelope of the waveform. As a full electromechanical calibration was not performed, results are presented in arbitrary units (a.u.) to represent relative changes.

3. Effect of Seismic Wave Characteristic Parameters by Rock Structure

3.1. Effect of Crack Angle to the Characteristic Parameters of Seismic Waves

To investigate the effect of the fracture angle, sensor #3 was used as the excitation source on samples 1, 4, and 5. Each sample was excited for 10 rounds, and sensors #1, #2, #4, #5, and #6 were used as the receiving sources for receiving. Under the third excitation of sample 1, the original waveform of the seismic wave signal received by the excitation source and sensor #4 and the spectrum processed by the Fourier fast transform (FFT) are shown in Figure 4. Blue arrows and red arrows point to the peak amplitude and main frequency of the signal, respectively. It can be seen from Figure 4 that the peak amplitude of the seismic wave signal received by sample 1’s receiving source with a crack angle of 35° is 2.3388 mV, which is 76.61% lower than that of the excited 10 mV, and the main frequency of the receiving source is reduced by 1 kHz.
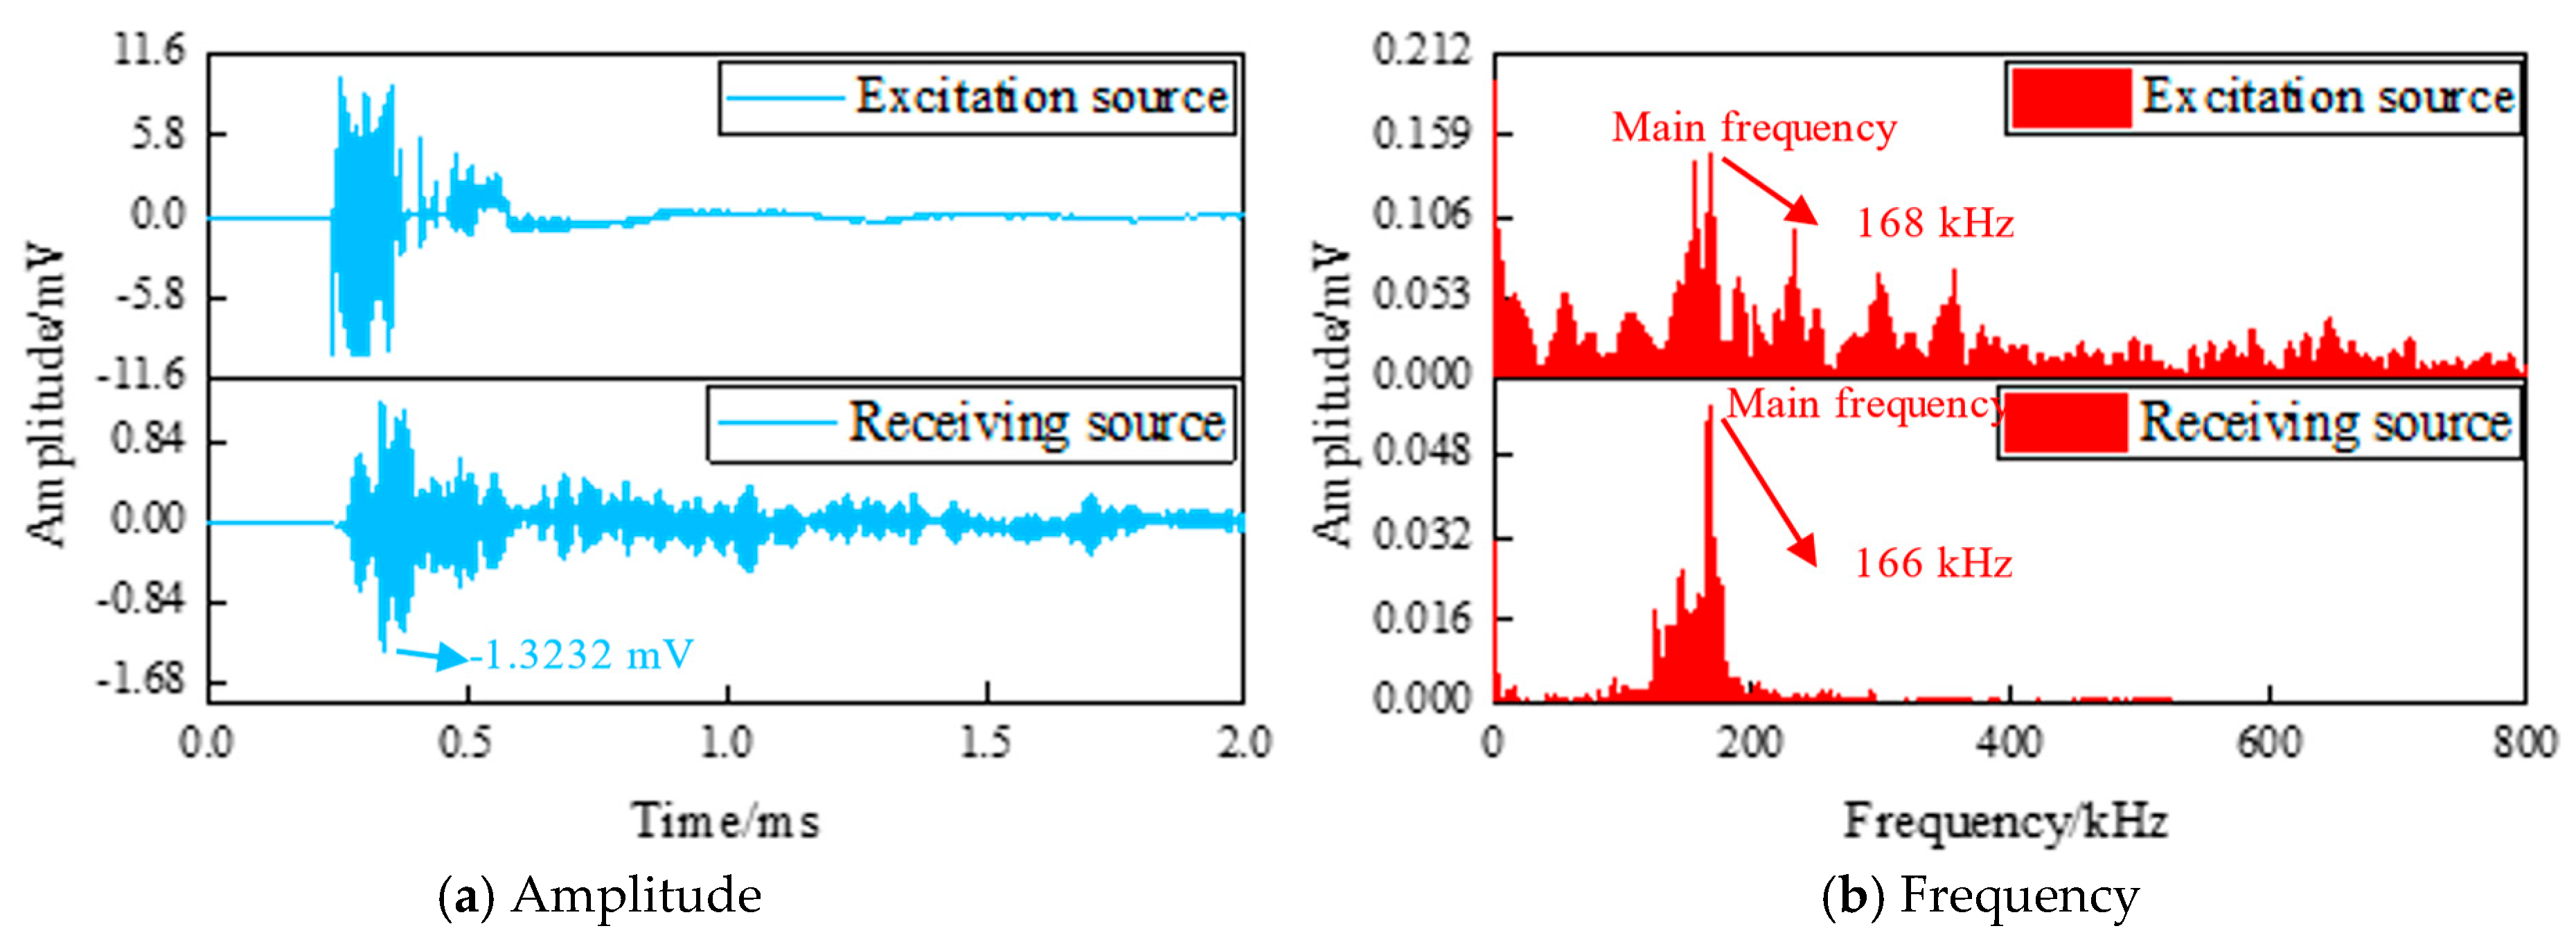
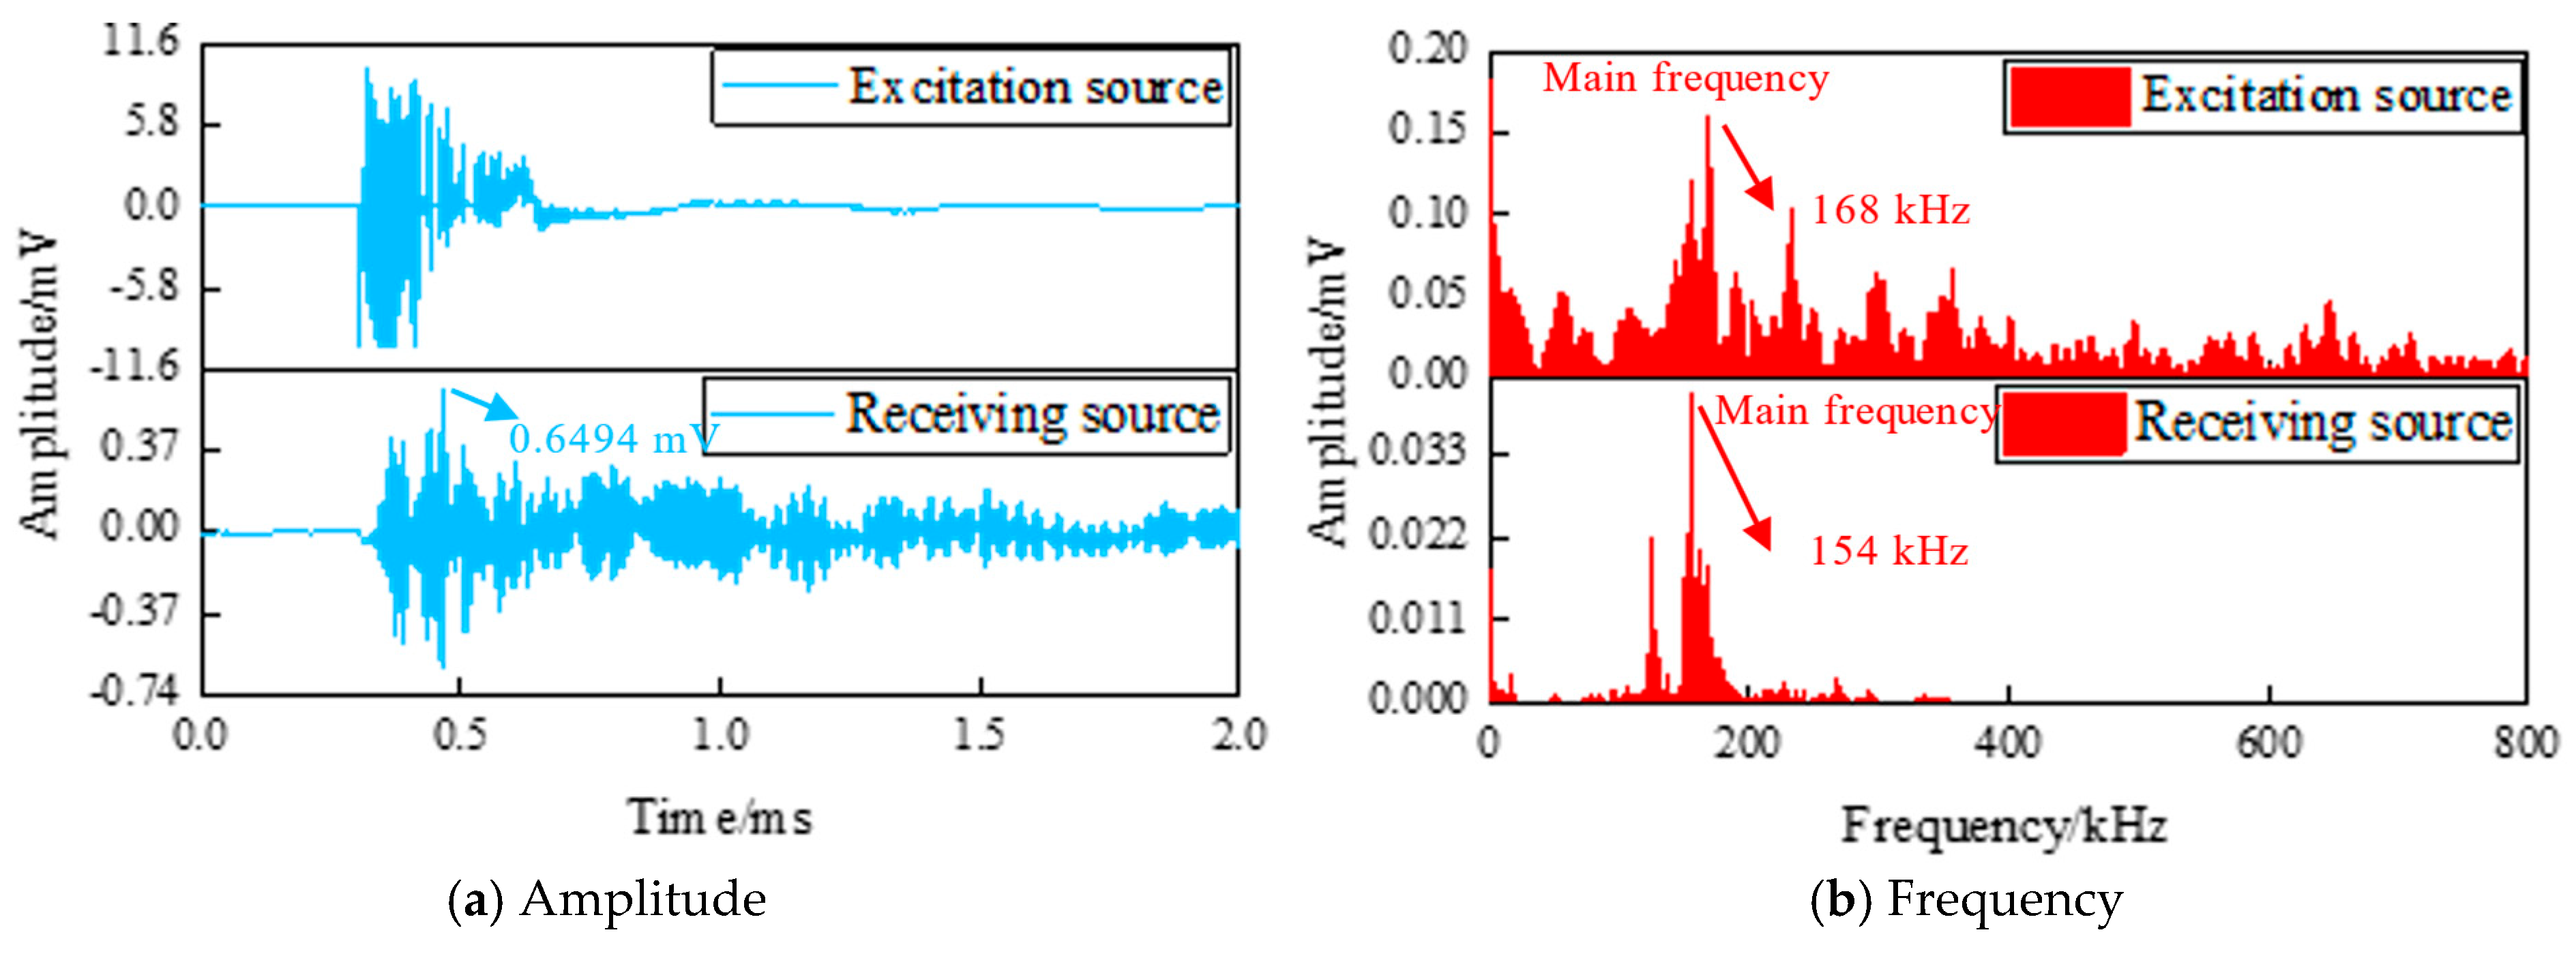
The amplitude and frequency of the seismic wave received by the excitation source and sensor #4 of specimens 4 and 5 with crack angles of 55° and 75° are shown in Figure 5 and Figure 6. The peak amplitude and main frequency of the receiving source also show a decreasing law. The peak amplitudes are −1.3232 mV and 0.6494 mV, respectively, which are 86.77% and 93.51% lower than the excitation source. The main frequencies are 166 kHz and 154 kHz, respectively, which are reduced by 2 kHz and 14 kHz compared with the excitation source. It can be found that after the seismic wave passes through the crack, the peak amplitude and main frequency of the seismic wave change. The decrease in the peak amplitude and main frequency of the received source seismic wave increases with the increase in the crack angle, and the two show a positive correlation. This shows that in the process of seismic wave propagation, the angle of fracture and the fracture surface of rock mass in geothermal well affects the change in seismic wave parameters.
In the study of seismic wave damage to rock mass, the effects of fractures on seismic waves (e.g., attenuation and frequency shifts) should be considered.
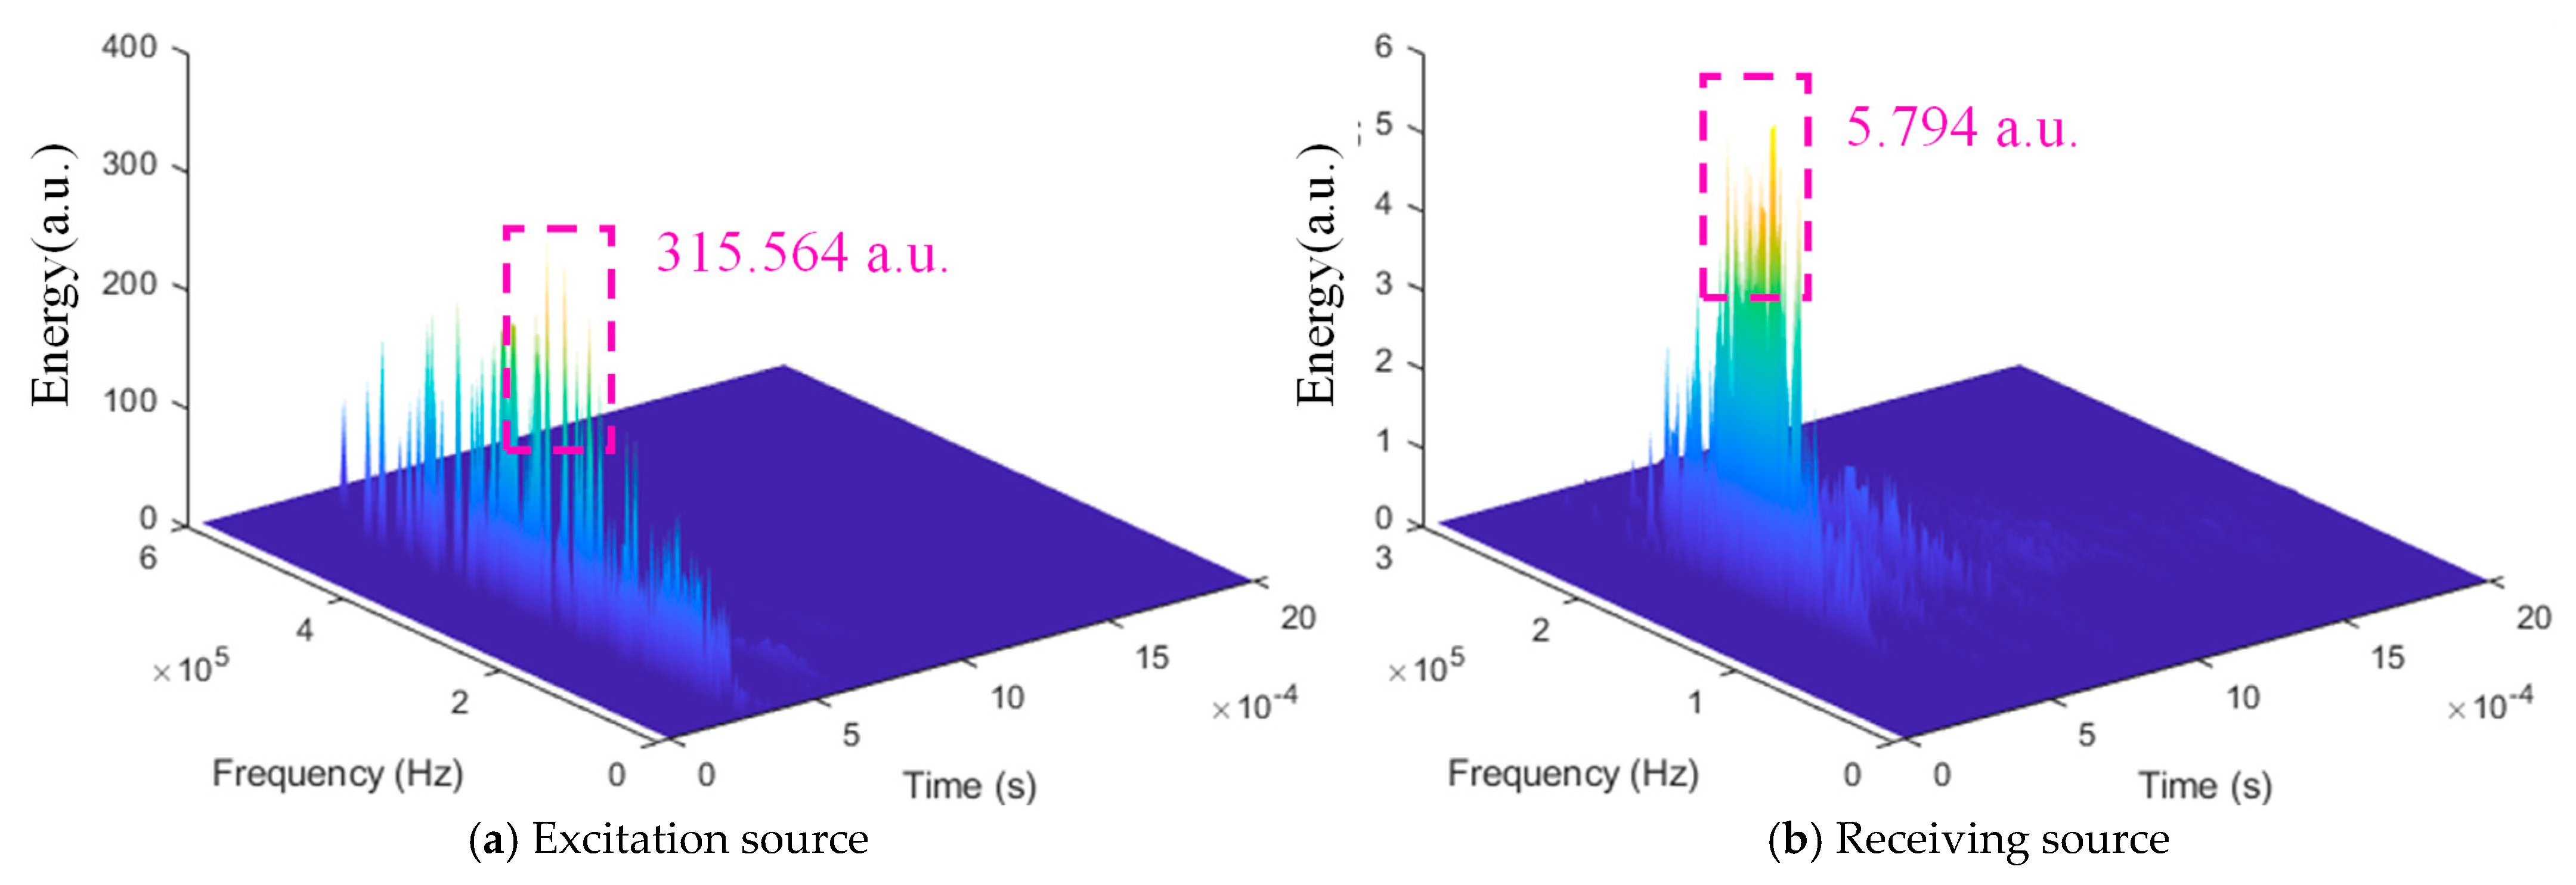
The HHT was used to analyze the energy changes of the seismic wave as it propagated from the source to sensor #4 across the crack. The results are shown in Figure 7, Figure 8 and Figure 9. It can be found that the energy of the receiving source of the three samples is greatly reduced compared with the excitation source. The peak energy of the receiving source of sample 1 decreased from 315.564 a.u. to 5.794 a.u., with a decrease of 98.16%. The peak energy of the receiving source of sample 4 decreased from 299.762 a.u. to 1.826 a.u., with a decrease of 99.39%. The peak energy of the receiving source of sample 5 decreased from 269.334 a.u. to 0.468 a.u., with a decrease of 99.82%. The attenuation degree of the received source energy increases with the increase in the fracture angle, and the two show a positive correlation. This result is the same as the peak amplitude and the main frequency of the above seismic wave, and the three show unity.
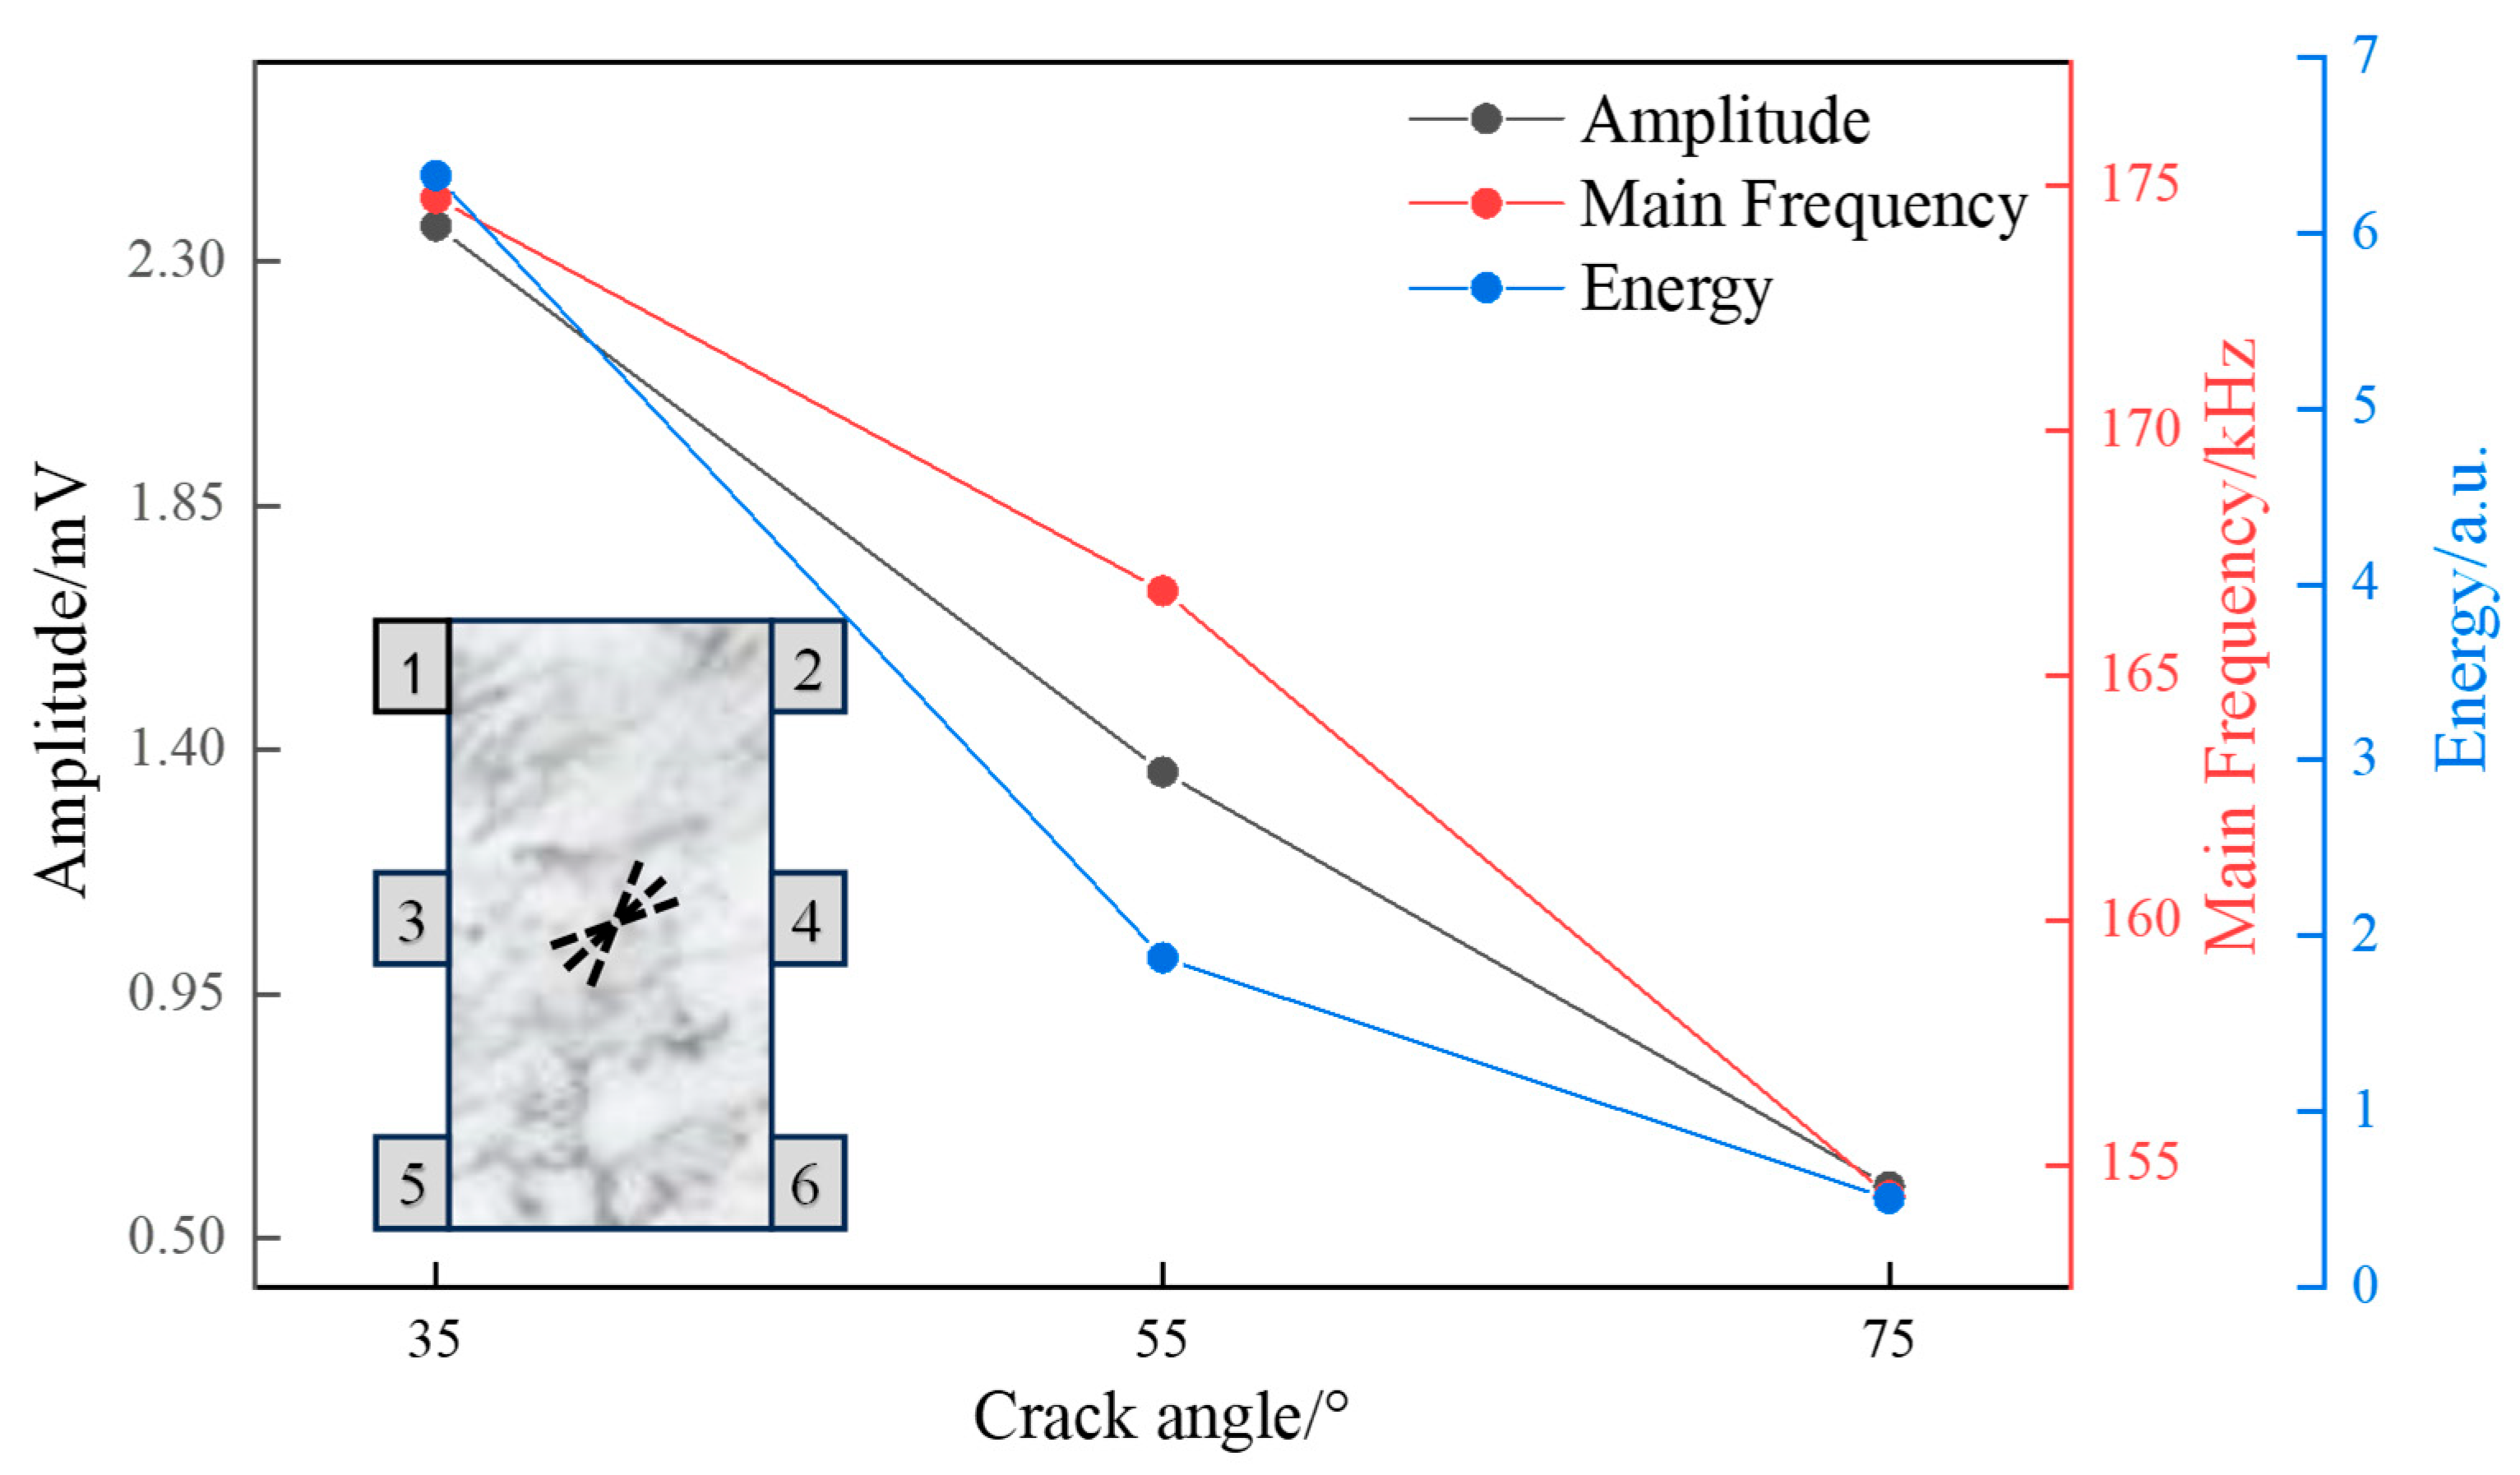
The received waves of sensor #4 after 10 rounds of excitation are statistically analyzed. The amplitude, main frequency, and average energy of the seismic wave signals received by sensor #4 are shown in Table 2. When the crack angle is 35°, the average peak value of the received waveform amplitude is 2.3649 mV, the average main frequency of the received waveform is 174.7 kHz, and the average peak value of the received waveform energy is 6.357 a.u.; when the crack angle is 55°, the average peak value of the received waveform amplitude is 1.3587 mV, the average main frequency of the received waveform is 166.7 kHz, and the average peak value of the received waveform energy is 1.883 a.u.; when the crack angle is 75°, the average peak value of the received waveform amplitude is 0.5953 mV, the average main frequency of the received waveform is 154.3 kHz, and the average peak value of the received waveform energy is 0.507 a.u. The peak amplitude, main frequency, and energy peak of the seismic wave received by the receiving source of the above-mentioned different angle samples are drawn into a line chart, as shown in Figure 10. It can be found that with the increase in the crack angle, the peak amplitude, main frequency, and energy peak of the seismic wave signal received by the receiving source of the 10 excitations are gradually reduced. The fitting equations and R2 of the three parameters were obtained using linear fitting, as shown in Table 3. Linear regression analysis confirmed a strong and statistically significant negative correlation between crack width and all measured wave parameters. The amplitude peak (R2 = 0.99), main frequency (R2 = 0.98), and energy peak (R2 = 0.91) all decreased systematically as the crack width increased from 35° to 75°. This robust statistical relationship supports the hypothesis that a more inclined crack acts as a more effective barrier to wave propagation, increasing scattering effects and energy loss, consistently with scattering theory.
This is because the three factors of reflection and refraction, scattering, and energy loss in the process of seismic wave propagation are superimposed. Reflection and refraction: Large-angle cracks increase the reflection and refraction paths of waves, resulting in energy dispersion and loss. Scattering: Large-angle cracks enhance the scattering effect of the wave, so that the energy of the wave is dispersed in all directions. Energy loss: The high-frequency component is more easily absorbed or scattered by large-angle cracks, resulting in the frequency of the wave moving to the low frequency. The schematic diagram and simulation diagram of seismic wave propagation in the sample are shown in Figure 11.
The observed seismic wave attenuation across fractures and interfaces can be quantitatively described by the linear-slip displacement discontinuity model (DDM). This model treats a fracture or interface as a non-welded boundary characterized by a normal specific stiffness, KN, and a tangential specific stiffness, KT. These stiffnesses represent the elastic resistance of the interface to normal and shear deformations, respectively.
For a planar P-wave with normal incidence (θ = 0°) with respect to the interface, the reflection (RPP) and transmission (TPP) coefficients are given by
R P P = i ω Z P 2 K N + i ω Z P
T P P = 2 K N 2 K N + i ω Z P
Similarly, for a normally incident S-wave, the reflection (RSS) and transmission (TSS) coefficients are
R S S = i ω Z S 2 K T + i ω Z S
T S S = 2 K T 2 K T + i ω Z S
The symbols and their corresponding units used in this model are defined in Table 4.
For the air-filled cracks in our samples (No. 1–5), the interface is compliant, meaning that the specific stiffnesses are very low ( K N 0 and K T 0 ). By substituting K N 0 into Equations (1) and (2), we get R P P 1 and T P P 0 . This theoretical prediction indicates near-total reflection of the wave energy at the crack, with minimal transmission. This is highly consistent with our experimental observations, where energy attenuation across the crack exceeded 99% (e.g., 99.81% for sample 5, as shown in Table 2). The model thus confirms that the high attenuation is due to the wave reflecting off the compliant, air-filled crack interface. The increasing attenuation with crack angle and width can be attributed to the larger effective area of the reflective discontinuity encountered by the propagating wave front.

3.2. Effect of Crack Width on Characteristic Parameters of Seismic Waves

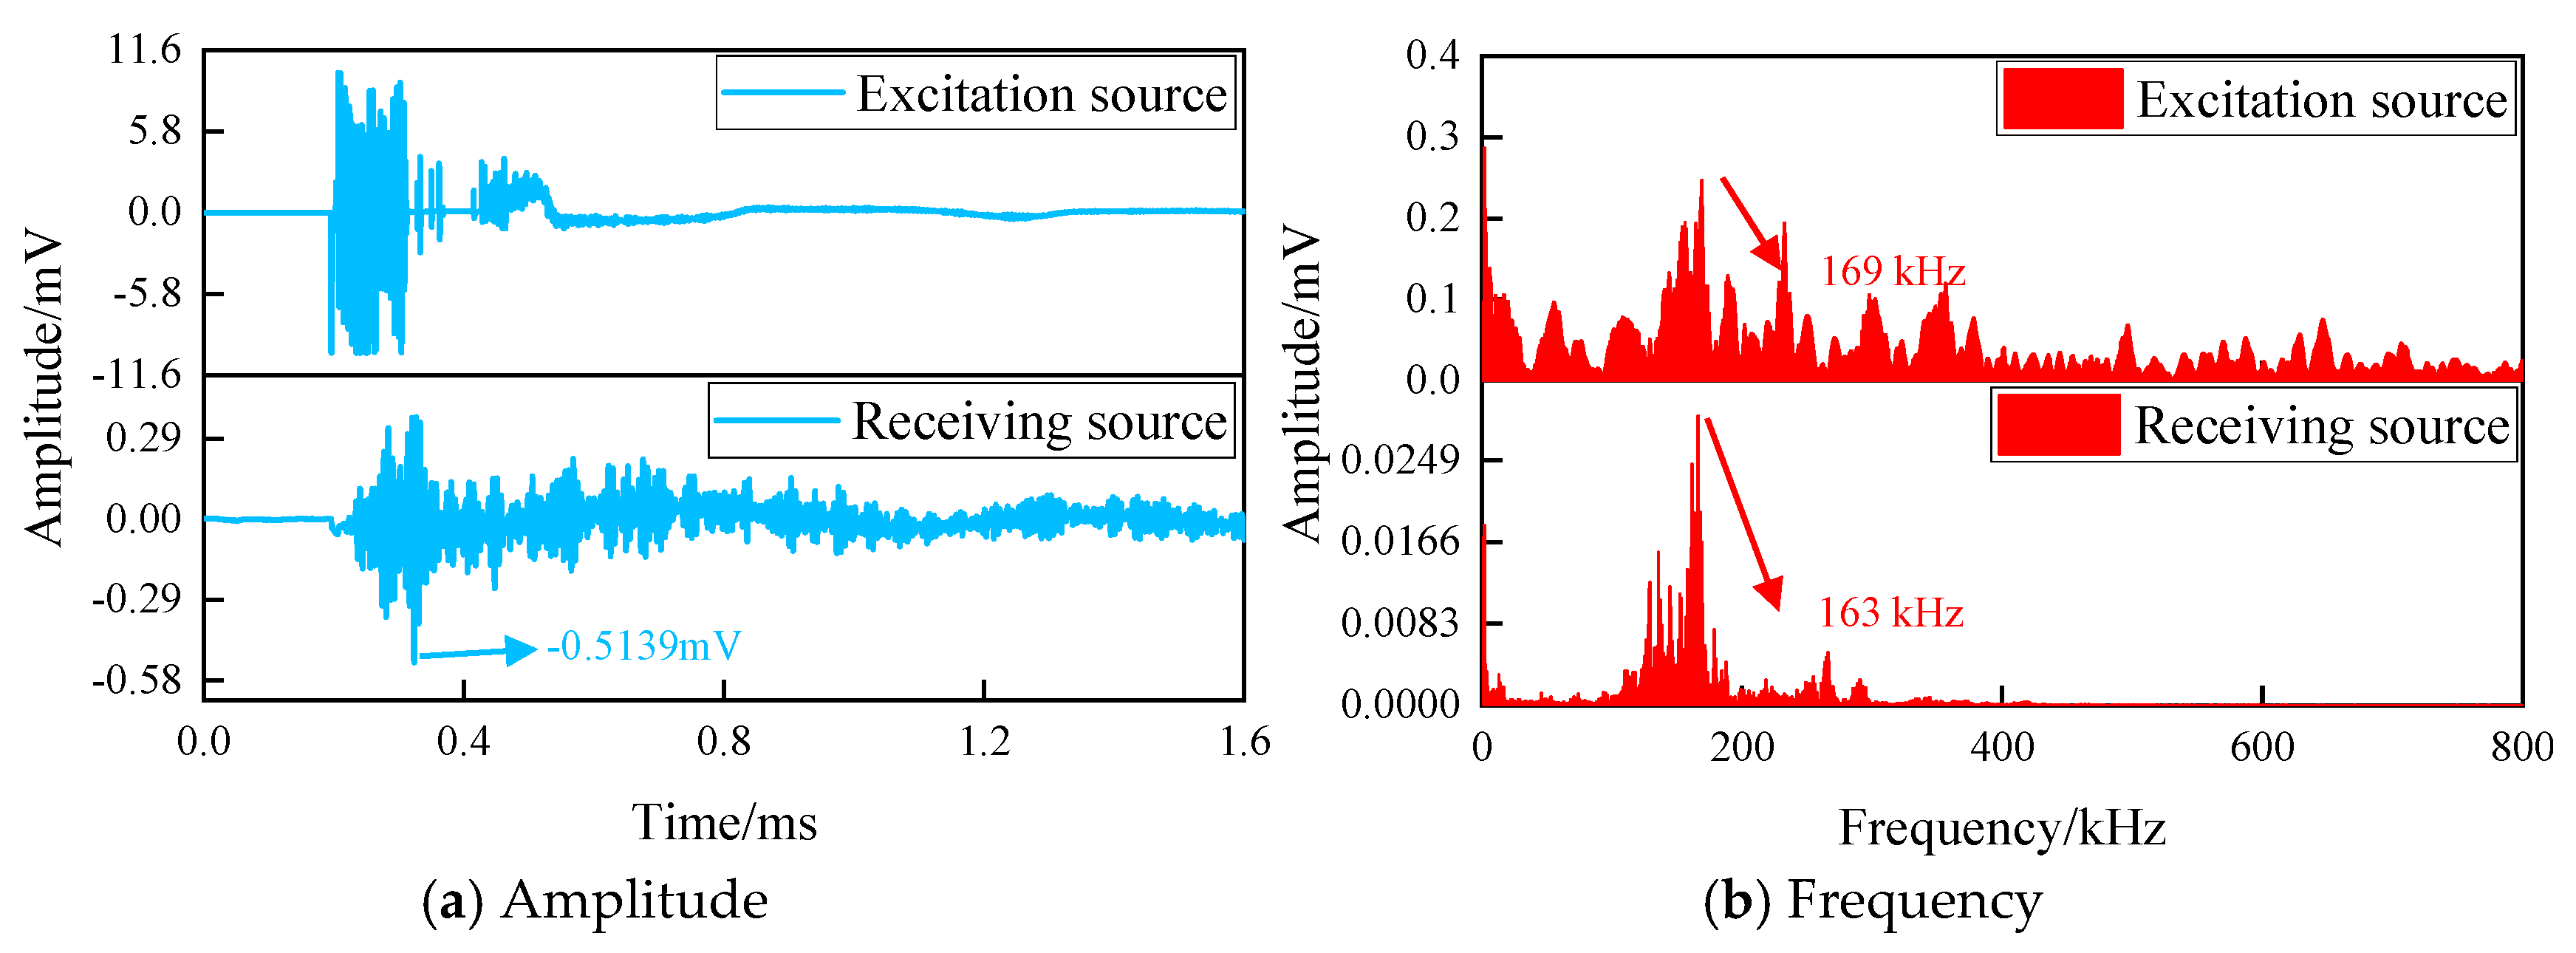
In the study of the influence of crack width on the characteristic parameters of seismic waves, sensor #3 installed in samples 1, 2, and 3 was used as the excitation source. Each sample was excited for 10 rounds, and sensors #1, #2, #4, #5, and #6 were used as the receiving sources. The waveform and spectrum of the excitation source and the receiving source of specimen 1 with a crack width of 1 mm are shown in Figure 4. The amplitude and frequency of the seismic wave received by the excitation source and sensor #4 of specimens 2 and 3 with crack widths of 2 mm and 3 mm are shown in Figure 12 and Figure 13. The peak amplitude and main frequency of the receiving source also show a similar decrease law as that of specimen 1. The peak amplitudes are 0.7226 mV and 0.5139 mV, respectively, which are 92.77% and 94.86% lower than those of the excitation source. The dominant frequencies are 166 kHz and 163 kHz, respectively, which are reduced by 3 kHz and 6 kHz compared with the excitation source. It can be found that after the seismic wave passes through the crack, the amplitude and main frequency of the seismic wave change, and the degree of decrease in the peak amplitude and the main frequency of the received source seismic wave signal increases with the increase in the crack width. The two show a positive correlation, which is the same as the law in Section 3.1 above.
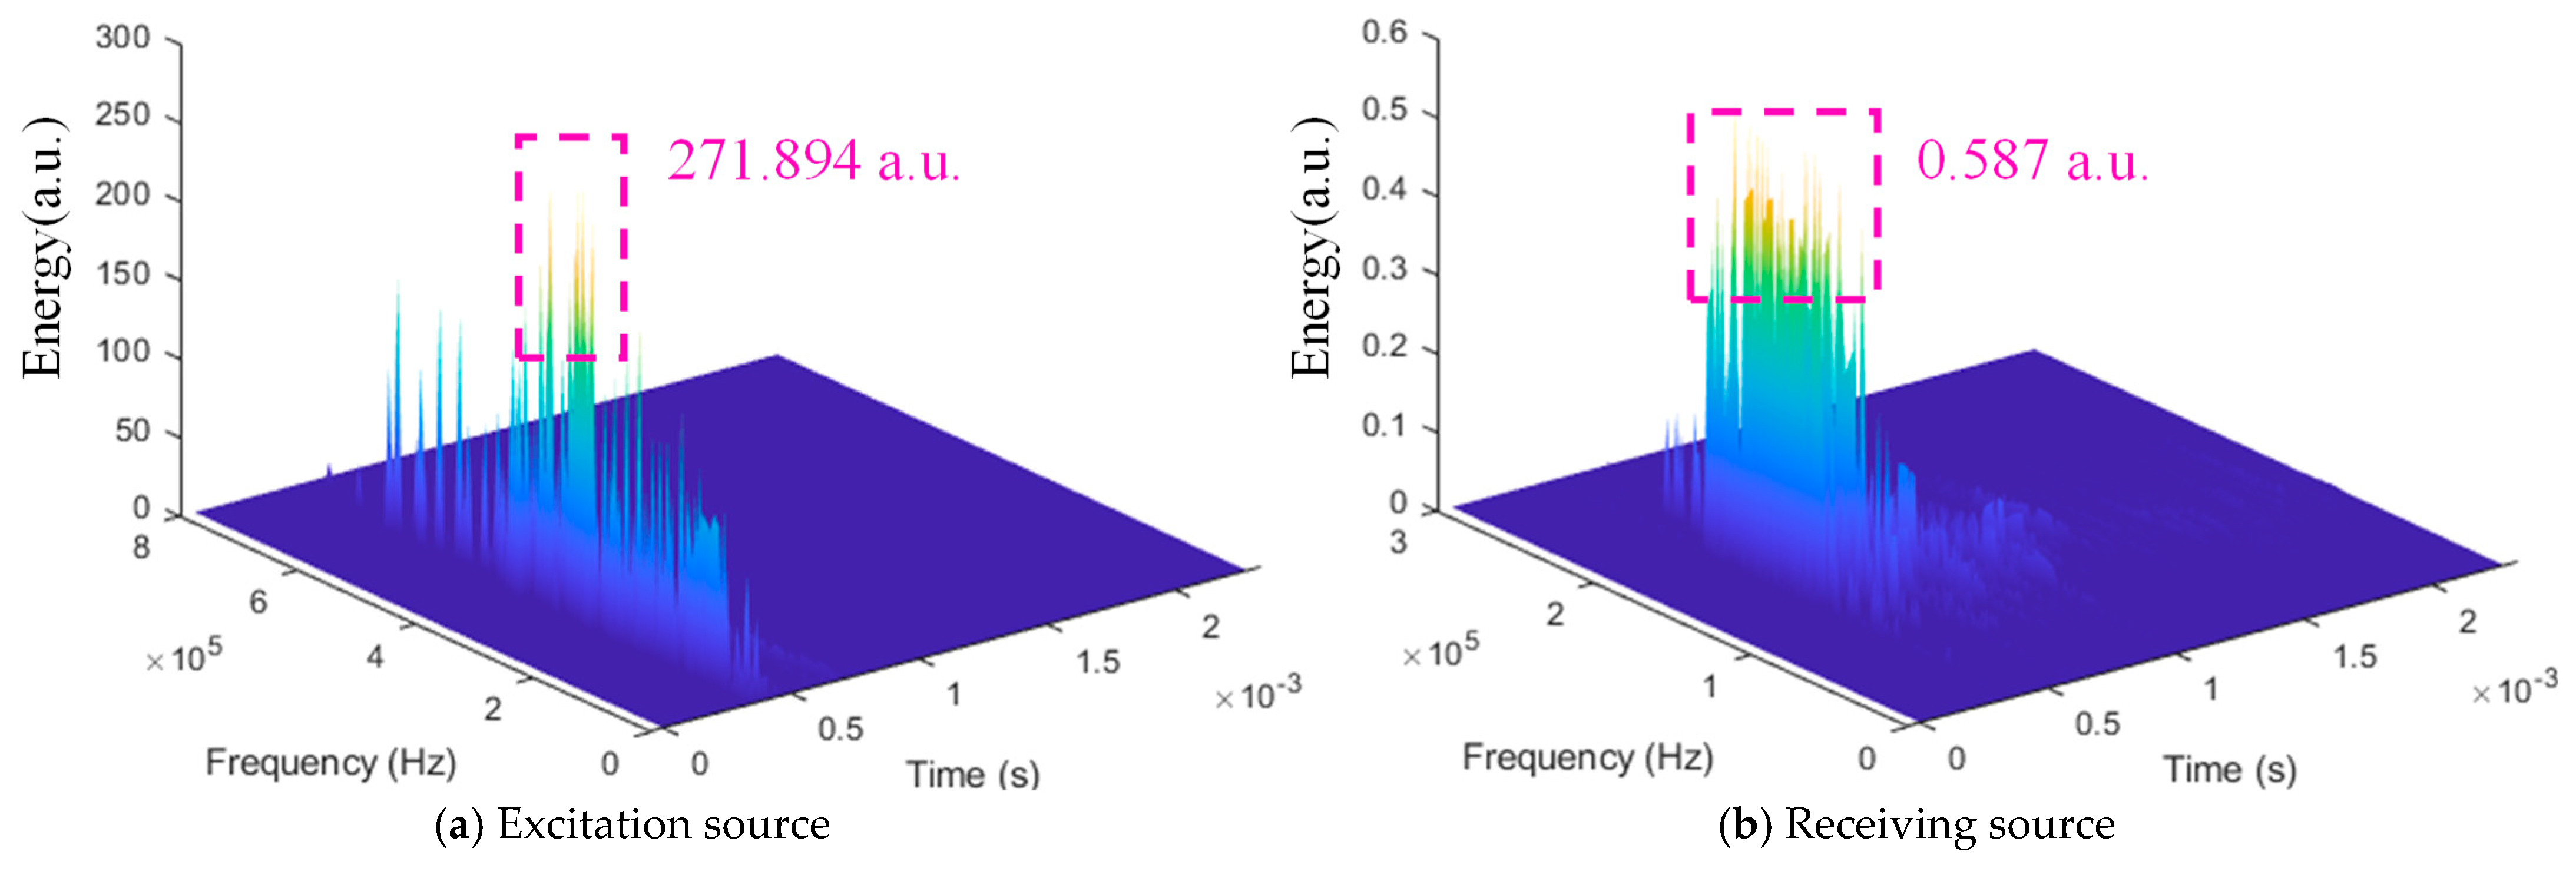
The HHT was used to analyze the change in seismic wave energy parameters when the seismic wave generated by the excitation source reached receiving sensor #4 after being affected by the crack. The results of specimen 1 with a crack width of 1 mm are shown in Figure 7. The HHT energy spectra of specimens 2 and 3 with crack widths of 2 mm and 3 mm are shown in Figure 14 and Figure 15. It can be found that the receiving source energy of the three samples has a greater degree of decline compared with the excitation source. The peak value of the receiving source energy of sample 2 decreased from 271.894 a.u. to 0.587 a.u., with a decrease of 99.78%. The peak energy of the receiving source of sample 3 decreased from 262.770 a.u. to 0.267 a.u., with a decrease of 99.90%. The attenuation degree of the received source energy increases with the increase in the crack width, and the two show a positive correlation. This result is the same as the peak amplitude and the main frequency of the above seismic wave, and the three show unity.
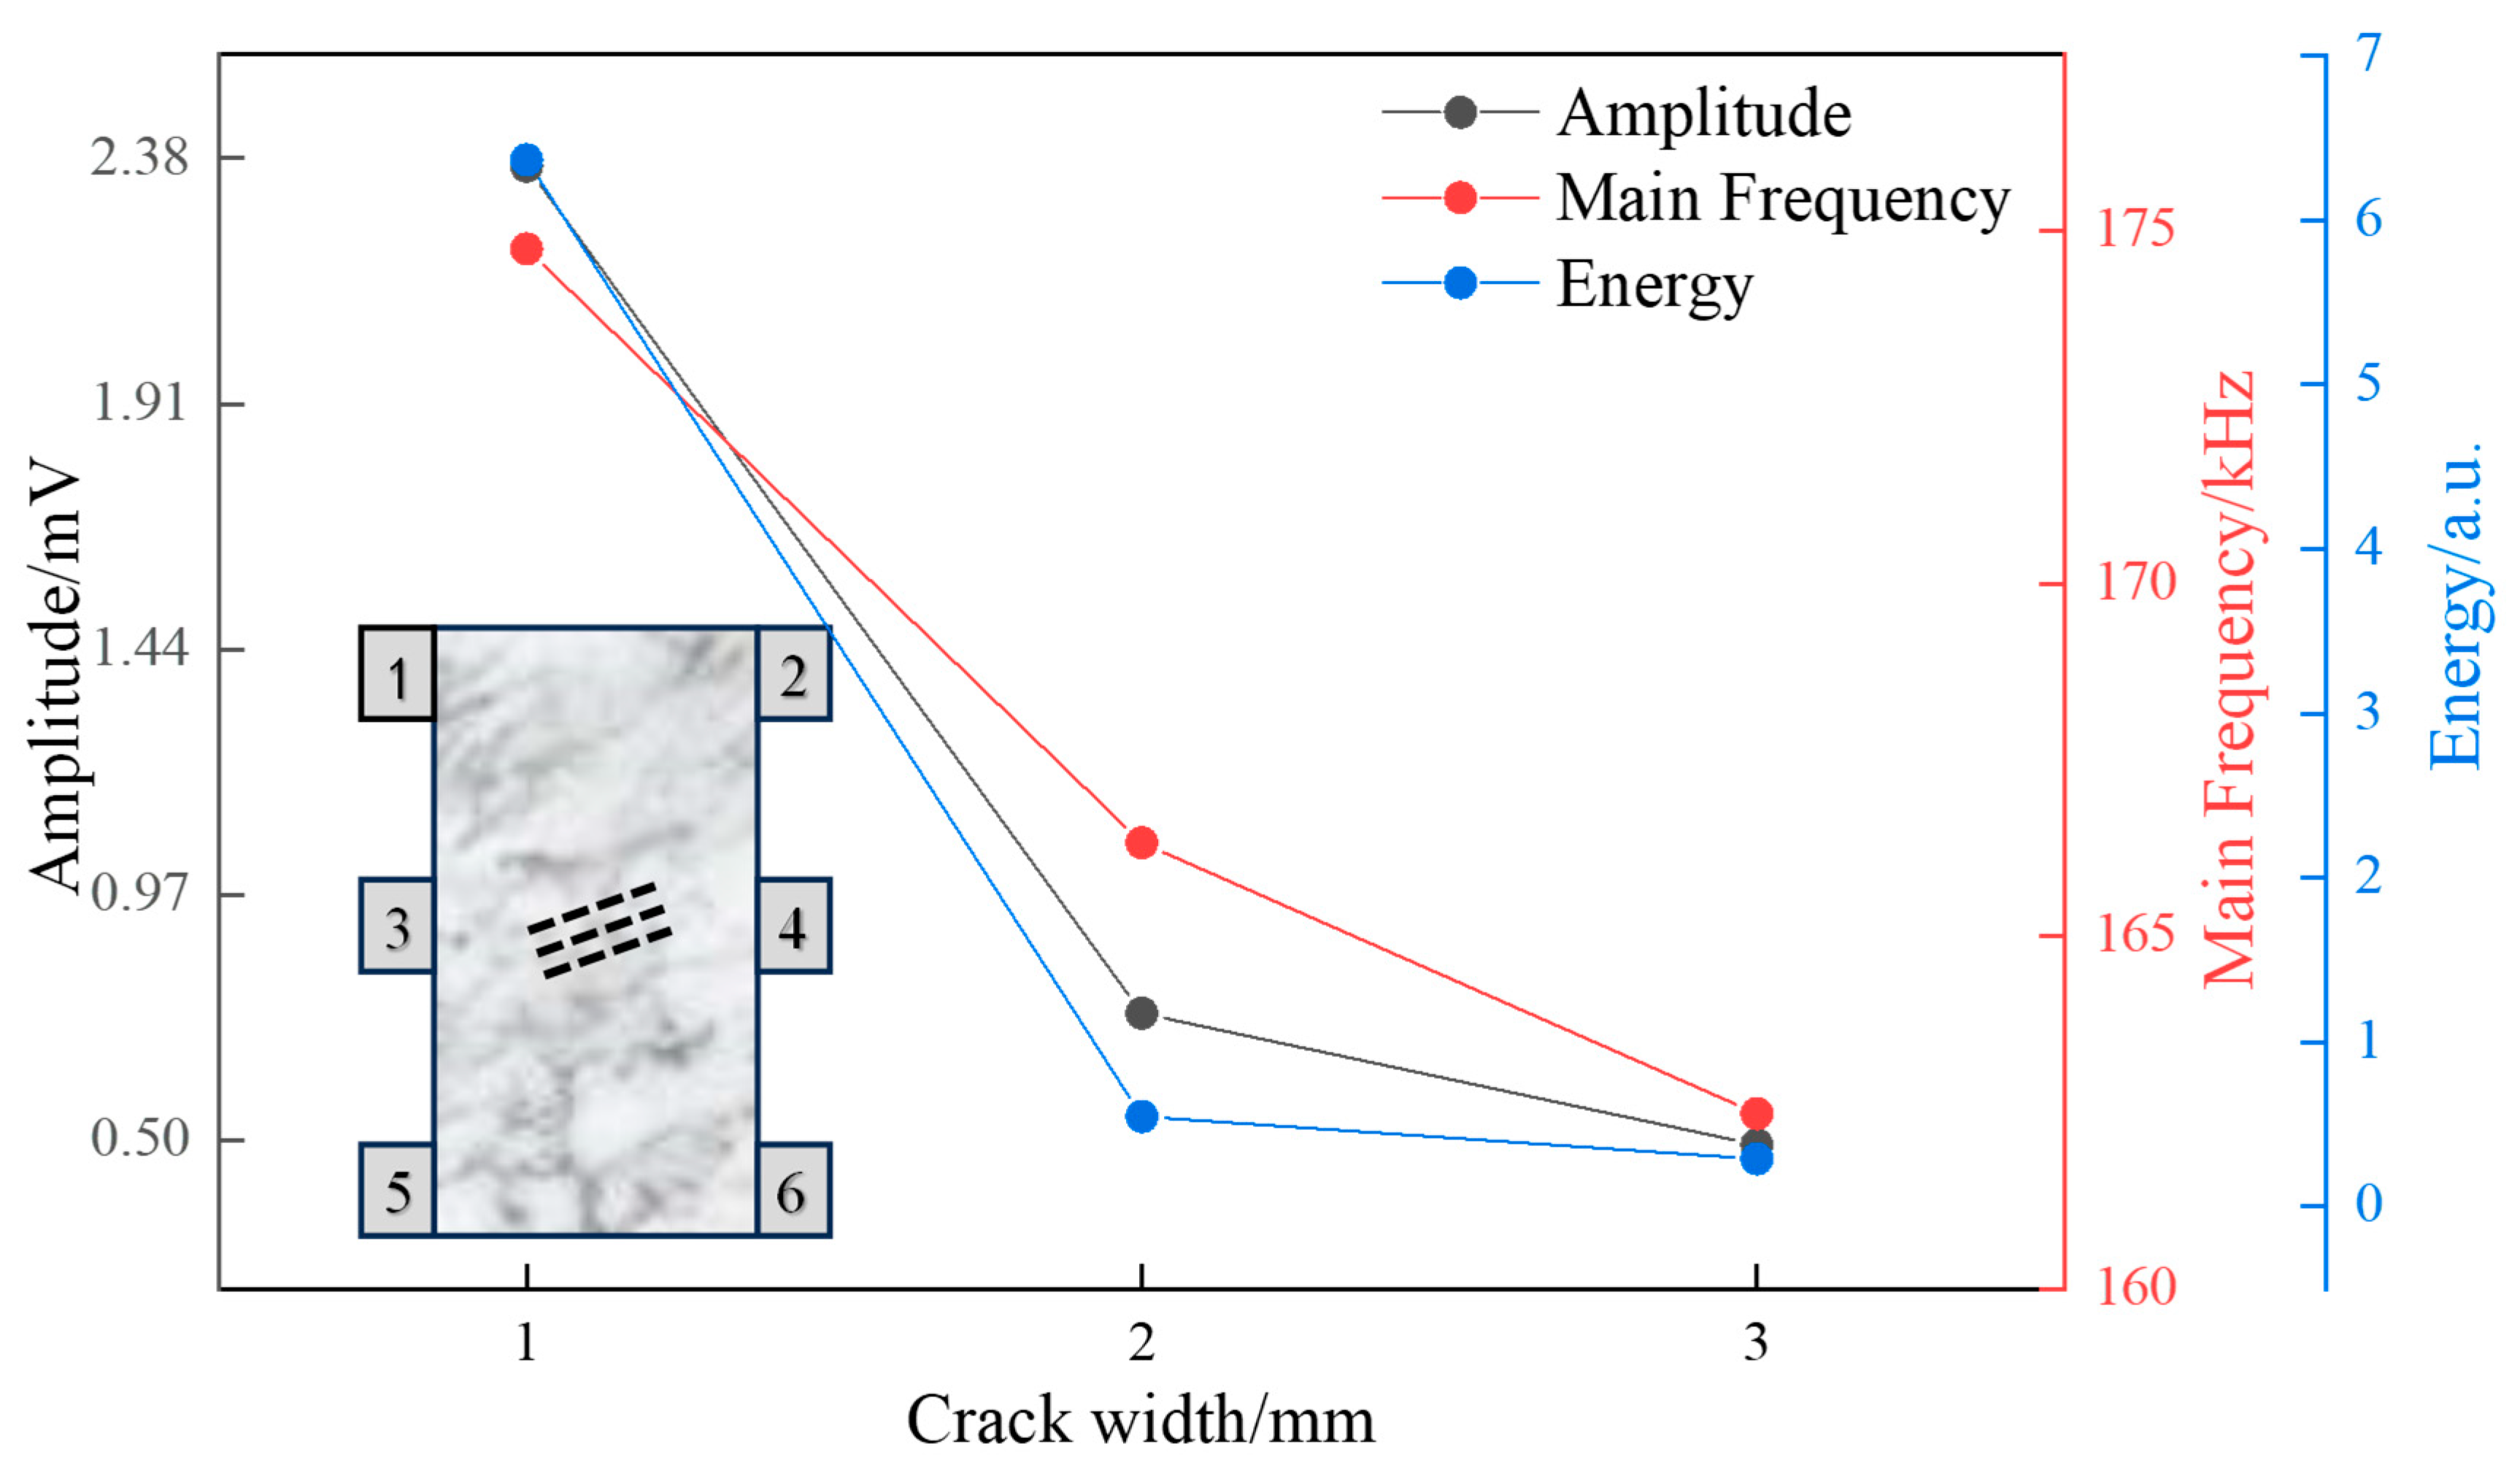
The statistical analysis of the received wave of sensor #4 after 10 rounds of excitation is carried out. The average values of the peak amplitude, main frequency, and energy peak of the seismic wave signal received by sensor #4 are shown in Table 5. When the crack width is 1 mm, the average peak value of the received waveform amplitude is 2.3649 mV, the average peak value of the main frequency of the received waveform is 174.7 kHz, and the average peak value of the received waveform energy is 6.357 a.u.; when the crack width is 2 mm, the average peak amplitude of the received waveform is 1.3587 mV, the average main frequency of the received waveform is 166.7 kHz, and the average peak energy of the received waveform is 1.883 a.u. When the crack width is 3 mm, the average peak amplitude of the received waveform is 0.5953 mV, the average main frequency of the received waveform is 154.3 kHz, and the average peak energy of the received waveform is 0.507 a.u. The peak amplitude, main frequency, and energy peak of the seismic wave received by the sample with different widths are drawn into a line chart, as shown in Figure 16. It can be found that with the increase in the crack width, the peak amplitude, main frequency, and energy peak of the seismic wave received by the 10-excitation-round receiving source gradually reduce. The exponential fitting results of the three parameters are shown in Table 6. A strong and statistically significant negative correlation between crack width and all measured wave parameters was found. The amplitude peak (R2 = 0.98), main frequency (R2 = 0.95), and energy peak (R2 = 0.97) all decreased systematically as the crack width increased from 1 mm to 3 mm. This robust statistical relationship supports the hypothesis that a wider crack acts as a more effective barrier to wave propagation, increasing scattering effects and energy loss, consistently with scattering theory.
The reason is the same as the above analysis in Section 3.1. The increase in the crack width leads to the increase in the reflection and refraction paths of the wave, enhances the scattering effect of the wave, and makes the energy of the wave disperse in all directions. The high-frequency component is more easily absorbed or scattered by a wider crack, resulting in the frequency of the wave moving to the low frequency. The simulation of crack width and seismic wave propagation is shown in Figure 17. After the crack width increases, the crack width increases on the path along which the seismic wave propagates from excitation source #3 to receiving source #4. Only a small part of the seismic wave can propagate in the air, the attenuation rate of the seismic wave propagation in the air is much larger than that in the rock mass, and its characteristic parameters continue to decrease.
The attenuation mechanism related to crack width can be modeled through scattering theory. The scattering attenuation coefficient α s satisfies
α s = 4 π 3 w 2 f 4 3 v p 4 1 2 ν 2 1 ν 2
w : crack width; f = 170 kHz : main frequency; v p = 3000   m / s ; ν = 0.25 . When the width increases from 1 mm to 3 mm, α s increases from 1.8 dB/m to 16.3 dB/m, corresponding to an energy attenuation of 98.1% → 99.92% (measured in Table 3, where 97.98% → 99.89%), verifying that the width enhanced the scattering effect.

3.3. Effect of Rock Interface on Characteristic Parameters of Seismic Wave

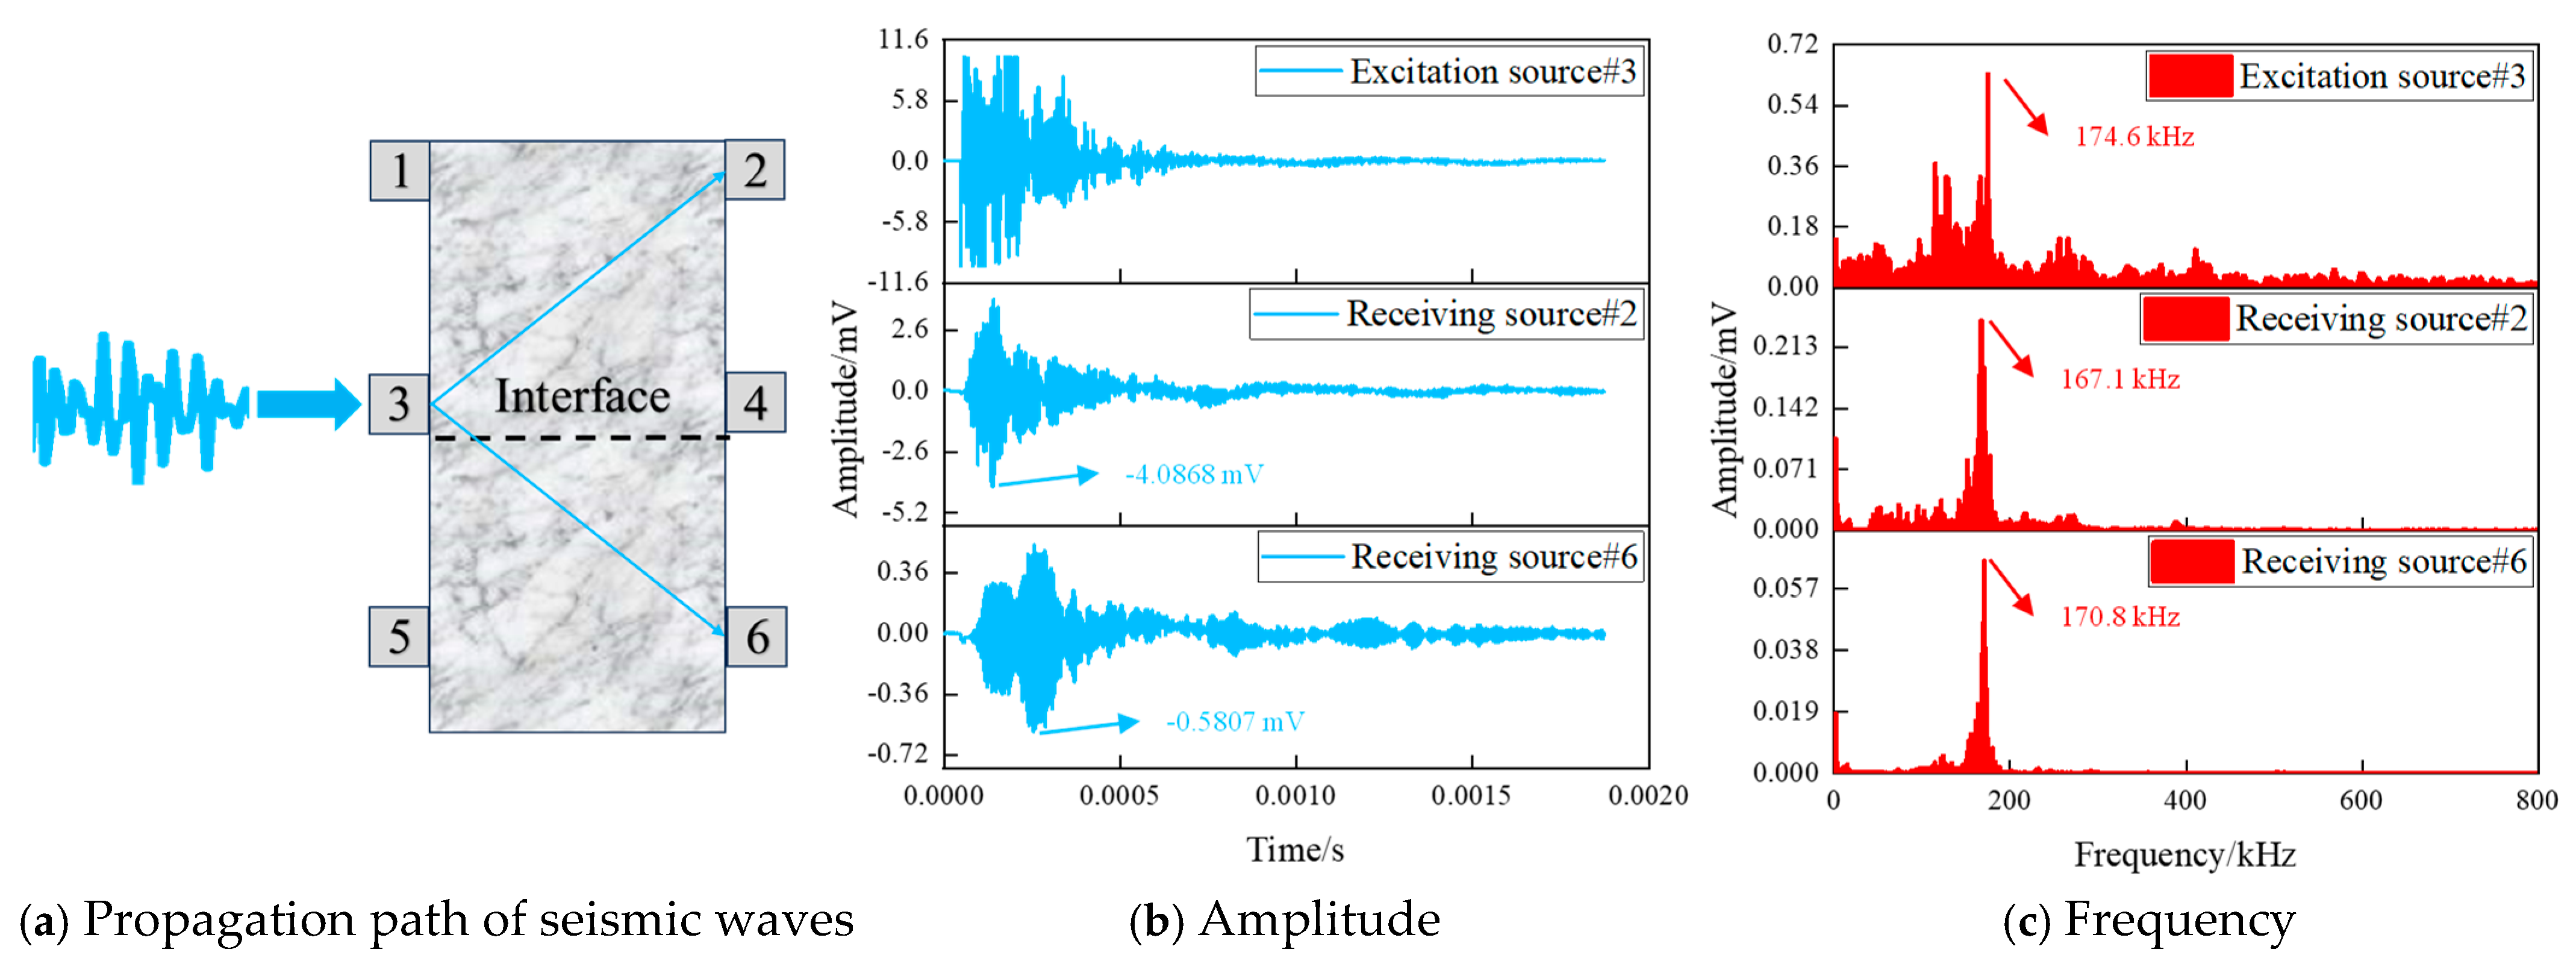
In the study of the influence of the interface on the characteristic parameters of the seismic wave, sensor #3 installed on sample 6 was used as the excitation source, and a total of 10 rounds of excitation were performed. Sensors #1, #2, #4, #5, and #6 were used as the receiving sources for reception. Under the first excitation of sample 6, the original waveform of the seismic wave signal received by the excitation source and sensors #2 and #6 and the spectrum processed by the Fourier fast transform (FFT) are shown in Figure 16. Blue arrows and red arrows point to the peak amplitude and main frequency of the signal, respectively. From Figure 18, it can be seen that the peak amplitude and main frequency of the seismic wave show a decreasing law after the wave is transmitted to receiving sources #2 and #6.
The peak amplitude of the seismic wave signals received by receiving sources #2 and #6 of sample 6 are −4.0868 mV and −0.5807 mV, respectively, which are 59.13% and 94.19% lower than the excited 10 mV. The dominant frequencies are 167.1 kHz and 170.8 kHz, respectively, which are 7.5 kHz and 3.8 kHz lower than the excitation source. By comparing receiving sources #2 and #6, it can be found that after the seismic wave passes through the interface, the peak value of the seismic wave amplitude of receiving source #6 decreases much more than that of receiving source #2. The degree of decline in the peak value of the seismic wave amplitude of the receiving source is closely related to whether it passes through the interface structure. The main frequency of the seismic wave of receiving source #6 is higher than that of receiving source #2. This may be because the existence of the interface leads to the boundary effect of the sample, which in turn affects the propagation characteristics of the seismic wave. Pressure together with truncation may change the wave velocity of the medium. Usually, the wave velocity is related to the elastic modulus and density of the medium. If the elastic modulus of the compressed medium increases, the wave velocity will also increase, resulting in an increase in the frequency of the wave. Truncation together with pressure may form a resonance condition, making it easier for the wave propagate at a specific frequency. The resonance effect may cause the frequency of the wave to increase. Truncation together with pressure may form a waveguide structure, making it easier for waves to propagate in a specific direction. This waveguide effect may lead to an increase in wave frequency. It shows that in the process of seismic wave propagation, whether there is an interface structure between rock masses affects the change in seismic wave parameters. When studying the damage and failure of rock mass caused by seismic wave, the effects of fractures on seismic waves (e.g., attenuation and frequency shifts) should be considered.
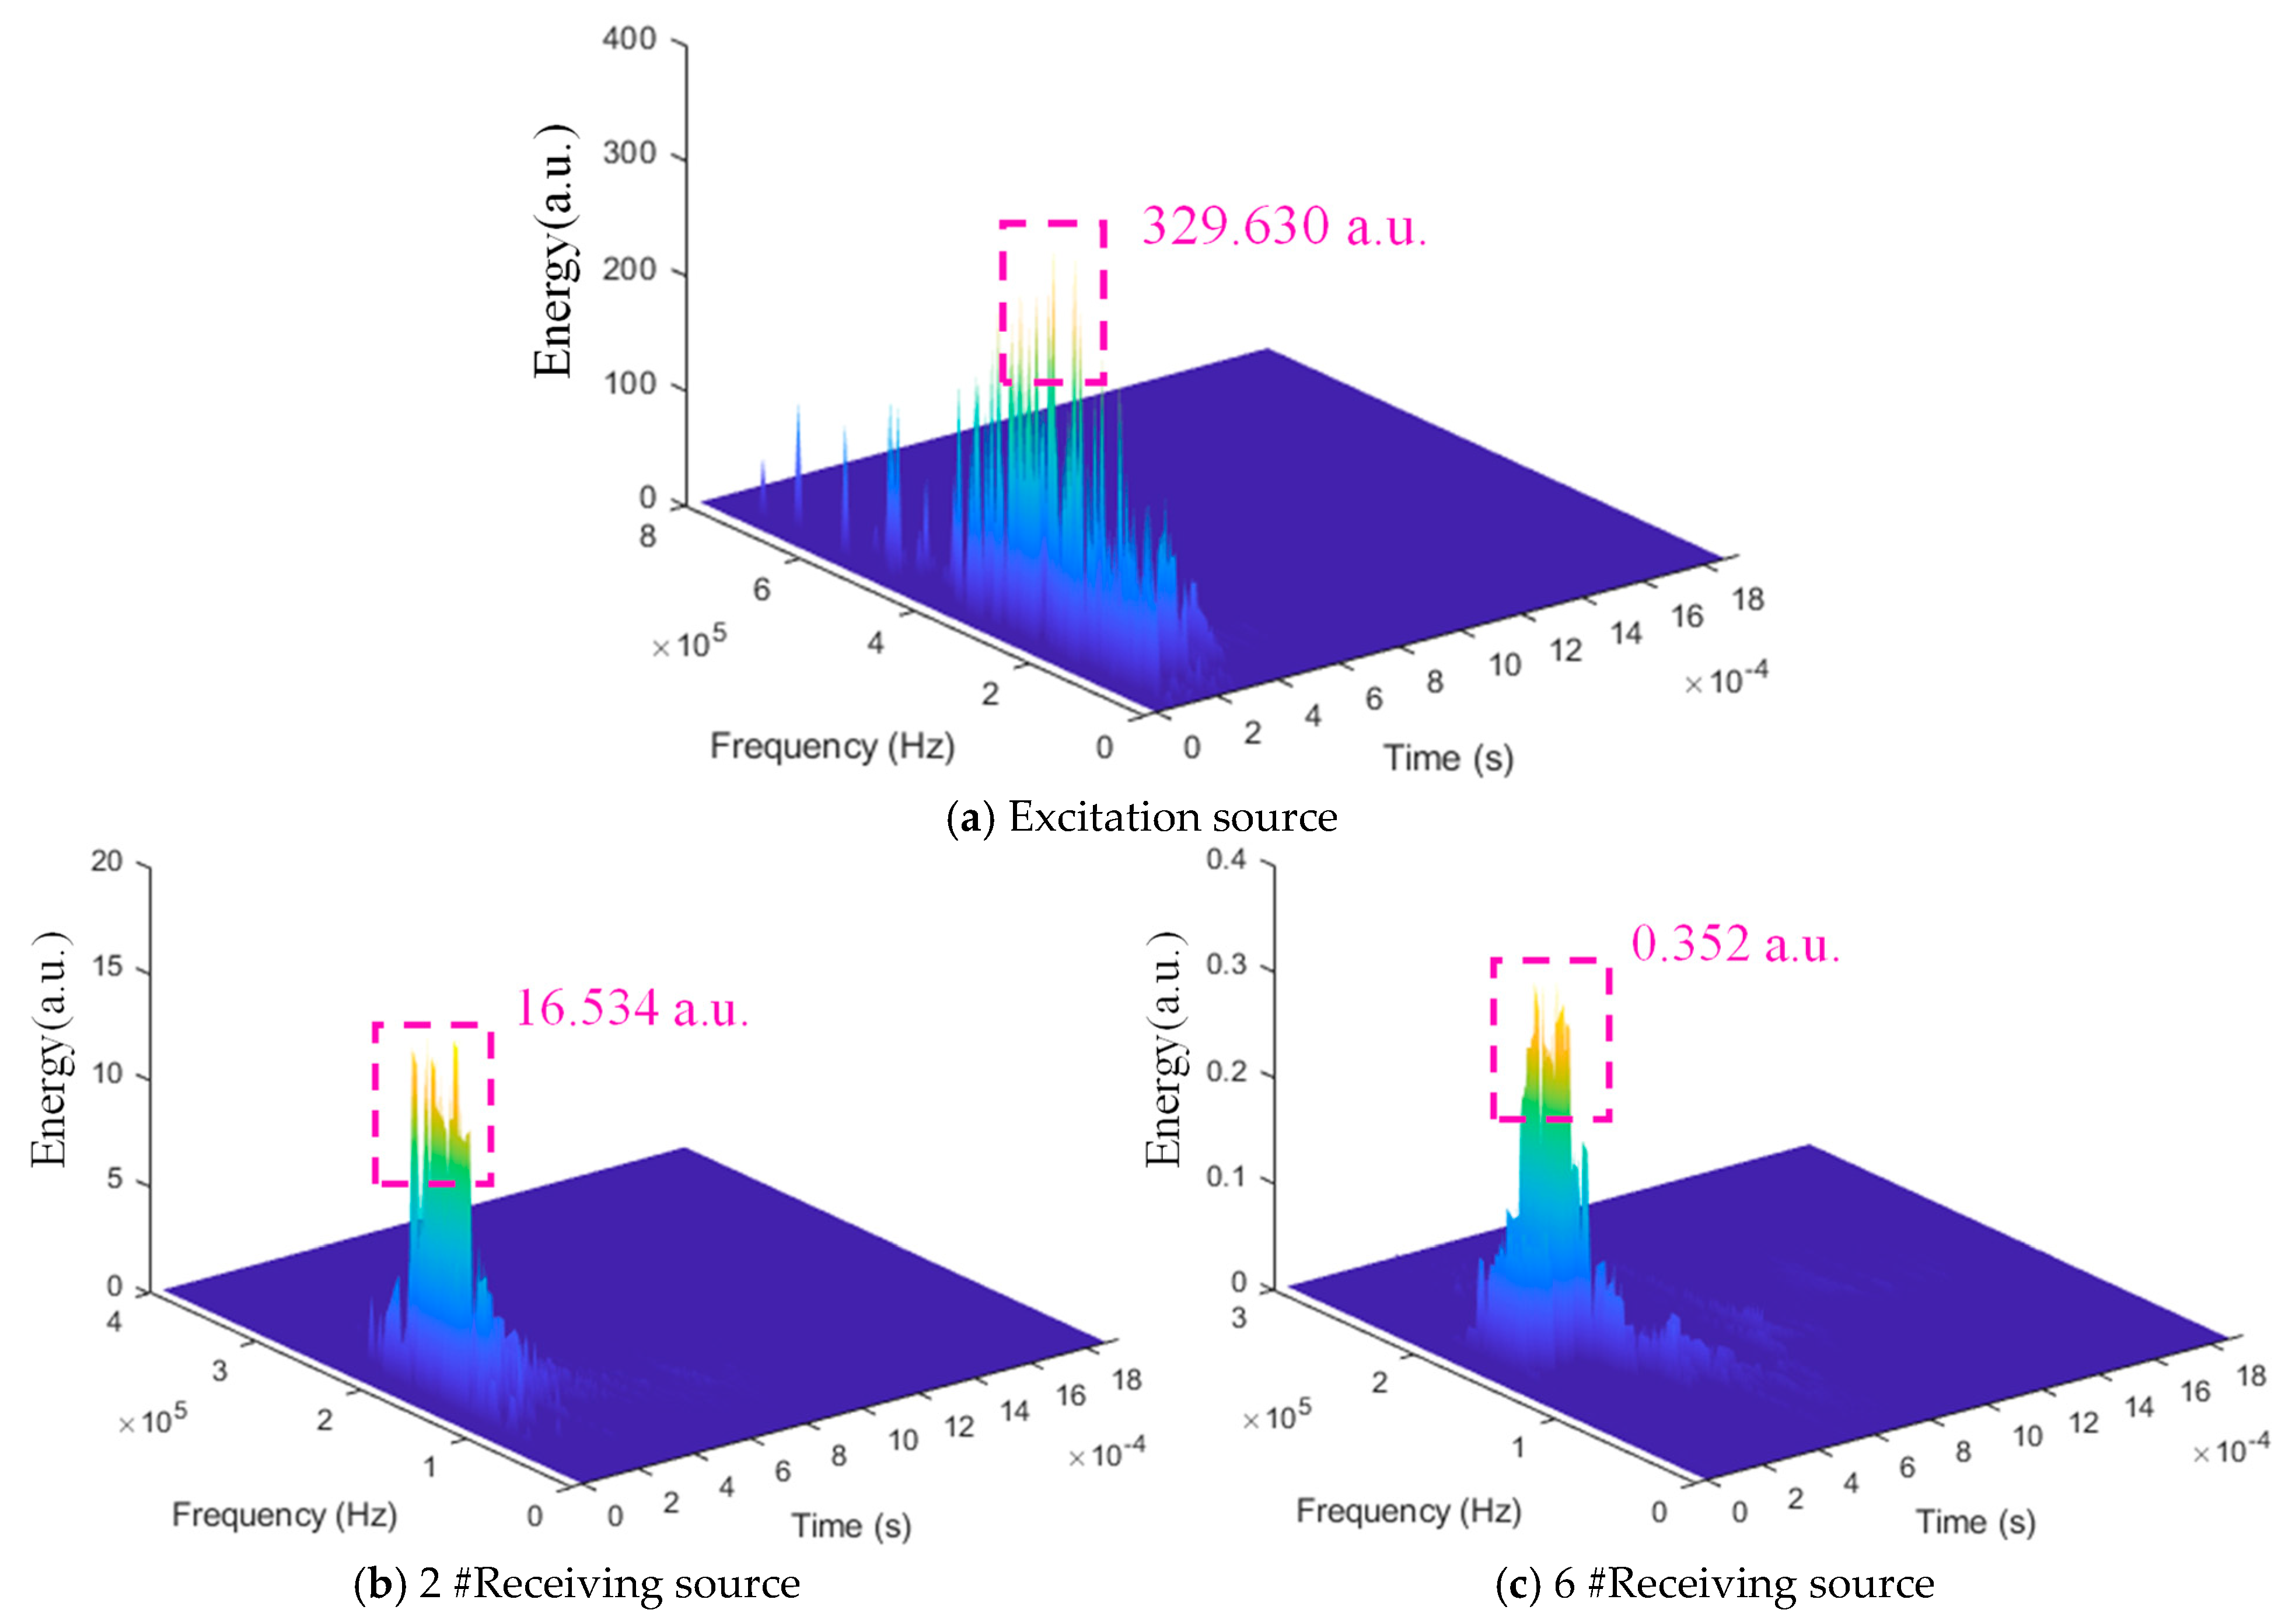
The HHT is used to analyze the change in the energy parameters of the seismic wave when the seismic wave generated by the excitation source reaches receiving sensors #2 and #6. The Hilbert spectrum is shown in Figure 19. It can be found that the energy of the receiving source is greatly reduced compared with the excitation source. The peak energy of receiving source #2 decreases to 16.534 a.u., with a decrease of 94.95%. The peak value of the receiving source energy of sample 6 is reduced to 0.352 a.u., and the degree of decline is 99.89%. The attenuation degree of the received source energy is related to whether it passes through the interface. This result is the same as the peak value of the above seismic wave amplitude, showing unity.
The linear-slip model can also be applied to the rock interface in sample 6. For a tightly pressed interface under 10 MPa of stress, the contact is imperfect, resulting in finite values for normal and tangential stiffnesses. Unlike an open crack, where K N 0 , a compressed interface has a high but finite K N . According to Equation (2), a finite K N will result in a transmission coefficient T P P that is less than 1, leading to energy loss. Our measurement of 99.89% energy attenuation at sensor #6 (Table 7) suggests that even under compression, the interface remains a significant barrier to wave propagation, corresponding to a specific stiffness that is still low relative to the term ω Z P .
The observed frequency increase (boundary effect) can be interpreted as a filtering effect of the interface. An imperfect interface with a given stiffness may act as a mechanical filter, preferentially transmitting higher-frequency components or generating them through complex contact mechanics, although a more detailed frequency-dependent analysis would be needed to fully quantify this phenomenon. The DDM provides a robust physical framework for the observed amplitude and energy reductions.

4. Difference in Characteristic Parameters of Seismic Wave Along Different Propagation Paths of the Same Rock Structure

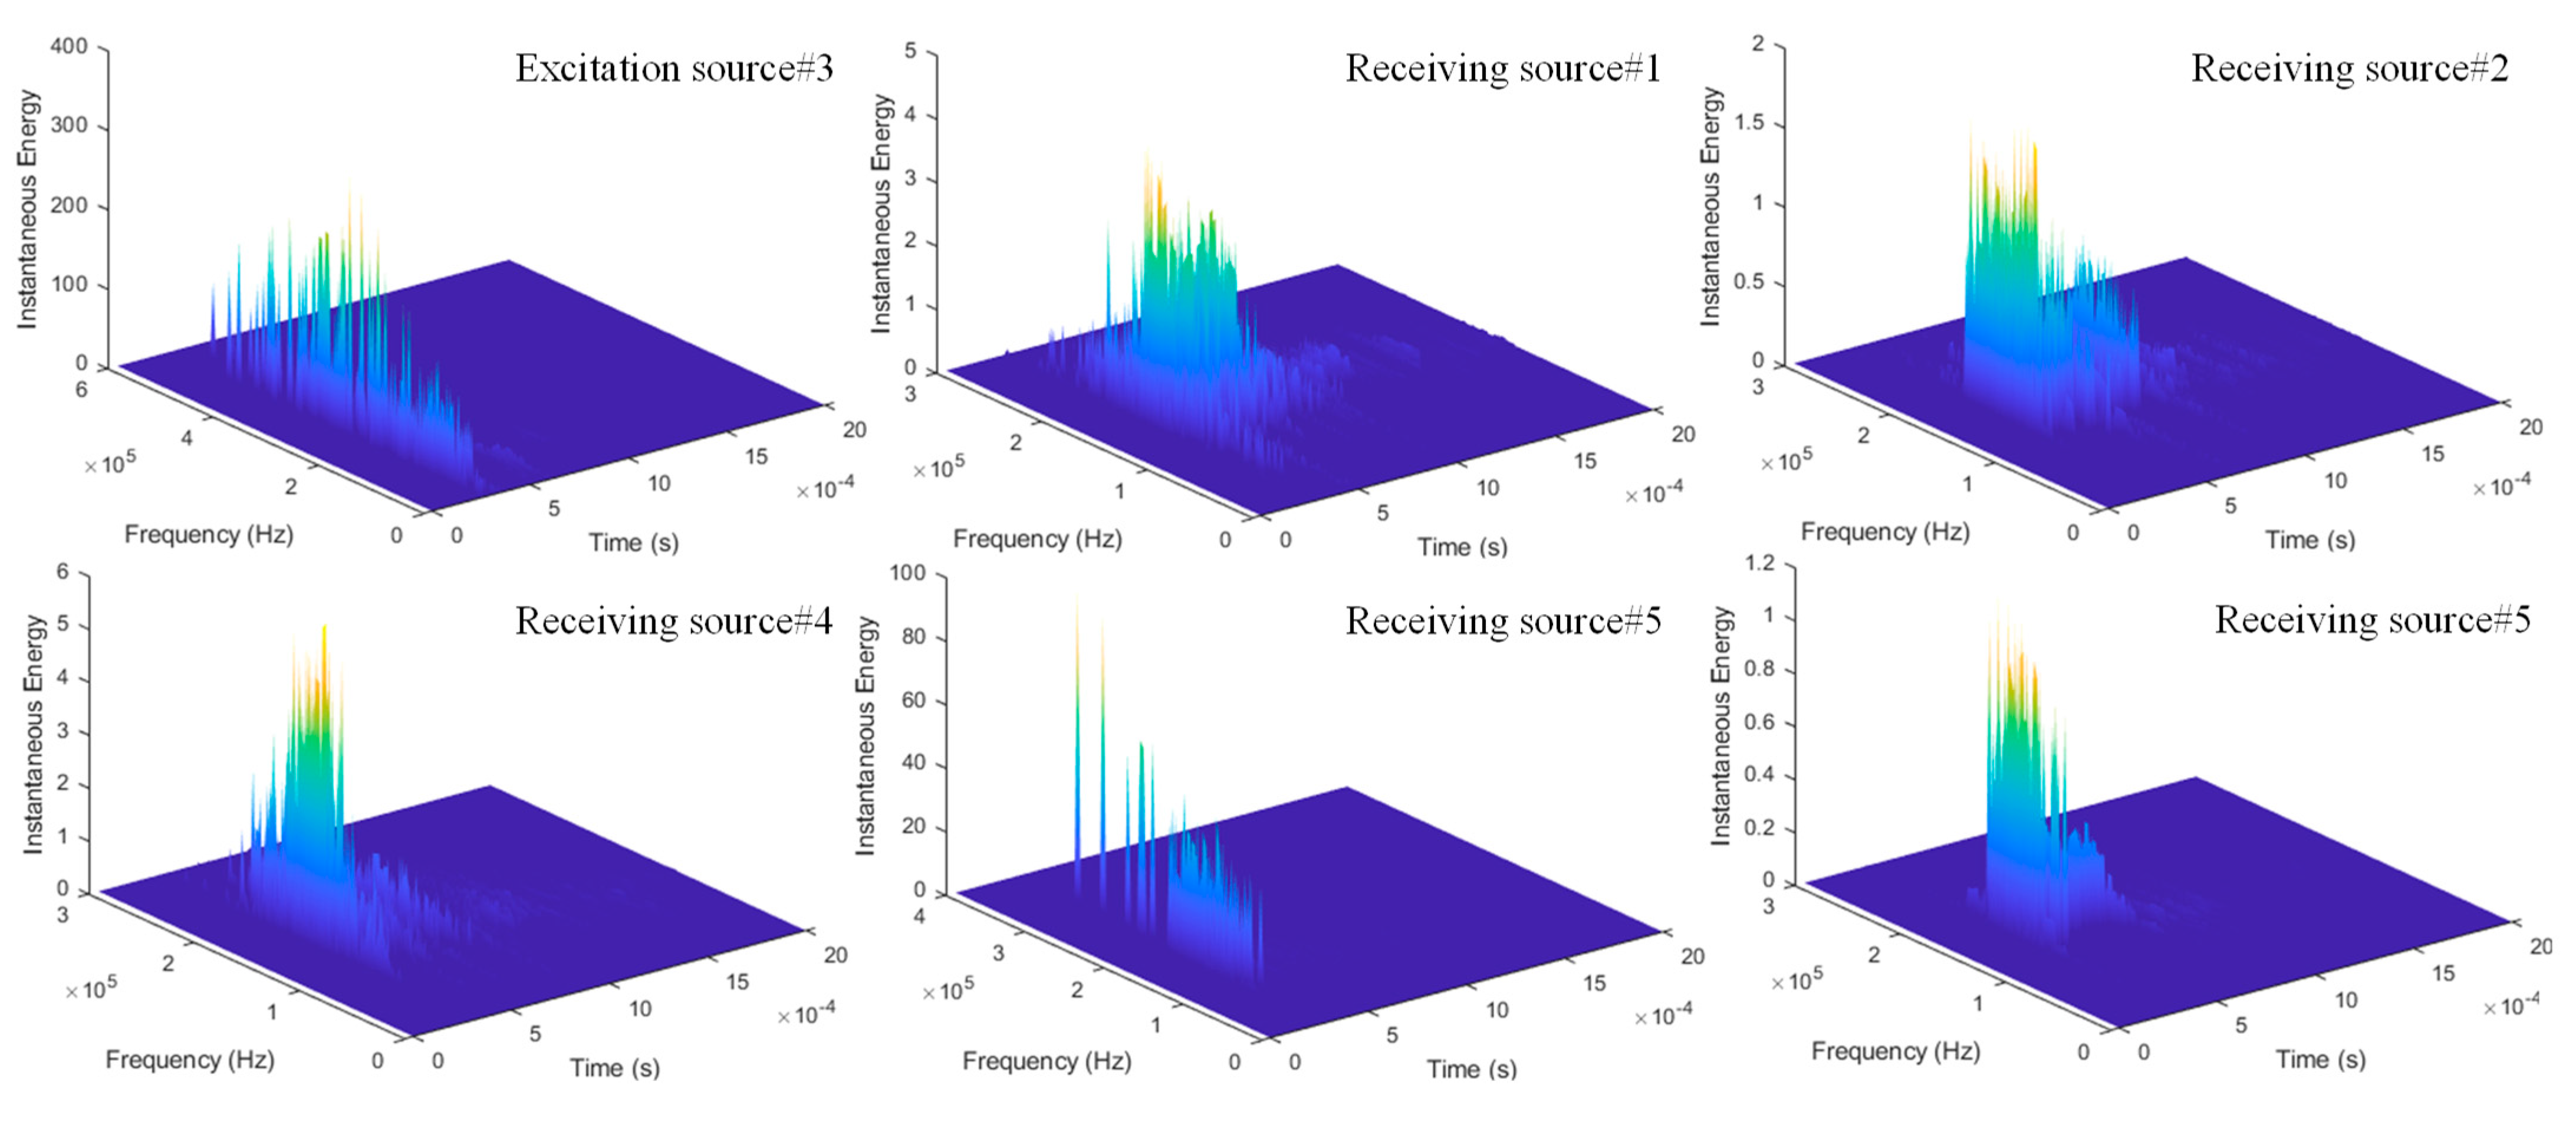
In order to explore the difference in the characteristic parameters of the seismic wave at the target point of different propagation paths, the six sensors of sample 1 were subjected to seismic wave excitation experiments in turn. Each sensor was excited for a total of ten rounds; that is, a total of 60 excitation waveforms and 300 receiving waveforms were obtained. The FFT and HHT were performed on the obtained seismic wave waveform, and one excitation of sensor #3 is randomly selected for analysis. The characteristic parameters of the seismic wave at the excitation source and the receiving source are shown in Table 8 and Figure 20 and Figure 21.
It can be found that the peak amplitude, main frequency, and energy peak of the seismic wave signal are obviously weakened after the wave propagates to the receiving source. The sensor with the largest peak amplitude attenuation is receiving source #6, and its peak amplitude is only 1.0058 mV. The sensor with the smallest attenuation is sensor #5, with a peak amplitude of −5.8202 mV. In addition to excitation source #3, the peak amplitude values of the five sensors of the receiving source are sorted as follows: #5 > #4 > #1 > #2 > #6. It can be found that the top three sensors are closer to the excitation source than the last two sensors. The reason for #4 < #5 is that the seismic wave passes through cracks in the propagation path from excitation source #3 to receiving source #4 but does not pass through cracks in the path to receiving source #5. Similarly, the energy peak ranking of each receiving source is completely consistent with the peak amplitude ranking, in which receiving source #5 has the largest energy peak, 98.037 a.u., and receiving source #6 has the smallest energy peak, 1.110 a.u.
At the same time, the time when the peak amplitude of each receiving source appears is sorted from small to large as follows: #1 < #5 < #6 < #4 < #2. It can be found that there is a significant difference in the time when the peak amplitude of receiving sources #1, #5, and #4, with the same distance from the excitation source, appears. The time of receiving source #4 is greater than that of #1 and #5 at the same distance and even greater than #6, which is farther away. This shows that the characteristic parameters of seismic waves are affected by the structure and spatial position of rock mass and are alienated in the process of propagation; there are differences in the characteristic parameters of seismic waves at each measuring point in space.
There are also obvious differences in the main frequency of the seismic wave signal received by different receiving sources. The main frequency of receiving source #4 passing through the crack on the propagation path is the largest, 174 kHz; the main frequencies of receiving sources #1 and #2, located above the excitation source, are similar, ranging from 171 kHz to 172 kHz. The dominant frequencies of receiving sources #5 and #6, located below the excitation source, are small, 170 kHz and 169 kHz, respectively.
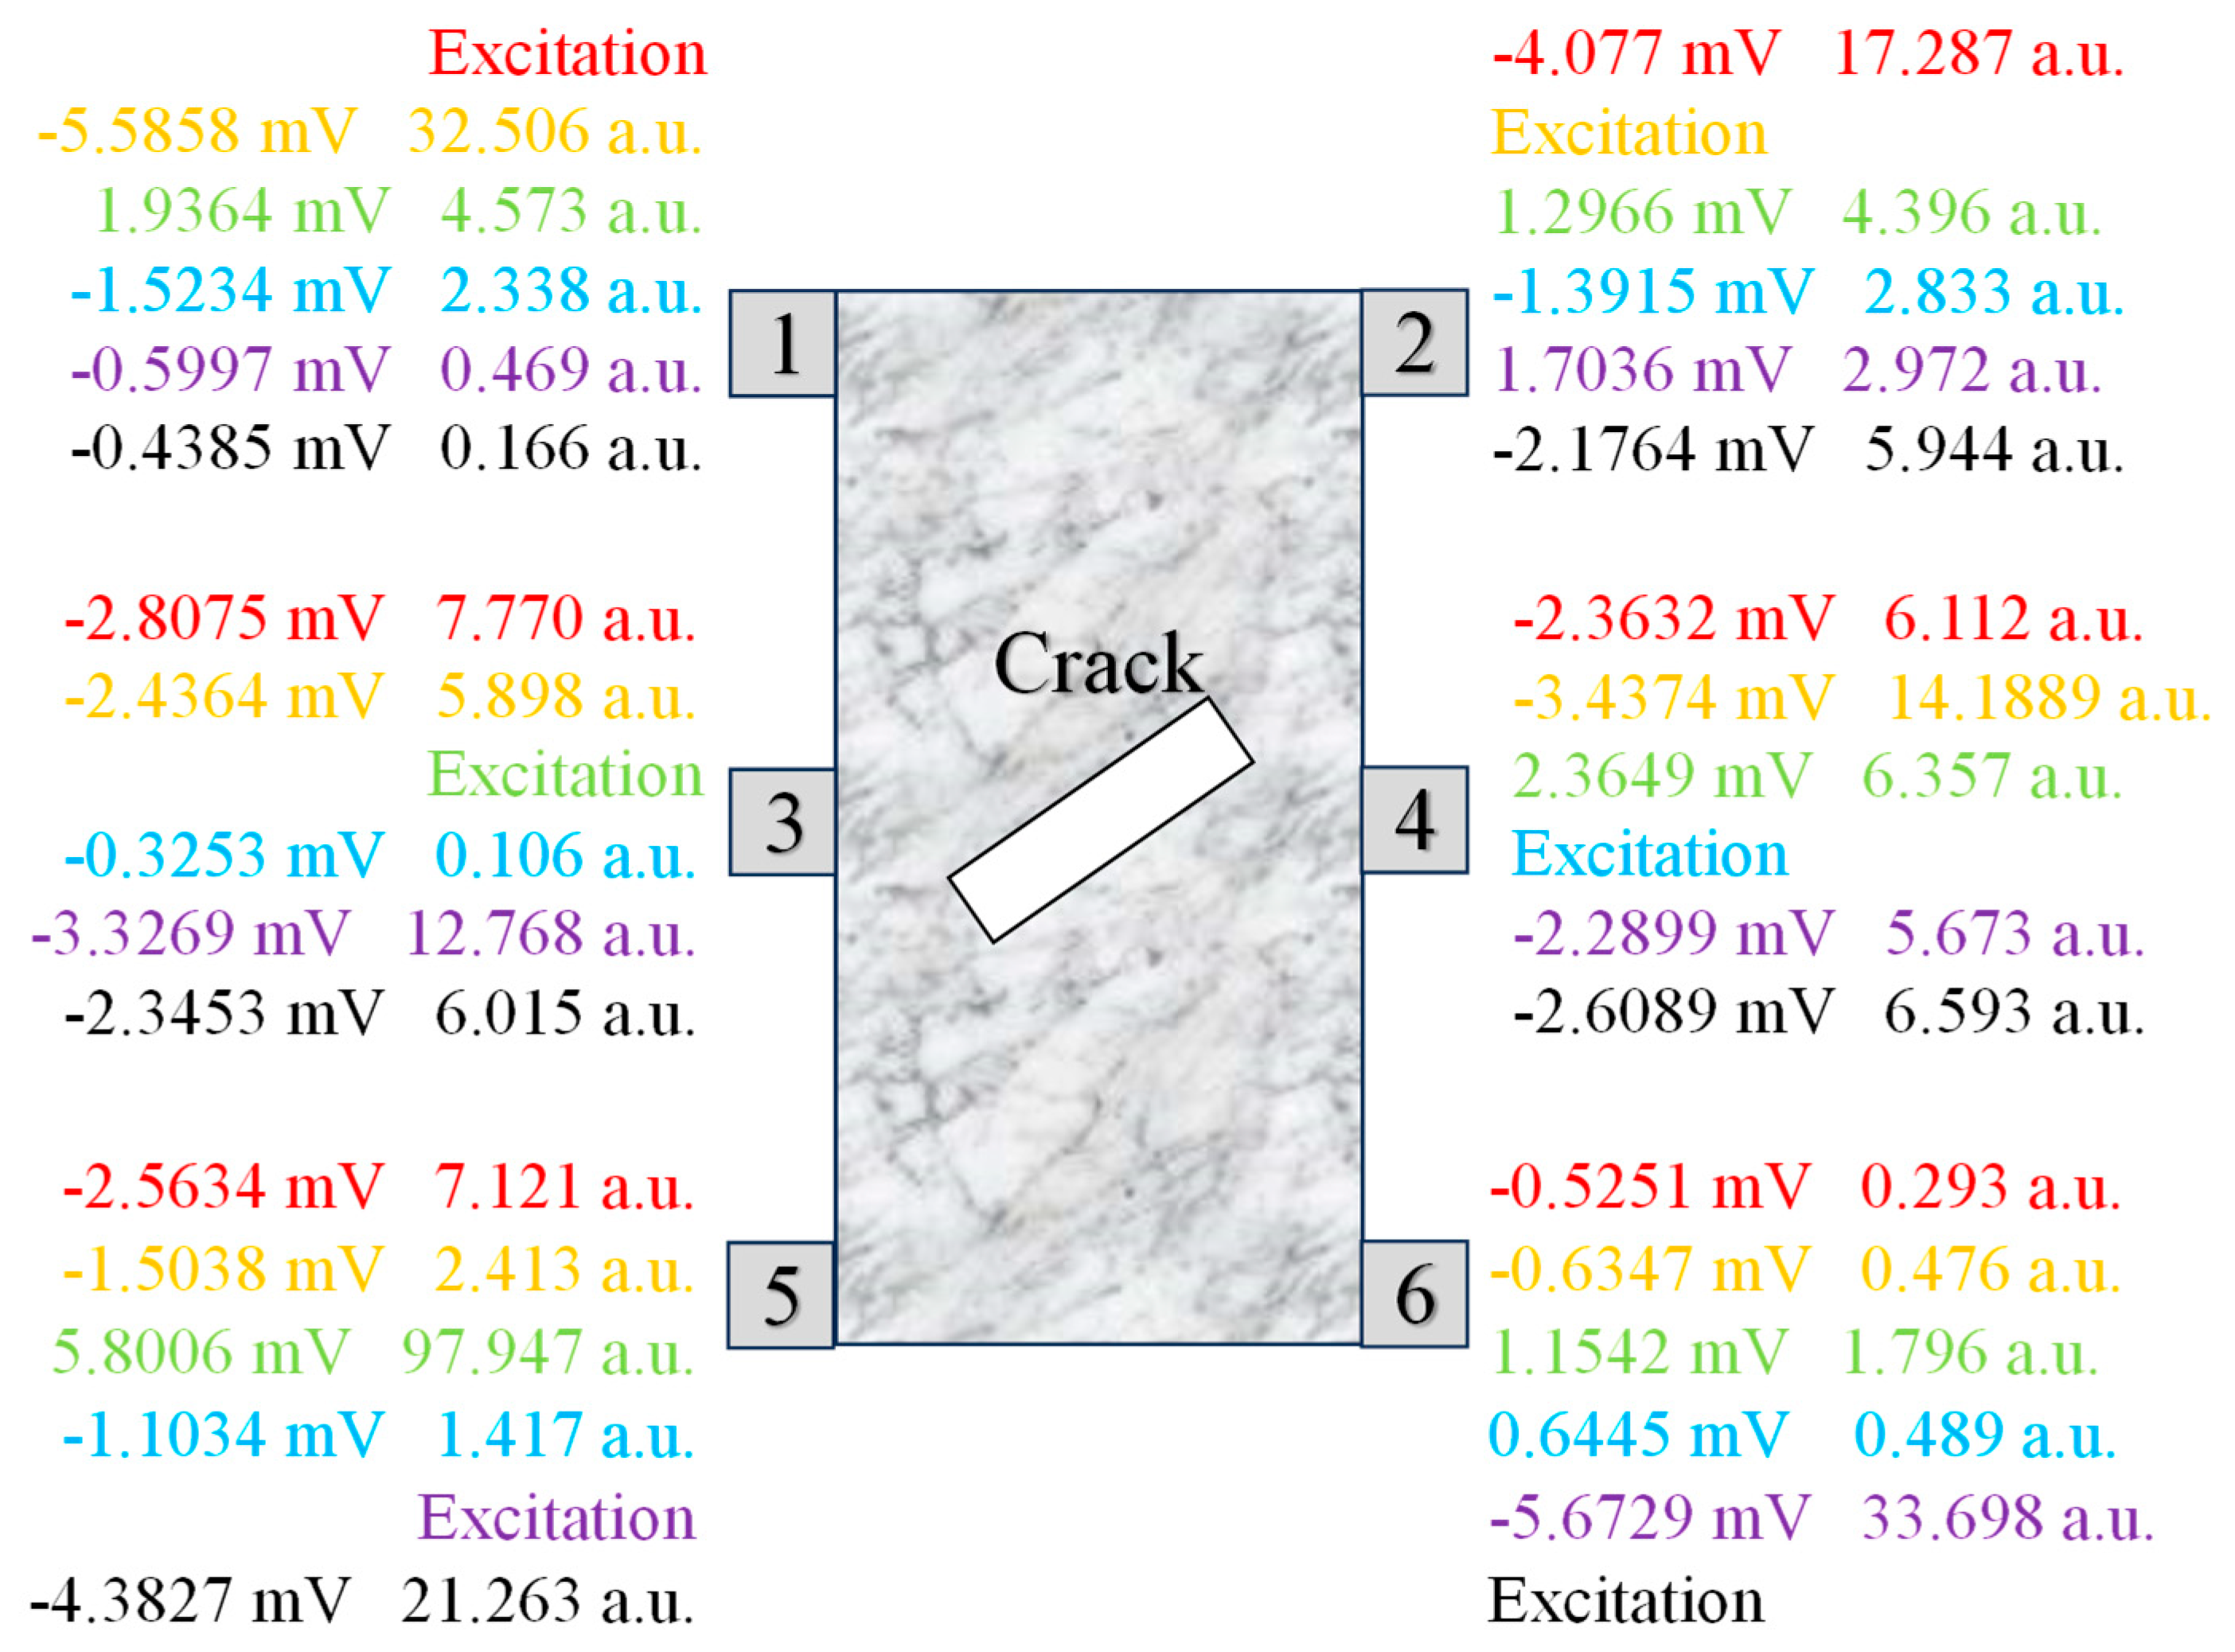
The average value of the characteristic parameters of the seismic wave signals received by each space sensor after 10 rounds of excitation of each sensor is obtained, and the results are shown in Figure 22. Different colors represent different excitation sources. It can be found that after excitation at different positions, the peak amplitude and energy peak of the seismic wave generally appear in the receiving source that is closer to the excitation source, but there are also spatial differences. In summary, after the excitation of the source seismic wave, the amplitude, main frequency, and energy of the seismic wave have obvious spatial differences after the seismic wave propagates to different spatial positions. This is due to the fact that seismic waves are mainly composed of shear waves and longitudinal waves. There is a significant difference in the spatial propagation of longitudinal waves and shear waves. At the same time, the micro-structure at different positions in the rock mass space also affects the propagation of seismic waves. Therefore, when studying the mechanism of seismic waves induced by rock fracture and microseismic location, we should not only consider some sensor data but also comprehensively analyze and improve reliability.

5. Discussion

5.1. Limitations and Implications for In Situ Conditions

We acknowledge that the experimental conditions employed in this study, namely, unconfined axial loading on dry samples at room temperature, represent a simplification of the complex in situ environment of a geothermal reservoir. The absence of confining pressure, pore pressure, fluid saturation, and elevated temperatures is a key limitation.These factors will all affect the propagation of seismic waves in coal and rock.
Despite these limitations, this study serves as a crucial analog test that provides a fundamental baseline. By isolating the effects of structural geometry, our results quantitatively demonstrate the maximum potential attenuation caused by open, dry fractures. This baseline is essential to deconvolving the multiple, overlapping effects in more complex, in situ scenarios.

5.2. Practical Applications

The principles derived from this research study can guide practical applications in geothermal engineering. The established relationship between fracture geometry and wave attenuation can enhance microseismic monitoring strategies. For instance, in areas with known large-angle fault zones, sensor arrays could be densified to compensate for expected signal loss, improving event location accuracy. Moreover, the severe attenuation observed when waves cross discontinuities could be leveraged to develop active ultrasonic methods for wellbore integrity assessment. A significant drop in transmitted energy across a section of the casing or cement sheath could indicate the presence of critical cracks or debonding.

5.3. Robustness of Time–Frequency Analysis

We acknowledge the potential vulnerabilities of the EMD/HHT method, such as mode mixing and end effects. While we implemented standard mitigation techniques like boundary wave extension, we conducted a sensitivity analysis to ensure that our primary conclusions are not method-dependent.
A Short-Time Fourier Transform (STFT) analysis was performed on representative waveforms under each experimental condition (e.g., varying crack angles and widths). A Hamming window with 80% overlap was used to balance time and frequency resolution. The STFT spectrograms confirmed the core findings derived from the HHT: a drastic and immediate reduction in signal energy upon encountering a crack or interface. The temporal distribution of energy loss shown by the STFT was highly consistent with the instantaneous energy profiles derived from the Hilbert envelope. While the HHT offers superior time–frequency resolution for non-stationary signals, the agreement with the well-established STFT method demonstrates that the observed energy attenuation, which exceeds 99% in many cases, is a robust physical observation rather than an artifact of the chosen signal processing technique. This validation strengthens the confidence in our quantitative conclusions.

6. Conclusions

In this paper, under simulated unconfined, dry laboratory conditions, the vertical stress conditions of geothermal well rock are simulated, and seismic wave excitation experiments of rock samples with different fracture angles, widths, and interfaces are carried out. The dissimilation effect of rock structure on characteristic parameters such as the waveform, amplitude, frequency, and energy of seismic waves is analyzed, and the dissimilation law and spatial differences are revealed as detailed below.
(1) With the increase in crack angle and width, the peak amplitude value, main frequency, and energy peak value of the seismic wave received by the receiving source gradually reduce compared with the source wave: amplitude attenuation of up to 94.04% and energy attenuation exceeding 99.8%. This phenomenon is caused by several compounding effects. The increase in crack angle and width enlarges the path for wave reflection and refraction and enhances wave scattering, which disperses energy in all directions. Furthermore, high-frequency components are more easily absorbed or scattered by these larger discontinuities, causing the wave’s main frequency to shift towards lower frequencies.
(2) After the seismic wave passes through the interface, the peak amplitude value and energy peak value decrease significantly, which is related to the attenuation of seismic wave propagation; the frequency of the seismic wave rises. The reason for this phenomenon is related to the boundary effect after the interface is compressed. After truncation, it is compressed together to change the wave velocity of the medium, forming a resonance condition and waveguide structure, which makes it easier for the wave to propagate in a specific direction, resulting in the increase in the frequency of the wave (frequency increase of 8.5%).
(3) After the excitation of the seismic wave from the excitation source, there are obvious spatial differences in the amplitude, main frequency, and energy of the seismic wave after it propagates to different spatial positions, which may be caused by the significant differences in the spatial propagation of P-waves and S-waves. At the same time, the micro-structures at different positions in the rock mass space also affect seismic wave propagation. Therefore, when evaluating the impact of seismic waves on wellbore integrity, both the energy and the spatial location of microseismic events should be considered.

Author Contributions

Conceptualization, Z.K., and S.H.; methodology, S.H.; software, S.H.; validation, Z.K., S.H., and C.Q.; formal analysis, S.H.; investigation, S.H.; resources, S.H.; data curation, S.H.; writing—original draft preparation, Z.K.; writing—review and editing, Z.K., S.H., F.S., and C.Q.; visualization, Z.K.; supervision, S.H.; project administration, H.J.; funding acquisition, H.J. All authors have read and agreed to the published version of the manuscript.

Funding

This research study was funded by the Science and Technology Innovation Program of Xiongan New Area, grant number 2023XAGG0061; the National Natural Science Foundation of China, grant number 52204197; the State Key Research Development Program of China, grant number 2024YFC3013803; the Open Subjects of Xinjiang Key Laboratory of Green Mining of Coal Resources, Ministry of Education, China, grant number KLXGY-KB2425; and the National Natural Science Foundation of China, grant number U24B2045. And The APC was funded by the Science and Technology Innovation Program of Xiongan New Area.

Institutional Review Board Statement

Not applicable.

Informed Consent Statement

Not applicable.

Data Availability Statement

The original contributions presented in this study are included in the article. Further inquiries can be directed to the corresponding author.

Conflicts of Interest

The authors declare no conflict of interest.

References

  1. Wang, R.; Wang, J.; Li, H.; Cui, H.; Tang, M.; Zhao, J. A study on the acquisition technology for weak seismic signals from deep geothermal reservoirs. Energies 2023, 16, 2751. [Google Scholar] [CrossRef]
  2. Um, E.S.; Commer, M.; Gritto, R.; Peacock, J.R.; Alumbaugh, D.L.; Jarpe, S.P.; Hartline, C. Cooperative joint inversion of magnetotelluric and microseismic data for imaging The Geysers geothermal field, California, USA. Geophysics 2023, 88, WB45–WB54. [Google Scholar] [CrossRef]
  3. Tunç, S.; Selek, B.; Koca, B.; Selek, Ü.S.; Balcı, K.; Yıldırım, A.; Kaypak, B. Installation of microseismic monitoring networks in geothermal fields. J. Fac. Eng. Archit. Gazi Univ. 2023, 38, 1307–1319. [Google Scholar] [CrossRef]
  4. Li, J.; Wu, W.; Li, H.; Zhu, J.; Zhao, J. A thin-layer interface model for wave propagation through filled rock joints. J. Appl. Geophys. 2013, 91, 31–38. [Google Scholar] [CrossRef]
  5. Lu, G.; Tao, Y. Experimental study into the propagation and attenuation of blasting seismic waves in porous rock-like materials. Front. Mater. 2023, 10, 1284158. [Google Scholar] [CrossRef]
  6. Fan, L.; Jiang, F.; Wang, M.; Chen, S. Oblique incident seismic P wave propagation through joints containing saturated fluids with different media on both sides. J. Appl. Geophys. 2024, 222, 105316. [Google Scholar] [CrossRef]
  7. Yu, C.; Li, H.; Yue, H.; Wang, X.; Xia, X. A case study of blasting seismic attenuation based on wave component characteristics. J. Rock Mech. Geotech. Eng. 2023, 15, 1298–1311. [Google Scholar] [CrossRef]
  8. Tartoussi, N.; Lataste, J.-F.; Rivard, P.; Barbosa, N.D. Effects of a filled discontinuity in a rock mass on transmission losses of compressional and shear wave of full-waveform sonic log data. J. Appl. Geophys. 2023, 217, 105179. [Google Scholar] [CrossRef]
  9. Tartoussi, N.; Lataste, J.-F.; Rivard, P.; Barbosa, N.D. Analysis of P-wave propagation in filled jointed rock mass with viscoelastic properties. Geomech. Geophys. Geo-Energy Geo Resour. 2023, 9, 102. [Google Scholar] [CrossRef]
  10. Wu, W.; Li, C.; Zhao, J. Seismic response of adjacent filled parallel rock fractures with dissimilar properties. J. Appl. Geophys. 2013, 96, 33–37. [Google Scholar] [CrossRef]
  11. Zhao, X.B.; Zhao, J.; Hefny, A.M.; Cai, J.G. Normal transmission of S-wave across parallel fractures with Coulomb slip behavior. J. Eng. Mech. 2006, 132, 641–650. [Google Scholar] [CrossRef]
  12. Syu, S.-Y.; Hutchings, L.; Lee, C.-S.; Jarpe, S. The implications of S-wave attenuation in geothermal reservoirs. Geothermics 2024, 117, 102861. [Google Scholar] [CrossRef]
  13. Toksoz, M.N.; Johnston, D.H.; Timur, A. Attenuation of seismic waves in dry and saturated rocks—1. laboratory measurements. Geophysics 2012, 44, 681–690. [Google Scholar] [CrossRef]
  14. Lu, S.; Zhou, C.; Jiang, N.; Xu, X. Effect of excavation blasting in an under-cross tunnel on airport runway. Geotech. Geol. Eng. 2015, 33, 973–981. [Google Scholar] [CrossRef]
  15. Li, J.; Ma, G.; Jian, Z. Analysis of stochastic seismic wave interaction with a slippery rock fault. Rock Mech. Rock Eng. 2011, 44, 85–92. [Google Scholar] [CrossRef]
  16. Li, J.; Ma, G.; Zhao, J. An equivalent viscoelastic model for rock mass with parallel joints. J. Geophys. Res. Atmos. 2010, 115, 1923–1941. [Google Scholar] [CrossRef]
  17. Chapman, S.; Borgomano, J.V.M.; Quintal, B.; Benson, S.M.; Fortin, J. Seismic wave attenuation and dispersion due to partial fluid saturation: Direct measurements and numerical simulations based on X-ray CT. J. Geophys. Res. Solid Earth 2021, 126, e2021JB021643. [Google Scholar] [CrossRef]
  18. Borgomano, J.V.M.; Pimienta, L.X.; Fortin, J.; Guéguen, Y. Seismic dispersion and attenuation in fluid-saturated carbonate rocks: Effect of microstructure and pressure. J. Geophys. Res. Solid Earth 2019, 124, 12498–12522. [Google Scholar] [CrossRef]
  19. Batzle, M.L.; Han, D.H.; Hofmann, R. Fluid mobility and frequency-dependent seismic velocity—Direct measurements. Geophysics 2006, 71, N1–N9. [Google Scholar] [CrossRef]
  20. Sun, C.; Tang, G.Y.; Fortin, J.; Borgomano, J.V.M.; Wang, S. Dispersion and attenuation of elastic wave velocities: Impact of microstructure heterogeneity and local measurements. J. Geophys. Res. Solid Earth 2020, 125, e2020JB020132. [Google Scholar] [CrossRef]
  21. Yin, H.; Zhao, J.; Tang, G.; Zhao, L.; Ma, X.; Wang, S. Pressure and fluid effect on frequency-dependent elastic moduli in fully saturated tight sandstone. J. Geophys. Res. Solid Earth 2017, 122, 8925–8942. [Google Scholar] [CrossRef]
  22. Guo, J.; Shuai, D.; Wei, J.; Ding, P.; Gurevich, B. P-wave dispersion and attenuation due to scattering by aligned fluid saturated fractures with finite thickness: Theory and experiment. Geophys. J. Int. 2018, 215, 2114–2133. [Google Scholar] [CrossRef]
  23. Song, Y.; Hu, H.; Han, B. Elastic wave scattering by a fluid-saturated circular crack and effective properties of a solid with a sparse distribution of aligned cracks. J. Acoust. Soc. Am. 2019, 146, 470–485. [Google Scholar] [CrossRef] [PubMed]
  24. Song, Y.; Rudnicki, J.W.; Hu, H.; Han, B. Dynamics anisotropy in a porous solid with aligned slit fractures. J. Mech. Phys. Solids 2020, 137, 103865. [Google Scholar] [CrossRef]
  25. Fu, B.; Guo, J.; Fu, L.; Glubokovskikh, S.; Galvin, R.J.; Gurevich, B. Seismic dispersion and attenuation in saturated porous rock with aligned slit cracks. J. Geophys. Res. Solid Earth 2018, 123, 6890–6910. [Google Scholar] [CrossRef]
  26. Tan, Y.; Li, X.Y.; Wu, T.H. Dynamic stress intensity factor of a rectangular crack in an infinite saturated porous medium: Mode I problem. Eng. Fract. Mech. 2020, 223, 106737. [Google Scholar] [CrossRef]
  27. Song, Y.; Hu, H.; Han, B. Effective properties of a porous medium with aligned cracks containing compressible fluid. Geophys. J. Int. 2020, 221, 60–76. [Google Scholar] [CrossRef]
  28. Song, Y.; Hu, H.; Han, B. P-wave attenuation and dispersion in a fluid-saturated rock with aligned rectangular cracks. Mech. Mater. 2020, 147, 103409. [Google Scholar] [CrossRef]
  29. Song, Y.; Wang, J.; Hu, H.; Han, B. Attenuation and dispersion of P-waves in fluid-saturated porous rocks with a distribution of coplanar cracks—Scattering approach. Geophysics 2021, 86, 81–93. [Google Scholar] [CrossRef]
  30. GB/T 23561.7-2009; Methods for Determining the Physical and Mechanical Properties of Coal and Rock—Part 7: Methods for Determining the Uniaxial Compressive Strength and Counting Softening Coefficient. China National Standardization Administration: Beijing, China, 2009.
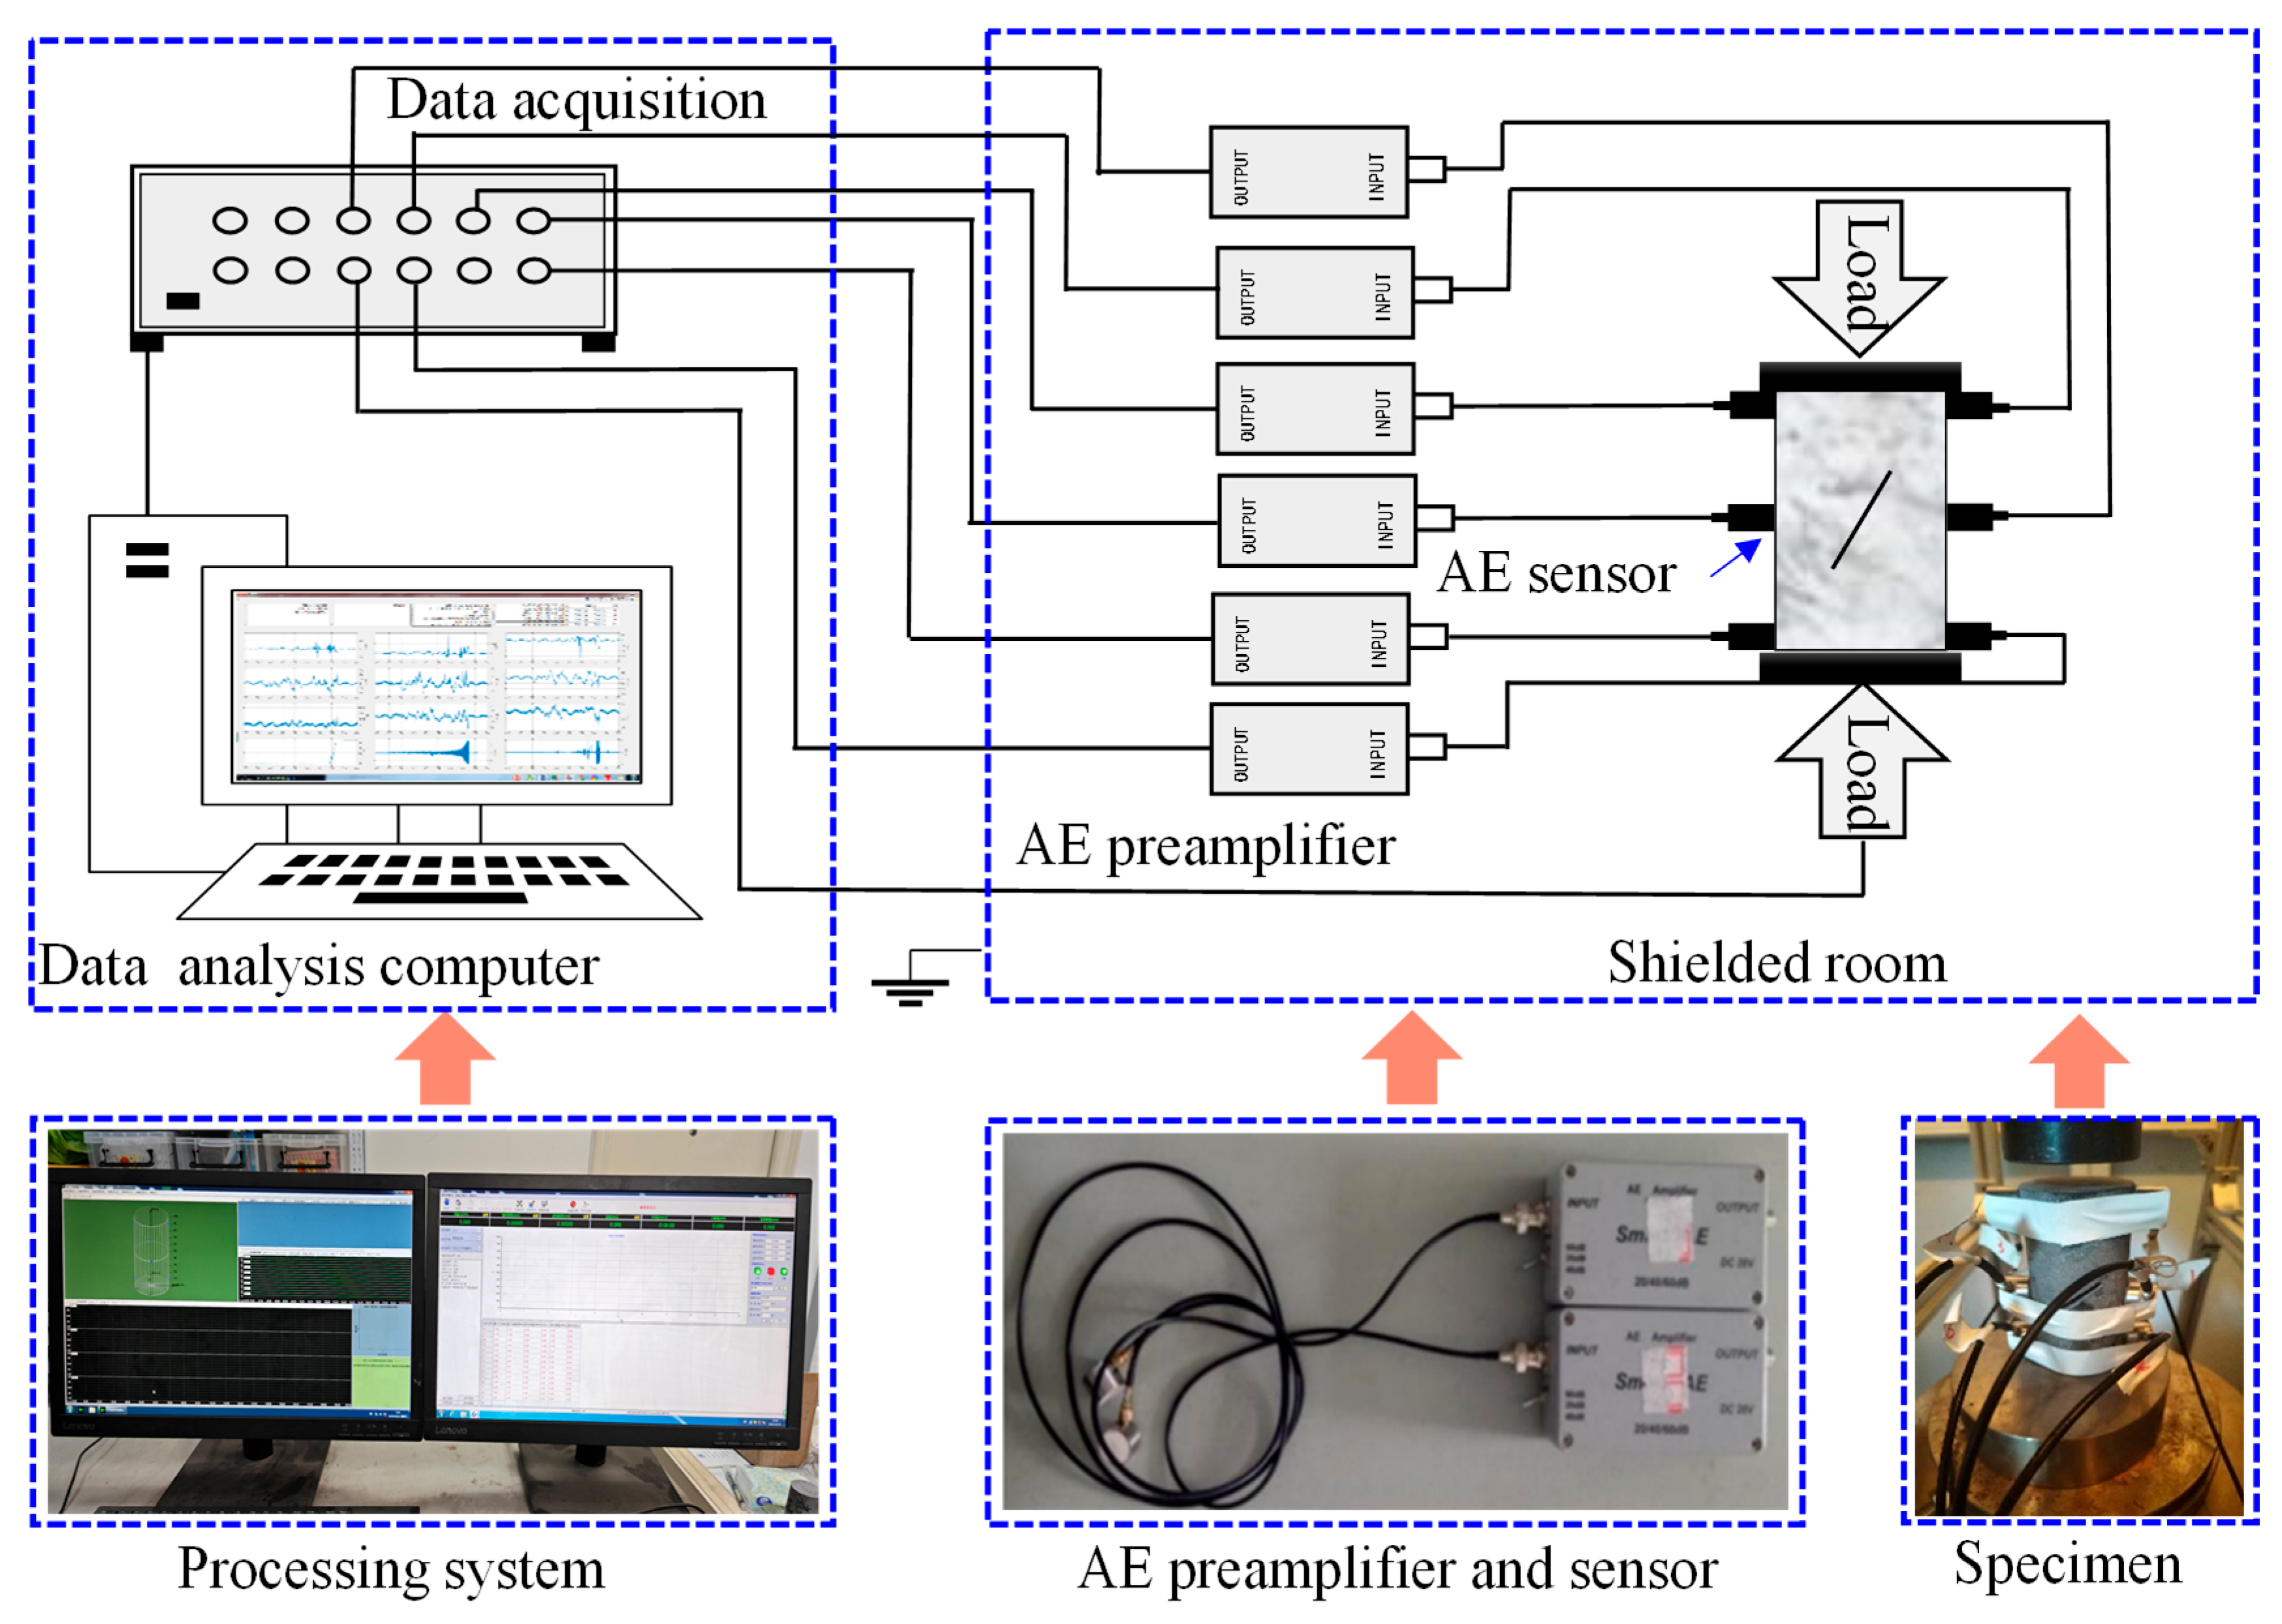
Figure 1. Experimental system diagram.
Sustainability 17 09325 g001
Figure 2. Sample physical diagram and sensor layout scheme.
Sustainability 17 09325 g002
Figure 3. Raw signal Data Analysis Flowchart.
Sustainability 17 09325 g003
Figure 4. Seismic wave and amplitude–frequency diagrams of sample 1.
Sustainability 17 09325 g004
Figure 5. Seismic wave and amplitude–frequency diagrams of sample 4.
Sustainability 17 09325 g005
Figure 6. Seismic wave and amplitude–frequency diagrams of sample 5.
Sustainability 17 09325 g006
Figure 7. Three-dimensional Hilbert spectra of sample 1.
Sustainability 17 09325 g007
Figure 8. Three-dimensional Hilbert spectra of sample 4.
Sustainability 17 09325 g008
Figure 9. Three-dimensional Hilbert spectra of sample 5.
Sustainability 17 09325 g009
Figure 10. The variation law of seismic wave characteristic parameters of receiving source at different crack angles.
Sustainability 17 09325 g010
Figure 11. Schematic diagrams of seismic wave propagation principle in samples with different angles.
Sustainability 17 09325 g011
Figure 12. Seismic wave and amplitude–frequency diagrams of sample 2.
Sustainability 17 09325 g012
Figure 13. Seismic wave and amplitude–frequency diagrams sample 3.
Sustainability 17 09325 g013
Figure 14. Three-dimensional Hilbert spectra of sample 2.
Sustainability 17 09325 g014
Figure 15. Three-dimensional Hilbert spectra of sample 3.
Sustainability 17 09325 g015
Figure 16. The trend change diagram of seismic wave signal of receiving source #4 with different widths.
Sustainability 17 09325 g016
Figure 17. Diagrams of crack width and seismic wave frequency.
Sustainability 17 09325 g017
Figure 18. The seismic wave and amplitude–frequency diagrams of sample 6.
Sustainability 17 09325 g018
Figure 19. Three-dimensional Hilbert spectra of sample 6.
Sustainability 17 09325 g019
Figure 20. Spectrogram of seismic wave waveform of sample 1.
Sustainability 17 09325 g020
Figure 21. The three-dimensional Hilbert spectra of sample 1.
Sustainability 17 09325 g021
Figure 22. Seismic wave amplitude energy at excitation source and receiving source at different positions.
Sustainability 17 09325 g022
Table 1. Specimen crack parameters.
No.Structure TypeCrack Length, mmCrack Width, mmAngle of Crack, °
1Crack30135
2235
3335
4155
5175
Table 2. Comparison of seismic wave characteristic parameters between excitation source and receiving source of samples at different angles.
Crack Angle, °ParameterExcitation Source
(Mean)
Receiving Source
(Mean ± SD)
95% CIDecay
(%)
35Amplitude
(mV)
10.02.36 ± 0.15[2.25, 2.47]76.35
Main Frequency
(kHz)
175.50174.74 ± 0.52[174.37, 175.11]0.44
Energy (a.u.)315.036.36 ± 0.41[6.06, 6.66]97.98
55Amplitude
(mV)
10.01.36 ± 0.11[1.28, 1.44]86.42
Main Frequency
(kHz)
167.78166.72 ± 0.65[166.25, 167.19]0.63
Energy (a.u.)297.331.88 ± 0.23[1.71, 2.05]99.37
75Amplitude
(mV)
10.00.60 ± 0.08[0.54, 0.66]94.04
Main Frequency
(kHz)
168.61154.36 ± 1.21[153.49, 155.23]8.45
Energy (a.u.)265.800.51 ± 0.07[0.46, 0.56]99.81
Table 3. Linear fitting equation of amplitude, main frequency, and energy with angle variation.
Equationy = a + b × x
ParameterEnergyAmplitudeMain Frequency
Intercept10.95942 ± 2.565483.87283 ± 0.20106193,287.29167 ± 3593.16331
Slope−0.14625 ± 0.04472−0.04424 ± 0.0035−509.375 ± 62.62807
R20.914510.993760.98511
Table 4. Definition of symbols in the linear-slip model.
SymbolDefinitionSI Unit
RPP, TPPReflection and transmission coefficients for P-waveDimensionless
RSS, TSSReflection and transmission coefficients for S-waveDimensionless
KNNormal specific stiffnessPa/m (or N/m3)
KTTangential specific stiffnessPa/m (or N/m3)
ωAngular frequency (2πf)rad/s
ZPP-wave acoustic impedance (pvP)kg/(m2s)
ZSS-wave acoustic impedance (pvS)kg/(m2s)
PRock densitykg/m3
vPP-wave velocity in the rockm/s
USS-wave velocity in the rockm/s
iImaginary unit ( 1 )Dimensionless
Table 5. Comparison of seismic wave characteristic parameters between excitation source and receiving source of samples with different widths.
Crack Width, mmParameterExcitation Source
(Mean)
Receiving Source
(Mean ± SD)
95% CIDecay
(%)
1Amplitude
(mV)
10.02.36 ± 0.15[2.25, 2.47]76.35
Main Frequency
(kHz)
175.50174.74 ± 0.52[174.37, 175.11]0.44
Energy (a.u.)315.036.36 ± 0.41[6.06, 6.66]97.98
2Amplitude
(mV)
10.00.74 ± 0.09[0.68, 0.80]92.56
Main Frequency
(kHz)
169.96166.33 ± 0.71[165.82, 166.84]2.14
Energy (a.u.)289.490.55 ± 0.08[0.49, 0.61]99.81
3Amplitude
(mV)
10.00.49 ± 0.06[0.45, 0.53]95.08
Main Frequency
(kHz)
169.70162.49 ± 0.88[161.86, 163.12]4.25
Energy (a.u.)275.070.29 ± 0.04[0.26, 0.32]99.89
Table 6. Exponential fitting equations of amplitude, main frequency, and energy with crack width.
Equationy = a·eb·x
ParameterEnergyAmplitudeMain Frequency
Fitting resultsy = 11.8398·e−1.8848xy = 4.5428·e−1.0287xy = 167·e−0.0076x
R20.97020.98220.9490
Table 7. Comparison between experimental values and theoretical predictions of seismic wave energy attenuation.
Parameter TypeParameter ValueExperimental Attenuation (%)Theoretical Prediction (%)
Angle (°)3597.9898.7 (DDM)
5599.3799.5 (DDM)
7599.8199.94 (DDM)
Width (mm)197.9898.1 (scattering)
299.8199.7 (scattering)
399.8999.92 (scattering)
Interface (receiving source #6)-99.8999.82 (stiffness)
Table 8. Characteristic parameters of seismic wave signal at different positions in space.
No.Peak Amplitude, mVPeak Amplitude Time,
×10−4 s
Main Frequency, kHzEnergy
Peak, a.u.
Excitation source 3102.60175.029315.564
Receiving source 1−1.91893.24171.5284.178
Receiving source 2−1.27434.34171.0281.769
Receiving source 42.33884.18174,5295.794
Receiving source 5−5.82023.35170,02898.037
Receiving source 61.00583.96169,0281.110
Disclaimer/Publisher’s Note: The statements, opinions and data contained in all publications are solely those of the individual author(s) and contributor(s) and not of MDPI and/or the editor(s). MDPI and/or the editor(s) disclaim responsibility for any injury to people or property resulting from any ideas, methods, instructions or products referred to in the content.